Altered amygdala-prefrontal response to facial emotion in offspring of parents with bipolar disorder Anna Manelis, 1 Cecile D. Ladouceur, 1 Simona Graur, 1 Kelly Monk, 1 Lisa K. Bonar, 1 Mary Beth Hickey, 1 Amanda C. Dwojak, 1 David Axelson, 2 Benjamin I. Goldstein, 3 Tina R. Goldstein, 1 Genna Bebko, 1 Michele A. Bertocci, 1 Danella M. Hafeman, 1 Mary Kay Gill, 1 Boris Birmaher 1 and Mary L. Phillips 1 This study aimed to identify neuroimaging measures associated with risk for, or protection against, bipolar disorder by comparing youth offspring of parents with bipolar disorder versus youth offspring of non-bipolar parents versus offspring of healthy parents in (i) the magnitude of activation within emotional face processing circuitry; and (ii) functional connectivity between this circuitry and frontal emotion regulation regions. The study was conducted at the University of Pittsburgh Medical Centre. Participants included 29 offspring of parents with bipolar disorder (mean age = 13.8 years; 14 females), 29 offspring of non-bipolar parents (mean age = 13.8 years; 12 females) and 23 healthy controls (mean age = 13.7 years; 11 females). Participants were scanned during implicit processing of emerging happy, sad, fearful and angry faces and shapes. The activation analyses revealed greater right amygdala activation to emotional faces versus shapes in offspring of parents with bipolar disorder and offspring of non-bipolar parents than healthy controls. Given that abnormally increased amygdala activation during emotion processing characterized offspring of both patient groups, and that abnormally increased amygdala activation has often been reported in individuals with already developed bipolar disorder and those with major depressive disorder, these neuroimaging findings may represent markers of increased risk for affective disorders in general. The analysis of psychophysiological interaction revealed that offspring of parents with bipolar disorder showed significantly more negative right amygdala-anterior cingulate cortex functional connect- ivity to emotional faces versus shapes, but significantly more positive right amygdala-left ventrolateral prefrontal cortex functional connectivity to happy faces (all P-values corrected for multiple tests) than offspring of non-bipolar parents and healthy controls. Taken together with findings of increased amygdala-ventrolateral prefrontal cortex functional connectivity, and decreased amyg- dala-anterior cingulate cortex functional connectivity previously shown in individuals with bipolar disorder, these connectivity patterns in offspring of parents with bipolar disorder may be risk markers for, rather than markers conferring protection against, bipolar disorder in youth. The patterns of activation and functional connectivity remained unchanged after removing medicated participants and those with current psychopathology from analyses. This is the first study to demonstrate that abnormal functional connectivity patterns within face emotion processing circuitry distinguish offspring of parents with bipolar disorder from those of non-bipolar parents and healthy controls. 1 Department of Psychiatry, Western Psychiatric Institute and Clinic, University of Pittsburgh Medical Center, University of Pittsburgh, Pittsburgh, Pennsylvania, USA 2 Department of Psychiatry, Nationwide Children’s Hospital and The Ohio State College of Medicine, Columbus, Ohio, USA 3 Department of Psychiatry, Sunnybrook Health Sciences Centre, University of Toronto, Faculty of Medicine, Toronto, Ontario, Canada doi:10.1093/brain/awv176 BRAIN 2015: Page 1 of 14 | 1 Received December 27, 2014. Revised April 2, 2015. Accepted April 26, 2015. ß The Author (2015). Published by Oxford University Press on behalf of the Guarantors of Brain. All rights reserved. For Permissions, please email: [email protected] Brain Advance Access published June 24, 2015 by guest on June 26, 2015 Downloaded from

Welcome message from author
This document is posted to help you gain knowledge. Please leave a comment to let me know what you think about it! Share it to your friends and learn new things together.
Transcript
Altered amygdala-prefrontal response tofacial emotion in offspring of parents withbipolar disorder
Anna Manelis,1Cecile D. Ladouceur,1 Simona Graur,1 Kelly Monk,1 Lisa K. Bonar,1 MaryBeth Hickey,1 Amanda C. Dwojak,1 David Axelson,2 Benjamin I. Goldstein,3 Tina R. Goldstein,1
Genna Bebko,1 Michele A. Bertocci,1 Danella M. Hafeman,1 Mary Kay Gill,1 Boris Birmaher1
and Mary L. Phillips1
This study aimed to identify neuroimaging measures associated with risk for, or protection against, bipolar disorder by comparing
youth offspring of parents with bipolar disorder versus youth offspring of non-bipolar parents versus offspring of healthy parents
in (i) the magnitude of activation within emotional face processing circuitry; and (ii) functional connectivity between this circuitry
and frontal emotion regulation regions. The study was conducted at the University of Pittsburgh Medical Centre. Participants
included 29 offspring of parents with bipolar disorder (mean age = 13.8 years; 14 females), 29 offspring of non-bipolar parents
(mean age = 13.8 years; 12 females) and 23 healthy controls (mean age = 13.7 years; 11 females). Participants were scanned during
implicit processing of emerging happy, sad, fearful and angry faces and shapes. The activation analyses revealed greater right
amygdala activation to emotional faces versus shapes in offspring of parents with bipolar disorder and offspring of non-bipolar
parents than healthy controls. Given that abnormally increased amygdala activation during emotion processing characterized
offspring of both patient groups, and that abnormally increased amygdala activation has often been reported in individuals
with already developed bipolar disorder and those with major depressive disorder, these neuroimaging findings may represent
markers of increased risk for affective disorders in general. The analysis of psychophysiological interaction revealed that offspring
of parents with bipolar disorder showed significantly more negative right amygdala-anterior cingulate cortex functional connect-
ivity to emotional faces versus shapes, but significantly more positive right amygdala-left ventrolateral prefrontal cortex functional
connectivity to happy faces (all P-values corrected for multiple tests) than offspring of non-bipolar parents and healthy controls.
Taken together with findings of increased amygdala-ventrolateral prefrontal cortex functional connectivity, and decreased amyg-
dala-anterior cingulate cortex functional connectivity previously shown in individuals with bipolar disorder, these connectivity
patterns in offspring of parents with bipolar disorder may be risk markers for, rather than markers conferring protection against,
bipolar disorder in youth. The patterns of activation and functional connectivity remained unchanged after removing medicated
participants and those with current psychopathology from analyses. This is the first study to demonstrate that abnormal functional
connectivity patterns within face emotion processing circuitry distinguish offspring of parents with bipolar disorder from those of
non-bipolar parents and healthy controls.
1 Department of Psychiatry, Western Psychiatric Institute and Clinic, University of Pittsburgh Medical Center, University ofPittsburgh, Pittsburgh, Pennsylvania, USA
2 Department of Psychiatry, Nationwide Children’s Hospital and The Ohio State College of Medicine, Columbus, Ohio, USA3 Department of Psychiatry, Sunnybrook Health Sciences Centre, University of Toronto, Faculty of Medicine, Toronto, Ontario,
Canada
doi:10.1093/brain/awv176 BRAIN 2015: Page 1 of 14 | 1
Received December 27, 2014. Revised April 2, 2015. Accepted April 26, 2015.
� The Author (2015). Published by Oxford University Press on behalf of the Guarantors of Brain. All rights reserved.
For Permissions, please email: [email protected]
Brain Advance Access published June 24, 2015by guest on June 26, 2015
Dow
nloaded from
Correspondence to: Anna Manelis,
Department of Psychiatry,
Western Psychiatric
Institute and Clinic,
121 Meyran Ave,
Loeffler Bldg, Room 306,
Pittsburgh, PA 15213, USA
E-mail: [email protected].
Keywords: youth offspring of parents with bipolar disorder; risk of bipolar disorder; functional MRI; emotion processing; emotionregulation; biological markers
Abbreviations: ACC = anterior cingulate cortex; BIOS = Bipolar Offspring Study; BO = offspring of parents with bipolar disorder;LAMS = Longitudinal Assessment of Manic Symptoms; NBO = offspring of parents with non-bipolar disorder psychopathology;PFC = prefrontal cortex
IntroductionIdentifying early clinical signs of bipolar disorder is critic-
ally important to improve treatment outcome (Birmaher
et al., 2009). One factor that increases probability of
developing affective disorders is having a parent with psy-
chopathology (Birmaher et al., 2009; Goldstein et al.,
2010). Offspring of parents with bipolar disorder (BO)
are at higher risk of bipolar disorder than offspring of par-
ents with non-bipolar disorder psychopathology (NBO), for
example. Yet, little is known about the neurophysiological
processes that predispose to or protect against risk for
bipolar disorder. Neuroimaging studies can help elucidate
such processes by identifying abnormal functioning in
neural circuitries supporting information processing
domains known to be aberrant in individuals with estab-
lished bipolar disorder, such as face emotion processing.
For example, youth and adults with bipolar disorder are
impaired in both memory for emotional faces (Dickstein
et al., 2007; Adleman et al., 2013) and identification of
facial emotional expressions (Rich et al., 2006; Guyer
et al., 2007). Comparing BO and NBO in neuroimaging
studies of face emotion processing circuitry may thus help
identify biomarkers reflecting risk for, or protection
against, bipolar disorder specifically.
When comparing BO and NBO groups in neuroimaging
studies there are additional facts that should be considered.
First, both BO and NBO are at increased future risk of a
range of non-bipolar disorder psychiatric disorders
(Birmaher et al., 2009). Second, both the parents of BO
and the parents of NBO often have non-bipolar disorder
comorbid disorders. Thus, including NBO will control for
the potential impact upon neuroimaging measures in BO
of: (i) being at risk for non-bipolar disorder psychopath-
ology; and (ii) living with parents with non-bipolar disorder
psychopathology. Furthermore, as parents of BO often
have multiple non-bipolar disorder disorders in addition
to bipolar disorder (e.g. generalized anxiety disorder, pho-
bias, alcohol/drug dependence), in studies comparing BO
and NBO, parents of NBO need to also have several of
these disorders rather than only one non-bipolar disorder
condition, to control for the presence of all of these differ-
ent disorders in the parents of BO.
Face processing depends on the coordinated function of a
distributed network of temporo-occipital, frontal and limbic
regions (Haxby et al., 2002; Ishai, 2008; Fusar-Poli et al.,
2009) and relies on interactions among amygdala, prefrontal
and visual cortices (Banks et al., 2007; Fairhall and Ishai,
2007; Dima et al., 2011). The amygdala supports processing
of emotional faces (Morris et al., 1996; Phillips et al., 1997;
Vuilleumier et al., 2001). Prefrontal cortices (PFCs)
(including ventrolateral PFC and orbitofrontal cortex) sup-
port semantic and reward-related aspects associated with
faces (Leveroni et al., 2000; Ishai et al., 2002), recognition
of facial expressions (Tsuchida and Fellows, 2012; Willis
et al., 2014), and voluntary emotional regulation (Phillips
et al., 2008; Strakowski et al., 2012). The anterior cingulate
cortex (ACC) and medial prefrontal cortices are involved in
emotion appraisal and regulation (Etkin et al., 2011).
Previous neuroimaging studies of youth and adults with
bipolar disorder showed abnormally elevated amygdala
activation (Blumberg et al., 2005; Rich et al., 2006). In
adults with bipolar disorder, the abnormalities in functional
connectivity between amygdala and prefrontal cortical
regions may be emotion-specific, with patterns of abnor-
mally reduced amygdala-PFC functional connectivity
being shown to happy faces in particular (Almeida et al.,
2009; Versace et al., 2010; Wang et al., 2012). In youths
with bipolar disorder, however, findings suggest abnor-
mally decreased amygdala-prefrontal cortical functional
connectivity to fear faces (Ladouceur et al., 2011).
A small number of neuroimaging studies suggest that BO
and youths with bipolar disorder may show similar pat-
terns of face emotion processing impairment and functional
abnormalities in neural circuitry supporting emotional
face processing (Brotman et al., 2008a, b). These findings
indicate that both youths with bipolar disorder and BO
made more face emotion labelling errors than healthy off-
spring of psychiatrically healthy parents (healthy controls)
(Brotman et al., 2008a) and needed more intense emotional
2 | BRAIN 2015: Page 2 of 14 A. Manelis et al.
by guest on June 26, 2015D
ownloaded from
expressions to correctly identify emotions (Brotman et al.,
2008b). Both youth with bipolar disorder and BO, relative
to healthy control subjects, had increased amygdala activa-
tion when viewing happy and fearful faces (Olsavsky et al.,
2012), but reduced dorsolateral PFC activation for success-
ful versus unsuccessful encoding of emotional faces (Tseng
et al., 2014). Moreover, the modulation of amygdala and
ventrolateral PFC activation by the changes in the intensity
of emotions was reduced in youth with bipolar disorder
and BO, compared with healthy control subjects
(Brotman et al., 2014a). Given that offspring of parents
with major depressive disorder also showed increased
amygdala activation during passive viewing of fear faces
when compared with healthy control subjects (Monk
et al., 2008), increased amygdala activation during process-
ing of emotional faces may be a risk factor for affective
disorders in general, rather than that for bipolar disorder
specifically. On the other hand, findings that depressed indi-
viduals with bipolar disorder were distinguished from those
with major depressive disorder by patterns of prefrontal cor-
tical-amygdala functional connectivity during face emotion
processing (Almeida et al., 2009), and by increased subcor-
tical and ventrolateral PFC activation during processing of
positive and negative facial expressions (Lawrence et al.,
2004), suggest that offspring of parents with bipolar dis-
order may also show functional abnormalities in the wider
prefrontal cortical-amygdala neural circuitry supporting
emotional face processing compared with offspring of par-
ents with non-bipolar disorder psychopathology.
The extent to which these functional abnormalities in BO
reflect specific risk markers for future bipolar disorder
versus risk for psychiatric disorders in general remains
unclear, however, given that there are no studies directly
comparing functioning in face emotion processing neural
circuitry in BO and in youth who are at higher than
normal risk for psychiatric disorders in general, but lower
risk of future bipolar disorder than BO (i.e. NBO).
Therefore, the aim of the present study was to identify
the effect of familial genetic risk for bipolar disorder
(BO4NBO4 healthy controls) on activation and func-
tional connectivity in face emotion processing neural cir-
cuitry. BO and NBO included youths with and without
current non-bipolar disorder psychopathology, some of
whom were treated with psychotropic medications. This
allowed us to determine, in secondary analyses, the effect
of genetic risk for bipolar disorder on emotional face pro-
cessing in participants with and without current psycho-
pathology and psychotropic medication. We used an
implicit face emotion processing task that has previously
been shown to elicit patterns of abnormally decreased
ventrolateral PFC activation in youths with bipolar dis-
order (Hafeman et al., 2014).
Based on neuroimaging findings described above, we
hypothesized that during emotional face processing:
(i) BO, compared with NBO and healthy control subjects,
would show significantly greater amygdala and reduced
prefrontal cortical activation to all emotional faces (versus
shapes). An alternative hypothesis was that both BO and
NBO would show significantly greater amygdala activation
to all emotional faces (versus shapes), which may be a risk
marker for psychiatric disorders in general, rather than for
bipolar disorder specifically.
(ii) BO, compared with NBO and healthy control subjects,
would show significantly reduced amygdala-prefrontal cor-
tical positive functional connectivity to all emotional faces.
(iii) The differential patterns of brain activation and functional
connectivity in the above neural regions in BO versus NBO
versus healthy control subjects youth would be present in
the subset of participants without current psychiatric diag-
noses and psychotropic medications.
Given previous findings suggesting differential patterns of
abnormal neural response to happy versus negative facial
emotions in adults and youth with bipolar disorder
(Almeida et al., 2009; Versace et al., 2010; Ladouceur
et al., 2011), we also examined the extent to which there
were differential patterns of neural response to happy and
all negative facial emotions in BO, NBO and healthy con-
trol subject youths in the above analyses.
Materials and methods
Participants
Three groups of participants aged 7–17 years who were notaffected with bipolar disorder took part in this study: offspringof parent(s) with bipolar disorder (BO; n = 36), offspring ofparent(s) with non-bipolar disorder psychopathology (NBO;n = 38) and healthy offspring of healthy parents (healthy con-trol subjects; n = 25) without family history of any lifetimepsychiatric disorders including bipolar disorder. The majorityof BO (n = 34) and NBO (n = 33) were recruited from theBipolar Offspring Study (BIOS). BIOS is an ongoing longitu-dinal study examining psychiatric symptomatology in youthoffspring of parents with bipolar disorder (Birmaher et al.,2009) and functioning in neural circuitries underlying informa-tion processing domains implicated in the pathogenesis ofbipolar disorder. See Supplementary Fig. 1 for detailed infor-mation about selection of BIOS participants for the functionalMRI study.
Two BO and five NBO subjects were recruited from theLongitudinal Assessment of Manic Symptoms (LAMS) study(Findling et al., 2010; Horwitz et al., 2010), a parallel studyexamining neural circuitry functioning in youth with behav-ioural and emotional dysregulation. We ensured that recruit-ment source did not impact main neuroimaging findings byconducting additional analyses of neural functioning usingonly the BIOS sample (see Supplementary material for details).Twenty-four healthy control subjects were recruited from thehealthy comparison youth group of the LAMS study. Exclusioncriteria for healthy control subjects were: history of meeting cri-teria for any psychiatric, alcohol, or substance use disorder, andfamily history (first-degree relatives) of any psychiatric disorder.All participants recruited from the LAMS study were scanned on
Face processing in youth at-risk for bipolar disorder BRAIN 2015: Page 3 of 14 | 3
by guest on June 26, 2015D
ownloaded from
the same scanner concurrently with BIOS participants. Onehealthy control subject was recruited from BIOS. Exclusioncriteria for all participants were: systemic medical illness,neurological disorders, head trauma, alcohol or illicit sub-stance use, standard exclusion criteria for MRI research(metal anywhere in the head or body, claustrophobia),IQ570 (using the Weschler Abbreviated Scale ofIntelligence; Wechsler, 1999), unable to read and write instandard English, and corrected far visual acuity worse than20/40 on the Snellen visual acuity test. Seven BO (from BIOS),nine NBO (from BIOS), and two healthy control subjects(from LAMS) were excluded from data analysis due to inabil-ity to complete the scanning session or due to excessive motionin the scanner (translation4 4 mm). The total numbers of par-ticipants with usable functional MRI data were: 29 BO, 29NBO, and 23 healthy control subjects. Eleven BO and14 NBO had current non-bipolar disorder psychopathology,five BO and four NBO were taking one class of psychotropicmedications (Table 1). Given ethical concerns with stoppingmedication for research participation, participants were per-mitted to use prescribed medication(s) before and on the dayof scanning.
Assessment procedures
A trained clinician interviewed parents about their childrenand a separate clinician interviewed children themselves usingthe Kiddie Schedule for Affective Disorders and Schizophrenia-Present and Lifetime version (KSADS-PL; Kaufman et al.,1997). Inter-rater reliability for all psychiatric diagnoses ascer-tained through the KSADS was �4 0.8. This clinician wasblind to parental psychopathology that was evaluated by an-other clinician using the Structural Clinical Interview for DSM-IV (SCID-I; First et al., 2002) for BIOS youth, and using theFamily History Screen (Weissman et al., 2000) for LAMSyouths. All cases were presented to a child psychiatrist whowas ultimately responsible for determining all diagnoses.
On the day of scanning, all participants completed clinicaland demographic questionnaires in the morning and werescanned and administered the tasks outside the scanner inthe afternoon. Staff administering these questionnaires andthe scanning procedures were not blinded to the participant’sgroup, but they were not involved with the psychiatric man-agement of the study participants. All participants completedmedication forms that documented psychotropic medicationsused during the past 24 h, and those used on a regular basis;drug/alcohol/pregnancy screens; the Edinburgh HandednessInventory (Oldfield, 1971); and the Snellen visual acuity test.IQ was measured using the Weschler Abbreviated Scale ofIntelligence (Wechsler, 1999). Additionally, parents/guardiansof youth participants completed the PGBI-10 M [ParentVersion, General Behavior Inventory (Youngstrom et al.,2008), to assess the severity of behavioral and emotional dys-regulation in their offspring during the last 6 months; onlyparents of BO and NBO completed this questionnaire]; theSCARED-P (Self-Report for Childhood Anxiety RelatedEmotional Disorders, Parent Version, to assess offspring anx-iety over last 2 weeks; Birmaher et al., 1997); the CALS-P(The Children’s Affective Lability Scale, Parent Version;Gerson et al., 1996); the MFQ-P (Mood and FeelingsQuestionnaire, Parent Version, to assess the severity of depres-sion during the last 2 weeks; Angold et al., 1995); and a
questionnaire to assess sociodemographic status representedby parental education (Hollingshead, 1975). Youth partici-pants completed child report versions of affective symptom-atology scales: the CALS-C, SCARED-C, MFQ-C. Pubertalstatus of youth was assessed using a self-report questionnaire(Petersen et al., 1988). Table 1 summarizes demographic andclinical variables in children. Table 2 summarizes lifetime psy-chiatric diagnoses in parents. Many (but not all) parents ofNBO had major depressive disorder, but they also had othercomorbid psychiatric disorders (Table 2). SupplementaryTable 1 reports demographic and clinical variables for youthwithout psychopathology and youth untreated withpsychotropic medications.
Dynamic faces task
The dynamic faces task (Fig. 1) was the first task administeredfollowing 15 min of structural image acquisition. During thistask (Perlman et al., 2013; Hafeman et al., 2014) participantswere presented with greyscale emotional faces (happy, angry,fearful, and sad) taken from the NimStim face database(Tottenham et al., 2009) and control stimuli (greyscale ovalsmatched in luminance with the face stimuli). The 13-min taskincluded three, 12-trial blocks for each of four emotional facetypes, and 12, six-trial blocks of shapes. Trials were separatedby 2–3 s jittered intertrial intervals. During face trials, a facechanged in emotional expression from neutral to emotional over1 s in 5% increments. During shape trials, a dark oval wassuperimposed on a light grey oval and changed in size to par-allel the changes in the face trials. In the middle of each trial(between 200 and 650 ms), a coloured semi-transparent oval(blue, orange or yellow) overlaid the image. Participants hadto identify the colour of the oval and respond using a corres-ponding button on the response stick. This task is a measure ofimplicit emotion processing and regulation, given that partici-pants do not overtly label facial emotional expressions.
Post-scanning emotion labelling task
An explicit emotion labelling task (Ladouceur et al., 2013) wasconducted after the scanning session outside the scanner toensure that youth were not impaired on emotional expressionlabelling in general. Participants labelled facial emotionalexpressions as angry, fearful, disgusted, sad, happy or neutral,and determined these expressions intensity on a scale rangingfrom 1 to 10 (10 being the most intense).
Behavioural data analysis
Participants’ accuracy and response times during colour iden-tification during the neuroimaging task were analysed to par-allel the structure of the functional MRI data analyses. (i) Wecomputed the Happy-Shape and AllNegative-Shape differences;(ii) accuracies and response time were compared using a2 (Emotion: Happy-Shapes versus AllNegative-Shapes) � 3(Group: BO/NBO/healthy controls) ANOVA. Only responsetimes for correctly identified colours were included in the ana-lysis of response time. Due to a computer failure, the data forone healthy control youth were missing.
The post-scan emotion labelling task data were analysed inthe same way. Disgusted faces were excluded from the analysisto match the analyses of the implicit dynamic faces task.
4 | BRAIN 2015: Page 4 of 14 A. Manelis et al.
by guest on June 26, 2015D
ownloaded from

In addition to analysing participants’ accuracy and responsetime, we also analysed ratings of emotion intensity.
Functional MRI data acquisition andanalysis
Functional MRI data were acquired using a SiemensMAGNETOM TrioTim 3 T MR system. A high-resolutionstructural image (1 � 1 � 1 mm) was acquired usingMPRAGE (repetition time = 2300 ms, echo time = 3.93 ms,field of view = 256, flip angle = 9�, 192 slices). Functionaldata were collected using a gradient-echo, echo-planar se-quence [voxel size: 3.2 � 3.2 � 3.1 mm, repetitiontime = 2000 ms, echo time = 28 ms, field of view = 205, flip
angle = 90�, 38 slices; 386 volumes (repetition times)]. Fieldmaps were collected at the 4 � 4 � 4 mm resolution using a
gradient echo sequence (repetition time = 488 ms, echotime1 = 4.92 ms, echo time2 = 7.38 ms, field of view = 256, flipangle = 60�, 32 slices).
The images were preprocessed and analysed using FSL 5.0.2(www.fmrib.ox.ac.uk/fsl). Preprocessing included motion correc-tion with MCFLIRT (Jenkinson et al., 2002), non-brain re-
moval using BET (Smith, 2002), fieldmap-based EPIunwarping using PRELUDE + FUGUE (Jenkinson, 2003), spa-tial smoothing with a Gaussian kernel of full-width at half-max-
imum 6 mm; grand-mean intensity normalization of the entire4D data set by a single multiplicative factor; high-pass temporal
filtering (Gaussian-weighted least-squares straight line fitting,with sigma = 100.0 s). A field map image used in the functional
Table 1 Demographic and clinical variables in youth offspring of parents with bipolar disorder (BO), youth offspring
of parents with non-bipolar psychopathology (NBO), and healthy offspring of psychiatrically healthy parents (HC)
BO n = 29 NBO n = 29 HC n = 23 Statistics P-
value
Number of youths without psychiatric diagnoses 18 (62%) 15 (52%) 23 (100%) BO versus NBO ns
�2(2)5 1
Number of youths untreated with psychotropic
medications
24 (83%) 25 (86%) 23 (100%) BO versus NBO ns
�2(2)5 1
Age at scan 13.81 (2.45) 13.83 (2.36) 13.74 (1.80) F(2,78)5 1 ns
Gender (female) 14 12 11 �2(2)5 1 ns
IQ (WASI) 103.21 (14.51) 101.79 (14.06) 105.78 (13.79) F(2,78)5 1 ns
Handedness (right hand) 26 27 21 Yates’ �2(2)5 1 ns
SES based on parental education 5.48 (0.95) 5.54 (0.96) 5.30 (1.02) F(2,77)5 1 ns
Symptom Assessment Scale Scores administered on the day of scan
SCARED Parent Total 9.45 (6.86) 9.79 (11.33) 4.17 (4.32) F(2,77) = 3.6 0.03
SCARED Child Total 11.66 (8.61) 10.14 (13.52) 9.33 (11.42) F(2,78)5 1 ns
CALS Parent Total 8.25 (10.33) 3.86 (4.53) 1.78 (2.59) F(2,76) = 6.0 0.004
CALS Child Total 10.52 (12.22) 7.62 (10.84) 5.96 (13.39) F(2,78)5 1 ns
MFQ Parent 6.11 (9.06) 3.85 (3.52) 1.57 (2.09) F(2,75) = 3.7 0.03
MFQ Child 8.86 (10.73) 9.38 (10.85) 5.09 (10.57) F(2,78) = 1.2 ns
Medications
Antidepressants na Sertraline HCI: n = 1 na
Antipsychotics Risperidone: n = 1 na na
Quetiapine: n = 1
Mood stabilizers na na na
Stimulants Dextroamphetamine
mixed salts: n = 1
Methylphenidate: n = 1;
dextroamphetamine
mixed salts: n = 2
na
Non-stimulants Atomoxetine: n = 2 na na
Benzodiazepines na na na
Youth offspring current psychiatric diagnoses
Number of youth with more than 1 diagnosis 5 6 na
MDD/DDNOS 3 2 na
Attention deficit hyperactivity disorder 6 7 na
Anxiety disorders 2 3 na
Oppositional defiant disorder 1 2 na
Phobias 2 2 na
Tourette’s disorder 1 0 na
Obsessive compulsive disorder 0 2 na
Eating disorder 1 0 na
Standard deviations (SD) are reported in parentheses. MDD = major depressive disorder; SCARED = Self-Report for Childhood Anxiety Related Emotional Disorders; MFQ =
Mood and Feelings Questionnaire; CALS = The Children’s Affective Lability scale; na = not applicable; ns = not significant; SES = Socioeconomic Status; DDNOS = Depressive
Disorder Not Otherwise Specified.
Face processing in youth at-risk for bipolar disorder BRAIN 2015: Page 5 of 14 | 5
by guest on June 26, 2015D
ownloaded from
MRI data analysis was prepared using the fsl_prepare_fieldmapscript. No slice-timing correction was applied. The high-reso-lution structural images were segmented using the fsl_anatscript to separate white matter, grey matter and CSF, and toalso segment subcortical structures. The white matter and CSFmasks were then coregistered with functional images, and theirtime courses were extracted from the preprocessed functionaldata for further analyses. Motion outliers (time points wherethe functional MRI signal was corrupted due to subject motion)were identified using the fsl_motion_outliers script (http://fsl.fmrib.ox.ac.uk/fsl/fslwiki/FSLMotionOutliers). A confoundmatrix from this analysis was then combined with the white
matter and CSF time courses and used as a confound variableof no interest in the first-level analyses.
Co-registration was carried out using FLIRT (FMRIB’sLinear Image Registration Tool; Jenkinson and Smith, 2001;Jenkinson et al., 2002) and FNIRT (FMRIB’s Non-linearImage Registration Tool; Andersson et al., 2007). BOLDimages were registered to the high-resolution structural(MPRAGE) images using FLIRT, the high-resolution imageswere registered to the MNI152_T1_2mm template usingFNIRT, and the two resulting transformations were concate-nated and applied to the original BOLD image (http://www.fmrib.ox.ac.uk/fsl/flirt/gui.html) to transform it to MNI space.The registration quality was checked for each subject. In rarecases FNIRT was substituted with FLIRT to obtain a betterquality registration.
An anatomical mask used as a target region in the PPI ana-lysis consisted of prefrontal regions (ACC, orbitofrontal cortexand ventrolateral PFC) previously implicated in emotion regu-lation (Phillips et al., 2008; Strakowski et al., 2012) and usedin a previous study (Hafeman et al., 2014) that examinedemotionally dysregulated youth using the same dynamic facestask. This mask was created by combining the thresholded at30% population probability anatomical masks of ACC, orbi-tofrontal cortex and inferior frontal gyrus (pars triangularisand pars opercularis) from the Harvard-Oxford Cortical struc-tural atlas shipped with FSL.
Preprocessed data were submitted to a first-level GeneralLinear Model analysis implemented using FEAT (FMRIExpert Analysis Tool, v6.0). The model included five regres-sors (happy, angry, fear and sad faces, and shapes). Themagnitude of activation was examined for each facial expres-sion versus shape, and for all faces versus shape. All group-level analyses were conducted using FLAME1 (FMRIB’s LocalAnalysis of Mixed Effects). Whenever possible, gender, age,IQ, and presence/absence of psychopathology were used ascovariates in the group-level analyses in order to factor outthe effects of these variables. To establish that participantsactivated face emotion processing neural circuitry during taskperformance, the first group-level analysis identified regionsthat activated for all emotional faces, compared with shapes,in all participants (n = 81). The Z-statistical images were
Table 2 Lifetime psychiatric diagnoses in parents of BO and NBO
Parents with bipolar
psychopathology
Parents with non-bipolar
psychopathology
Statistics P-value
BD-I 23 0 Yates’ �2(1) = 34.8 5 0.001
BD-II 6 0 Yates’ 0.03
�2(1) = 4.6
BD-NOS 0 0
Major depressive disorder/depressive disorder NOS 1 21 Yates’ �2(1) = 26.6 5 0.001
Generalized anxiety disorder/anxiety disorders NOS 16 9 �2(1) = 3.4 ns
Phobias 21 14 �2(1)5 3.0 ns
Alcohol/drug abuse/dependence 23 13 �2(1) = 6.6 0.01
Post-traumatic stress disorder 12 4 �2(1) = 5.2 0.02
Panic disorder 16 6 �2(1) = 6.8 5 0.01
Eating disorder 4 2 �2(1) = 1.8 ns
Obsessive-compulsive disorder 10 0 �2(1) = 11.7 5 0.001
Attention deficit hyperactivity disorder 4 2 �2(1)5 1 ns
Standard deviations (SD) are reported in parentheses. BD = bipolar disorder.
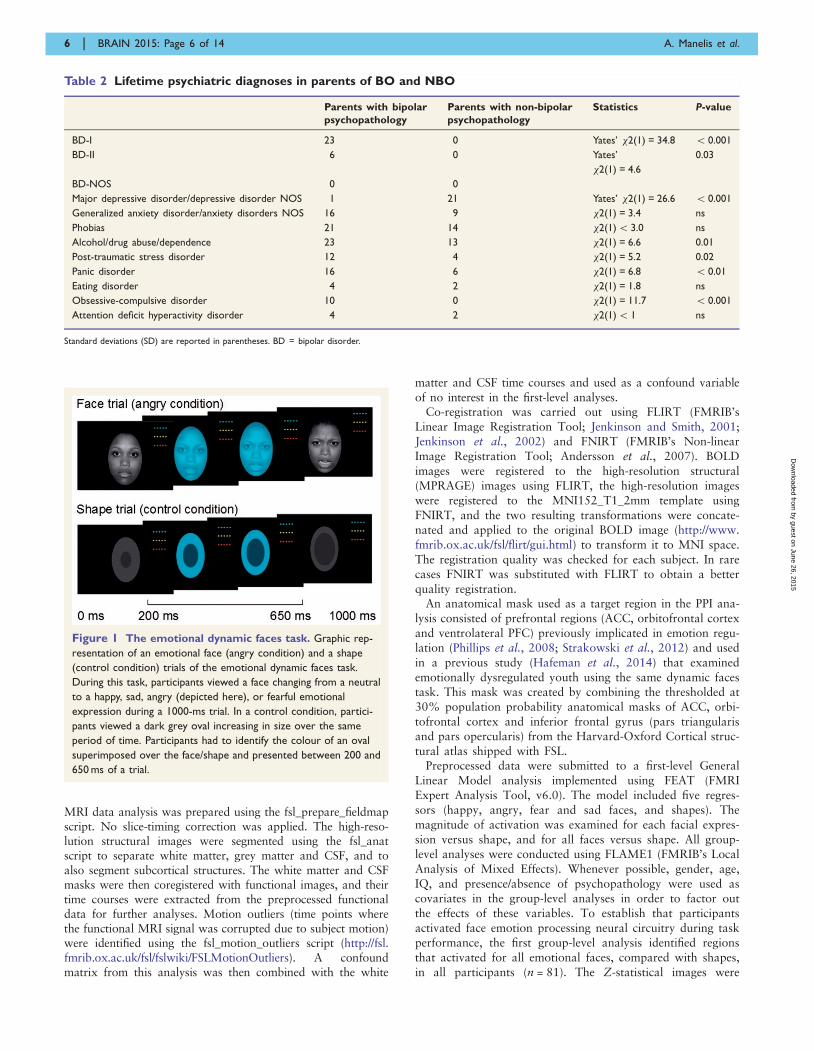
Figure 1 The emotional dynamic faces task. Graphic rep-
resentation of an emotional face (angry condition) and a shape
(control condition) trials of the emotional dynamic faces task.
During this task, participants viewed a face changing from a neutral
to a happy, sad, angry (depicted here), or fearful emotional
expression during a 1000-ms trial. In a control condition, partici-
pants viewed a dark grey oval increasing in size over the same
period of time. Participants had to identify the colour of an oval
superimposed over the face/shape and presented between 200 and
650 ms of a trial.
6 | BRAIN 2015: Page 6 of 14 A. Manelis et al.
by guest on June 26, 2015D
ownloaded from

thresholded using GRF (Gaussian-Random-Field) theory-basedmaximum height threshold at voxel-wise-corrected P50.05.
Statistics
Hypothesis 1 testing
The second group-level analysis examined brain activationusing a 3 (Group: BO/NBO/healthy controls) � 2 (Emotion:Happy versus AllNegative faces) ANOVA limited to the faceemotion processing neural circuitry identified in the firstgroup-level analysis. Significant clusters of activation weredetermined using a cluster method in FSL by thresholding Z-statistic images in the face emotion processing circuitry maskusing voxel-wise-uncorrected P5 0.005 (z4 2.57) and a cor-rected cluster significance threshold of P50.05 (Worsley, 2001).
Hypothesis 2 testing
Functional connectivity was examined using psychophysio-logical interaction (PPI) analysis (Friston et al., 1997). Theregions within the emotional face processing circuitry identifiedin the second group-level analysis served as the seed regions.The target region was an anatomical mask consisting of pre-frontal regions (ACC, orbitofrontal cortex, and ventrolateralPFC). The PPI first-level analysis model included five psycho-logical regressors (happy, angry, fear and sad faces, andshapes), one physiological regressor—a mean time course ex-tracted from the seed region, and five interaction terms be-tween the physiological and psychological regressors. Thegroup-level connectivity analyses (a 3 � 2 ANOVA) paralleledthe activation analysis.
Post hoc tests
Tukey’s HSD post hoc tests of activation and connectivityvalues (parameter estimates extracted from the significant ac-tivation and connectivity clusters) were performed in SPSS todetermine the direction of the between-group effects.
Hypothesis 3 testing
Here, we examined the effect of diagnosis and medications onactivation and connectivity in the brain regions identified inthe previous analyses. For this purpose, we first extracted ac-tivation and connectivity values from the significant clusters.Then, we conducted two 3 � 2 ANOVAs, using SPSS, on (i)participants without diagnoses; and (ii) unmedicatedparticipants.
Exploratory analyses
These analyses examined the relationship between neuralmeasures of emotional face processing and demographic, clin-ical and behavioural variables separately in each group of par-ticipants. We also examined the effect of puberty on activationand connectivity measures.
Results
Pubertal status
The Petersen’s self-report pubertal status data were avail-
able for 27 BO, 27 NBO, and 18 healthy control subjects.
The biological ages of youth were distributed across all five
pubertal categories: prepubertal, early pubertal, mid-pubertal,
late pubertal and post-pubertal, with only very small
number of youth in prepubertal and early pubertal stages.
Given this, we combined data across prepubertal, early
pubertal and mid-pubertal categories into one category
(‘earlier’ pubertal), and combined late pubertal and post-
pubertal categories into another category (‘later’ pubertal).
Twelve BO, 10 NBO and nine healthy control subjects
were in the ‘earlier’ pubertal category, whereas 15 BO,
17 NBO and nine healthy control subjects were in the
‘later’ pubertal category. A chi-square test for the
three groups and two pubertal categories indicated no sig-
nificant effect of group on pubertal status [�2(2) = 0.78,
P = 0.68].
Behavioural analyses
Dynamic faces task (scanned)
A 2 (Emotion: Happy-Shapes versus AllNegative-
Shapes) � 3 (Group:BO/NBO/healthy controls) ANOVA
revealed that there was no significant effect of Group,
and no significant Group � Emotion interaction, on
accuracy and response time (P4 0.05). There was, how-
ever, an effect of Emotion on accuracy [F(1,77) = 20.4,
P5 0.001] and response time [F(1,77) = 7.3, P = 0.009].
All participants were significantly faster and more ac-
curate when processing AllNegative relative to Happy
faces.
Post-scanning emotion labelling task (outside the
scanner)
To make these analyses similar to the functional MRI ana-
lyses, we computed the average judgement accuracy, average
response time for accurate responses and emotion intensity
for angry, fearful and sad faces (AllNegative) and con-
ducted a 3 (Group:BO/NBO/healthy control subjects) � 2
(Emotion: Happy versus AllNegative) ANOVA. There
was no main effect of Group or Group � Emotion inter-
action effect on accuracy and intensity judgement. All
participants judged Happy, compared to AllNegative,
faces more accurately [F(1,78) = 62.4, P50.001] and
gave them higher intensity ratings [F(1,78) = 242.1,
P5 0.001]. The analysis of response time for correctly
judged emotions revealed a main effect of Group
[F(2,78) = 3.7, P = 0.03], a main effect of Emotion
[F(1,78) = 71.8, P50.001] and a Group � Emotion inter-
action effect [F(2,78) = 3.9, P = 0.03]. Based on the Tukey’s
HSD post hoc test, BO were overall faster than healthy
control subjects (P = 0.006), and NBO did not differ from
BO and healthy control subjects. The interaction effect was
driven by greater changes in response time for Happy
versus AllNegative faces in healthy control subjects
than in BO.
Face processing in youth at-risk for bipolar disorder BRAIN 2015: Page 7 of 14 | 7
by guest on June 26, 2015D
ownloaded from
Functional MRI analyses
All emotional faces versus shape across all
participants
Consistent with previous studies (Fusar-Poli et al., 2009;
Sabatinelli et al., 2011), bilateral amygdala, temporal and
occipital fusiform cortices, frontal polar, frontal medial and
orbito-frontal cortices, right ventrolateral PFC and right
temporal polar cortex showed increased activation for emo-
tional faces versus shapes, across all participants (Table 3
and Supplementary Fig. 2). These regions were used as a
region of interest mask for testing Hypotheses 1 and 2.
Hypothesis 1: Activation in the emotional face pro-
cessing circuitry region of interest
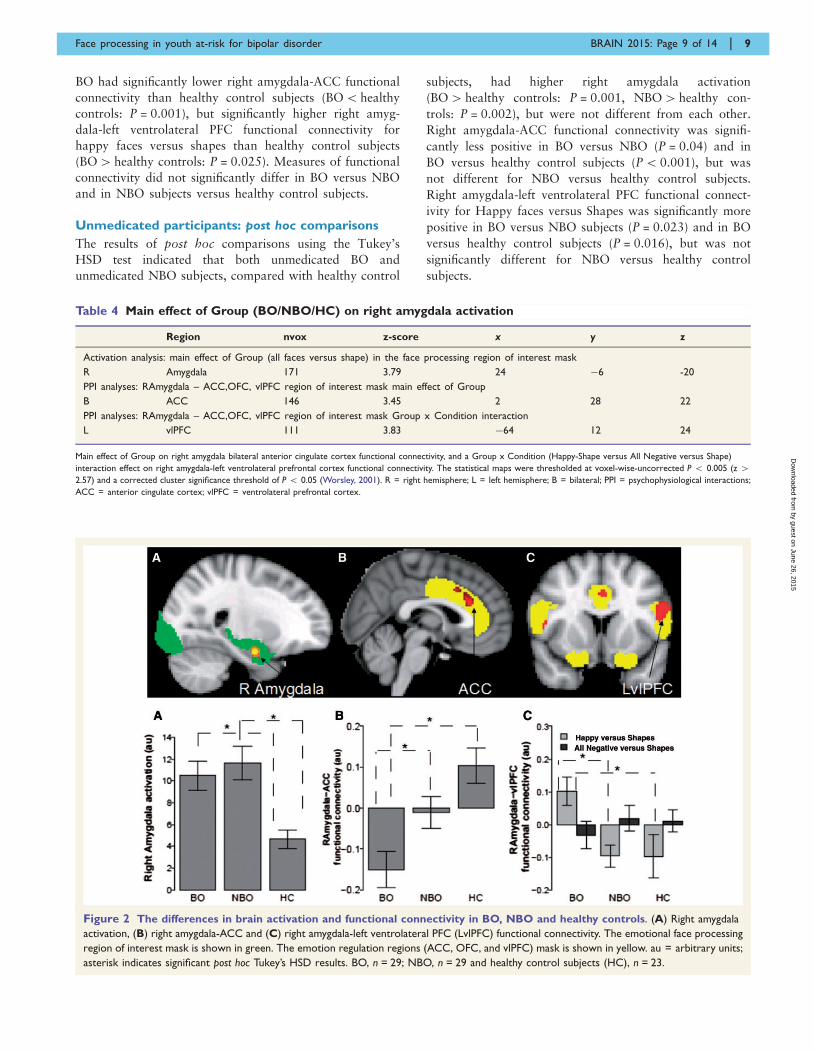
A significant main effect of group in the emotional face
processing circuitry was found in the right amygdala
(Table 4 and Fig. 2A). The Tukey’s HSD post hoc test
indicated that BO and NBO had significantly greater
right amygdala activation for Faces versus Shapes than
healthy control subjects (BO4 healthy controls:
P = 0.009; NBO4 healthy controls: P = 0.001), but did
not differ from each other. There was also a main effect
of Emotion (Supplementary Table 2), but no
Group � Condition interaction.
Hypothesis 2: Functional connectivity
The PPI analysis with right amygdala (the region of interest
identified in the activation analysis) as the seed region and
the ACC, orbitofrontal cortex, ventrolateral PFC region of
interest mask as the target region revealed a main effect of
Group on right amygdala–ACC (Fig. 2B and Table 4) func-
tional connectivity and a Group � Emotion interaction
effect on right amygdala-left ventrolateral PFC functional
connectivity (Fig. 2C and Table 4). The Tukey’s HSD
post hoc test indicated that BO, relative to NBO and
healthy control subjects, showed significantly decreased
positive right amygdala-ACC functional connectivity
(BO5NBO: P = 0.049; BO5 healthy controls:
P5 0.001; NBO = healthy controls).
To determine which emotional condition drove the
Group � Emotion interaction on right amygdala-left
ventrolateral PFC functional connectivity, we conducted
two planned comparison tests using one-way ANOVA on
Happy-Shape and AllNegative-Shape contrasts with Group
as a between-subject factor and Bonferroni corrected
P-values for two comparisons (0.05/2 = 0.025). These
tests revealed that the interaction was driven by group
differences for the Happy-Shape condition [F(2,78) = 6.1,
P = 0.004]. Tukey’s HSD post hoc test indicated that BO
showed significantly more positive right amygdala-left
ventrolateral PFC functional connectivity for happy faces
(versus Shapes) than both NBO (P = 0.008) and healthy
control subjects (P = 0.014).
Hypothesis 3: Activation and functional connectivity
in unmedicated youths and youths without
psychopathology
There was a significant effect of Group on right amygdala
activation [participants without psychopathology:
F(2,53) = 8.2, P5 0.001; unmedicated participants:
F(2,69) = 8.5, P5 0.001; Supplementary Figs 3 and 4], and
on right amygdala-ACC functional connectivity [participants
without psychopathology: F(2,53) = 7.8, P = 0.001; unmedi-
cated participants: F(2,69) = 8.6, P50.001]. There was also
a significant Group � Emotion interaction effect on right
amygdala-left ventrolateral PFC functional connectivity [par-
ticipants without psychopathology: F(2,53) = 9.0, P5 0.001;
unmedicated participants: F(2,69) = 9.8, P5 0.001].
Participants without psychopathology: post hoc
comparisons
The results of post hoc comparisons using the Tukey’s HSD
test indicated that both BO without psychopathology and
NBO without psychopathology, compared with healthy
control subjects, had higher right amygdala activation
(BO4 healthy controls: P = 0.001, NBO4 healthy con-
trols: P = 0.02), but were not different from each other.
Table 3 The effect of presentation of happy, angry, fear and sad faces versus presentation of shapes on whole brain
activation in all participants
Region nvox z-score x y zActivation All Emotional Faces4Shapes
R LOC, inf 5612 11 40 �82 �10
L LOC, inf 3857 9.73 �38 �86 �12
R Amygdala 2130 10.3 24 0 �20
L Amygdala 1019 9.15 �26 �2 �18
R vlPFC 397 6.29 52 24 20
R Frontal medial cortex 72 5.72 6 54 �16
R Frontal pole/frontal orbital cortex 64 6.47 34 34 �14
R Subcallosal cortex 13 5.14 2 8 �14
L Frontal pole/frontal orbital cortex 13 5.12 �38 32 �16
The statistical maps were thresholded at voxel-wise corrected P 5 0.05. The resulting thresholded image is referred to as the face processing region of interest mask. nvox =
number of voxels in the cluster; R = right hemisphere; L = left hemisphere; LOC, inf = lateral occipital cortex, inferior division; vlPFC = ventrolateral prefrontal cortex.
8 | BRAIN 2015: Page 8 of 14 A. Manelis et al.
by guest on June 26, 2015D
ownloaded from
BO had significantly lower right amygdala-ACC functional
connectivity than healthy control subjects (BO5 healthy
controls: P = 0.001), but significantly higher right amyg-
dala-left ventrolateral PFC functional connectivity for
happy faces versus shapes than healthy control subjects
(BO4 healthy controls: P = 0.025). Measures of functional
connectivity did not significantly differ in BO versus NBO
and in NBO subjects versus healthy control subjects.
Unmedicated participants: post hoc comparisons
The results of post hoc comparisons using the Tukey’s
HSD test indicated that both unmedicated BO and
unmedicated NBO subjects, compared with healthy control
subjects, had higher right amygdala activation
(BO4 healthy controls: P = 0.001, NBO4 healthy con-
trols: P = 0.002), but were not different from each other.
Right amygdala-ACC functional connectivity was signifi-
cantly less positive in BO versus NBO (P = 0.04) and in
BO versus healthy control subjects (P50.001), but was
not different for NBO versus healthy control subjects.
Right amygdala-left ventrolateral PFC functional connect-
ivity for Happy faces versus Shapes was significantly more
positive in BO versus NBO subjects (P = 0.023) and in BO
versus healthy control subjects (P = 0.016), but was not
significantly different for NBO versus healthy control
subjects.
Figure 2 The differences in brain activation and functional connectivity in BO, NBO and healthy controls. (A) Right amygdala
activation, (B) right amygdala-ACC and (C) right amygdala-left ventrolateral PFC (LvlPFC) functional connectivity. The emotional face processing
region of interest mask is shown in green. The emotion regulation regions (ACC, OFC, and vlPFC) mask is shown in yellow. au = arbitrary units;
asterisk indicates significant post hoc Tukey’s HSD results. BO, n = 29; NBO, n = 29 and healthy control subjects (HC), n = 23.
Table 4 Main effect of Group (BO/NBO/HC) on right amygdala activation
Region nvox z-score x y z
Activation analysis: main effect of Group (all faces versus shape) in the face processing region of interest mask
R Amygdala 171 3.79 24 �6 -20
PPI analyses: RAmygdala – ACC,OFC, vlPFC region of interest mask main effect of Group
B ACC 146 3.45 2 28 22
PPI analyses: RAmygdala – ACC,OFC, vlPFC region of interest mask Group x Condition interaction
L vlPFC 111 3.83 �64 12 24
Main effect of Group on right amygdala bilateral anterior cingulate cortex functional connectivity, and a Group x Condition (Happy-Shape versus All Negative versus Shape)
interaction effect on right amygdala-left ventrolateral prefrontal cortex functional connectivity. The statistical maps were thresholded at voxel-wise-uncorrected P 5 0.005 (z 42.57) and a corrected cluster significance threshold of P 5 0.05 (Worsley, 2001). R = right hemisphere; L = left hemisphere; B = bilateral; PPI = psychophysiological interactions;
ACC = anterior cingulate cortex; vlPFC = ventrolateral prefrontal cortex.
Face processing in youth at-risk for bipolar disorder BRAIN 2015: Page 9 of 14 | 9
by guest on June 26, 2015D
ownloaded from
Exploratory analyses
Relation between neural measures and demo-
graphic, clinical, and behavioural variables
Right amygdala-ACC functional connectivity was signifi-
cantly positively correlated with CALS-C, MFQ-P,
SCARED-P and SCARED-C measures in NBO (CALS-C:
r = 0.4, P = 0.03; MFQ-P: r = 0.46, P = 0.02; SCARED-P:
r = 0.45, P = 0.02; SCARED-C: r = 0.41, P = 0.03), but
not in BO or healthy control subjects. Those correlations
with SCARED were significantly greater in NBO versus BO
(SCARED-P: Fisher’s z = 2.7, P = 0.007; SCARED-C:
Fisher’s z = 2.5, P = 0.01). CALS-P and MFQ-C measures
did not correlate significantly with neural measures in
either group. Right amygdala-ACC connectivity was signifi-
cantly negatively correlated with IQ in BO (r =�0.43,
P = 0.03) and NBO (r = �0.58, P = 0.001), but not in
healthy control subjects (r = 0.06). This correlation was sig-
nificantly more negative in NBO versus healthy control
subjects (Fisher’s z = �2.4, P = 0.02) and marginally signifi-
cant in BO versus healthy control subjects (Fisher’s
z = �1.7, P = 0.08).
Right amygdala-left ventrolateral PFC functional con-
nectivity to Happy faces-Shapes and participants’ age
were significantly negatively correlated in BO (r = �0.4,
P = 0.03), positively correlated in healthy control subjects
(r = 0.45, P = 0.03; BO5 healthy controls: Fisher’s
z = �3.1, P = 0.002), and not significantly correlated in
NBO (r = 0.16). Right amygdala-left ventrolateral PFC con-
nectivity to Happy faces-Shapes and response time to
correctly identify a happy expression were significantly
positively correlated in BO (r = 0.48, P = 0.009), negatively
correlated in NBO (r = �0.44, P = 0.02) and marginally
negatively correlated in healthy control subjects
(r = �0.41, P = 0.052; BO4NBO: Fisher’s z = 3.6,
P = 0.0003; BO4 healthy controls: Fisher’s z = 3.2,
P = 0.001).
The effect of pubertal status on main neuroimaging
measures
A 3 (Groups) � 2 (pubertal status: earlier/later) ANOVA
conducted on the three main neuroimaging measures iden-
tified in the above analyses testing main hypotheses
revealed neither a significant main effect of pubertal
status, nor an interaction between group and pubertal
status, on these activation and connectivity measures.
DiscussionOur goal was to determine the extent to which alterations
in neural functioning supporting processing of emotional
faces characterized BO relative to NBO and healthy control
subjects. Consistent with Hypotheses 1 and 2, we found
abnormally elevated right amygdala activation and abnor-
mally reduced positive right amygdala-ACC functional con-
nectivity in BO relative to healthy control subjects, and
abnormally reduced positive right amygdala-ACC func-
tional connectivity in BO relative to NBO, during implicit
processing of emerging emotional faces. Contrary to
Hypothesis 2, we found abnormally increased right amyg-
dala-left ventrolateral PFC functional connectivity for emer-
ging happy, but not negative, emotional faces in BO
compared with NBO and healthy control subjects. These
patterns of activation and functional connectivity remained
in participants free of current psychiatric diagnoses and
untreated with medications, supporting Hypothesis 3.Hypothesis 1 specifically predicted that BO, compared
with NBO and healthy control subjects, would show sig-
nificantly greater amygdala and reduced prefrontal cortical
activation to all emotional faces (versus shapes). An alter-
native hypothesis was that both BO and NBO would show
significantly greater amygdala activation than healthy con-
trol subjects. The amygdala is a key region for processing
of emotional faces and emotions in general (Haxby et al.,
2002; Glascher et al., 2004; Sabatinelli et al., 2011). Our
finding of abnormally elevated right amygdala activation to
all emotional faces in BO and NBO taken together with
previous findings of abnormally increased amygdala activa-
tion in individuals with established bipolar disorder
(Lawrence et al., 2004; Blumberg et al., 2005; Pavuluri
et al., 2007, 2009; Ladouceur et al., 2011; Hulvershorn
et al., 2012; Brotman et al., 2014b), in individuals at-risk
for bipolar disorder (Olsavsky et al., 2012), and also in
those at-risk for major depressive disorder (Monk et al.,
2008), suggest that elevated right amygdala activation
may be a risk marker for psychiatric disorders in general,
rather than for BO specifically. Interestingly, we did not
show a pattern of abnormally reduced prefrontal cortical
activation to emotional faces in BO relative to the other
groups. This may reflect the fact that the three participant
groups recruited prefrontal cortical regions to the same
extent, but differed in the magnitude of functional connect-
ivity between prefrontal cortical and amygdala regions,
during task performance, as is highlighted below.
Hypothesis 2 specifically predicted that BO, compared
with NBO and healthy control subjects, would show sig-
nificantly reduced amygdala-prefrontal cortical positive
functional connectivity to all emotional faces. The finding
of abnormally reduced positive right amygdala-ACC func-
tional connectivity in BO, relative to NBO and healthy
control subjects, supported this hypothesis. Given the role
of the ACC in implicit emotion regulation (Phillips et al.,
2008; Etkin et al., 2011), our finding of abnormally
reduced right amygdala-ACC functional connectivity to
all emotional faces in BO supports theories proposing
deficient regulation of the amygdala by prefrontal cortical
regions during emotion regulation in individuals with, and
at risk for, bipolar disorder (Phillips et al., 2008;
Strakowski et al., 2012; Phillips and Swartz, 2014) and
accords with previous findings in adults and youth with
bipolar disorder (Almeida et al., 2009; Wang et al., 2009,
2012; Ladouceur et al., 2011).
10 | BRAIN 2015: Page 10 of 14 A. Manelis et al.
by guest on June 26, 2015D
ownloaded from

While the finding of abnormally elevated right amygdala-
left ventrolateral PFC functional connectivity in BO
(BO4NBO, healthy controls) to happy faces did not sup-
port Hypothesis 2, and may contradict one previous finding
of reduced right amygdala-right ventrolateral PFC func-
tional connectivity in BO versus healthy control subjects
in an emotional regulation paradigm (Ladouceur et al.,
2013), other studies report similar findings to those of
the present study. For example, individuals with bipolar
disorder type 1 versus healthy control subjects showed
reduced inverse left amygdala-bilateral ventrolateral PFC
functional connectivity during emotional downregulation
(Townsend et al., 2013), individuals with bipolar disorder
type 2 versus healthy control subjects had higher positive
right amygdala-left ventrolateral PFC functional connectiv-
ity during emotional face processing (Vizueta et al., 2012),
and right amygdala-left ventrolateral PFC connectivity
increased during mania in individuals with bipolar disorder
type 1 (Cerullo et al., 2012). In addition, increased right
amygdala-left ventrolateral PFC functional connectivity was
reported in anxious versus healthy adolescents during social
evaluation anticipation (Guyer et al., 2008).
In parallel, abnormally increased left ventrolateral PFC
activation during outcome and reward expectancy has
been highlighted in adults with bipolar disorder (Nusslock
et al., 2012; Caseras et al., 2013; Chase et al., 2013;
Phillips and Swartz, 2014). Given the role of the ventrolat-
eral PFC in encoding the value of different decision-making
options (Walton et al., 2011), linking specific stimulus rep-
resentations to specific reward outcome representations
(Noonan et al., 2012), and the potential role of the anterior
left ventrolateral PFC in controlling access to stored con-
ceptual representations (Badre and Wagner, 2007), these
findings from our previous studies were interpreted as
reflecting increased engagement with reward and positive
emotions in particular in individuals with bipolar disorder
(Nusslock et al., 2012; Caseras et al., 2013; Chase et al.,
2013). Together, these previous and present findings
thereby suggest that the pattern of abnormally increased
functional connectivity between left ventrolateral PFC and
amygdala in BO relative to NBO and healthy control sub-
jects may reflect increased engagement with positive emo-
tions in BO, and may be a risk marker of bipolar disorder.
Hypothesis 3 predicted that altered neural functioning
within emotional face processing circuitry in BO versus
NBO versus healthy control youths would be present in
the subset of participants without current psychiatric diag-
noses and psychotropic medications. Our data supported
this hypothesis by showing the same activation and con-
nectivity patterns in the subset of participants that were
free of current psychopathology and did not take psycho-
tropic medications.
The fact that BO significantly differed from NBO and
from healthy control subjects in right amygdala-ACC and
right amygdala-left ventrolateral PFC functional connectiv-
ity suggests that these connectivity measures may both rep-
resent a unique neural mechanism characterizing BO,
compared with NBO and healthy controls. Taken to-
gether with previous findings that connectivity between
these regions is abnormal in individuals with already es-
tablished bipolar disorder (Cerullo et al., 2012; Vizueta
et al., 2012; Townsend et al., 2013), these findings sug-
gest that altered right amygdala-ACC and right amyg-
dala-left ventrolateral PFC connectivity in BO may be a
risk marker for future bipolar disorder, rather than a
protective marker against the development of bipolar dis-
order, in these youth. Future longitudinal follow-up stu-
dies are needed to determine the extent to which this is
the case, however.
There were interesting exploratory findings. Right amyg-
dala-left ventrolateral PFC functional connectivity posi-
tively correlated with explicit Happy face labelling
response time and negatively correlated with age in BO,
but not in NBO and healthy control subjects, suggesting
that abnormally increased right amygdala-left ventrolateral
PFC functional connectivity may be related to greater
engagement with, and greater difficulty in labelling,
happy faces (slower response time) in BO. This difficulty
may be greater for younger BO, for whom happy faces may
be more ambiguous than for older BO. IQ negatively
correlated with right amygdala-ACC functional connectiv-
ity in BO and NBO. This suggests that decreased positive
right amygdala-ACC functional connectivity may be a com-
pensatory mechanism in BO and NBO with higher IQ, to
modulate abnormally increased right amygdala activation
by increasing ACC activation.
In NBO, right amygdala-ACC functional connectivity
also positively correlated with measures of anxiety and
depression severity, suggesting that greater right amyg-
dala-ACC functional connectivity in NBO may be asso-
ciated with the emergence of affective pathology and
anxiety, and that the changes in right amygdala-ACC func-
tional connectivity may represent a state marker of anxiety
and depression severity in NBO. In contrast, right amyg-
dala-ACC connectivity in BO was not significantly corre-
lated with current levels of anxiety and depression severity,
suggesting that this connectivity pattern may be a trait
marker of BO that exists independently of a current level
of anxiety and depression severity. Clearly, these explora-
tory findings need to be replicated in future studies.
One limitation of this study was that we did not focus on
examining between-group differences in neural activation
and functional connectivity to the different negative emo-
tional faces, given our main focus on group differences to
positive versus all negative emotions. Future studies can
examine this with larger sample sizes. Another possible
limitation was using offspring of parents with psychopath-
ology from two recruitment sources (BIOS and LAMS).
Our exploratory analyses showed, however, that recruit-
ment source did not impact main findings because exclud-
ing BO and NBO from LAMS did not alter the results.
Future studies should also include youths with established
bipolar disorder to directly compare neural measures of
emotion processing in these youth with BO and NBO.
Face processing in youth at-risk for bipolar disorder BRAIN 2015: Page 11 of 14 | 11
by guest on June 26, 2015D
ownloaded from
In summary, our findings in BO indicate three main
themes of abnormal functioning in face emotion processing
circuitry: abnormally increased right amygdala activation,
abnormally reduced right amygdala-ACC functional connect-
ivity during emotion processing in general, and abnormally
increased right amygdala-left ventrolateral PFC positive func-
tional connectivity during processing of positive emotional
faces, that parallel the themes previously identified in indi-
viduals with bipolar disorder (Phillips and Swartz, 2014).
Importantly, these patterns of activation and functional con-
nectivity remained unchanged even after removing medicated
participants and those with current psychopathology from
the analyses. Given that both BO and NBO, with or without
psychopathology, showed abnormally increased right amyg-
dala activation, this pattern of abnormal activation may
confer risk for affective disorders in general, rather than bi-
polar disorder specifically. By contrast, the fact that right
amygdala-ACC and right amygdala-left ventrolateral PFC
functional connectivity differentiated BO from healthy con-
trol subjects and NBO, and that both patterns of abnormal
functional connectivity parallel findings in individuals with
established bipolar disorder, as discussed above, suggests that
these measures may be risk markers for the future develop-
ment of bipolar disorder in youth. BIOS is an ongoing study,
with all participants being invited for follow-up clinical as-
sessments. Our future research will thus be able to focus on
using the measures of abnormal right amygdala activation
and right amygdala-ACC and right amygdala-left ventrolat-
eral PFC functional connectivity to determine if these neuroi-
maging markers can help predict future mood and anxiety
symptom severity, as well as changes in diagnosis (e.g. de-
velopment of bipolar disorder) over time, in BO and NBO.
AcknowledgementsThe authors thank the families for participating in this re-
search study.
FundingThis work was supported by grants from the National
Institute of Health 2 R01 MH060952-12S1 to Birmaher,
Axelson, Phillips (MPIs) and R01 MH073953 to Birmaher
and Phillips (MPIs), and Pittsburgh Foundation to Phillips.
Supplementary materialSupplementary material is available at Brain online.
ReferencesAdleman NE, Kayser RR, Olsavsky AK, Bones BL, Muhrer EJ, Fromm
SJ, et al. Abnormal fusiform activation during emotional-face
encoding assessed with functional magnetic resonance imaging.
Psychiatry Res 2013; 212: 161–3.
Almeida JRC, Versace A, Mechelli A, Hassel S, Quevedo K, Kupfer
DJ, et al. Abnormal amygdala-prefrontal effective connectivity to
happy faces differentiates bipolar from major depression. Biol
Psychiatry 2009; 66: 451–9.
Andersson JLR, Jenkinson M, Smith S. Non-linear registration aka
spatial normalisation. Oxford: FMRIB Centre; Technical Report
FMRIB Technical Report TR07JA2; 2007.Angold A, Prendergast M, Cox A, Harrington R, Simonoff E, Rutter
M. The Child and Adolescent Psychiatric Assessment (CAPA).
Psychol Med 1995; 25: 739–53.Badre D, Wagner AD. Left ventrolateral prefrontal cortex and
the cognitive control of memory. Neuropsychologia 2007; 45:
2883–901.
Banks SJ, Eddy KT, Angstadt M, Nathan PJ, Phan KL. Amygdala-
frontal connectivity during emotion regulation. Soc Cogn Affect
Neurosci 2007; 2: 303–12.
Birmaher B, Axelson D, Monk K, Kalas C, Goldstein B, Hickey MB,
et al. Lifetime psychiatric disorders in school-aged offspring of par-
ents with bipolar disorder: the Pittsburgh Bipolar Offspring study.
Arch Gen Psychiatry 2009; 66: 287–96.
Birmaher B, Khetarpal S, Brent D, Cully M, Balach L, Kaufman J,
et al. The Screen for Child Anxiety Related Emotional Disorders
(SCARED): scale construction and psychometric characteristics.
J Am Acad Child Adolesc Psychiatry 1997; 36: 545–53.
Blumberg HP, Donegan NH, Sanislow CA, Collins S, Lacadie C,
Skudlarski P, et al. Preliminary evidence for medication effects on
functional abnormalities in the amygdala and anterior cingulate in
bipolar disorder. Psychopharmacology (Berl) 2005; 183: 308–13.
Brotman MA, Deveney CM, Thomas LA, Hinton KE, Yi JY, Pine DS,
et al. Parametric modulation of neural activity during face emotion
processing in unaffected youth at familial risk for bipolar disorder.
Bipolar Disord 2014a; 16: 756–63.Brotman MA, Guyer AE, Lawson ES, Horsey SE, Rich BA, Dickstein
DP, et al. Facial emotion labeling deficits in children and adolescents
at risk for bipolar disorder. Am J Psychiatry 2008a; 165: 385–9.
Brotman MA, Skup M, Rich BA, Blair KS, Pine DS, Blair JR, et al.
Risk for bipolar disorder is associated with face-processing deficits
across emotions. J Am Acad Child Adolesc Psychiatry 2008b; 47:
1455–61.
Brotman MA, Tseng WL, Olsavsky AK, Fromm SJ, Muhrer EJ,
Rutenberg JG, et al. Fronto-limbic-striatal dysfunction in pediatric
and adult patients with bipolar disorder: impact of face emotion and
attentional demands. Psychol Med 2014b; 44: 1639–51.Caseras X, Lawrence NS, Murphy K, Wise RG, Phillips ML. Ventral
striatum activity in response to reward: differences between bipolar
I and II disorders. Am J Psychiatry 2013; 170: 533–41.
Cerullo MA, Fleck DE, Eliassen JC, Smith MS, DelBello MP, Adler
CM, et al. A longitudinal functional connectivity analysis of the
amygdala in bipolar I disorder across mood states. Bipolar Disord
2012; 14: 175–84.
Chase HW, Nusslock R, Almeida JR, Forbes EE, Labarbara EJ,
Phillips ML. Dissociable patterns of abnormal frontal cortical acti-
vation during anticipation of an uncertain reward or loss in bipolar
versus major depression. Bipolar Disord 2013; 15: 839–54.Dickstein DP, Rich BA, Roberson-Nay R, Berghorst L, Vinton D, Pine
DS, et al. Neural activation during encoding of emotional faces in
pediatric bipolar disorder. Bipolar Disord 2007; 9: 679–92.
Dima D, Stephan KE, Roiser JP, Friston KJ, Frangou S. Effective con-
nectivity during processing of facial affect: evidence for multiple
parallel pathways. J Neurosci 2011; 31: 14378–85.
Etkin A, Egner T, Kalisch R. Emotional processing in anterior cingu-
late and medial prefrontal cortex. Trends Cogn Sci 2011; 15: 85–93.
Fairhall SL, Ishai A. Effective connectivity within the distributed cor-
tical network for face perception. Cereb Cortex 2007; 17: 2400–6.
Findling RL, Youngstrom EA, Fristad MA, Birmaher B, Kowatch RA,
Arnold LE, et al. Characteristics of children with elevated symptoms
12 | BRAIN 2015: Page 12 of 14 A. Manelis et al.
by guest on June 26, 2015D
ownloaded from

of mania: the Longitudinal Assessment of Manic Symptoms (LAMS)
study. J Clin Psychiatry 2010; 71: 1664–72.
First MB, Spitzer RL, Gibbon M, Williams JBW. Structured Clinical
Interview for DSM-IV-TR Axis I disorders, research version, non-
patient edition. (SCID-I/NP) New York, NY: Biometrics research,
New York State Psychiatric Institute; 2002.Friston KJ, Buechel C, Fink GR, Morris J, Rolls E, Dolan RJ.
Psychophysiological and modulatory interactions in neuroimaging.
Neuroimage 1997; 6: 218–29.
Fusar-Poli P, Placentino A, Carletti F, Landi P, Allen P, Surguladze S,
et al. Functional atlas of emotional faces processing: a voxel-based
meta-analysis of 105 functional magnetic resonance imaging studies.
J Psychiatry Neurosci 2009; 34: 418–32.
Gerson AC, Gerring JP, Freund L, Joshi PT, Capozzoli J, Brady K,
et al. The Children’s Affective Lability Scale: a psychometric evalu-
ation of reliability. Psychiatry Res 1996; 65: 189–98.Glascher J, Tuscher O, Weiller C, Buchel C. Elevated responses to
constant facial emotions in different faces in the human amygdala:
an fMRI study of facial identity and expression. BMC Neurosci
2004; 5: 45.
Goldstein BI, Shamseddeen W, Axelson DA, Kalas C, Monk K, Brent
DA, et al. Clinical, demographic, and familial correlates of bipolar
spectrum disorders among offspring of parents with bipolar dis-
order. J Am Acad Child Adolesc Psychiatry 2010; 49: 388–96.
Guyer AE, Lau JYF, McClure-Tone EB, Parrish J, Shiffrin ND,
Reynolds RC, et al. Amygdala and ventrolateral prefrontal cortex
function during anticipated peer evaluation in pediatric social anx-
iety. Arch Gen Psychiatry 2008; 65: 1303–12.
Guyer AE, McClure EB, Adler AD, Brotman MA, Rich BA, Kimes AS,
et al. Specificity of facial expression labeling deficits in childhood
psychopathology. J Child Psychol Psychiatry 2007; 48: 863–71.Hafeman DM, Bebko G, Bertocci MA, Fournier JC, Bonar L, Perlman
SB, et al. Abnormal deactivation of the inferior frontal gyrus during
implicit emotion processing in youth with bipolar disorder:
Attenuated by medication. J Psychiatr Res 2014; 58C: 129–36.
Haxby JV, Hoffman EA, Gobbini MI. Human neural systems for face
recognition and social communication. Biol Psychiatry 2002; 51:
59–67.
Hollingshead AB. Four factor index of social status. New Haven, CT:
Yale University Department of Sociology; 1975.
Horwitz SM, Demeter CA, Pagano ME, Youngstrom EA, Fristad MA,
Arnold LE, et al. Longitudinal Assessment of Manic Symptoms
(LAMS) study: background, design, and initial screening results.
J Clin Psychiatry 2010; 71: 1511–17.Hulvershorn LA, Karne H, Gunn AD, Hartwick SL, Wang Y,
Hummer TA, et al. Neural activation during facial emotion process-
ing in unmedicated bipolar depression, euthymia, and mania. Biol
Psychiatry 2012; 71: 603–10.
Ishai A. Let’s face it: it’s a cortical network. Neuroimage 2008; 40:
415–19.
Ishai A, Haxby JV, Ungerleider LG. Visual imagery of famous faces:
effects of memory and attention revealed by fMRI. Neuroimage
2002; 17: 1729–41.
Jenkinson M. Fast, automated, N-dimensional phase-unwrapping algo-
rithm. Magn Reson Med 2003; 49: 193–7.
Jenkinson M, Bannister P, Brady M, Smith S. Improved optimization
for the robust and accurate linear registration and motion correction
of brain images. Neuroimage 2002; 17: 825–41.
Jenkinson M, Smith S. A global optimisation method for robust affine
registration of brain images. Med Image Anal 2001; 5: 143–56.
Kaufman J, Birmaher B, Brent D, Rao U, Flynn C, Moreci P, et al.
Schedule for Affective Disorders and Schizophrenia for School-Age
Children-Present and Lifetime Version (K-SADS-PL): initial reliabil-
ity and validity data. J Am Acad Child Adolesc Psychiatry 1997; 36:
980–8.
Ladouceur CD, Diwadkar VA, White R, Bass J, Birmaher B, Axelson
DA, et al. Fronto-limbic function in unaffected offspring at familial
risk for bipolar disorder during an emotional working memory
paradigm. Dev Cogn Neurosci 2013; 5: 185–96.
Ladouceur CD, Farchione T, Diwadkar V, Pruitt P, Radwan J,
Axelson DA, et al. Differential patterns of abnormal activity and
connectivity in the amygdala-prefrontal circuitry in bipolar-I and
bipolar-NOS youth. J Am Acad Child Adolesc Psychiatry 2011;
50: 1275–89.e2.
Lawrence NS, Williams AM, Surguladze S, Giampietro V, Brammer
MJ, Andrew C, et al. Subcortical and ventral prefrontal cortical
neural responses to facial expressions distinguish patients with
bipolar disorder and major depression. Biol Psychiatry 2004; 55:
578–87.Leveroni CL, Seidenberg M, Mayer AR, Mead LA, Binder JR, Rao
SM. Neural systems underlying the recognition of familiar and
newly learned faces. J Neurosci 2000; 20: 878–86.
Monk CS, Klein RG, Telzer EH, Schroth EA, Mannuzza S, Moulton
JL 3rd, et al. Amygdala and nucleus accumbens activation to emo-
tional facial expressions in children and adolescents at risk for major
depression. Am J Psychiatry 2008; 165: 90–8.
Morris JS, Frith CD, Perrett DI, Rowland D, Young AW, Calder AJ,
et al. A differential neural response in the human amygdala to fear-
ful and happy facial expressions. Nature 1996; 383: 812–15.Noonan MP, Kolling N, Walton ME, Rushworth MF. Re-evaluating
the role of the orbitofrontal cortex in reward and reinforcement. Eur
J Neurosci 2012; 35: 997–1010.
Nusslock R, Almeida JRC, Forbes EE, Versace A, Frank E, Labarbara
EJ, et al. Waiting to win: elevated striatal and orbitofrontal cortical
activity during reward anticipation in euthymic bipolar disorder
adults. Bipolar Disord 2012; 14: 249–60.
Oldfield RC. The assessment and analysis of handedness: The
Edinburgh inventory. Neuropsychologia 1971; 9: 97–113.
Olsavsky AK, Brotman MA, Rutenberg JG, Muhrer EJ, Deveney CM,
Fromm SJ, et al. Amygdala hyperactivation during face emotion
processing in unaffected youth at risk for bipolar disorder. J Am
Acad Child Adolesc Psychiatry 2012; 51: 294–303.
Pavuluri MN, O’Connor MM, Harral E, Sweeney JA. Affective neural
circuitry during facial emotion processing in pediatric bipolar dis-
order. Biol Psychiatry 2007; 62: 158–67.Pavuluri MN, Passarotti AM, Harral EM, Sweeney JA. An fMRI study
of the neural correlates of incidental versus directed emotion pro-
cessing in pediatric bipolar disorder. J Am Acad Child Adolesc
Psychiatry 2009; 48: 308–19.
Perlman SB, Fournier JC, Bebko G, Bertocci MA, Hinze AK, Bonar L,
et al. Emotional face processing in pediatric bipolar disorder: evi-
dence for functional impairments in the fusiform gyrus. J Am Acad
Child Adolesc Psychiatry 2013; 52: 1314–25.e3.
Petersen AC, Crockett L, Richards M, Boxer A. A self-report measure
of pubertal status: Reliability, validity, and initial norms. J Youth
Adolesc 1988; 17: 117–33.
Phillips ML, Ladouceur CD, Drevets WC. A neural model of volun-
tary and automatic emotion regulation: implications for understand-
ing the pathophysiology and neurodevelopment of bipolar disorder.
Mol Psychiatry 2008; 13: 833–57.
Phillips ML, Swartz HA. A critical appraisal of neuroimaging studies
of bipolar disorder: toward a new conceptualization of underlying
neural circuitry and a road map for future research. Am J Psychiatry
2014; 171: 829–43.Phillips ML, Young AW, Senior C, Brammer M, Andrew C, Calder
AJ, et al. A specific neural substrate for perceiving facial expressions
of disgust. Nature 1997; 389: 495–8.
Rich BA, Vinton DT, Roberson-Nay R, Hommer RE, Berghorst LH,
McClure EB, et al. Limbic hyperactivation during processing of neu-
tral facial expressions in children with bipolar disorder. Proc Natl
Acad Sci USA 2006; 103: 8900–5.
Sabatinelli D, Fortune EE, Li Q, Siddiqui A, Krafft C, Oliver WT,
et al. Emotional perception: meta-analyses of face and natural
scene processing. Neuroimage 2011; 54: 2524–33.
Face processing in youth at-risk for bipolar disorder BRAIN 2015: Page 13 of 14 | 13
by guest on June 26, 2015D
ownloaded from
Smith SM. Fast robust automated brain extraction. Hum Brain Mapp2002; 17: 143–55.
Strakowski SM, Adler CM, Almeida J, Altshuler LL, Blumberg HP,
Chang KD, et al. The functional neuroanatomy of bipolar disorder:
a consensus model. Bipolar Disord 2012; 14: 313–25.Tottenham N, Tanaka JW, Leon AC, McCarry T, Nurse M, Hare TA,
et al. The NimStim set of facial expressions: judgments from
untrained research participants. Psychiatry Res 2009; 168: 242–9.
Townsend JD, Torrisi SJ, Lieberman MD, Sugar CA, Bookheimer SY,Altshuler LL. Frontal-amygdala connectivity alterations during emo-
tion downregulation in bipolar I disorder. Biol Psychiatry 2013; 73:
127–35.Tseng WL, Bones BL, Kayser RR, Olsavsky AK, Fromm SJ, Pine DS,
et al. An fMRI study of emotional face encoding in youth at risk for
bipolar disorder. Eur Psychiatry 2014; 30: 94–8.
Tsuchida A, Fellows LK. Are you upset? Distinct roles for orbitofron-tal and lateral prefrontal cortex in detecting and distinguishing facial
expressions of emotion. Cereb Cortex 2012; 22: 2904–12.
Versace A, Thompson WK, Zhou D, Almeida JRC, Hassel S, Klein
CR, et al. Abnormal left and right amygdala-orbitofrontal corticalfunctional connectivity to emotional faces: state versus trait vulner-
ability markers of depression in bipolar disorder. Biol Psychiatry
2010; 67: 422–31.
Vizueta N, Rudie JD, Townsend JD, Torrisi S, Moody TD,Bookheimer SY, et al. Regional fMRI hypoactivation and altered
functional connectivity during emotion processing in nonmedicated
depressed patients with bipolar II disorder. Am J Psychiatry 2012;169: 831–40.
Vuilleumier P, Armony JL, Driver J, Dolan RJ. Effects of attention andemotion on face processing in the human brain: an event-related
fMRI study. Neuron 2001; 30: 829–41.
Walton ME, Behrens TE, Noonan MP, Rushworth MF. Giving credit
where credit is due: orbitofrontal cortex and valuation in an uncer-tain world. Ann N Y Acad Sci 2011; 1239: 14–24.
Wang F, Bobrow L, Liu J, Spencer L, Blumberg HP. Corticolimbic
functional connectivity in adolescents with bipolar disorder. PLoS
One 2012; 7: e50177.Wang F, Kalmar JH, He Y, Jackowski M, Chepenik LG, Edmiston EE,
et al. Functional and structural connectivity between the perigenual
anterior cingulate and amygdala in bipolar disorder. Biol Psychiatry2009; 66: 516–21.
Wechsler D. Wechsler abbreviated scale of intelligence. San Antonio,
TX: The Psychological Corporation; 1999.
Weissman MM, Wickramaratne P, Adams P, Wolk S, Verdeli H,Olfson M. Brief screening for family psychiatric history: the family
history screen. Arch Gen Psychiatry 2000; 57: 675e82.
Willis ML, Palermo R, McGrillen K, Miller L. The nature of facial
expression recognition deficits following orbitofrontal cortexdamage. Neuropsychology 2014; 28: 613–23.
Worsley KJ. Statistical analysis of activation images. In: Jezzard P,
Matthews PM, Smith SM, eds. Functional MRI: an introduction to
methods, Chapter 14. New York, NY: Oxford University Press; 2001.Youngstrom EA, Frazier TW, Demeter C, Calabrese JR, Findling RL.
Developing a 10-item mania scale from the Parent General Behavior
Inventory for children and adolescents. J Clin Psychiatry 2008; 69:831–9.
14 | BRAIN 2015: Page 14 of 14 A. Manelis et al.
by guest on June 26, 2015D
ownloaded from
Related Documents