Alma Mater Studiorum - Università di Bologna DOTTORATO DI RICERCA IN PSICOLOGIA Ciclo 33 Settore Concorsuale: 11/E4 - PSICOLOGIA CLINICA E DINAMICA Settore Scientifico Disciplinare: M-PSI/08 - PSICOLOGIA CLINICA PROMOTING WEIGHT LOSS AND DISTRESS REDUCTION IN PATIENTS WITH TYPE 2 DIABETES: A RANDOMIZED CONTROLLED TRIAL OF A COMBINED WELL-BEING AND LIFESTYLE INTERVENTION Presentata da: Giada Benasi Supervisore Chiara Rafanelli Esame finale anno 2021 Coordinatore Dottorato Maurizio Codispoti

Welcome message from author
This document is posted to help you gain knowledge. Please leave a comment to let me know what you think about it! Share it to your friends and learn new things together.
Transcript
Alma Mater Studiorum - Università di Bologna
DOTTORATO DI RICERCA IN
PSICOLOGIA
Ciclo 33
Settore Concorsuale: 11/E4 - PSICOLOGIA CLINICA E DINAMICA
Settore Scientifico Disciplinare: M-PSI/08 - PSICOLOGIA CLINICA
PROMOTING WEIGHT LOSS AND DISTRESS REDUCTION IN PATIENTS WITH TYPE 2 DIABETES: A RANDOMIZED CONTROLLED TRIAL OF A COMBINED
WELL-BEING AND LIFESTYLE INTERVENTION
Presentata da: Giada Benasi
Supervisore
Chiara Rafanelli
Esame finale anno 2021
Coordinatore Dottorato
Maurizio Codispoti
Table of Contents Abstract ................................................................................................................................................ 1
Chapter 1: THE ROLE OF OBESITY IN TYPE 2 DIABETES ............................................... 3 1.1 Type 2 diabetes ...................................................................................................................... 3
1.1.1 Definition and diagnosis ................................................................................................. 3 1.1.2 Prevalence and epidemiology ......................................................................................... 4 1.1.3 Risk factors ..................................................................................................................... 6 1.1.4 Consequences and complications.................................................................................... 8
1.2 Overweight and obesity ....................................................................................................... 10 1.2.1 Definition and classification ......................................................................................... 10 1.2.2 Prevalence and epidemiology ....................................................................................... 11 1.2.3 Risk factors ................................................................................................................... 12 1.2.4 Consequences and complications.................................................................................. 13
1.3 Management of type 2 diabetes and overweight/obesity ..................................................... 14 1.3.1 Lifestyle interventions................................................................................................... 15 1.3.2 Medications ................................................................................................................... 18 1.3.3 Surgery .......................................................................................................................... 20
Chapter 2: PSYCHOSOCIAL VARIABLES IN TYPE 2 DIABETES .................................. 22 2.1 Psychological distress .......................................................................................................... 22
2.1.1 Diabetes-related distress ............................................................................................... 23 2.1.2 Depression ..................................................................................................................... 24 2.1.3 Anxiety .......................................................................................................................... 27 2.1.4 Other psychosocial variables ........................................................................................ 28 2.1.5 Psychological interventions for distress ........................................................................ 29
2.2 Psychological well-being ..................................................................................................... 31 2.2.1 Definition ...................................................................................................................... 31 2.2.2 Health-related consequences ......................................................................................... 32 2.2.3 Well-being interventions ............................................................................................... 33
Chapter 3: EXPERIMENTAL STUDY ..................................................................................... 35 3.1 Rationale .............................................................................................................................. 35 3.2 Aims and Objectives ............................................................................................................ 36 3.3. Hypotheses .......................................................................................................................... 37 3.4 Methods ................................................................................................................................ 37
3.4.1 Research design and procedures ................................................................................... 37 3.4.2 Participants .................................................................................................................... 38 3.4.3 Interventions.................................................................................................................. 39
3.4.3.1 Well-being intervention protocol ........................................................................... 40 3.4.3.2 Lifestyle intervention protocol ............................................................................... 45 3.4.3.3 Treatment as usual ................................................................................................. 47
3.4.4 Assessment .................................................................................................................... 47 3.4.4.1 Baseline assessment ............................................................................................... 48 3.4.4.2 Feasibility and Acceptability ................................................................................. 49 3.4.4.3 Primary Superiority Outcomes ............................................................................... 50 3.4.4.4 Secondary Superiority Outcomes ........................................................................... 53
3.4.5 Statistical analysis ......................................................................................................... 55 3.5 Results .................................................................................................................................. 57
3.5.1 Baseline characteristics of the sample .......................................................................... 57
3.5.1.1 Socio-demographic variables ................................................................................. 57 3.5.1.2 Medical profile ....................................................................................................... 59 3.5.1.3 Weight history ........................................................................................................ 66 3.5.1.4 Psychological profile .............................................................................................. 72 3.5.1.5 Lifestyle ................................................................................................................. 78
3.5.2 Lifestyle engagement .................................................................................................... 81 3.5.3 Feasibility and acceptability .......................................................................................... 82 3.5.4 Primary Superiority Outcomes...................................................................................... 87
3.5.4.1 Psychological distress ............................................................................................ 87 3.5.4.2 Psychological well-being ....................................................................................... 91 3.5.4.3 Weight .................................................................................................................... 95
3.5.5 Secondary Superiority Outcomes.................................................................................. 99 3.5.5.1 Lifestyle ................................................................................................................. 99 3.5.5.2 Physiological parameters ..................................................................................... 101
3.6 Discussion .......................................................................................................................... 108 3.6.1 Study limitations ......................................................................................................... 115
3.7 General conclusions and implications................................................................................ 116
References ....................................................................................................................................... 118
1
Abstract
Introduction: Current lifestyle interventions for the treatment of type 2 diabetes and weight loss
show limited effects, while the promotion of psychological well-being has shown preliminary
benefits in reducing psychological distress and improving self-care behaviors in type 2 diabetes and
weight loss.
Objectives: The aim of this study was to evaluate the feasibility, acceptability, and superiority of a
4-month combined well-being and lifestyle intervention for weight loss and distress reduction
among adult patients with type 2 diabetes and overweight/obesity compared to lifestyle intervention
alone. Primary efficacy outcomes included changes in weight, psychological distress, and well-
being, while secondary efficacy outcomes included changes in lifestyle and physiological
parameters.
Methods: In this multicenter RCT, 58 consecutive patients were recruited from two outpatient
endocrinology clinics and randomized to either a combined WBT-lifestyle group, receiving the
combined well-being and lifestyle intervention (n=30), or a lifestyle alone group, receiving a
lifestyle intervention only (n=28). Data were collected at baseline (T0), at immediate post-
intervention (T1), and at a 6-month follow-up (T2).
Results: The study intervention was shown to be feasible and acceptable. Compared to the lifestyle
alone group, the combined WBT-lifestyle group showed significantly greater improvements in
levels of depression, hostility, and personal growth at T1 and in levels of physical activity at T2.
There were no significant differences between treatment groups in measures of weight and other
physiological parameters at any assessment points. However, significant improvements were
observed from T0 to T2 in weight in both treatment groups, and in blood pressure in the combined
WBT-lifestyle group.

2
Conclusions: The findings suggest that a well-being intervention can be a valuable addition to
lifestyle interventions in improving short-term psychological outcomes and promoting healthy
changes in physical activity at a 6-month follow-up.
3
Chapter 1: THE ROLE OF OBESITY IN TYPE 2 DIABETES
1.1 Type 2 diabetes
1.1.1 Definition and diagnosis
Diabetes mellitus, hereafter simply diabetes, is a chronic, non-communicable metabolic disorder
characterized by impaired glucose metabolism and consequent chronic hyperglycemia (American
Diabetes Association, 2020c; World Health Organization, 2020a). Broadly speaking, diabetes is
caused by either an absolute or relative deficiency of insulin, a hormone produced by the beta cells
of the pancreas that is responsible for lowering levels of glucose in the blood through uptake into
organs and muscles. Peripheral resistance to the action of insulin (i.e., the body is not able to
effectively use the insulin produced in the pancreas) results in relative deficiency, while impairment
in insulin secretion (i.e., the pancreas does not produce enough insulin) results in an absolute
deficiency (American Diabetes Association, 2020c; World Health Organization, 2020a).
The term diabetes encompasses a group of disorders characterized by different clinical
presentation and pathophysiology. Type 2 diabetes is the most common form, accounting for more
than 90% of all cases (Xu et al., 2018). In type 2 diabetes, a form of non-insulin dependent diabetes,
the pancreas is still producing insulin and hyperglycemia is due to a diminished response of the
body’s organs and muscles to insulin, also called insulin resistance (American Diabetes
Association, 2020c; World Health Organization, 2020a). Other forms of diabetes are less common
and include type 1 diabetes, gestational diabetes, monogenic diabetes (i.e., maturity-onset diabetes
of the young or MODY), and secondary diabetes (American Diabetes Association, 2020c; World
Health Organization, 2020a). Type 1 diabetes comprises 5% to 10% of all cases of diabetes and is
an autoimmune condition that results in the destruction of pancreatic beta cells, leading to
dependence on external sources of insulin, or insulin dependent diabetes (American Diabetes
Association, 2020c; World Health Organization, 2020a). Gestational diabetes is a type of non-
4
insulin dependent diabetes that is first diagnosed in pregnancy in a patient without a pre-existing
diagnosis of diabetes. This condition affects 7% of all pregnancies, increasing the risk of
complications during pregnancy for both the mother and the fetus and the risk of developing type 2
diabetes in the future for both the mother and child (American Diabetes Association, 2020c; World
Health Organization, 2020a). Finally, monogenic diabetes affects about 1% to 5% of all cases of
diabetes and is caused by a genetic mutation, while secondary diabetes may be the consequence of
other systemic diseases (e.g., hemochromatosis), drugs (e.g., corticosteroids), or complications of
another disease affecting the pancreas (e.g., chronic pancreatitis) (American Diabetes Association,
2020c).
A diagnosis of diabetes is usually made with either a blood hemoglobin A1c (hbA1c) ≥ 6.5% or
a fasting plasma glucose (FPG) ≥ 126 mg/dL. HbA1c is a measurement of the percentage of
glycated hemoglobin in the blood and provides a general measure of the level of blood glucose
control over the preceding 3 months, while FPG is the level of glucose in the blood after 8 hours of
overnight fasting. Another standard test is the 2-hour Oral Glucose Tolerance Test (OGTT), which
assesses blood glucose levels before and 2 hours after the ingestion of 75 mg of glucose. A plasma
glucose (PG) level in the 2-hour sample > 200 mg/dL is diagnostic of diabetes (American Diabetes
Association, 2020c). An intermediate condition of pre-diabetes is commonly described following an
impaired glucose tolerance (IGT) reading (i.e., a 2-hour PG during 75-g OGTT from 140 mg/dL to
199 mg/dL), impaired fasting glycemia (IFG) reading (i.e., FPG levels between 100 mg/dL and 125
mg/dL), and/or a hbA1c between 5.7% and 6.4% (American Diabetes Association, 2020c). Pre-
diabetes represents a significant risk factor for the development of diabetes and cardiovascular
disease (Richter, Hemmingsen, Metzendorf, & Takwoingi, 2018; Zhang et al., 2010).
1.1.2 Prevalence and epidemiology
The global prevalence of diabetes among adults has almost doubled during the past three
decades, rising from 4.7% in 1980 to 8.5% in 2014 (World Health Organization, 2020a; Zimmet et
5
al., 2014). A similar trend has been observed in the Italian population from 1980 to 2013, where the
prevalence of diabetes has increased from 3.3% to 7.1% in men and from 4.7% to 6.8% in women
(Gnavi et al., 2018). Higher estimates have been observed in the USA, where the prevalence of
diabetes among adults rose from 9.5% in 1999-2002 to 12% in 2013-2016, reaching a prevalence of
13% in 2018 (Centers for Disease Control and Prevention, 2020c), and the prevalence is expected to
keep increasing in the next couple of decades (Khan et al., 2020). According to the International
Diabetes Federation Diabetes Atlas, the global prevalence of diabetes was estimated to be 9.3% in
2019, and an increase to 10.2% and 10.9% is expected by 2030 and 2045, respectively (Saeedi et
al., 2019). Even if these figures often do not distinguish between type 1 and type 2 diabetes, it has
been reported that the increase in diabetes in the past decades is mostly related to the rise of type 2
diabetes (World Health Organization, 2020a). Furthermore, data on the prevalence and incidence of
type 2 diabetes are likely to be underestimated because around 1 in 3 people with diabetes are
thought to be undiagnosed (Saeedi et al., 2019). Due to their large populations, the USA, China, and
India are the countries with the highest total number of cases of type 2 diabetes in the world (Khan
et al., 2020). While the prevalence of type 2 diabetes has been increasing in all countries
independently of their incomes, new cases are increasing faster in low and middle-income countries
compared with high-income countries (Khan et al., 2020; World Health Organization, 2020b).
The prevalence of diabetes generally increases with age. In the USA, new cases of diabetes
are higher among people who are 45 years or older, with a prevalence of 26.8% among people 65
years of age or older, 17.5% among people between 45 and 64 years of age, and 4.2% among
people between 18 and 44 years of age (Centers for Disease Control and Prevention, 2020c). This
age-related trend is characteristic of type 2 diabetes, while type 1 diabetes is more commonly
diagnosed during childhood and adolescence. However, the prevalence of type 2 diabetes is
currently increasing among children, adolescents, and young adults as well (Centers for Disease
Control and Prevention, 2019a).
6
The prevalence of diabetes differs among people based on socio-economic status, though
different patterns are seen in countries based on their level of economic development. In high-
income countries, diabetes disproportionally affects people with a low socio-economic status
(Agardh et al., 2011), while in low and middle-income countries a higher prevalence of diabetes has
been observed in people with higher income and higher levels of education (Seiglie et al., 2020).
The prevalence of diabetes is higher among ethnic and racial minorities. In the USA, 22.1% of
Hispanic people, 20.4% of non-Hispanic black people, and 19.1% of Asian people had a diagnosis
of diabetes between 2011 and 2016 compared to 12.1% of non-Hispanic white people (Cheng et al.,
2019). Finally, sex differences in the prevalence of type 2 diabetes do not appear to be significant,
with a slightly higher prevalence among men < 60 years and among women > 65 years (Centers for
Disease Control and Prevention, 2020c; Khan et al., 2020).
1.1.3 Risk factors
Various genetic and environmental factors have been implicated in the development of type
2 diabetes (Franks et al., 2013; Zheng et al., 2018).
Type 2 diabetes has a stronger genetic component than type 1 diabetes (Zheng et al., 2018).
It has been estimated that people with one first-degree relative with type 2 diabetes are 2.5 times
more likely to develop the disease. The risk of developing the disease is even higher when two or
three family members have type 2 diabetes (Scott et al., 2013). A meta-analysis of data from twin
studies showed a 72% heritability for type 2 diabetes, with a higher concordance rate among
monozygotic twins than dizygotic twins (Willemsen et al., 2015). Genome-wide association studies
have identified several loci that affect insulin secretion and action, suggesting that type 2 diabetes is
a highly polygenic disease (Fuchsberger et al., 2016). However, the rapid rise of the diabetes
epidemic in association with major lifestyle changes in modern society along with data showing
that lifestyle modification can prevent the development of the disease suggest a significant
contribution from environmental factors to the disease (Sumamo Schellenberg et al., 2013).
7
The main environmental risk factors for type 2 diabetes, also referred to as modifiable risk
factors, include obesity, lack of physical activity, and unhealthy diet (Chatterjee et al., 2017). Being
overweight or obese represents the strongest risk factor for the development of type 2 diabetes
(Bellou et al., 2018). In fact, the prevalence of type 2 diabetes increases linearly with BMI (Nguyen
et al., 2011), most patients with type 2 diabetes are also overweight or obese (World Health
Organization, 2020c), and abdominal obesity, weight gain since young adulthood, and visceral
adiposity are all independent risk factors of type 2 diabetes (Bozorgmanesh et al., 2011; Jafari-
Koshki et al., 2016; Zheng et al., 2018). One of the possible mechanisms by which these factors can
induce type 2 diabetes is via adipose (i.e., fat) tissue. Excessive adipose tissue promotes various
inflammatory mechanisms, including free fatty acid release and adipokine dysregulation, that lead
to insulin resistance (Galicia-Garcia et al., 2020).
Another major modifiable risk factor for type 2 diabetes is lack of physical activity. A linear
association between sedentary behaviors and type 2 diabetes has been found in numerous studies,
with total sedentary time and time spent watching TV being associated with an increased risk for
type 2 diabetes (Grøntved & Hu, 2011; Patterson et al., 2018). On the other hand, an increase in
physical activity has been shown to both prevent the development of type 2 diabetes and improve
glucose control and reduce disease complications in patients with a diagnosis of type 2 diabetes
(Warburton et al., 2006). For example, in a meta-analysis of longitudinal studies in the general
population, 150 minutes of moderate per week has been associated with a risk reduction of 26% for
the development of type 2 diabetes, with even higher levels of physical activity being associated
with a risk reduction of up to 56% (Smith, Crippa, Woodcock, & Brage, 2016). In patients with
type 2 diabetes, regular physical activity can improve metabolic parameters and vascular health,
reduce inflammation, and promote weight loss (Kirwan et al., 2017).
Diet is another important factor in the prevention and management of type 2 diabetes.
Although controlling overall energy intake is important, the quality of the diet rather than quantity
is what appears to be more important for the prevention and management of type 2 diabetes
8
(Bhupathiraju et al., 2014). More specifically, most guidelines recommend avoiding or reducing the
consumption of red or processed meats, refined grains and sugar, and foods high in sodium and
trans-fat due to their negative impact on weight and cardiovascular health, while consuming
vegetables, fruits, whole grains, legumes, nuts, and dairy products in moderation (Forouhi et al.,
2018). A healthy diet, along with physical activity, has been associated with a reduced risk of type 2
diabetes (Hemmingsen et al., 2017). Moreover, a diet rich in vegetables, such as the Mediterranean
diet, may reduce the risk of developing type 2 diabetes by 19% and 23% and has been associated
with better glycemic control and reduction of cardiovascular risk factors compared to control diets
among patients with type 2 diabetes (Esposito et al., 2015).
Finally, another two factors that can have an impact on type 2 diabetes are alcohol consumption and
tobacco use. The risk of type 2 diabetes increases linearly with the number of cigarettes smoked
(Maddatu et al., 2017). However, a moderate consumption of alcohol (i.e., < 63 g/day) has been
associated with a reduced risk of type 2 diabetes compared to complete abstinence or higher
consumption (Knott et al., 2015), and with improvements in insulin sensitivity and lipid profile
(Joosten et al., 2008).
1.1.4 Consequences and complications
Common symptoms of diabetes are related to hyperglycemia and include increased urination,
thirst, hunger, and fatigue, blurred vision, and poor wound healing (American Diabetes Association,
2020c; World Health Organization, 2020a). Weight loss is a common presenting symptom in type 1
diabetes due to the body’s inability to derive energy from glucose due to absence of insulin, type 2
diabetes is associated with overweigh and obesity due to these conditions’ presumptive effects on
peripheral insulin resistance (American Diabetes Association, 2020c). Although presenting
symptoms of type 1 and 2 diabetes may be similar, symptoms generally occur suddenly in type 1
diabetes, often in an acute presentation following a triggering event such as an illness. Type 2
diabetes progresses slowly and symptoms are often mild or absent in the earliest stages of the
9
disease as the body slowly loses the ability to control blood glucose levels (American Diabetes
Association, 2020c).
Diabetes is associated with both acute and chronic complications. The two most common
acute complications of diabetes are diabetic ketoacidosis (DKA) and hyperglycemic hyperosmolar
state (HHS) (Kitabchi et al., 2009). DKA is a syndrome of hyperglycemia, dehydration, and
reliance of the body on ketones for energy due to an inability to utilize glucose which results in
metabolic acidosis (Eledrisi & Elzouki, 2020). While this complication is more common in type 1
diabetes following an acute event such as trauma, surgery, or a systemic infection, it can also occur
in patients with type 2 diabetes (Eledrisi & Elzouki, 2020; Kitabchi et al., 2009; Newton & Raskin,
2004). HHS is characterized by severe hyperglycemia, dehydration, and hyperosmolality, or
concentrated blood, in the absence of significant acidosis (Stoner, 2017). This complication is more
common in patients with type 2 diabetes, mostly among the elderly or during the initial presentation
of the disease among young adults and teenagers (Kitabchi et al., 2009). Both DKA and HHS are
life-threatening complications and require emergency medical care. Untreated, DKA can lead to
coma, cardiac arrest, thromboembolism, and cerebral edema (Misra & Oliver, 2015), while HHS
can be associated with seizures, coma, and acute renal failure (Stoner, 2017).
Over time, chronic hyperglycemia can lead to chronic complications due to damage to blood
vessels and nerves, resulting in microvascular complications such as nephropathy, neuropathy, and
retinopathy, and macrovascular complications such as coronary artery disease, peripheral artery
disease, and cerebrovascular disease (Zheng et al., 2018). These complications are common, and it
has been estimated that microvascular complications affect half of all patients with type 2 diabetes,
while macrovascular complications affect about one-third of all patients (Litwak et al., 2013).
Accordingly, treatment of type 2 diabetes has been associated with a risk reduction > 10% of
developing microvascular and macrovascular complications (Henning, 2018). In particular,
cardiovascular disease and nephropathy are the major causes of mortality and disability among
patients with type 2 diabetes (Braunwald, 2019; Glovaci et al., 2019). Globally, CVDs affect 32.2%
10
of all patients with type 2 diabetes (Einarson et al., 2018), while diabetic nephropathy affects about
one-third of all patients with diabetes (Reutens & Atkins, 2011). Over time, diabetic nephropathy
can lead to renal failure and the need for dialysis or renal transplant (Reutens & Atkins, 2011).
Diabetic retinopathy can lead to moderate or severe vision loss and permanent visual impairment,
and in the USA, vision disability, including blindness, affected 11.7% of adult patients with
diabetes in 2018 (Centers for Disease Control and Prevention, 2020c). Finally, peripheral
neuropathy affects almost half of all patients with diabetes and it is associated with an increased
risk of foot ulcers, infections, and in severe cases lower-limb amputation (Hicks & Selvin, 2019).
As a result of these complications, diabetes is associated with high rates of disability and
reduced life expectancy worldwide. In 2017, type 2 diabetes was the 9th leading cause of mortality
(Khan et al., 2020). CVD is the major cause of mortality in patients with diabetes, accounting for
half of all deaths (Einarson et al., 2018). The impact of diabetes is not limited to its direct effect on
health but also the increased economic burden it entails. For example, in the US the cost burden of
diabetes in 2017 reached $327.2 and $31.7 billion for people with diagnosed and undiagnosed
diabetes, respectively (Dall et al., 2019), and people with diabetes have medical expenditures about
2.3 times higher than those without diabetes. There are additional indirect costs related to increased
absenteeism, reduced productivity, and inability to work because of disease-related disability
(American Diabetes Association, 2018).
1.2 Overweight and obesity
1.2.1 Definition and classification
Overweight and obesity are conditions characterized by excessive fat accumulation. The
most commonly used standardized measure to estimate body fat and categorize individuals as
overweight or obese is the Body Mass Index (BMI), which is calculated by dividing a person’s
weight in kilograms by the square of their height in meters (kg/m2). Among adults, overweight is
defined by a BMI between 25 and 29.9 kg/m2, while obesity is defined by a BMI ≥ 30 kg/m2.
11
Obesity is also further categorized as obesity class I (BMI between 30 and 34.9 kg/m2), class II
(BMI between 34.9 and 39.9 kg/m2), and class III (BMI ≥ 40 kg/m2) (World Health Organization,
2020b). While this classification applies to the Western world, the threshold for overweight and
obesity is lower in Asian and South Asian populations, where a BMI between 23 and 24.9 kg/m2
indicates overweight and a BMI ≥ 25 kg/m2 indicates obesity (Nishida et al., 2004). Despite being
criticized for not taking into consideration individual variations in body composition, adiposity
distribution, and lean body mass (Buss, 2014), BMI is considered clinically significant because a
BMI ≥ 25 kg/m2 has been associated with an increased risk of comorbidities such as diabetes,
hypertension, and coronary artery disease, and with overall increased morbidity and mortality
(Abdelaal et al., 2017).
Another common measure of body fat that has been associated with important clinical
outcomes is abdominal circumference. In particular, a waist circumference ≥ 102 cm in men and ≥
88 cm in women has been associated with greater health risks as well (Abdelaal et al., 2017).
Other more accurate measures of adiposity include the body adiposity index, waist-to-hip
ration, air displacement plethysmography, bioelectrical impedance weighing scale, magnetic
resonance imaging (MRI), intra-organ fat quantification (MRS), and dual-energy X-ray
absorptiometry (DEXA), but are all less commonly used due to increased cost and reduced access
(Borga et al., 2018).
1.2.2 Prevalence and epidemiology
Overweight and obesity are important clinical and public health challenges, representing a
current global epidemic and public health crisis (World Health Organization, 2020b). The global
prevalence of obesity has significantly increased from 1975 to 2014 from 3.2% to 10.8% among
men and 6.4% to 14.9% among women (Di Cesare et al., 2016). This trend is expected to increase,
and by 2025 the global prevalence of obesity is expected to reach 18% in men and higher than 21%
12
in women (Di Cesare et al., 2016). The combined prevalence of overweight and obesity is expected
to reach 57.8% by 2030 (Kelly et al., 2008).
Epidemiology data show the prevalence of obesity varies based on age, gender, education,
race/ethnicity, and income (Centers for Disease Control and Prevention, 2020c). In the US, for
example, the prevalence of obesity in 2017 and 2018 was the highest among middle-aged adults
between 40 and 59 years of age, non-Hispanic black people, and people with lower levels of
education. A different trend in education and obesity was observed among non-Hispanic black men
for whom the prevalence of obesity increased linearly with education. While there were no
differences between men and women in the prevalence of obesity, women had a higher prevalence
of severe obesity, defined as a BMI ≥ 40 kg/m2. Moreover, the prevalence of obesity was the
highest in the middle-income group among men, with the exception of non-Hispanic black men for
whom obesity prevalence was the highest in the high-income group. Among women, the prevalence
of obesity was the highest in both the middle and low-income groups, with the exception of non-
Hispanic black women, for whom the prevalence of obesity did not differ by income group (Centers
for Disease Control and Prevention, 2020c). Finally, in underdeveloped and low to middle income
countries, a higher socioeconomic status has been associated with a higher BMI, while the opposite
trend was observed in developed countries, where a lower socioeconomic status has been associated
with a higher BMI (S. Newton et al., 2017).
1.2.3 Risk factors
Overweight and obesity are the result of an imbalance between caloric intake and energy
expenditure, and a variety of biological, genetic, environmental, behavioral, and psychosocial
factors are involved in the development of overweight and obesity (World Health Organization,
2020b).
Biological factors related to overweight and obesity generally involve abnormalities that
affect the hormones responsible for the regulation of the hunger-satiety mechanism such as ghrelin
13
and leptin (Jehan et al., 2020). Ghrelin is a hormone that stimulates the hunger center of the brain
located in the hypothalamus, while leptin suppresses appetite by signaling the brain satiety centers
(Austin & Marks, 2009). A dysfunction in the action of these hormones, seen in conditions like
congenital leptin deficiency and acquired lesions of the hypothalamus, can lead to hyperphagia and
weight gain (Timper & Brüning, 2017).
Genetic factors can also be involved in the etiology of obesity (Thaker, 2017). Adoption and
twin studies have found significant correlations in weight between adopted individuals and their
biological parents as well as twin pairs, showing a heritability between 45% and 90% (Bouchard et
al., 1990; Silventoinen et al., 2010; Stunkard et al., 1986). Broadly speaking, the three main genetic
causes of obesity are: monogenic, in which a single gene mutation is involved; syndromic, in which
obesity is associated with a mutation in one or multiple genes along with other neurodevelopmental
or systemic developmental conditions; and polygenic, in which the effect of a variety of genes
interact with each other and environmental risk factors for obesity (Jehan et al., 2020; Thaker,
2017).
Other behavioral factors such as poor sleep (Ogilvie & Patel, 2017), smoking cessation
(Chao et al., 2019), excessive alcohol consumption (Traversy & Chaput, 2015), and the side effect
of some medications such as antipsychotics, antidepressants, lithium, anticonvulsants, insulin, and
glucocorticoids may also contribute to the development of overweight and obesity (Carver, 2006;
Shrivastava & Johnston, 2010).
With respect to psychosocial factors, various forms of psychological distress such as
depression, anxiety, and binge eating disorder have been associated with an increased risk of
obesity (Sarwer & Polonsky, 2016).
1.2.4 Consequences and complications
Obesity is associated with a greater risk for all-cause mortality (Abdelaal et al., 2017). There
is evidence that even among those with a BMI in the normal range, being overweight or obese in
14
the past may lead to a higher mortality rate compared to those who have always had a normal
weight, highlighting the importance of prevention (Xu, Cupples, Stokes, & Liu, 2018).
This increase in mortality may be linked to the various associated comorbidities. Both
overweight and obesity have been associated with a higher incidence of type 2 diabetes, various
cancers (i.e., breast, endometrial, ovarian, colorectal, and kidney cancer), CVD (i.e., hypertension,
stroke, and coronary artery disease), asthma, gallbladder disease, osteoarthritis, and chronic back
pain (Guh et al., 2009). The relationship between weight, CVD, and type 2 diabetes is particularly
important (WHO, 2016), and overweight and obesity account for 35% of all cases of ischemic heart
disease and 55% of all cases of hypertension (Frühbeck et al., 2013). Moreover, the prevalence of
type 2 diabetes increases linearly with BMI (Nguyen et al., 2011), and about 65-80% of diabetic
patients are overweight or obese (World Health Organization, 2020c). Other comorbidities include
kidney disease, non-alcoholic fatty liver disease, infertility, gastroesophageal reflux disease, and
sleep apnea (Abdelaal et al., 2017). Severe obesity can also impact physical functioning, such as the
ability to walk or climb stairs, therefore interfering with daily activities, and it has generally been
associated with a poor health-related quality of life (Abdelaal et al., 2017; Felix et al., 2020).
Finally, obesity has a great economic impact on both the individual and society overall. The
economic burden of obesity results from a combination of increased health care expenditure, lost
productivity, increased mortality, and disability (Tremmel et al., 2017). In the US, for example, the
global economic impact of obesity was estimated to account for 2.8% of the 2014 global gross
domestic product (Tremmel et al., 2017).
1.3 Management of type 2 diabetes and overweight/obesity
Due to the high prevalence of overweight and obesity among patients with type 2 diabetes, it
is difficult to discuss the management of type 2 diabetes without discussing weight management. In
fact, weight loss is considered the single most important goal in the management of diabetes
(American Diabetes Association, 2020e; Franz et al., 2015). Therefore, interventions in patients
15
with type 2 diabetes who are also overweight or obese focus on both glycemic control and a
reduction in weight that is sustained over time. Although the diagnosis of diabetes is made at a
hbA1c of 6.5%, the target for individuals with diabetes is usually 7%, because attempts at stricter
control often have deleterious side effect (American Diabetes Association, 2020d). Reaching a state
of glycemic control is associated with a reduction in diabetes-related complications (American
Diabetes Association, 2020d). About weight, it has been suggested that a modest weight loss of at
least 5% of the initial weight can improve health outcomes, including glucose levels, blood
pressure, and lipid profile, and to reduce the need of medication for glucose-lowering medications
(Brown, Buscemi, Milsom, Malcolm, & O’Neil, 2016; Wing et al., 2011). Other important targets
of treatment are the management of eventual macrovascular and microvascular complications to
reduce mortality, eventual impairments in the control of other physiological parameters like lipid
profile and blood pressure, albuminuria levels, inflammation markers, bone mineral density, and
reduction in other deleterious lifestyles like smoking and alcohol consumption (American Diabetes
Association, 2020b). In individuals that do not have a diagnosis of type 2 diabetes but are at risk for
this, like in pre-diabetes, the goal of the intervention is to prevent the progression of the disease, its
complications, and mortality (American Diabetes Association, 2020f). Modest and sustained weight
loss can delay the progression to type 2 diabetes in patients with pre-diabetes (American Diabetes
Association, 2020e).
Various options are commonly employed for the management of type 2 diabetes and
overweight/obesity, including lifestyle interventions, medications, and surgery. These managements
tools often overlap in purpose, since the management of diabetes and overweight/obesity will have
a benefit on the management of the other.
1.3.1 Lifestyle interventions
Lifestyle interventions are considered a first-line treatment for both type 2 diabetes and
obesity. These are usually comprehensive multicomponent interventions, including a combination
16
of diet, physical activity, and behavioral therapy, delivered by a multidisciplinary team of
dieticians, psychologists, physicians, and clinicians trained in exercise physiology, and can be
delivered in various settings: in person or online, in group or individual sessions. Taken together
these components are important both for weight and glycemic control (American Diabetes
Association, 2017b; Kushner, 2014).
The diet component, or nutrition therapy, in patients with type 2 diabetes usually promotes
the consumption of nutrient-dense, high-quality foods. In general, it is recommended to consume
foods that are high in fiber and low in glycemic load (a standardized measure of how much a given
food will raise an individual’s blood glucose following consumption), like whole grains, vegetables,
fruits, legumes, and some dairy products, to consume foods rich in omega-3 fatty acids, to avoid
sugar-sweetened beverages, to minimize foods with added sugar, to limit sodium intake, and to
consume a moderate amount of alcohol (American Diabetes Association, 2017b). Examples of
healthy dietary plans are the Mediterranean diet, the Dietary Approaches to Stop Hypertension
(DASH) diet, and plant-based diets (Papamichou et al., 2019). However, there is no one specific
plan that fits all patients, and therefore it is recommended that all patients receive individualized
medical nutrition therapy by a registered dietician (Evert et al., 2013). For those patients that also
need to lose weight, the diet is designed to promote an overall reduction in energy/calorie intake.
Common hypocaloric diet regimens for weight loss may include very low-energy diets that restrict
calorie intake to 800 kilocalories (kcal) a day and often include meal replacement products (e.g.,
energy bars, shakes), and low-energy diets that restrict calorie intake to 800-1,500 kcal a day and
likewise may include both regular food and meal replacement products (American Diabetes
Association, 2017b; Kushner, 2014).
Physical activity and exercise are recommended in patients with diabetes. General
recommendations for adults include engaging in at least 150 minutes of moderate or vigorous
physical activity a week, distributed between at least 3 days with no more than 2 consecutive days
without physical activity, combined with 2-3 sessions of resistance exercises on nonconsecutive
17
days, and reducing time spent in sedentary behaviors (American Diabetes Association, 2017b). For
weight loss, the main goal of physical activity is to increase energy expenditure while reducing
energy intake (Kushner, 2014).
Behavioral components are usually combined with diet and physical activity and commonly
include stimulus control, goal setting, problem solving, self-monitoring, and cognitive restructuring
to identify and modify negative thoughts and emotions that may interfere with weight management
(American Diabetes Association, 2017b; Wadden & Bray, 2019). It is recommended that all
patients with diabetes participate in Diabetes Self-Management Education and Support, a
comprehensive approach to diabetes education and management that aims to instill the necessary
knowledge and skills for diabetes self-management (American Diabetes Association, 2017b).
In patients with a diagnosis of type 2 diabetes, comprehensive lifestyle interventions that
combine these three components in a structured way can have beneficial effects on glycemic
control, lipid profile, glucose tolerance, and insulin resistance (Wing et al., 2010). Lifestyle
interventions that include a combination of energy restriction, regular physical activity, and
frequent contacts may achieve a weight loss of at least 5% (Franz et al., 2015; Wing, 2001). One
particularly significant example was a large multicenter RCT, the Look AHEAD (Action for Health
in Diabetes) trial, conducted in the USA, where 5145 overweight or obese patients with type 2
diabetes were randomized to either an intensive lifestyle intervention (i.e., a combination of diet,
physical activity, and behavioral strategies, with frequent meetings during a year), or to an
intervention of Diabetes Support and Education (i.e., 3 group sessions in a year). At post-
intervention, the intensive lifestyle program was associated with significantly greater weight loss,
improved cardiometabolic risk profiles, reduced medication need to control CVD factors, reduced
mortality rate, improved hbA1c, glycemic control, blood pressure, and lipid profile (Wing et al.,
2010).
While the evidence for the efficacy of each individual component of lifestyle interventions
in preventing type 2 diabetes is still limited (Hemmingsen et al., 2017), studies are in agreement
18
that comprehensive multicomponent lifestyle interventions can be effective in the prevention or
delay of type 2 diabetes in high-risk individuals, with results sustained for several years following
conclusion of the intervention (Schellenberg et al., 2013).
Despite these encouraging data, there is substantial variability in response to treatment. The
main challenge is related to the maintenance of results in the long-term (Curioni & Lourenço, 2005;
Katz, 2005). In fact, even patients that initially obtain a clinically significant weight loss often
relapse and regain weight, with a consequent worsening of glycemic control. For example, in the
Look AHEAD trial, percentage weight lost went from 8.6% at 1 year to 4.7% at 4 years after the
intensive lifestyle intervention and worsening in all other outcomes was observed over time.
Ultimately, at a median follow-up of 9.6 years the study was interrupted because the intervention
was not shown to reduce the incidence of CVD events (Wing et al., 2010). Thus, there is a
demonstrated need for comprehensive interventions that are effective in both the short and long-
term, for both weight loss and diabetes.
1.3.2 Medications
Pharmacotherapy in type 2 diabetes is generally indicated for individuals with type 2
diabetes presenting with a hbA1c > 7.5%, although patients between 7 and 7.5% may be trialed on
3-6 months of lifestyle changes in diet and physical activity if they are highly motivated to avoid
pharmacologic treatment (American Diabetes Association, 2020d; Davies et al., 2018).
The most common oral drug prescribed is metformin as it is effective in lowering hbA1c,
may result in modest weight loss, has minimal side effects including no risk of hypoglycemia, and
is widely available and low in cost. A variety of other oral diabetes medications are commonly
prescribed and may be necessary if metformin is contraindicated or is not sufficient to reach target
hbA1c. Examples include the GLP-1 receptor agonists, DPP-4 inhibitors, SGLT2 inhibitors,
sulfonylureas, meglitinides, and thiazolidinediones. These medications are often less desirable than
metformin as initial therapy due to increased cost as well as adverse effects such as weight gain
19
(sulfonylureas, meglitinides), hypoglycemia (sulfonylureas, meglitinides), and urinary tract
infections (SGLT2 inhibitors) (American Diabetes Association, 2020d; Davies et al., 2018).
If target hbA1c cannot be achieved with lifestyle modification and oral hypoglycemics
alone, insulin may be indicated. This often requires a complex regimen of both short and long-
acting insulin combined with frequent blood sugar monitoring through self-administered needle-
stick testing. Patients are subject to side effects from insulin of weight gain and hypoglycemia, and
access can be a challenge for patients in countries without robust public healthcare infrastructures
(American Diabetes Association, 2020a).
The use of medication for weight loss is usually considered in combination with lifestyle
modification and only in patients with a BMI ≥ 27 kg/m2 with weight-related comorbidities or a
BMI ≥ 30 kg/m2 without comorbidities, who failed to achieve clinically significant weight loss by
lifestyle modification alone. Weight loss medications currently prescribed include orlistat, which
interferes with lipid digestion, the combination sympathomimetic/anticonvulsant phentermine-
topiramate, the combination antidepressant/opioid antagonist bupropion-naltrexone, and the
individual sympathomimetics phentermine, benzphetamine, phendimetrazine, and diethylpropion.
Some drugs such as the oral diabetes medications metformin and liraglutide have minor effects on
weight loss but may be indicated for weight loss in patients who would otherwise benefit from
those medications to treat diabetes (Apovian et al., 2015).
Although the data is heterogeneous, short-term (6-12 months) clinical trials investigating the
efficacy of pharmacology for obesity have shown an association between orlistat, bupropion-
naltrexone, phentermine-topiramate, and liraglutide and achieving at least 5% weight loss at 52
weeks, with phentermine-topiramate and liraglutide showing the greatest efficacy (Khera et al.,
2016). A previously approved drug, the serotonergic medication lorcaserin, has been discontinued
in the USA due to an associated increased risk of developing cancer (Sharretts et al., 2020).
20
Nevertheless, the use of pharmacotherapy for weight loss is still controversial due to
unpleasant side effects and limited data on efficacy compounded by low adherence, small effect
sizes, and high rate of weight regain after discontinuation (Kushner, 2014).
1.3.3 Surgery
Weight loss surgery is usually suggested for patients who are not able to achieve weight loss
with lifestyle interventions and pharmacotherapy alone, with a BMI ≥ 40 kg/m2, a BMI between 35
and 39.9 kg/m2 with one or more serious comorbidities, including type 2 diabetes, or in some cases
a BMI between 30 and 34.9 kg/m2 with uncontrollable type 2 diabetes (Brito et al., 2017). As a
result, many overweight/obese individuals with type 2 diabetes may be indicated for such a
procedure.
There are various surgical procedures currently accepted, with the most common
procedures being sleeve gastrectomy and Roux-en-Y gastric bypass. They generally consist of
directly or indirectly reducing available stomach volume to limit food intake, thus acting as a form
of calorie restriction (Brito et al., 2017).
Weight loss surgery results in significantly greater weight loss, glycemic improvement,
reduction of cardiometabolic risk factors, and overall mortality reduction than both comprehensive
lifestyle interventions and medication (Courcoulas et al., 2014; Dixon, 2009; Halperin et al., 2014).
An average of 20% to 40% weight loss has been observed, and studies have shown that weight loss
surgery can reduce the incidence of new cases of type 2 diabetes, result in the resolution of some
cases of type 2 diabetes, and lead to significant improvements in type 2 diabetes, dyslipidemia, and
hypertension (Carlsson et al., 2012; Lautz et al., 2011). While most patients will regain some
weight over the long-term, treatment failure defined as weight regain to within 5% of baseline
weight has been observed at a rate of 3.4-30.5% within 4 years of operation depending on the
procedure, with Roux-en-Y being the most effective and adjustable gastric banding the least
(Maciejewski et al., 2016).
21
Major limitations to the implementation of these procedures include severe postoperative
complications, limited accessibility, and maintenance of results. Severe postoperative complications
can vary based on the specific surgical procedure utilized, but commonly include wound infections,
dumping syndrome, bacterial overgrowth, stomal stenosis, marginal ulceration, and gallstones
(Lautz et al., 2011). These procedures are therefore only indicated for patients that meet strict
criteria and are not indicated for all patients with overweight/obesity. Accessibility is another major
limiting factor in the adoption of weight loss surgery, as it is expensive and requires significant
financial resources which limits its applicability in resource-poor settings such as the developing
world (Wolfenden et al., 2019). Prescribing bariatric surgery therefore requires a thorough risk-
benefit analysis, and may not be suitable for many patients who are candidates for less invasive
weight-loss and glycemic control strategies (Kushner, 2014).
22
Chapter 2: PSYCHOSOCIAL VARIABLES IN TYPE 2 DIABETES
2.1 Psychological distress
Psychological distress is common among patients with type 2 diabetes and, whether
reaching the threshold for a clinical disorder or presenting subclinically, has been linked to a variety
of adverse health outcomes (American Diabetes Association, 2017a; Dennick et al., 2015; Khaledi
et al., 2019).
Living with a diagnosis of diabetes can be difficult because it often requires many changes
in lifestyle and self-care behaviors such as frequent medication use, dietary changes, increases in
physical activity, and monitoring blood glucose, all combined with the distress associated with the
disease and its complications (Dennick et al., 2017). Moreover, these changes can affect the social
life of patients who may have to manage difficult interpersonal situations, like finding a balance
between social expectations and medical requirements when eating with other people (Browne et
al., 2013; Dennick et al., 2017). Individuals with diabetes may also face social stigma related to
their condition, with commonly reported experiences including others blaming them for causing
their condition, negative stereotypes, discrimination, and restricted opportunities in life (Browne et
al., 2013).
When associated with overweight and obesity other factors come into play. For example, it
is common for people with excessive weight to be dissatisfied with their body image and experience
discrimination because of it, particularly in the case of severe obesity, and this can have a
significant impact on the individual’s self-esteem (Sarwer & Polonsky, 2016). Moreover, obesity is
often associated with significant physical and occupational dysfunction that can have a negative
impact on health-related quality of life (Sarwer & Polonsky, 2016).
All of this can have a major impact on mental health and predispose to the development of
various forms of psychological distress in those with type 2 diabetes such as diabetes-related
distress, depression, and anxiety (Feng & Astell-Burt, 2017).
23
2.1.1 Diabetes-related distress
The construct of diabetes-related distress was introduced by Polonsky et al. (1995) to
specifically address the emotional distress of living with diabetes and the burden of self-care.
Symptoms of diabetes-related distress can include feeling burned out or overwhelmed by the
demands of self-care, fear of diabetes complications, discouragement and lack of motivation, and
feelings of anger, guilt, frustration, denial, and loneliness (Kreider, 2017; Polonsky et al., 1995).
This array of emotions can result in poor self-care behaviors and lack of adherence to diabetes
regimens (Kreider, 2017; Polonsky et al., 1995). The most common scales to assess diabetes-related
distress are the Problem Areas in Diabetes (PAID) scale (Polonsky et al., 1995) and the Diabetes
Distress Scale (DDS) (Polonsky et al., 2005), encompassing areas related to treatment regimen,
diet, complications, interpersonal relationships, and relationships with health care professionals
(Dennick et al., 2017).
Diabetes-related distress must be distinguished from other psychological disorders like
depression, because even if the constructs of diabetes-related distress and depression are strongly
correlated and partially overlapping, diabetes-related distress encompasses experiences and
challenges that are uniquely related to patients with diabetes (Snoek et al., 2015). In a longitudinal
study on patients with type 1 and type 2 diabetes, only 4.5% of the sample screened positive for
both depression and diabetes-related distress, compared to 10% for depression and 13% for
diabetes-related distress considered alone. On the other hand the correlation between diabetes-
related distress and depression is evidenced by an apparent bi-directional association, with one
predicting the other after one year (Snoek et al., 2012). Similarly, in another prospective study,
improvements in depressive symptoms among patients with diabetes were independently predicted
by improvements in diabetes-related distress (Reimer et al., 2017).
The prevalence of diabetes-related distress varies across studies based on the definition
used. According to one systematic review and meta-analysis (Perrin et al., 2017), the prevalence of
diabetes-related distress as assessed by both the PAID (Polonsky et al., 1995) and DDS (Polonsky
24
et al., 2005) scales was 36% among patients with type 2 diabetes. The most common dimension of
diabetes-related distress is that related to emotional burden (Gahlan et al., 2018; Parsa et al., 2019),
followed by distress related to diabetes regimen, interpersonal relationships, and the relationship
with the physician (Gahlan et al., 2018).
A higher risk of developing diabetes-related distress among patients with type 2 diabetes has
been associated with a variety of factors in various studies. These included sociodemographic
characteristics (i.e., being female, lower income, and lower education), medical variables (i.e., past
and current depression, diabetes complications, use of insulin, shorter diabetes duration, excessive
weight, and poor control of glycemic levels, lipid profile, and blood pressure), lifestyle-related
factors (i.e., poor diet, and lack of physical activity), more stressful life events, and chronic stress
(Alvani et al., 2020; Azadbakht et al., 2020; Fisher et al., 2009; Gahlan et al., 2018; Parsa et al.,
2019; Perrin et al., 2017; Islam et al., 2017).
At the same time, the presence of diabetes-related distress can have a negative impact on
self-care behaviors and health outcomes. Accordingly, high levels of diabetes-related distress have
been associated with lower levels of self-efficacy and poorer adherence to medication, diet, and
physical activity regimens, which in turn compromise glycemic control and increase the risk of
microvascular complications and all-cause mortality (Aikens, 2012; Ascher-Svanum et al., 2015;
Darwish et al., 2018; Fisher et al., 2008; Fisher et al., 2007; Gahlan et al., 2018). In another
example, a study by Indelicato et al. (Indelicato et al., 2017) found that both diabetes-related
distress and low self-efficacy were associated with high levels of hbA1c. If not specifically
addressed, diabetes-related distress can also interfere with participation in and outcomes of
educational and self-management interventions (Fonda et al., 2009; Weinger & Jacobson, 2001).
2.1.2 Depression
Compared to the general population, the prevalence of depression is almost twice as high in
patients with type 2 diabetes (Anderson et al., 2001; Roy & Lloyd, 2012). Depression is a
25
heterogeneous condition characterized by the combination of a variety of symptoms (Goldberg,
2011). According to the DSM-5 (American Psychiatric Association, 2013), a diagnosis of major
depressive disorder is made when at least five symptoms are present for at least two weeks and are
associated with significant distress and/or impairment. These five symptoms must include either
depressed mood or anhedonia, in addition to any combination of appetite/weight changes, sleep
changes, lack of energy, psychomotor agitation or retardation, feelings of worthless or guilt,
difficulty concentrating, and suicidality. According to a recent systematic review and meta-analysis
of observational studies, almost one in four adults with type 2 diabetes have a comorbid depressive
disorder (Khaledi et al., 2019).
Depressive symptoms can also occur at a subsyndromal level in patients with type 2
diabetes (Darwish et al., 2018). Specifically, symptoms of depression that do not meet the criteria
for a fully diagnosed depressive disorder in terms of frequency, severity, and/or duration are usually
referred to as subthreshold depression (Juruena, 2012). Minor depression, for example, is a
condition that has been defined in the DSM-IV-TR (American Psychiatric Association, 2000) as
characterized by at least two, but less than five, depressive symptoms, of which one must be either
depressed mood or anhedonia, with no history of another depressive disorder. Subthreshold
depression is more common than major depression among patients with diabetes (Albertorio-Diaz
et al., 2017). In a prospective study among patients with type 2 diabetes, for example, almost half of
participants reported at least one episode of subthreshold depression within five years (Schmitz et
al., 2014).
A variety of factors have been associated with a greater risk of developing depression
among patients with type 2 diabetes. These factors are similar for major and minor depression and
include socio-demographic characteristics (i.e., being female, being unmarried, younger age, and
lower education), medical and psychological variables (i.e., poor glycemic control, obesity, physical
disability, family history of diabetes, diabetes complications and other medical comorbidities,
insulin therapy, history of major depression, diabetes-related distress, and lack of physician
26
support), and lifestyle-related variables (i.e., lack of physical activity and smoking) (Alzahrani et
al., 2019; Bahety et al., 2017; El Mahalli, 2015; Kamrul-Hasan et al., 2019; Katon et al., 2004;
Khan et al., 2019; Lloyd et al., 2018; Mathew et al., 2013). Duration of diabetes is another factor
that has been associated with the development of depression (Alzahrani et al., 2019; Bahety et al.,
2017; Kamrul-Hasan et al., 2019). Specifically, the risk of developing depression appears to be the
highest soon after a diagnosis of diabetes is made and then later in the course of the disease with the
development of complications (Darwish et al., 2018). Moreover, being overweight, having poor
physical functioning, and showing low levels of physical activity were significant predictors of
depression in a sample of elderly patients with diabetes (Chen et al., 2019).
Similarly to what has been observed for diabetes-related distress, depression can have a
negative impact on self-care behaviors and health outcomes. Specifically, patients with type 2
diabetes who are also depressed show lower self-efficacy and poorer self-care behaviors related to
diet, physical activity, adherence to medication, and smoking cessation. This can result in poor
glycemic control, poor lipid profile, higher blood pressure, microvascular complications,
macrovascular complications (i.e., coronary artery disease and stroke), poor health-related quality
of life, work absenteeism, and all-cause mortality (Brown et al., 2016; Gahlan et al., 2018; Katon,
2010; Mukherjee & Chaturvedi, 2019). When comorbid, depression can also worsen diabetes-
related distress, and both act in tandem to negatively affect glycemic control (Snoek et al., 2015).
Even if less severe than a frank depressive disorder, subthreshold depression has been associated
with impaired health-related quality of life and poor glycemic control (Lustman et al., 2000;
Schmitz et al., 2014). Its presence also increases the risk of developing a major depressive disorder,
diabetes-related complications, work and functional disability, and all-cause mortality (Coleman et
al., 2013; Lee et al., 2019; Lin et al., 2010).
27
2.1.3 Anxiety
Another form of psychological distress that is commonly experienced by patients with type
2 diabetes is anxiety. Symptoms of anxiety are usually experienced as feelings of worry and a state
of hyperarousal with respect to a future circumstance. These symptoms are often associated with
avoidance behaviors and somatic complaints (e.g., accelerated heartbeat, increased sweating,
gastrointestinal symptoms, headache, etc.) (Bickett & Tapp, 2016). In patients with diabetes,
common sources of anxiety may be related to not being able to control hyperglycemia, use of
insulin injections, and the health consequences of the disease (American Diabetes Association,
2017a). While temporary states of anxiety are considered normal, clinically significant and more
persistent anxiety can be debilitating. Similarly to depression, anxiety symptoms can be subclinical
when not meeting the threshold for a specific disorder. Compared with depression and diabetes-
related distress, anxiety disorders are less persistent and tend to be more episodic (Fisher et al.,
2008).
The prevalence of both anxiety symptoms and diagnosed disorders are higher among
patients with type 2 diabetes than in the general population (Fisher et al., 2008; Smith et al., 2013),
with the prevalence of anxiety symptoms that do not fulfil the criteria for an anxiety disorder
estimated to be between 15% and 73%, and that of anxiety disorders to be between 1.4% and 15.6%
(Smith et al., 2013). More specifically, in a large multinational study among patients with type 2
diabetes, the most common anxiety disorders were generalized anxiety disorder and panic disorder,
with a prevalence of 8.1% and 5.1%, respectively (Chaturvedi et al., 2019).
Risk factors that predispose to the development of anxiety in patients with diabetes include
being female, younger age, low socioeconomic status, longer duration of diabetes, poorer glycemic
control, diabetes complications, and chronic comorbidities (Chaturvedi et al., 2019; Collins et al.,
2009; Fisher et al., 2008; Grigsby et al., 2002; Hermanns et al., 2005).
Anxiety symptoms, whether clinical or subclinical, have a been associated with a number of
adverse outcomes in patients with diabetes. These include poor adherence to dietary modification,
28
physical activity, and smoking cessation, poor glycemic control, greater risk for diabetes-related
complications such as stroke, and poor quality of life (Anderson et al., 2002; Collins et al., 2009;
Dong et al., 2019; dos Santos et al., 2014; Tsai et al., 2016; Turkat, 1982). Moreover, anxiety can
predict fear of insulin injections and hypoglycemia, that in turn are associated with the avoidance of
important self-care behaviors like blood glucose monitoring and appropriate increase of insulin
dosing (Wild et al., 2007).
2.1.4 Other psychosocial variables
Although less studied, other psychosocial variables have been investigated with respect to
their prevalence and impact in diabetes, and have been shown to negatively affect self-management
and health outcomes.
Sleep problems are commonly experienced by patients with type 2 diabetes, with up to 50%
reporting poor sleep quality (Da Cunha et al., 2008). The presence of poor sleep quality, especially
if associated with anxiety, has shown to have a negative impact on glucose control and quality of
life (Dong et al., 2020; Zhu et al., 2018).
Somatization, interpersonal sensitivity, and anger-hostility were all significantly more
common among patients with type 2 diabetes than non-diabetic controls (Dogan et al., 2019).
Prospective and cross-sectional studies have shown that hostility is associated with poor glucose
control, insulin resistance, and greater systemic inflammation in response to acute stress, with an
increased risk of cardiovascular disease and mortality (Elovainio et al., 2011; Hackett et al., 2015;
Jonasson et al., 2019; Todaro et al., 2005).
Finally, the prevalence of dysfunctional eating behaviors among patients with diabetes is
highly variable across studies, ranging from less than 5% to 20% (Mannucci et al., 2002;
Papelbaum et al., 2005). Binge eating disorder is the most common eating disorder among patients
with type 2 diabetes and is often related to an increase in anxiety (Papelbaum et al., 2005).
29
Dysfunctional eating behaviors can also be associated with poor metabolic control (Mannucci et al.,
2002).
2.1.5 Psychological interventions for distress
In light of the high prevalence and negative health outcomes of psychological distress,
current guidelines recommend integrating standard diabetes care with regular psychological
assessment and treatment (American Diabetes Association, 2017a).
Numerous psychological interventions specifically designed to address psychological
distress in patients with diabetes have been developed and tested. Due to high heterogeneity across
studies, it is difficult to draw conclusions on the effect of a specific type of intervention. In fact,
except for a few meta-analyses that specifically focused on cognitive behavioral therapy and
mindfulness-based cognitive therapy (Tovote et al., 2014; Uchendu & Blake, 2017; Wang et al.,
2017), most meta-analyses do not differentiate between different types of psychological
interventions, including a variety of cognitive and emotion-focused interventions (e.g., social
support, stress management and coping skills training, motivational interviewing, etc.). Not only
were these interventions different with respect to the specific techniques utilized, but they also
differed in duration, intensity (e.g., number of sessions and frequency), setting (e.g., individual vs.
group), and method of delivery (e.g., in person vs. telehealth) (Mathiesen et al., 2019).
As to the effect of these interventions on measures of psychological distress, most meta-
analyses indicated that psychological interventions can have a significant effect on measures of
depression and/or anxiety (Baumeister et al., 2014; Markowitz et al., 2011; Mathiesen et al., 2019;
Tovote et al., 2014; Uchendu & Blake, 2017; van der Feltz-Cornelis et al., 2010; Wang et al., 2017).
Effects on diabetes-related distress have been mixed, with two meta-analyses showing significant
improvements (Mathiesen et al., 2019; Tovote et al., 2014), one showing mixed findings (Uchendu
& Blake, 2017), and another showing no effect (Chew et al., 2017). Mathiesen et al. (2019) found
that better results in diabetes-related distress were observed when psychosocial interventions
30
included motivational interviewing, were intense, and were performed in an individual rather than
group setting.
Since various forms of psychological distress have been shown to have a negative impact on
self-care behaviors and health, it has been hypothesized that interventions targeting a reduction in
psychological distress may result in better behavioral and health-related outcomes (Mathiesen et al.,
2019). Measures of glycemic control such as hbA1c have been the most commonly assessed
outcomes, but results have been mixed and inconclusive. For example, a significant but small and
temporary effect from psychological interventions was found on measures of glycemic control in
two meta-analyses (Chew et al., 2017; Uchendu & Blake, 2017), while no effect or mixed results
were reported in another four meta-analyses (Baumeister et al., 2014; Markowitz et al., 2011;
Mathiesen et al., 2019; Tovote et al., 2014). In Mathiesen et al. (2019), psychosocial interventions
that were more intensive were associated with greater improvements in hbA1c. Other studies found
no significant effect of psychological interventions in improving quality of life and all-cause
mortality (Chew et al., 2017; Mathiesen et al., 2019). Chew et al. (2017), in their meta-analysis,
found that psychological interventions for distress could significantly improve self-efficacy for up
to 12 months of follow-up. Data on the effect of psychological interventions on other health-related
outcomes like weight loss are still limited and preliminary. As previously mentioned, weight loss is
an important outcome for patients with diabetes who are also overweight or obese, and the presence
of psychological distress has been shown to interfere with intervention participation and benefits
(Fonda et al., 2009; Weinger & Jacobson, 2001). In a systematic review by Ismail et al. (2004), an
intervention of cognitive behavioral therapy was shown to be more effective than control (i.e., usual
care, education, wait list, and attention control) in improving psychological distress, but no effect
was seen on weight. Thus, there remains a need for interventions effective both in reducing
psychological distress and improving physiological outcomes in both diabetes and weight loss.
31
2.2 Psychological well-being
2.2.1 Definition
For a long time, Western medicine has been characterized by a reductionist approach that
considers health to be merely the absence of disease and defines it exclusively by physical
parameters (Tinetti et al., 2004). The WHO’s definition of health as a “state of complete physical,
mental, and social well-being, not merely the absence of disease or infirmity” (World Health
Organization, 1984) has had important implications for the development of many national health
care systems, bringing about a shift from focusing purely on the treatment and prevention of disease
to actively promoting elements of positive health (Leonardi, 2018).
In keeping with this trend, there has been a growing research interest in the concept of well-
being as not simply the absence of mental illness or the opposite of psychological distress, but as an
independent dimension (Ryff & Singer, 1998). Although well-being and distress are inversely
correlated (Rafanelli et al., 2000), the contribution of well-being to both mental and physical health
can be independent from that of distress (Ryff, 2014).
In psychology there are two main perspectives on well-being: hedonic and eudaimonic
(Huta & Waterman, 2014; Ryan & Deci, 2001). Within each of these perspectives, multiple models
of well-being have been developed. Hedonic well-being has been most commonly referred to as
subjective well-being (SWB) and described as happiness, pursuit of pleasure, and life satisfaction
(Diener et al., 1999), while eudaimonic well-being has been generally defined as fulfilling one’s
potential and having a sense of purpose and meaning in life (Ryff, 1989). Huta and Waterman
(2014) identified 11 models with comprehensive measures of eudaimonic well-being. Among these,
the Jahoda-Ryff model (Jahoda, 1958; Ryff, 1989) of psychological well-being (PWB) is the most
commonly used in research. According to this model, PWB is characterized by 6 distinct but
interrelated dimensions: 1) autonomy, 2) environmental mastery, 3) personal growth, 4) positive
relations with others, 5) purpose in life, and 6) self-acceptance. More recently, the concept of
euthymia has been proposed as an integrative construct that includes positive affect, the 6
32
dimensions of PWB, flexibility (i.e., balance and integration of psychic forces), consistency (i.e., a
unifying outlook on life which guides actions and feelings accordingly), and resilience and
tolerance to anxiety and frustration (i.e., resistance to stress) (Fava & Guidi, 2020). The concept of
euthymia has also been defined by Fava and Bech (2016) as: 1) not having a diagnosis of a mood
disorder and only experiencing negative emotions that are transitory, circumscribed, and with no
significant impact on everyday life; 2) feeling cheerful, calm, active, interested in things, and
having a restful sleep; and 3) showing flexibility, consistency, and resistance to stress.
The concept of “diabetic euthymia” or “euthymic diabetes” as a state of optimal mood has
been recently introduced as a target in diabetes care, suggesting that interventions for diabetes
should focus on promoting a sense of euthymia rather than solely on avoiding diabetes-related
distress (Kalra et al., 2018), in this sense being analogous to the pursuit of psychological well-being
in other disciplines.
2.2.2 Health-related consequences
Just as psychological distress has been shown to result in worse self-care behaviors and health
outcomes, various well-being constructs have been associated with better health outcomes in
different medical conditions (Ryff, 2014). More specifically, different measures of subjective and
psychological well-being have been shown to affect physical health on an immune, endocrine, and
cardiovascular level (Diener et al., 2017; Ryff, 2014), showing a protective role against
cardiovascular and metabolic conditions (Boehm & Kubzansky, 2012; Boylan & Ryff, 2015; Sin,
2016). Data from longitudinal studies have also indicated that higher levels of well-being are
associated with better life expectancy and lower risk to experience disability or chronic disease
(Kim et al., 2017; Paganini-Hill et al., 2018; Zaninotto & Steptoe, 2019). Among patients with
diabetes, higher levels of well-being have been associated with better glycemic control, greater
adherence to diet, exercise, blood glucose monitoring, and medication, and with a lower risk of
chronic complications and all-cause mortality (Al-Khawaldeh et al., 2012; Judith Tedlie Moskowitz

33
et al., 2008; Papanas et al., 2010; Yi et al., 2008). Moreover, among individuals from the general
population, well-being may reduce the risk of developing type 2 diabetes over up to 13 years of
follow-up (Boehm et al., 2015; Okely & Gale, 2016; Poole et al., 2020).
Health behaviors appear to mediate the relationship between well-being and health.
Specifically, higher levels of subjective and psychological well-being have been associated with
better diet, more exercise, and improved sleep (Diener et al., 2017; Ryff, 2014). In patients with
diabetes, for example, those with higher levels of self-efficacy and optimism have been shown to
have higher quality of life and more active coping behaviors that, in turn, have a significant effect
on hbA1c reduction (Rose et al., 2002).
Finally, well-being appears to have a buffering effect on the impact of psychological distress on
health behaviors (Steptoe et al., 2008; Tighe et al., 2016). For example, in patients with type 2
diabetes, Yi et al. (Yi et al., 2008) showed that resilience had a buffering effect on the worsening in
hbA1c and self-care behaviors in patients experiencing diabetes-related distress. Higher levels of
well-being may impact the way people interpret stressful situations and promote more efficient
coping strategies that, in turn, reduce the adverse health consequences of stressor exposure
(Pressman & Cohen, 2005).
2.2.3 Well-being interventions
Considering the positive effect that a variety of constructs of well-being have on distress,
self-efficacy, self-care behaviors, and health outcomes, the application of interventions that
specifically address and promote different aspects of well-being is warranted among patients with
type 2 diabetes (Massey et al., 2019). In addition, well-being interventions are broadly applicable to
patients that do not necessarily fulfill the criteria for a psychiatric disorder but show significant
symptoms of distress (Fredrickson, 2001).
Even if well-being interventions have been shown to improve both psychological and health
outcomes in medical conditions such as cardiovascular disease, hypertension, and HIV (Moskowitz
34
et al., 2017; Ogedegbe et al., 2012; Peterson et al., 2012), little attention has been paid to the effect
of well-being interventions in patients with diabetes. The first systematic review on the
psychological and physical health effects of well-being interventions in patients with diabetes has
been published recently by Massey et al. (2019). According to this review, most studies have
implemented a mindfulness-based intervention and shown a significant effect in improving levels of
depression and well-being. Other interventions have included positive psychology interventions,
acceptance and commitment therapy, resilience-based interventions, and interventions to promote
emotional intelligence, positive self-concept, and self-efficacy. Data on the effects of these
interventions in improving psychological distress and well-being have been reported in a small
number of studies showing mixed results (Massey et al., 2019). Data on the effect of well-being
interventions on health-related outcomes, such as hbA1c, glucose monitoring, medication
adherence, lipid profile, self-management, physical activity, and weight are still preliminary with
only a minority of studies reporting on this (Massey et al., 2019). Regarding weight, only three
studies implementing mindfulness-based interventions have considered it as an outcome, and only
one of these studies showed a significant reduction in weight over time after a mindful eating
intervention, but the effect was not significantly different from that of an intervention of diabetes
self-management reduction (Miller et al., 2012).
Developing and testing the application of well-being interventions among patients with chronic
medical conditions like diabetes is still a growing field and other options are being considered.
Among these, Well-Being Therapy (WBT) is an innovative short-term psychotherapeutic strategy
that, unlike many well-being interventions, is not aimed at maximizing positive emotions and
cognitions but rather at achieving a state of euthymia or balance among different areas of well-
being (Fava, 2016a). Initially developed to improve residual symptoms and increase levels of
recovery among patients with depression, early evidence is suggesting its application among
patients with chronic medical conditions (Benasi et al., 2019; Fava, 2016b).
35
Chapter 3: EXPERIMENTAL STUDY
3.1 Rationale
Overweight and obesity are major risk factors for the development of type 2 diabetes
(World Health Organization, 2020a, 2020c). The prevalence of type 2 diabetes increases linearly
with BMI (Nguyen et al., 2011) and about 65-80% of diabetic patients are overweight or obese
(World Health Organization, 2020a, 2020c), presenting a greater risk for mortality and serious
health complications (Wing, 2001). Given the significant increase in the past three decades in the
prevalence of both type 2 diabetes and obesity (Zimmet et al., 2014), it is of particular importance
to provide diabetic patients with effective weight loss interventions (World Health Organization,
2020a, 2020c). Therefore, behavioral lifestyle interventions for weight loss have a pivotal role in
diabetes management.
Several psychosocial factors have been found to have an impact on individual vulnerability,
course, and outcome of medical disease (Fava et al., 2017), and their presence can interfere with
behavioral change (Geiker et al., 2018). Specifically, psychological distress is common among
patients with type 2 diabetes (Dennick et al., 2015; Khaledi et al., 2019) and has been linked to poor
health behaviors and a variety of adverse clinical outcomes (Dirmaier et al., 2010; Dong et al.,
2020; Guerrero Fernández de Alba et al., 2020). On the other hand, various indicators of
psychological well-being have been associated with better health outcomes across numerous
medical conditions (Ryff, 2014).
Psychological interventions for the promotion of well-being have shown some promise in
reducing levels of distress and improving health-related outcomes. However, only a few studies are
available on this topic and the data are still preliminary (Massey et al., 2019), which speaks to the
need of investigating novel methods for improving well-being and other psychological parameters
to improve physiological health outcomes. Well-being therapy (WBT) (Fava, 2016a) is an
36
innovative short-term psychotherapeutic strategy aimed at achieving a state of euthymia or balance
within psychological dimensions of well-being according to the model originally developed by
Jahoda (1958). To date, WBT has been effective in enhancing recovery in depression and
generalized anxiety disorder, modulating mood in cyclothymic disorder, and promoting
mechanisms of resilience and psychological well-being in an educational setting with children and
adolescents. Preliminary data suggest its potential role in managing the challenges related to
chronic medical conditions and in promoting healthy attitudes and behaviors (Benasi et al., 2019;
Fava, 2016b), which suggests it may have promise when applied to weight loss in the context of
type 2 diabetes.
3.2 Aims and Objectives
The main aim of this study was to develop and evaluate a 4-month combined well-being and
lifestyle intervention for weight loss and distress reduction in patients with type 2 diabetes. In
particular, the study attempted to provide an answer to the following questions: is the
implementation of a novel combined well-being and lifestyle intervention feasible and acceptable to
patients; and can a well-being and lifestyle intervention better help patients with type 2 diabetes in
managing their weight and distress levels compared to a lifestyle intervention alone?
Specifically, the objectives of the present study were to:
1. Estimate study feasibility;
2. Investigate intervention acceptability;
3. Test the superiority of a combined well-being and lifestyle intervention (WBT-
lifestyle) in promoting changes in measures of weight, psychological well-being,
psychological distress (primary superiority outcomes), lifestyle, and physiological
parameters (secondary superiority outcomes), by comparing the outcomes of the
WBT-lifestyle group to those of a group receiving only the lifestyle intervention
37
(lifestyle alone), at immediate post-intervention and at 6-month post-intervention
follow-up;
4. Examine effect size estimates of key outcomes to provide essential data to inform a
larger superiority trial.
3.3. Hypotheses
We expected to observe significantly greater improvements in measures of weight,
psychological well-being and distress, lifestyle, and physiological parameters in the group of
participants receiving the combined WBT-lifestyle intervention than in those receiving the lifestyle
alone intervention at both post-intervention and 6-month follow-up.
3.4 Methods
3.4.1 Research design and procedures
This study is a multicenter, parallel-arm, assessor-blinded, randomized controlled trial.
Participants were recruited from March 2018 to June 2019 at two outpatient endocrinology clinics
in northern Italy, the Servizio di Endocrinologia e Diabetologia of Bufalini Hospital in Cesena and
the Struttura Semplice di Endocrinologia e Metabolismo of Oglio Po Hospital in Casalmaggiore, a
town in the Province of Cremona. Both clinics deal with the diagnosis and treatment of adult
patients with endocrine and metabolic disorders, including type 2 diabetes.
Physicians and nurses at both sites were given a brief checklist of main eligibility criteria
and were asked to screen consecutive patients attending the clinic during the enrollment period.
Patients who appeared to be eligible were introduced to the study and referred to one of the study
researchers for a more in-depth screening evaluation. Eligibility was determined based on medical
chart review and patients’ self-reported information using an ad hoc checklist. The Structured
38
Clinical Interview for DSM-5, Clinical Version (SCID-5-CV) (First et al., 2016) was used to assess
for the presence of psychiatric diagnoses.
Eligible participants who consented to participate in the study were randomly assigned to
either the combined WBT-lifestyle intervention or the lifestyle alone intervention with an allocation
ratio of 1:1. The possibility of being randomized to one of two different interventions was made
clear to participants during the consent process. The randomization schedule was generated with the
Random Allocation Software 2.0, a free software program designed to support simple and block
randomization in parallel group trials. Block randomization with random block sizes was used to
ensure a balance in sample size across groups while maintaining the unpredictability of the
randomization process.
The trial received approval from the Ethics Committee of each clinic, the Comitato Etico
della Romagna and the Comitato Etico Val Padana. The study was registered on ClinicalTrials.gov
(NCT03609463). All study participants provided written informed consent.
3.4.2 Participants
Participants were considered to be eligible and included in the study if they a) were
overweight (BMI ≥ 25) or obese (BMI ≥ 30), b) adult (18-65 years old), and c) had a diagnosis of
type 2 diabetes.
Reasons for exclusion were:
a) Inability to speak Italian fluently;
b) Inability to provide informed consent (e.g., cognitive impairment);
c) Any medical condition that would make participation in the study difficult or unsafe, or
that is associated with unintentional weight loss or gain (i.e., any cancer, congestive
heart failure, untreated or unstable hyperthyroidism, kidney failure on dialysis, and
severe orthopedic disorders);
d) Untreated, severe, or recently diagnosed (≤ 6 months) mental illness or personality
39
disorder;
e) History of eating disorders or substance abuse;
f) Use of appetite suppressants (e.g., sibutramine), lipase inhibitors (e.g., orlistat), or
dietetic products (e.g., meal replacements, herbs);
g) Involvement in another weight-loss program, trial, or in any other behavioral
intervention;
h) History of weight loss surgery or weight loss surgery scheduled within the year;
i) Pregnancy or intention to become pregnant within the next year;
j) Inability to control meal contents (e.g., institutionalized patients).
3.4.3 Interventions
Participants were involved in the study intervention for up to 16 weeks, for a total of 16
weekly sessions in the combined WBT-lifestyle group and 12 weekly sessions in the lifestyle alone
group. Missed sessions were rescheduled until participants completed all sessions of the
intervention. During the first four weeks, participants in the combined WBT-lifestyle group
received the well-being intervention in combination with treatment as usual, while those in the
lifestyle alone group were asked to continue their treatment as usual alone. In the following 12
weeks, participants in both the combined WBT-lifestyle and the lifestyle alone groups received the
lifestyle intervention in combination with treatment as usual.
The same clinical psychologist provided the intervention in both groups in one-to-one
sessions with each participant. Two psychotherapists with expertise in WBT (Fava, 2016a) offered
supervision for the implementation of the well-being intervention during the entire duration of the
study.
40
3.4.3.1 Well-being intervention protocol
The well-being intervention was delivered in four individua weekly sessions. Each session
lasted for about an hour and was conducted in-person. All sessions were done in a private room at
each clinic.
The intervention has been adapted from the WBT protocol (Fava, 2016a) and it is based on a
multidimensional model of psychological well-being that was originally developed by Jahoda
(1958) and further elaborated by Ryff (2014). According to this model, positive mental health is
characterized by distinct dimensions of psychological well-being, including autonomy,
environmental mastery, positive relations with others, purpose in life, personal growth, and self-
acceptance.
The objective of this intervention was to promote a state of euthymia (Fava & Bech, 2016;
Fava & Guidi, 2020), which corresponds to Jahoda’s sixth criteria “individual’s balance and
integration of psychic forces” (Jahoda, 1958), in order to reduce psychological distress and motivate
health attitudes and behaviors. Main features of the intervention included monitoring of
circumstances of well-being, modification of thoughts and beliefs leading to premature interruption
of well-being, discussion of dysfunctional dimensions of well-being, and behavioral homework to
increase exposure to experiences of well-being.
During the first session, participants were introduced to the structure and focus of the
intervention. Well-being was described as including both experiences and feelings, but no formal
definition of well-being was provided at this stage. The relationship between thoughts, emotions,
and behaviors was explained, with particular reference to the negative impact that dysfunctional
thoughts and behaviors can have on the ability to experience daily instances of well-being.
Participants were provided with a structured paper diary and asked to report the circumstances
surrounding their episodes of well-being, rating them on a scale from 0 (i.e., absence of well-being)
to 100 (i.e., the most intense well-being that could be experienced). They were also instructed to
report in the same diary thoughts and behaviors associated with any premature interruption of well-
41
being they experienced. The concept of self-therapy was then introduced, to emphasize the active
role that participants have in promoting their own well-being. At the beginning of each of the
following sessions, the diary was reviewed and difficulties related to its completion were discussed.
During the second session, participants were introduced to the concept of optimal experience
(Csikszentmihalyi & Csikszentmihalyi, 1988) and were asked to report these experiences in the
diary along with other occurrences of well-being. The concepts of automatic thoughts and
dysfunctional behaviors (e.g., avoidance behaviors) were also introduced through examples
available in the diary, and common thinking errors (e.g., all-or-nothing thinking, jumping to
conclusions, ignoring the evidence, magnifying or minimizing, overgeneralizing, and personalizing)
were described. Starting from this session, participants were guided into examining the evidence for
and against their automatic thoughts and were asked to develop alternative ways of thinking and to
report them in the observer’s column of the diary (see Table 1 for an example of the well-being
diary). Moreover, activities that were likely to elicit well-being and optimal experiences or
overcome challenging or feared situations started being encouraged and scheduled.
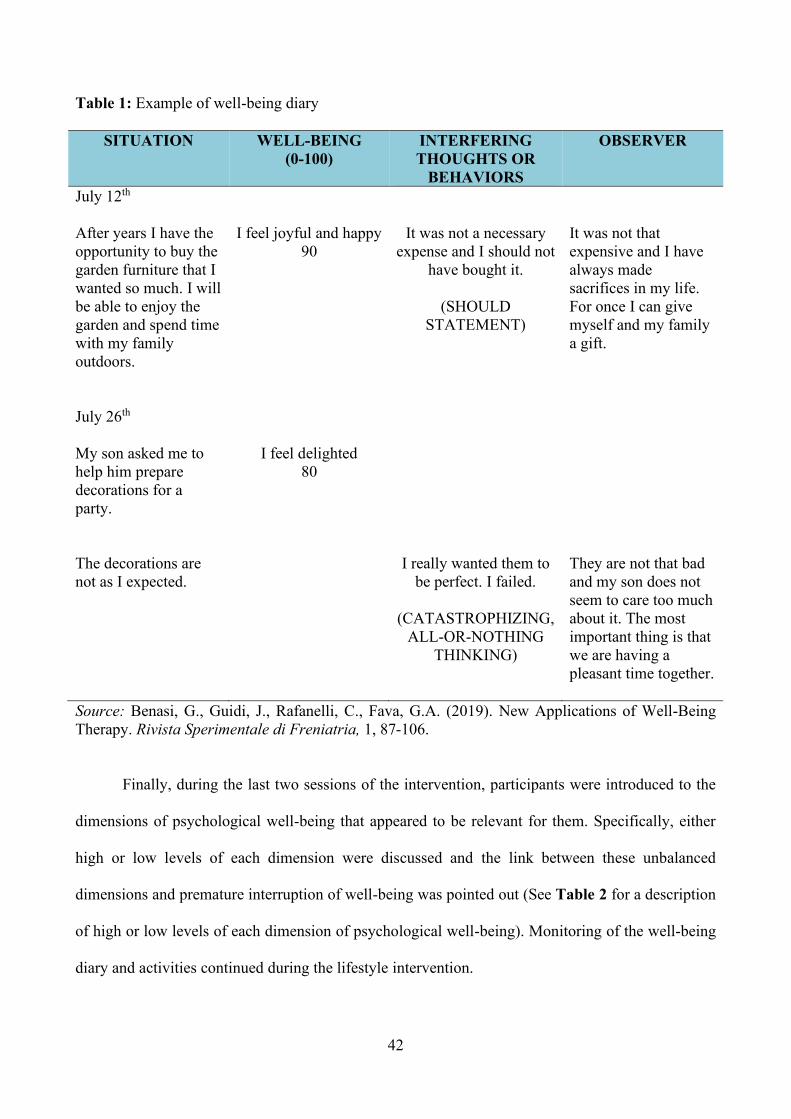
42
Table 1: Example of well-being diary
SITUATION WELL-BEING (0-100)
INTERFERING THOUGHTS OR
BEHAVIORS
OBSERVER
July 12th After years I have the opportunity to buy the garden furniture that I wanted so much. I will be able to enjoy the garden and spend time with my family outdoors.
I feel joyful and happy 90
It was not a necessary expense and I should not
have bought it.
(SHOULD STATEMENT)
It was not that expensive and I have always made sacrifices in my life. For once I can give myself and my family a gift.
July 26th My son asked me to help him prepare decorations for a party. The decorations are not as I expected.
I feel delighted 80
I really wanted them to
be perfect. I failed.
(CATASTROPHIZING, ALL-OR-NOTHING
THINKING)
They are not that bad and my son does not seem to care too much about it. The most important thing is that we are having a pleasant time together.
Source: Benasi, G., Guidi, J., Rafanelli, C., Fava, G.A. (2019). New Applications of Well-Being Therapy. Rivista Sperimentale di Freniatria, 1, 87-106.
Finally, during the last two sessions of the intervention, participants were introduced to the
dimensions of psychological well-being that appeared to be relevant for them. Specifically, either
high or low levels of each dimension were discussed and the link between these unbalanced
dimensions and premature interruption of well-being was pointed out (See Table 2 for a description
of high or low levels of each dimension of psychological well-being). Monitoring of the well-being
diary and activities continued during the lifestyle intervention.

43
Even if the general structure of the well-being intervention was the same for all participants
in the combined WBT-lifestyle group, its specific components, such as which dimensions of
psychological well-being were discussed, which activities were scheduled, and which examples of
automatic thoughts and dysfunctional behaviors were provided, were all tailored and personalized
based on the material presented by each participant during the sessions.
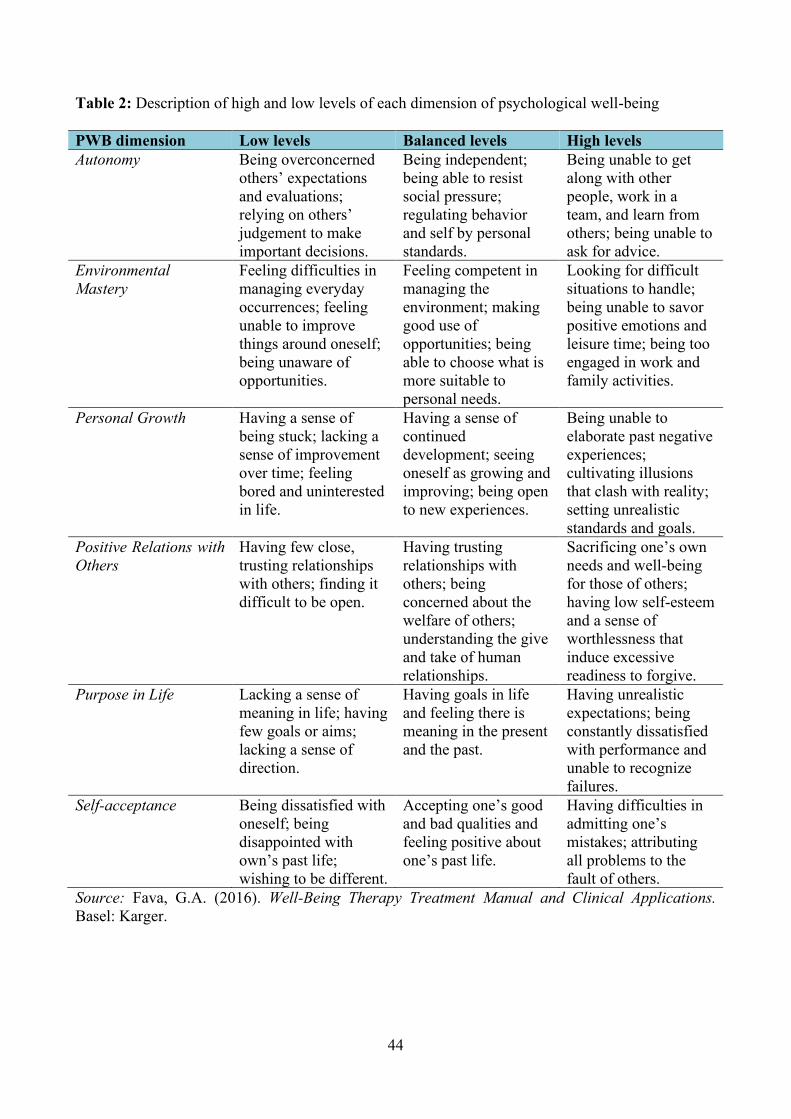
44
Table 2: Description of high and low levels of each dimension of psychological well-being
PWB dimension Low levels Balanced levels High levels Autonomy Being overconcerned
others’ expectations and evaluations; relying on others’ judgement to make important decisions.
Being independent; being able to resist social pressure; regulating behavior and self by personal standards.
Being unable to get along with other people, work in a team, and learn from others; being unable to ask for advice.
Environmental Mastery
Feeling difficulties in managing everyday occurrences; feeling unable to improve things around oneself; being unaware of opportunities.
Feeling competent in managing the environment; making good use of opportunities; being able to choose what is more suitable to personal needs.
Looking for difficult situations to handle; being unable to savor positive emotions and leisure time; being too engaged in work and family activities.
Personal Growth Having a sense of being stuck; lacking a sense of improvement over time; feeling bored and uninterested in life.
Having a sense of continued development; seeing oneself as growing and improving; being open to new experiences.
Being unable to elaborate past negative experiences; cultivating illusions that clash with reality; setting unrealistic standards and goals.
Positive Relations with Others
Having few close, trusting relationships with others; finding it difficult to be open.
Having trusting relationships with others; being concerned about the welfare of others; understanding the give and take of human relationships.
Sacrificing one’s own needs and well-being for those of others; having low self-esteem and a sense of worthlessness that induce excessive readiness to forgive.
Purpose in Life Lacking a sense of meaning in life; having few goals or aims; lacking a sense of direction.
Having goals in life and feeling there is meaning in the present and the past.
Having unrealistic expectations; being constantly dissatisfied with performance and unable to recognize failures.
Self-acceptance Being dissatisfied with oneself; being disappointed with own’s past life; wishing to be different.
Accepting one’s good and bad qualities and feeling positive about one’s past life.
Having difficulties in admitting one’s mistakes; attributing all problems to the fault of others.
Source: Fava, G.A. (2016). Well-Being Therapy Treatment Manual and Clinical Applications. Basel: Karger.
45
3.4.3.2 Lifestyle intervention protocol
The lifestyle intervention was delivered in 12 individual weekly sessions. Four sessions
(number 1, 4, 8, and 12) were conducted in-person and lasted for about an hour, while the
remaining sessions were conducted over the phone and lasted for about 30 minutes. All in-person
sessions took place in a private room at each clinic.
The intervention was modeled after the Small Changes and Lasting Effects (SCALE) trial
intervention protocol (Phillips-Caesar et al., 2015; Phillips et al., 2017). It was developed in the
context of the small change approach (Hill, 2009; Hills et al., 2013) and the Social Cognitive
Theory (Bandura, 1977). Specifically, it is based on the assumption that, in most people, gradual
weight gain is due to an “energy gap”, a daily discrepancy between energy intake and energy
expenditure, and that a gradual weight loss may be achieved by implementing small, sustained
lifestyle changes that reduce energy intake by about 100-200 kcal a day. Moreover, small changes
in diet and physical activity, being more feasible to achieve and maintain, may increase feelings of
self-efficacy and stimulate additional changes.
The objective of the lifestyle intervention was therefore to help participants gradually lose
weight by making small changes in their lifestyle. The intervention comprised three key
components: monitoring of lifestyle changes and weight, goal setting, and problem solving.
During the first session, participants were introduced to the small change concept and were
guided in setting their eating and physical activity goals. Participants were presented with a list of
ten small change eating strategies (Table 3). For the present study the eating strategy “drink plain
water instead of sweetened drinks” was modified to “drink plain water instead of sweetened and/or
alcoholic drinks”. After a full discussion of each strategy’s utility and feasibility, participants were
asked to select a strategy they felt they could accomplish for the following week. The selected
strategy was defined in terms of “what”, “when”, and “for how long”; for example, a participant
could decide to “use a smaller plate for lunch, 6 days a week”. There were no pre-defined small
change strategies for physical activity. Participants were asked to provide information about their
46
current level of physical activity and set a goal that represented an increase in time or intensity. The
physical activity strategy was defined in terms of “what”, “when”, and “for how long”; for example,
a participant could decide to “walk for 30 minutes, in the evening, 4 days a week”. Both the eating
and physical activity strategies needed to represent a change in current habits and be realistic and
feasible. Finally, participants were instructed to monitor their weight once a week for the entire
duration of the intervention.
Table 3: List of the ten small change eating strategies
Small Change
Eating Strategies
Use a smaller plate for your main meal
Half of your main meal should be vegetables
Keep snacks out of sight
Don’t buy snack food
Eat a fruit or vegetable before salty or sugary snacks
Turn off the TV during meals
Eat breakfast every day
Take time for your meals (don’t skip a meal)
Drink plain water instead of sweetened drinks
Prepare the main meal at home
Source: Phillips-Caesar et al. (2015). Small Changes and Lasting Effects (SCALE) Trial: the formation of a weight loss behavioral intervention using EVOLVE. Contemporary Clinical Trials, 41, 118-128.
During the following weekly sessions, participants’ adherence to their small change
strategies was reviewed and facilitators and barriers to goal completion were discussed in order to
increase participants’ motivation and problem-solving skills. At each session, eating and physical
activity strategies could be revised, changed, or another goal could be added based on levels of
adherence to the selected strategies. Participants were encouraged to select one strategy at a time,
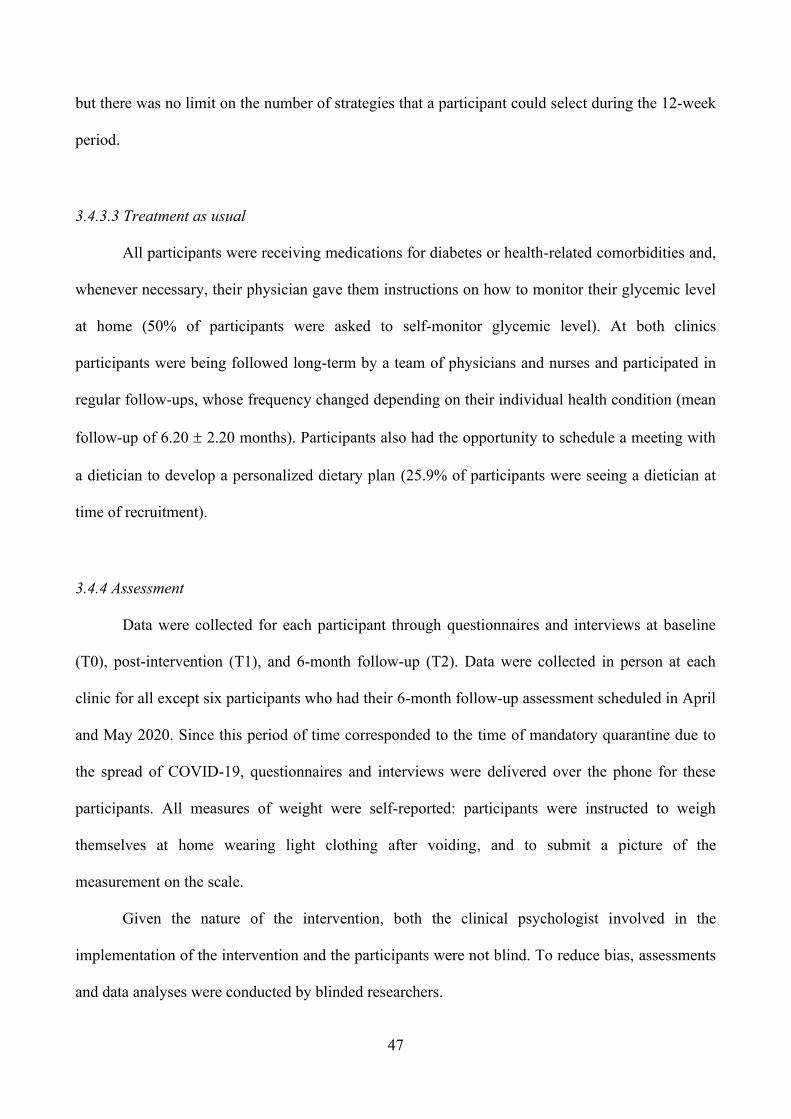
47
but there was no limit on the number of strategies that a participant could select during the 12-week
period.
3.4.3.3 Treatment as usual
All participants were receiving medications for diabetes or health-related comorbidities and,
whenever necessary, their physician gave them instructions on how to monitor their glycemic level
at home (50% of participants were asked to self-monitor glycemic level). At both clinics
participants were being followed long-term by a team of physicians and nurses and participated in
regular follow-ups, whose frequency changed depending on their individual health condition (mean
follow-up of 6.20 2.20 months). Participants also had the opportunity to schedule a meeting with
a dietician to develop a personalized dietary plan (25.9% of participants were seeing a dietician at
time of recruitment).
3.4.4 Assessment
Data were collected for each participant through questionnaires and interviews at baseline
(T0), post-intervention (T1), and 6-month follow-up (T2). Data were collected in person at each
clinic for all except six participants who had their 6-month follow-up assessment scheduled in April
and May 2020. Since this period of time corresponded to the time of mandatory quarantine due to
the spread of COVID-19, questionnaires and interviews were delivered over the phone for these
participants. All measures of weight were self-reported: participants were instructed to weigh
themselves at home wearing light clothing after voiding, and to submit a picture of the
measurement on the scale.
Given the nature of the intervention, both the clinical psychologist involved in the
implementation of the intervention and the participants were not blind. To reduce bias, assessments
and data analyses were conducted by blinded researchers.
48
3.4.4.1 Baseline assessment
An ad-hoc questionnaire was used at baseline to collect data on socio-demographic, medical, and
weight history variables. Data were obtained from chart reviews and participants’ self-reports:
• Socio-demographic variables included: gender, age, education, marital status, living
situation, children, and work.
• Medical variables included: past and present medical/psychiatric disorders, years with
diabetes, past hospitalizations and surgeries, past psychological/psychiatric interventions,
presence of cardiovascular risk factors (i.e., hypercholesterolemia, hypertension, smoking,
and lack of physical activity), family history of medical disorders, and information related to
diabetes management.
• Finally, weight history variables included: years overweight/obese and previous and current
attempts to lose weight.
The Semi-Structured Interview for the Diagnostic Criteria for Psychosomatic Research – Revised
version (DCPR-R SSI) (Fava et al., 2017) was also used at baseline. This semi-structured interview
(SSI) is based on the revised Diagnostic Criteria for Psychosomatic Research (DCPR-R) (Fava et
al., 2017). The DCPR-R allow the identification of psychopathological conditions often neglected
by traditional nosography. These criteria have been developed with the intent to operationalize the
spectrum of manifestations of illness behavior and sub-threshold distress in both psychiatric and
medical settings, and can be used in addition to the DSM criteria (Cosci & Fava, 2016). For
example, using the DCPR-R in addition to the DSM-IV has shown to provide a better assessment of
the psychological profile of patients in a variety of medical settings (Galeazzi et al., 2004).
Specifically, the DCPR-R allow the identification of 14 psychosomatic syndromes that are
subdivided in four major clusters:
• Stress, including allostatic overload.
• Personality, including type A behavior and alexithymia.
49
• Illness behavior, including health anxiety, disease phobia, hypochondriasis, thanatophobia,
illness denial, persistent somatization, conversion symptoms, and anniversary reaction.
• Psychological manifestations, including demoralization, irritable mood, and functional
somatic symptoms secondary to a psychiatric disorder. Helplessness and hopelessness are
further differentiated within demoralization.
The DCPR-R SSI is organized in a modular structure, with questions referring to the past 6 to
12 months and answers being recorded in a yes/no response format. The interview has been shown
to have a good inter-rater reliability, construct validity, and predictor validity for psychological
functioning and treatment outcomes (Galeazzi et al., 2004).
In this study, an Italian version of the DCPR-R SSI was used (Fava et al., 2017) to evaluate all
14 syndromes and offer a better characterization of the study sample.
3.4.4.2 Feasibility and Acceptability
The study feasibility and acceptability were assessed as:
• Eligibility rate (i.e., total number of patients eligible out of the total number of patients
approached);
• Acceptance rate (i.e., total number of participants enrolled out of the total number of eligible
patients);
• Retention rate (i.e., total number of participants who completed the study out of the total
number enrolled);
• Total number of sessions rescheduled;
• Participants’ satisfaction and suggestions for improvement, assessed at the end of the
intervention by asking the following open-ended questions:
▪ “Which component of the study did you find to be the most useful?”
▪ “Which component of the study did you find to be the least useful?”
50
▪ “Which changes have you made in your lifestyle since the beginning of the
study?”
▪ “Do you have any suggestions on how to improve the study?”
3.4.4.3 Primary Superiority Outcomes
Primary efficacy outcomes included measures of weight, psychological distress, and psychological
well-being:
• Symptom Questionnaire (SQ) (Benasi et al., 2020; Kellner, 1987)
The SQ is a 92-item self-rating questionnaire for the assessment of psychological symptoms
and well-being. The questionnaire is available in two forms: the week form is concerned
with feelings experienced by the respondent during the past week, while the day form with
feelings experienced on the day of the test. The questionnaire yields four main scales:
depression, anxiety, hostility, and somatization. Each scale can be divided into 2 subscales,
one concerned with symptoms (i.e., depression, anxiety, hostility, and somatization) and one
with well-being (i.e., relaxation, contentment, friendliness, and physical well-being).
Answers to each item are dichotomous (yes/no or true/false). Each scale and subscale can be
scored separately, with scoring ranging from 0 to 17 for the symptom subscales, from 0 to 6
for the well-being subscales, and from 0 to 23 for the four main scales. The sum of the four
main scales can also yield a total distress score. Higher scores in the main scales and
symptoms subscales indicate higher levels of distress, whereas higher scores in the well-
being subscales indicate higher levels of well-being.
The SQ has been validated in several languages, including Italian, and used in
numerous studies among various age populations, and has shown to be a highly sensitive
clinimetric index (Benasi et al., 2020). The questionnaire has also been found to have a good
predictive and concurrent validity (Benasi et al., 2020).
51
For the purpose of the present study, the Italian version of the SQ (Fava et al., 1983)
in its week form was used and the four main scales for anxiety, depression, hostility, and
somatization were analyzed.
• Psychosocial Index (PSI) (Piolanti et al., 2016; Sonino & Fava, 1998)
The PSI is a 55-item self-report questionnaire that was originally developed as an instrument
for the assessment of stress and other psychological dimensions in clinical practice, but can
also be used in research settings, and covers the following clinical domains:
▪ Stress: 17 items assessing both perceived and objective stress, life events, and
chronic stress, with a total score ranging from 0 to 17, where higher scores indicate
greater stress;
▪ Well-being: 6 items assessing different aspects of well-being, including positive
relations with others, environmental mastery, and autonomy, with a total score
ranging from 0 to 6, where higher scores indicate greater well-being;
▪ Psychological distress: 15 items assessing sleep disturbances, somatization, anxiety,
depression, and irritability with a total score ranging from 0 to 45, where higher
scores indicate greater distress. The 4 items about sleep disturbances can be scored
separately, with a total score ranging from 0 to 12, where higher scores indicate
greater sleep disturbances;
▪ Abnormal illness behavior: 3 items for the assessment of hypochondriacal beliefs
and bodily preoccupations with a total score ranging from 0 to 9, where higher
scores indicate greater hypochondriacal beliefs and bodily preoccupations;
▪ Quality of life: 1 item for the assessment of quality of life, with a score ranging from
0 to 4, where higher scores indicate greater quality of life. The quality of life and
well-being scores can be summed to obtain a global well-being score.
Respondents are asked to answer each item using either a dichotomous (yes/no) or
Likert scale. The questionnaire also includes 12 items for the collection of
52
sociodemographic and clinical data. The PSI has been used in various studies and has been
shown to be a valid and sensitive tool to discriminate between various degrees of
psychosocial impairment among different clinical populations (Piolanti et al., 2016).
For the purpose of the present study, the Italian version of the PSI was used (Sonino &
Fava, 1998), and the domains related to stress, psychological distress, and global well-being
were analyzed.
• Psychological Well-Being Scale (PWBs) (Ryff, 1989)
The PWBs is a 42-item self-rating questionnaire for the assessment of psychological well-
being according to the multidimensional model developed by Jahoda (Jahoda, 1958).
Specifically, the scale is composed of six scales corresponding to the six dimensions of
psychological well-being: autonomy, environmental mastery, personal growth, purpose in
life, self-acceptance, and positive relations with other.
Respondents are asked to rate the extent to which they agree with each item on a 6-
point Likert scale (from 1 = strongly disagree to 6 = strongly agree). Each scale can be rated
separately, with scores ranging from 7 to 42 and higher scores indicating higher levels of
psychological well-being in that specific dimension. The scale has shown good internal
consistency (Cronbach's alpha coefficient = 0.81) (Sharma & Sharma, 2018) and test-retest
reliability (Ryff, 1989).
For the purpose of this study, the Italian version of the PWBs (Ruini et al., 2003) was
used, and changes in all six dimensions of well-being were analyzed.
• Body Weight and Body Mass Index (BMI)
Body weight was measured in kilograms on a standard balance beam scale at each clinic or
on a standard digital scale at participants’ home, as described above. BMI was calculated by
dividing the body weight by the square of the body height and expressed in kg/m2.
53
3.4.4.4 Secondary Superiority Outcomes
• GOSPEL Study Questionnaire (Giannuzzi et al., 2005, 2008)
The GOSPEL questionnaire is a 32-item self-rating scale for the assessment of lifestyle in
the past month. Specifically, the questionnaire can be used for the assessment of the
following scales:
▪ Mediterranean diet: 10 items evaluate the frequency of consumption of specific
categories of foods and beverages (i.e., fruit, cooked and raw vegetables, fish, oil,
butter, cheese, wine, and coffee). Each item is scored on a 4-point Likert scale and
can be summed to obtain a Mediterranean diet score, ranging from 0 to 30, with
higher scores indicating a better diet;
▪ Dietary behavior: 3 items evaluate the frequency of behaviors during meals (i.e., eat
regularly, slowly, and in a relaxed way). Each item is scored on a 4-point Likert
scale and can be summed to obtain an eating habit score, ranging from 0 to 9, with
higher scores indicating better eating habits. Mediterranean diet and behavioral
aspects related to food consumption scores can also be summed to give a total diet
score;
▪ Physical activity: 5 items evaluate the frequency of specific types of physical activity
(i.e., climbing stairs, doing manual work, walking, biking, free body exercise) on a
4-point Likert scale, 2 items evaluate playing sports (yes/no) and time dedicated to it
( 2 h or < 2 hours per week), and 1 item evaluates the overall self-perceived level of
physical activity on a 4-point Likert scale. Scores on each item can be summed to
obtain a total physical activity score, ranging from 0 to 20, with higher scores
indicating higher levels of physical activity;
▪ Stress: 7 items evaluate workload and frequency of a variety of self/stress
management behaviors. Each item is scored on a 4-point Likert scale and can be
54
summed to obtain a self/stress management scale, with higher scores indicating
inadequate self/stress management;
▪ Family risk behaviors: 4 items that evaluate the presence of risk behaviors (i.e.
smoking, unhealthy diet, sedentariness, and high stress) among family members on a
dichotomous scale (present/absent), with higher scores indicating a higher number of
risk behaviors;
▪ Family support: 1 item that evaluates the perception of support from family members
in making healthy lifestyle choices on a 4-point Likert scale, with higher scores
indicating greater perceived support.
The questionnaire has been used in the GOSPEL study for the assessment of patients with
cardiovascular disease (Giannuzzi et al., 2005, 2008) and has been tailored to the dietary
variation in the Italian adult population.
For the purpose of the present study, only the Mediterranean diet, dietary behavior, total
diet, and physical activity scores were considered. Additional questions were asked to collect
data on alcohol consumption (yes/no and number of alcoholic drinks per week), smoking habits
(yes/no and number of cigarettes per day), sleep onset, and total sleep time with reference to the
past month.
• Physiological parameters
The following physiological parameters were collected from medical charts for each participant
at each assessment time:
▪ HbA1c (%), a proxy measure of the 3-month average blood sugar level that is
commonly used to diagnose type 2 diabetes and assess glycemic control in people
with type 2 diabetes. Levels of HbA1c lower than 5.7% are considered normal
(Centers for Disease Control and Prevention, 2019b);
▪ HDL (mg/dL). Levels higher than or equal to 60 mg/dL are considered normal
(Centers for Disease Control and Prevention, 2020a);
55
▪ LDL (mg/dL). Levels lower than 100 mg/dL are considered normal (Centers for
Disease Control and Prevention, 2020a);
▪ Triglycerides (mg/dL). Levels lower than 150 mg/dL are considered normal (Centers
for Disease Control and Prevention, 2020a);
▪ Blood pressure (mm Hg). Levels of systolic blood pressure lower than 120 mm Hg
and levels of diastolic blood pressure lower than 80 mm Hg are considered normal
(Centers for Disease Control and Prevention, 2020b).
3.4.5 Statistical analysis
The sample size was estimated a priori using G*Power 3.1. Previous studies have shown a
moderate effect size of psycho-behavioral interventions on weight loss and measures of depression
and anxiety in adults with overweight or obesity (Rogers et al., 2017; Seo & Sa, 2008). To detect a
medium effect size (d = 0.5) at the statistical power of 0.80, a minimum of 34 participants is
required. Considering a risk of drop-out of about 50% (Moroshko et al., 2011), 68 participants were
intended to be recruited.
Main analyses on feasibility and acceptability were descriptive and focused on rates (i.e.,
eligibility, acceptance, and retention rates). Differences in retention rates between the combined
WBT-lifestyle and the lifestyle alone group, and between study sites were analyzed by means of
Pearson 2 test. The average number of sessions that had to be rescheduled was reported as mean
and standard deviation (M±SD) and differences between intervention groups and study sites were
assessed using independent samples Student t-test after controlling for Levene’s test for equality of
variances.
Content analysis was applied to participants’ answers to open-ended questions. Data were
organized into segments, coded, and analyzed both qualitatively and quantitatively to determine
which theme occurred most frequently.
56
Categorical variables were presented as frequencies, normally distributed continuous variables
were presented as mean with standard deviation, and non-normally distributed continuous variables
were presented as median with interquartile range. Baseline differences between intervention
groups, study sites, and completers vs. non-completers were analyzed by means of Pearson 2 test
for categorical variables, and by means of independent samples Student t-test after controlling for
Levene’s test for equality of variances for normally distributed continuous variables and by means
of the Mann-Whitney U test for non-normally distributed continuous variables.
Intervention efficacy for all primary and secondary outcomes was assessed by linear mixed-
effects modeling (LMM) to estimate adjusted mean treatment difference and confidence intervals
according to intention-to-treat (ITT) principles. Age, gender, high school education, site, and
group*time interaction were included as fixed effects, and participant ID as a random effect, to
analyze changes between and within groups over time. For studies with missing values, including
both values missing at random and drop-out, a mixed model approach with no ad hoc imputation
has been found to be more powerful than mixed models using ad hoc imputation methods (i.e., last
observation carried forward (LOCF), best value replacement (BVR), and worst value replacement
(WVR) (Chakraborty & Gu, 2009) and analysis of covariance (ANCOVA) with or without multiple
imputation (MI) (Xi et al., 2018). Differences between groups in outcome measures at baseline
were accounted for by using a constrained longitudinal data analysis (cLDA). This technique
constrains baseline means to be equal between groups and has been found to be more efficient than
ANCOVA and longitudinal data analysis (LDA) in providing accurate treatment effect estimates
and robust inferential statistics (Coffman et al., 2016). Residual histograms of the efficacy
outcomes were assessed visually and considered to be sufficiently normally distributed, and plots of
the fitted values against the standardized residuals of the efficacy outcomes were assessed visually
to confirm homoscedasticity.
57
Between group effect size estimates were reported as Cohen’s d calculated as adjusted mean
difference between groups divided by pooled baseline standard deviation (Sheaves et al., 2018). A
standardized effect size of 0.20 is considered small, 0.50 medium, and 0.80 large (Cohen, 1988).
Statistical analyses were conducted in Stata/SE, version 16.1 (StataCorp 2019, College Station,
TX, USA). Statistical significance was set at p ≤ 0.05, two-tailed, with 95% confidence intervals
reported.
3.5 Results
3.5.1 Baseline characteristics of the sample
3.5.1.1 Socio-demographic variables
The socio-demographic profile of the study population is presented in Table 4. The mean
age for the entire sample was 55.45 (SD = 6.60), ranging from 36 to 64, and with a higher
prevalence of male participants (60.3%). The majority of participants were in a relationship
(including those who were in a romantic relationship, in a domestic partnership, or married)
(79.3%), were living with others (91.4%), had children (75.9%), and were employed (67.2%).
Among those who were not in a relationship, 58.3 % were never married, 25% were divorced, and
16.7% were a widow/widower. Among those who were unemployed, 52.6% were retired, 26.3%
were a housemaker, 10.5% were looking for a job, and 10.5% said that they were home to take care
of an elderly person.
No statistically significant difference in any of the socio-demographic variables considered
was found when comparing participants in the combined WBT-lifestyle to the lifestyle alone group,
between the two study sites, and between completers and those who did not complete the study
(including both drop-out and participants who were eliminated by the investigator). Even if not
statistically significant, a higher prevalence of female participants (50.0% vs. 28.6%) was observed
in the combined WBT-lifestyle group.
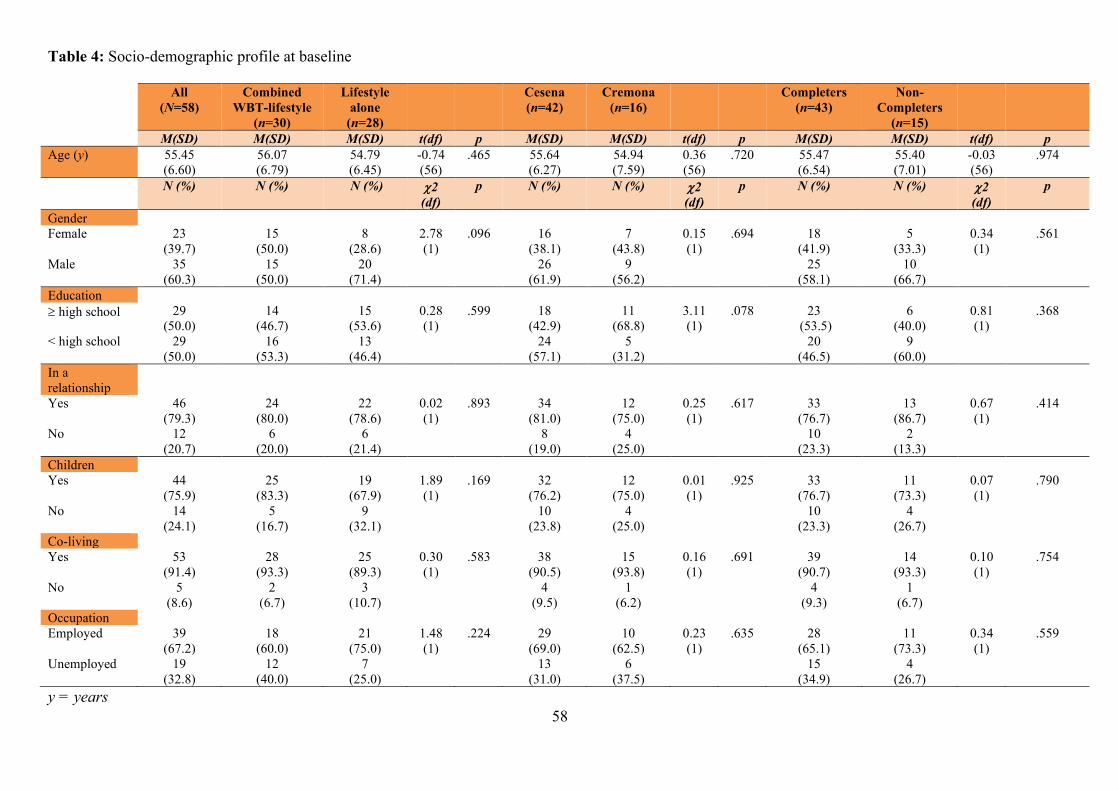
58
Table 4: Socio-demographic profile at baseline
All (N=58)
Combined WBT-lifestyle
(n=30)
Lifestyle alone
(n=28)
Cesena (n=42)
Cremona (n=16)
Completers (n=43)
Non-Completers
(n=15)
M(SD) M(SD) M(SD) t(df) p M(SD) M(SD) t(df) p M(SD) M(SD) t(df) p Age (y) 55.45
(6.60) 56.07 (6.79)
54.79 (6.45)
-0.74 (56)
.465 55.64 (6.27)
54.94 (7.59)
0.36 (56)
.720 55.47 (6.54)
55.40 (7.01)
-0.03 (56)
.974
N (%) N (%) N (%) 2 (df)
p N (%) N (%) 2 (df)
p N (%) N (%) 2 (df)
p
Gender Female 23
(39.7) 15
(50.0) 8
(28.6) 2.78 (1)
.096 16 (38.1)
7 (43.8)
0.15 (1)
.694 18 (41.9)
5 (33.3)
0.34 (1)
.561
Male 35 (60.3)
15 (50.0)
20 (71.4)
26 (61.9)
9 (56.2)
25 (58.1)
10 (66.7)
Education high school 29
(50.0) 14
(46.7) 15
(53.6) 0.28 (1)
.599 18 (42.9)
11 (68.8)
3.11 (1)
.078 23 (53.5)
6 (40.0)
0.81 (1)
.368
< high school 29 (50.0)
16 (53.3)
13 (46.4)
24 (57.1)
5 (31.2)
20 (46.5)
9 (60.0)
In a relationship
Yes 46 (79.3)
24 (80.0)
22 (78.6)
0.02 (1)
.893 34 (81.0)
12 (75.0)
0.25 (1)
.617 33 (76.7)
13 (86.7)
0.67 (1)
.414
No 12 (20.7)
6 (20.0)
6 (21.4)
8 (19.0)
4 (25.0)
10 (23.3)
2 (13.3)
Children Yes 44
(75.9) 25
(83.3) 19
(67.9) 1.89 (1)
.169 32 (76.2)
12 (75.0)
0.01 (1)
.925 33 (76.7)
11 (73.3)
0.07 (1)
.790
No 14 (24.1)
5 (16.7)
9 (32.1)
10 (23.8)
4 (25.0)
10 (23.3)
4 (26.7)
Co-living Yes 53
(91.4) 28
(93.3) 25
(89.3) 0.30 (1)
.583 38 (90.5)
15 (93.8)
0.16 (1)
.691 39 (90.7)
14 (93.3)
0.10 (1)
.754
No 5 (8.6)
2 (6.7)
3 (10.7)
4 (9.5)
1 (6.2)
4 (9.3)
1 (6.7)
Occupation Employed 39
(67.2) 18
(60.0) 21
(75.0) 1.48 (1)
.224 29 (69.0)
10 (62.5)
0.23 (1)
.635 28 (65.1)
11 (73.3)
0.34 (1)
.559
Unemployed 19 (32.8)
12 (40.0)
7 (25.0)
13 (31.0)
6 (37.5)
15 (34.9)
4 (26.7)
y = years
59
3.5.1.2 Medical profile
The medical profile of the study population is presented in Table 5. Participants had a
median of 4.00 (IQR = 2.00-5.00) comorbidities at baseline, with 38% of participants having five or
more comorbidities, 19% having four comorbidities, 17% having three comorbidities, 21% having
two comorbidities, and only 5% having one comorbidity. A description of current medical
comorbidities at baseline in the overall sample is provided in Figure 1. All participants had a
diagnosis of type 2 diabetes, with a median of 6.00 (IQR = 3.00-12.00) years with diabetes. A
family history of type 2 diabetes was also commonly reported among first and second-degree
family members (74.1%). The most common comorbidities were cardiovascular (69%) and other
metabolic diseases (55%), followed by eye (24%), musculoskeletal (19%), gastrointestinal (19%),
nervous system (19%), genitourinary (16%), and respiratory (10%) diseases. Among cardiovascular
disease (CVD), hypertension was the most common, being present in 62% of the total sample.
Among metabolic diseases, hyperlipidemia and thyroid disease were present in 48% and 10% of the
total sample, respectively. Common diabetes complications included peripheral neuropathy (22% of
the total sample), retinopathy (16% of the total sample), and nephropathy (9% of the total sample).
Overall, the sample had a high comorbidity burden, with 38% having 5 or more comorbidities.
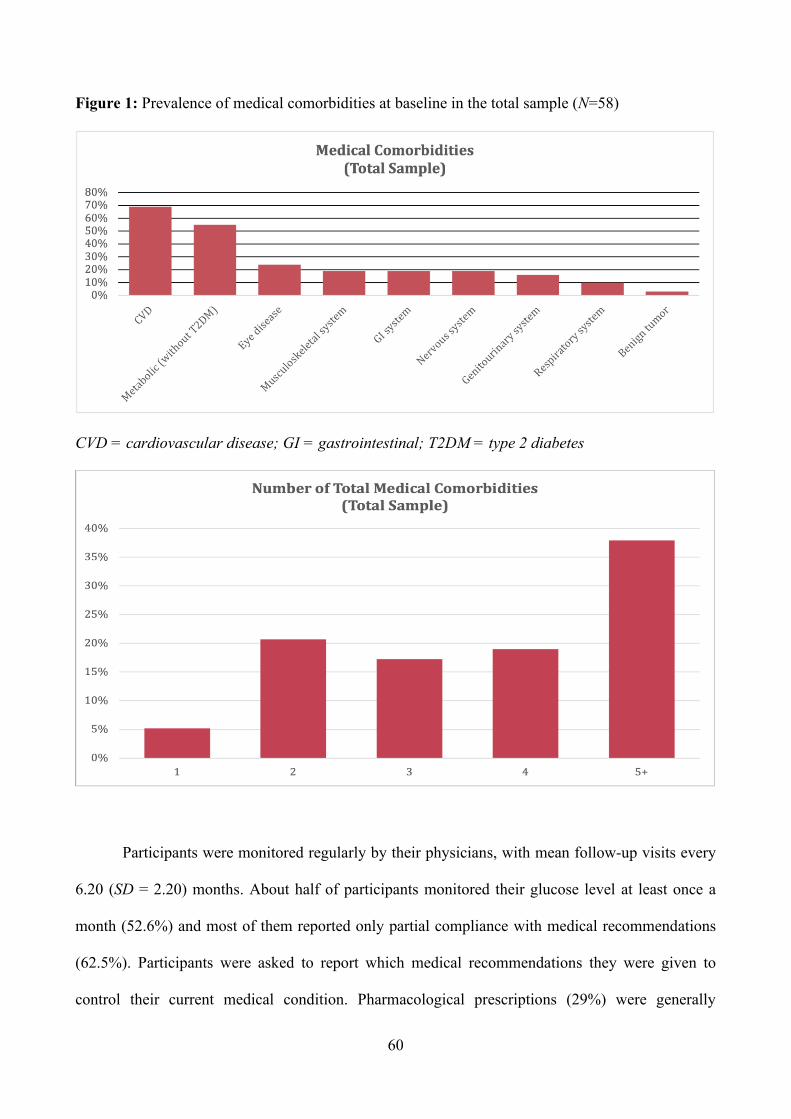
60
Figure 1: Prevalence of medical comorbidities at baseline in the total sample (N=58)
CVD = cardiovascular disease; GI = gastrointestinal; T2DM = type 2 diabetes
Participants were monitored regularly by their physicians, with mean follow-up visits every
6.20 (SD = 2.20) months. About half of participants monitored their glucose level at least once a
month (52.6%) and most of them reported only partial compliance with medical recommendations
(62.5%). Participants were asked to report which medical recommendations they were given to
control their current medical condition. Pharmacological prescriptions (29%) were generally
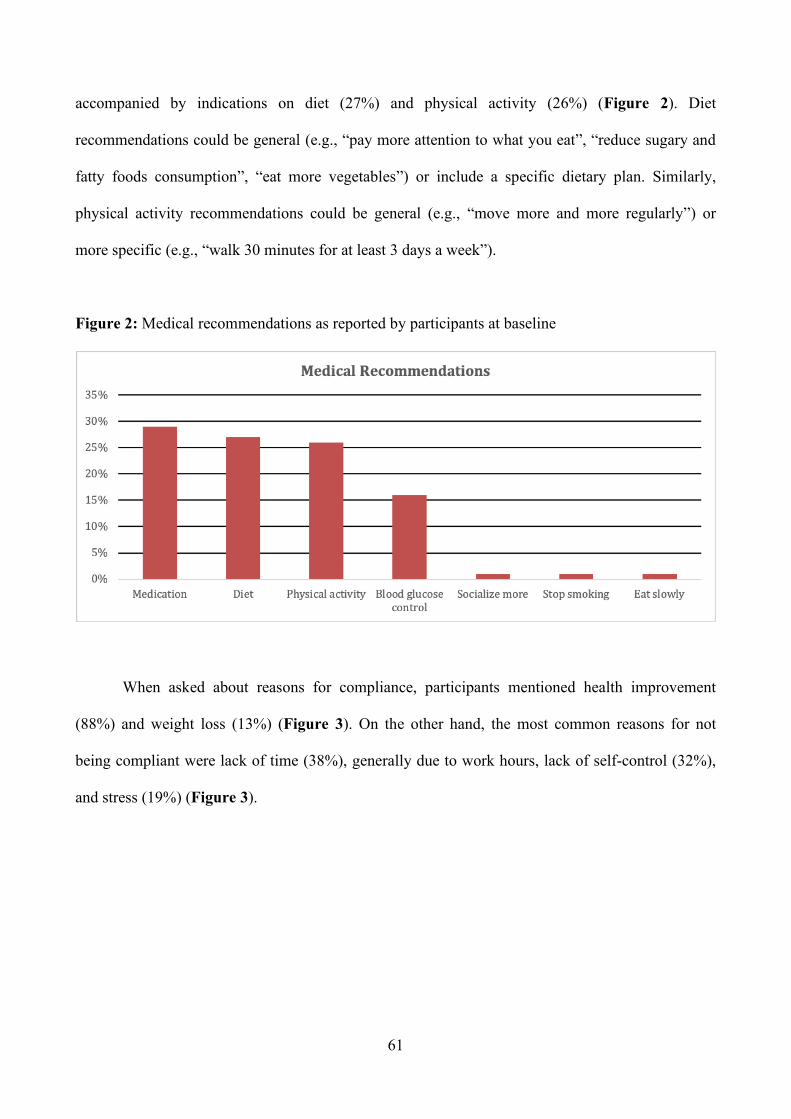
61
accompanied by indications on diet (27%) and physical activity (26%) (Figure 2). Diet
recommendations could be general (e.g., “pay more attention to what you eat”, “reduce sugary and
fatty foods consumption”, “eat more vegetables”) or include a specific dietary plan. Similarly,
physical activity recommendations could be general (e.g., “move more and more regularly”) or
more specific (e.g., “walk 30 minutes for at least 3 days a week”).
Figure 2: Medical recommendations as reported by participants at baseline
When asked about reasons for compliance, participants mentioned health improvement
(88%) and weight loss (13%) (Figure 3). On the other hand, the most common reasons for not
being compliant were lack of time (38%), generally due to work hours, lack of self-control (32%),
and stress (19%) (Figure 3).
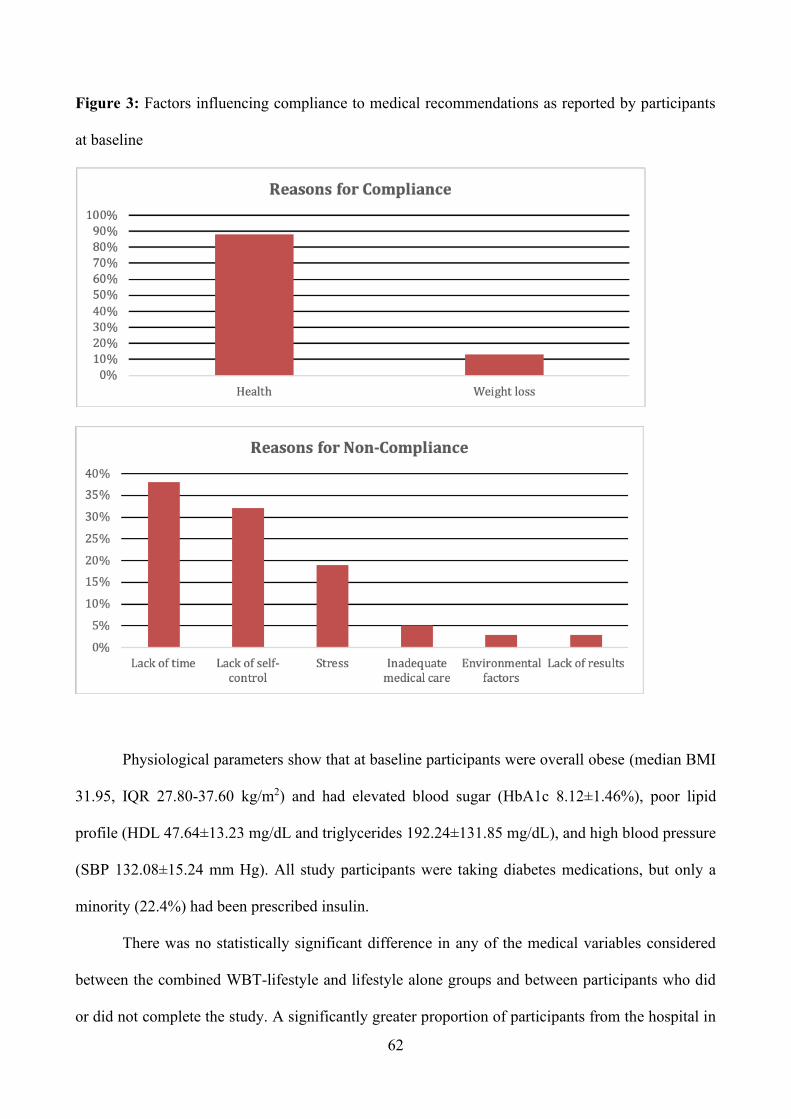
62
Figure 3: Factors influencing compliance to medical recommendations as reported by participants
at baseline
Physiological parameters show that at baseline participants were overall obese (median BMI
31.95, IQR 27.80-37.60 kg/m2) and had elevated blood sugar (HbA1c 8.12±1.46%), poor lipid
profile (HDL 47.64±13.23 mg/dL and triglycerides 192.24±131.85 mg/dL), and high blood pressure
(SBP 132.08±15.24 mm Hg). All study participants were taking diabetes medications, but only a
minority (22.4%) had been prescribed insulin.
There was no statistically significant difference in any of the medical variables considered
between the combined WBT-lifestyle and lifestyle alone groups and between participants who did
or did not complete the study. A significantly greater proportion of participants from the hospital in

63
Cremona reported regularly monitoring their glucose levels and had significantly lower HbA1c
(7.38±1.23% vs. 8.43±1.45%).
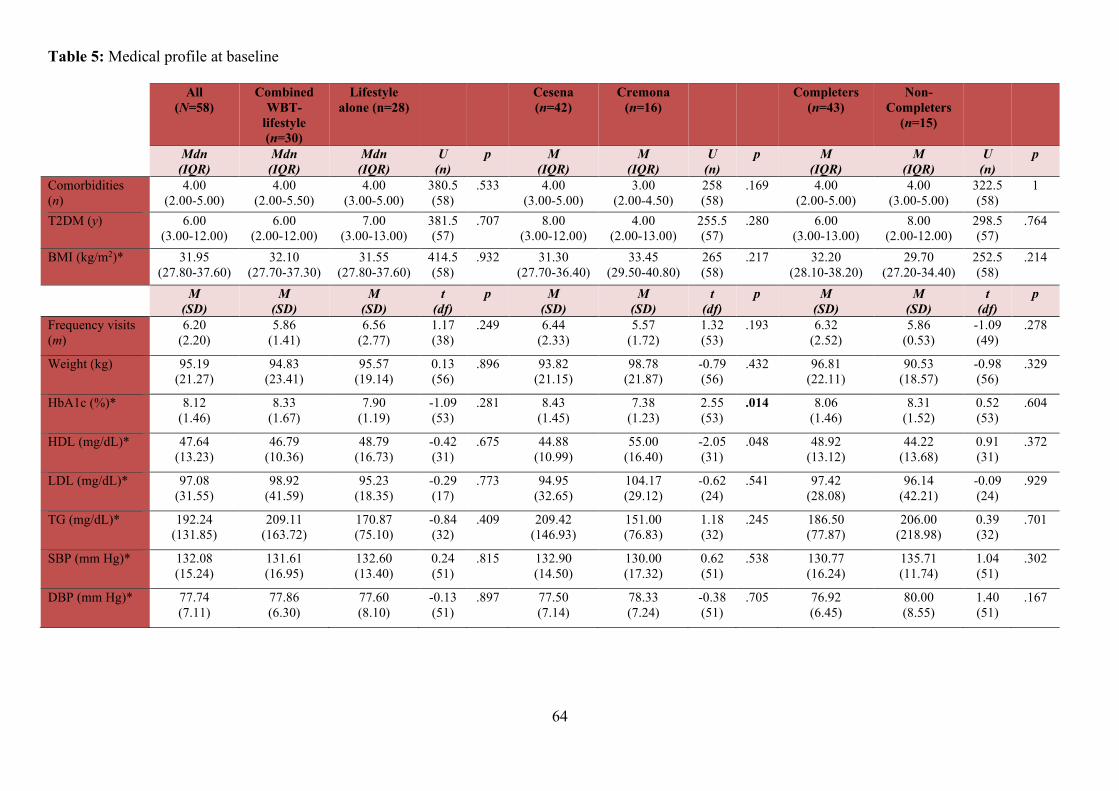
64
Table 5: Medical profile at baseline
All (N=58)
Combined WBT-
lifestyle (n=30)
Lifestyle alone (n=28)
Cesena (n=42)
Cremona (n=16)
Completers (n=43)
Non-Completers
(n=15)
Mdn (IQR)
Mdn (IQR)
Mdn (IQR)
U (n)
p M (IQR)
M (IQR)
U (n)
p M (IQR)
M (IQR)
U (n)
p
Comorbidities (n)
4.00 (2.00-5.00)
4.00 (2.00-5.50)
4.00 (3.00-5.00)
380.5 (58)
.533 4.00 (3.00-5.00)
3.00 (2.00-4.50)
258 (58)
.169 4.00 (2.00-5.00)
4.00 (3.00-5.00)
322.5 (58)
1
T2DM (y) 6.00 (3.00-12.00)
6.00 (2.00-12.00)
7.00 (3.00-13.00)
381.5 (57)
.707
8.00 (3.00-12.00)
4.00 (2.00-13.00)
255.5 (57)
.280
6.00 (3.00-13.00)
8.00 (2.00-12.00)
298.5 (57)
.764
BMI (kg/m2)* 31.95 (27.80-37.60)
32.10 (27.70-37.30)
31.55 (27.80-37.60)
414.5 (58)
.932
31.30 (27.70-36.40)
33.45 (29.50-40.80)
265 (58)
.217
32.20 (28.10-38.20)
29.70 (27.20-34.40)
252.5 (58)
.214
M (SD)
M (SD)
M (SD)
t (df)
p M (SD)
M (SD)
t (df)
p M (SD)
M (SD)
t (df)
p
Frequency visits (m)
6.20 (2.20)
5.86 (1.41)
6.56 (2.77)
1.17 (38)
.249 6.44 (2.33)
5.57 (1.72)
1.32 (53)
.193 6.32 (2.52)
5.86 (0.53)
-1.09 (49)
.278
Weight (kg) 95.19 (21.27)
94.83 (23.41)
95.57 (19.14)
0.13 (56)
.896 93.82 (21.15)
98.78 (21.87)
-0.79 (56)
.432 96.81 (22.11)
90.53 (18.57)
-0.98 (56)
.329
HbA1c (%)* 8.12 (1.46)
8.33 (1.67)
7.90 (1.19)
-1.09 (53)
.281 8.43 (1.45)
7.38 (1.23)
2.55 (53)
.014 8.06 (1.46)
8.31 (1.52)
0.52 (53)
.604
HDL (mg/dL)* 47.64 (13.23)
46.79 (10.36)
48.79 (16.73)
-0.42 (31)
.675 44.88 (10.99)
55.00 (16.40)
-2.05 (31)
.048 48.92 (13.12)
44.22 (13.68)
0.91 (31)
.372
LDL (mg/dL)* 97.08 (31.55)
98.92 (41.59)
95.23 (18.35)
-0.29 (17)
.773 94.95 (32.65)
104.17 (29.12)
-0.62 (24)
.541 97.42 (28.08)
96.14 (42.21)
-0.09 (24)
.929
TG (mg/dL)* 192.24 (131.85)
209.11 (163.72)
170.87 (75.10)
-0.84 (32)
.409 209.42 (146.93)
151.00 (76.83)
1.18 (32)
.245 186.50 (77.87)
206.00 (218.98)
0.39 (32)
.701
SBP (mm Hg)* 132.08 (15.24)
131.61 (16.95)
132.60 (13.40)
0.24 (51)
.815 132.90 (14.50)
130.00 (17.32)
0.62 (51)
.538 130.77 (16.24)
135.71 (11.74)
1.04 (51)
.302
DBP (mm Hg)* 77.74 (7.11)
77.86 (6.30)
77.60 (8.10)
-0.13 (51)
.897 77.50 (7.14)
78.33 (7.24)
-0.38 (51)
.705 76.92 (6.45)
80.00 (8.55)
1.40 (51)
.167
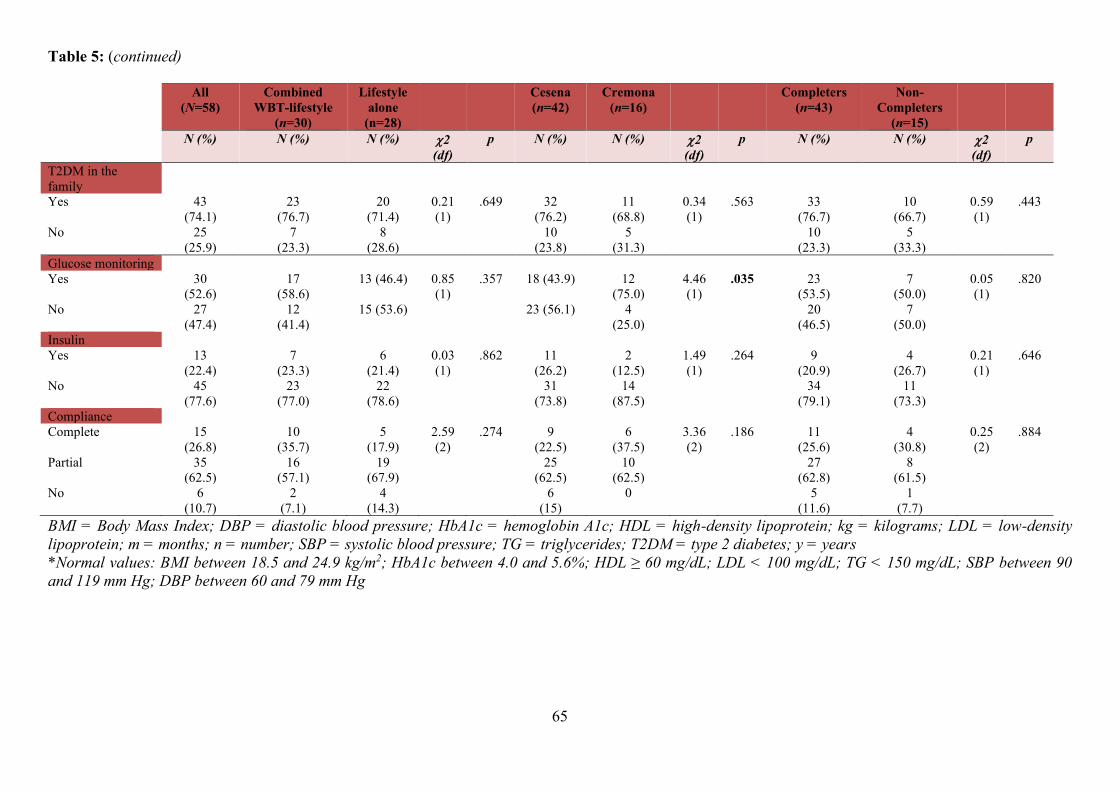
65
Table 5: (continued)
All (N=58)
Combined WBT-lifestyle
(n=30)
Lifestyle alone
(n=28)
Cesena (n=42)
Cremona (n=16)
Completers (n=43)
Non-Completers
(n=15)
N (%) N (%) N (%) 2 (df)
p N (%) N (%) 2 (df)
p N (%) N (%) 2 (df)
p
T2DM in the family
Yes 43 (74.1)
23 (76.7)
20 (71.4)
0.21 (1)
.649 32 (76.2)
11 (68.8)
0.34 (1)
.563 33 (76.7)
10 (66.7)
0.59 (1)
.443
No 25 (25.9)
7 (23.3)
8 (28.6)
10 (23.8)
5 (31.3)
10 (23.3)
5 (33.3)
Glucose monitoring Yes 30
(52.6) 17
(58.6) 13 (46.4) 0.85
(1) .357 18 (43.9) 12
(75.0) 4.46 (1)
.035 23 (53.5)
7 (50.0)
0.05 (1)
.820
No 27 (47.4)
12 (41.4)
15 (53.6) 23 (56.1) 4 (25.0)
20 (46.5)
7 (50.0)
Insulin Yes 13
(22.4) 7
(23.3) 6
(21.4) 0.03 (1)
.862 11 (26.2)
2 (12.5)
1.49 (1)
.264 9 (20.9)
4 (26.7)
0.21 (1)
.646
No 45 (77.6)
23 (77.0)
22 (78.6)
31 (73.8)
14 (87.5)
34 (79.1)
11 (73.3)
Compliance Complete 15
(26.8) 10
(35.7) 5
(17.9) 2.59 (2)
.274 9 (22.5)
6 (37.5)
3.36 (2)
.186 11 (25.6)
4 (30.8)
0.25 (2)
.884
Partial 35 (62.5)
16 (57.1)
19 (67.9)
25 (62.5)
10 (62.5)
27 (62.8)
8 (61.5)
No 6 (10.7)
2 (7.1)
4 (14.3)
6 (15)
0 5 (11.6)
1 (7.7)
BMI = Body Mass Index; DBP = diastolic blood pressure; HbA1c = hemoglobin A1c; HDL = high-density lipoprotein; kg = kilograms; LDL = low-density lipoprotein; m = months; n = number; SBP = systolic blood pressure; TG = triglycerides; T2DM = type 2 diabetes; y = years *Normal values: BMI between 18.5 and 24.9 kg/m2; HbA1c between 4.0 and 5.6%; HDL ≥ 60 mg/dL; LDL < 100 mg/dL; TG < 150 mg/dL; SBP between 90 and 119 mm Hg; DBP between 60 and 79 mm Hg
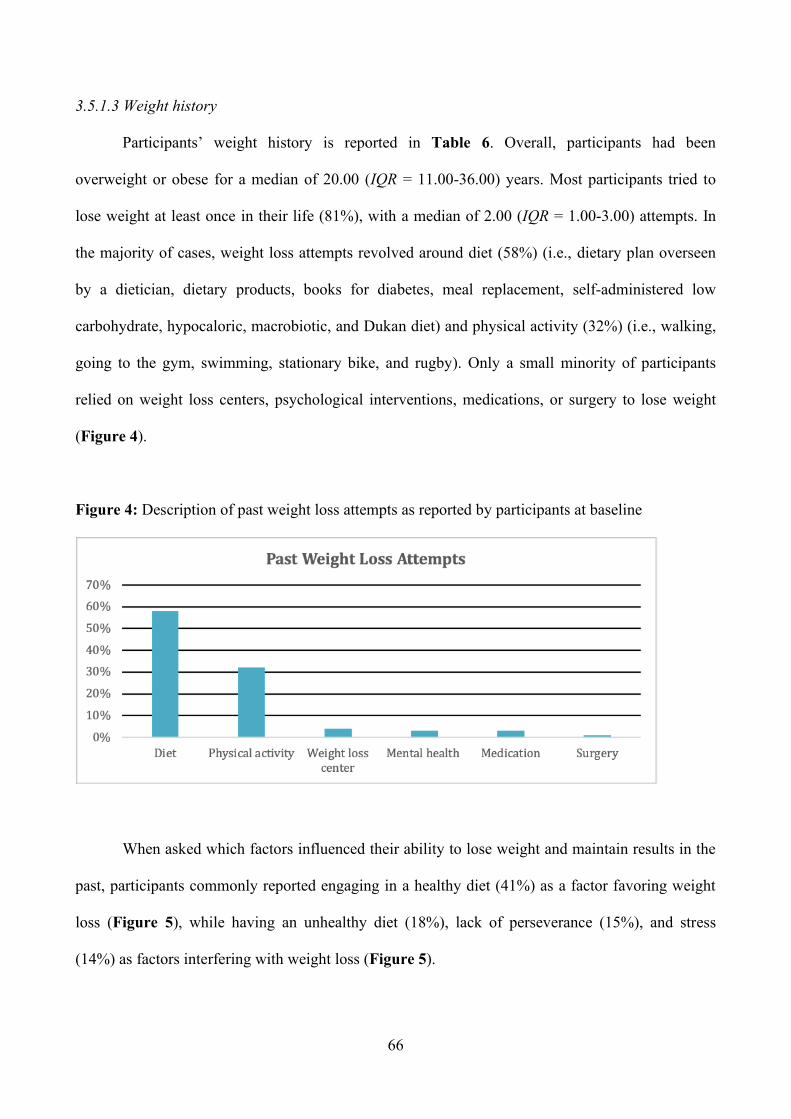
66
3.5.1.3 Weight history
Participants’ weight history is reported in Table 6. Overall, participants had been
overweight or obese for a median of 20.00 (IQR = 11.00-36.00) years. Most participants tried to
lose weight at least once in their life (81%), with a median of 2.00 (IQR = 1.00-3.00) attempts. In
the majority of cases, weight loss attempts revolved around diet (58%) (i.e., dietary plan overseen
by a dietician, dietary products, books for diabetes, meal replacement, self-administered low
carbohydrate, hypocaloric, macrobiotic, and Dukan diet) and physical activity (32%) (i.e., walking,
going to the gym, swimming, stationary bike, and rugby). Only a small minority of participants
relied on weight loss centers, psychological interventions, medications, or surgery to lose weight
(Figure 4).
Figure 4: Description of past weight loss attempts as reported by participants at baseline
When asked which factors influenced their ability to lose weight and maintain results in the
past, participants commonly reported engaging in a healthy diet (41%) as a factor favoring weight
loss (Figure 5), while having an unhealthy diet (18%), lack of perseverance (15%), and stress
(14%) as factors interfering with weight loss (Figure 5).
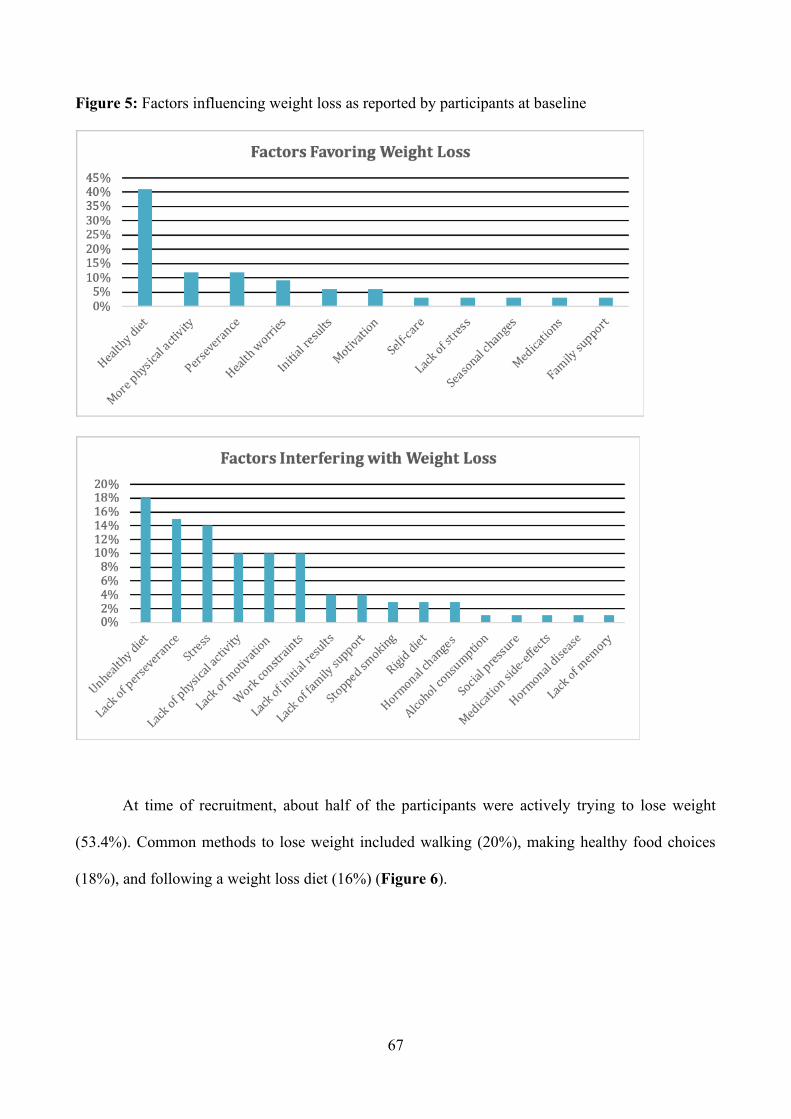
67
Figure 5: Factors influencing weight loss as reported by participants at baseline
At time of recruitment, about half of the participants were actively trying to lose weight
(53.4%). Common methods to lose weight included walking (20%), making healthy food choices
(18%), and following a weight loss diet (16%) (Figure 6).
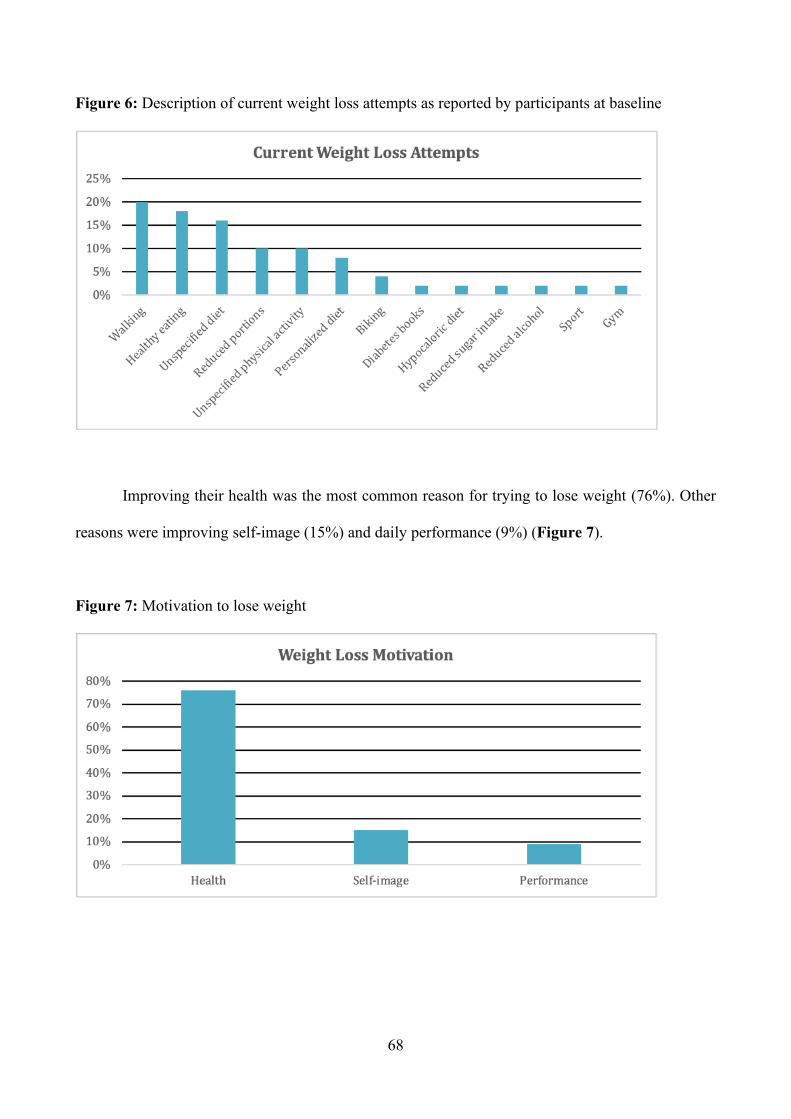
68
Figure 6: Description of current weight loss attempts as reported by participants at baseline
Improving their health was the most common reason for trying to lose weight (76%). Other
reasons were improving self-image (15%) and daily performance (9%) (Figure 7).
Figure 7: Motivation to lose weight
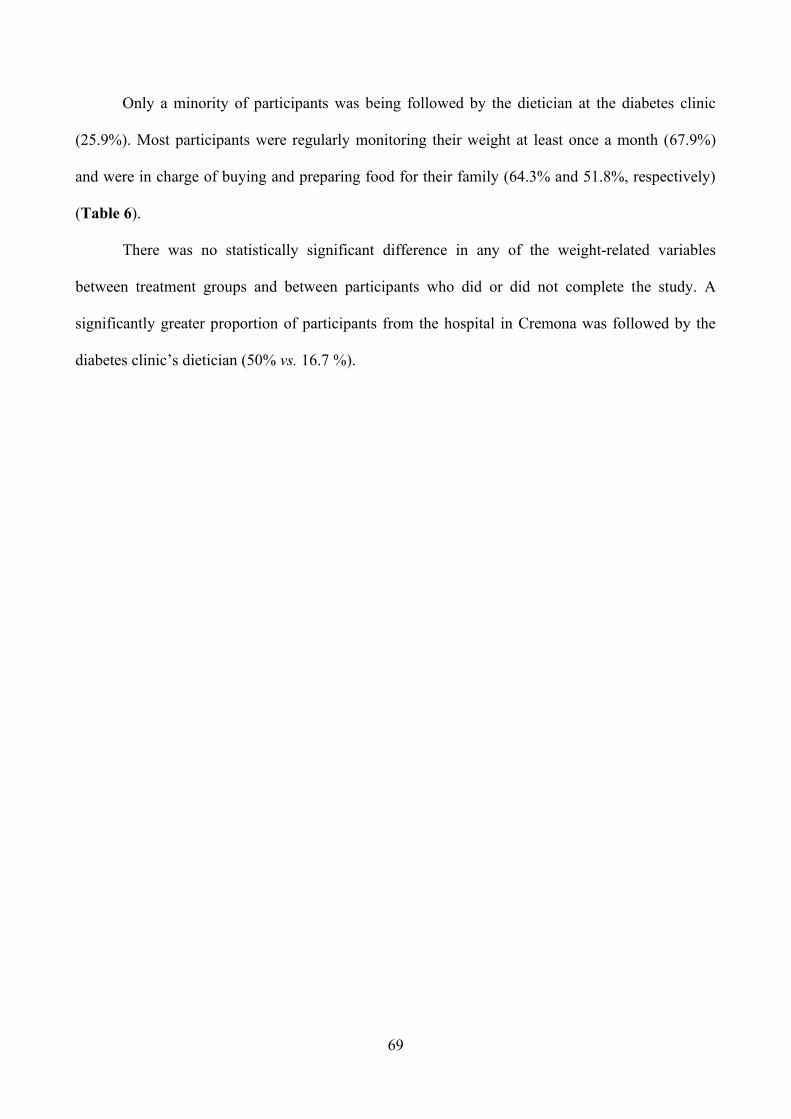
69
Only a minority of participants was being followed by the dietician at the diabetes clinic
(25.9%). Most participants were regularly monitoring their weight at least once a month (67.9%)
and were in charge of buying and preparing food for their family (64.3% and 51.8%, respectively)
(Table 6).
There was no statistically significant difference in any of the weight-related variables
between treatment groups and between participants who did or did not complete the study. A
significantly greater proportion of participants from the hospital in Cremona was followed by the
diabetes clinic’s dietician (50% vs. 16.7 %).
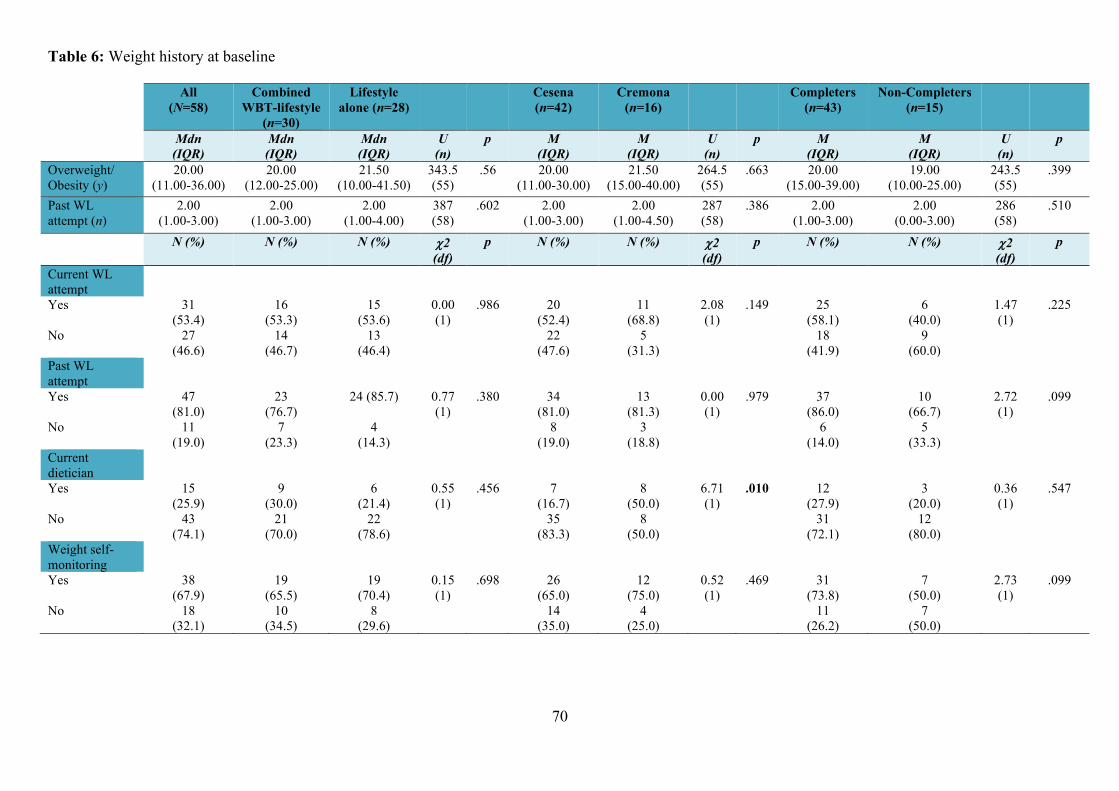
70
Table 6: Weight history at baseline
All (N=58)
Combined WBT-lifestyle
(n=30)
Lifestyle alone (n=28)
Cesena (n=42)
Cremona (n=16)
Completers (n=43)
Non-Completers (n=15)
Mdn (IQR)
Mdn (IQR)
Mdn (IQR)
U (n)
p M (IQR)
M (IQR)
U (n)
p M (IQR)
M (IQR)
U (n)
p
Overweight/ Obesity (y)
20.00 (11.00-36.00)
20.00 (12.00-25.00)
21.50 (10.00-41.50)
343.5 (55)
.56
20.00 (11.00-30.00)
21.50 (15.00-40.00)
264.5 (55)
.663
20.00 (15.00-39.00)
19.00 (10.00-25.00)
243.5 (55)
.399
Past WL attempt (n)
2.00 (1.00-3.00)
2.00 (1.00-3.00)
2.00 (1.00-4.00)
387 (58)
.602
2.00 (1.00-3.00)
2.00 (1.00-4.50)
287 (58)
.386
2.00 (1.00-3.00)
2.00 (0.00-3.00)
286 (58)
.510
N (%) N (%) N (%) 2 (df)
p N (%) N (%) 2 (df)
p N (%) N (%) 2 (df)
p
Current WL attempt
Yes 31 (53.4)
16 (53.3)
15 (53.6)
0.00 (1)
.986 20 (52.4)
11 (68.8)
2.08 (1)
.149 25 (58.1)
6 (40.0)
1.47 (1)
.225
No 27 (46.6)
14 (46.7)
13 (46.4)
22 (47.6)
5 (31.3)
18 (41.9)
9 (60.0)
Past WL attempt
Yes 47 (81.0)
23 (76.7)
24 (85.7) 0.77 (1)
.380 34 (81.0)
13 (81.3)
0.00 (1)
.979 37 (86.0)
10 (66.7)
2.72 (1)
.099
No 11 (19.0)
7 (23.3)
4 (14.3)
8 (19.0)
3 (18.8)
6 (14.0)
5 (33.3)
Current dietician
Yes 15 (25.9)
9 (30.0)
6 (21.4)
0.55 (1)
.456 7 (16.7)
8 (50.0)
6.71 (1)
.010 12 (27.9)
3 (20.0)
0.36 (1)
.547
No 43 (74.1)
21 (70.0)
22 (78.6)
35 (83.3)
8 (50.0)
31 (72.1)
12 (80.0)
Weight self-monitoring
Yes 38 (67.9)
19 (65.5)
19 (70.4)
0.15 (1)
.698 26 (65.0)
12 (75.0)
0.52 (1)
.469 31 (73.8)
7 (50.0)
2.73 (1)
.099
No 18 (32.1)
10 (34.5)
8 (29.6)
14 (35.0)
4 (25.0)
11 (26.2)
7 (50.0)
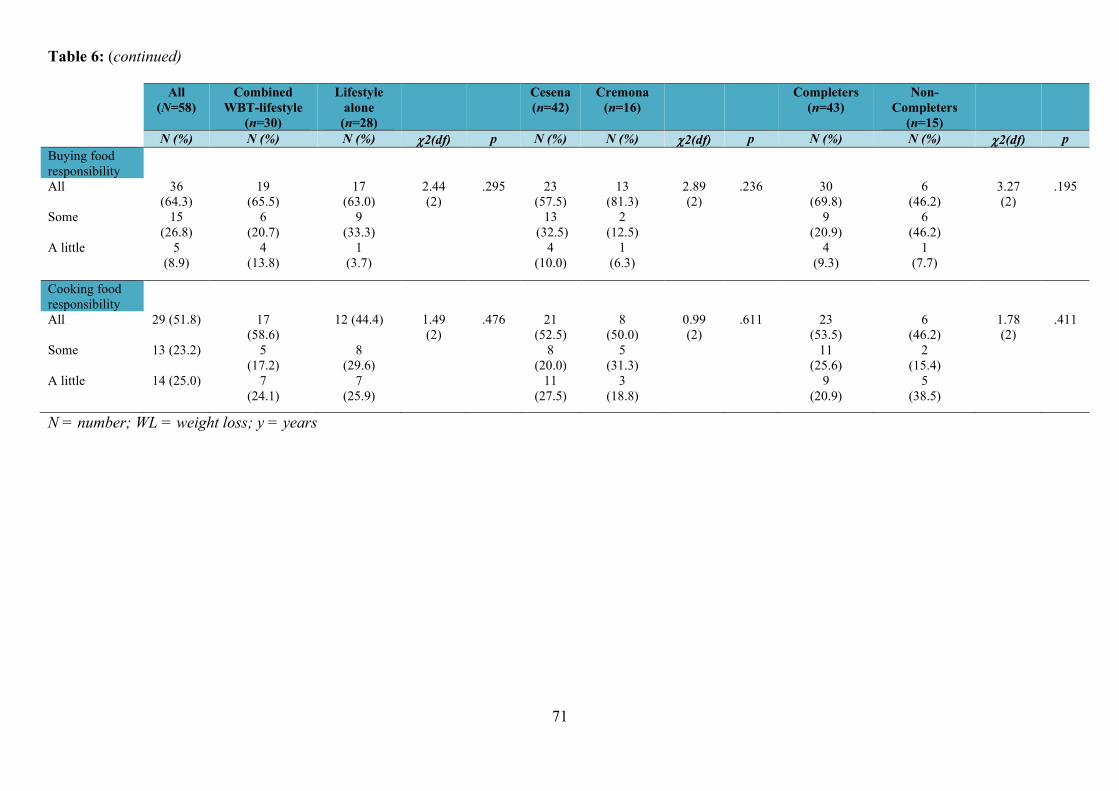
71
Table 6: (continued)
All (N=58)
Combined WBT-lifestyle
(n=30)
Lifestyle alone
(n=28)
Cesena (n=42)
Cremona (n=16)
Completers (n=43)
Non-Completers
(n=15)
N (%) N (%) N (%) 2(df) p N (%) N (%) 2(df) p N (%) N (%) 2(df) p Buying food responsibility
All 36 (64.3)
19 (65.5)
17 (63.0)
2.44 (2)
.295 23 (57.5)
13 (81.3)
2.89 (2)
.236 30 (69.8)
6 (46.2)
3.27 (2)
.195
Some 15 (26.8)
6 (20.7)
9 (33.3)
13 (32.5)
2 (12.5)
9 (20.9)
6 (46.2)
A little 5 (8.9)
4 (13.8)
1 (3.7)
4 (10.0)
1 (6.3)
4 (9.3)
1 (7.7)
Cooking food responsibility
All 29 (51.8) 17 (58.6)
12 (44.4) 1.49 (2)
.476 21 (52.5)
8 (50.0)
0.99 (2)
.611 23 (53.5)
6 (46.2)
1.78 (2)
.411
Some 13 (23.2) 5 (17.2)
8 (29.6)
8 (20.0)
5 (31.3)
11 (25.6)
2 (15.4)
A little 14 (25.0) 7 (24.1)
7 (25.9)
11 (27.5)
3 (18.8)
9 (20.9)
5 (38.5)
N = number; WL = weight loss; y = years
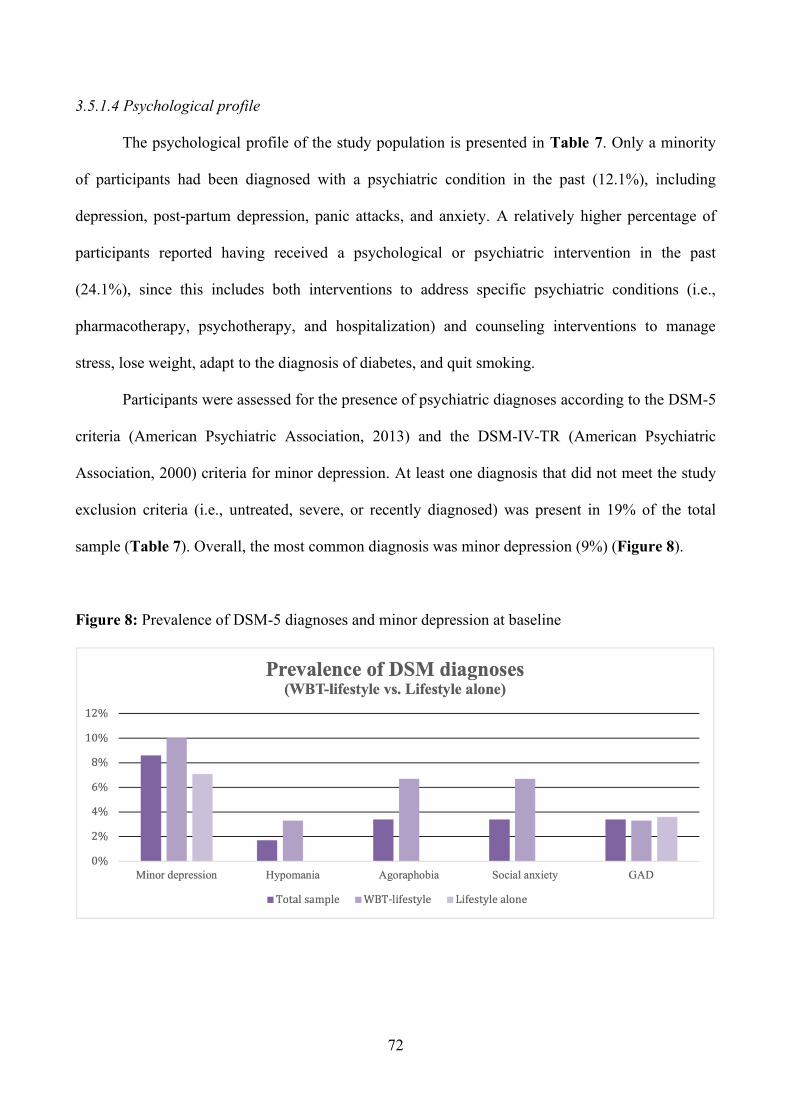
72
3.5.1.4 Psychological profile
The psychological profile of the study population is presented in Table 7. Only a minority
of participants had been diagnosed with a psychiatric condition in the past (12.1%), including
depression, post-partum depression, panic attacks, and anxiety. A relatively higher percentage of
participants reported having received a psychological or psychiatric intervention in the past
(24.1%), since this includes both interventions to address specific psychiatric conditions (i.e.,
pharmacotherapy, psychotherapy, and hospitalization) and counseling interventions to manage
stress, lose weight, adapt to the diagnosis of diabetes, and quit smoking.
Participants were assessed for the presence of psychiatric diagnoses according to the DSM-5
criteria (American Psychiatric Association, 2013) and the DSM-IV-TR (American Psychiatric
Association, 2000) criteria for minor depression. At least one diagnosis that did not meet the study
exclusion criteria (i.e., untreated, severe, or recently diagnosed) was present in 19% of the total
sample (Table 7). Overall, the most common diagnosis was minor depression (9%) (Figure 8).
Figure 8: Prevalence of DSM-5 diagnoses and minor depression at baseline
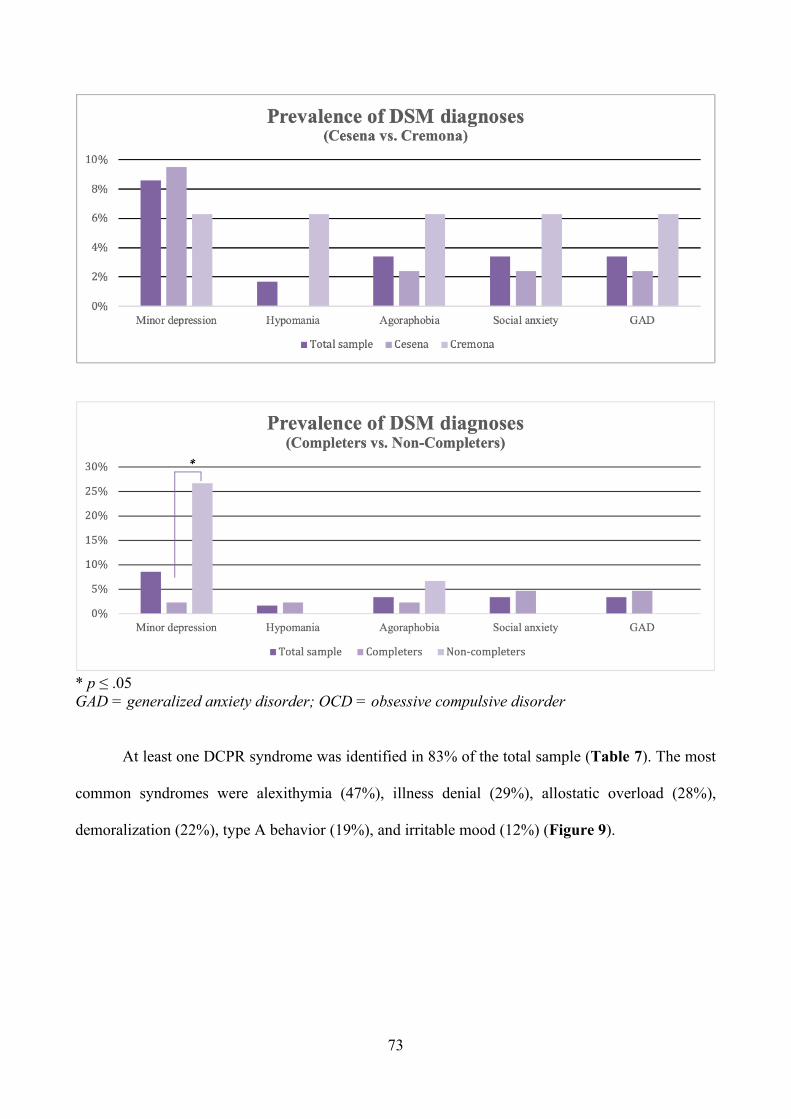
73
* p ≤ .05 GAD = generalized anxiety disorder; OCD = obsessive compulsive disorder
At least one DCPR syndrome was identified in 83% of the total sample (Table 7). The most
common syndromes were alexithymia (47%), illness denial (29%), allostatic overload (28%),
demoralization (22%), type A behavior (19%), and irritable mood (12%) (Figure 9).
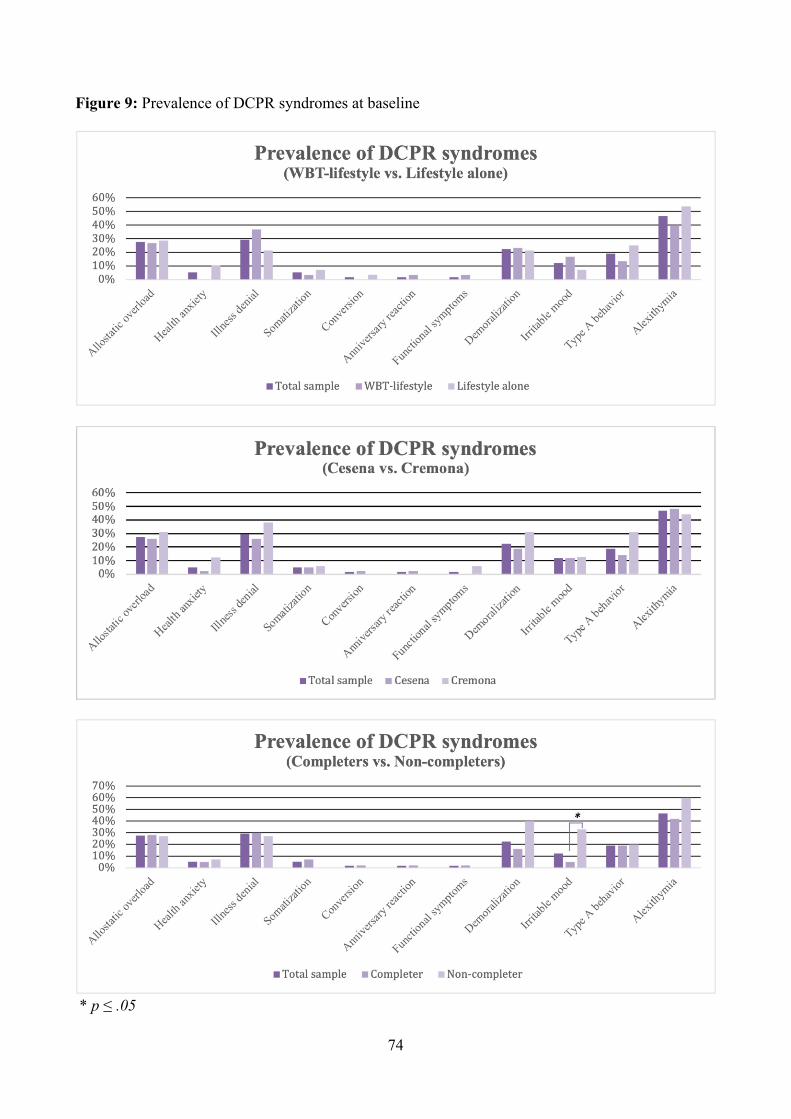
74
Figure 9: Prevalence of DCPR syndromes at baseline
* p ≤ .05
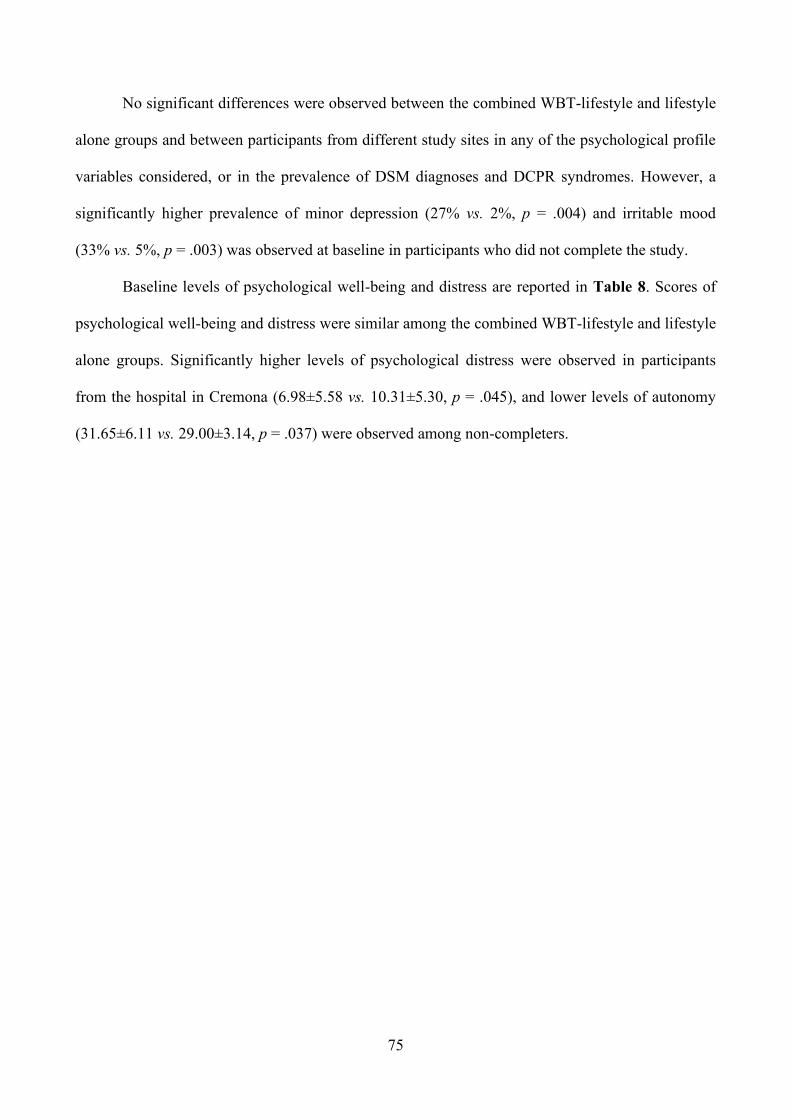
75
No significant differences were observed between the combined WBT-lifestyle and lifestyle
alone groups and between participants from different study sites in any of the psychological profile
variables considered, or in the prevalence of DSM diagnoses and DCPR syndromes. However, a
significantly higher prevalence of minor depression (27% vs. 2%, p = .004) and irritable mood
(33% vs. 5%, p = .003) was observed at baseline in participants who did not complete the study.
Baseline levels of psychological well-being and distress are reported in Table 8. Scores of
psychological well-being and distress were similar among the combined WBT-lifestyle and lifestyle
alone groups. Significantly higher levels of psychological distress were observed in participants
from the hospital in Cremona (6.98±5.58 vs. 10.31±5.30, p = .045), and lower levels of autonomy
(31.65±6.11 vs. 29.00±3.14, p = .037) were observed among non-completers.
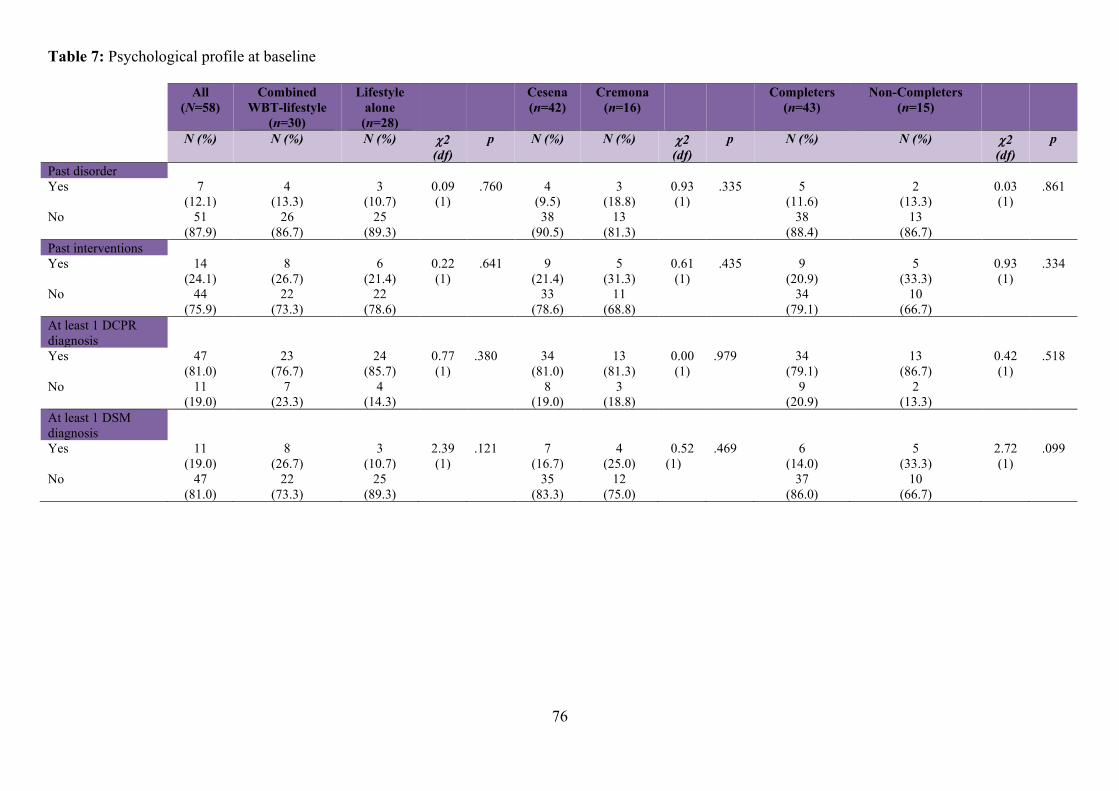
76
Table 7: Psychological profile at baseline
All (N=58)
Combined WBT-lifestyle
(n=30)
Lifestyle alone
(n=28)
Cesena (n=42)
Cremona (n=16)
Completers (n=43)
Non-Completers (n=15)
N (%) N (%) N (%) 2 (df)
p N (%) N (%) 2 (df)
p N (%) N (%) 2 (df)
p
Past disorder Yes 7
(12.1) 4
(13.3) 3
(10.7) 0.09 (1)
.760 4 (9.5)
3 (18.8)
0.93 (1)
.335 5 (11.6)
2 (13.3)
0.03 (1)
.861
No 51 (87.9)
26 (86.7)
25 (89.3)
38 (90.5)
13 (81.3)
38 (88.4)
13 (86.7)
Past interventions Yes 14
(24.1) 8
(26.7) 6
(21.4) 0.22 (1)
.641 9 (21.4)
5 (31.3)
0.61 (1)
.435 9 (20.9)
5 (33.3)
0.93 (1)
.334
No 44 (75.9)
22 (73.3)
22 (78.6)
33 (78.6)
11 (68.8)
34 (79.1)
10 (66.7)
At least 1 DCPR diagnosis
Yes 47 (81.0)
23 (76.7)
24 (85.7)
0.77 (1)
.380 34 (81.0)
13 (81.3)
0.00 (1)
.979 34 (79.1)
13 (86.7)
0.42 (1)
.518
No 11 (19.0)
7 (23.3)
4 (14.3)
8 (19.0)
3 (18.8)
9 (20.9)
2 (13.3)
At least 1 DSM diagnosis
Yes 11 (19.0)
8 (26.7)
3 (10.7)
2.39 (1)
.121 7 (16.7)
4 (25.0)
0.52 (1)
.469 6 (14.0)
5 (33.3)
2.72 (1)
.099
No 47 (81.0)
22 (73.3)
25 (89.3)
35 (83.3)
12 (75.0)
37 (86.0)
10 (66.7)
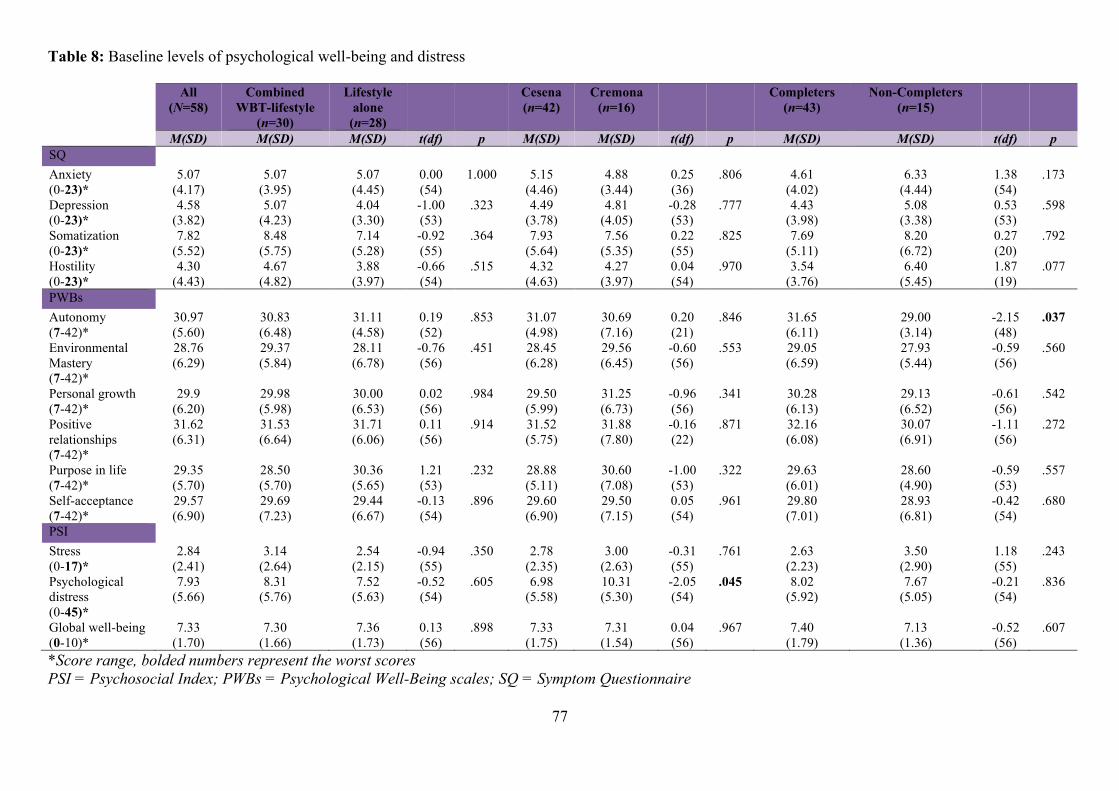
77
Table 8: Baseline levels of psychological well-being and distress
All (N=58)
Combined WBT-lifestyle
(n=30)
Lifestyle alone
(n=28)
Cesena (n=42)
Cremona (n=16)
Completers (n=43)
Non-Completers (n=15)
M(SD) M(SD) M(SD) t(df) p M(SD) M(SD) t(df) p M(SD) M(SD) t(df) p SQ Anxiety (0-23)*
5.07 (4.17)
5.07 (3.95)
5.07 (4.45)
0.00 (54)
1.000 5.15 (4.46)
4.88 (3.44)
0.25 (36)
.806 4.61 (4.02)
6.33 (4.44)
1.38 (54)
.173
Depression (0-23)*
4.58 (3.82)
5.07 (4.23)
4.04 (3.30)
-1.00 (53)
.323 4.49 (3.78)
4.81 (4.05)
-0.28 (53)
.777 4.43 (3.98)
5.08 (3.38)
0.53 (53)
.598
Somatization (0-23)*
7.82 (5.52)
8.48 (5.75)
7.14 (5.28)
-0.92 (55)
.364 7.93 (5.64)
7.56 (5.35)
0.22 (55)
.825 7.69 (5.11)
8.20 (6.72)
0.27 (20)
.792
Hostility (0-23)*
4.30 (4.43)
4.67 (4.82)
3.88 (3.97)
-0.66 (54)
.515 4.32 (4.63)
4.27 (3.97)
0.04 (54)
.970 3.54 (3.76)
6.40 (5.45)
1.87 (19)
.077
PWBs Autonomy (7-42)*
30.97 (5.60)
30.83 (6.48)
31.11 (4.58)
0.19 (52)
.853 31.07 (4.98)
30.69 (7.16)
0.20 (21)
.846 31.65 (6.11)
29.00 (3.14)
-2.15 (48)
.037
Environmental Mastery (7-42)*
28.76 (6.29)
29.37 (5.84)
28.11 (6.78)
-0.76 (56)
.451 28.45 (6.28)
29.56 (6.45)
-0.60 (56)
.553 29.05 (6.59)
27.93 (5.44)
-0.59 (56)
.560
Personal growth (7-42)*
29.9 (6.20)
29.98 (5.98)
30.00 (6.53)
0.02 (56)
.984 29.50 (5.99)
31.25 (6.73)
-0.96 (56)
.341 30.28 (6.13)
29.13 (6.52)
-0.61 (56)
.542
Positive relationships (7-42)*
31.62 (6.31)
31.53 (6.64)
31.71 (6.06)
0.11 (56)
.914 31.52 (5.75)
31.88 (7.80)
-0.16 (22)
.871 32.16 (6.08)
30.07 (6.91)
-1.11 (56)
.272
Purpose in life (7-42)*
29.35 (5.70)
28.50 (5.70)
30.36 (5.65)
1.21 (53)
.232 28.88 (5.11)
30.60 (7.08)
-1.00 (53)
.322 29.63 (6.01)
28.60 (4.90)
-0.59 (53)
.557
Self-acceptance (7-42)*
29.57 (6.90)
29.69 (7.23)
29.44 (6.67)
-0.13 (54)
.896 29.60 (6.90)
29.50 (7.15)
0.05 (54)
.961 29.80 (7.01)
28.93 (6.81)
-0.42 (54)
.680
PSI Stress (0-17)*
2.84 (2.41)
3.14 (2.64)
2.54 (2.15)
-0.94 (55)
.350 2.78 (2.35)
3.00 (2.63)
-0.31 (55)
.761 2.63 (2.23)
3.50 (2.90)
1.18 (55)
.243
Psychological distress (0-45)*
7.93 (5.66)
8.31 (5.76)
7.52 (5.63)
-0.52 (54)
.605 6.98 (5.58)
10.31 (5.30)
-2.05 (54)
.045 8.02 (5.92)
7.67 (5.05)
-0.21 (54)
.836
Global well-being (0-10)*
7.33 (1.70)
7.30 (1.66)
7.36 (1.73)
0.13 (56)
.898 7.33 (1.75)
7.31 (1.54)
0.04 (56)
.967 7.40 (1.79)
7.13 (1.36)
-0.52 (56)
.607
*Score range, bolded numbers represent the worst scores PSI = Psychosocial Index; PWBs = Psychological Well-Being scales; SQ = Symptom Questionnaire
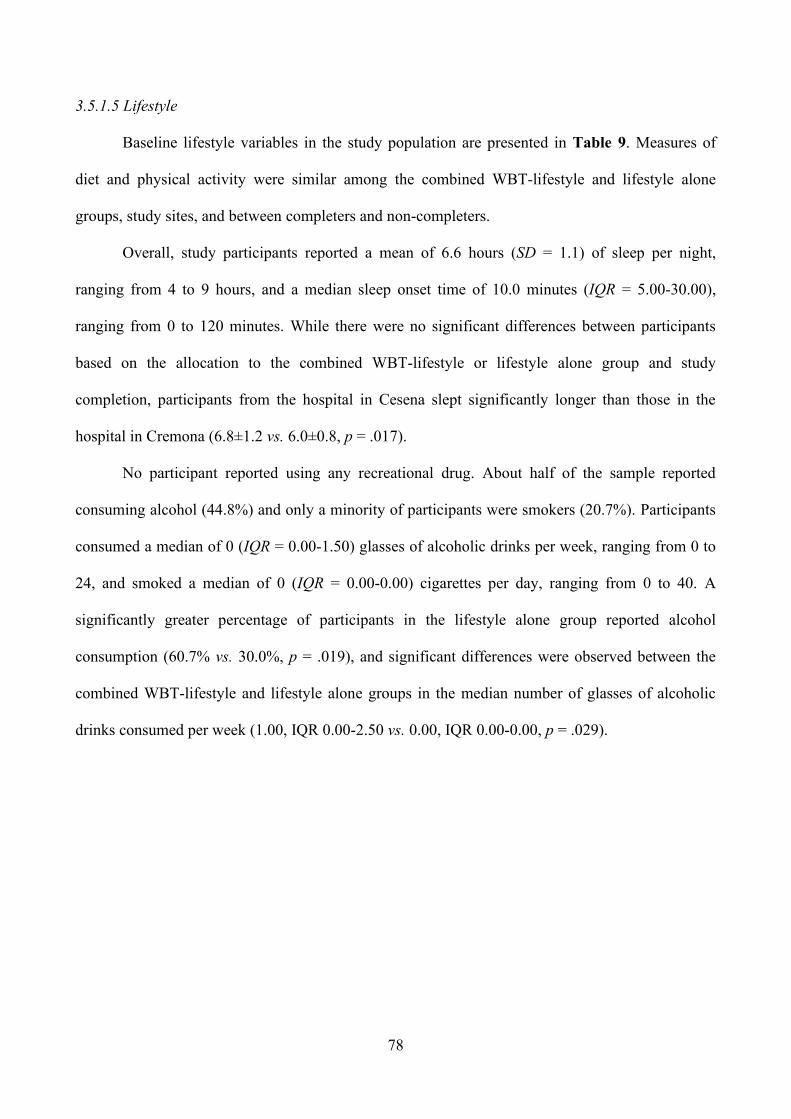
78
3.5.1.5 Lifestyle
Baseline lifestyle variables in the study population are presented in Table 9. Measures of
diet and physical activity were similar among the combined WBT-lifestyle and lifestyle alone
groups, study sites, and between completers and non-completers.
Overall, study participants reported a mean of 6.6 hours (SD = 1.1) of sleep per night,
ranging from 4 to 9 hours, and a median sleep onset time of 10.0 minutes (IQR = 5.00-30.00),
ranging from 0 to 120 minutes. While there were no significant differences between participants
based on the allocation to the combined WBT-lifestyle or lifestyle alone group and study
completion, participants from the hospital in Cesena slept significantly longer than those in the
hospital in Cremona (6.8±1.2 vs. 6.0±0.8, p = .017).
No participant reported using any recreational drug. About half of the sample reported
consuming alcohol (44.8%) and only a minority of participants were smokers (20.7%). Participants
consumed a median of 0 (IQR = 0.00-1.50) glasses of alcoholic drinks per week, ranging from 0 to
24, and smoked a median of 0 (IQR = 0.00-0.00) cigarettes per day, ranging from 0 to 40. A
significantly greater percentage of participants in the lifestyle alone group reported alcohol
consumption (60.7% vs. 30.0%, p = .019), and significant differences were observed between the
combined WBT-lifestyle and lifestyle alone groups in the median number of glasses of alcoholic
drinks consumed per week (1.00, IQR 0.00-2.50 vs. 0.00, IQR 0.00-0.00, p = .029).
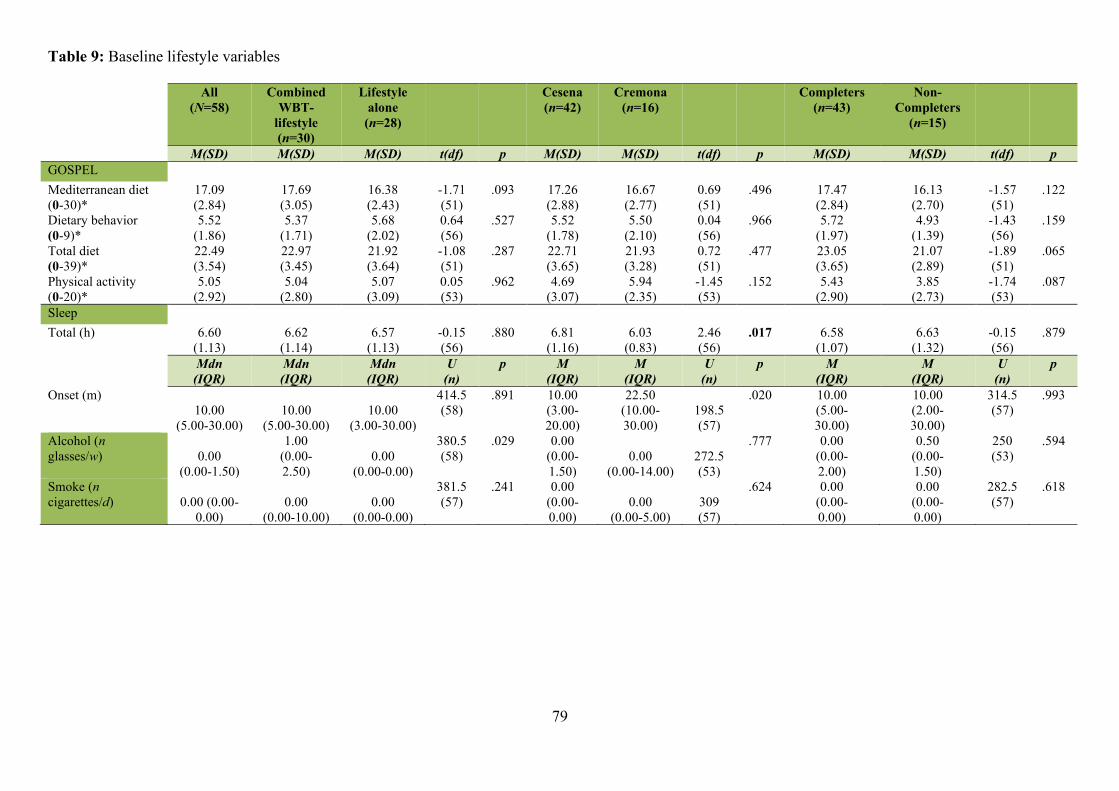
79
Table 9: Baseline lifestyle variables
All (N=58)
Combined WBT-
lifestyle (n=30)
Lifestyle alone
(n=28)
Cesena (n=42)
Cremona (n=16)
Completers (n=43)
Non-Completers
(n=15)
M(SD) M(SD) M(SD) t(df) p M(SD) M(SD) t(df) p M(SD) M(SD) t(df) p GOSPEL Mediterranean diet (0-30)*
17.09 (2.84)
17.69 (3.05)
16.38 (2.43)
-1.71 (51)
.093 17.26 (2.88)
16.67 (2.77)
0.69 (51)
.496 17.47 (2.84)
16.13 (2.70)
-1.57 (51)
.122
Dietary behavior (0-9)*
5.52 (1.86)
5.37 (1.71)
5.68 (2.02)
0.64 (56)
.527 5.52 (1.78)
5.50 (2.10)
0.04 (56)
.966 5.72 (1.97)
4.93 (1.39)
-1.43 (56)
.159
Total diet (0-39)*
22.49 (3.54)
22.97 (3.45)
21.92 (3.64)
-1.08 (51)
.287 22.71 (3.65)
21.93 (3.28)
0.72 (51)
.477 23.05 (3.65)
21.07 (2.89)
-1.89 (51)
.065
Physical activity (0-20)*
5.05 (2.92)
5.04 (2.80)
5.07 (3.09)
0.05 (53)
.962 4.69 (3.07)
5.94 (2.35)
-1.45 (53)
.152 5.43 (2.90)
3.85 (2.73)
-1.74 (53)
.087
Sleep Total (h) 6.60
(1.13) 6.62
(1.14) 6.57
(1.13) -0.15 (56)
.880 6.81 (1.16)
6.03 (0.83)
2.46 (56)
.017 6.58 (1.07)
6.63 (1.32)
-0.15 (56)
.879
Mdn (IQR)
Mdn (IQR)
Mdn (IQR)
U (n)
p M (IQR)
M (IQR)
U (n)
p M (IQR)
M (IQR)
U (n)
p
Onset (m) 10.00
(5.00-30.00) 10.00
(5.00-30.00) 10.00
(3.00-30.00)
414.5 (58)
.891
10.00 (3.00-20.00)
22.50 (10.00-30.00)
198.5 (57)
.020
10.00 (5.00- 30.00)
10.00 (2.00- 30.00)
314.5 (57)
.993
Alcohol (n glasses/w) 0.00
(0.00-1.50)
1.00 (0.00- 2.50)
0.00 (0.00-0.00)
380.5 (58)
.029
0.00 (0.00-1.50)
0.00 (0.00-14.00)
272.5 (53)
.777
0.00 (0.00- 2.00)
0.50 (0.00- 1.50)
250 (53)
.594
Smoke (n cigarettes/d) 0.00 (0.00-
0.00) 0.00
(0.00-10.00) 0.00
(0.00-0.00)
381.5 (57)
.241
0.00 (0.00-0.00)
0.00 (0.00-5.00)
309 (57)
.624
0.00 (0.00- 0.00)
0.00 (0.00- 0.00)
282.5 (57)
.618
80
Table 9: (continued)
All (N=58)
Combined WBT-lifestyle
(n=30)
Lifestyle alone
(n=28)
Cesena (n=42)
Cremona (n=16)
Completers (n=43)
Non-Completers
(n=15)
N (%) N (%) N (%) 2 (df)
p N (%) N (%) 2 (df)
p N (%) N (%) 2 (df)
p
Alcohol Yes 26 (44.8) 9
(30.0) 17 (60.7) 5.52
(1) .019 20 (47.6) 6
(37.5) 0.48 (1)
.489 18 (41.9)
8 (53.3)
0.59 (1)
.442
No 32 (55.2) 21 (70.0)
11 (39.3) 22 (52.4) 10 (62.5)
25 (58.1)
7 (46.7)
Smoke Yes 12 (20.7) 4
(13.3) 8
(28.6) 2.05 (1)
.152 8 (19.0) 4 (25.0)
0.25 (1)
.617 9 (20.9)
3 (20.0)
0.01 (1)
.939
No 46 (79.3) 26 (86.7)
20 (71.4) 34 (81.0) 12 (75.0)
34 (79.1)
12 (18.0)
Recreational drugs Yes 0 - - - - - - - - - No 100 - - - - - - - - - h = hours; m = minutes *Score range, bolded numbers represent the worst scores
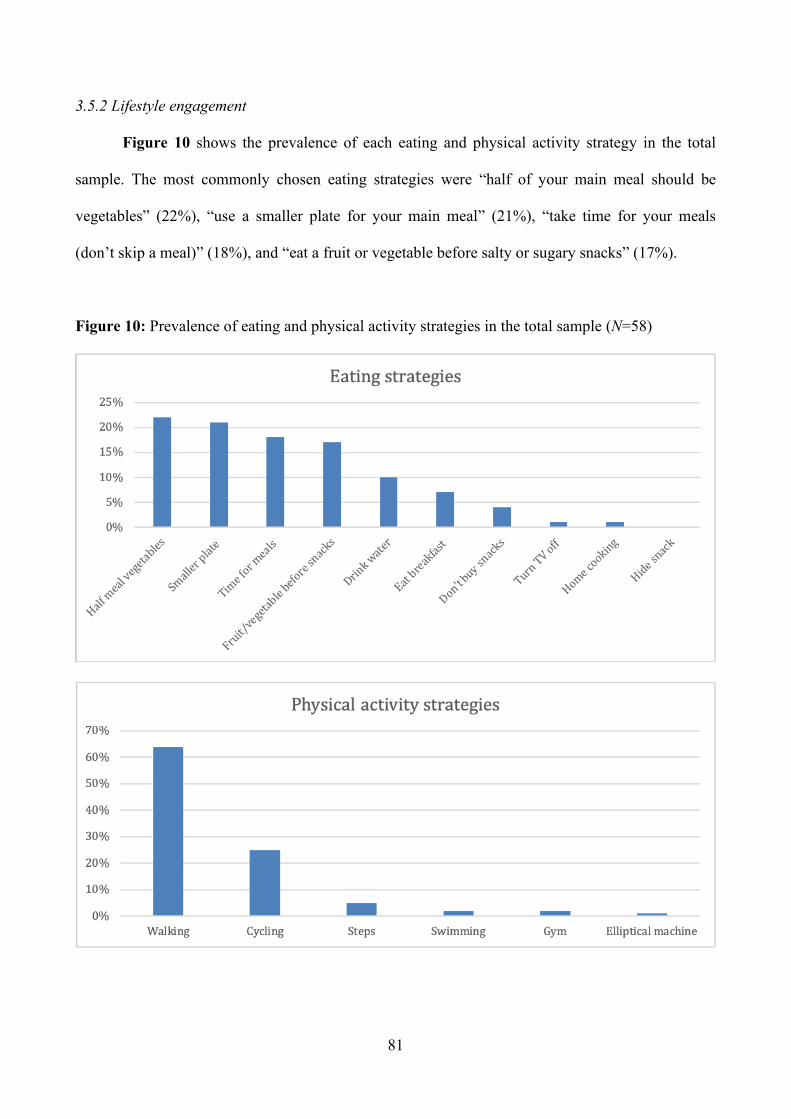
81
3.5.2 Lifestyle engagement
Figure 10 shows the prevalence of each eating and physical activity strategy in the total
sample. The most commonly chosen eating strategies were “half of your main meal should be
vegetables” (22%), “use a smaller plate for your main meal” (21%), “take time for your meals
(don’t skip a meal)” (18%), and “eat a fruit or vegetable before salty or sugary snacks” (17%).
Figure 10: Prevalence of eating and physical activity strategies in the total sample (N=58)
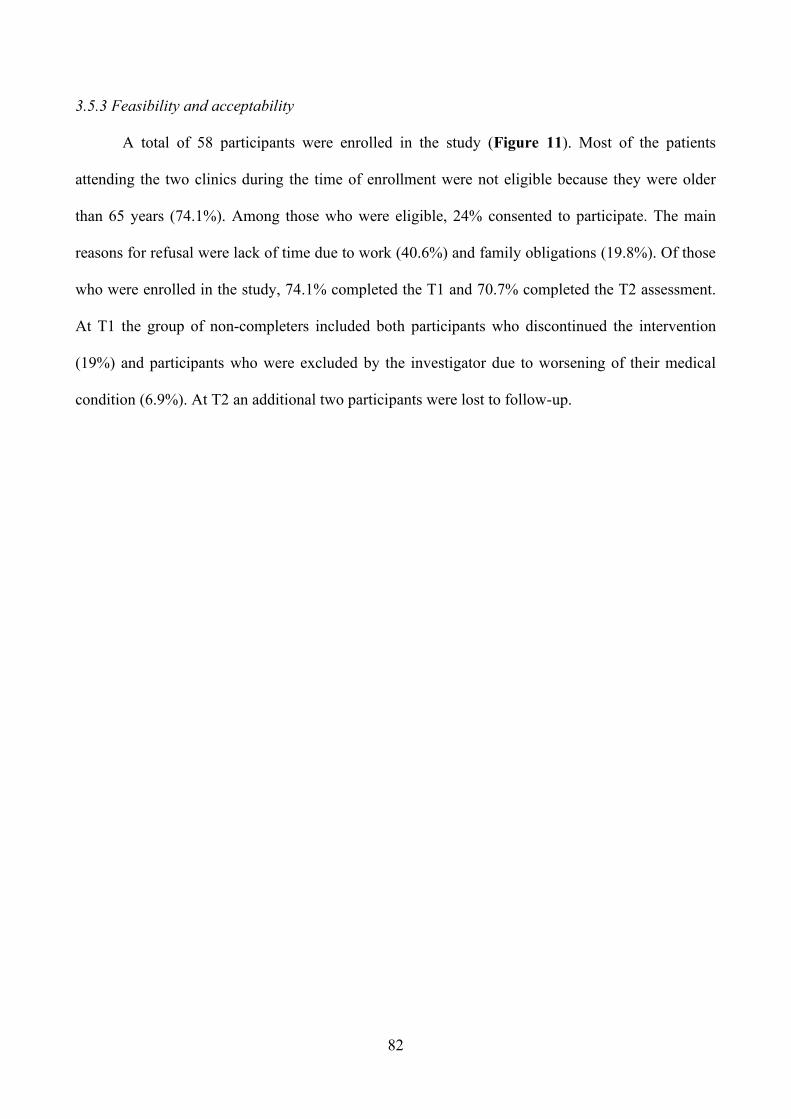
82
3.5.3 Feasibility and acceptability
A total of 58 participants were enrolled in the study (Figure 11). Most of the patients
attending the two clinics during the time of enrollment were not eligible because they were older
than 65 years (74.1%). Among those who were eligible, 24% consented to participate. The main
reasons for refusal were lack of time due to work (40.6%) and family obligations (19.8%). Of those
who were enrolled in the study, 74.1% completed the T1 and 70.7% completed the T2 assessment.
At T1 the group of non-completers included both participants who discontinued the intervention
(19%) and participants who were excluded by the investigator due to worsening of their medical
condition (6.9%). At T2 an additional two participants were lost to follow-up.
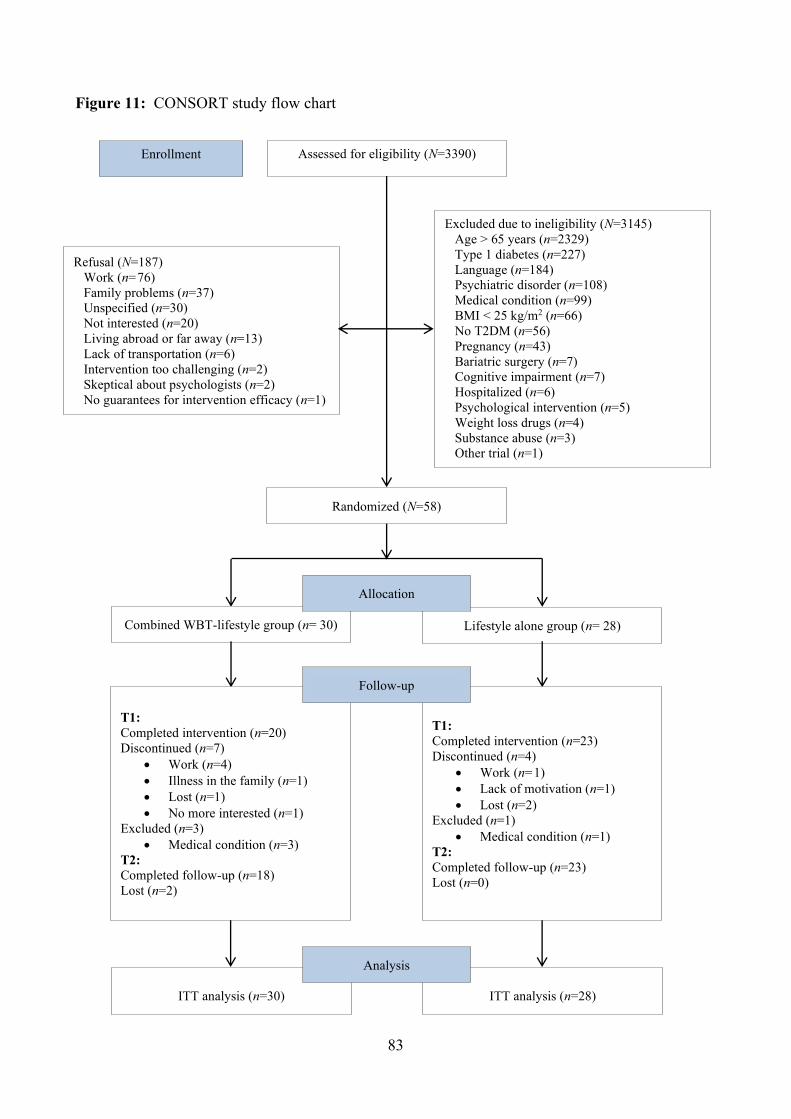
83
Figure 11: CONSORT study flow chart
Assessed for eligibility (N=3390) Enrollment
Excluded due to ineligibility (N=3145) Age > 65 years (n=2329) Type 1 diabetes (n=227) Language (n=184) Psychiatric disorder (n=108) Medical condition (n=99) BMI < 25 kg/m2 (n=66) No T2DM (n=56) Pregnancy (n=43) Bariatric surgery (n=7) Cognitive impairment (n=7) Hospitalized (n=6) Psychological intervention (n=5) Weight loss drugs (n=4) Substance abuse (n=3) Other trial (n=1)
Randomized (N=58)
Refusal (N=187) Work (n=76) Family problems (n=37) Unspecified (n=30) Not interested (n=20) Living abroad or far away (n=13) Lack of transportation (n=6) Intervention too challenging (n=2) Skeptical about psychologists (n=2) No guarantees for intervention efficacy (n=1)
Combined WBT-lifestyle group (n= 30) Lifestyle alone group (n= 28)
Allocation
ITT analysis (n=30)
ITT analysis (n=28)
Analysis
T1: Completed intervention (n=20) Discontinued (n=7)
• Work (n=4) • Illness in the family (n=1) • Lost (n=1) • No more interested (n=1)
Excluded (n=3) • Medical condition (n=3)
T2: Completed follow-up (n=18) Lost (n=2)
T1: Completed intervention (n=23) Discontinued (n=4)
• Work (n=1) • Lack of motivation (n=1) • Lost (n=2)
Excluded (n=1) • Medical condition (n=1)
T2: Completed follow-up (n=23) Lost (n=0)
Follow-up
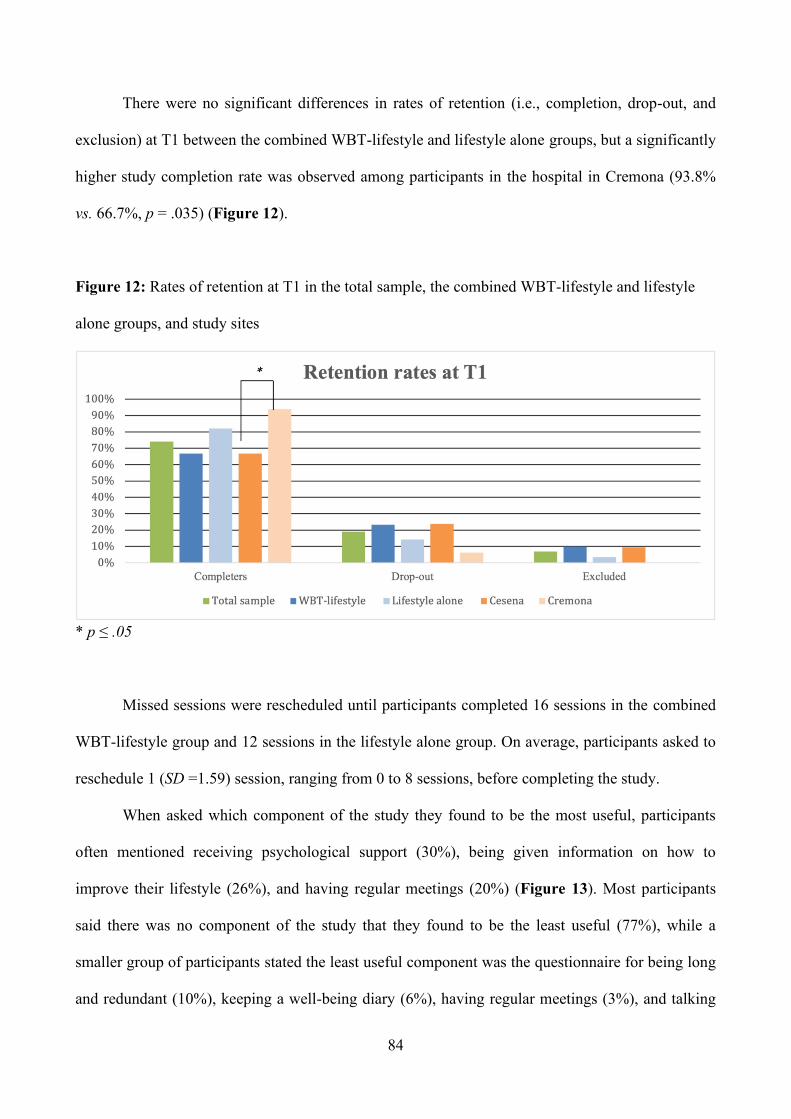
84
There were no significant differences in rates of retention (i.e., completion, drop-out, and
exclusion) at T1 between the combined WBT-lifestyle and lifestyle alone groups, but a significantly
higher study completion rate was observed among participants in the hospital in Cremona (93.8%
vs. 66.7%, p = .035) (Figure 12).
Figure 12: Rates of retention at T1 in the total sample, the combined WBT-lifestyle and lifestyle
alone groups, and study sites
* p ≤ .05
Missed sessions were rescheduled until participants completed 16 sessions in the combined
WBT-lifestyle group and 12 sessions in the lifestyle alone group. On average, participants asked to
reschedule 1 (SD =1.59) session, ranging from 0 to 8 sessions, before completing the study.
When asked which component of the study they found to be the most useful, participants
often mentioned receiving psychological support (30%), being given information on how to
improve their lifestyle (26%), and having regular meetings (20%) (Figure 13). Most participants
said there was no component of the study that they found to be the least useful (77%), while a
smaller group of participants stated the least useful component was the questionnaire for being long
and redundant (10%), keeping a well-being diary (6%), having regular meetings (3%), and talking
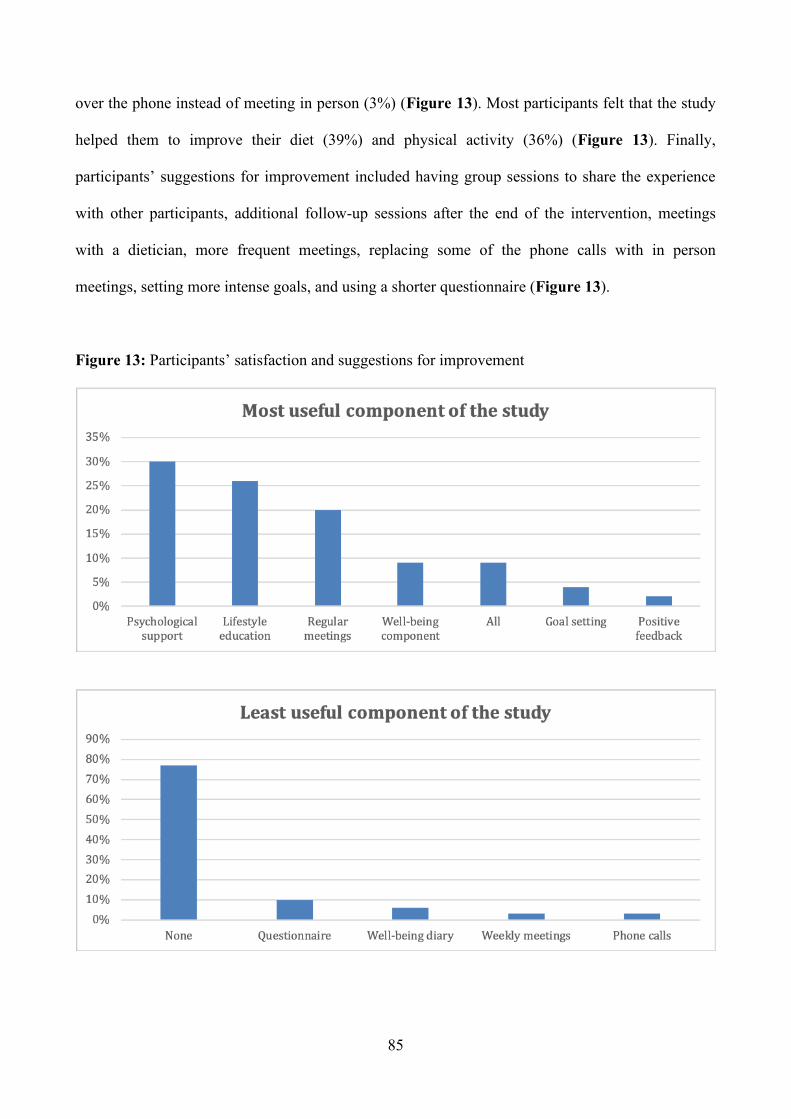
85
over the phone instead of meeting in person (3%) (Figure 13). Most participants felt that the study
helped them to improve their diet (39%) and physical activity (36%) (Figure 13). Finally,
participants’ suggestions for improvement included having group sessions to share the experience
with other participants, additional follow-up sessions after the end of the intervention, meetings
with a dietician, more frequent meetings, replacing some of the phone calls with in person
meetings, setting more intense goals, and using a shorter questionnaire (Figure 13).
Figure 13: Participants’ satisfaction and suggestions for improvement
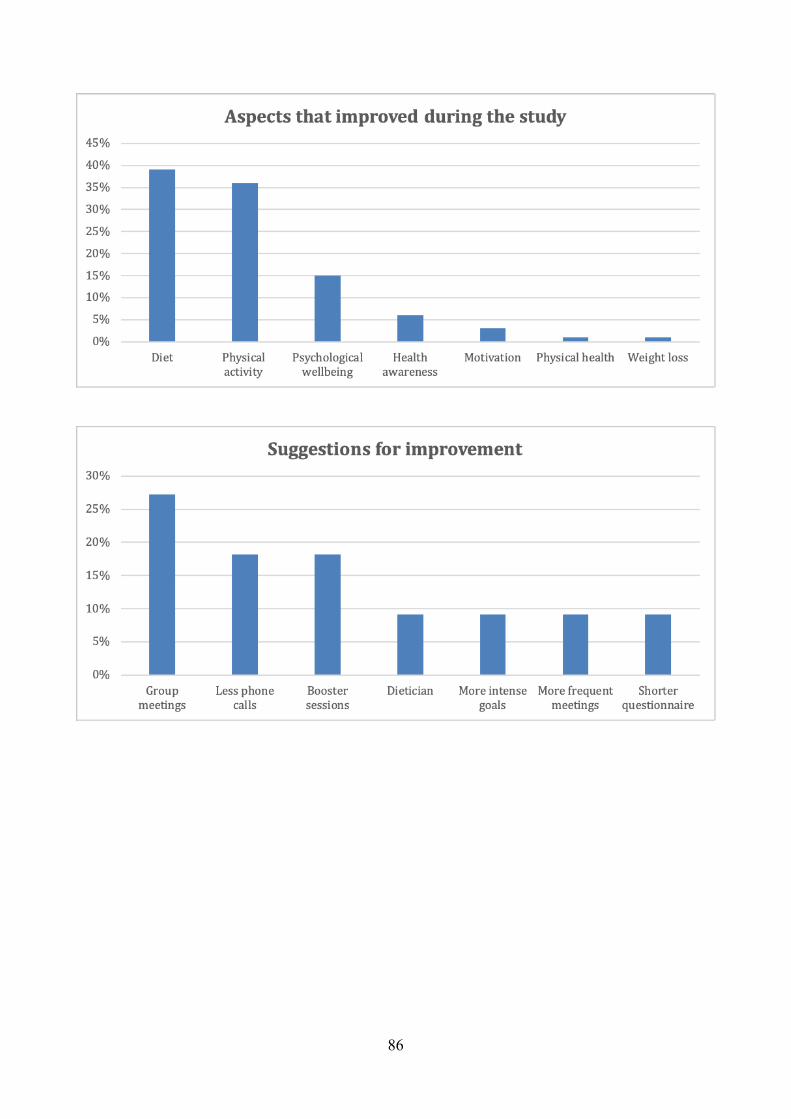
86
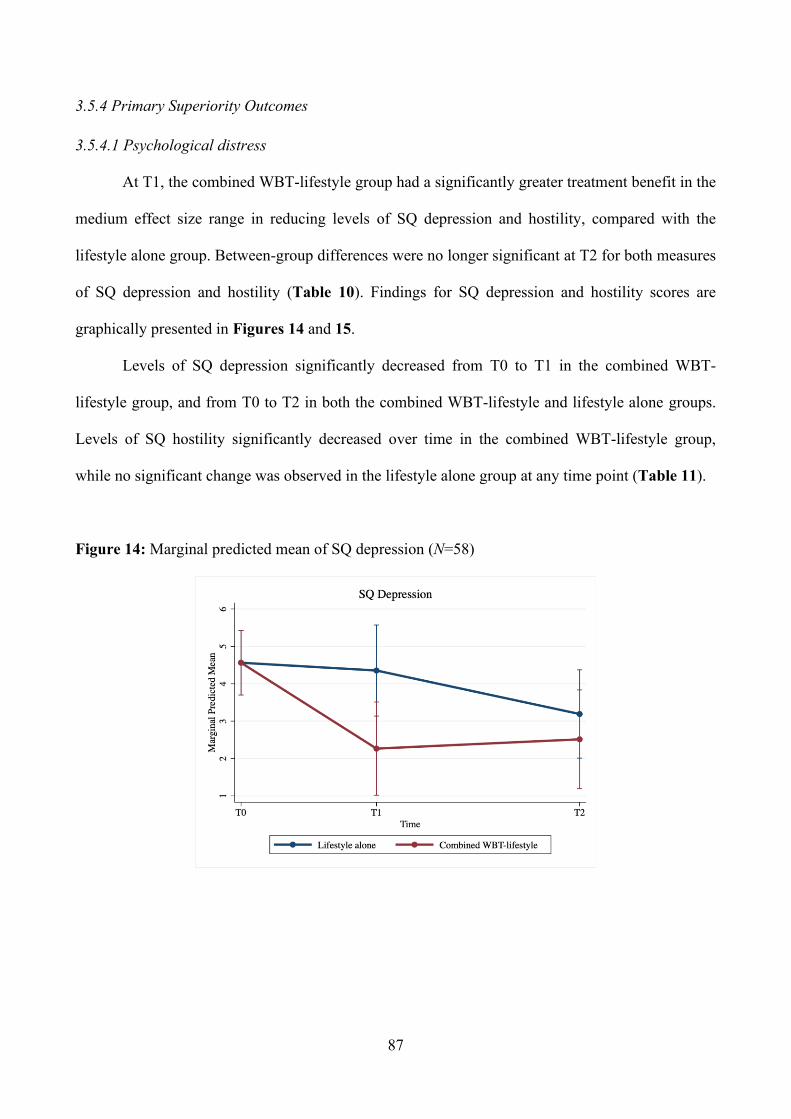
87
3.5.4 Primary Superiority Outcomes
3.5.4.1 Psychological distress
At T1, the combined WBT-lifestyle group had a significantly greater treatment benefit in the
medium effect size range in reducing levels of SQ depression and hostility, compared with the
lifestyle alone group. Between-group differences were no longer significant at T2 for both measures
of SQ depression and hostility (Table 10). Findings for SQ depression and hostility scores are
graphically presented in Figures 14 and 15.
Levels of SQ depression significantly decreased from T0 to T1 in the combined WBT-
lifestyle group, and from T0 to T2 in both the combined WBT-lifestyle and lifestyle alone groups.
Levels of SQ hostility significantly decreased over time in the combined WBT-lifestyle group,
while no significant change was observed in the lifestyle alone group at any time point (Table 11).
Figure 14: Marginal predicted mean of SQ depression (N=58)
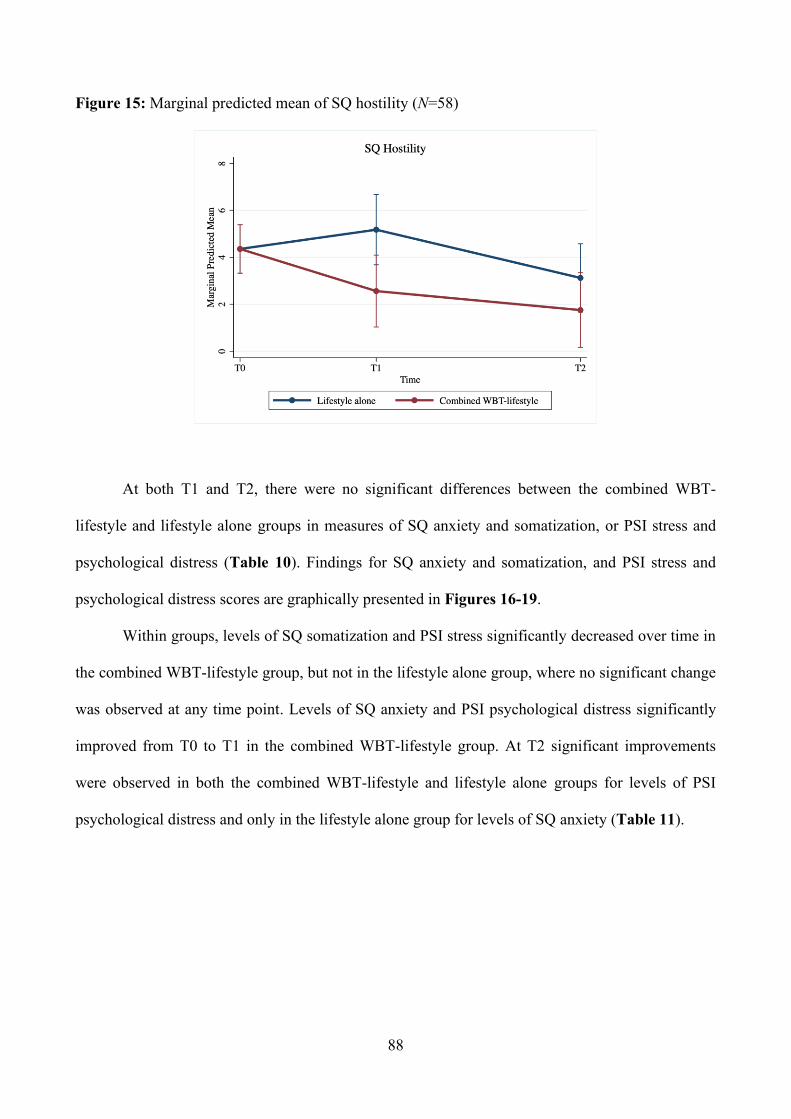
88
Figure 15: Marginal predicted mean of SQ hostility (N=58)
At both T1 and T2, there were no significant differences between the combined WBT-
lifestyle and lifestyle alone groups in measures of SQ anxiety and somatization, or PSI stress and
psychological distress (Table 10). Findings for SQ anxiety and somatization, and PSI stress and
psychological distress scores are graphically presented in Figures 16-19.
Within groups, levels of SQ somatization and PSI stress significantly decreased over time in
the combined WBT-lifestyle group, but not in the lifestyle alone group, where no significant change
was observed at any time point. Levels of SQ anxiety and PSI psychological distress significantly
improved from T0 to T1 in the combined WBT-lifestyle group. At T2 significant improvements
were observed in both the combined WBT-lifestyle and lifestyle alone groups for levels of PSI
psychological distress and only in the lifestyle alone group for levels of SQ anxiety (Table 11).
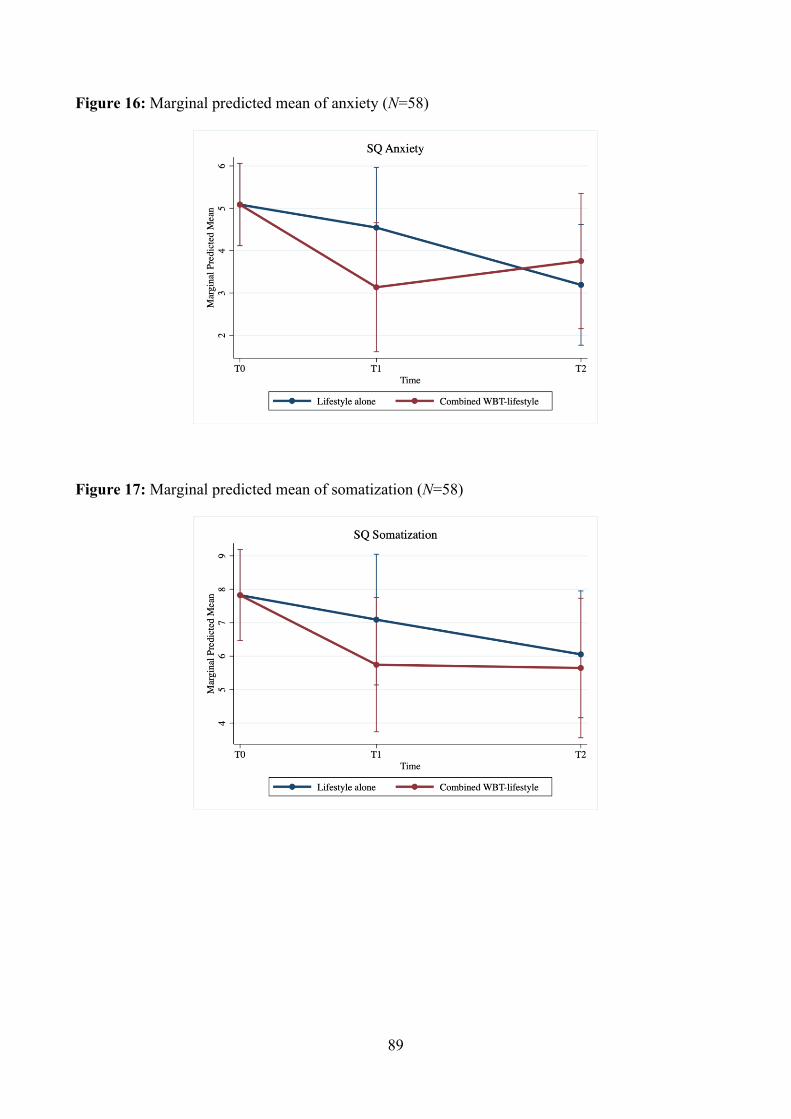
89
Figure 16: Marginal predicted mean of anxiety (N=58)
Figure 17: Marginal predicted mean of somatization (N=58)
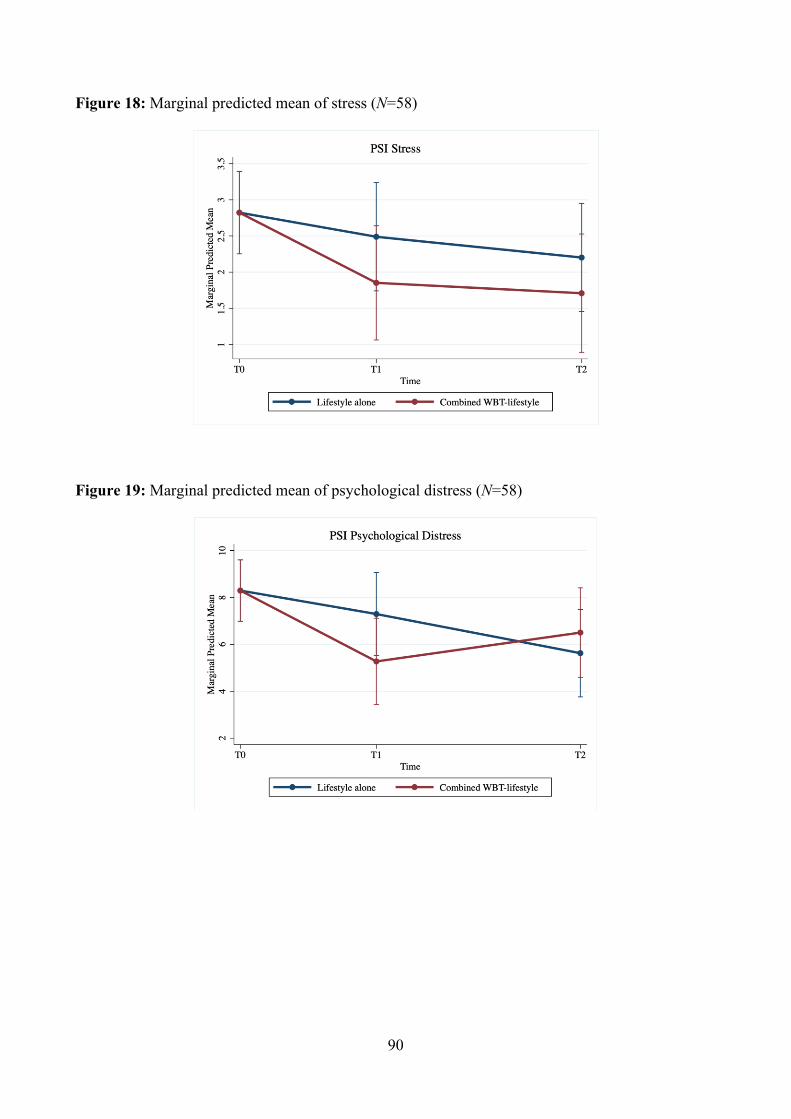
90
Figure 18: Marginal predicted mean of stress (N=58)
Figure 19: Marginal predicted mean of psychological distress (N=58)
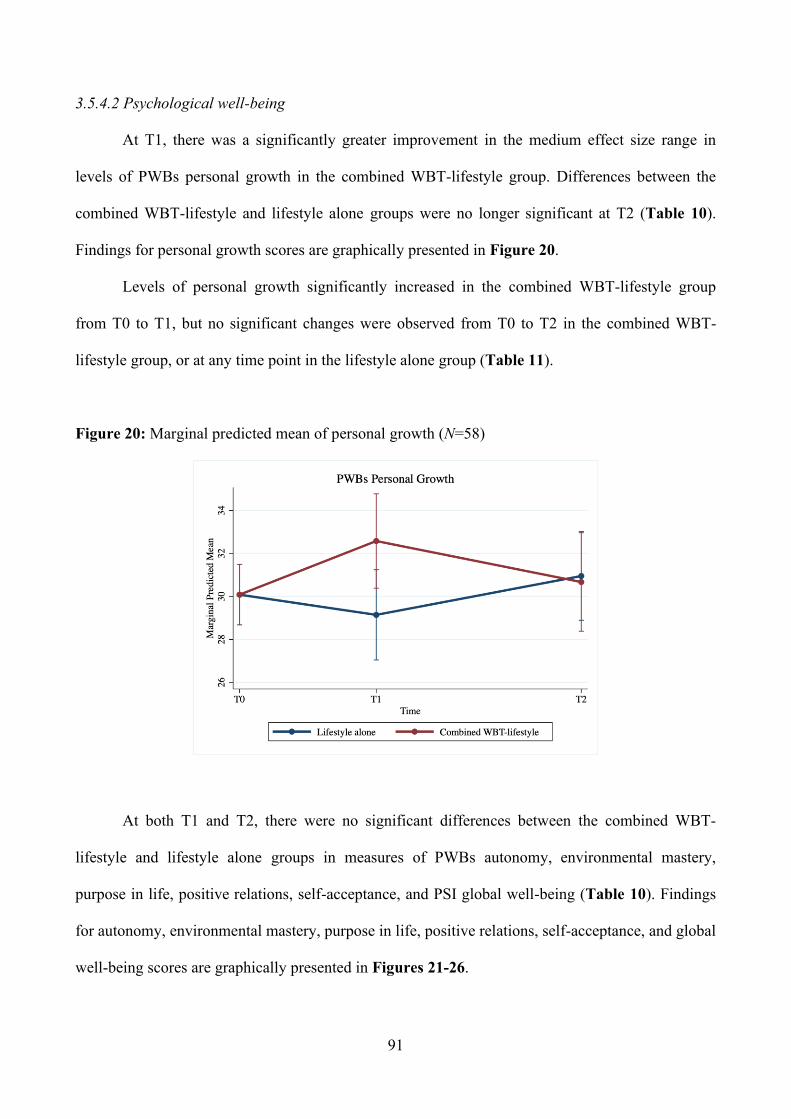
91
3.5.4.2 Psychological well-being
At T1, there was a significantly greater improvement in the medium effect size range in
levels of PWBs personal growth in the combined WBT-lifestyle group. Differences between the
combined WBT-lifestyle and lifestyle alone groups were no longer significant at T2 (Table 10).
Findings for personal growth scores are graphically presented in Figure 20.
Levels of personal growth significantly increased in the combined WBT-lifestyle group
from T0 to T1, but no significant changes were observed from T0 to T2 in the combined WBT-
lifestyle group, or at any time point in the lifestyle alone group (Table 11).
Figure 20: Marginal predicted mean of personal growth (N=58)
At both T1 and T2, there were no significant differences between the combined WBT-
lifestyle and lifestyle alone groups in measures of PWBs autonomy, environmental mastery,
purpose in life, positive relations, self-acceptance, and PSI global well-being (Table 10). Findings
for autonomy, environmental mastery, purpose in life, positive relations, self-acceptance, and global
well-being scores are graphically presented in Figures 21-26.
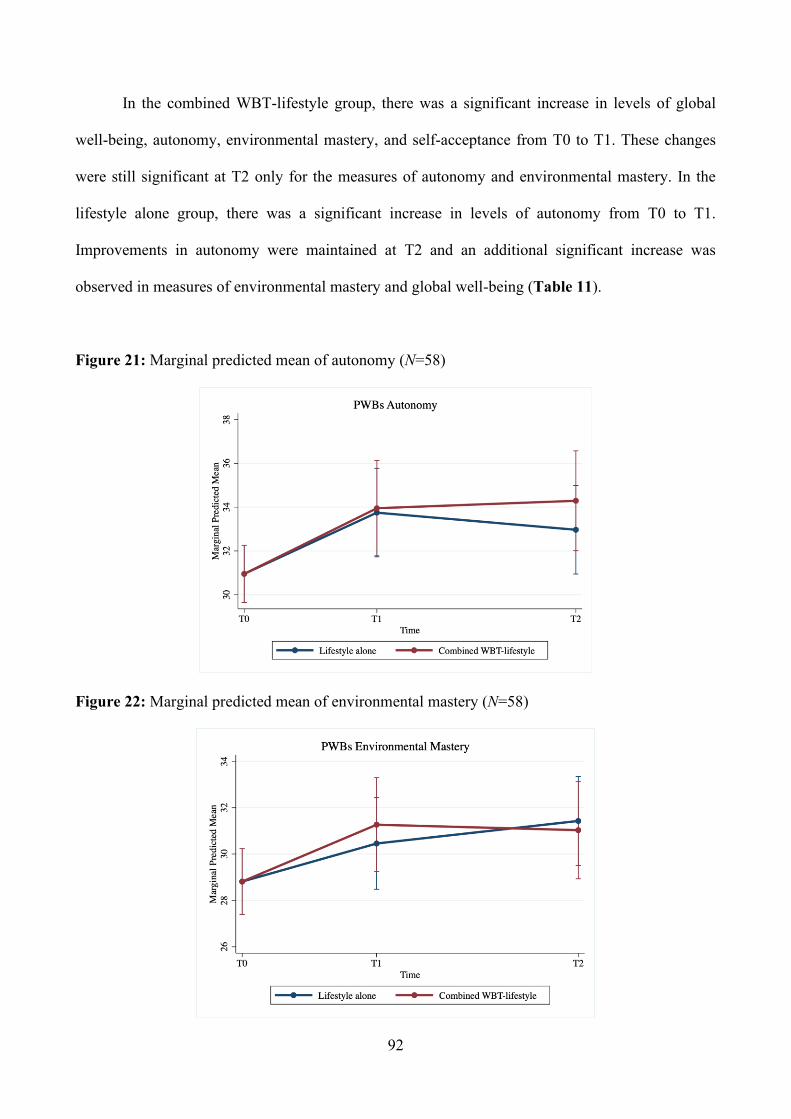
92
In the combined WBT-lifestyle group, there was a significant increase in levels of global
well-being, autonomy, environmental mastery, and self-acceptance from T0 to T1. These changes
were still significant at T2 only for the measures of autonomy and environmental mastery. In the
lifestyle alone group, there was a significant increase in levels of autonomy from T0 to T1.
Improvements in autonomy were maintained at T2 and an additional significant increase was
observed in measures of environmental mastery and global well-being (Table 11).
Figure 21: Marginal predicted mean of autonomy (N=58)
Figure 22: Marginal predicted mean of environmental mastery (N=58)
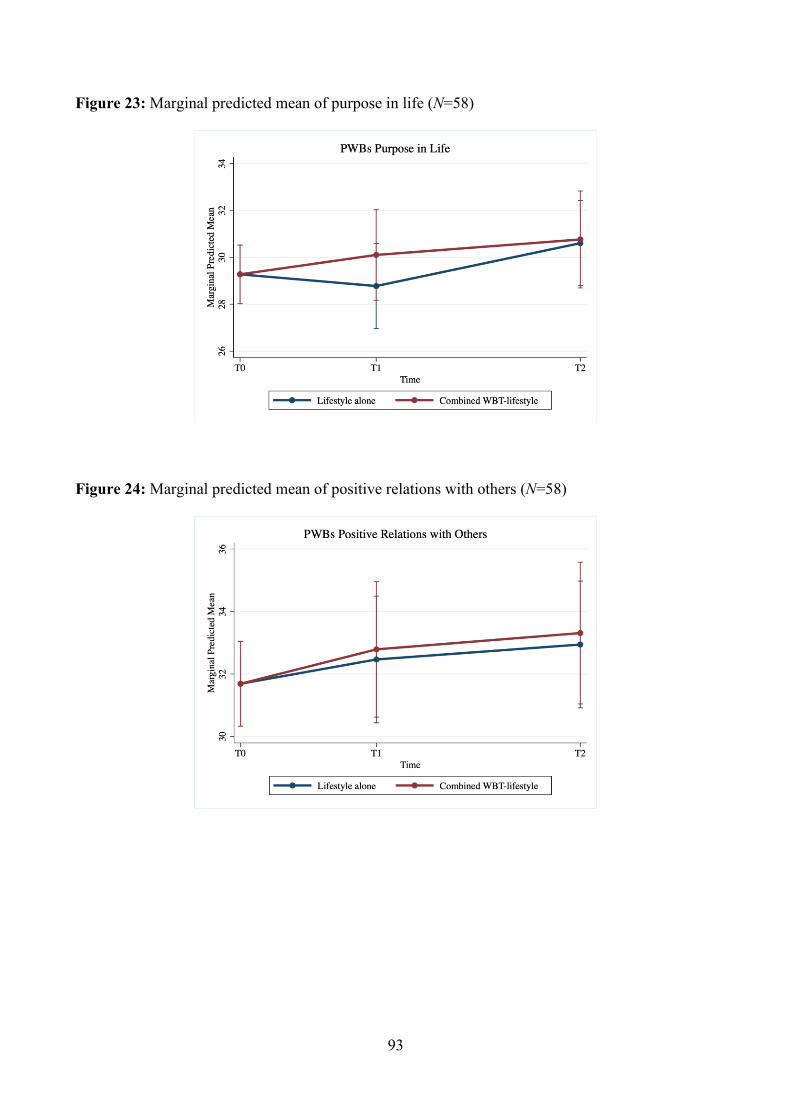
93
Figure 23: Marginal predicted mean of purpose in life (N=58)
Figure 24: Marginal predicted mean of positive relations with others (N=58)
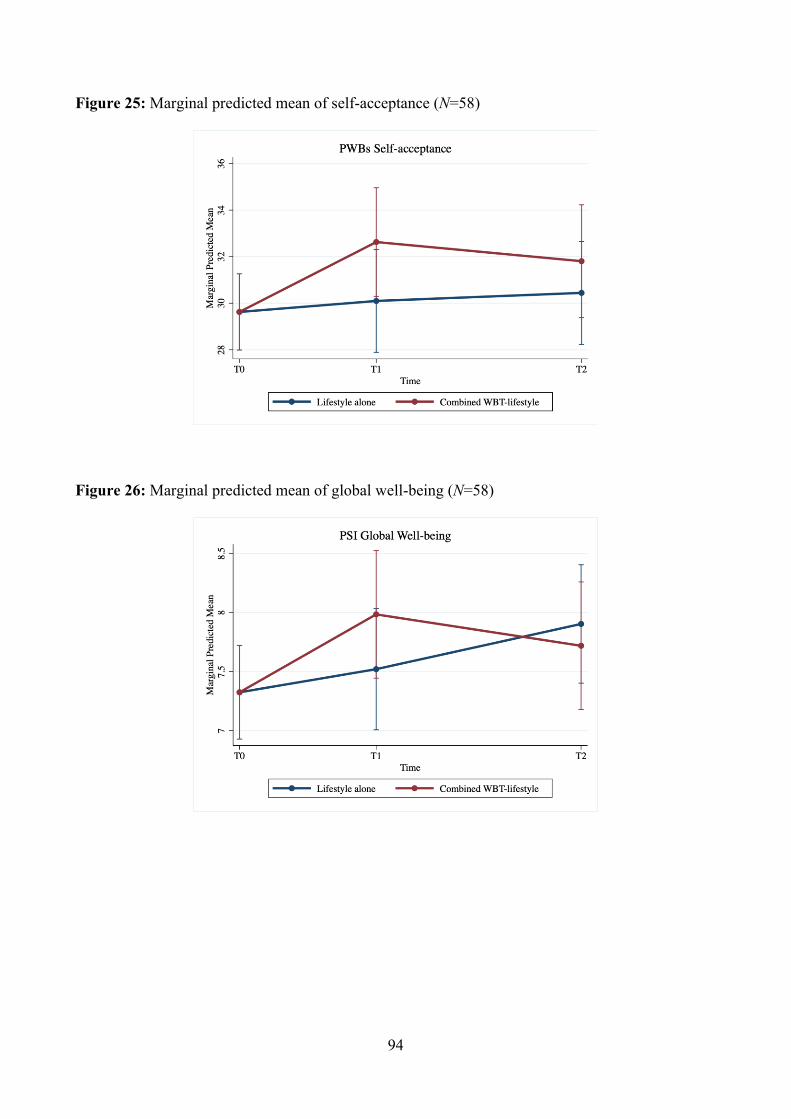
94
Figure 25: Marginal predicted mean of self-acceptance (N=58)
Figure 26: Marginal predicted mean of global well-being (N=58)
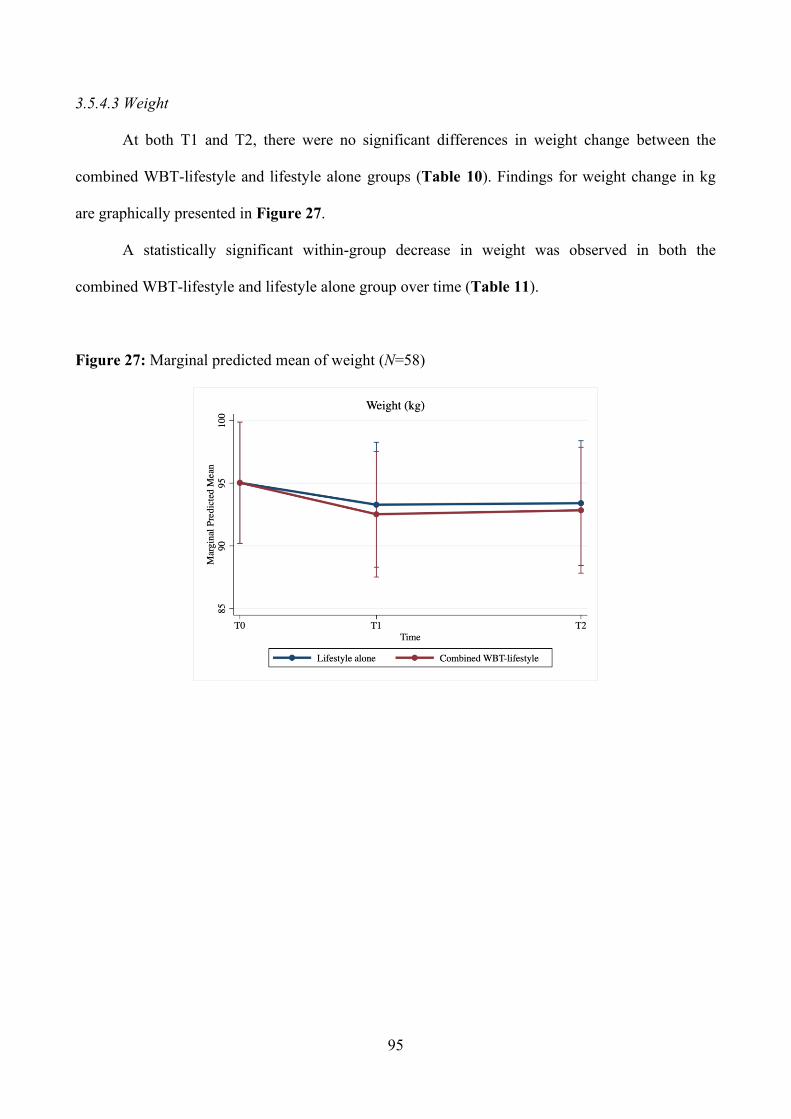
95
3.5.4.3 Weight
At both T1 and T2, there were no significant differences in weight change between the
combined WBT-lifestyle and lifestyle alone groups (Table 10). Findings for weight change in kg
are graphically presented in Figure 27.
A statistically significant within-group decrease in weight was observed in both the
combined WBT-lifestyle and lifestyle alone group over time (Table 11).
Figure 27: Marginal predicted mean of weight (N=58)
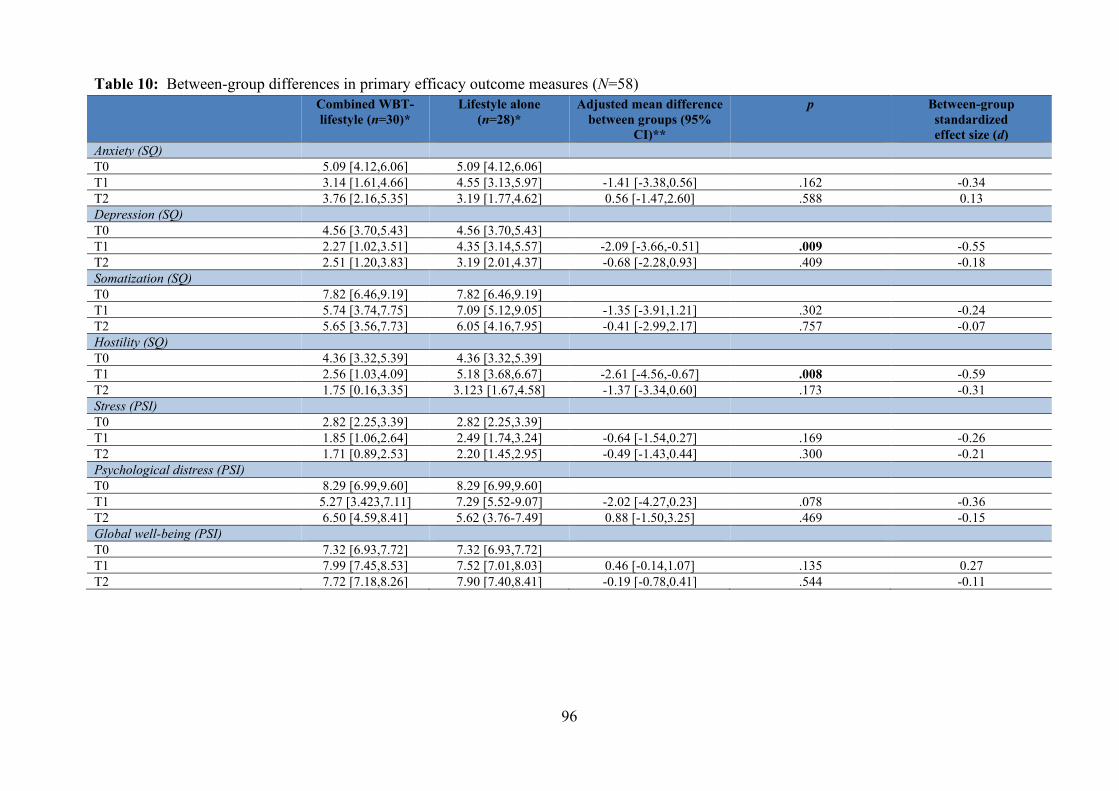
96
Table 10: Between-group differences in primary efficacy outcome measures (N=58) Combined WBT-
lifestyle (n=30)*
Lifestyle alone (n=28)*
Adjusted mean difference between groups (95%
CI)**
p Between-group standardized effect size (d)
Anxiety (SQ) T0 5.09 [4.12,6.06] 5.09 [4.12,6.06] T1 3.14 [1.61,4.66] 4.55 [3.13,5.97] -1.41 [-3.38,0.56] .162 -0.34 T2 3.76 [2.16,5.35] 3.19 [1.77,4.62] 0.56 [-1.47,2.60] .588 0.13 Depression (SQ) T0 4.56 [3.70,5.43] 4.56 [3.70,5.43] T1 2.27 [1.02,3.51] 4.35 [3.14,5.57] -2.09 [-3.66,-0.51] .009 -0.55 T2 2.51 [1.20,3.83] 3.19 [2.01,4.37] -0.68 [-2.28,0.93] .409 -0.18 Somatization (SQ) T0 7.82 [6.46,9.19] 7.82 [6.46,9.19] T1 5.74 [3.74,7.75] 7.09 [5.12,9.05] -1.35 [-3.91,1.21] .302 -0.24 T2 5.65 [3.56,7.73] 6.05 [4.16,7.95] -0.41 [-2.99,2.17] .757 -0.07 Hostility (SQ) T0 4.36 [3.32,5.39] 4.36 [3.32,5.39] T1 2.56 [1.03,4.09] 5.18 [3.68,6.67] -2.61 [-4.56,-0.67] .008 -0.59 T2 1.75 [0.16,3.35] 3.123 [1.67,4.58] -1.37 [-3.34,0.60] .173 -0.31 Stress (PSI) T0 2.82 [2.25,3.39] 2.82 [2.25,3.39] T1 1.85 [1.06,2.64] 2.49 [1.74,3.24] -0.64 [-1.54,0.27] .169 -0.26 T2 1.71 [0.89,2.53] 2.20 [1.45,2.95] -0.49 [-1.43,0.44] .300 -0.21 Psychological distress (PSI) T0 8.29 [6.99,9.60] 8.29 [6.99,9.60] T1 5.27 [3.423,7.11] 7.29 [5.52-9.07] -2.02 [-4.27,0.23] .078 -0.36 T2 6.50 [4.59,8.41] 5.62 (3.76-7.49] 0.88 [-1.50,3.25] .469 -0.15 Global well-being (PSI) T0 7.32 [6.93,7.72] 7.32 [6.93,7.72] T1 7.99 [7.45,8.53] 7.52 [7.01,8.03] 0.46 [-0.14,1.07] .135 0.27 T2 7.72 [7.18,8.26] 7.90 [7.40,8.41] -0.19 [-0.78,0.41] .544 -0.11
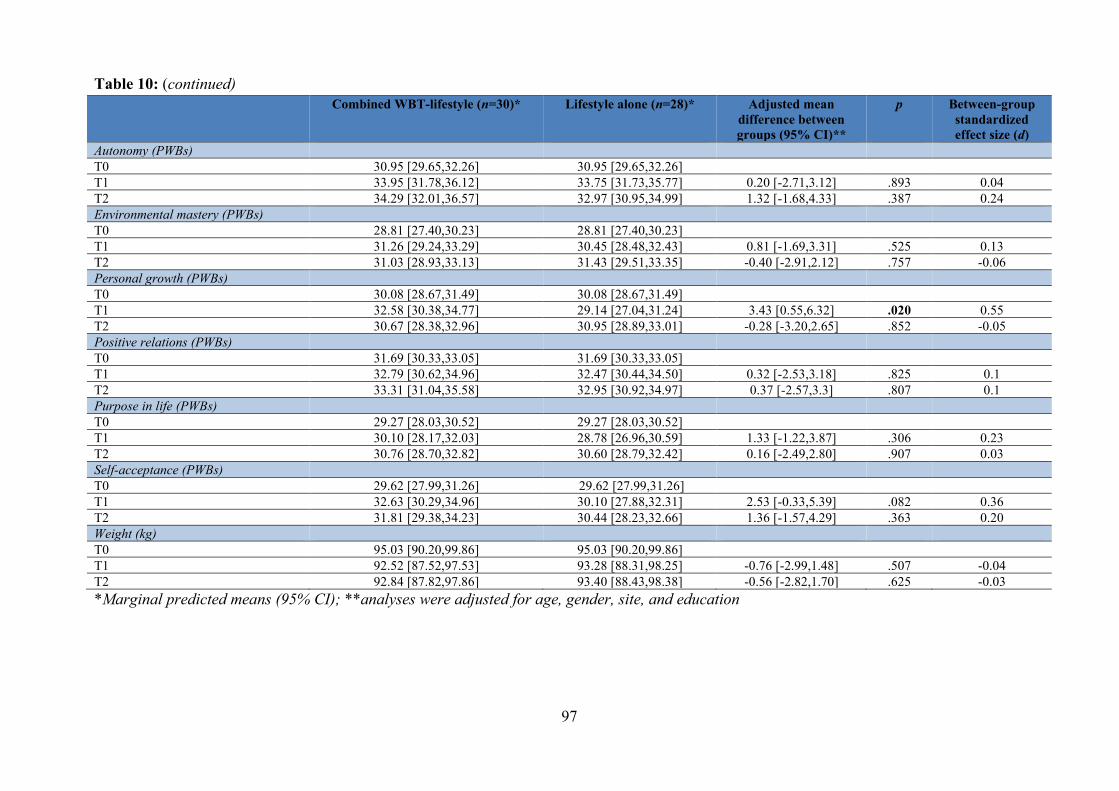
97
Table 10: (continued) Combined WBT-lifestyle (n=30)*
Lifestyle alone (n=28)* Adjusted mean
difference between groups (95% CI)**
p Between-group standardized effect size (d)
Autonomy (PWBs) T0 30.95 [29.65,32.26] 30.95 [29.65,32.26] T1 33.95 [31.78,36.12] 33.75 [31.73,35.77] 0.20 [-2.71,3.12] .893 0.04 T2 34.29 [32.01,36.57] 32.97 [30.95,34.99] 1.32 [-1.68,4.33] .387 0.24 Environmental mastery (PWBs) T0 28.81 [27.40,30.23] 28.81 [27.40,30.23] T1 31.26 [29.24,33.29] 30.45 [28.48,32.43] 0.81 [-1.69,3.31] .525 0.13 T2 31.03 [28.93,33.13] 31.43 [29.51,33.35] -0.40 [-2.91,2.12] .757 -0.06 Personal growth (PWBs) T0 30.08 [28.67,31.49] 30.08 [28.67,31.49] T1 32.58 [30.38,34.77] 29.14 [27.04,31.24] 3.43 [0.55,6.32] .020 0.55 T2 30.67 [28.38,32.96] 30.95 [28.89,33.01] -0.28 [-3.20,2.65] .852 -0.05 Positive relations (PWBs) T0 31.69 [30.33,33.05] 31.69 [30.33,33.05] T1 32.79 [30.62,34.96] 32.47 [30.44,34.50] 0.32 [-2.53,3.18] .825 0.1 T2 33.31 [31.04,35.58] 32.95 [30.92,34.97] 0.37 [-2.57,3.3] .807 0.1 Purpose in life (PWBs) T0 29.27 [28.03,30.52] 29.27 [28.03,30.52] T1 30.10 [28.17,32.03] 28.78 [26.96,30.59] 1.33 [-1.22,3.87] .306 0.23 T2 30.76 [28.70,32.82] 30.60 [28.79,32.42] 0.16 [-2.49,2.80] .907 0.03 Self-acceptance (PWBs) T0 29.62 [27.99,31.26] 29.62 [27.99,31.26] T1 32.63 [30.29,34.96] 30.10 [27.88,32.31] 2.53 [-0.33,5.39] .082 0.36 T2 31.81 [29.38,34.23] 30.44 [28.23,32.66] 1.36 [-1.57,4.29] .363 0.20 Weight (kg) T0 95.03 [90.20,99.86] 95.03 [90.20,99.86] T1 92.52 [87.52,97.53] 93.28 [88.31,98.25] -0.76 [-2.99,1.48] .507 -0.04 T2 92.84 [87.82,97.86] 93.40 [88.43,98.38] -0.56 [-2.82,1.70] .625 -0.03 *Marginal predicted means (95% CI); **analyses were adjusted for age, gender, site, and education
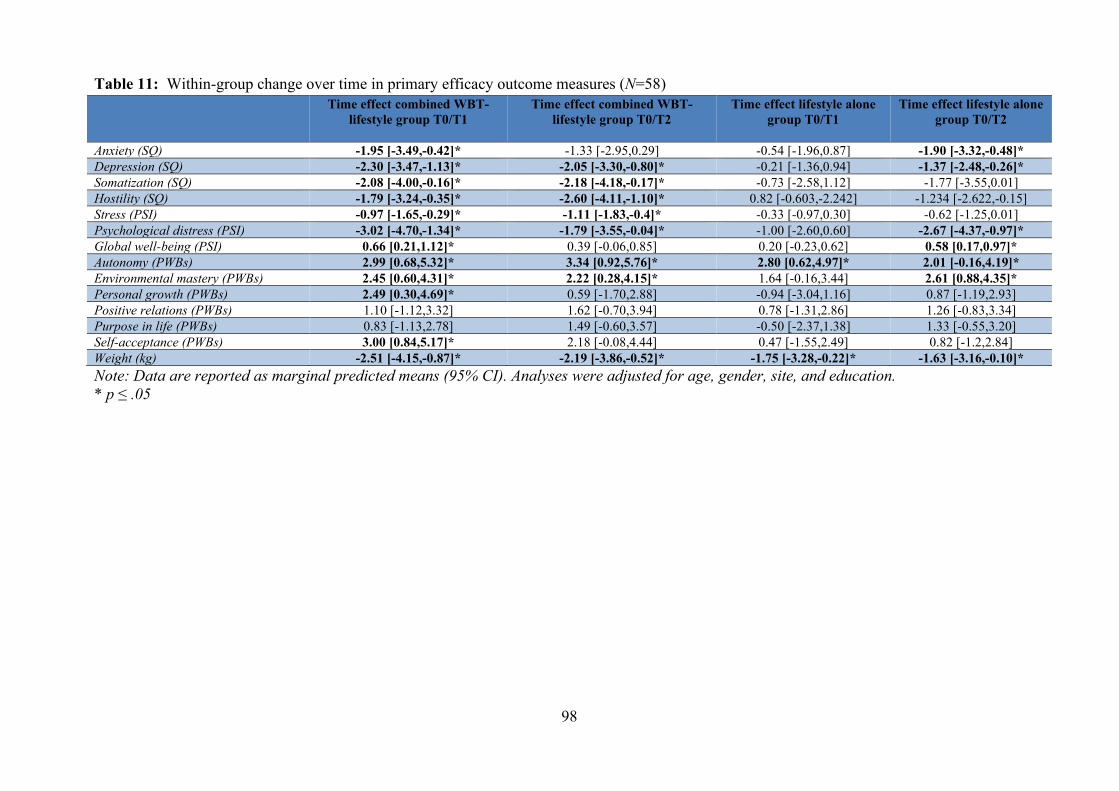
98
Table 11: Within-group change over time in primary efficacy outcome measures (N=58) Time effect combined WBT-
lifestyle group T0/T1
Time effect combined WBT-lifestyle group T0/T2
Time effect lifestyle alone group T0/T1
Time effect lifestyle alone group T0/T2
Anxiety (SQ) -1.95 [-3.49,-0.42]* -1.33 [-2.95,0.29] -0.54 [-1.96,0.87] -1.90 [-3.32,-0.48]* Depression (SQ) -2.30 [-3.47,-1.13]* -2.05 [-3.30,-0.80]* -0.21 [-1.36,0.94] -1.37 [-2.48,-0.26]* Somatization (SQ) -2.08 [-4.00,-0.16]* -2.18 [-4.18,-0.17]* -0.73 [-2.58,1.12] -1.77 [-3.55,0.01] Hostility (SQ) -1.79 [-3.24,-0.35]* -2.60 [-4.11,-1.10]* 0.82 [-0.603,-2.242] -1.234 [-2.622,-0.15] Stress (PSI) -0.97 [-1.65,-0.29]* -1.11 [-1.83,-0.4]* -0.33 [-0.97,0.30] -0.62 [-1.25,0.01] Psychological distress (PSI) -3.02 [-4.70,-1.34]* -1.79 [-3.55,-0.04]* -1.00 [-2.60,0.60] -2.67 [-4.37,-0.97]* Global well-being (PSI) 0.66 [0.21,1.12]* 0.39 [-0.06,0.85] 0.20 [-0.23,0.62] 0.58 [0.17,0.97]* Autonomy (PWBs) 2.99 [0.68,5.32]* 3.34 [0.92,5.76]* 2.80 [0.62,4.97]* 2.01 [-0.16,4.19]* Environmental mastery (PWBs) 2.45 [0.60,4.31]* 2.22 [0.28,4.15]* 1.64 [-0.16,3.44] 2.61 [0.88,4.35]* Personal growth (PWBs) 2.49 [0.30,4.69]* 0.59 [-1.70,2.88] -0.94 [-3.04,1.16] 0.87 [-1.19,2.93] Positive relations (PWBs) 1.10 [-1.12,3.32] 1.62 [-0.70,3.94] 0.78 [-1.31,2.86] 1.26 [-0.83,3.34] Purpose in life (PWBs) 0.83 [-1.13,2.78] 1.49 [-0.60,3.57] -0.50 [-2.37,1.38] 1.33 [-0.55,3.20] Self-acceptance (PWBs) 3.00 [0.84,5.17]* 2.18 [-0.08,4.44] 0.47 [-1.55,2.49] 0.82 [-1.2,2.84] Weight (kg) -2.51 [-4.15,-0.87]* -2.19 [-3.86,-0.52]* -1.75 [-3.28,-0.22]* -1.63 [-3.16,-0.10]* Note: Data are reported as marginal predicted means (95% CI). Analyses were adjusted for age, gender, site, and education. * p ≤ .05
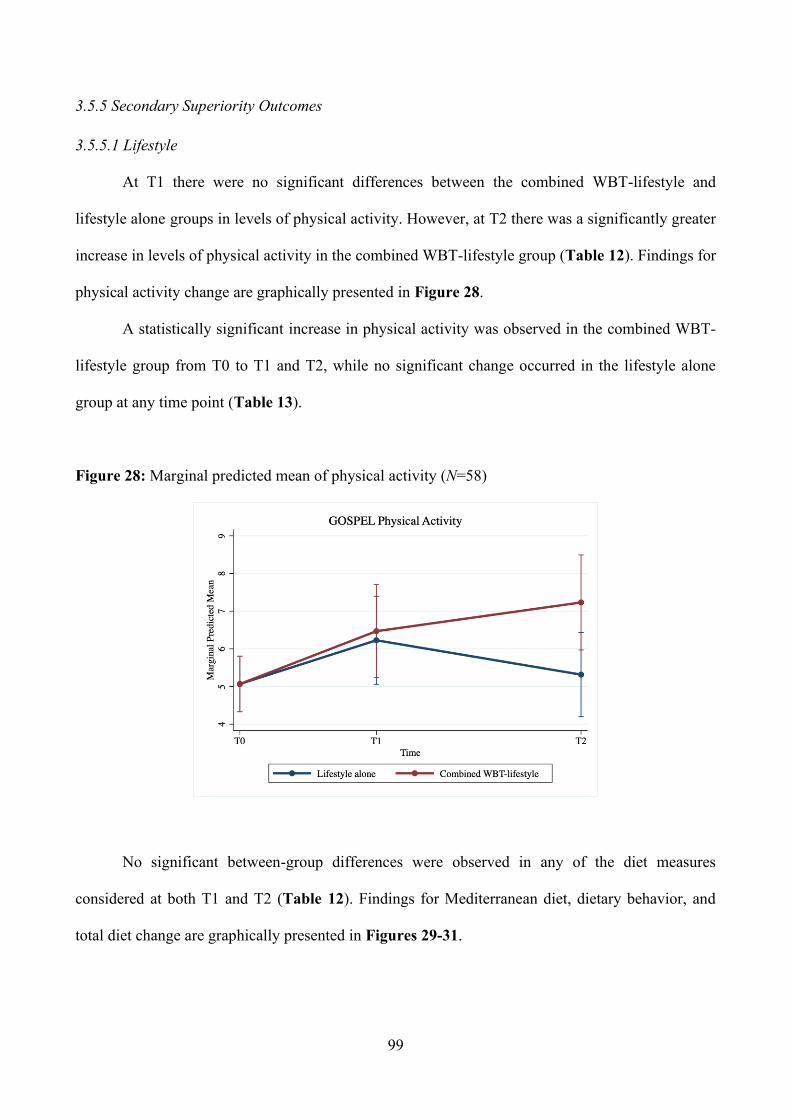
99
3.5.5 Secondary Superiority Outcomes
3.5.5.1 Lifestyle
At T1 there were no significant differences between the combined WBT-lifestyle and
lifestyle alone groups in levels of physical activity. However, at T2 there was a significantly greater
increase in levels of physical activity in the combined WBT-lifestyle group (Table 12). Findings for
physical activity change are graphically presented in Figure 28.
A statistically significant increase in physical activity was observed in the combined WBT-
lifestyle group from T0 to T1 and T2, while no significant change occurred in the lifestyle alone
group at any time point (Table 13).
Figure 28: Marginal predicted mean of physical activity (N=58)
No significant between-group differences were observed in any of the diet measures
considered at both T1 and T2 (Table 12). Findings for Mediterranean diet, dietary behavior, and
total diet change are graphically presented in Figures 29-31.
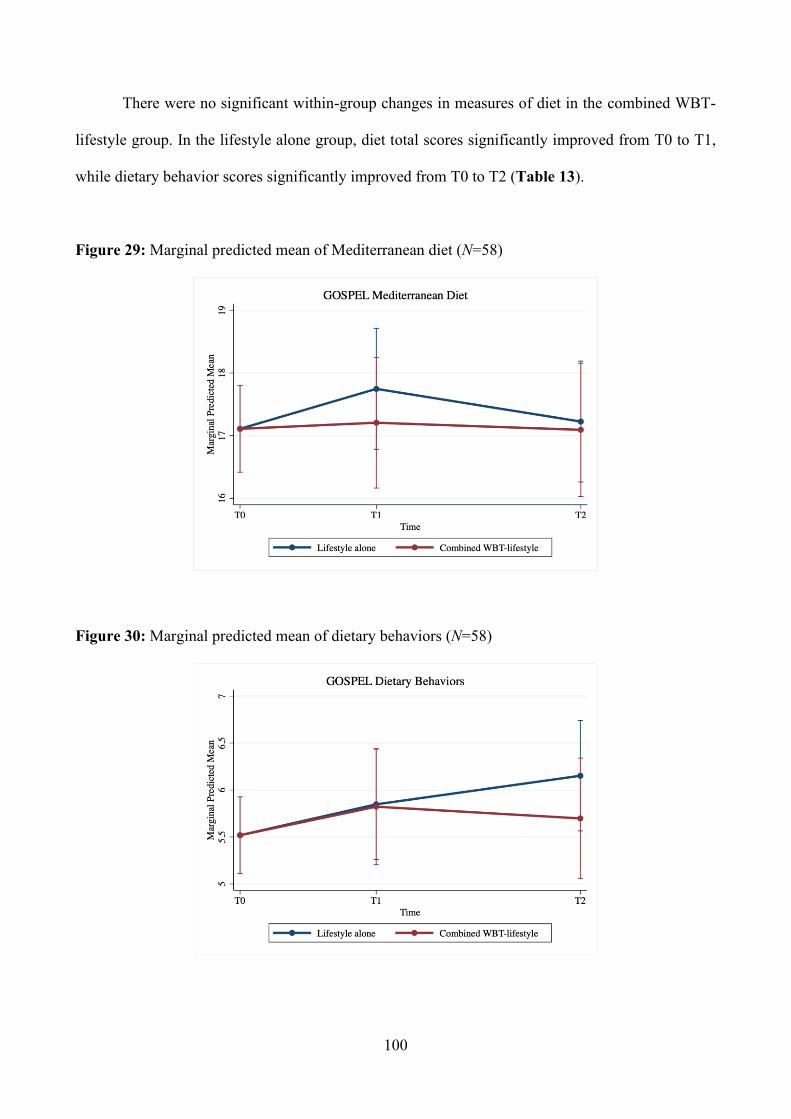
100
There were no significant within-group changes in measures of diet in the combined WBT-
lifestyle group. In the lifestyle alone group, diet total scores significantly improved from T0 to T1,
while dietary behavior scores significantly improved from T0 to T2 (Table 13).
Figure 29: Marginal predicted mean of Mediterranean diet (N=58)
Figure 30: Marginal predicted mean of dietary behaviors (N=58)
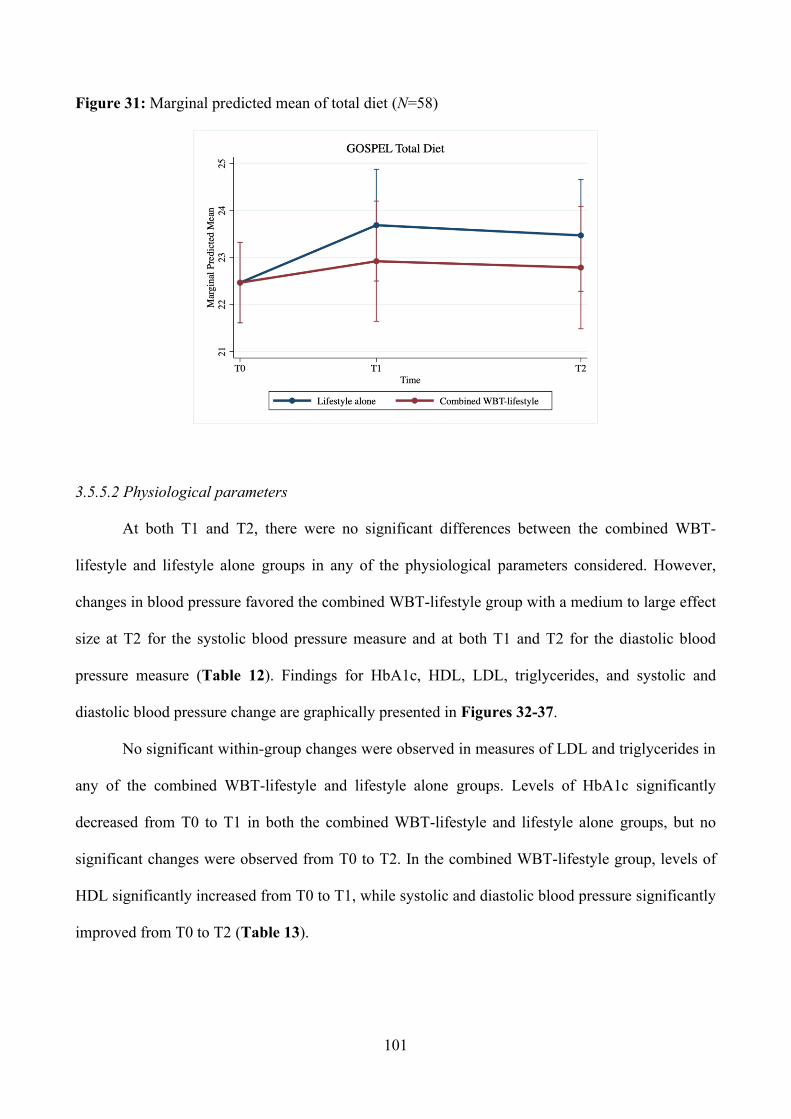
101
Figure 31: Marginal predicted mean of total diet (N=58)
3.5.5.2 Physiological parameters
At both T1 and T2, there were no significant differences between the combined WBT-
lifestyle and lifestyle alone groups in any of the physiological parameters considered. However,
changes in blood pressure favored the combined WBT-lifestyle group with a medium to large effect
size at T2 for the systolic blood pressure measure and at both T1 and T2 for the diastolic blood
pressure measure (Table 12). Findings for HbA1c, HDL, LDL, triglycerides, and systolic and
diastolic blood pressure change are graphically presented in Figures 32-37.
No significant within-group changes were observed in measures of LDL and triglycerides in
any of the combined WBT-lifestyle and lifestyle alone groups. Levels of HbA1c significantly
decreased from T0 to T1 in both the combined WBT-lifestyle and lifestyle alone groups, but no
significant changes were observed from T0 to T2. In the combined WBT-lifestyle group, levels of
HDL significantly increased from T0 to T1, while systolic and diastolic blood pressure significantly
improved from T0 to T2 (Table 13).
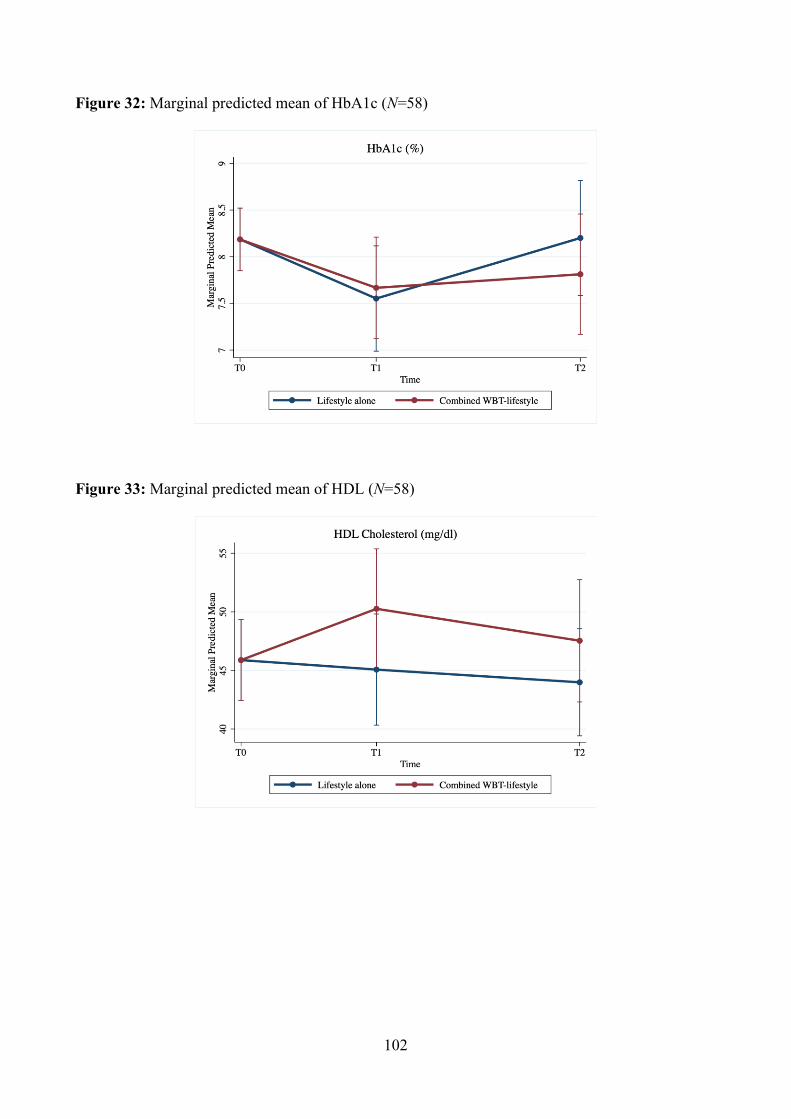
102
Figure 32: Marginal predicted mean of HbA1c (N=58)
Figure 33: Marginal predicted mean of HDL (N=58)
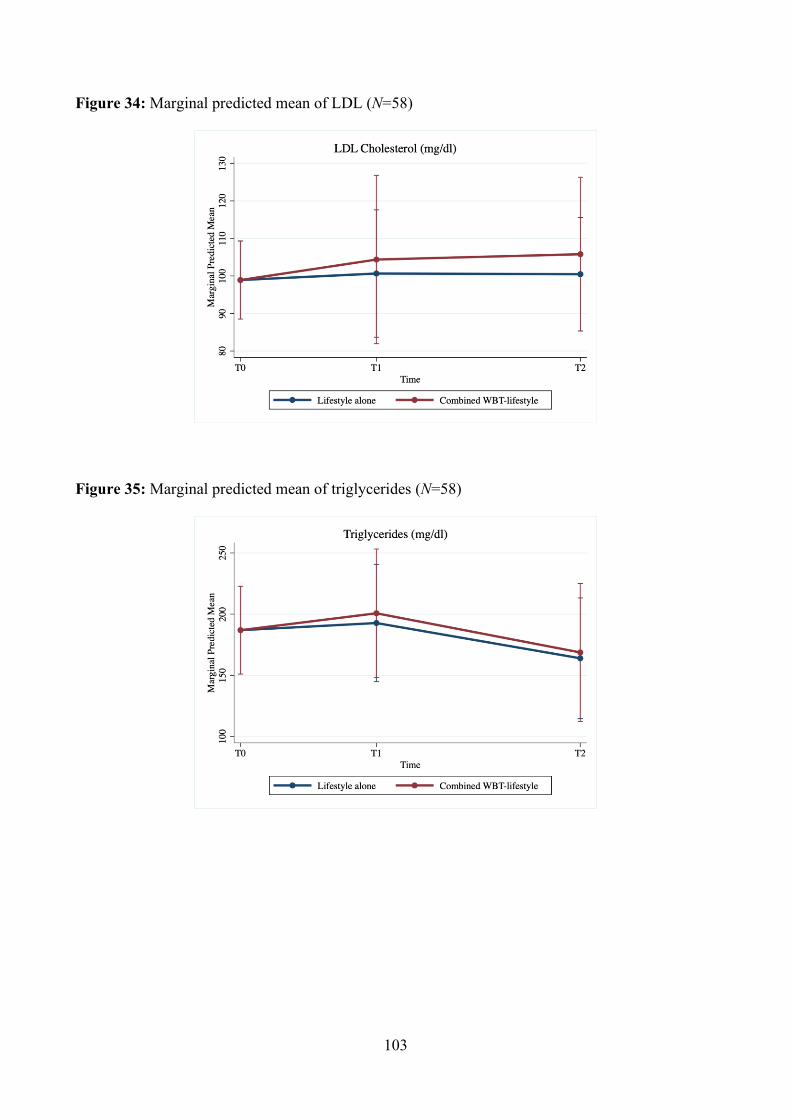
103
Figure 34: Marginal predicted mean of LDL (N=58)
Figure 35: Marginal predicted mean of triglycerides (N=58)
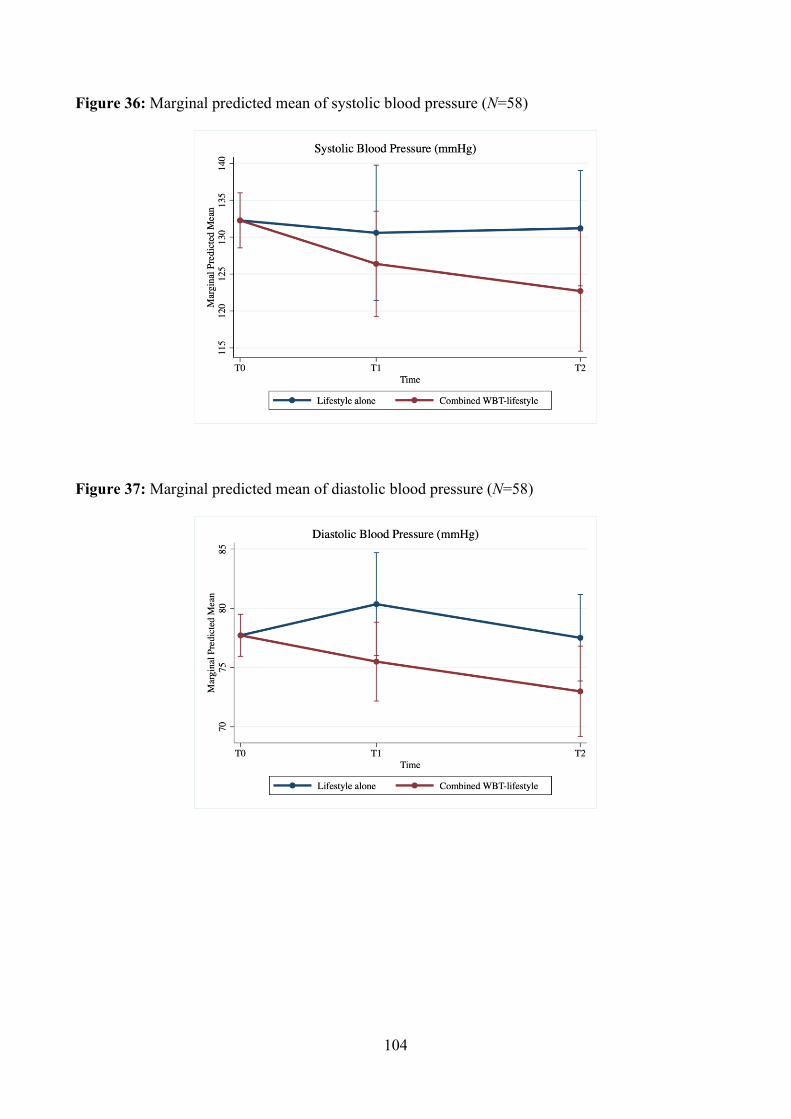
104
Figure 36: Marginal predicted mean of systolic blood pressure (N=58)
Figure 37: Marginal predicted mean of diastolic blood pressure (N=58)
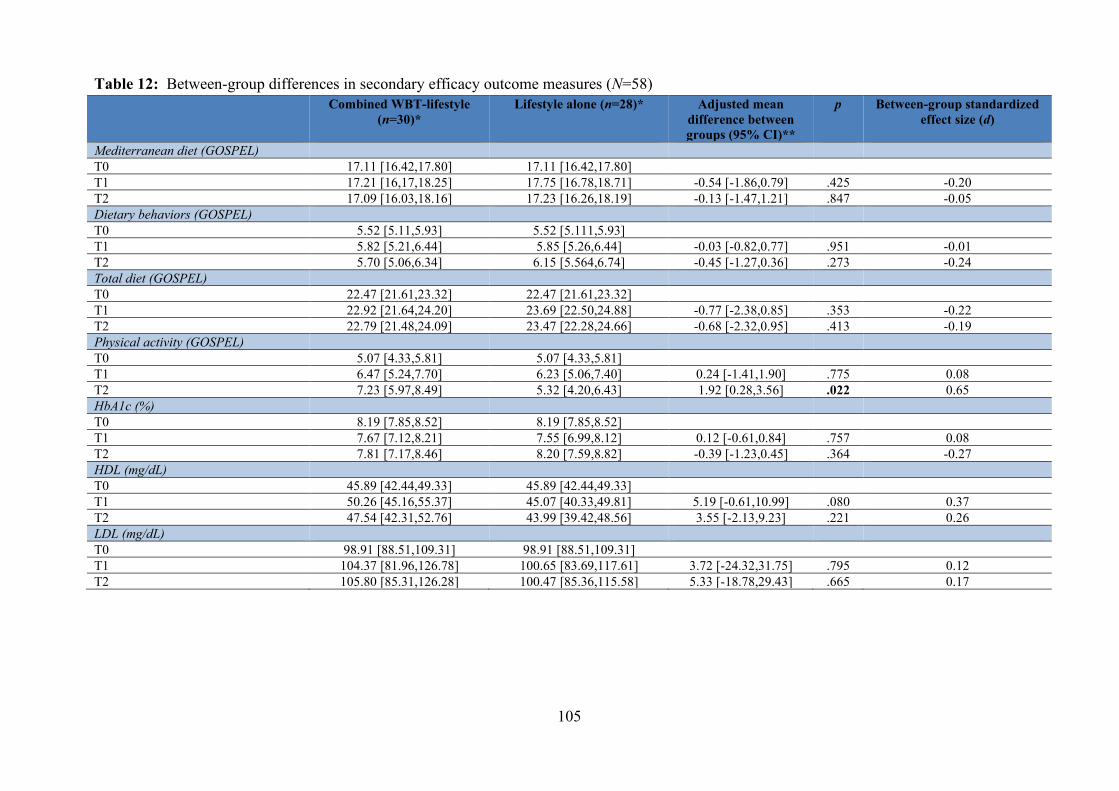
105
Table 12: Between-group differences in secondary efficacy outcome measures (N=58) Combined WBT-lifestyle
(n=30)*
Lifestyle alone (n=28)* Adjusted mean difference between groups (95% CI)**
p Between-group standardized effect size (d)
Mediterranean diet (GOSPEL) T0 17.11 [16.42,17.80] 17.11 [16.42,17.80] T1 17.21 [16,17,18.25] 17.75 [16.78,18.71] -0.54 [-1.86,0.79] .425 -0.20 T2 17.09 [16.03,18.16] 17.23 [16.26,18.19] -0.13 [-1.47,1.21] .847 -0.05 Dietary behaviors (GOSPEL) T0 5.52 [5.11,5.93] 5.52 [5.111,5.93] T1 5.82 [5.21,6.44] 5.85 [5.26,6.44] -0.03 [-0.82,0.77] .951 -0.01 T2 5.70 [5.06,6.34] 6.15 [5.564,6.74] -0.45 [-1.27,0.36] .273 -0.24 Total diet (GOSPEL) T0 22.47 [21.61,23.32] 22.47 [21.61,23.32] T1 22.92 [21.64,24.20] 23.69 [22.50,24.88] -0.77 [-2.38,0.85] .353 -0.22 T2 22.79 [21.48,24.09] 23.47 [22.28,24.66] -0.68 [-2.32,0.95] .413 -0.19 Physical activity (GOSPEL) T0 5.07 [4.33,5.81] 5.07 [4.33,5.81] T1 6.47 [5.24,7.70] 6.23 [5.06,7.40] 0.24 [-1.41,1.90] .775 0.08 T2 7.23 [5.97,8.49] 5.32 [4.20,6.43] 1.92 [0.28,3.56] .022 0.65 HbA1c (%) T0 8.19 [7.85,8.52] 8.19 [7.85,8.52] T1 7.67 [7.12,8.21] 7.55 [6.99,8.12] 0.12 [-0.61,0.84] .757 0.08 T2 7.81 [7.17,8.46] 8.20 [7.59,8.82] -0.39 [-1.23,0.45] .364 -0.27 HDL (mg/dL) T0 45.89 [42.44,49.33] 45.89 [42.44,49.33] T1 50.26 [45.16,55.37] 45.07 [40.33,49.81] 5.19 [-0.61,10.99] .080 0.37 T2 47.54 [42.31,52.76] 43.99 [39.42,48.56] 3.55 [-2.13,9.23] .221 0.26 LDL (mg/dL) T0 98.91 [88.51,109.31] 98.91 [88.51,109.31] T1 104.37 [81.96,126.78] 100.65 [83.69,117.61] 3.72 [-24.32,31.75] .795 0.12 T2 105.80 [85.31,126.28] 100.47 [85.36,115.58] 5.33 [-18.78,29.43] .665 0.17
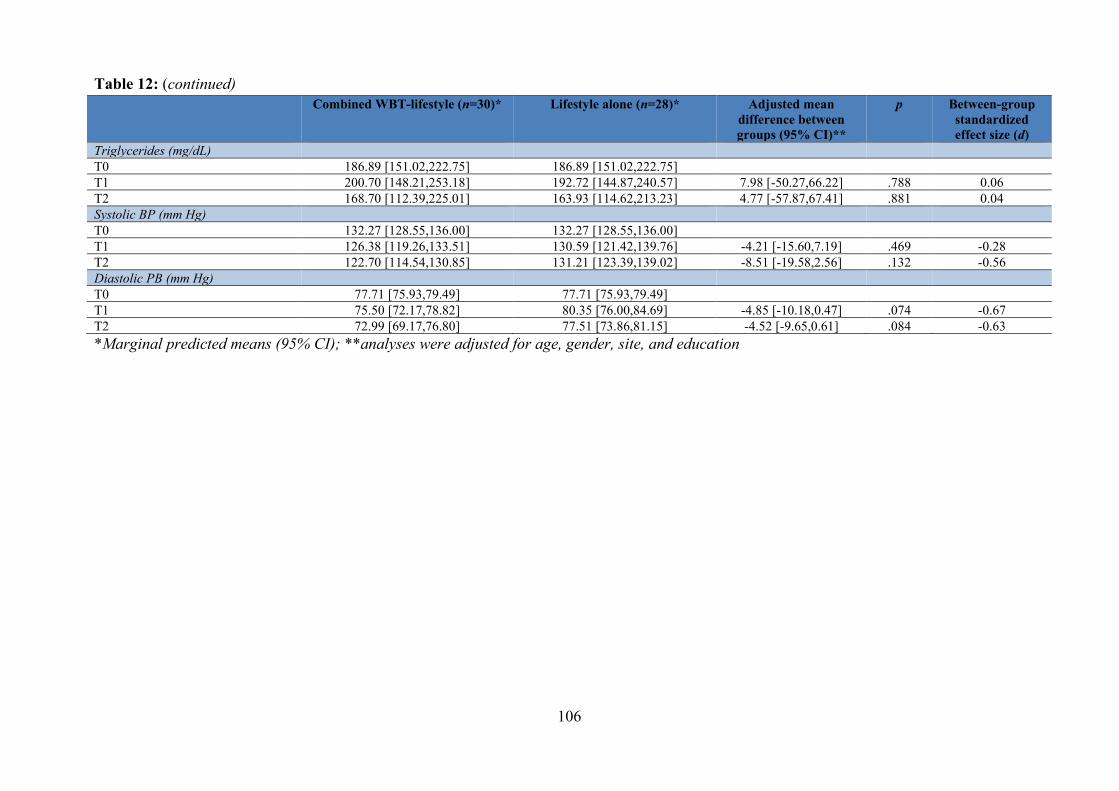
106
Table 12: (continued) Combined WBT-lifestyle (n=30)*
Lifestyle alone (n=28)* Adjusted mean
difference between groups (95% CI)**
p Between-group standardized effect size (d)
Triglycerides (mg/dL) T0 186.89 [151.02,222.75] 186.89 [151.02,222.75] T1 200.70 [148.21,253.18] 192.72 [144.87,240.57] 7.98 [-50.27,66.22] .788 0.06 T2 168.70 [112.39,225.01] 163.93 [114.62,213.23] 4.77 [-57.87,67.41] .881 0.04 Systolic BP (mm Hg) T0 132.27 [128.55,136.00] 132.27 [128.55,136.00] T1 126.38 [119.26,133.51] 130.59 [121.42,139.76] -4.21 [-15.60,7.19] .469 -0.28 T2 122.70 [114.54,130.85] 131.21 [123.39,139.02] -8.51 [-19.58,2.56] .132 -0.56 Diastolic PB (mm Hg) T0 77.71 [75.93,79.49] 77.71 [75.93,79.49] T1 75.50 [72.17,78.82] 80.35 [76.00,84.69] -4.85 [-10.18,0.47] .074 -0.67 T2 72.99 [69.17,76.80] 77.51 [73.86,81.15] -4.52 [-9.65,0.61] .084 -0.63 *Marginal predicted means (95% CI); **analyses were adjusted for age, gender, site, and education
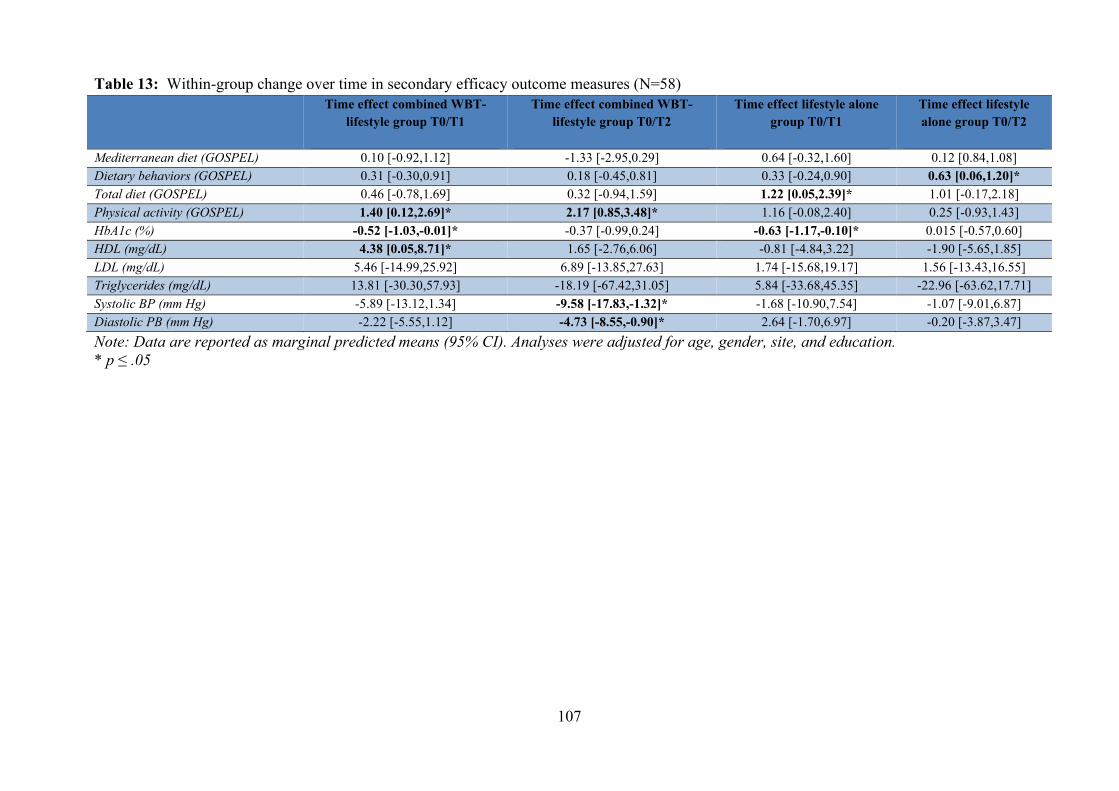
107
Table 13: Within-group change over time in secondary efficacy outcome measures (N=58) Time effect combined WBT-
lifestyle group T0/T1
Time effect combined WBT-lifestyle group T0/T2
Time effect lifestyle alone group T0/T1
Time effect lifestyle alone group T0/T2
Mediterranean diet (GOSPEL) 0.10 [-0.92,1.12] -1.33 [-2.95,0.29] 0.64 [-0.32,1.60] 0.12 [0.84,1.08] Dietary behaviors (GOSPEL) 0.31 [-0.30,0.91] 0.18 [-0.45,0.81] 0.33 [-0.24,0.90] 0.63 [0.06,1.20]* Total diet (GOSPEL) 0.46 [-0.78,1.69] 0.32 [-0.94,1.59] 1.22 [0.05,2.39]* 1.01 [-0.17,2.18] Physical activity (GOSPEL) 1.40 [0.12,2.69]* 2.17 [0.85,3.48]* 1.16 [-0.08,2.40] 0.25 [-0.93,1.43] HbA1c (%) -0.52 [-1.03,-0.01]* -0.37 [-0.99,0.24] -0.63 [-1.17,-0.10]* 0.015 [-0.57,0.60] HDL (mg/dL) 4.38 [0.05,8.71]* 1.65 [-2.76,6.06] -0.81 [-4.84,3.22] -1.90 [-5.65,1.85] LDL (mg/dL) 5.46 [-14.99,25.92] 6.89 [-13.85,27.63] 1.74 [-15.68,19.17] 1.56 [-13.43,16.55] Triglycerides (mg/dL) 13.81 [-30.30,57.93] -18.19 [-67.42,31.05] 5.84 [-33.68,45.35] -22.96 [-63.62,17.71] Systolic BP (mm Hg) -5.89 [-13.12,1.34] -9.58 [-17.83,-1.32]* -1.68 [-10.90,7.54] -1.07 [-9.01,6.87] Diastolic PB (mm Hg) -2.22 [-5.55,1.12] -4.73 [-8.55,-0.90]* 2.64 [-1.70,6.97] -0.20 [-3.87,3.47] Note: Data are reported as marginal predicted means (95% CI). Analyses were adjusted for age, gender, site, and education. * p ≤ .05
108
3.6 Discussion
This study evaluated the feasibility, acceptability, and superiority of a combined well-being
and lifestyle intervention for weight loss and distress reduction in a sample of 58 adult patients with
type 2 diabetes compared to a lifestyle intervention alone.
With respect to feasibility and acceptability, our intervention showed a retention rate of
about 70% after 10 months from the beginning of the intervention. High rates of attrition are one
the major challenges in the treatment of obesity. Although attrition rates are highly variable across
studies, ranging from 10% to 80% (Moroshko et al., 2011), a mean attrition rate of more than 40%
within the first 12 months has been reported in previous weight loss trials. For example, in two
studies from the Italian population, 51.7% (Dalle Grave et al., 2005) and 77.3% (Inelmen et al.,
2005) of study participants discontinued the intervention after 12 months. Numerous factors have
been associated with attrition in weight loss programs, but findings are often mixed and
inconsistent, with only a small number of studies reporting a specific factor. In a recent systematic
review (Leung et al., 2017), older age, higher education, healthier eating and physical activity,
higher stage of change at baseline, and higher initial weight loss were commonly associated with
better adherence to lifestyle modification programs for weight loss, while presence of depression,
stress, body image concerns, and having a full-time job were common predictors of poor adherence.
In line with these findings, an unhealthy diet, lack of physical activity, stress, work constraints, and
lack of initial results were among the factors reported by our study participants as interfering with
their past attempts to lose weight. Moreover, in the present study, non-completers had significantly
lower baseline levels of autonomy compared with study completers and showed significantly higher
rates of minor depression and irritable mood. The role of these variables as predictors of attrition in
weight loss programs appear to be relatively unexplored in the literature. For example, levels of
anger-hostility have been found to be independently associated with attrition among adult patients
undergoing a behavioral weight loss treatment (Colombo et al., 2014). However, only one study
(Altamura et al., 2018) specifically considered the impact of DCPR syndromes on attrition and
109
found that even if non-completers had significantly higher rates of alexithymia, irritable mood, and
type A behavior, only alexithymia was a significant predictor of attrition. Positing a mechanism
behind the good rates of retention observed in our study compared to similar studies in this field is
difficult due to the heterogeneity of interventions and study designs. Nevertheless, our retention
rates are promising and appear to be better than those of most weight loss studies.
Despite these promising results, only 24% of eligible patients accepted to participate in the
study. A common barrier to both study enrollment and retention cited by participants or potential
participants was a lack of time due to family and work constraints. A potential solution to this is
transitioning to more remote intervention procedures. Previous studies utilizing remote
interventions with participants in various medical and non-medical settings have reported excellent
feasibility and acceptability rates. For example, Wakefield et al. (2016), in a sample of parents of
children who survived cancer, reported a 96% completion rate after a 6-month, online, group-based,
cognitive behavioral therapy intervention (CBT). In another study, Beatty et al. (2016) evaluated
the efficacy of a 6-week self-guided Web-based CBT to reduce distress among cancer patients and
reported a study acceptance rate of 63.2% of eligible patients. Moreover, the research interest and
the need for new and remote modes of delivery for psychological interventions has become even
more salient in the past year in response to the Covid-19 outbreak. In an ongoing study during the
pandemic, this author has been adapting a well-being intervention similar to the present study for
complete remote delivery through teleconferencing software and preliminary anecdotal findings
suggest that retention rates are very high. This suggests that transition to more remote strategies that
make psychological interventions more accessible to participants could improve intervention
acceptability and retention rates even further.
No specific effect of the well-being intervention was found with respect to weight change. In
fact, there were no significant differences in weight loss between the group receiving the combined
well-being and lifestyle intervention and the group receiving the lifestyle intervention alone. These
findings are in line with those from another study (Phillips et al., 2017), in which the combination
110
of a positive affect (i.e., participants were asked to identify and think about small things that made
them feel good on waking up and during the day) and self-affirmation (i.e., participants were asked
to think about a proud moment in their life when facing barriers to their behavioral goals)
component with a lifestyle intervention was not associated with significantly greater weight loss at
12 months compared with the lifestyle intervention alone. In both this latter study and our study, the
lifestyle intervention was based on a small change approach that relies on small sustained lifestyle
changes to reduce energy intake and increase energy expenditure in order to promote gradual
weight loss (Hill, 2009; Hills et al., 2013). Previous studies using this approach have shown a
statistically significant and sustained weight loss across different populations of adult participants
who were overweight or obese (Crane et al., 2020; Damschroder et al., 2010, 2014; Lutes et al.,
2008, 2012, 2017; Paxman et al., 2011; Vimalananda et al., 2016; Zinn et al., 2012). Similarly, in
our study, participants in both the combined WBT-lifestyle and lifestyle alone groups received a
small change intervention and experienced a statistically significant weight loss from baseline to
post-intervention that was sustained at 6-month follow-up. A total weight loss of at least 5% is
considered to be clinically significant, since it has been associated with improvements in
cardiovascular risk factors such as HbA1c, systolic and diastolic blood pressure, triglycerides, and
total, HDL, and LDL cholesterol (Brown et al., 2016; Wing et al., 2011). Among completers in our
study, a clinically significant weight loss of 5% was observed in 25.6% of the total sample at post-
intervention and 31% at 6-month follow-up, without significant differences between the combined
WBT-lifestyle and lifestyle alone groups. Similarly, in the studies by Zinn et al. (Zinn et al., 2012)
and Damschroder et al. (Damschroder et al., 2014), about 30% of participants lost at least 5% of
their initial body weight during a small change intervention. Also, one study showed a clinically
significant weight loss greater than 5% during a small change treatment program delivered in group
for 3 months and over the phone for an additional 6 months (Lutes et al., 2012). On the other hand,
in the study by Phillips et al. (2017), only 9% of all participants lost at least 7% of their initial body
weight at post-intervention (12 months). To the best of our knowledge, our study is the first to have
111
tested a small change intervention by focusing exclusively on a population of patients with type 2
diabetes. An exploratory post hoc analysis by Lutes et al. (2017) revealed that participants with a
diagnosis of diabetes experienced worse weight loss outcomes during a small change intervention
when compared with those without diabetes, which they conjecture may be related to the higher
level of emotional distress present in diabetic populations, and therefore the more negative effect on
these participants of losing social support as the group sessions in the study became less frequent
over the course of the long-term follow-up. Considering this, our findings are particularly promising
since, although we did not find a significant effect from the well-being intervention on weight loss,
they show the efficacy of the small change approach in a population of patients with type 2
diabetes. Exploratory subgroup analyses were conducted to determine for which participants the
combined WBT-lifestyle intervention had the most advantages in terms of weight loss. Student’s t-
test with Bonferroni correction was used to compare the group of WBT-lifestyle participants who
reached a clinically significant weight loss at either immediate post-intervention or 6-month follow-
up with those who did not in terms of baseline demographics, medical, psychological, and lifestyle
variables. No significant difference was found. However, these results are to be considered with
caution due to the small sample size and large number of candidate predictors at baseline.
Significantly greater improvements in measures of depression and hostility, as assessed by
the SQ (Benasi et al., 2020; Kellner, 1987), and personal growth, as assessed by the PWBs (Ryff,
1989), were observed at post-intervention in the group receiving the combined well-being and
lifestyle intervention. This is particularly important when considering the high prevalence of
various forms of psychological distress among patients with type 2 diabetes. The prevalence of
depression has been found to be nearly twice as high among people with type 2 diabetes compared
to the general population (Roy & Lloyd, 2012), and according to a recent systematic review and
meta-analysis of observational studies, almost one in four adults with type 2 diabetes had a
comorbid depressive disorder (Khaledi et al., 2019). Other forms of psychological distress that are
prevalent among patients with type 2 diabetes include anxiety disorders (Chaturvedi et al., 2019),
112
subthreshold depression (Schmitz et al., 2014), and diabetes-related distress (Dennick et al., 2017;
Polonsky et al., 1995). In a case control study (Dogan et al., 2019), higher levels of anger-hostility
were observed among patients with type 2 diabetes compared to non-diabetic patients. Even if in
our study we specifically excluded patients with an untreated, severe, and/or recently diagnosed
psychiatric disorder, 9% of the sample met the diagnostic criteria for minor depression, and self-
reported levels of psychological distress were generally higher than those observed in populations
of healthy individuals (Kellner, 1987; Kellner et al., 1989; Mangelli et al., 2006; Sonino et al.,
2011). Whether it meets full diagnostic criteria for a psychiatric disorder or not, the presence of
psychological distress has been linked to poor health behaviors and clinical outcomes, including
poorer treatment adherence, glycemic control, diet and quality of life, lower physical activity, and
higher rates of diabetes-related complications, disability, and mortality (Dirmaier et al., 2010; Dong
et al., 2020; Guerrero Fernández de Alba et al., 2020). Hostility, in particular, has been associated
with worse metabolic outcomes, systemic inflammation, and higher rates of cardiovascular
morbidity and mortality in patients with diabetes (Elovainio et al., 2011; Hackett et al., 2015;
Jonasson et al., 2019; Todaro et al., 2005). According to a recent study, depressive symptoms may
have a role in mediating the association between hostility and cardiovascular risk (Hamieh et al.,
2020). On the other hand, different indicators of psychological well-being have been associated
with better health outcomes across numerous medical conditions (Chida & Steptoe, 2008; Ryff,
2014). Among patients with type 2 diabetes, positive psychological characteristics, such as positive
affect, self-efficacy, resilience, and optimism have been associated with better glycemic control,
fewer diabetes-related complications, and lower mortality rates (Celano et al., 2013). In a
longitudinal study, the association between distress and worsening of glycemic control and self-care
behaviors was significantly stronger among diabetic patients with low to moderate levels of
resilience than among those with high levels of resilience, showing the protective role of resilience
in response to distress (Yi et al., 2008). These data suggest the importance of addressing factors
related to psychological distress and well-being when developing effective interventions for
113
diabetes. In our study, we implemented an intervention to promote psychological well-being and
reduce psychological distress in line with the WBT protocol (Fava, 2016a). While this innovative
short-term psychotherapeutic strategy yielded enduring clinical benefits in the psychiatric setting,
particularly with regard to recurrent depression (Fava et al., 1998), its application in the medical
setting is still new. In a recently published study by Rafanelli et al. (2020), among depressed and/or
demoralized patients with acute coronary syndrome, the sequential combination of cognitive
behavioral therapy (CBT) and WBT was associated with significantly greater improvements in
depressive symptoms compared to an active control group receiving clinical management alone at
immediate post-intervention. Improvements were maintained in both the combined WBT-lifestyle
and lifestyle alone groups, but differences between groups were no longer significant starting from
a 3-month follow-up after the end of the intervention. Similarly, in our study, lack of significant
differences between groups in measures of psychological distress at 6-month follow-up was not
associated with a loss of improvement in the well-being and lifestyle intervention group, but to a
reduction in distress in the lifestyle alone intervention group. A previous study has shown that
behavioral lifestyle interventions for weight loss can improve psychological health in patients with
type 2 diabetes and obesity even without a psychological component (Brinkworth et al., 2016).
Considering this, it is possible that in our study adding a well-being component to the lifestyle
intervention resulted in a faster improvement in psychological outcomes.
For the assessment of psychological states in this study, we relied on self-reported measures
with good clinimetric properties such as the SQ (Benasi et al., 2020; Kellner, 1987). A clinimetric
approach for the evaluation of clinical issues has been introduced by Feinstein in 1982 (Feinstein,
1982) as an alternative to the traditional psychometric model. According to the clinimetric
approach, the psychometric model, with its focus on the homogeneity of items (e.g., Cronbach’s
alpha tests) as the main criterion of validity and reliability of a rating scale, appears to be
inadequate for the understanding of clinical challenges (Bech, 2004; Fava et al., 2004). In fact, a
scale with a high internal consistency or homogeneity may be redundant and have a decreased
114
ability to identify differences and change (Fava et al., 2004). In clinimetrics, homogeneity is not
necessary, and the quality of an instrument is judged based on its sensitivity, which can be
described as its ability to discriminate between different patient populations, and detect clinically
significant changes in health status over time and with treatment (Kellner, 1972). The use of
sensitive scales can therefore allow the identification of psychological states, including both
symptoms of distress and well-being, and their changes with treatment, even when these changes
are present with a small effect size and limited sample size (Benasi et al., 2020).
The combined WBT-lifestyle intervention showed a sustained and moderate to large effect
in promoting physical activity compared to lifestyle alone. Specifically, at 6-month follow-up,
levels of physical activity were significantly higher among participants in the combined WBT-
lifestyle intervention but started to decrease among those who received the lifestyle intervention
alone. These positive findings are in line with a newly proposed approach to physical activity that
challenges the current focus on the risks associated with physical inactivity and the promotion of
generic threshold-based recommendations, and advocates for a more person-centered approach that
relies on self-empowerment and self-determination (Warburton & Bredin, 2019). Similarly, WBT
recognizes individual variations and endorses a personalized approach in promoting lifestyle
changes (Benasi et al., 2019; Fava, 2016b). Moreover, studies have suggested that more attention
should be paid to physical activity in patients with type 2 diabetes (Zhang et al., 2020). In fact, even
when not associated with clinically significant weight loss, an increase in physical activity can have
several health benefits in diabetic patients, such as improvement of glucose and lipid profiles,
increases in health-related quality of life, prevention of diabetes-related complications, and
lowering of mortality rates (Karstoft & Pedersen, 2016; Munan et al., 2020; Tapehsari et al., 2020;
Wake, 2020). The benefits of adding a psychological component to a standard lifestyle intervention
for behavioral change have been previously reported in the literature. For example, in Martinus et
al. (2006), the combination of psychological counseling and exercise training resulted in a
significantly higher adherence to exercise compared to exercise training alone in patients with type
115
2 diabetes. Furthermore, Aikens et al. (2012) found a prospective association between depressive
symptoms and future health behaviors, including physical activity. It is therefore possible that, in
our study, short-term improvements in psychological distress may have had a positive impact on
physical activity at follow-up. This is in line with the hypothesis that a state of euthymia may
promote healthy lifestyle changes by modifying psychosocial factors that negatively impact the
individual vulnerability, course, and outcome of medical disease.
Finally, improvements in psychological distress at post-intervention and physical activity at
follow-up do not appear to be associated with better physiological outcomes (i.e., HbA1c, HDL,
LDL, triglycerides, and blood pressure), in the group receiving the combined well-being and
lifestyle intervention. In fact, even if changes in blood pressure favored the combined intervention
at 6-month follow-up with a medium to large effect size, differences between the combined WBT-
lifestyle and lifestyle alone groups were not statistically significant. In line with our results, several
meta-analyses found a small or no effect on glycemic control from both psychosocial interventions
to reduce distress and well-being interventions in patients with diabetes (Baumeister et al., 2014;
Chew et al., 2017; Massey et al., 2019; Mathiesen et al., 2019). On the other hand, these findings
are contrary to those of other studies in which better psychological outcomes and increased physical
activity were associated with improved glycemic control (Fisher et al., 2010; Munan et al., 2020).
Considering the delayed effect of the intervention on physical activity, it is possible that better
physiological outcomes may have been detected at a longer-term follow-up in the group of
participants receiving the combined WBT-lifestyle intervention.
3.6.1 Study limitations
Our findings need to be considered within the context of study limitations. First, the use of a
treatment as usual waitlist control may have inflated the effect of the combined WBT-lifestyle
intervention by artificially worsening outcomes in the lifestyle alone group. Wait-list controls have
been controversial. For example, a meta-analysis comparing various strategies for control groups in
116
clinical trials found that a wait-list control may lead to deleterious effects, effectively a “nocebo”,
compared to no treatment at all (Furukawa et al., 2014). As an alternative, an active intervention
control group (e.g., receiving the same amount of study contact while receiving only treatment as
usual and no specific intervention) has been recommended (Guidi et al., 2018).
Another limitation pertains to the use of stringent inclusion criteria related to age. We chose to
exclude patients older than 65 years of age. We did this due to possible risks associated with weight
loss in older adults (Waters et al., 2013). Moreover, older adults with diabetes may have more
medical complications, and we hoped that limiting our sample to younger patients would result in a
more homogeneous sample. However, the prevalence of type 2 diabetes among those older than 65
years of age is 26.8% compared to 17.5% in patients between 45 and 64 years old and 4.1% in
patients between 18 and 44 years old (Centers for Disease Control and Prevention, 2020c). This
limits the generalizability of our findings to a specific population of patients with type 2 diabetes.
Furthermore, restricting recruitment to a working age population may have impacted the acceptance
rate. In fact, lack of time due to work and family constraints was a common reason for refusing
participation but also interrupting participation.
The use of self-reported questionnaires for the assessment of physical activity could have led to
bias, while an objective assessment (e.g., accelerometers, pedometers, actigraph, etc.) could have
provided a more accurate estimate.
Finally, physiological parameters were collected from medical charts and were not available for
all participants, resulting in a great number of missing data leading to loss of statistical power and
potential bias if data were not missing at random. Including a direct collection of blood samples as
part of the study protocol would have assured accuracy and completeness of physiological data.
3.7 General conclusions and implications
The present study is the first to test the feasibility, acceptability, and superiority of an
intervention modeled after WBT in combination with small change lifestyle elements to promote
117
weight loss and reduce distress in a population of adult patients with type 2 diabetes compared to
lifestyle changes alone.
Preliminary findings suggest that not only can a combined well-being and lifestyle
intervention be feasible and acceptable in the setting of an outpatient diabetes clinic, but also that a
well-being intervention can be a valuable addition to lifestyle interventions in improving short-term
psychological outcomes and promoting healthy changes in physical activity at 6-month follow-up.
Moreover, although no significant effect of the well-being intervention was found in terms of
weight loss, promising results were found within each group, demonstrating for the first time the
efficacy of a small change intervention to promote weight loss in patients with type 2 diabetes
specifically.
The feasibility data generated in this study may be valuable for informing the design of
future studies. Considering the challenges and limitations which emerged in the present study,
investigators should consider: replicating our findings in a population of adults ≥ 65 years of age,
which is more representative of the overall population of patients with type 2 diabetes; utilizing
objective measures of lifestyle change in order to ensure accurate assessment of physical activity;
including a plan for standardized, direct collection of physiological parameters to ensure accuracy
and completeness; replacing the treatment as usual wait-list control group with an active
intervention control group; and assessing participants at longer follow-ups. Also, the effect size
estimates of key efficacy outcomes may inform a sample size calculation for a larger superiority
trial.
Finally, it may be beneficial to design alternative ways to deliver the intervention, such as
those implemented in telemedicine, to meet both participants’ personal needs related to work and
family constrains and current safety challenges, and therefore potentially increase acceptance and
retention rates.
118
References
Abdelaal, M., le Roux, C. W., & Docherty, N. G. (2017). Morbidity and mortality associated with
obesity. Annals of Translational Medicine, 5(7), 161.
https://doi.org/10.21037/atm.2017.03.107
Agardh, E., Allebeck, P., Hallqvist, J., Moradi, T., & Sidorchuk, A. (2011). Type 2 diabetes
incidence and socio-economic position: A systematic review and meta-analysis. International
Journal of Epidemiology, 40(3), 804–818. https://doi.org/10.1093/ije/dyr029
Aikens, J. E. (2012). Prospective associations between emotional distress and poor outcomes in
type 2 diabetes. Diabetes Care, 35(12), 2472–2478. https://doi.org/10.2337/dc12-0181
Al-Khawaldeh, O. A., Al-Hassan, M. A., & Froelicher, E. S. (2012). Self-efficacy, self-
management, and glycemic control in adults with type 2 diabetes mellitus. Journal of Diabetes
and Its Complications, 26(1), 10–16. https://doi.org/10.1016/j.jdiacomp.2011.11.002
Albertorio-Diaz, J. R., Eberhardt, M. S., Oquendo, M., Mesa-Frias, M., He, Y., Jonas, B., & Kang,
K. (2017). Depressive states among adults with diabetes: Findings from the National Health
and Nutrition Examination Survey, 2007–2012. Diabetes Research and Clinical Practice, 127,
80–88. https://doi.org/10.1016/j.diabres.2017.02.031
Altamura, M., Porcelli, P., Fairfield, B., Malerba, S., Carnevale, R., Balzotti, A., Rossi, G.,
Vendemiale, G., & Bellomo, A. (2018). Alexithymia predicts attrition and outcome in weight-
loss obesity treatment. Frontiers in Psychology, 9, 2432.
https://doi.org/10.3389/fpsyg.2018.02432
Alvani, S. R., Hosseini, S. M. P., & Zaharim, N. M. (2020). Prediction of diabetes distress among
adults with type 2 diabetes. International Journal of Diabetes in Developing Countries, 40(1),
119–126. https://doi.org/10.1007/s13410-019-00745-y
Alzahrani, A., Alghamdi, A., Alqarni, T., Alshareef, R., & Alzahrani, A. (2019). Prevalence and
predictors of depression, anxiety, and stress symptoms among patients with type II diabetes
119
attending primary healthcare centers in the western region of Saudi Arabia: A cross-sectional
study. International Journal of Mental Health Systems, 13(1), 48.
https://doi.org/10.1186/s13033-019-0307-6
American Diabetes Association. (2017a). Comprehensive medical evaluation and assessment of
comorbidities. Diabetes Care, 40(Supplement 1), S25–S32. https://doi.org/10.2337/dc17-S006
American Diabetes Association. (2017b). Lifestyle management. Diabetes Care, 40(Supplement 1),
S33–S43. https://doi.org/10.2337/dc17-S007
American Diabetes Association. (2018). Economic costs of diabetes in the U.S. in 2017. Diabetes
Care, 41(5), 917–928. https://doi.org/10.2337/dci18-0007
American Diabetes Association. (2020a). Pharmacologic approaches to glycemic treatment:
Standards of medical care in diabetesd―2020. Diabetes Care, 43(Supplement 1), S98–S110.
https://doi.org/10.2337/dc20-S009
American Diabetes Association. (2020b). Cardiovascular disease and risk management: Standards
of medical care in diabetes- 2020. Diabetes Care, 43(Supplement 1), S111–S134.
https://doi.org/10.2337/dc20-S010
American Diabetes Association. (2020c). Classification and diagnosis of diabetes: Standards of
Medical Care in Diabetes-2020. Diabetes Care, 43(Supplement 1), S14–S31.
https://doi.org/10.2337/dc20-S002
American Diabetes Association. (2020d). Glycemic targets: Standards of medical care in diabetes-
2020. Diabetes Care, 43(Supplement 1), S66–S76. https://doi.org/10.2337/dc20-S006
American Diabetes Association. (2020e). Obesity management for the treatment of type 2 diabetes:
Standards of medical care in diabetes - 2020. Diabetes Care, 43(Supplement 1), S89–S97.
https://doi.org/10.2337/dc20-S008
American Diabetes Association. (2020f). Prevention or delay of type 2 diabetes: Standards of
medical care in diabetesd2020. Diabetes Care, 43(Supplement 1), S32–S36.
https://doi.org/10.2337/dc20-S003
120
American Psychiatric Association. (2000). Diagnostic and statistical manual of mental disorders
(4th ed., Text Revision).
American Psychiatric Association. (2013). Diagnostic and statistical manual of mental disorders
(5th ed.).
Anderson, R. J., De Groot, M., Grigsby, A. B., McGill, J. B., Freedland, K. E., Clouse, R. E., &
Lustman, P. J. (2002). Anxiety and poor glycemic control: A meta-analytic review of the
literature. International Journal of Psychiatry in Medicine, 32(3), 235–247.
https://doi.org/10.2190/KLGD-4H8D-4RYL-TWQ8
Anderson, R. J., Freedland, K. E., Clouse, R. E., & Lustman, P. J. (2001). The prevalence of
comorbid depression in adults with diabetes: A meta-analysis. Diabetes Care, 24(6), 1069–
1078. https://doi.org/10.2337/diacare.24.6.1069
Apovian, C. M., Aronne, L. J., Bessesen, D. H., McDonnell, M. E., Murad, M. H., Pagotto, U.,
Ryan, D. H., & Still, C. D. (2015). Pharmacological management of obesity: An endocrine
society clinical practice guideline. Journal of Clinical Endocrinology and Metabolism, 100(2),
342–362. https://doi.org/10.1210/jc.2014-3415
Ascher-Svanum, H., Zagar, A., Jiang, D., Schuster, D., Schmitt, H., Dennehy, E. B., Kendall, D.
M., Raskin, J., & Heine, R. J. (2015). Associations Between Glycemic Control, Depressed
Mood, Clinical Depression, and Diabetes Distress Before and After Insulin Initiation: An
Exploratory, Post Hoc Analysis. Diabetes Therapy, 6(3), 303–316.
https://doi.org/10.1007/s13300-015-0118-y
Austin, J., & Marks, D. (2009). Hormonal Regulators of Appetite. International Journal of
Pediatric Endocrinology, 2009, 141753. https://doi.org/10.1155/2009/141753
Azadbakht, M., Taheri Tanjani, P., Fadayevatan, R., Froughan, M., & Zanjari, N. (2020). The
prevalence and predictors of diabetes distress in elderly with type 2 diabetes mellitus. Diabetes
Research and Clinical Practice, 163, 108133. https://doi.org/10.1016/j.diabres.2020.108133
Bahety, P., Agarwal, G., Khandelwal, D., Dutta, D., Kalra, S., Taparia, P., & Singhal, V. (2017).
121
Occurrence and predictors of depression and poor quality of life among patients with Type-2
diabetes: A Northern India perspective. Indian Journal of Endocrinology and Metabolism,
21(4), 564–569. https://doi.org/10.4103/ijem.IJEM_123_17
Bandura, A. (1977). Self-efficacy: Toward a unifying theory of behavioral change. Psychological
Review, 84(2), 191–215. https://doi.org/10.1037/0033-295X.84.2.191
Baumeister, H., Hutter, N., & Bengel, J. (2014). Psychological and pharmacological interventions
for depression in patients with diabetes mellitus: An abridged Cochrane review. Diabetic
Medicine, 31(7), 773–786. https://doi.org/10.1111/dme.12452
Beatty, L., Koczwara, B., & Wade, T. (2016). Evaluating the efficacy of a self-guided Web-based
CBT intervention for reducing cancer-distress: a randomised controlled trial. Supportive Care
in Cancer, 24(3), 1043–1051. https://doi.org/10.1007/s00520-015-2867-6
Bech, P. (2004). Modern psychometrics in clinimetrics: Impact on clinical trials of antidepressants.
Psychotherapy and Psychosomatics, 73(3), 134–138. https://doi.org/10.1159/000076448
Bellou, V., Belbasis, L., Tzoulaki, I., & Evangelou, E. (2018). Risk factors for type 2 diabetes
mellitus: An exposure-wide umbrella review of meta-analyses. PLoS ONE, 13(3), e0194127.
https://doi.org/10.1371/journal.pone.0194127
Benasi, G., Fava, G. A., & Rafanelli, C. (2020). Kellner’s Symptom Questionnaire, a Highly
Sensitive Patient-Reported Outcome Measure: Systematic Review of Clinimetric Properties.
Psychotherapy and Psychosomatics, 89(2), 74–89. https://doi.org/10.1159/000506110
Benasi, G., Guidi, J., Rafanelli, C., & Fava, G. A. (2019). New Applications of Well-Being
Therapy. Rivista Sperimental Di Freniatria, CXLIII(1), 87–106.
Bhupathiraju, S. N., Tobias, D. K., Malik, V. S., Pan, A., Hruby, A., Manson, J. E., Willett, W. C.,
& Hu, F. B. (2014). Glycemic index, glycemic load, and risk of type 2 diabetes: Results from 3
large US cohorts and an updated meta-analysis. American Journal of Clinical Nutrition,
100(1), 218–232. https://doi.org/10.3945/ajcn.113.079533
Bickett, A., & Tapp, H. (2016). Anxiety and diabetes: Innovative approaches to management in
122
primary care. Experimental Biology and Medicine, 241(15), 1724–1731.
https://doi.org/10.1177/1535370216657613
Boehm, J. K., & Kubzansky, L. D. (2012). The heart’s content: The association between positive
psychological well-being and cardiovascular health. Psychological Bulletin, 138(4), 655–691.
https://doi.org/10.1037/a0027448
Boehm, J. K., Trudel-Fitzgerald, C., Kivimaki, M., & Kubzansky, L. D. (2015). The prospective
association between positive psychological well-being and diabetes. Health Psychology,
34(10), 1013–1021. https://doi.org/10.1037/hea0000200
Borga, M., West, J., Bell, J. D., Harvey, N. C., Romu, T., Heymsfield, S. B., & Leinhard, O. D.
(2018). Advanced body composition assessment: From body mass index to body composition
profiling. Journal of Investigative Medicine, 66(5), 887–895. https://doi.org/10.1136/jim-2018-
000722
Bouchard, C., Tremblay, A., Després, J.-P., Nadeau, A., Lupien, P. J., Thériault, G., Dussault, J.,
Moorjani, S., Pinault, S., & Fournier, G. (1990). The Response to Long-Term Overfeeding in
Identical Twins. New England Journal of Medicine, 322(21), 1477–1482.
https://doi.org/10.1056/nejm199005243222101
Boylan, J. M., & Ryff, C. D. (2015). Psychological well-being and metabolic syndrome: Findings
from the midlife in the United States national sample. Psychosomatic Medicine, 77(5), 548–
558. https://doi.org/10.1097/PSY.0000000000000192
Bozorgmanesh, M., Hadaegh, F., & Azizi, F. (2011). Predictive performance of the visceral
adiposity index for a visceral adiposity-related risk: Type 2 Diabetes. Lipids in Health and
Disease, 10, 88. https://doi.org/10.1186/1476-511X-10-88
Braunwald, E. (2019). Diabetes, heart failure, and renal dysfunction: The vicious circles. Progress
in Cardiovascular Diseases, 62(4), 298–302. https://doi.org/10.1016/j.pcad.2019.07.003
Brinkworth, G. D., Luscombe-Marsh, N. D., Thompson, C. H., Noakes, M., Buckley, J. D., Wittert,
G., & Wilson, C. J. (2016). Long-term effects of very low-carbohydrate and high-carbohydrate
123
weight-loss diets on psychological health in obese adults with type 2 diabetes: randomized
controlled trial. Journal of Internal Medicine, 280(4), 388–397.
https://doi.org/10.1111/joim.12501
Brito, J. P., Montori, V. M., & Davis, A. M. (2017). Metabolic surgery in the treatment algorithm
for type 2 diabetes: A joint statement by international diabetes organizations. JAMA - Journal
of the American Medical Association, 317(6), 635–636.
https://doi.org/10.1001/jama.2016.20563
Brown, J. D., Buscemi, J., Milsom, V., Malcolm, R., & O’Neil, P. M. (2016). Effects on
cardiovascular risk factors of weight losses limited to 5–10 %. Translational Behavioral
Medicine, 6(3), 339–346. https://doi.org/10.1007/s13142-015-0353-9
Brown, S. A., García, A. A., Brown, A., Becker, B. J., Conn, V. S., Ramírez, G., Winter, M. A.,
Sumlin, L. L., Garcia, T. J., & Cuevas, H. E. (2016). Biobehavioral determinants of glycemic
control in type 2 diabetes: A systematic review and meta-analysis. Patient Education and
Counseling, 99(10), 1558–1567. https://doi.org/10.1016/j.pec.2016.03.020
Browne, J. L., Ventura, A., Mosely, K., & Speight, J. (2013). “I call it the blame and shame
disease”: A qualitative study about perceptions of social stigma surrounding type 2 diabetes.
BMJ Open, 3(11), e003384. https://doi.org/10.1136/bmjopen-2013-003384
Buss, J. (2014). Limitations of Body Mass Index to Assess Body Fat. Workplace Health & Safety,
62(6), 264–264. https://doi.org/10.1177/216507991406200608
Carlsson, L. M. S., Peltonen, M., Ahlin, S., Anveden, Å., Bouchard, C., Carlsson, B., Jacobson, P.,
Lönroth, H., Maglio, C., Näslund, I., Pirazzi, C., Romeo, S., Sjöholm, K., Sjöström, E., Wedel,
H., Svensson, P.-A., & Sjöström, L. (2012). Bariatric Surgery and Prevention of Type 2
Diabetes in Swedish Obese Subjects. New England Journal of Medicine, 367(8), 695–704.
https://doi.org/10.1056/nejmoa1112082
Carver, C. (2006). Insulin treatment and the problem of weight gain in type 2 diabetes. Diabetes
Educator, 32(6), 910–917. https://doi.org/10.1177/0145721706294259
124
Celano, C. M., Beale, E. E., Moore, S. V., Wexler, D. J., & Huffman, J. C. (2013). Positive
psychological characteristics in diabetes: A review. Current Diabetes Reports, 13(6), 917–929.
https://doi.org/10.1007/s11892-013-0430-8
Centers for Disease Control and Prevention. (2019a). Diabetes in Youth .
https://www.cdc.gov/diabetes/library/reports/reportcard/diabetes-in-youth-2017.html
Centers for Disease Control and Prevention. (2019b). Diabetes Tests.
https://www.cdc.gov/diabetes/basics/getting-tested.html
Centers for Disease Control and Prevention. (2020a). Getting Your Cholesterol Checked.
https://www.cdc.gov/cholesterol/cholesterol_screening.htm
Centers for Disease Control and Prevention. (2020b). High Blood Pressure Symptoms and Causes.
https://www.cdc.gov/bloodpressure/about.htm
Centers for Disease Control and Prevention. (2020c). National Diabetes Statistics Report 2020.
Estimates of diabetes and its burden in the United States.
Chakraborty, H., & Gu, H. (2009). A mixed model approach for intent-to-treat analysis in
longitudinal clinical trials with missing values. In Methods Report (Issue March, pp. 1–12).
RTI Press. https://doi.org/10.3768/rtipress.2009.mr.0009.0903
Chao, A. M., Wadden, T. A., Ashare, R. L., Loughead, J., & Schmidt, H. D. (2019). Tobacco
Smoking, Eating Behaviors, and Body Weight: a Review. Current Addiction Reports, 6, 191–
199. https://doi.org/10.1007/s40429-019-00253-3
Chatterjee, S., Khunti, K., & Davies, M. J. (2017). Type 2 diabetes. The Lancet, 389(10085), 2239–
2251. https://doi.org/10.1016/S0140-6736(17)30058-2
Chaturvedi, S. K., Gowda, S. M., Ahmed, H. U., Alosaimi, F. D., Andreone, N., Bobrov, A.,
Bulgari, V., Carrà, G., Castelnuovo, G., De Girolamo, G., Ndetei, D., Rabbani, G., Somruk, S.,
Srikanta, S., Taj, R., Valentini, U., Vukovic, O., Wölwer, W., Cimino, L., … Chaturvedi, K.
(2019). More anxious than depressed: prevalence and correlates in a 15-nation study of anxiety
disorders in people with type 2 diabetes mellitus. Psychiatry, 32, e100076.
125
https://doi.org/10.1136/gpsych-2019-100076
Chen, F., Wei, G., Wang, Y., Liu, T., Huang, T., Wei, Q., Ma, G., & Wang, D. (2019). Risk factors
for depression in elderly diabetic patients and the effect of metformin on the condition. BMC
Public Health, 19, 1063. https://doi.org/10.1186/s12889-019-7392-y
Cheng, Y. J., Kanaya, A. M., Araneta, M. R. G., Saydah, S. H., Kahn, H. S., Gregg, E. W.,
Fujimoto, W. Y., & Imperatore, G. (2019). Prevalence of Diabetes by Race and Ethnicity in
the United States, 2011-2016. JAMA - Journal of the American Medical Association, 322(24),
2389–2398. https://doi.org/10.1001/jama.2019.19365
Chew, B. H., Vos, R. C., Metzendorf, M. I., Scholten, R. J. P. M., & Rutten, G. E. H. M. (2017).
Psychological interventions for diabetes-related distress in adults with type 2 diabetes mellitus.
Cochrane Database of Systematic Reviews, 2017(9), CD011469.
https://doi.org/10.1002/14651858.CD011469.pub2
Chida, Y., & Steptoe, A. (2008). Positive psychological well-being and mortality: A quantitative
review of prospective observational studies. In Psychosomatic Medicine (Vol. 70, Issue 7, pp.
741–756). Lippincott Williams and Wilkins. https://doi.org/10.1097/PSY.0b013e31818105ba
Coffman, C. J., Edelman, D., & Woolson, R. F. (2016). To condition or not condition? Analysing
“change” in longitudinal randomised controlled trials. BMJ Open, 6(12), e013096.
https://doi.org/10.1136/bmjopen-2016-013096
Cohen, J. (1988). Statistical Power Analysis for the Behavioral Sciences (2nd ed.). Lawrence
Erlbaum Associates Publishers.
Coleman, S. M., Katon, W., Lin, E., & Von Korff, M. (2013). Depression and death in diabetes; 10-
year follow-up of all-cause and cause-specific mortality in a diabetic cohort. Psychosomatics,
54(5), 428–436. https://doi.org/10.1016/j.psym.2013.02.015
Collins, M. M., Corcoran, P., & Perry, I. J. (2009). Anxiety and depression symptoms in patients
with diabetes: Original Article: Psychology. Diabetic Medicine, 26(2), 153–161.
https://doi.org/10.1111/j.1464-5491.2008.02648.x
126
Colombo, O., Ferretti, V. V., Ferraris, C., Trentani, C., Vinai, P., Villani, S., & Tagliabue, A.
(2014). Is drop-out from obesity treatment a predictable and preventable event? Nutrition
Journal, 13(1), 13. https://doi.org/10.1186/1475-2891-13-13
Cosci, F., & Fava, G. A. (2016). The clinical inadequacy of the DSM-5 classification of somatic
symptom and related disorders: An alternative trans-diagnostic model. CNS Spectrums, 21(4),
310–317. https://doi.org/10.1017/S1092852915000760
Courcoulas, A. P., Goodpaster, B. H., Eagleton, J. K., Belle, S. H., Kalarchian, M. A., Lang, W.,
Toledo, F. G. S., & Jakicic, J. M. (2014). Surgical vs medical treatments for type 2 diabetes
mellitus: A randomized clinical trial. JAMA Surgery, 149(7), 707–715.
https://doi.org/10.1001/jamasurg.2014.467
Crane, M. M., Williams, J. L., Garcia, C. K., Jones, K., Callaway, I. N., Tangney, C. C.,
Zimmermann, L., & Lynch, E. B. (2020). A small-changes weight loss program for african-
american church members. Health Behavior and Policy Review, 7(4), 279–291.
https://doi.org/10.14485/HBPR.7.4.2
Csikszentmihalyi, M., & Csikszentmihalyi, I. (1988). Optimal experience: Psychological studies of
flow in consciousness. - PsycNET. Cambridge University Press. .
https://psycnet.apa.org/record/1988-98551-000
Curioni, C. C., & Lourenço, P. M. (2005). Long-term weight loss after diet and exercise: a
systematic review. International Journal of Obesity, 29(10), 1168–1174.
https://doi.org/10.1038/sj.ijo.0803015
Da Cunha, M. C. B., Zanetti, M. L., & Hass, V. J. (2008). Sleep quality in type 2 diabetics. Revista
Latino-Americana de Enfermagem, 16(5), 850–855. https://doi.org/10.1590/S0104-
11692008000500009
Dall, T. M., Yang, W., Gillespie, K., Mocarski, M., Byrne, E., Cintina, I., Beronja, K., Semilla, A.
P., Iacobucci, W., & Hogan, P. F. (2019). The economic burden of elevated blood glucose
levels in 2017: Diagnosed and undiagnosed diabetes, gestational diabetes mellitus, and
127
prediabetes. Diabetes Care, 42(9), 1661–1668. https://doi.org/10.2337/dc18-1226
Dalle Grave, R., Calugi, S., Molinari, E., Petroni, M. L., Bondi, M., Compare, A., & Marchesini, G.
(2005). Weight loss expectations in obese patients and treatment attrition: An observational
multicenter study. Obesity Research, 13(11), 1961–1969. https://doi.org/10.1038/oby.2005.241
Damschroder, L. J., Lutes, L. D., Goodrich, D. E., Gillon, L., & Lowery, J. C. (2010). A small-
change approach delivered via telephone promotes weight loss in veterans: Results from the
ASPIRE-VA pilot study. Patient Education and Counseling, 79(2), 262–266.
https://doi.org/10.1016/j.pec.2009.09.025
Damschroder, L. J., Lutes, L. D., Kirsh, S., Kim, H. M., Gillon, L., Holleman, R. G., Goodrich, D.
E., Lowery, J. C., & Richardson, C. R. (2014). Small-changes obesity treatment among
veterans: 12-Month outcomes. American Journal of Preventive Medicine, 47(5), 541–553.
https://doi.org/10.1016/j.amepre.2014.06.016
Darwish, L., Beroncal, E., Sison, M. V., & Swardfager, W. (2018). Depression in people with type
2 diabetes: Current perspectives. Diabetes, Metabolic Syndrome and Obesity: Targets and
Therapy, 11, 333–343. https://doi.org/10.2147/DMSO.S106797
Davies, M. J., D’Alessio, D. A., Fradkin, J., Kernan, W. N., Mathieu, C., Mingrone, G., Rossing, P.,
Tsapas, A., Wexler, D. J., & Buse, J. B. (2018). Management of hyperglycemia in type 2
diabetes, 2018. A consensus report by the American Diabetes Association (ADA) and the
european association for the study of diabetes (EASD). Diabetes Care, 41(12), 2669–2701.
https://doi.org/10.2337/dci18-0033
Dennick, K., Sturt, J., Hessler, D., Purssell, E., Hunter, B., Oliver, J., & Fisher, L. (2015). High
rates of elevated diabetes distress in research populations: A systematic review and meta-
analysis. International Diabetes Nursing, 12(3), 93–107.
https://doi.org/10.1080/20573316.2016.1202497
Dennick, K., Sturt, J., & Speight, J. (2017). What is diabetes distress and how can we measure it? A
narrative review and conceptual model. Journal of Diabetes and Its Complications, 31(5),
128
898–911. https://doi.org/10.1016/j.jdiacomp.2016.12.018
Di Cesare, M., Bentham, J., Stevens, G. A., Zhou, B., Danaei, G., Lu, Y., Bixby, H., Cowan, M. J.,
Riley, L. M., Hajifathalian, K., Fortunato, L., Taddei, C., Bennett, J. E., Ikeda, N., Khang, Y.
H., Kyobutungi, C., Laxmaiah, A., Li, Y., Lin, H. H., … Cisneros, J. Z. (2016). Trends in adult
body-mass index in 200 countries from 1975 to 2014: A pooled analysis of 1698 population-
based measurement studies with 19.2 million participants. The Lancet, 387(10026), 1377–
1396. https://doi.org/10.1016/S0140-6736(16)30054-X
Diener, E., Pressman, S. D., Hunter, J., & Delgadillo-Chase, D. (2017). If, Why, and When
Subjective Well-Being Influences Health, and Future Needed Research. Applied Psychology:
Health and Well-Being, 9(2), 133–167. https://doi.org/10.1111/aphw.12090
Diener, E., Suh, E. M., Lucas, R. E., & Smith, H. L. (1999). Subjective well-being: Three decades
of progress. Psychological Bulletin, 125(2), 276–302. https://doi.org/10.1037/0033-
2909.125.2.276
Dirmaier, J., Watzke, B., Koch, U., Schulz, H., Lehnert, H., Pieper, L., & Wittchen, H. U. (2010).
Diabetes in primary care: Prospective associations between depression, nonadherence and
glycemic control. Psychotherapy and Psychosomatics, 79(3), 172–178.
https://doi.org/10.1159/000296135
Dixon, J. B. (2009). Obesity and diabetes: The impact of bariatric surgery on type-2 diabetes. World
Journal of Surgery, 33(10), 2014–2021. https://doi.org/10.1007/s00268-009-0062-y
Dogan, B., Oner, C., Akalin, A. A., Ilhan, B., Caklili, O. T., & Oguz, A. (2019). Psychiatric
symptom rate of patients with Diabetes Mellitus: A case control study. Diabetes and Metabolic
Syndrome: Clinical Research and Reviews, 13(2), 1059–1063.
https://doi.org/10.1016/j.dsx.2019.01.045
Dong, D., Lou, P., Wang, J., Zhang, P., Sun, J., Chang, G., & Xu, C. (2020). Interaction of sleep
quality and anxiety on quality of life in individuals with type 2 diabetes mellitus. Health and
Quality of Life Outcomes, 18(1), 150. https://doi.org/10.1186/s12955-020-01406-z
129
Dong, R., Stefan, G., Horrocks, J., Goodday, S. M., & Duffy, A. (2019). Investigating the
association between anxiety symptoms and mood disorder in high-risk offspring of bipolar
parents: a comparison of Joint and Cox models. International Journal of Bipolar Disorders,
7(1). https://doi.org/10.1186/s40345-019-0157-9
dos Santos, M. A. B., Ceretta, L. B., Réus, G. Z., Abelaira, H. M., Jornada, L. K., Schwalm, M. T.,
Neotti, M. V., Tomazzi, C. D., Gulbis, K. G., Ceretta, R. A., & Quevedo, J. (2014). Anxiety
disorders are associated with quality of life impairment in patients with insulin-dependent type
2 diabetes: A case-control study. Revista Brasileira de Psiquiatria, 36(4), 298–304.
https://doi.org/10.1590/1516-4446-2013-1230
Einarson, T. R., Acs, A., Ludwig, C., & Panton, U. H. (2018). Prevalence of cardiovascular disease
in type 2 diabetes: A systematic literature review of scientific evidence from across the world
in 2007-2017. Cardiovascular Diabetology, 17(1), 83. https://doi.org/10.1186/s12933-018-
0728-6
El Mahalli, A. A. (2015). Prevalence and Predictors of Depression among Type 2 Diabetes Mellitus
Outpatients in Eastern Province, Saudi Arabia - PubMed. International Journal of Health
Sciences, 9(2), 119–126. https://pubmed.ncbi.nlm.nih.gov/26309430/
Eledrisi, M., & Elzouki, A.-N. (2020). Management of diabetic ketoacidosis in adults: A narrative
review. Saudi Journal of Medicine and Medical Sciences, 8(3), 173.
https://doi.org/10.4103/sjmms.sjmms_478_19
Elovainio, M., Merjonen, P., Pulkki-Råback, L., Kivimäki, M., Jokela, M., Mattson, N., Koskinen,
T., Viikari, J. S. A., Raitakari, O. T., & Keltikangas-Järvinen, L. (2011). Hostility, metabolic
syndrome, inflammation and cardiac control in young adults: The Young Finns Study.
Biological Psychology, 87(2), 234–240. https://doi.org/10.1016/j.biopsycho.2011.03.002
Esposito, K., Maiorino, M. I., Bellastella, G., Chiodini, P., Panagiotakos, D., & Giugliano, D.
(2015). A journey into a Mediterranean diet and type 2 diabetes: A systematic review with
meta-analyses. BMJ Open, 5(8), e008222. https://doi.org/10.1136/bmjopen-2015-008222
130
Evert, A. B., Boucher, J. L., Cypress, M., Dunbar, S. A., Franz, M. J., Mayer-Davis, E. J.,
Neumiller, J. J., Nwankwo, R., Verdi, C. L., Urbanski, P., & Yancy, W. S. (2013). Nutrition
therapy recommendations for the management of adults with diabetes. Diabetes Care, 36(11),
3821–3842. https://doi.org/10.2337/dc13-2042
Fava, G. A., Kellner, R., Perini, G. I., Fava, M., Michelacci, L., Munari, F., Evangelisti, L. P.,
Grandi, S., Bernardi, M., & Mastrogiacomo, I. (1983). Italian validation of the symptom rating
test (SRT) and symptom questionnaire (SQ). Canadian Journal of Psychiatry, 28(2), 117–123.
https://doi.org/10.1177/070674378302800208
Fava, G. A., Rafanelli, C., Cazzaro, M., Conti, S., & Grandi, S. (1998). Well-being therapy. A novel
psychotherapeutic approach for residual symptoms of affective disorders. Psychological
Medicine, 28(2), 475–480. https://doi.org/10.1017/S0033291797006363
Fava, G.A. (2016a). Well-being therapy: treatment manual and clinical applications. Karger.
https://doi.org/10.1159/isbn.978-3-318-05822-2
Fava, G.A. (2016b). Well-Being Therapy: Current Indications and Emerging Perspectives.
Psychotherapy and Psychosomatics, 85(3), 136–145. https://doi.org/10.1159/000444114
Fava, G.A., & Bech, P. (2016). The concept of euthymia. Psychotherapy and Psychosomatics,
85(1), 1–5. https://doi.org/10.1159/000441244
Fava, G.A., Cosci, F., & Sonino, N. (2017). Current Psychosomatic Practice. In Psychotherapy and
Psychosomatics (Vol. 86, Issue 1, pp. 13–30). S. Karger AG.
https://doi.org/10.1159/000448856
Fava, G.A., & Guidi, J. (2020). The pursuit of euthymia. World Psychiatry, 19(1), 40–50.
https://doi.org/10.1002/wps.20698
Fava, G.A., Ruini, C., & Rafanelli, C. (2004). Psychometric theory is an obstacle to the progress of
clinical research. Psychotherapy and Psychosomatics, 73(3), 145–148.
https://doi.org/10.1159/000076451
Feinstein, A. R. (1982). The Jones criteria and the challenges of clinimetrics. Circulation, 66(1), 1–
131
5. https://doi.org/10.1161/01.cir.66.1.1
Felix, J., Stark, R., Teuner, C., Leidl, R., Lennerz, B., Brandt, S., Von Schnurbein, J., Moss, A.,
Bollow, E., Sergeyev, E., Mühlig, Y., Wiegand, S., Holl, R. W., Reinehr, T., Kiess, W.,
Scherag, A., Hebebrand, J., Wabitsch, M., & Holle, R. (2020). Health related quality of life
associated with extreme obesity in adolescents - Results from the baseline evaluation of the
YES-study. Health and Quality of Life Outcomes, 18(1). https://doi.org/10.1186/s12955-020-
01309-z
Feng, X., & Astell-Burt, T. (2017). Impact of a type 2 diabetes diagnosis on mental health, quality
of life, and social contacts: A longitudinal study. BMJ Open Diabetes Research and Care,
5(1), e000198. https://doi.org/10.1136/bmjdrc-2016-000198
First, M., Williams, J., Karg, R., & Spitzer, R. (2016). Structured Clinical Interview for DSM-5
Disorders, Clinician Version (SCID-5-CV). American Psychiatric Association.
Fisher, L., Mullan, J. T., Skaff, M. M., Glasgow, R. E., Arean, P., & Hessler, D. (2009). Predicting
diabetes distress in patients with Type 2 diabetes: A longitudinal study. Diabetic Medicine,
26(6), 622–627. https://doi.org/10.1111/j.1464-5491.2009.02730.x
Fisher, L., Skaff, M. M., Mullan, J. T., Arean, P., Glasgow, R., & Masharani, U. (2008). A
longitudinal study of affective and anxiety disorders, depressive affect and diabetes distress in
adults with type 2 diabetes. Diabetic Medicine, 25(9), 1096–1101.
https://doi.org/10.1111/j.1464-5491.2008.02533.x
Fisher, L., Mullan, J. T., Arean, P., Glasgow, R. E., Hessler, D., & Masharani, U. (2010). Diabetes
distress but not clinical depression or depressive symptoms is associated with glycemic control
in both cross-sectional and longitudinal analyses. Diabetes Care, 33(1), 23–28.
https://doi.org/10.2337/dc09-1238
Fisher, L., Skaff, M. M., Mullan, J. T., Arean, P., Mohr, D., Masharani, U., Glasgow, R., &
Laurencin, G. (2007). Clinical depression versus distress among patients with type 2 diabetes:
Not just a question of semantics. Diabetes Care, 30(3), 542–548. https://doi.org/10.2337/dc06-
132
1614
Fonda, S. J., McMahon, G. T., Gomes, H. E., Hickson, S., & Conlin, P. R. (2009). Changes in
diabetes distress related to participation in an internet-based diabetes care management
program and glycemic control. Journal of Diabetes Science and Technology, 3(1), 117–124.
https://doi.org/10.1177/193229680900300113
Forouhi, N. G., Misra, A., Mohan, V., Taylor, R., & Yancy, W. (2018). Dietary and nutritional
approaches for prevention and management of type 2 diabetes. BMJ (Online), 361, k2234.
https://doi.org/10.1136/bmj.k2234
Franks, P. W., Pearson, E., & Florez, J. C. (2013). Gene-environment and gene-treatment
interactions in type 2 diabetes: Progress, pitfalls, and prospects. Diabetes Care, 36(5), 1413–
1421. https://doi.org/10.2337/dc12-2211
Franz, M. J., Boucher, J. L., Rutten-Ramos, S., & VanWormer, J. J. (2015). Lifestyle Weight-Loss
Intervention Outcomes in Overweight and Obese Adults with Type 2 Diabetes: A Systematic
Review and Meta-Analysis of Randomized Clinical Trials. Journal of the Academy of
Nutrition and Dietetics, 115(9), 1447–1463. https://doi.org/10.1016/j.jand.2015.02.031
Fredrickson, B. L. (2001). The role of positive emotions in positive psychology: The broaden-and-
build theory of positive emotions. American Psychologist, 56(3), 218–226.
https://doi.org/10.1037/0003-066X.56.3.218
Frühbeck, G., Toplak, H., Woodward, E., Yumuk, V., Maislos, M., & Oppert, J. M. (2013).
Obesity: The gateway to ill health - An EASO position statement on a rising public health,
clinical and scientific challenge in Europe. Obesity Facts, 6(2), 117–120.
https://doi.org/10.1159/000350627
Fuchsberger, C., Flannick, J., Teslovich, T. M., Mahajan, A., Agarwala, V., Gaulton, K. J., Ma, C.,
Fontanillas, P., Moutsianas, L., McCarthy, D. J., Rivas, M. A., Perry, J. R. B., Sim, X.,
Blackwell, T. W., Robertson, N. R., Rayner, N. W., Cingolani, P., Locke, A. E., Tajes, J. F., …
McCarthy, M. I. (2016). The genetic architecture of type 2 diabetes. Nature, 536(7614), 41–47.
133
https://doi.org/10.1038/nature18642
Furukawa, T. A., Noma, H., Caldwell, D. M., Honyashiki, M., Shinohara, K., Imai, H., Chen, P.,
Hunot, V., & Churchill, R. (2014). Waiting list may be a nocebo condition in psychotherapy
trials: A contribution from network meta-analysis. Acta Psychiatrica Scandinavica, 130(3),
181–192. https://doi.org/10.1111/acps.12275
Gahlan, D., Rajput, R., Gehlawat, P., & Gupta, R. (2018). Prevalence and determinants of diabetes
distress in patients of diabetes mellitus in a tertiary care centre. Diabetes and Metabolic
Syndrome: Clinical Research and Reviews, 12(3), 333–336.
https://doi.org/10.1016/j.dsx.2017.12.024
Galeazzi, G. M., Ferrari, S., Mackinnon, A., & Rigatelli, M. (2004). Interrater reliability,
prevalence, and relation to ICD-10 diagnoses of the Diagnostic Criteria for Psychosomatic
Research in consultation-liaison psychiatry patients. Psychosomatics, 45(5), 386–393.
https://doi.org/10.1176/appi.psy.45.5.386
Galicia-Garcia, U., Benito-Vicente, A., Jebari, S., Larrea-Sebal, A., Siddiqi, H., Uribe, K. B.,
Ostolaza, H., & Martín, C. (2020). Pathophysiology of type 2 diabetes mellitus. International
Journal of Molecular Sciences, 21(17), 1–34. https://doi.org/10.3390/ijms21176275
Geiker, N. R. W., Astrup, A., Hjorth, M. F., Sjödin, A., Pijls, L., & Markus, C. R. (2018). Does
stress influence sleep patterns, food intake, weight gain, abdominal obesity and weight loss
interventions and vice versa? Obesity Reviews, 19(1), 81–97.
https://doi.org/10.1111/obr.12603
Giannuzzi, P., Temporelli, P. L., Maggioni, A. P., Ceci, V., Chieffo, C., Gattone, M., Griffo, R.,
Marchioli, R., Schweiger, C., Tavazzi, L., Urbinati, S., Valagussa, F., & Vanuzzo, D. (2005).
GlObal Secondary Prevention strategiEs to Limit event recurrence after myocardial infarction:
the GOSPEL study. A trial from the Italian Cardiac Rehabilitation Network: rationale and
design. European Journal of Cardiovascular Prevention & Rehabilitation, 12(6), 555–561.
https://doi.org/10.1097/01.hjr.0000186623.60486.26
134
Giannuzzi, P., Temporelli, P. L., Marchioli, R., Maggioni, A. P., Balestroni, G., Ceci, V., Chieffo,
C., Gattone, M., Griffo, R., Schweiger, C., Tavazzi, L., Urbinati, S., Valagussa, F., Vanuzzo,
D., Girardini, D., Francesconi, G., Vona, M., Santoni, R., Sarno, C., … Garbin, R. (2008).
Global secondary prevention strategies to limit event recurrence after myocardial infarction:
Results of the GOSPEL study, a multicenter, randomized controlled trial from the Italian
Cardiac Rehabilitation Network. Archives of Internal Medicine, 168(20), 2194–2204.
https://doi.org/10.1001/archinte.168.20.2194
Glovaci, D., Fan, W., & Wong, N. D. (2019). Epidemiology of Diabetes Mellitus and
Cardiovascular Disease. Current Cardiology Reports, 21(4), 21.
https://doi.org/10.1007/s11886-019-1107-y
Gnavi, R., Migliardi, A., Maggini, M., & Costa, G. (2018). Prevalence of and secular trends in
diagnosed diabetes in Italy: 1980–2013. Nutrition, Metabolism and Cardiovascular Diseases,
28(3), 219–225. https://doi.org/10.1016/j.numecd.2017.12.004
Goldberg, D. (2011). The heterogeneity of “major depression.” In World Psychiatry (Vol. 10, Issue
3, pp. 226–228). Blackwell Publishing Ltd. https://doi.org/10.1002/j.2051-
5545.2011.tb00061.x
Grigsby, A. B., Anderson, R. J., Freedland, K. E., Clouse, R. E., & Lustman, P. J. (2002).
Prevalence of anxiety in adults with diabetes a systematic review. Journal of Psychosomatic
Research, 53(6), 1053–1060. https://doi.org/10.1016/S0022-3999(02)00417-8
Grøntved, A., & Hu, F. B. (2011). Television viewing and risk of type 2 diabetes, cardiovascular
disease, and all-cause mortality: A meta-analysis. JAMA - Journal of the American Medical
Association, 305(23), 2448–2455. https://doi.org/10.1001/jama.2011.812
Guerrero Fernández de Alba, I., Gimeno-Miguel, A., Poblador-Plou, B., Gimeno-Feliu, L. A.,
Ioakeim-Skoufa, I., Rojo-Martínez, G., Forjaz, M. J., & Prados-Torres, A. (2020). Association
between mental health comorbidity and health outcomes in type 2 diabetes mellitus patients.
Scientific Reports, 10(1), 19583. https://doi.org/10.1038/s41598-020-76546-9
135
Guh, D. P., Zhang, W., Bansback, N., Amarsi, Z., Birmingham, C. L., & Anis, A. H. (2009). The
incidence of co-morbidities related to obesity and overweight: A systematic review and meta-
analysis. BMC Public Health, 9, 88. https://doi.org/10.1186/1471-2458-9-88
Guidi, J., Brakemeier, E. L., Bockting, C. L. H., Cosci, F., Cuijpers, P., Jarrett, R. B., Linden, M.,
Marks, I., Peretti, C. S., Rafanelli, C., Rief, W., Schneider, S., Schnyder, U., Sensky, T.,
Tomba, E., Vazquez, C., Vieta, E., Zipfel, S., Wright, J. H., & Fava, G. A. (2018).
Methodological Recommendations for Trials of Psychological Interventions. Psychotherapy
and Psychosomatics, 87(5), 276–284. https://doi.org/10.1159/000490574
Hackett, R. A., Lazzarino, A. I., Carvalho, L. A., Hamer, M., & Steptoe, A. (2015). Hostility and
physiological responses to acute stress in people with type 2 diabetes. Psychosomatic
Medicine, 77(4), 458–466. https://doi.org/10.1097/PSY.0000000000000172
Halperin, F., Ding, S. A., Simonson, D. C., Panosian, J., Goebel-Fabbri, A., Wewalka, M., Hamdy,
O., Abrahamson, M., Clancy, K., Foster, K., Lautz, D., Vernon, A., & Goldfine, A. B. (2014).
Roux-en-Y gastric bypass surgery or lifestyle with intensive medical management in patients
with type 2 diabetes: Feasibility and 1-year results of a randomized clinical trial. JAMA
Surgery, 149(7), 716–726. https://doi.org/10.1001/jamasurg.2014.514
Hamieh, N., Meneton, P., Zins, M., Goldberg, M., Wiernik, E., Empana, J.-P., Limosin, F.,
Melchior, M., & Lemogne, C. (2020). Hostility, depression and incident cardiac events in the
GAZEL cohort. Journal of Affective Disorders, 266, 381–386.
https://doi.org/10.1016/j.jad.2020.01.164
Hemmingsen, B., Gimenez-Perez, G., Mauricio, D., Roqué i Figuls, M., Metzendorf, M. I., &
Richter, B. (2017). Diet, physical activity or both for prevention or delay of type 2 diabetes
mellitus and its associated complications in people at increased risk of developing type 2
diabetes mellitus. Cochrane Database of Systematic Reviews, 12(12), CD003054.
https://doi.org/10.1002/14651858.CD003054.pub4
Henning, R. J. (2018). Type-2 diabetes mellitus and cardiovascular disease. Future Cardiology,
136
14(6), 491–509. https://doi.org/10.2217/fca-2018-0045
Hermanns, N., Kulzer, B., Krichbaum, M., Kubiak, T., & Haak, T. (2005). Affective and anxiety
disorders in a German sample of diabetic patients: Prevalence, comorbidity and risk factors.
Diabetic Medicine, 22(3), 293–300. https://doi.org/10.1111/j.1464-5491.2005.01414.x
Hicks, C. W., & Selvin, E. (2019). Epidemiology of Peripheral Neuropathy and Lower Extremity
Disease in Diabetes. Current Diabetes Reports, 19(10), 86. https://doi.org/10.1007/s11892-
019-1212-8
Hill, J. O. (2009). Can a small-changes approach help address the obesity epidemic? a report of the
joint task force of the american society for nutrition, institute of food technologists, and
international food information council. American Journal of Clinical Nutrition, 89(2), 477–
484. https://doi.org/10.3945/ajcn.2008.26566
Hills, A. P., Byrne, N. M., Lindstrom, R., & Hill, J. O. (2013). Small changes to diet and physical
activity behaviors for weight management. Obesity Facts, 6(3), 228–238.
https://doi.org/10.1159/000345030
Huta, V., & Waterman, A. S. (2014). Eudaimonia and Its Distinction from Hedonia: Developing a
Classification and Terminology for Understanding Conceptual and Operational Definitions.
Journal of Happiness Studies, 15(6), 1425–1456. https://doi.org/10.1007/s10902-013-9485-0
Indelicato, L., Dauriz, M., Santi, L., Bonora, F., Negri, C., Cacciatori, V., Targher, G., Trento, M.,
& Bonora, E. (2017). Psychological distress, self-efficacy and glycemic control in type 2
diabetes. Nutrition, Metabolism and Cardiovascular Diseases, 27(4), 300–306.
https://doi.org/10.1016/j.numecd.2017.01.006
Inelmen, E. M., Toffanello, E. D., Enzi, G., Gasparini, G., Miotto, F., Sergi, G., & Busetto, L.
(2005). Predictors of drop-out in overweight and obese outpatients. International Journal of
Obesity, 29(1), 122–128. https://doi.org/10.1038/sj.ijo.0802846
Ismail, K., Winkley, K., & Rabe-Hesketh, S. (2004). Systematic review and meta-analysis of
randomised controlled trials of psychological interventions to improve glycaemic control in
137
patients with type 2 diabetes. Lancet, 363(9421), 1589–1597. https://doi.org/10.1016/S0140-
6736(04)16202-8
Jafari-Koshki, T., Mansourian, M., Hosseini, S. M., & Amini, M. (2016). Association of waist and
hip circumference and waist-hip ratio with type 2 diabetes risk in first-degree relatives.
Journal of Diabetes and Its Complications, 30(6), 1050–1055.
https://doi.org/10.1016/j.jdiacomp.2016.05.003
Jahoda, M. (1958). Current concepts of positive mental health. Basic Books.
Jehan, S., Zizi, F., Pandi-Perumal, S. R., Mcfarlane, S. I., Jean-Louis, G., & Myers, A. K. (2020).
Energy imbalance: obesity, associated comorbidities, prevention, management and public
health implications. Advances in Obesity, Weight Management & Control, 10(5), 161.
https://www.cdc.gov/nchs/products/databriefs/db360.htm
Jonasson, J. M., Hendryx, M., Manson, J. A. E., Dinh, P., Garcia, L., Liu, S., & Luo, J. (2019).
Personality traits and the risk of coronary heart disease or stroke in women with diabetes-an
epidemiological study based on the Women’s Health Initiative. Menopause, 26(10), 1117–
1124. https://doi.org/10.1097/GME.0000000000001382
Joosten, M. M., Beulens, J. W. J., Kersten, S., & Hendriks, H. F. J. (2008). Moderate alcohol
consumption increases insulin sensitivity and ADIPOQ expression in postmenopausal women:
A randomised, crossover trial. Diabetologia, 51(8), 1375–1381.
https://doi.org/10.1007/s00125-008-1031-y
Juruena, M. F. (2012). Understanding subthreshold depression. Shanghai Archives of Psychiatry,
24(5), 292–293. https://doi.org/10.3969/j.issn.1002-0829.2012.05.009
Kalra, S., Balhara, Y. P. S., & Bathla, M. (2018). Euthymia in Diabetes. European Endocrinology,
14(2), 18–19. https://doi.org/10.17925/ee.2018.14.2.18
Kamrul-Hasan, A. B., Palash-Molla, M., Mainul-Ahsan, M., Gaffar, A. J., Asaduzzaman, M.,
Saifuddin, M., Rahman, M. S., Akter, F., Rahman, H., Talukder, S. K., Islam, M., Chanda, P.
K., Siddiqui, N. I., & Selim, S. (2019). Prevalence and Predictors of Depression among
138
Patients with Type 2 Diabetes: A Multicenter Cross-sectional Study from Bangladesh.
Mymensingh Medical Journal : MMJ, 28(1), 23–30.
http://www.ncbi.nlm.nih.gov/pubmed/30755546
Karstoft, K., & Pedersen, B. K. (2016). Exercise and type 2 diabetes: Focus on metabolism and
inflammation. Immunology and Cell Biology, 94(2), 146–150.
https://doi.org/10.1038/icb.2015.101
Katon, W. (2010). Depression and diabetes: Unhealthy bedfellows. Depression and Anxiety, 27(4),
323–326. https://doi.org/10.1002/da.20683
Katon, W., Von Korff, M., Ciechanowski, P., Russo, J., Lin, E., Simon, G., Ludman, E., Walker, E.,
Bush, T., & Young, B. (2004). Behavioral and Clinical Factors Associated with Depression
among Individuals with Diabetes. Diabetes Care, 27(4), 914–920.
https://doi.org/10.2337/diacare.27.4.914
Katz, D. L. (2005). Competing dietary claims for weight loss: Finding the Forest Through Truculent
Trees. Annu. Rev. Public Health, 26(38), 61–88.
https://doi.org/10.1146/annurev.publhealth.26.021304.144415
Kellner, R. (1987). A symptom questionnaire. The Journal of Clinical Psychiatry, 48(7), 268–274.
https://pubmed.ncbi.nlm.nih.gov/3597327/
Kellner, R., Abbotf, P., Winslow, W. W., & Pathak, D. (1989). Anxiety, Depression, and
Somatization in DSM-III Hypochondriasis. Psychosomatics, 30(1), 57–64.
https://doi.org/10.1016/S0033-3182(89)72318-5
Kellner, R. (1972). Part 2. Improvement criteria in drug trials with neurotic patients. Psychological
Medicine, 2(1), 73–80. https://doi.org/10.1017/S0033291700045645
Kelly, T., Yang, W., Chen, C. S., Reynolds, K., & He, J. (2008). Global burden of obesity in 2005
and projections to 2030. International Journal of Obesity, 32(9), 1431–1437.
https://doi.org/10.1038/ijo.2008.102
Khaledi, M., Haghighatdoost, F., Feizi, A., & Aminorroaya, A. (2019). The prevalence of comorbid
139
depression in patients with type 2 diabetes: an updated systematic review and meta-analysis on
huge number of observational studies. In Acta Diabetologica (Vol. 56, Issue 6). Springer-
Verlag Italia s.r.l. https://doi.org/10.1007/s00592-019-01295-9
Khan, M. A. B., Hashim, M. J., King, J. K., Govender, R. D., Mustafa, H., & Kaabi, J. Al. (2020).
Epidemiology of Type 2 diabetes - Global burden of disease and forecasted trends. Journal of
Epidemiology and Global Health, 10(1), 107–111.
https://doi.org/10.2991/JEGH.K.191028.001
Khan, Z. D., Lutale, J., & Moledina, S. M. (2019). Prevalence of Depression and Associated
Factors among Diabetic Patients in an Outpatient Diabetes Clinic. Psychiatry Journal, 2019,
1–6. https://doi.org/10.1155/2019/2083196
Khera, R., Murad, M. H., Chandar, A. K., Dulai, P. S., Wang, Z., Prokop, L. J., Loomba, R.,
Camilleri, M., & Singh, S. (2016). Association of pharmacological treatments for obesity
withweight loss and adverse events a systematic review and meta-analysis. JAMA - Journal of
the American Medical Association, 315(22), 2424–2434.
https://doi.org/10.1001/jama.2016.7602
Kim, E. S., Hagan, K. A., Grodstein, F., DeMeo, D. L., De Vivo, I., & Kubzansky, L. D. (2017).
Optimism and cause-specific mortality: A prospective cohort study. American Journal of
Epidemiology, 185(1), 21–29. https://doi.org/10.1093/aje/kww182
Kirwan, J. P., Sacks, J., & Nieuwoudt, S. (2017). The essential role of exercise in the management
of type 2 diabetes. Cleveland Clinic Journal of Medicine, 84(7 Suppl 1), S15–S21.
https://doi.org/10.3949/ccjm.84.s1.03
Kitabchi, A. E., Umpierrez, G. E., Miles, J. M., & Fisher, J. N. (2009). Hyperglycemic crises in
adult patients with diabetes. Diabetes Care, 32(7), 1335–1343. https://doi.org/10.2337/dc09-
9032
Knott, C., Bell, S., & Britton, A. (2015). Alcohol consumption and the risk of type 2 diabetes: A
systematic review and Dose-Response Meta-analysis of more than 1.9 million individuals from
140
38 observational studies. Diabetes Care, 38(9), 1804–1812. https://doi.org/10.2337/dc15-0710
Kreider, K. E. (2017). Diabetes Distress or Major Depressive Disorder? A Practical Approach to
Diagnosing and Treating Psychological Comorbidities of Diabetes. Diabetes Therapy, 8(1), 7.
https://doi.org/10.1007/s13300-017-0231-1
Kushner, R. F. (2014). Weight loss strategies for treatment of obesity. Progress in Cardiovascular
Diseases, 56(4), 465–472. https://doi.org/10.1016/j.pcad.2013.09.005
Lautz, D., Halperin, F., Goebel-Fabbri, A., & Goldfine, A. B. (2011). The great debate: Medicine or
surgery: What is best for the patient with type 2 diabetes? Diabetes Care, 34(3), 763–770.
https://doi.org/10.2337/dc10-1859
Lee, Y. Y., Stockings, E. A., Harris, M. G., Doi, S. A. R., Page, I. S., Davidson, S. K., &
Barendregt, J. J. (2019). The risk of developing major depression among individuals with
subthreshold depression: A systematic review and meta-analysis of longitudinal cohort studies.
Psychological Medicine, 49(1), 92–102. https://doi.org/10.1017/s0033291718000557
Leonardi, F. (2018). The Definition of Health: Towards New Perspectives. International Journal of
Health Services, 48(4), 735–748. https://doi.org/10.1177/0020731418782653
Leung, A. W. Y., Chan, R. S. M., Sea, M. M. M., & Woo, J. (2017). An overview of factors
associated with adherence to lifestyle modification programs for weight management in adults.
International Journal of Environmental Research and Public Health, 14(8), 922.
https://doi.org/10.3390/ijerph14080922
Lin, E. H. B., Rutter, C. M., Katon, W., Heckbert, S. R., Ciechanowski, P., Oliver, M. M., Ludman,
E. J., Young, B. A., Williams, L. H., McCulloch, D. K., & Von Korff, M. (2010). Depression
and advanced complications of diabetes: A prospective cohort study. Diabetes Care, 33(2),
264–269. https://doi.org/10.2337/dc09-1068
Litwak, L., Goh, S. Y., Hussein, Z., Malek, R., Prusty, V., & Khamseh, M. E. (2013). Prevalence of
diabetes complications in people with type 2 diabetes mellitus and its association with baseline
characteristics in the multinational A1chieve study. Diabetology and Metabolic Syndrome,
141
5(1), 57. https://doi.org/10.1186/1758-5996-5-57
Lloyd, C. E., Nouwen, A., Sartorius, N., Ahmed, H. U., Alvarez, A., Bahendeka, S., Basangwa, D.,
Bobrov, A. E., Boden, S., Bulgari, V., Burti, L., Chaturvedi, S. K., Cimino, L. C., Gaebel, W.,
de Girolamo, G., Gondek, T. M., de Braude, M. G., Guntupalli, A., Heinze, M. G., … Xin, Y.
(2018). Prevalence and correlates of depressive disorders in people with Type 2 diabetes:
results from the International Prevalence and Treatment of Diabetes and Depression
(INTERPRET-DD) study, a collaborative study carried out in 14 countries. Diabetic Medicine,
35(6), 760–769. https://doi.org/10.1111/dme.13611
Lustman, P. J., Anderson, R. J., Freedland, K. E., De Groot, M., Carney, R. M., & Clouse, R. E.
(2000). Depression and poor glycemic control: A meta-analytic review of the literature.
Diabetes Care, 23(7), 934–942. https://doi.org/10.2337/diacare.23.7.934
Lutes, L. D., Daiss, S. R., Barger, S. D., Read, M., Steinbaugh, E., & Winett, R. A. (2012). Small
changes approach promotes initial and continued weight loss with a phone-based followup:
Nine-month outcomes From ASPIRES II. American Journal of Health Promotion, 26(4), 235–
238. https://doi.org/10.4278/ajhp.090706-QUAN-216
Lutes, L. D., Damschroder, L. J., Masheb, R., Kim, H. M., Gillon, L., Holleman, R. G., Goodrich,
D. E., Lowery, J. C., Janney, C., Kirsh, S., & Richardson, C. R. (2017). Behavioral Treatment
for Veterans with Obesity: 24-Month Weight Outcomes from the ASPIRE-VA Small Changes
Randomized Trial. Journal of General Internal Medicine, 32(Suppl 1), 40–47.
https://doi.org/10.1007/s11606-017-3987-0
Lutes, L. D., Winett, R. A., Barger, S. D., Wojcik, J. R., Herbert, W. G., Nickols-Richardson, S. M.,
& Anderson, E. S. (2008). Small changes in nutrition and physical activity promote weight
loss and maintenance: 3-Month evidence from the ASPIRE randomized trial. Annals of
Behavioral Medicine, 35(3), 351–357. https://doi.org/10.1007/s12160-008-9033-z
Maciejewski, M. L., Arterburn, D. E., Van Scoyoc, L., Smith, V. A., Yancy, W. S., Weidenbacher,
H. J., Livingston, E. H., & Olsen, M. K. (2016). Bariatric surgery and long-term durability of
142
weight loss. JAMA Surgery, 151(11), 1046–1055. https://doi.org/10.1001/jamasurg.2016.2317
Maddatu, J., Anderson-Baucum, E., & Evans-Molina, C. (2017). Smoking and the risk of type 2
diabetes. Translational Research, 184, 101–107. https://doi.org/10.1016/j.trsl.2017.02.004
Mangelli, L., Semprini, F., Sirri, L., Fava, G. A., & Sonino, N. (2006). Use of the Diagnostic
Criteria for Psychosomatic Research (DCPR) in a community sample. Psychosomatics, 47(2),
143–146. https://doi.org/10.1176/appi.psy.47.2.143
Mannucci, E., Tesi, F., Ricca, V., Pierazzuoli, E., Barciulli, E., Moretti, S., Di Bernardo, M.,
Travaglini, R., Carrara, S., Zucchi, T., Placidi, G. F., & Rotella, C. M. (2002). Eating behavior
in obese patients with and without type 2 diabetes mellitus. International Journal of Obesity,
26(6), 848–853. https://doi.org/10.1038/sj.ijo.0801976
Markowitz, S. M., Gonzalez, J. S., Wilkinson, J. L., & Safren, S. A. (2011). A review of treating
depression in diabetes: Emerging findings. Psychosomatics, 52(1), 1–18.
https://doi.org/10.1016/j.psym.2010.11.007
Martinus, R., Corban, R., Wackerhage, H., Atkins, S., & Singh, J. (2006). Effect of psychological
intervention on exercise adherence in type 2 diabetic subjects. Annals of the New York
Academy of Sciences, 1084, 350–360. https://doi.org/10.1196/annals.1372.024
Massey, C. N., Feig, E. H., Duque-Serrano, L., Wexler, D., Moskowitz, J. T., & Huffman, J. C.
(2019). Well-being interventions for individuals with diabetes: A systematic review. Diabetes
Research and Clinical Practice, 147, 118–133. https://doi.org/10.1016/j.diabres.2018.11.014
Mathew, M., Abish, A., Kuriakose, A., Isaiah, J. R., A M, K., & K, V. (2013). Predictors of
depression among patients with diabetes mellitus in Southern India. Asian Journal of
Psychiatry, 6(4), 313–317. https://doi.org/10.1016/j.ajp.2013.01.012
Mathiesen, A. S., Egerod, I., Jensen, T., Kaldan, G., Langberg, H., & Thomsen, T. (2019).
Psychosocial interventions for reducing diabetes distress in vulnerable people with type 2
diabetes mellitus: A systematic review and meta-analysis. Diabetes, Metabolic Syndrome and
Obesity: Targets and Therapy, 12, 19–33. https://doi.org/10.2147/DMSO.S179301
143
Miller, C. K., Kristeller, J. L., Headings, A., Nagaraja, H., & Miser, W. F. (2012). Comparative
Effectiveness of a Mindful Eating Intervention to a Diabetes Self-Management Intervention
among Adults with Type 2 Diabetes: A Pilot Study. Journal of the Academy of Nutrition and
Dietetics, 112(11), 1835–1842. https://doi.org/10.1016/j.jand.2012.07.036
Misra, S., & Oliver, N. S. (2015). Diabetic ketoacidosis in adults. BMJ (Online), 351, h5660.
https://doi.org/10.1136/bmj.h5660
Moroshko, I., Brennan, L., & O’Brien, P. (2011). Predictors of dropout in weight loss interventions:
A systematic review of the literature. Obesity Reviews, 12(11), 912–934.
https://doi.org/10.1111/j.1467-789X.2011.00915.x
Moskowitz, J. T., Carrico, A. W., Duncan, L. G., Cohn, M. A., Cheung, E. O., Batchelder, A.,
Martinez, L., Segawa, E., Acree, M., & Folkman, S. (2017). Randomized controlled trial of a
positive affect intervention for people newly diagnosed with HIV. Journal of Consulting and
Clinical Psychology, 85(5), 409–423. https://doi.org/10.1037/ccp0000188
Moskowitz, Judith Tedlie, Epel, E. S., & Acree, M. (2008). Positive Affect Uniquely Predicts
Lower Risk of Mortality in People With Diabetes. Health Psychology, 27(1 SUPPL.), S73–
S82. https://doi.org/10.1037/0278-6133.27.1.S73
Mukherjee, N., & Chaturvedi, S. K. (2019). Depressive symptoms and disorders in type 2 diabetes
mellitus. Current Opinion in Psychiatry, 32(5), 416–421.
https://doi.org/10.1097/YCO.0000000000000528
Munan, M., Oliveira, C. L. P., Marcotte-Chénard, A., Rees, J. L., Prado, C. M., Riesco, E., &
Boulé, N. G. (2020). Acute and Chronic Effects of Exercise on Continuous Glucose
Monitoring Outcomes in Type 2 Diabetes: A Meta-Analysis. Frontiers in Endocrinology, 11,
495. https://doi.org/10.3389/fendo.2020.00495
Newton, C. A., & Raskin, P. (2004). Diabetic ketoacidosis in type 1 and type 2 diabetes mellitus:
Clinical and biochemical differences. Archives of Internal Medicine, 164(17), 1925–1931.
https://doi.org/10.1001/archinte.164.17.1925
144
Newton, S., Braithwaite, D., & Akinyemiju, T. F. (2017). Socio-economic status over the life
course and obesity: Systematic review and meta-analysis. In PLoS ONE (Vol. 12, Issue 5, p.
e0177151). Public Library of Science. https://doi.org/10.1371/journal.pone.0177151
Nguyen, N. T., Nguyen, X. M. T., Lane, J., & Wang, P. (2011). Relationship between obesity and
diabetes in a US adult population: Findings from the national health and nutrition examination
survey, 1999-2006. Obesity Surgery, 21(3), 351–355. https://doi.org/10.1007/s11695-010-
0335-4
Nishida, C., Barba, C., Cavalli-Sforza, T., Cutter, J., Deurenberg, P., Darnton-Hill, I., Deurenberg-
Yap, M., Gill, T., James, P., Ko, G., Kosulwat, V., Kumanyika, S., Kurpad, A., Mascie-Taylor,
N., Moon, H. K., Nakadomo, F., Nishida, C., Noor, M. I., Reddy, K. S., … Zimmet, P. (2004).
Appropriate body-mass index for Asian populations and its implications for policy and
intervention strategies. The Lancet, 363(9403), 157–163. https://doi.org/10.1016/S0140-
6736(03)15268-3
Ogedegbe, G. O., Boutin-Foster, C., Wells, M. T., Allegrante, J. P., Isen, A. M., Jobe, J. B., &
Charlson, M. E. (2012). A randomized controlled trial of positive-affect intervention and
medication adherence in hypertensive African Americans. Archives of Internal Medicine,
172(4), 322–326. https://doi.org/10.1001/archinternmed.2011.1307
Ogilvie, R. P., & Patel, S. R. (2017). The epidemiology of sleep and obesity. Sleep Health, 3(5),
383–388. https://doi.org/10.1016/j.sleh.2017.07.013
Okely, J. A., & Gale, C. R. (2016). Well-being and chronic disease incidence: The English
Longitudinal Study of Ageing. Psychosomatic Medicine, 78(3), 335–344.
https://doi.org/10.1097/PSY.0000000000000279
Paganini-Hill, A., Kawas, C. H., & Corrada, M. M. (2018). Positive Mental Attitude Associated
with Lower 35-Year Mortality: The Leisure World Cohort Study. Journal of Aging Research,
2018, 2126368. https://doi.org/10.1155/2018/2126368
Papamichou, D., Panagiotakos, D. B., & Itsiopoulos, C. (2019). Dietary patterns and management
145
of type 2 diabetes: A systematic review of randomised clinical trials. Nutrition, Metabolism
and Cardiovascular Diseases, 29(6), 531–543. https://doi.org/10.1016/j.numecd.2019.02.004
Papanas, N., Tsapas, A., Papatheodorou, K., Papazoglou, D., Bekiari, E., Sariganni, M., Paletas, K.,
& Maltezos, E. (2010). Glycaemic control is correlated with well-being index (WHO-5) in
subjects with type 2 diabetes. Experimental and Clinical Endocrinology and Diabetes, 118(6),
364–367. https://doi.org/10.1055/s-0029-1243623
Papelbaum, M., Appolinário, J. C., De Oliveira Moreira, R., Moema Ellinger, V. C., Kupfer, R., &
Ferreira Coutinho, W. (2005). Prevalence of eating disorders and psychiatric comorbidity in a
clinical sample of type 2 diabetes mellitus patients. Revista Brasileira de Psiquiatria, 27(2),
135–138. https://doi.org/10.1590/s1516-44462005000200012
Parsa, S., Aghamohammadi, M., & Abazari, M. (2019). Diabetes distress and its clinical
determinants in patients with type II diabetes. Diabetes and Metabolic Syndrome: Clinical
Research and Reviews, 13(2), 1275–1279. https://doi.org/10.1016/j.dsx.2019.02.007
Patterson, R., McNamara, E., Tainio, M., de Sá, T. H., Smith, A. D., Sharp, S. J., Edwards, P.,
Woodcock, J., Brage, S., & Wijndaele, K. (2018). Sedentary behaviour and risk of all-cause,
cardiovascular and cancer mortality, and incident type 2 diabetes: a systematic review and
dose response meta-analysis. European Journal of Epidemiology, 33(9), 811–829.
https://doi.org/10.1007/s10654-018-0380-1
Paxman, J. R., Hall, A. C., Harden, C. J., O’Keeffe, J., & Simper, T. N. (2011). Weight loss is
coupled with improvements to affective state in obese participants engaged in behavior change
therapy based on incremental, self-selected “Small Changes.” Nutrition Research, 31(5), 327–
337. https://doi.org/10.1016/j.nutres.2011.03.015
Perrin, N. E., Davies, M. J., Robertson, N., Snoek, F. J., & Khunti, K. (2017). The prevalence of
diabetes-specific emotional distress in people with Type 2 diabetes: a systematic review and
meta-analysis. Diabetic Medicine, 34(11), 1508–1520. https://doi.org/10.1111/dme.13448
Peterson, J. C., Charlson, M. E., Hoffman, Z., Wells, M. T., Wong, S. C., Hollenberg, J. P., Jobe, J.
146
B., Boschert, K. A., Isen, A. M., & Allegrante, J. P. (2012). A randomized controlled trial of
positive-affect induction to promote physical activity after percutaneous coronary intervention.
Archives of Internal Medicine, 172(4), 329–336.
https://doi.org/10.1001/archinternmed.2011.1311
Phillips-Caesar, E. G., Winston, G., Peterson, J. C., Wansink, B., Devine, C. M., Kanna, B.,
Michelin, W., Wethington, E., Wells, M., Hollenberg, J., & Charlson, M. E. (2015). Small
Changes and Lasting Effects (SCALE) Trial: The Formation of a Weight Loss Behavioral
Intervention Using EVOLVE. Contemporary Clinical Trials, 41, 118–128.
https://doi.org/10.1016/j.cct.2015.01.003
Phillips, E. G., Wells, M. T., Winston, G., Ramos, R., Devine, C. M., Wethington, E., Peterson, J.
C., Wansink, B., & Charlson, M. (2017). Innovative approaches to weight loss in a high-risk
population: The small changes and lasting effects (SCALE) trial. Obesity, 25(5), 833–841.
https://doi.org/10.1002/oby.21780
Piolanti, A., Offidani, E., Guidi, J., Gostoli, S., Fava, G. A., & Sonino, N. (2016). Use of the
Psychosocial Index: A Sensitive Tool in Research and Practice. Psychotherapy and
Psychosomatics, 85(6), 337–345. https://doi.org/10.1159/000447760
Polonsky, W. H., Anderson, B. J., Lohrer, P. A., Welch, G., Jacobson, A. M., Aponte, J. E., &
Schwartz, C. E. (1995). Assessment of diabetes-related distress. Diabetes Care, 18(6), 754–
760. https://doi.org/10.2337/diacare.18.6.754
Polonsky, W. H., Fisher, L., Earles, J., Dudl, R. J., Lees, J., Mullan, J., & Jackson, R. A. (2005).
Assessing psychosocial distress in diabetes: Development of the Diabetes Distress Scale.
Diabetes Care, 28(3), 626–631. https://doi.org/10.2337/diacare.28.3.626
Poole, L., Hackett, R. A., Panagi, L., & Steptoe, A. (2020). Subjective wellbeing as a determinant
of glycated hemoglobin in older adults: Longitudinal findings from the English Longitudinal
Study of Ageing. Psychological Medicine, 50(11), 1820–1828.
https://doi.org/10.1017/S0033291719001879
147
Pressman, S. D., & Cohen, S. (2005). Does positive affect influence health? Psychological Bulletin,
131(6), 925–971. https://doi.org/10.1037/0033-2909.131.6.925
Rafanelli, C, Park, S. K., Ruini, C., Ottolini, F., Cazzaro, M., & Fava, G. A. (2000). Rating well-
being and distress. Stress Medicine, 16(1), 55–61. https://doi.org/10.1002/(SICI)1099-
1700(200001)16:1<55::AID-SMI832>3.0.CO;2-M
Rafanelli, Chiara, Gostoli, S., Buzzichelli, S., Guidi, J., Sirri, L., Gallo, P., Marzola, E., Bergerone,
S., De Ferrari, G. M., Roncuzzi, R., Di Pasquale, G., Abbate-Daga, G., Fava, G. A., &
Rafanelli, C. (2020). Sequential Combination of Cognitive-Behavioral Treatment and Well-
Being Therapy in Depressed Patients with Acute Coronary Syndromes: A Randomized
Controlled Trial (TREATED-ACS Study). Psychotherapy and Psychosomatics, 89(6), 345–
356. https://doi.org/10.1159/000510006
Rashedul Islam, M., Shafiqul Islam, M., Karim, M. R., Alam, U. K., & Yesmin, K. (2017).
Predictors of diabetes distress in patients with type 2 diabetes mellitus. International Journal
of Research in Medical Sciences Islam MR et Al. Int J Res Med Sci, 2(2), 631–638.
https://doi.org/10.5455/2320-6012.ijrms20140549
Reimer, A., Schmitt, A., Ehrmann, D., Kulzer, B., & Hermanns, N. (2017). Reduction of diabetes-
related distress predicts improved depressive symptoms: A secondary analysis of the DIAMOS
study. PLoS ONE, 12(7), e0181218. https://doi.org/10.1371/journal.pone.0181218
Reutens, A. T., & Atkins, R. C. (2011). Epidemiology of Diabetic Nephropathy. In Contributions to
Nephrology (Vol. 170, pp. 1–7). Karger Publishers. https://doi.org/10.1159/000324934
Richter, B., Hemmingsen, B., Metzendorf, M. I., & Takwoingi, Y. (2018). Development of type 2
diabetes mellitus in people with intermediate hyperglycaemia. Cochrane Database of
Systematic Reviews, 2018(10), CD012661. https://doi.org/10.1002/14651858.CD012661.pub2
Rogers, J. M., Ferrari, M., Mosely, K., Lang, C. P., & Brennan, L. (2017). Mindfulness-based
interventions for adults who are overweight or obese: a meta-analysis of physical and
psychological health outcomes. Obesity Reviews, 18(1), 51–67.
148
https://doi.org/10.1111/obr.12461
Rose, M., Fliege, H., Hildebrandt, M., Schirop, T., & Klapp, B. F. (2002). The network of
psychological variables in patients with diabetes and their importance for quality of life and
metabolic control. Diabetes Care, 25(1), 35–42. https://doi.org/10.2337/diacare.25.1.35
Roy, T., & Lloyd, C. E. (2012). Epidemiology of depression and diabetes: A systematic review.
Journal of Affective Disorders, 142(SUPPL.). https://doi.org/10.1016/S0165-0327(12)70004-6
Ruini, C., Ottolini, F., Rafanelli, C., & Ryff, C. D. (2003). Italian validation of Psychological Well-
Being Scales (PWB) . Rivista Di Psichiatria, 38(3), 117–130.
https://www.researchgate.net/publication/279559940_Italian_validation_of_Psychological_We
ll-Being_Scales_PWB
Ryan, R. M., & Deci, E. L. (2001). On happiness and human potentials: A review of research on
hedonic and eudaimonic well-being. Annual Review of Psychology, 52, 141–166.
https://doi.org/10.1146/annurev.psych.52.1.141
Ryff, C. D. (1989). Happiness is everything, or is it? Explorations on the meaning of psychological
well-being. Journal of Personality and Social Psychology, 57(6), 1069–1081.
https://doi.org/10.1037/0022-3514.57.6.1069
Ryff, C. D. (2014). Psychological well-being revisited: Advances in the science and practice of
eudaimonia. Psychotherapy and Psychosomatics, 83(1), 10–28.
https://doi.org/10.1159/000353263
Ryff, C. D., & Singer, B. (1998). The Contours of Positive Human Health. Psychological Inquiry,
9(1), 1–28. https://doi.org/10.1207/s15327965pli0901_1
Saeedi, P., Petersohn, I., Salpea, P., Malanda, B., Karuranga, S., Unwin, N., Colagiuri, S.,
Guariguata, L., Motala, A. A., Ogurtsova, K., Shaw, J. E., Bright, D., & Williams, R. (2019).
Global and regional diabetes prevalence estimates for 2019 and projections for 2030 and 2045:
Results from the International Diabetes Federation Diabetes Atlas, 9th edition. Diabetes
Research and Clinical Practice, 157, 107843. https://doi.org/10.1016/j.diabres.2019.107843
149
Sarwer, D. B., & Polonsky, H. M. (2016). The Psychosocial Burden of Obesity. Endocrinology and
Metabolism Clinics of North America, 45(3), 677–688.
https://doi.org/10.1016/j.ecl.2016.04.016
Schmitz, N., Gariépy, G., Smith, K. J., Clyde, M., Malla, A., Boyer, R., Strychar, I., Lesage, A., &
Wang, J. L. (2014). Recurrent subthreshold depression in type 2 diabetes: An important risk
factor for poor health outcomes. Diabetes Care, 37(4), 970–978. https://doi.org/10.2337/dc13-
1832
Scott, R. A., Langenberg, C., Sharp, S. J., Franks, P. W., Rolandsson, O., Drogan, D., van der
Schouw, Y. T., Ekelund, U., Kerrison, N. D., Ardanaz, E., Arriola, L., Balkau, B., Barricarte,
A., Barroso, I., Bendinelli, B., Beulens, J. W. J., Boeing, H., de Lauzon-Guillain, B., Deloukas,
P., … Wareham, N. J. (2013). The link between family history and risk of type 2 diabetes is
not explained by anthropometric, lifestyle or genetic risk factors: The EPIC-InterAct study.
Diabetologia, 56(1), 60–69. https://doi.org/10.1007/s00125-012-2715-x
Seiglie, J. A., Marcus, M. E., Ebert, C., Prodromidis, N., Geldsetzer, P., Theilmann, M., Agoudavi,
K., Andall-Brereton, G., Aryal, K. K., Bicaba, B. W., Bovet, P., Brian, G., Dorobantu, M.,
Gathecha, G., Gurung, M. S., Guwatudde, D., Msaidié, M., Houehanou, C., Houinato, D., …
Manne-Goehler, J. (2020). Diabetes prevalence and its relationship with education, wealth, and
BMI in 29 low- And middle-income countries. Diabetes Care, 43(4), 767–775.
https://doi.org/10.2337/dc19-1782
Seo, D. C., & Sa, J. (2008). A meta-analysis of psycho-behavioral obesity interventions among US
multiethnic and minority adults. Preventive Medicine, 47(6), 573–582.
https://doi.org/10.1016/j.ypmed.2007.12.010
Sharma, A., & Sharma, R. (2018). Internet addiction and psychological well-being among college
students: A cross-sectional study from Central India. Journal of Family Medicine and Primary
Care, 7(1), 151. https://doi.org/10.4103/jfmpc.jfmpc_189_17
Sharretts, J., Galescu, O., Gomatam, S., Andraca-Carrera, E., Hampp, C., & Yanoff, L. (2020).
150
Cancer Risk Associated with Lorcaserin — The FDA’s Review of the CAMELLIA-TIMI 61
Trial. New England Journal of Medicine, 383(11), 1000–1002.
https://doi.org/10.1056/nejmp2003873
Sheaves, B., Freeman, D., Isham, L., McInerney, J., Nickless, A., Yu, L. M., Rek, S., Bradley, J.,
Reeve, S., Attard, C., Espie, C. A., Foster, R., Wirz-Justice, A., Chadwick, E., & Barrera, A.
(2018). Stabilising sleep for patients admitted at acute crisis to a psychiatric hospital (OWLS):
An assessor-blind pilot randomised controlled trial. Psychological Medicine, 48(10), 1694–
1704. https://doi.org/10.1017/S0033291717003191
Shrivastava, A., & Johnston, M. E. (2010). Weight-gain in psychiatric treatment: Risks,
implications, and strategies for prevention and management. Mens Sana Monographs, 8(1),
53–68. https://doi.org/10.4103/0973-1229.58819
Silventoinen, K., Rokholm, B., Kaprio, J., & Sørensen, T. I. A. (2010). The genetic and
environmental influences on childhood obesity: A systematic review of twin and adoption
studies. International Journal of Obesity, 34(1), 29–40. https://doi.org/10.1038/ijo.2009.177
Sin, N. L. (2016). The Protective Role of Positive Well-Being in Cardiovascular Disease: Review
of Current Evidence, Mechanisms, and Clinical Implications. Current Cardiology Reports,
18(11), 106. https://doi.org/10.1007/s11886-016-0792-z
Smith, A. D., Crippa, A., Woodcock, J., & Brage, S. (2016). Physical activity and incident type 2
diabetes mellitus: a systematic review and dose–response meta-analysis of prospective cohort
studies. Diabetologia, 59(12), 2527–2545. https://doi.org/10.1007/s00125-016-4079-0
Smith, K. J., Béland, M., Clyde, M., Gariépy, G., Pagé, V., Badawi, G., Rabasa-Lhoret, R., &
Schmitz, N. (2013). Association of diabetes with anxiety: A systematic review and meta-
analysis. Journal of Psychosomatic Research, 74(2), 89–99.
https://doi.org/10.1016/j.jpsychores.2012.11.013
Snoek, F. J., Bremmer, M. A., & Hermanns, N. (2015). Constructs of depression and distress in
diabetes: Time for an appraisal. The Lancet Diabetes and Endocrinology, 3(6), 450–460.
151
https://doi.org/10.1016/S2213-8587(15)00135-7
Snoek, F. J., Kersch, N. Y. A., Eldrup, E., Harman-Boehm, I., Hermanns, N., Kokoszka, A.,
Matthews, D. R., Mcguire, B. E., Pibernik-Okanović, M., Singer, J., De Wit, M., & Skovlund,
S. E. (2012). Monitoring of individual needs in diabetes (MIND)-2: Follow-up data from the
cross-national diabetes attitudes, wishes, and needs (DAWN) MIND study. Diabetes Care,
35(11), 2128–2132. https://doi.org/10.2337/dc11-1326
Sonino, N., & Fava, G. A. (1998). A simple instrument for assessing stress in clinical practice.
Postgraduate Medical Journal, 74(873), 408–410. https://doi.org/10.1136/pgmj.74.873.408
Sonino, N., Tomba, E., Genesia, M. L., Bertello, C., Mulatero, P., Veglio, F., Fava, G. A., & Fallo,
F. (2011). Psychological assessment of primary aldosteronism: A controlled study. Journal of
Clinical Endocrinology and Metabolism, 96(6), E878–E883. https://doi.org/10.1210/jc.2010-
2723
Steptoe, A., O’Donnell, K., Marmot, M., & Wardle, J. (2008). Positive affect, psychological well-
being, and good sleep. Journal of Psychosomatic Research, 64(4), 409–415.
https://doi.org/10.1016/j.jpsychores.2007.11.008
Stoner, G. D. (2017). Hyperosmolar Hyperglycemic State. American Family Physician, 96(11),
729–736. www.aafp.org/afp
Stunkard, A. J., Sørensen, T. I. A., Hanis, C., Teasdale, T. W., Chakraborty, R., Schull, W. J., &
Schulsinger, F. (1986). An Adoption Study of Human Obesity. New England Journal of
Medicine, 314(4), 193–198. https://doi.org/10.1056/nejm198601233140401
Sumamo Schellenberg, E., Dryden, D. M., Vandermeer, B., Ha, C., & Korownyk, C. (2013).
Lifestyle interventions for patients with and at risk for type 2 diabetes: A systematic review
and meta-analysis. Annals of Internal Medicine, 159(8), 543–551.
https://doi.org/10.7326/0003-4819-159-8-201310150-00007
Tapehsari, B., Nojomi, M., Alizadeh, M., Khamseh, M., & Seifouri, S. (2020). Physical activity and
quality of life in people with type 2 diabetes mellitus: A randomized controlled trial.
152
International Journal of Preventive Medicine, 11(1), 9.
https://doi.org/10.4103/ijpvm.IJPVM_202_18
Thaker, V. V. (2017). Genetic and epigenetic causes of obesity. Adolescent Medicine: State of the
Art Reviews, 28(2), 379–405. http://www.ncbi.nlm.nih.gov/pubmed/30416642
Tighe, C. A., Shoji, K. D., Dautovich, N. D., Lichstein, K. L., & Scogin, F. (2016). Affective
mediators of the association between pleasant events and global sleep quality in community-
dwelling adults. Journal of Behavioral Medicine, 39(1), 170–177.
https://doi.org/10.1007/s10865-015-9666-x
Timper, K., & Brüning, J. C. (2017). Hypothalamic circuits regulating appetite and energy
homeostasis: Pathways to obesity. DMM Disease Models and Mechanisms, 10(6), 679–689.
https://doi.org/10.1242/dmm.026609
Tinetti, M. E., Bogardus, S. T., & Agostini, J. V. (2004). Potential Pitfalls of Disease-Specific
Guidelines for Patients with Multiple Conditions. New England Journal of Medicine, 351(27),
2870–2874. https://doi.org/10.1056/nejmsb042458
Todaro, J. F., Con, A., Niaura, R., Spiro, A., Ward, K. D., & Roytberg, A. (2005). Combined effect
of the metabolic syndrome and hostility on the incidence of myocardial infarction (The
Normative Aging Study). American Journal of Cardiology, 96(2), 221–226.
https://doi.org/10.1016/j.amjcard.2005.03.049
Tovote, K. A., Fleer, J., Snippe, E., Peeters, A. C. T. M., Emmelkamp, P. M. G., Sanderman, R.,
Links, T. P., & Schroevers, M. J. (2014). Individual mindfulness-based cognitive therapy and
cognitive behavior therapy for treating depressive symptoms in patients with diabetes: Results
of a randomized controlled trial. Diabetes Care, 37(9), 2427–2434.
https://doi.org/10.2337/dc13-2918
Traversy, G., & Chaput, J. P. (2015). Alcohol Consumption and Obesity: An Update. Current
Obesity Reports, 4(1), 122–130. https://doi.org/10.1007/s13679-014-0129-4
Tremmel, M., Gerdtham, U. G., Nilsson, P. M., & Saha, S. (2017). Economic burden of obesity: A
153
systematic literature review. International Journal of Environmental Research and Public
Health, 14(4), 435. https://doi.org/10.3390/ijerph14040435
Tsai, M. T., Erickson, S. R., Cohen, L. J., & Wu, C. H. (2016). The association between comorbid
anxiety disorders and the risk of stroke among patients with diabetes: An 11-year population-
based retrospective cohort study. Journal of Affective Disorders, 202, 178–186.
https://doi.org/10.1016/j.jad.2016.03.060
Turkat, I. D. (1982). Glycosylated hemoglobin levels in anxious and nonanxious diabetic patients.
Psychosomatics, 23(10), 1056–1058. https://doi.org/10.1016/S0033-3182(82)73301-8
Uchendu, C., & Blake, H. (2017). Effectiveness of cognitive–behavioural therapy on glycaemic
control and psychological outcomes in adults with diabetes mellitus: a systematic review and
meta-analysis of randomized controlled trials. Diabetic Medicine, 34(3), 328–339.
https://doi.org/10.1111/dme.13195
van der Feltz-Cornelis, C. M., Nuyen, J., Stoop, C., Chan, J., Jacobson, A. M., Katon, W., Snoek,
F., & Sartorius, N. (2010). Effect of interventions for major depressive disorder and significant
depressive symptoms in patients with diabetes mellitus: A systematic review and meta-
analysis. General Hospital Psychiatry, 32(4), 380–395.
https://doi.org/10.1016/j.genhosppsych.2010.03.011
Vimalananda, V., Damschroder, L., Janney, C. A., Goodrich, D., Kim, H. M., Holleman, R., Gillon,
L., & Lutes, L. (2016). Weight loss among women and men in the ASPIRE-VA behavioral
weight loss intervention trial. Obesity, 24(9), 1884–1891. https://doi.org/10.1002/oby.21574
Wadden, T. A., & Bray, G. A. (2019). Handbook of Obesity Treatment: Second Edition. Guilford
Press. https://www.guilford.com/books/Handbook-of-Obesity-Treatment/Wadden-
Bray/9781462542901
Wake, A. D. (2020). Antidiabetic effects of physical activity: How it helps to control type 2
diabetes. Diabetes, Metabolic Syndrome and Obesity: Targets and Therapy, 13, 2909–2923.
https://doi.org/10.2147/DMSO.S262289
154
Wakefield, C. E., Sansom-Daly, U. M., McGill, B. C., Ellis, S. J., Doolan, E. L., Robertson, E. G.,
Mathur, S., & Cohn, R. J. (2016). Acceptability and feasibility of an e-mental health
intervention for parents of childhood cancer survivors: “Cascade.” Supportive Care in Cancer,
24(6), 2685–2694. https://doi.org/10.1007/s00520-016-3077-6
Wang, Z. Da, Xia, Y. F., Zhao, Y., & Chen, L. M. (2017). Cognitive behavioural therapy on
improving the depression symptoms in patients with diabetes: A meta-analysis of randomized
control trials. Bioscience Reports, 37(2), BSR20160557.
https://doi.org/10.1042/BSR20160557
Warburton, D. E. R., & Bredin, S. S. D. (2019). Health Benefits of Physical Activity: A Strengths-
Based Approach. Journal of Clinical Medicine, 8(12), 2044.
https://doi.org/10.3390/jcm8122044
Warburton, D. E. R., Nicol, C. W., & Bredin, S. S. D. (2006). Health benefits of physical activity:
The evidence. CMAJ, 174(6), 801–809. https://doi.org/10.1503/cmaj.051351
Waters, D. L., Ward, A. L., & Villareal, D. T. (2013). Weight loss in obese adults 65 years and
older: A review of the controversy. Experimental Gerontology, 48(10), 1054–1061.
https://doi.org/10.1016/j.exger.2013.02.005
Weinger, K., & Jacobson, A. M. (2001). Psychosocial and quality of life correlates of glycemic
control during intensive treatment of type 1 diabetes. Patient Education and Counseling, 42(2),
123–131. https://doi.org/10.1016/S0738-3991(00)00098-7
Wild, D., von Maltzahn, R., Brohan, E., Christensen, T., Clauson, P., & Gonder-Frederick, L.
(2007). A critical review of the literature on fear of hypoglycemia in diabetes: Implications for
diabetes management and patient education. Patient Education and Counseling, 68(1), 10–15.
https://doi.org/10.1016/j.pec.2007.05.003
Willemsen, G., Ward, K. J., Bell, C. G., Christensen, K., Bowden, J., Dalgård, C., Harris, J. R.,
Kaprio, J., Lyle, R., Magnusson, P. K. E., Mather, K. A., Ordoňana, J. R., Perez-Riquelme, F.,
Pedersen, N. L., Pietiläinen, K. H., Sachdev, P. S., Boomsma, D. I., & Spector, T. (2015). The
155
Concordance and Heritability of Type 2 Diabetes in 34,166 Twin Pairs From International
Twin Registers: The Discordant Twin (DISCOTWIN) Consortium. Twin Research and Human
Genetics, 18(6), 762–771. https://doi.org/10.1017/thg.2015.83
Wing, R. R. (2001). Weight loss in the management of type 2 diabetes. In Evidence-based diabetes
care (pp. 252–276). PMPH-USA.
Wing, R. R., Bahnson, J. L., Bray, G. A., Clark, J. M., Coday, M., Egan, C., Espeland, M. A.,
Foreyt, J. P., Gregg, E. W., Goldman, V., Haffner, S. M., Hazuda, H., Hill, J. O., Horton, E. S.,
Hubbard, V. S., Jakicic, J., Jeffery, R. W., Johnson, K. C., Kahn, S., … Yanovski, S. Z.
(2010). Long-term effects of a lifestyle intervention on weight and cardiovascular risk factors
in individuals with type 2 diabetes mellitus: Four-year results of the look AHEAD trial.
Archives of Internal Medicine, 170(17), 1566–1575.
https://doi.org/10.1001/archinternmed.2010.334
Wing, Rena R., Lang, W., Wadden, T. A., Safford, M., Knowler, W. C., Bertoni, A. G., Hill, J. O.,
Brancati, F. L., Peters, A., & Wagenknecht, L. (2011). Benefits of modest weight loss in
improving cardiovascular risk factors in overweight and obese individuals with type 2
diabetes. Diabetes Care, 34(7), 1481–1486. https://doi.org/10.2337/dc10-2415
Wolfenden, L., Ezzati, M., Larijani, B., & Dietz, W. (2019). The challenge for global health
systems in preventing and managing obesity. Obesity Reviews, 20(S2), 185–193.
https://doi.org/10.1111/obr.12872
World Health Organization. (1984). Construction in basic documents.
World Health Organization. (2020a). Diabetes. https://www.who.int/news-room/fact-
sheets/detail/diabetes
World Health Organization. (2020b). Obesity and overweight. https://www.who.int/news-
room/fact-sheets/detail/obesity-and-overweight
World Health Organization. (2020c). Data and statistics. https://www.euro.who.int/en/health-
topics/noncommunicable-diseases/diabetes/data-and-statistics
156
Xi, W., Pennell, M. L., Andridge, R. R., & Paskett, E. D. (2018). Comparison of intent-to-treat
analysis strategies for pre-post studies with loss to follow-up. Contemporary Clinical Trials
Communications, 11, 20–29. https://doi.org/10.1016/j.conctc.2018.05.008
Xu, G., Liu, B., Sun, Y., Du, Y., Snetselaar, L. G., Hu, F. B., & Bao, W. (2018). Prevalence of
diagnosed type 1 and type 2 diabetes among US adults in 2016 and 2017: Population based
study. BMJ (Online), 362, k1497. https://doi.org/10.1136/bmj.k1497
Xu, H., Cupples, L. A., Stokes, A., & Liu, C. T. (2018). Association of Obesity With Mortality
Over 24 Years of Weight History: Findings From the Framingham Heart Study. JAMA
Network Open, 1(7), e184587. https://doi.org/10.1001/jamanetworkopen.2018.4587
Yi, J. P., Vitaliano, P. P., Smith, R. E., Yi, J. C., & Weinger, K. (2008). The role of resilience on
psychological adjustment and physical health in patients with diabetes. British Journal of
Health Psychology, 13(2), 311–325. https://doi.org/10.1348/135910707X186994
Zaninotto, P., & Steptoe, A. (2019). Association between Subjective Well-being and Living Longer
Without Disability or Illness. JAMA Network Open, 2(7), e196870.
https://doi.org/10.1001/jamanetworkopen.2019.6870
Zhang, F., Huang, L., & Peng, L. (2020). The Degree of Influence of Daily Physical Activity on
Quality of Life in Type 2 Diabetics. Frontiers in Psychology, 11, 1292.
https://doi.org/10.3389/fpsyg.2020.01292
Zhang, X., Gregg, E. W., Williamson, D. F., Barker, L. E., Thomas, W., Bullard, K. M. K.,
Imperatore, G., Williams, D. E., & Albright, A. L. (2010). A1C level and future risk of
diabetes: A systematic review. Diabetes Care, 33(7), 1665–1673.
https://doi.org/10.2337/dc09-1939
Zheng, Y., Ley, S. H., & Hu, F. B. (2018). Global aetiology and epidemiology of type 2 diabetes
mellitus and its complications. Nature Reviews Endocrinology, 14(2), 88–98.
https://doi.org/10.1038/nrendo.2017.151
Zhu, B., Vincent, C., Kapella, M. C., Quinn, L., Collins, E. G., Ruggiero, L., Park, C., & Fritschi,
157
C. (2018). Sleep disturbance in people with diabetes: A concept analysis. Journal of Clinical
Nursing, 27(1–2), e50–e60. https://doi.org/10.1111/jocn.14010
Zimmet, P. Z., Magliano, D. J., Herman, W. H., & Shaw, J. E. (2014). Diabetes: A 21st century
challenge. The Lancet Diabetes and Endocrinology, 2(1), 56–64.
https://doi.org/10.1016/S2213-8587(13)70112-8
Zinn, C., Schofield, G. M., & Hopkins, W. G. (2012). A “small-changes” workplace weight loss
and maintenance program: Examination of weight and health outcomes. Journal of
Occupational and Environmental Medicine, 54(10), 1230–1238.
https://doi.org/10.1097/JOM.0b013e3182480591
Related Documents