Allen County Insight July 2012 Allen County Employment Employment improving from recession lows but we’re not back to pre-recession level yet The seasonally adjusted employment number for the Fort Wayne Metro (Allen, Wells, and Whitley Counes) was 215,000 in May 2012, up from 206,800 in May 2011. Even though we are not back to pre-recession levels, the trend is very encouraging, especially when comparing the Fort Wayne MSA to the largest 100 metros in the country. In the past year, the Fort Wayne MSA has received naonal aenon for achieving year to year employment gains that put it in the top 5 of all 372 metro areas in the country. A summary of economic events, data, and trends published by the Community Research Instute Fort Wayne MSA Annual Employment Fort Wayne MSA NonFarm Payroll Employment In this Issue Focus on... Employment •What has happened since the end of the recession? •What sectors are re- bounding? Also... •Wages, Income, Earnings •Major Employers •Business Events From the Director Allen County employment gains in comparison to other major Indiana counes Allen County Insight is brought to you by The Community Research Instute at IPFW with the support of the Allen County Commissioners Welcome to the preview issue of the Allen County Insight. Every quarter, it is our intent to provide a recurring report on employment and wage data, as well as business events such as expansion news. In addion, each quarter will focus in detail on specific topics of local interest, for example in this edion, we add some background informaon and offer an in-depth look at the employment data. The Director’s Corner offers addional insight this quarter into changes in employment since the recession. This newsleer will also be available on our website: hp://new.ipfw.edu/centers/cri/reports . Allen County represents approximately 85-89 percent of the employment in the Fort Wayne MSA, depending on which measurement is used. Note both Fort Wayne MSA data and Allen County data are presented throughout this quarterly issue. Introducon 190 195 200 205 210 215 220 2012* 2011 2010 2009 2008 2007 2006 2005 2004 2003 2002 2001 MSA Employment in thousands 195 200 205 210 215 220 225 2013 2012 2011 2010 2009 2008 2007 2006 2005 Employment in thousands (000) Not Seasonally Adjusted Seasonally Adjusted *Note that 2012 is the average of Jan-May data Source: U.S. Bureau of Labor Stascs, CES Source: U.S. Bureau of Labor Stascs, CES On the web: www.ipfw.edu/cri

Welcome message from author
This document is posted to help you gain knowledge. Please leave a comment to let me know what you think about it! Share it to your friends and learn new things together.
Transcript
Allen County InsightJuly 2012
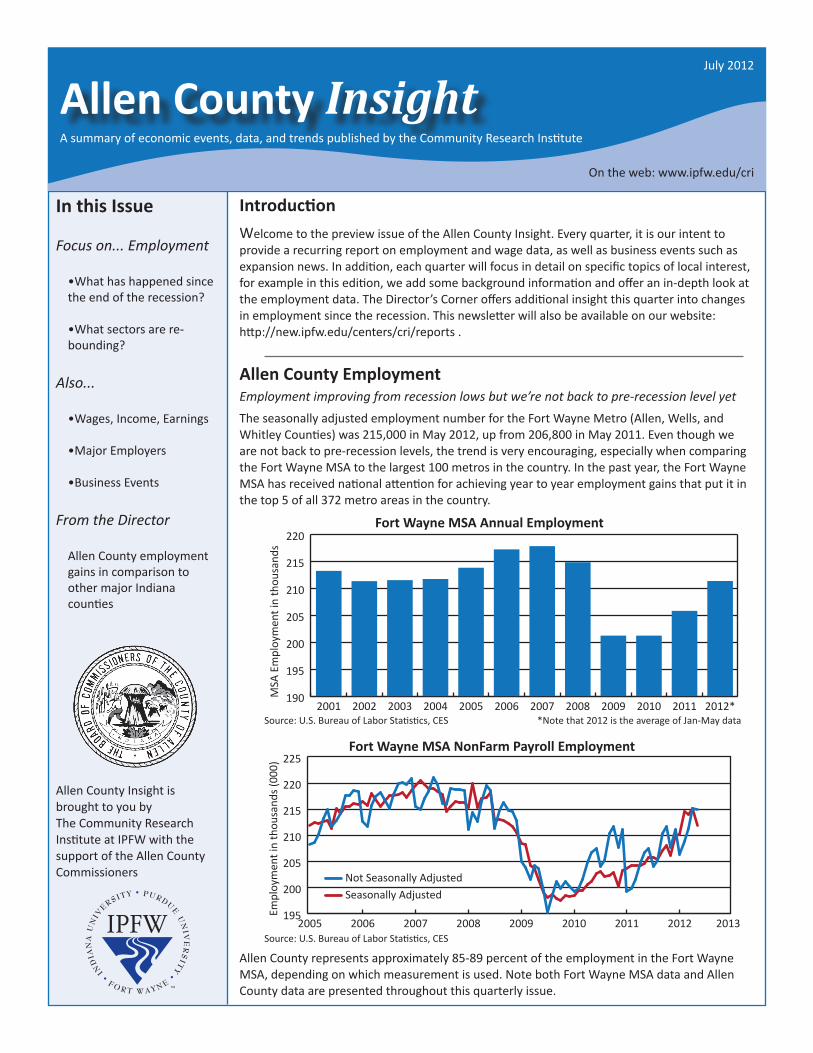
Allen County EmploymentEmployment improving from recession lows but we’re not back to pre-recession level yetThe seasonally adjusted employment number for the Fort Wayne Metro (Allen, Wells, and Whitley Counties) was 215,000 in May 2012, up from 206,800 in May 2011. Even though we are not back to pre-recession levels, the trend is very encouraging, especially when comparing the Fort Wayne MSA to the largest 100 metros in the country. In the past year, the Fort Wayne MSA has received national attention for achieving year to year employment gains that put it in the top 5 of all 372 metro areas in the country.
A summary of economic events, data, and trends published by the Community Research Institute
Fort Wayne MSA Annual Employment
Fort Wayne MSA NonFarm Payroll Employment
In this Issue
Focus on... Employment
•What has happened since the end of the recession?
•What sectors are re-bounding?
Also...
•Wages, Income, Earnings
•Major Employers
•Business Events
From the Director
Allen County employment gains in comparison to other major Indiana counties
Allen County Insight is brought to you by The Community Research Institute at IPFW with the support of the Allen County Commissioners
Welcome to the preview issue of the Allen County Insight. Every quarter, it is our intent to provide a recurring report on employment and wage data, as well as business events such as expansion news. In addition, each quarter will focus in detail on specific topics of local interest, for example in this edition, we add some background information and offer an in-depth look at the employment data. The Director’s Corner offers additional insight this quarter into changes in employment since the recession. This newsletter will also be available on our website: http://new.ipfw.edu/centers/cri/reports .
Allen County represents approximately 85-89 percent of the employment in the Fort Wayne MSA, depending on which measurement is used. Note both Fort Wayne MSA data and Allen County data are presented throughout this quarterly issue.
Introduction
190
195
200
205
210
215
220
2012*20112010200920082007200620052004200320022001
MSA
Em
ploy
men
t in
thou
sand
s
195
200
205
210
215
220
225
201320122011201020092008200720062005
Empl
oym
ent i
n th
ousa
nds (
000)
Not Seasonally AdjustedSeasonally Adjusted
*Note that 2012 is the average of Jan-May dataSource: U.S. Bureau of Labor Statistics, CES
Source: U.S. Bureau of Labor Statistics, CES
On the web: www.ipfw.edu/cri
Community Research Institute
And What is Changing to Cause this Uptick in Employment?
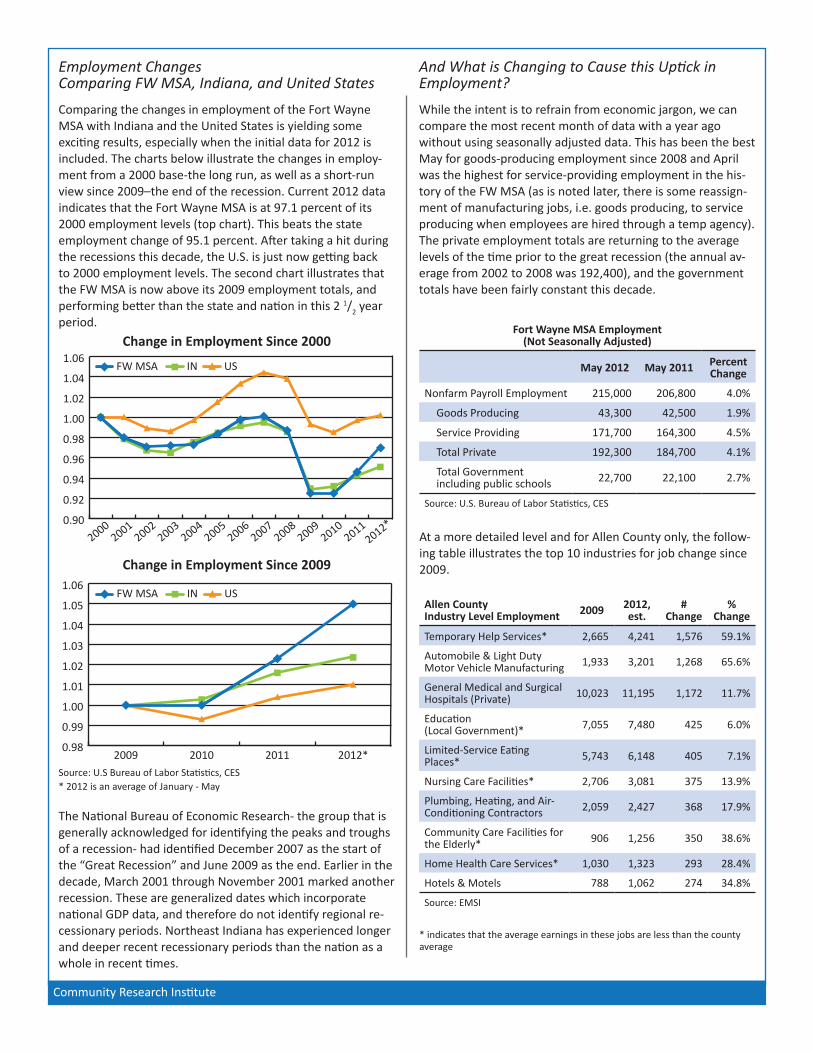
At a more detailed level and for Allen County only, the follow-ing table illustrates the top 10 industries for job change since 2009.
Allen CountyIndustry Level Employment 2009 2012,
est.#
Change%
Change
Temporary Help Services* 2,665 4,241 1,576 59.1%
Automobile & Light Duty Motor Vehicle Manufacturing 1,933 3,201 1,268 65.6%
General Medical and Surgical Hospitals (Private) 10,023 11,195 1,172 11.7%
Education (Local Government)* 7,055 7,480 425 6.0%
Limited-Service Eating Places* 5,743 6,148 405 7.1%
Nursing Care Facilities* 2,706 3,081 375 13.9%
Plumbing, Heating, and Air-Conditioning Contractors 2,059 2,427 368 17.9%
Community Care Facilities for the Elderly* 906 1,256 350 38.6%
Home Health Care Services* 1,030 1,323 293 28.4%
Hotels & Motels 788 1,062 274 34.8%
Source: EMSI
* indicates that the average earnings in these jobs are less than the county average
Employment Changes Comparing FW MSA, Indiana, and United States
Change in Employment Since 2009
Change in Employment Since 2000
* 2012 is an average of January - MaySource: U.S Bureau of Labor Statistics, CES
Comparing the changes in employment of the Fort Wayne MSA with Indiana and the United States is yielding some exciting results, especially when the initial data for 2012 is included. The charts below illustrate the changes in employ-ment from a 2000 base-the long run, as well as a short-run view since 2009–the end of the recession. Current 2012 data indicates that the Fort Wayne MSA is at 97.1 percent of its 2000 employment levels (top chart). This beats the state employment change of 95.1 percent. After taking a hit during the recessions this decade, the U.S. is just now getting back to 2000 employment levels. The second chart illustrates that the FW MSA is now above its 2009 employment totals, and performing better than the state and nation in this 2 1/2 year period.
While the intent is to refrain from economic jargon, we can compare the most recent month of data with a year ago without using seasonally adjusted data. This has been the best May for goods-producing employment since 2008 and April was the highest for service-providing employment in the his-tory of the FW MSA (as is noted later, there is some reassign-ment of manufacturing jobs, i.e. goods producing, to service producing when employees are hired through a temp agency). The private employment totals are returning to the average levels of the time prior to the great recession (the annual av-erage from 2002 to 2008 was 192,400), and the government totals have been fairly constant this decade.
Fort Wayne MSA Employment(Not Seasonally Adjusted)
May 2012 May 2011 Percent Change
Nonfarm Payroll Employment 215,000 206,800 4.0%
Goods Producing 43,300 42,500 1.9%
Service Providing 171,700 164,300 4.5%
Total Private 192,300 184,700 4.1%
Total Government including public schools 22,700 22,100 2.7%
Source: U.S. Bureau of Labor Statistics, CES
0.98
0.99
1.00
1.01
1.02
1.03
1.04
1.05
1.06
2012*201120102009
FW MSA IN US
0.90
0.92
0.94
0.96
0.98
1.00
1.02
1.04
1.06
2012*2011
20102009
20082007
20062005
20042003
20022001
2000
FW MSA IN US
The National Bureau of Economic Research- the group that is generally acknowledged for identifying the peaks and troughs of a recession- had identified December 2007 as the start of the “Great Recession” and June 2009 as the end. Earlier in the decade, March 2001 through November 2001 marked another recession. These are generalized dates which incorporate national GDP data, and therefore do not identify regional re-cessionary periods. Northeast Indiana has experienced longer and deeper recent recessionary periods than the nation as a whole in recent times.
Community Research Institute
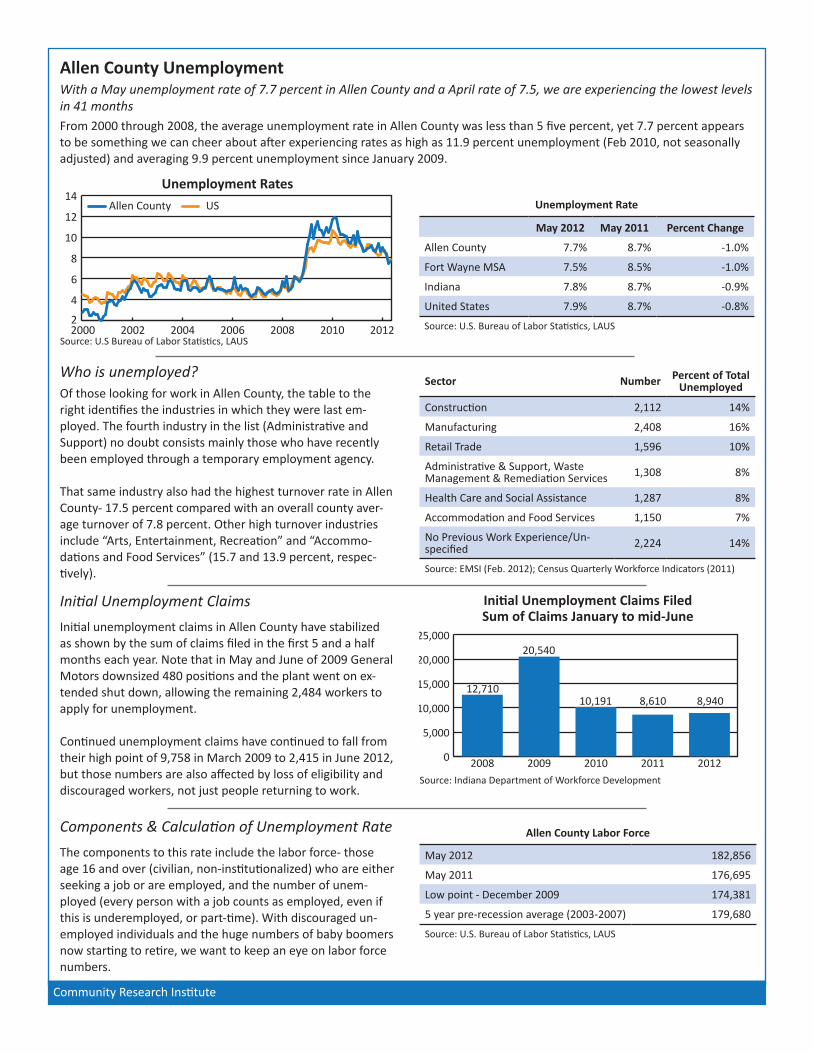
Allen County UnemploymentWith a May unemployment rate of 7.7 percent in Allen County and a April rate of 7.5, we are experiencing the lowest levels in 41 monthsFrom 2000 through 2008, the average unemployment rate in Allen County was less than 5 five percent, yet 7.7 percent appears to be something we can cheer about after experiencing rates as high as 11.9 percent unemployment (Feb 2010, not seasonally adjusted) and averaging 9.9 percent unemployment since January 2009.
Unemployment Rate
May 2012 May 2011 Percent Change
Allen County 7.7% 8.7% -1.0%
Fort Wayne MSA 7.5% 8.5% -1.0%
Indiana 7.8% 8.7% -0.9%
United States 7.9% 8.7% -0.8%
Source: U.S. Bureau of Labor Statistics, LAUS
Allen County Labor Force
May 2012 182,856
May 2011 176,695
Low point - December 2009 174,381
5 year pre-recession average (2003-2007) 179,680
Source: U.S. Bureau of Labor Statistics, LAUS
The components to this rate include the labor force- those age 16 and over (civilian, non-institutionalized) who are either seeking a job or are employed, and the number of unem-ployed (every person with a job counts as employed, even if this is underemployed, or part-time). With discouraged un-employed individuals and the huge numbers of baby boomers now starting to retire, we want to keep an eye on labor force numbers.
Unemployment Rates
Source: U.S Bureau of Labor Statistics, LAUS
Initial Unemployment Claims FiledSum of Claims January to mid-June
Source: Indiana Department of Workforce Development
Initial unemployment claims in Allen County have stabilized as shown by the sum of claims filed in the first 5 and a half months each year. Note that in May and June of 2009 General Motors downsized 480 positions and the plant went on ex-tended shut down, allowing the remaining 2,484 workers to apply for unemployment.
Continued unemployment claims have continued to fall from their high point of 9,758 in March 2009 to 2,415 in June 2012, but those numbers are also affected by loss of eligibility and discouraged workers, not just people returning to work.
Of those looking for work in Allen County, the table to the right identifies the industries in which they were last em-ployed. The fourth industry in the list (Administrative and Support) no doubt consists mainly those who have recently been employed through a temporary employment agency.
That same industry also had the highest turnover rate in Allen County- 17.5 percent compared with an overall county aver-age turnover of 7.8 percent. Other high turnover industries include “Arts, Entertainment, Recreation” and “Accommo-dations and Food Services” (15.7 and 13.9 percent, respec-tively).
Who is unemployed?Sector Number Percent of Total
Unemployed
Construction 2,112 14%
Manufacturing 2,408 16%
Retail Trade 1,596 10%
Administrative & Support, Waste Management & Remediation Services 1,308 8%
Health Care and Social Assistance 1,287 8%
Accommodation and Food Services 1,150 7%
No Previous Work Experience/Un-specified 2,224 14%
Source: EMSI (Feb. 2012); Census Quarterly Workforce Indicators (2011)
Initial Unemployment Claims
Components & Calculation of Unemployment Rate
2
4
6
8
10
12
14
2012201020082006200420022000
USAllen County
0
5,000
10,000
15,000
20,000
25,000
20122011201020092008
12,710
20,540
10,191 8,610 8,940
Community Research Institute
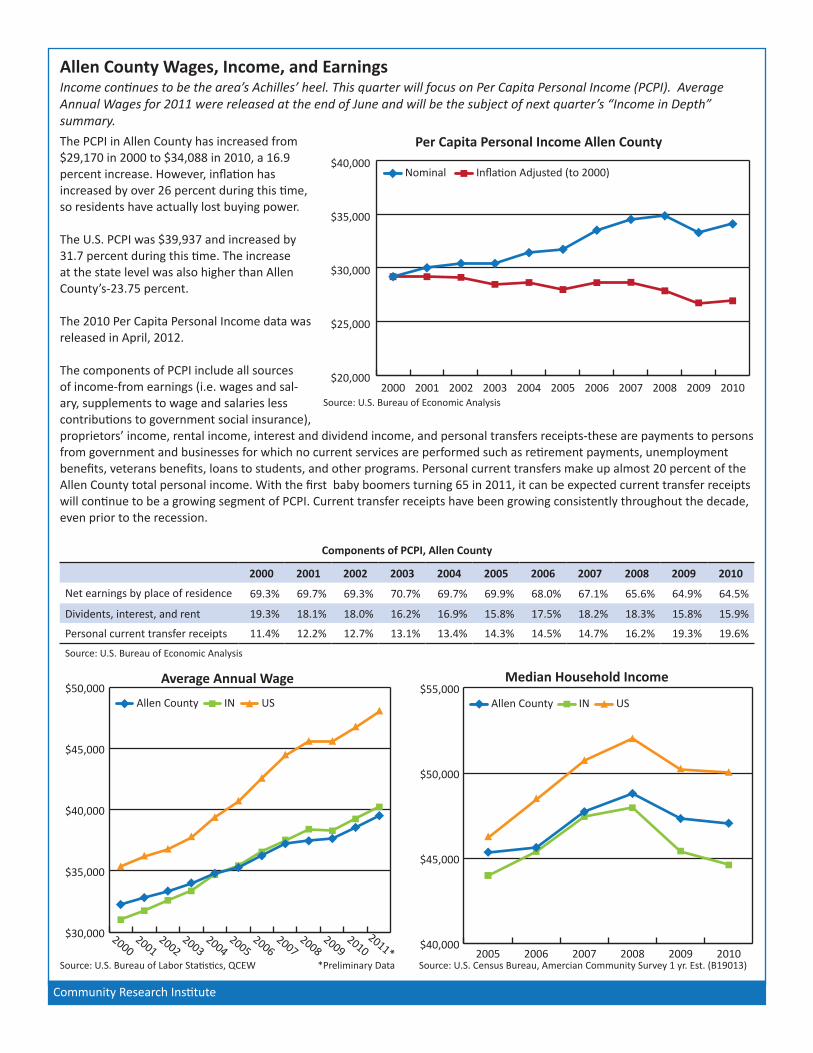
Allen County Wages, Income, and EarningsIncome continues to be the area’s Achilles’ heel. This quarter will focus on Per Capita Personal Income (PCPI). Average Annual Wages for 2011 were released at the end of June and will be the subject of next quarter’s “Income in Depth” summary.The PCPI in Allen County has increased from $29,170 in 2000 to $34,088 in 2010, a 16.9 percent increase. However, inflation has increased by over 26 percent during this time, so residents have actually lost buying power.
The U.S. PCPI was $39,937 and increased by 31.7 percent during this time. The increase at the state level was also higher than Allen County’s-23.75 percent.
The 2010 Per Capita Personal Income data was released in April, 2012.
The components of PCPI include all sources of income-from earnings (i.e. wages and sal-ary, supplements to wage and salaries less contributions to government social insurance), proprietors’ income, rental income, interest and dividend income, and personal transfers receipts-these are payments to persons from government and businesses for which no current services are performed such as retirement payments, unemployment benefits, veterans benefits, loans to students, and other programs. Personal current transfers make up almost 20 percent of the Allen County total personal income. With the first baby boomers turning 65 in 2011, it can be expected current transfer receipts will continue to be a growing segment of PCPI. Current transfer receipts have been growing consistently throughout the decade, even prior to the recession.
Components of PCPI, Allen County
2000 2001 2002 2003 2004 2005 2006 2007 2008 2009 2010
Net earnings by place of residence 69.3% 69.7% 69.3% 70.7% 69.7% 69.9% 68.0% 67.1% 65.6% 64.9% 64.5%
Dividents, interest, and rent 19.3% 18.1% 18.0% 16.2% 16.9% 15.8% 17.5% 18.2% 18.3% 15.8% 15.9%
Personal current transfer receipts 11.4% 12.2% 12.7% 13.1% 13.4% 14.3% 14.5% 14.7% 16.2% 19.3% 19.6%
Source: U.S. Bureau of Economic Analysis
$30,000
$35,000
$40,000
$45,000
$50,000
2011*2010
20092008
20072006
20052004
20032002
20012000
Allen County IN US
Average Annual Wage
Source: U.S. Bureau of Labor Statistics, QCEW
Median Household Income
Source: U.S. Census Bureau, Amercian Community Survey 1 yr. Est. (B19013)
$40,000
$45,000
$50,000
$55,000
201020092008200720062005
Allen County IN US
Per Capita Personal Income Allen County
$20,000
$25,000
$30,000
$35,000
$40,000
20102009200820072006200520042003200220012000
Nominal Inflation Adjusted (to 2000)
Source: U.S. Bureau of Economic Analysis
*Preliminary Data

Community Research Institute
Allen County Business Dynamics- 2nd Quarter A quarterly review of events occurring with the business establishments in Allen CountyThe following reflects business dynamics events that have started in Allen County, although the project may have been an-nounced in a previous quarter or year. CRI does not collect data on some industries such as retail, restaurant, or accommoda-tions. Our focus is on manufacturing, insur-ance, defense, logistics, medical devices, food processing, and major employers. Some establishments do make changes to their workforce that are not recorded through our business dynamics, although we survey establishments to capture that information-see the Major Employers report.
Event People/Jobs Investment in Millions Company
Expansion 18 3.75 Orthopaedics Northeast
Expansion 20 4 CNC Industries
Expansion 6 1 Quake Manufacturing Inc.
Expansion 5 4.2 Dana Corp.
Expansion 8 1.5 First Gear Engineering & Technology
Expansion 0 5.8 Lutheran Hospital
Expansion 50 1 Logistics Insight Corporation
Expansion 60 8.3 American Mitsuba Corporation
Expansion 50 0 Frontier
Expansion 0 0.34 Lutheran Hospital
New Unknown 0.315 C&J Services and Supplies Inc.
New 260 25.2 Franklin Electric Co., Inc.
Major Employers Report
Rank Company Employment Rank Company Employment
1 Parkview Health Systems 4,710 21 Sirva 500
2 Lutheran Health Network 4,301 22 AWS 496
3 Fort Wayne Community Schools 4,159 23 Ivy Tech Community College 496
4 General Motors 3,610 24 Indiana Michigan Power 451
5 Lincoln Financial Group 2,007 25 Do it Best Corp. 445
6 City of Fort Wayne 2,003 26 Dana Corp. 425
7 Allen County Government 1,605 27 IN Air National Guard, 122nd Fighter Wing 423
8 BFGoodrich 1,580 28 Easter Seals ARC of Northeast Indiana 423
9 Frontier Communications Corp. 1,523 29 Sweetwater Sound 413
10 IPFW 1,255 30 Fort Wayne Newspapers Inc 404
11 ITT Exelis 1,203 31 Navistar International Corp. 400
12 Raytheon Systems Co 1,040 32 C&M Fine Pack, Inc 384
13 B.A.E. Systems Platform Solutions 1,015 33 Superior Essex 377
14 Vera Bradley 840 34 AT&T 373
14 Northwest Allen County Schools 840 35 Lutheran Life Villages 359
16 Steel Dynamics1 825 36 Park Center, Inc 358
17 Norfolk Southern Corp2 784 37 Wells Fargo 355
18 Fort Wayne Metals Research Products Corp 539 38 Mullinix Packages, Inc 348
19 Edy’s Grand Ice Cream 525 39 UPS 345
20 Parker Hannifin Corporation 500 40 Lincoln Foodservice Products 330
1- Steel Dynamics consists of SDI Headquarters, OmniSource, and Superior Aluminum Alloys.2- Norfolk Southern includes Norfolk Southern, Triple Crown, and TransWorks.
Note that the business dynamics data is continously being revised.
A listing of the top 100 employers in Allen County is available at www.ipfw.edu/cri. Employment is reported in FTE- full time equivalents.
Based on a compilation of reports from 2007 to 2012.

Community Research Institute
Director’s Corner
Much has been made recently about Indiana leading the nation in private sector job creation in April, 2012. Employment data indicates that Allen County has been among the leaders within the state contributing to the relatively strong recovery Indiana is making since the end of the recession. This review will examine the strength of the Allen County recovery compared with the other larger Indiana counties1. These fifteen counties currently represent nearly 60 percent of the state’s total employment. There is also some indication that these larger counties perform economically somewhat differently than do more rural areas.
For purposes of this article, we will utilize the monthly employment and labor force estimates released by the Indiana Depart-ment of Workforce Development under the U.S. Department of Commerce Local Area Unemployment Statistics program. This data source estimates the number of employed residents in each county and the number of those in the labor force (those whom are either employed or actively seeking employment). This data series does not adjust for seasonal impacts at the coun-ty level and comparing different months without seasonally adjusting the data is always done with some caution. However, we will be treating all fifteen counties in a similar manner. We will also use the dates of the national recession as determined by the Nation Bureau of Economic Research. Nationally the recession began in December, 2007 and “officially” ended in June, 2009.
Allen County began to experience a significant drop in employment during late Summer of 2007, somewhat in advance of the official start of the national recession. Resident employment in Allen County declined by 10,306 during the recession (from December, 2007 through June, 2009). This was a 6 percent decrease in employment in Allen County. Over the same time period, the state experienced a 5.2 percent decline. Only three of the fourteen comparison counties had a greater percentage decline in employment of this period than did Allen County (Elkhart at -20.0 percent; Delaware at -8.6 percent; and St. Joseph at -8.4 percent). Of the fifteen largest counties in the state, only these four counties exceeded the rate of statewide employment decline during the recession.
The recovery has been a very different experience in Allen County. It has had the second best recovery – growth in employment since June, 2009 – with a 4.9 percent increase in resident employment. Only Elkhart County has had a stronger recovery with a 14.2 percent increase. Of the fifteen largest Indiana counties, nine have higher employment levels today than they did at the end of the recession while six have fewer employed residents today than at the official end of the recession.
Allen County’s employment is now (April, 2012) at 98.6 percent of its pre-recession (December, 2007) total. Statewide, employ-ment is now at 95.7 percent of its pre-recession level. Of the comparison counties, only two – Tippecanoe and Hendricks – are closer to their pre-recession employment than is Allen County. In fact, these two counties now actually exceed their pre-reces-sion employment total. Given how hard Allen County was impacted by the recession, its rate of employment growth during the recovery is impressive – second best improvement rate among the fifteen largest counties.
Among Indiana’s largest counties, Allen has certainly been a leader in bringing employment totals back to near pre-recession levels. While an unemployment rate at 7.5 percent (April, 2012) is still substantially higher than any would like, the progress being made in Allen County toward regaining employment since the official end of the recession has been strong compared with other Indiana counties.
Allen County is a statewide leader in the economic recovery
1- The fifteen largest Indiana counties, as defined by resident employment in April, 2012, include: Allen, Clark, Delaware, Elkhart, Hamilton, Hendricks, Johnson, Lake, Madison, Marion, Monroe, St. Joseph, Tippecanoe, Vanderburgh and Porter counties.
0.92
0.94
0.96
0.98
1.00
1.02
April '12June '09Dec. '07
Perc
ent o
f ‘07
Em
ploy
men
t Allen County INPeer Group
Employment Changes During the Great Recession
Source: U.S. Bureau of Labor Statistics, LAUS
2
4
6
8
10
12
14
2012201020082006200420022000
USAllen County
Employment Changes Since the Recession
Source: U.S. Bureau of Labor Statistics, LAUS
Related Documents


![{KKKKmmmmaaaa---]]] ----©mmmm----bbb ---¯ nnnssssââââ …lfa.kerala.gov.in/docs/audit_report/panchayat/kottayam/elikkulam09_… · FenFen- ---¡pfw {Kma¡pfw {Kma¡pfw {Kma-](https://static.cupdf.com/doc/110x72/5f78fae61406ab6bec26f33c/kkkkmmmmaaaa-mmmm-bbb-nnnssss-lfa-fenfen-pfw.jpg)