INVESTOR PRO POWERPOINT PRESENTATION TEMPLATE INDIA REAL ESTATE JANUARY TO JUNE 2016 RESIDENTIAL & OFFICE

Welcome message from author
This document is posted to help you gain knowledge. Please leave a comment to let me know what you think about it! Share it to your friends and learn new things together.
Transcript

INVESTOR PRO
P O W E R P O I N T P R E S E N T A T I O N T E M P L A T E
INDIA REAL ESTATE
JANUARY TO JUNE 2016
RESIDENTIAL & OFFICE

IS RECOVERY IN
RESIDENTIAL FOR REAL?
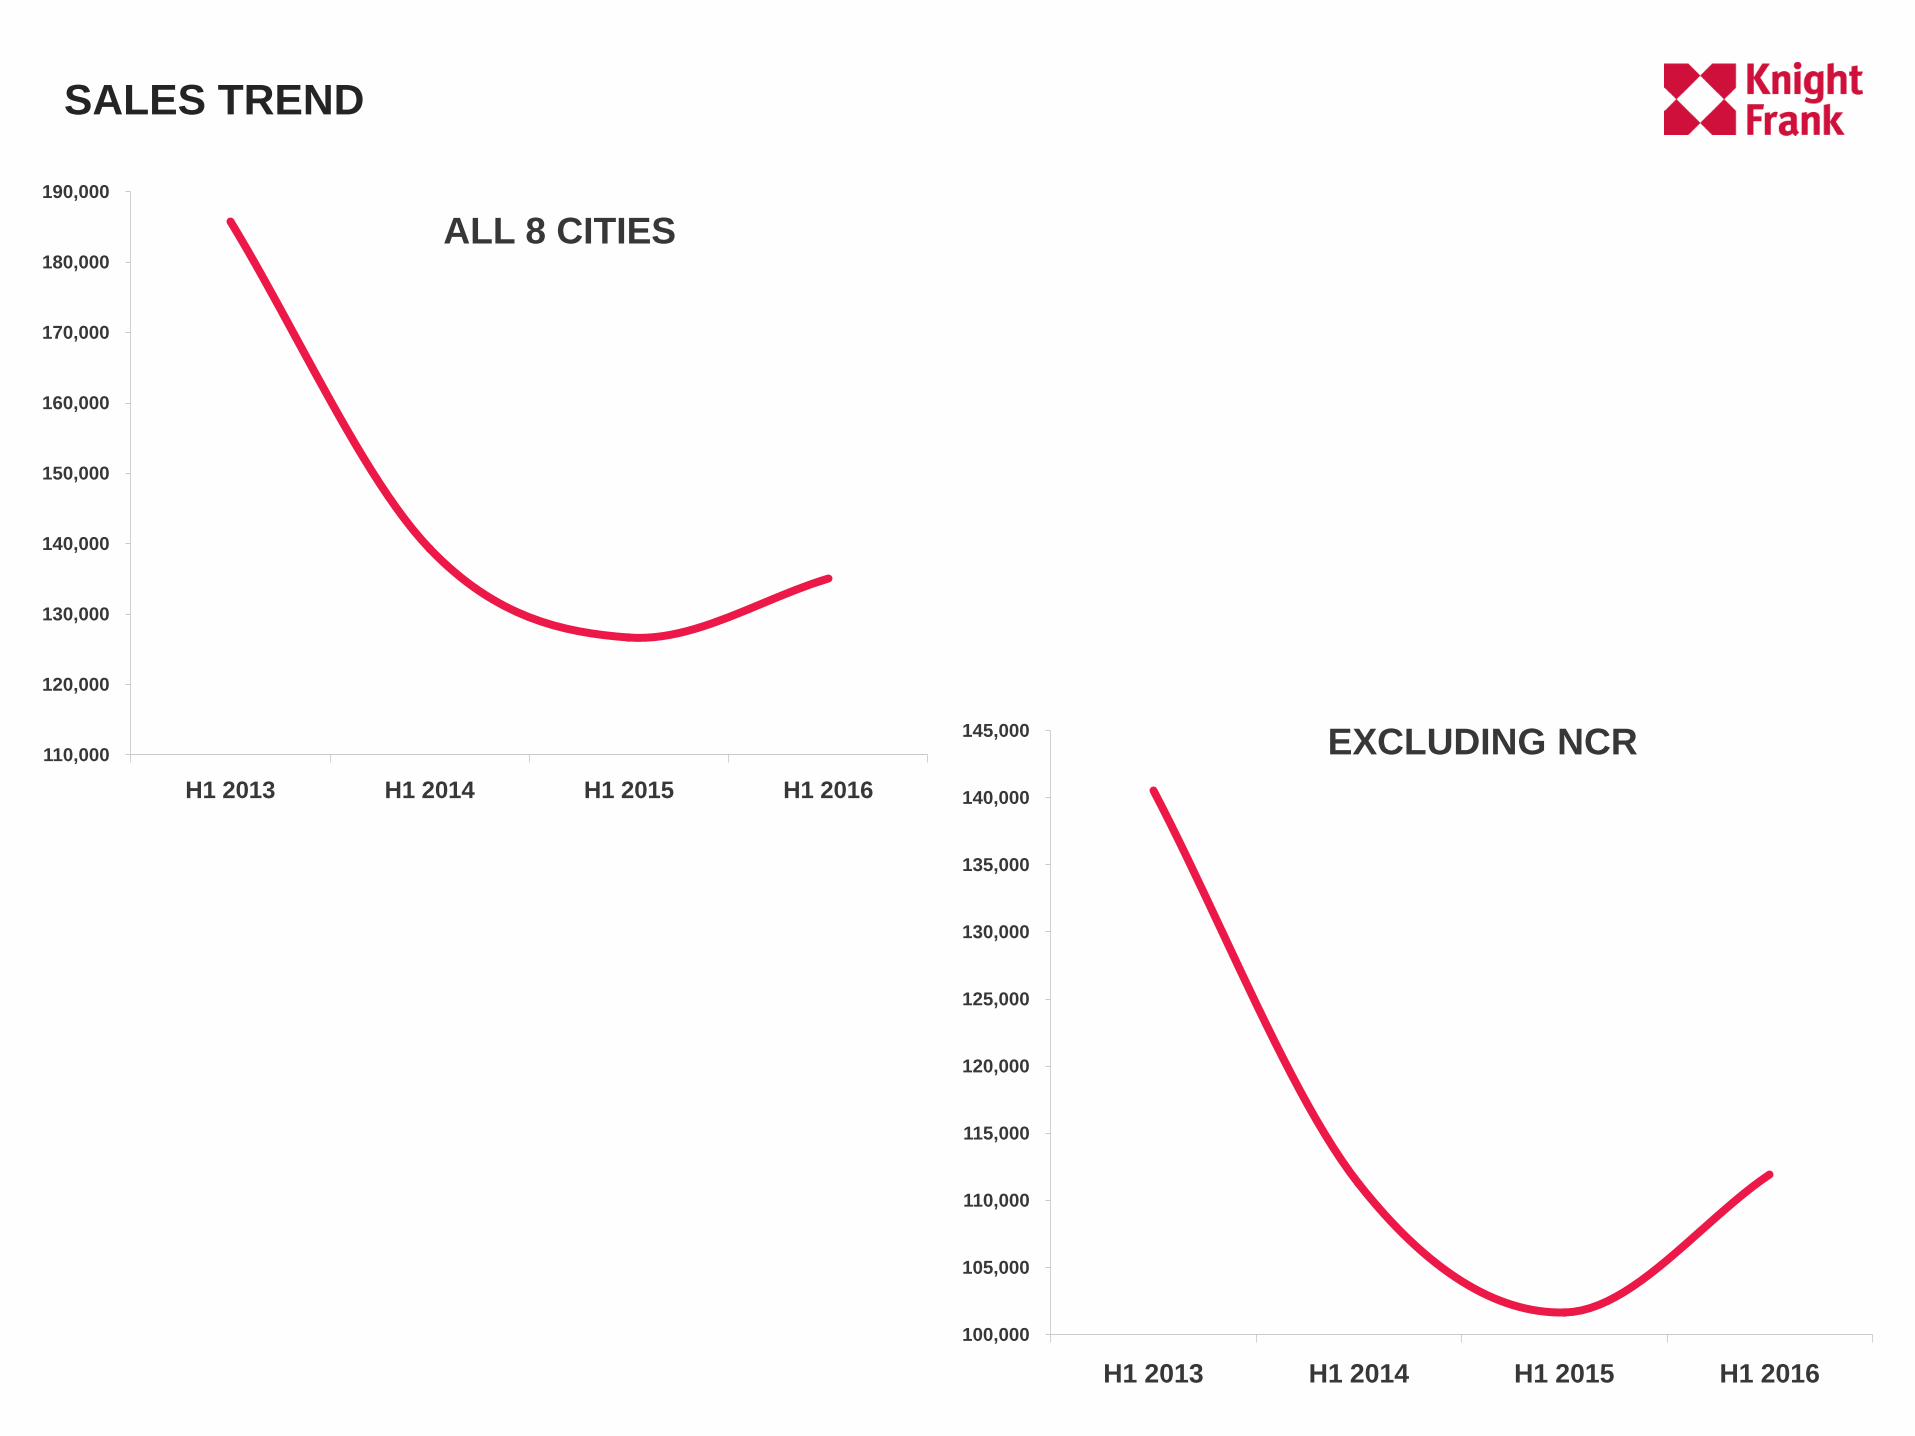
SALES TREND
110,000
120,000
130,000
140,000
150,000
160,000
170,000
180,000
190,000
H1 2013 H1 2014 H1 2015 H1 2016
100,000
105,000
110,000
115,000
120,000
125,000
130,000
135,000
140,000
145,000
H1 2013 H1 2014 H1 2015 H1 2016
ALL 8 CITIES
EXCLUDING NCR
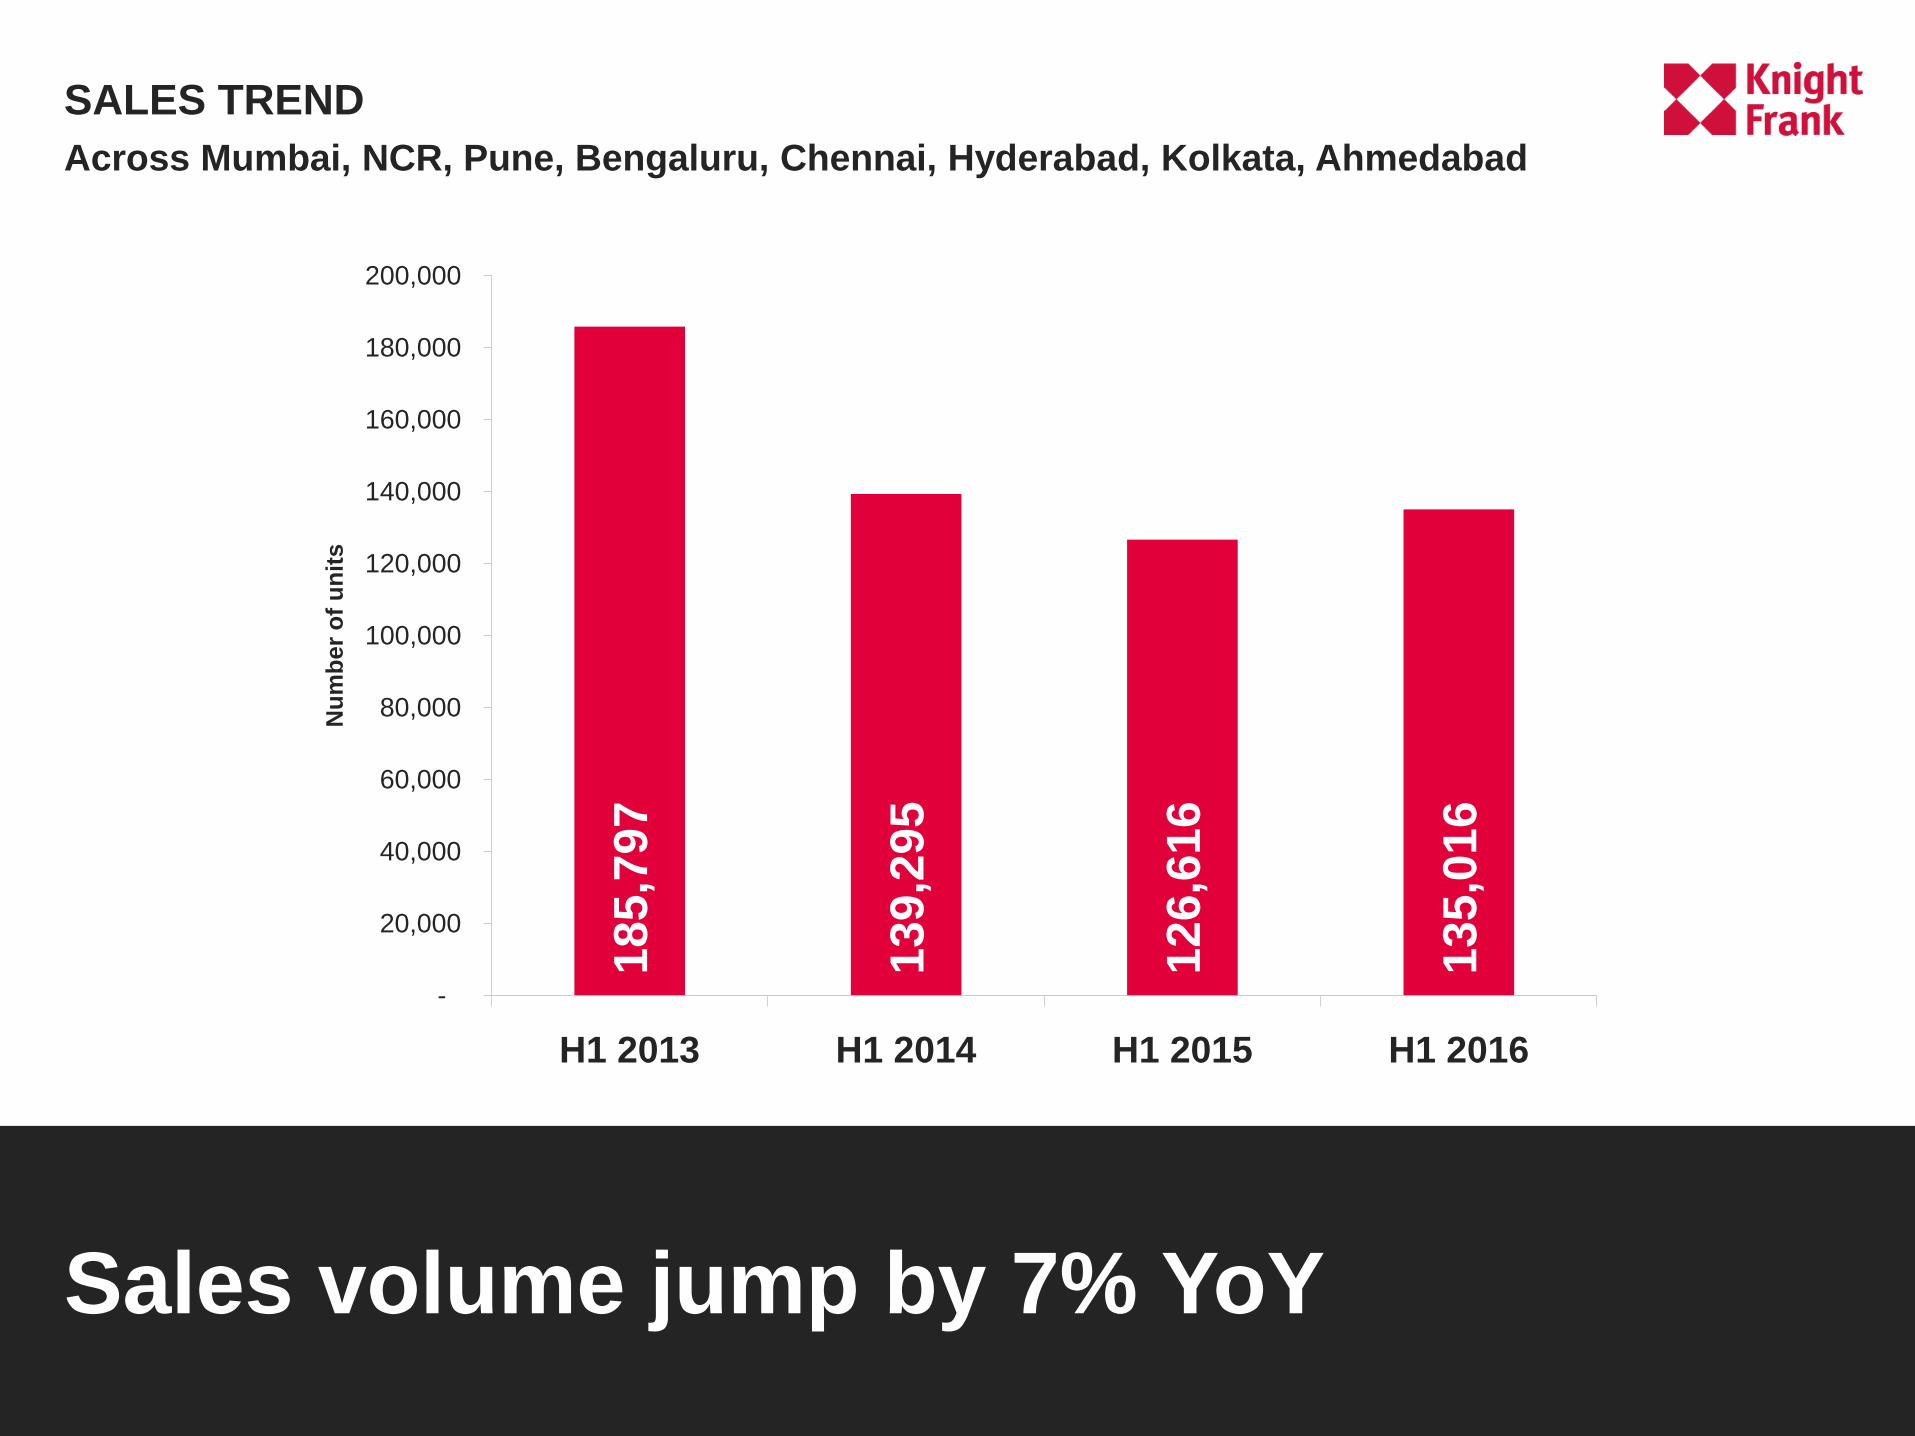
SALES TREND
Sales volume jump by 7% YoY
185,7
97
139,2
95
126,6
16
135,0
16
-
20,000
40,000
60,000
80,000
100,000
120,000
140,000
160,000
180,000
200,000
H1 2013 H1 2014 H1 2015 H1 2016
Nu
mb
er
of
un
its
Across Mumbai, NCR, Pune, Bengaluru, Chennai, Hyderabad, Kolkata, Ahmedabad
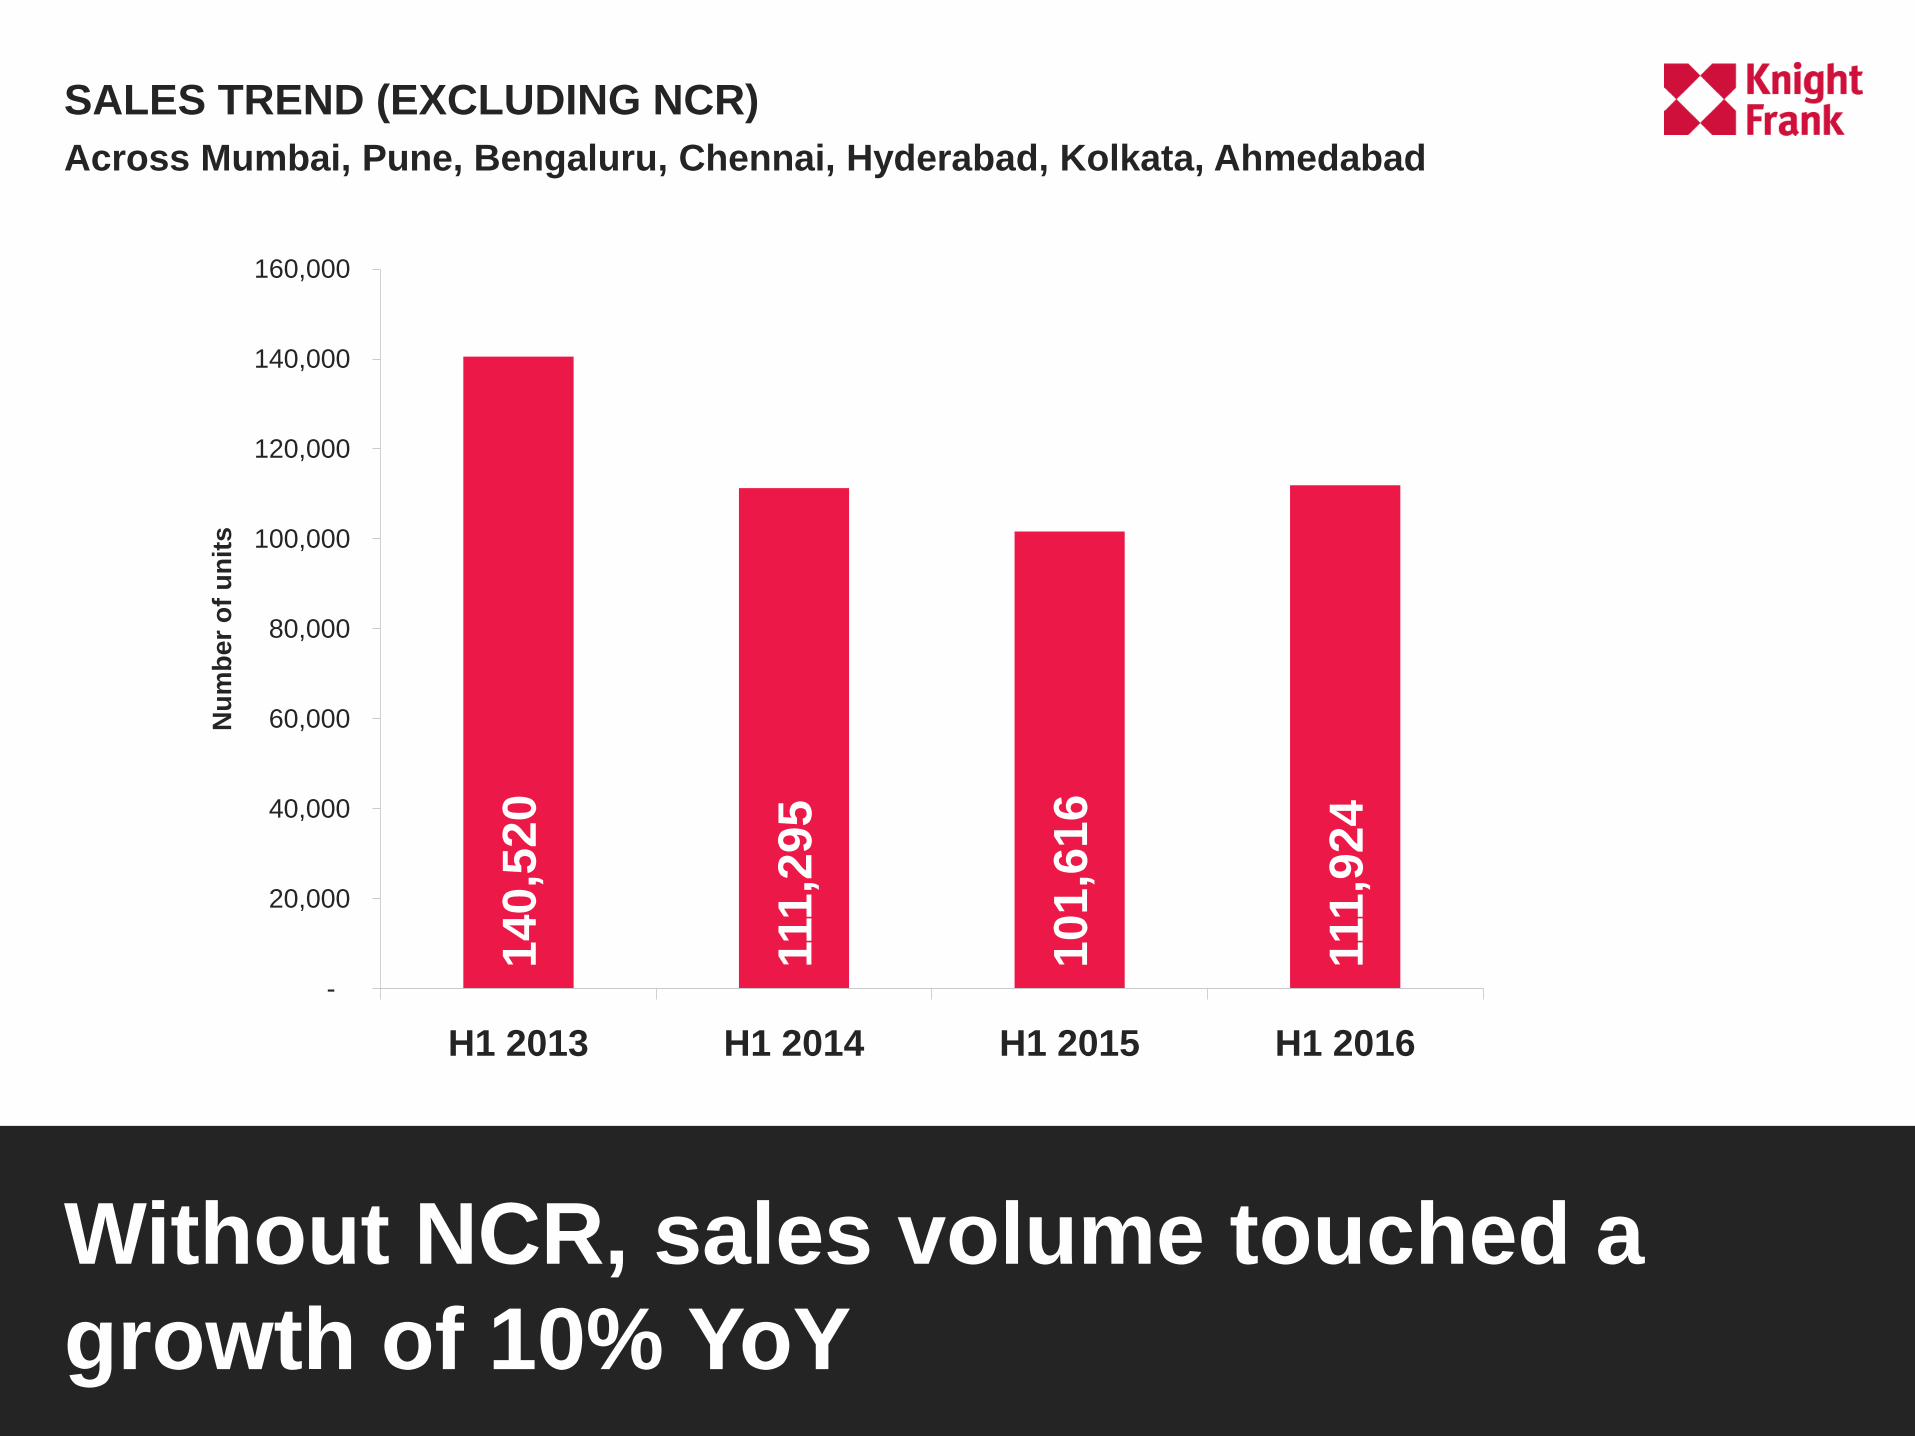
SALES TREND (EXCLUDING NCR)
Without NCR, sales volume touched a
growth of 10% YoY
Across Mumbai, Pune, Bengaluru, Chennai, Hyderabad, Kolkata, Ahmedabad
140,5
20
111,2
95
101,6
16
111,9
24
-
20,000
40,000
60,000
80,000
100,000
120,000
140,000
160,000
H1 2013 H1 2014 H1 2015 H1 2016
Nu
mb
er
of
un
its

RESIDENTIAL
LAUNCHES DIP TO A
3 YEAR LOW
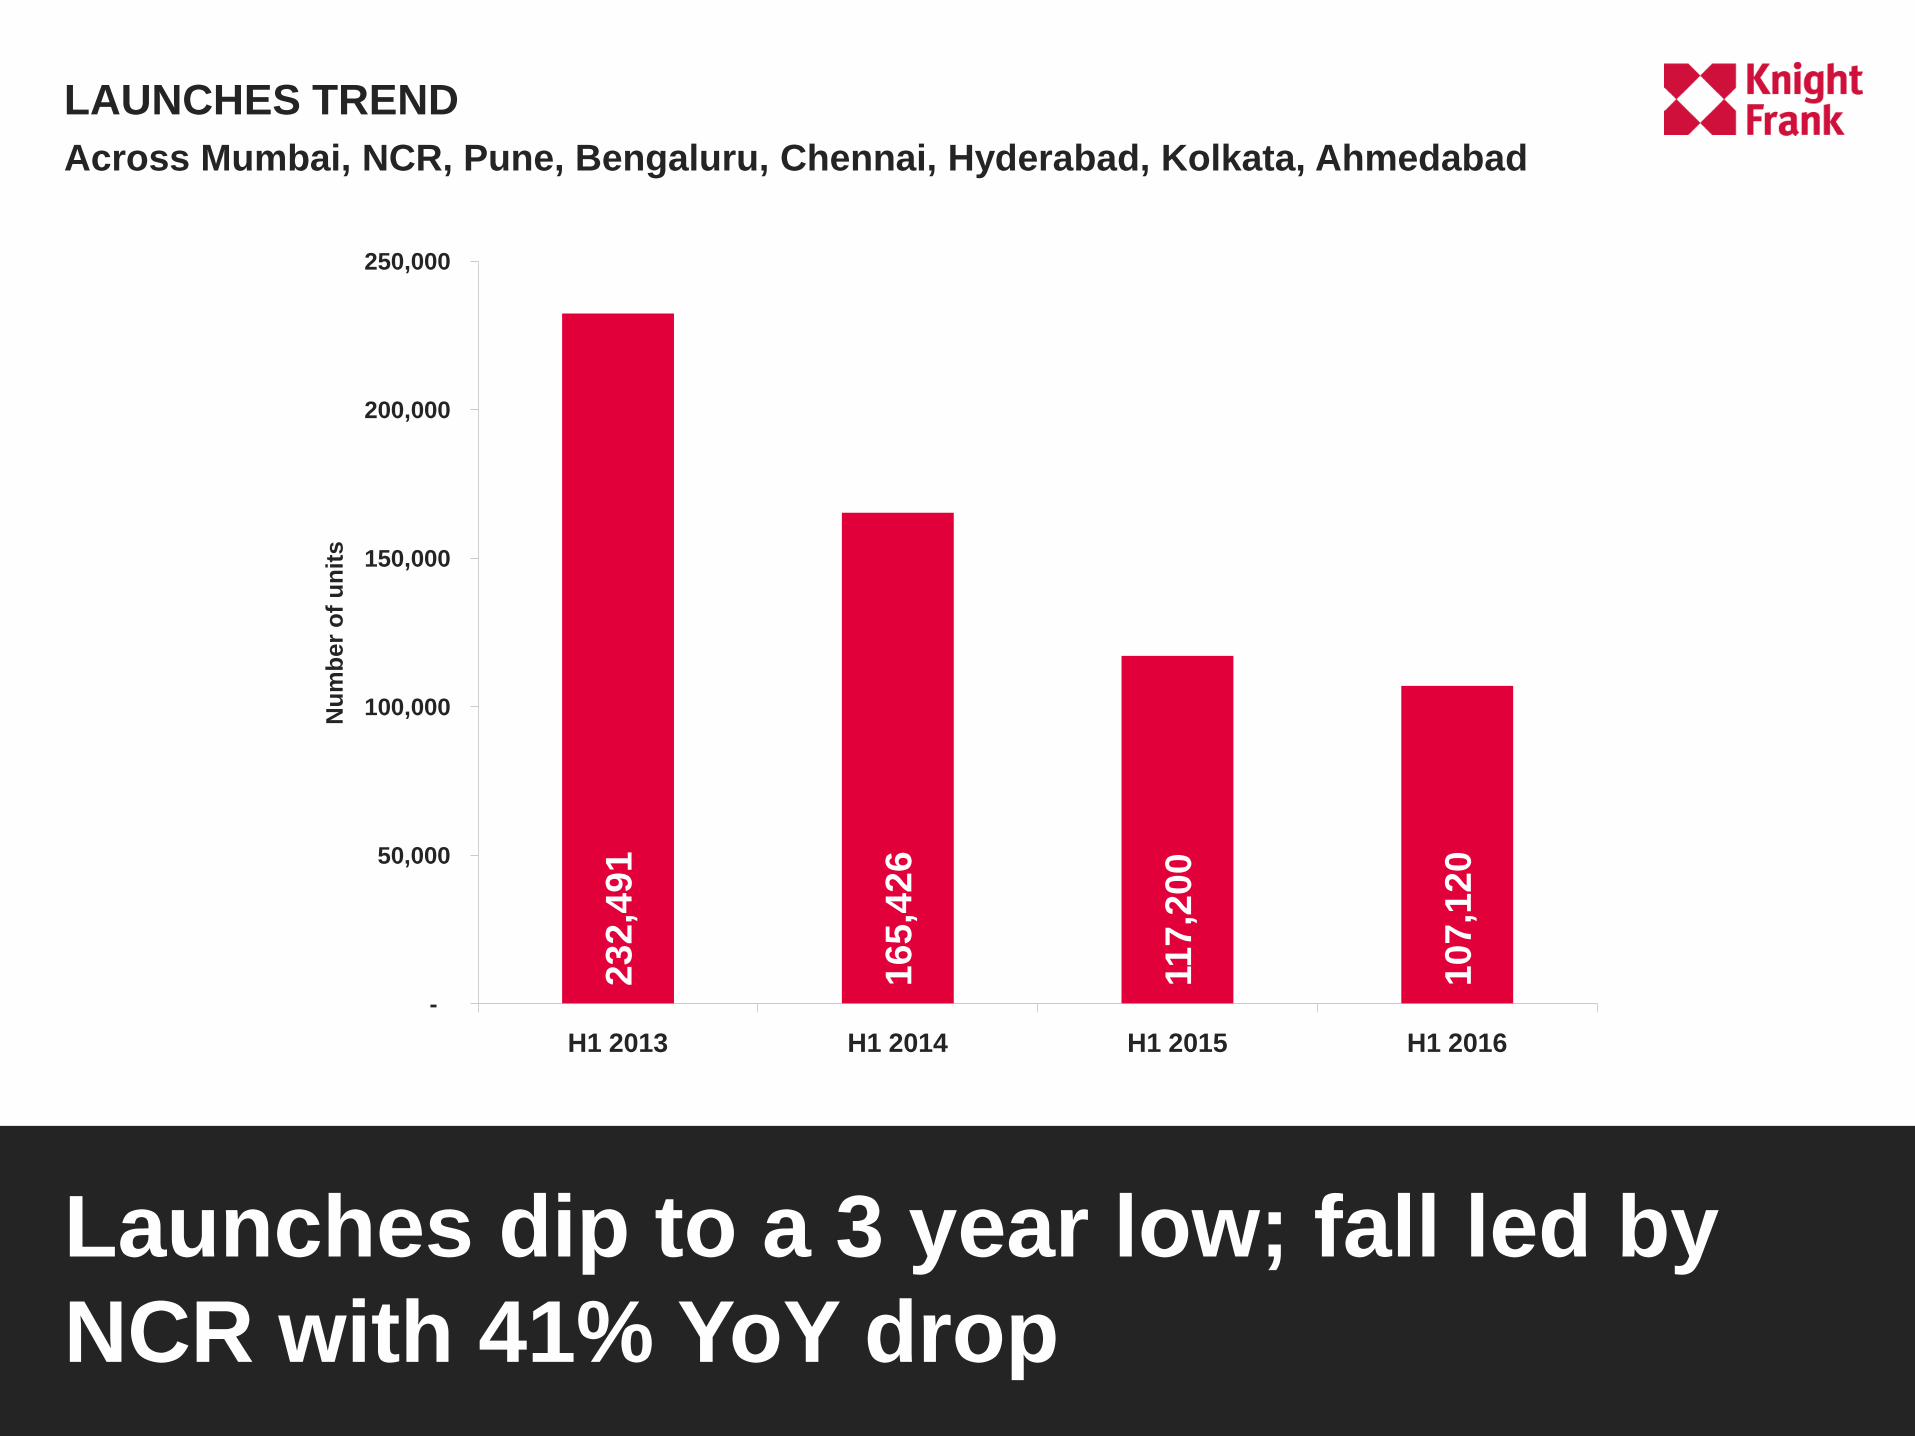
LAUNCHES TREND
Launches dip to a 3 year low; fall led by
NCR with 41% YoY drop
23
2,4
91
16
5,4
26
117
,20
0
10
7,1
20
-
50,000
100,000
150,000
200,000
250,000
H1 2013 H1 2014 H1 2015 H1 2016
Nu
mb
er
of
un
its
Across Mumbai, NCR, Pune, Bengaluru, Chennai, Hyderabad, Kolkata, Ahmedabad
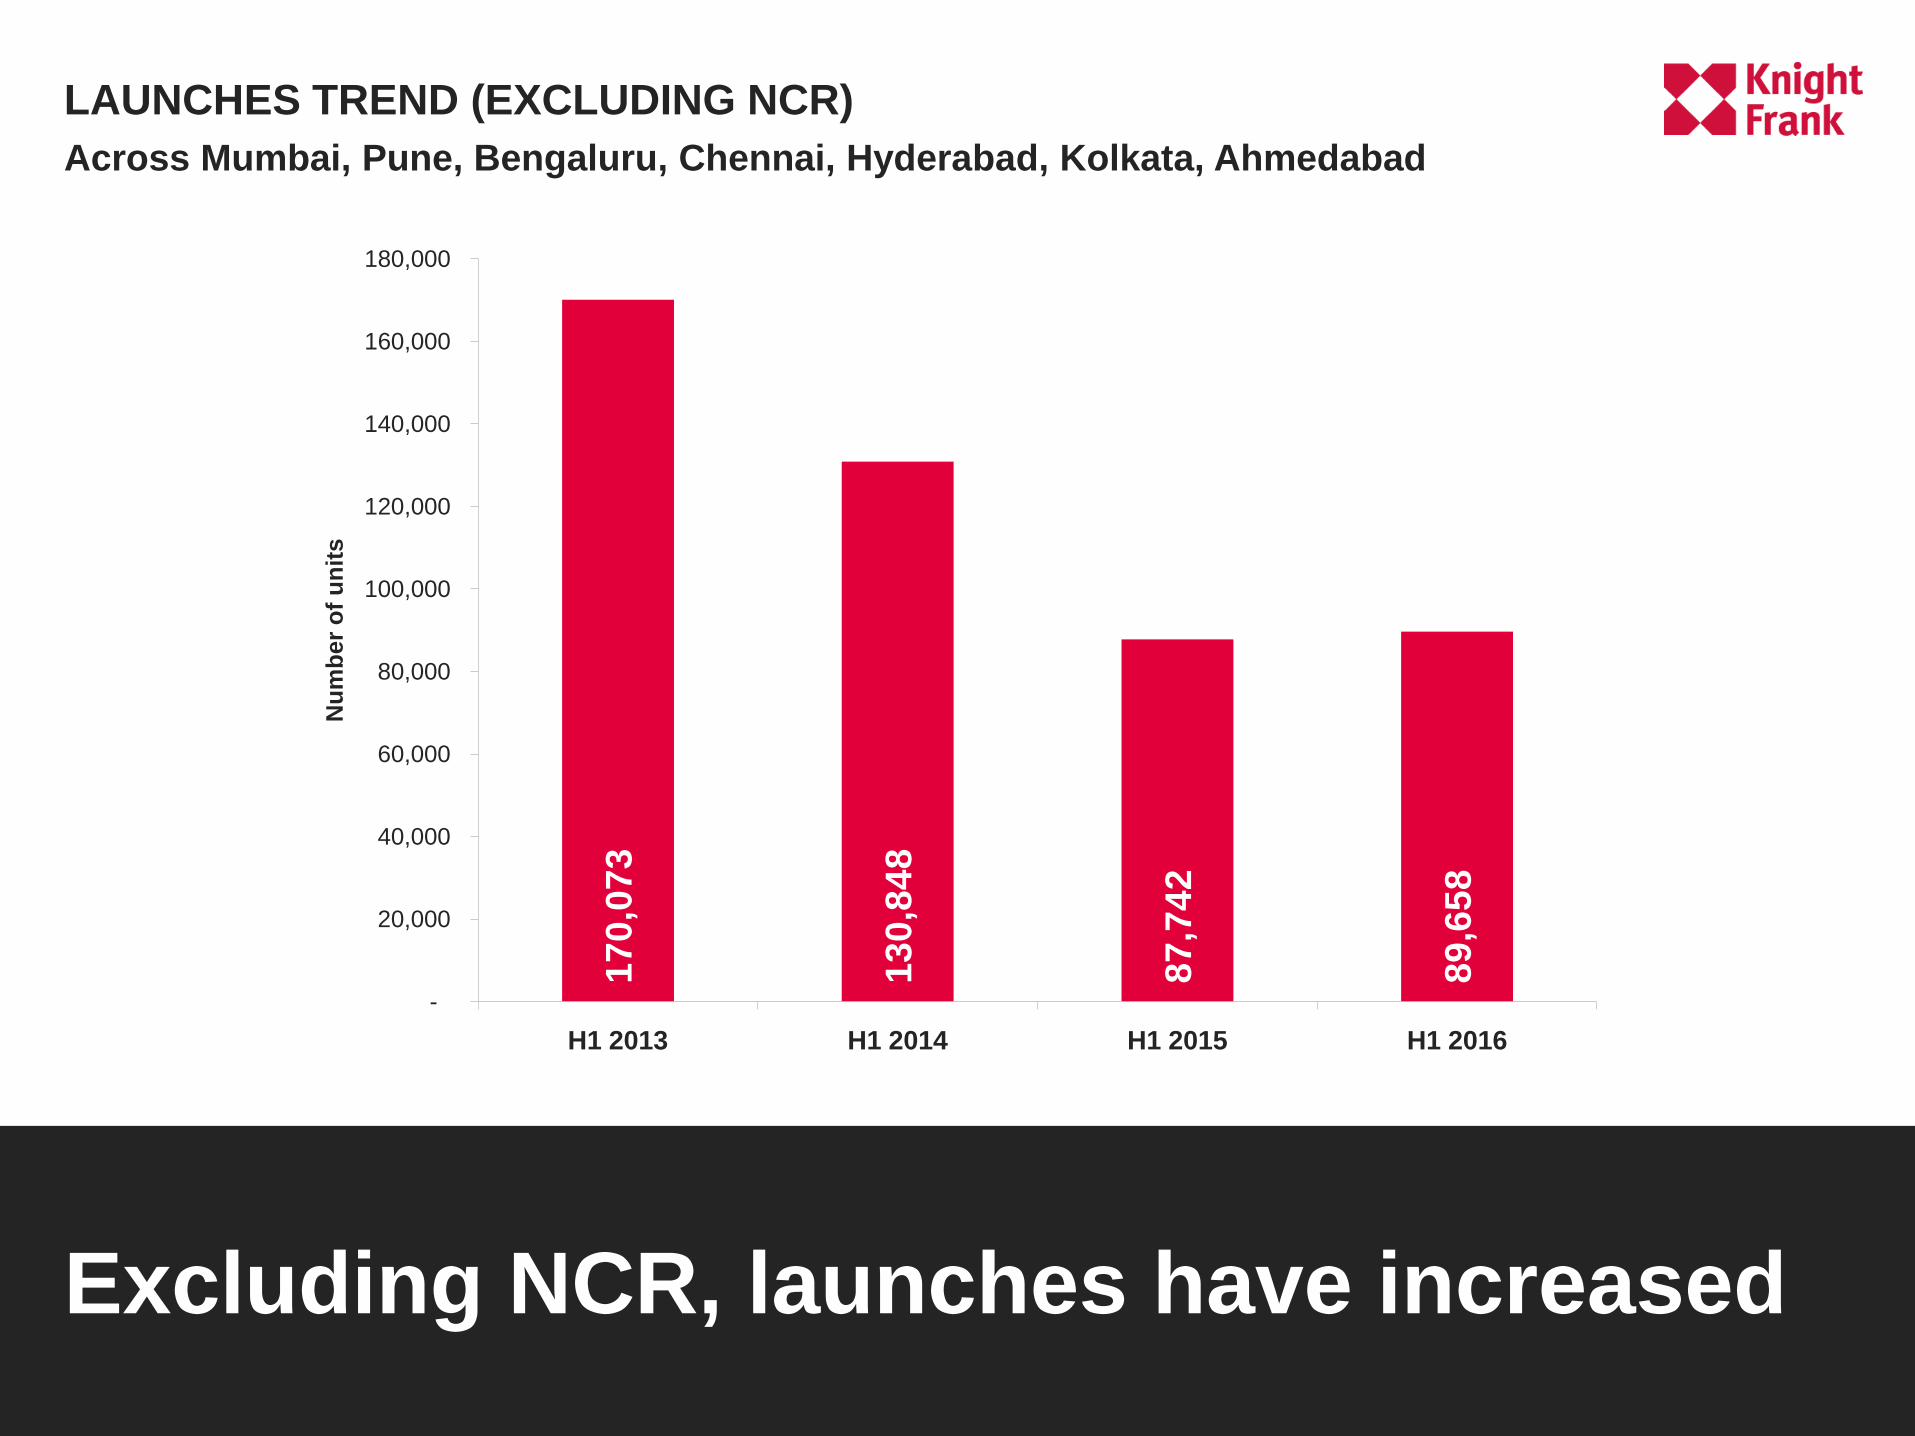
LAUNCHES TREND (EXCLUDING NCR)
Excluding NCR, launches have increased
17
0,0
73
13
0,8
48
87
,74
2
89
,65
8
-
20,000
40,000
60,000
80,000
100,000
120,000
140,000
160,000
180,000
H1 2013 H1 2014 H1 2015 H1 2016
Nu
mb
er
of
un
its
Across Mumbai, Pune, Bengaluru, Chennai, Hyderabad, Kolkata, Ahmedabad

PRICE CORRECTION?
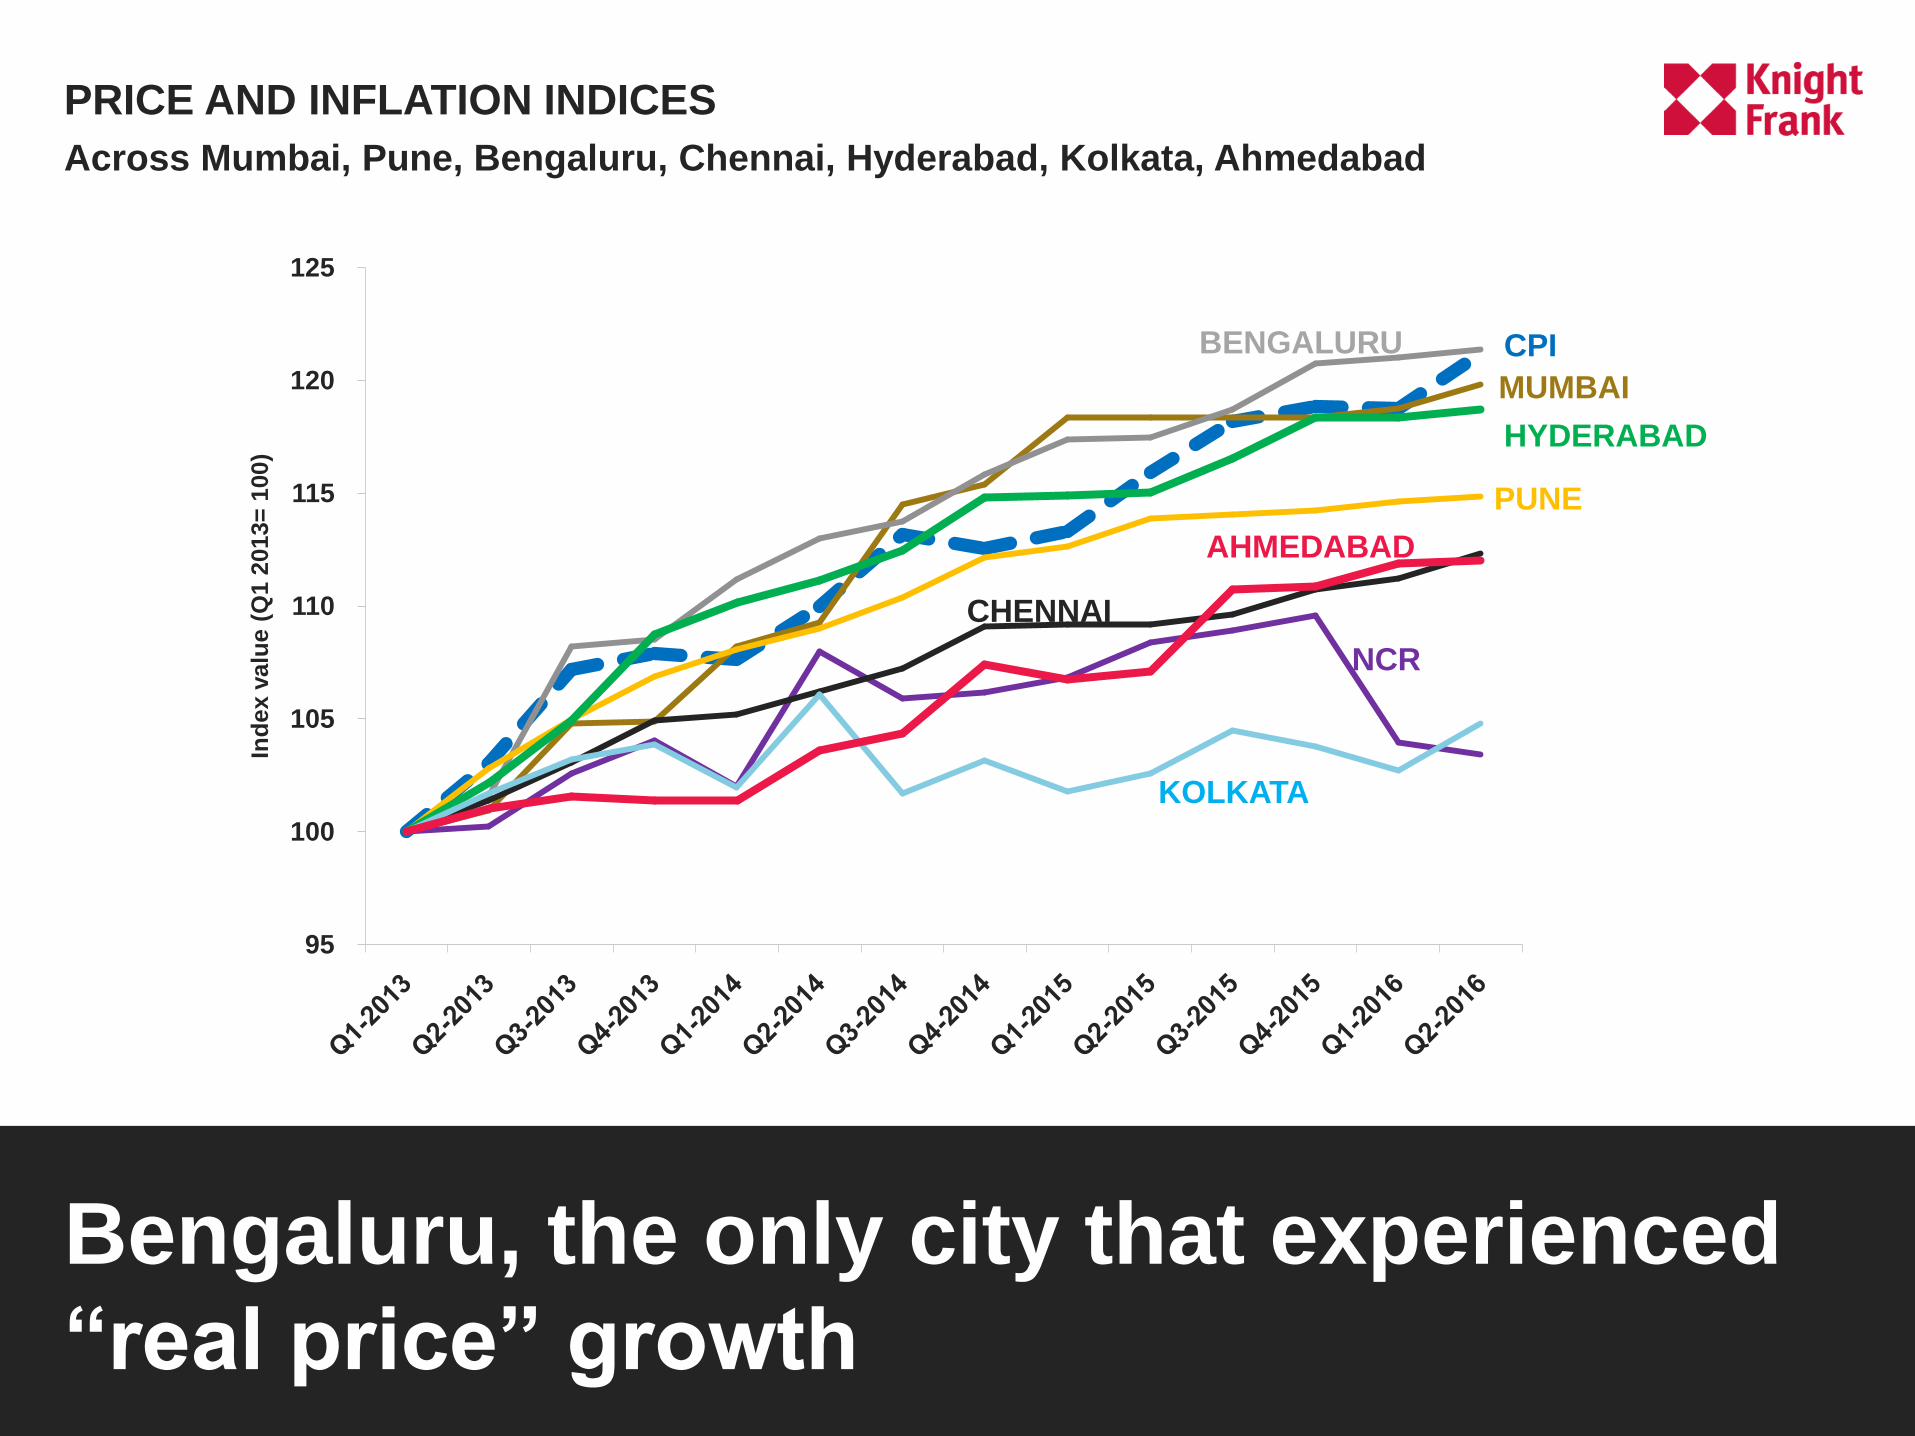
PRICE AND INFLATION INDICES
Bengaluru, the only city that experienced
“real price” growth
Across Mumbai, Pune, Bengaluru, Chennai, Hyderabad, Kolkata, Ahmedabad
95
100
105
110
115
120
125 In
dex v
alu
e (
Q1 2
013=
100)
CPIBENGALURU
MUMBAI
HYDERABAD
AHMEDABAD
PUNE
CHENNAI
NCR
KOLKATA
SUPPLY PRESSURE IS EASING;
UNWINDING OF UNSOLD
INVENTORY HAPPENING
AT A FAST PACE
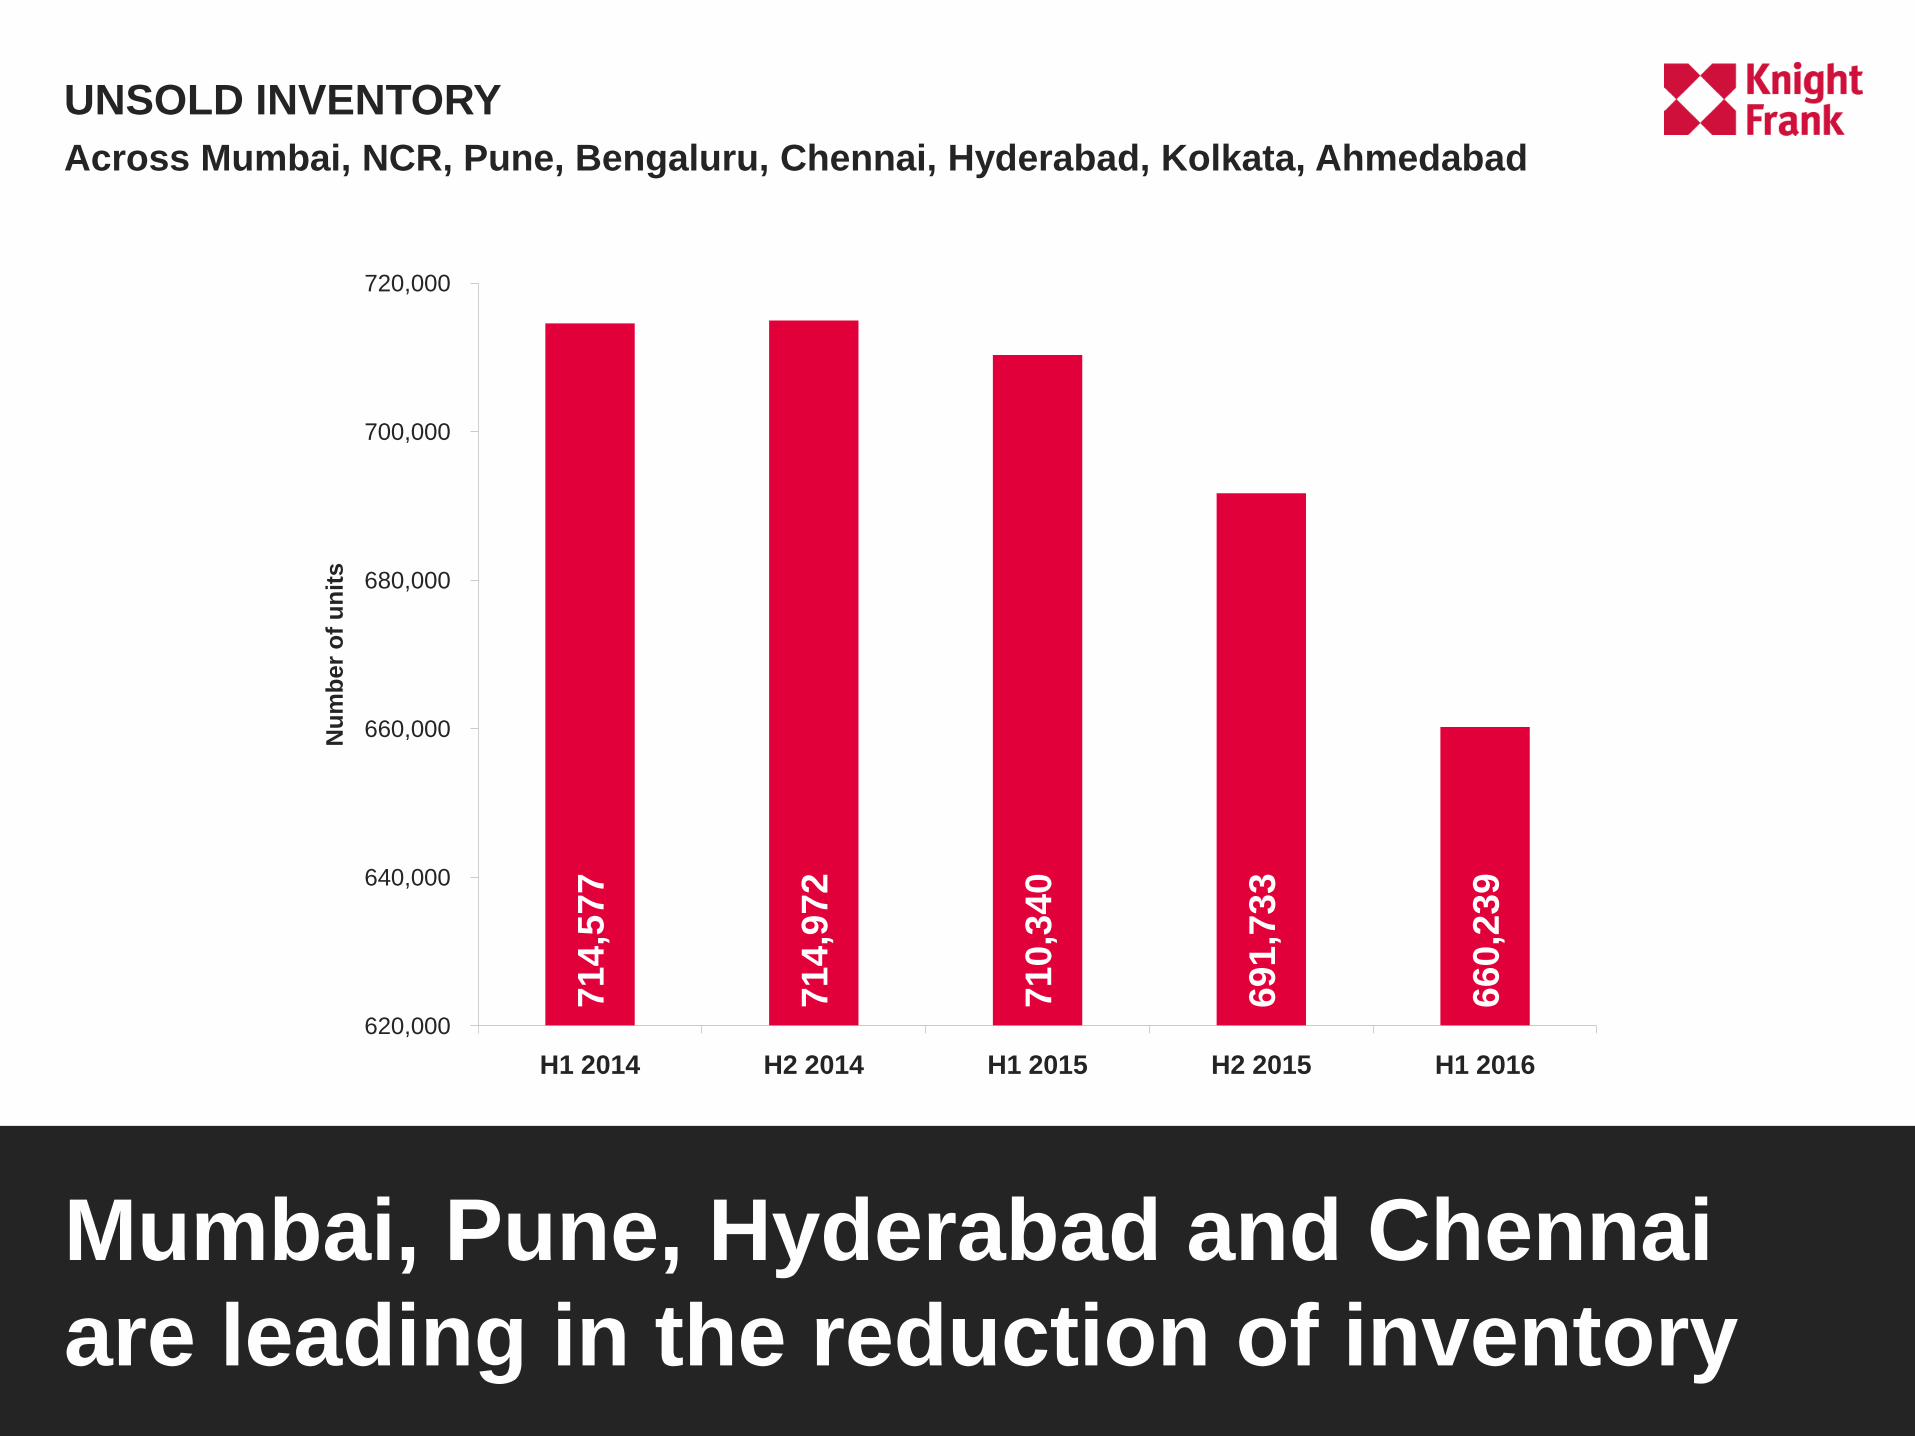
UNSOLD INVENTORY
Mumbai, Pune, Hyderabad and Chennai
are leading in the reduction of inventory
71
4,5
77
71
4,9
72
71
0,3
40
69
1,7
33
66
0,2
39
620,000
640,000
660,000
680,000
700,000
720,000
H1 2014 H2 2014 H1 2015 H2 2015 H1 2016
Nu
mb
er
of
un
its
Across Mumbai, NCR, Pune, Bengaluru, Chennai, Hyderabad, Kolkata, Ahmedabad
QUARTERS TO SELL (QTS) VS. AGE OF INVENTORY ACROSS CITIES
Bengaluru & Pune continues to be the
best performing markets; NCR the worst
8
10
12
14
16
5 7 9 11 13 15 17 19
Ag
e o
f u
nso
ld i
nven
tory
in
qu
art
ers
QTS
Mumbai
NCR
Bengaluru
Pune
Chennai
Hyderabad
Kolkata
Ahmedabad
MUMBAI
NCR
BENGALURU
PUNE
CHENNAI
HYDERABAD
KOLKATA
AHMEDABAD
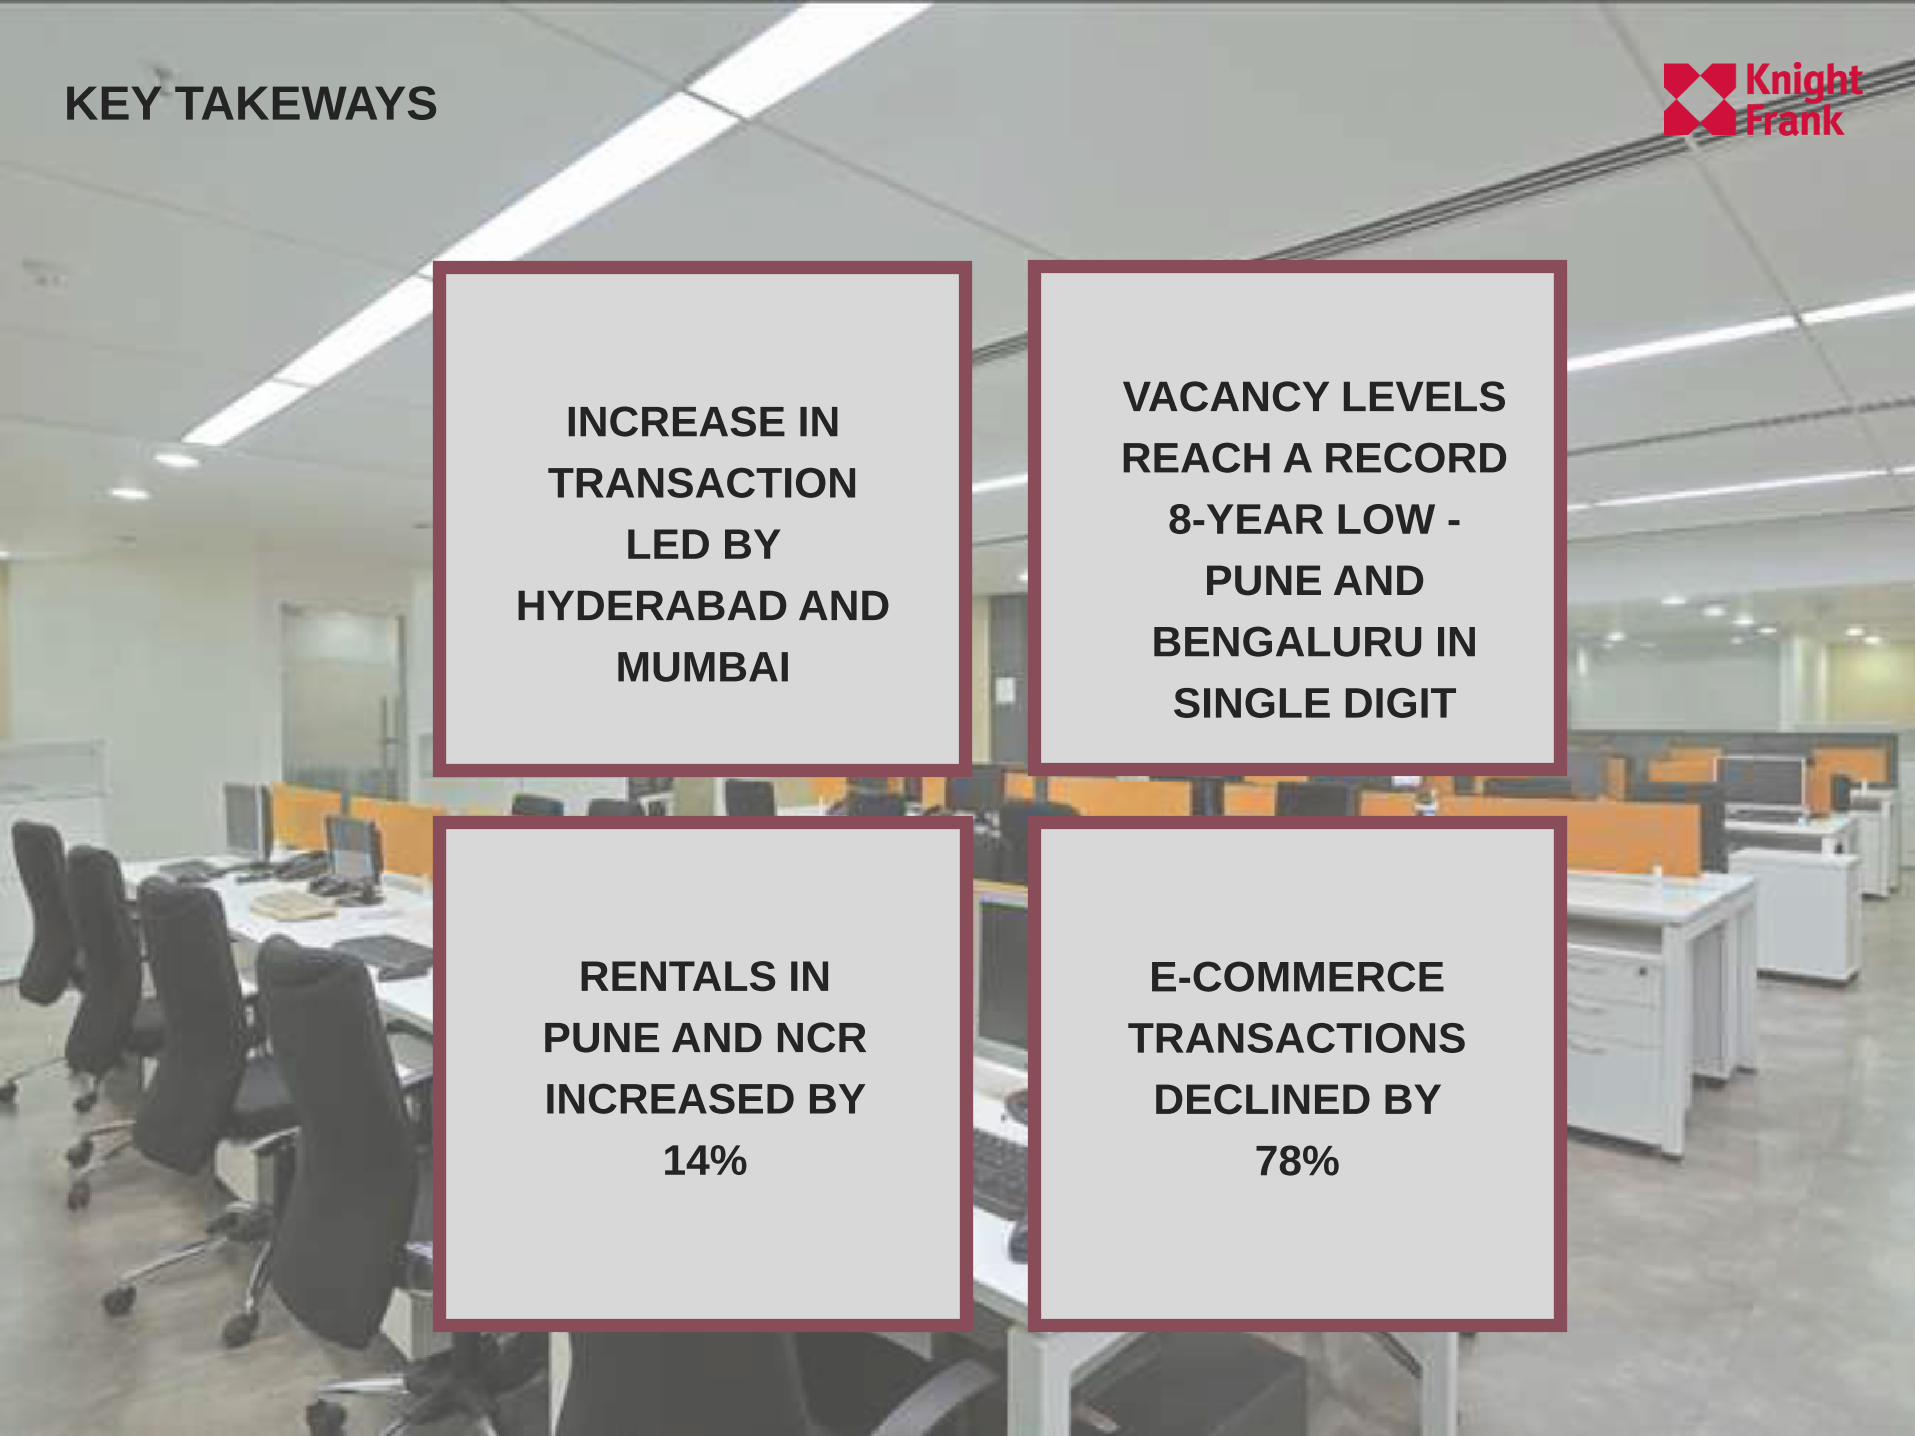
KEY TAKEWAYS
NCR
WEIGHING
THE WHOLE
COUNTRY
DOWN
SALES
RECOVERY IN
MUMBAI KEEPS
THE
RESIDENTIAL
MARKET
BUOYANT
BENGALURU
THE ONLY CITY
THAT
EXPERIENCED
“REAL PRICE”
GROWTH
UNSOLD
INVENTORY
LOWEST IN
THE LAST 2
YEARS
BENGALURU
& PUNE
CONTINUE TO
BE THE BEST
PERFORMING
MARKETS

IT IS REAL!

OFFICE DEMAND
CONTINUES TO GROW
FROM STRENGTH TO
STRENGTH
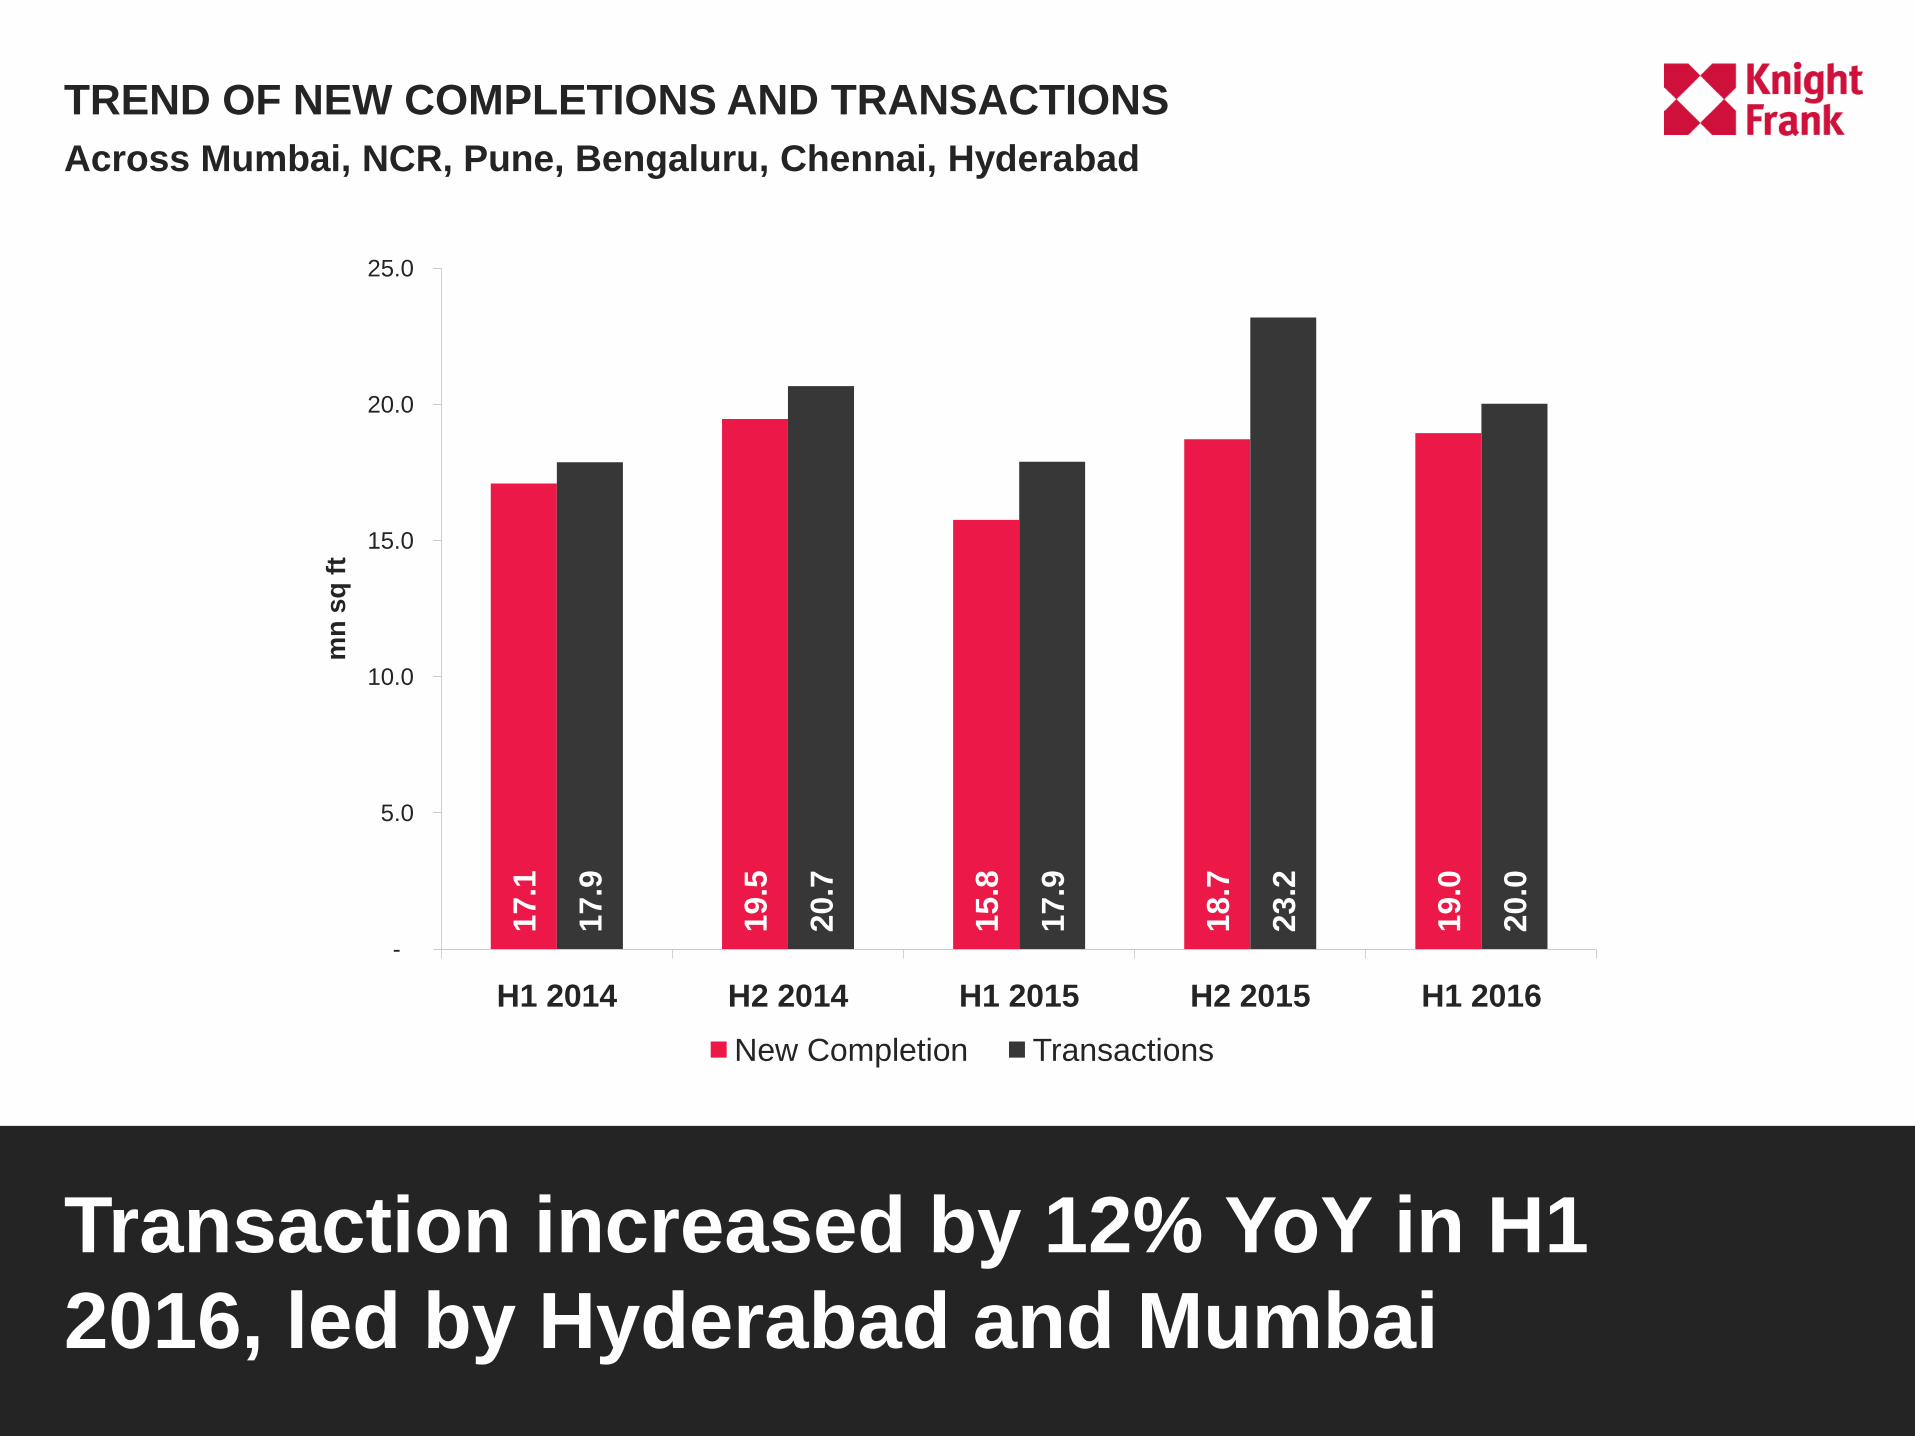
TREND OF NEW COMPLETIONS AND TRANSACTIONS
Transaction increased by 12% YoY in H1
2016, led by Hyderabad and Mumbai
Across Mumbai, NCR, Pune, Bengaluru, Chennai, Hyderabad
17.1
19.5
15.8
18.7
19.0
17.9
20.7
17.9
23.2
20.0
-
5.0
10.0
15.0
20.0
25.0
H1 2014 H2 2014 H1 2015 H2 2015 H1 2016
mn
sq
ft
New Completion Transactions
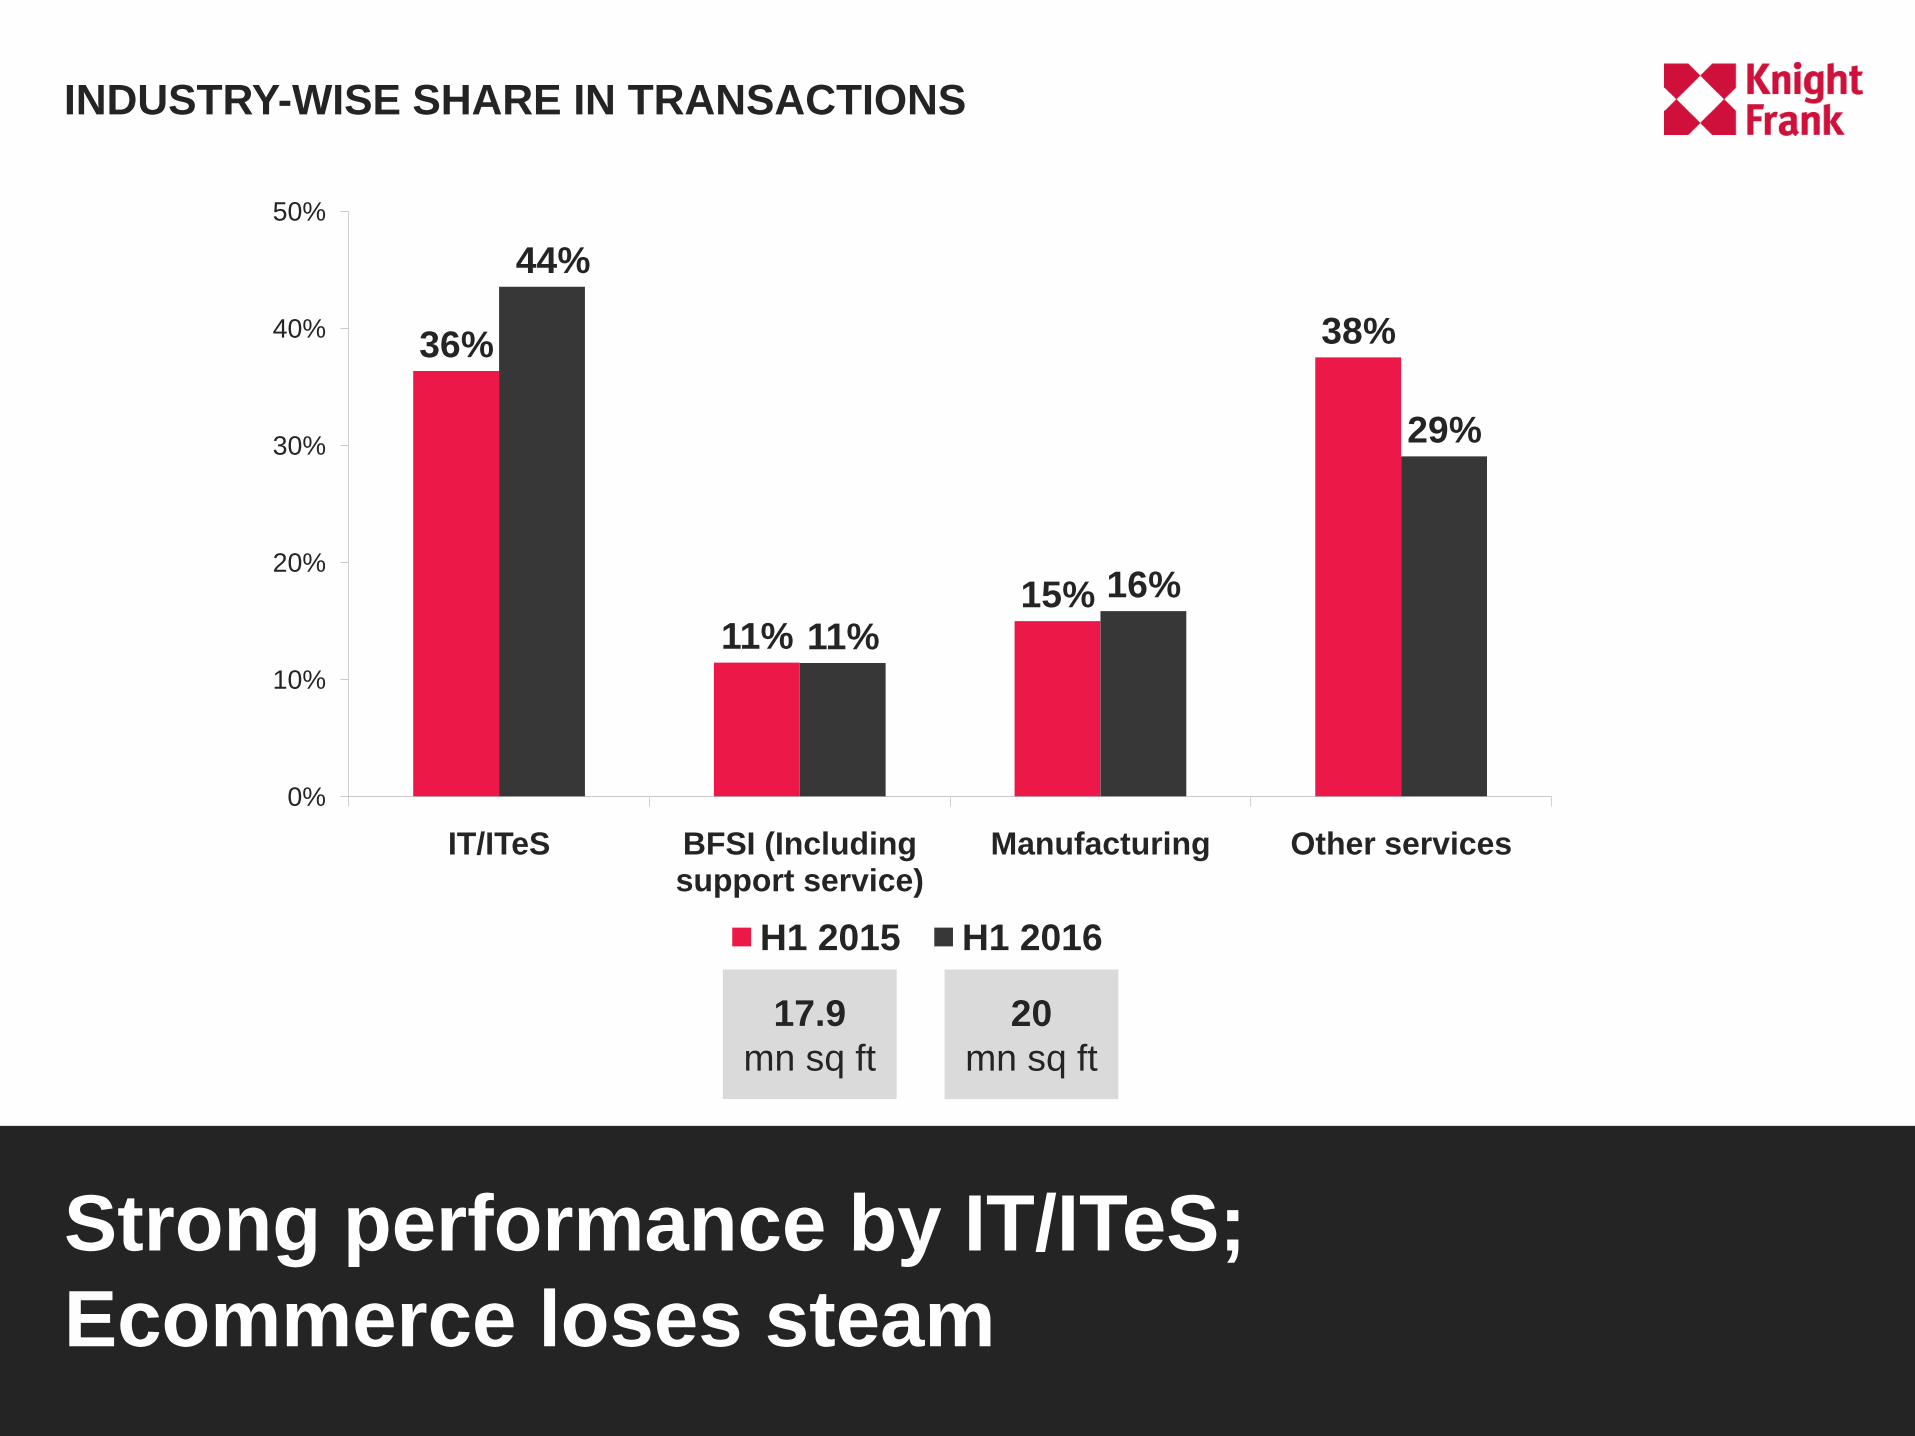
INDUSTRY-WISE SHARE IN TRANSACTIONS
Strong performance by IT/ITeS;
Ecommerce loses steam
36%
11%15%
38%
44%
11%
16%
29%
0%
10%
20%
30%
40%
50%
IT/ITeS BFSI (Including support service)
Manufacturing Other services
H1 2015 H1 2016
17.9
mn sq ft
20
mn sq ft
VACANCY LEVELS REACH
A RECORD 8-YEAR LOW
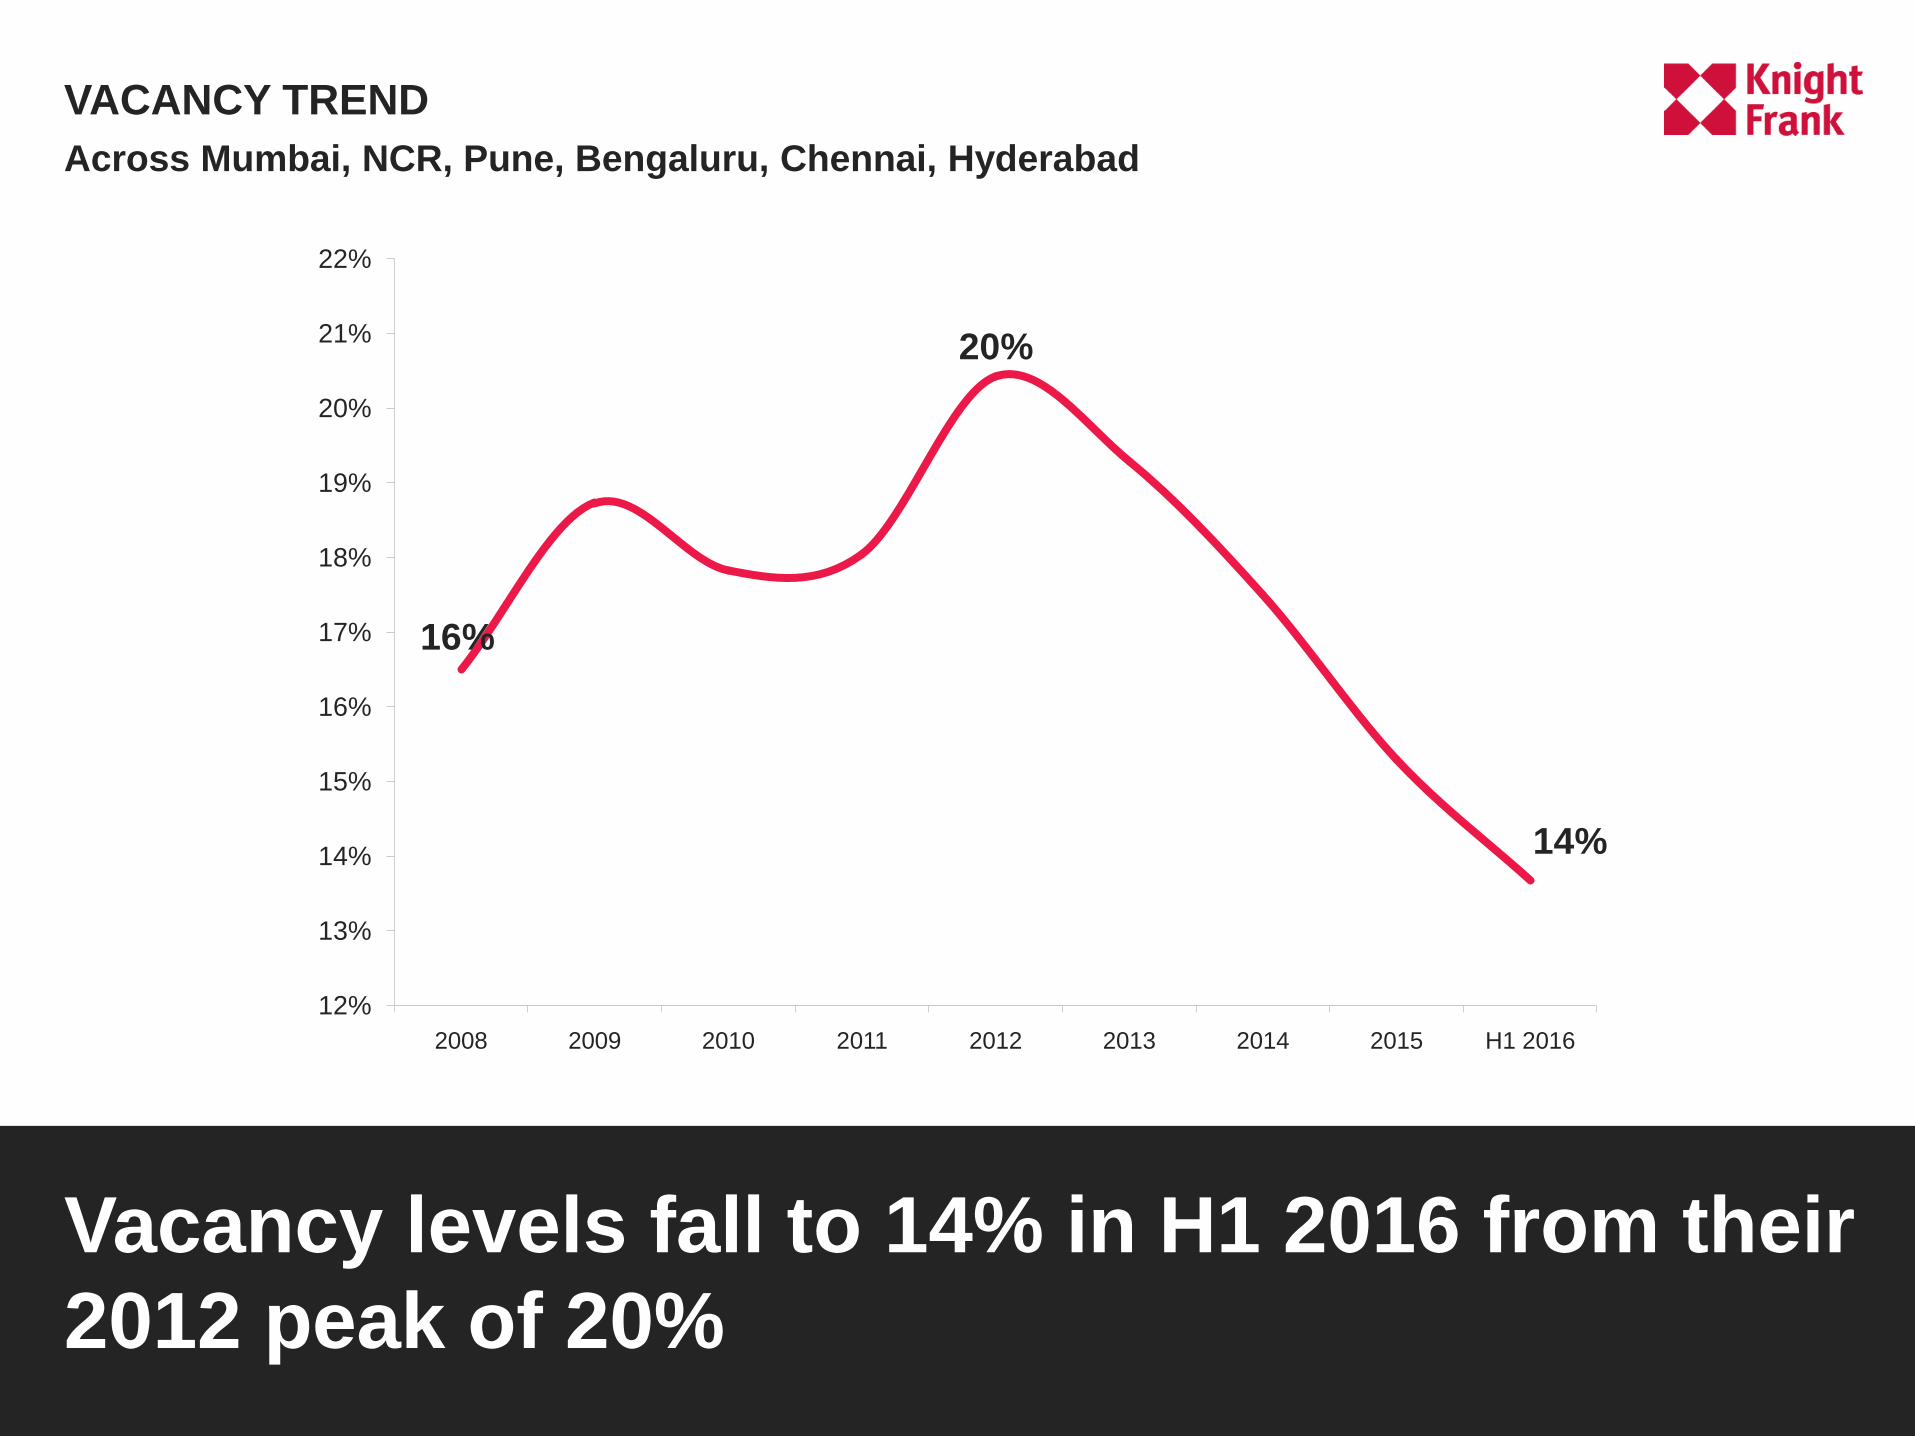
VACANCY TREND
Vacancy levels fall to 14% in H1 2016 from their
2012 peak of 20%
16%
20%
14%
12%
13%
14%
15%
16%
17%
18%
19%
20%
21%
22%
2008 2009 2010 2011 2012 2013 2014 2015 H1 2016
Across Mumbai, NCR, Pune, Bengaluru, Chennai, Hyderabad
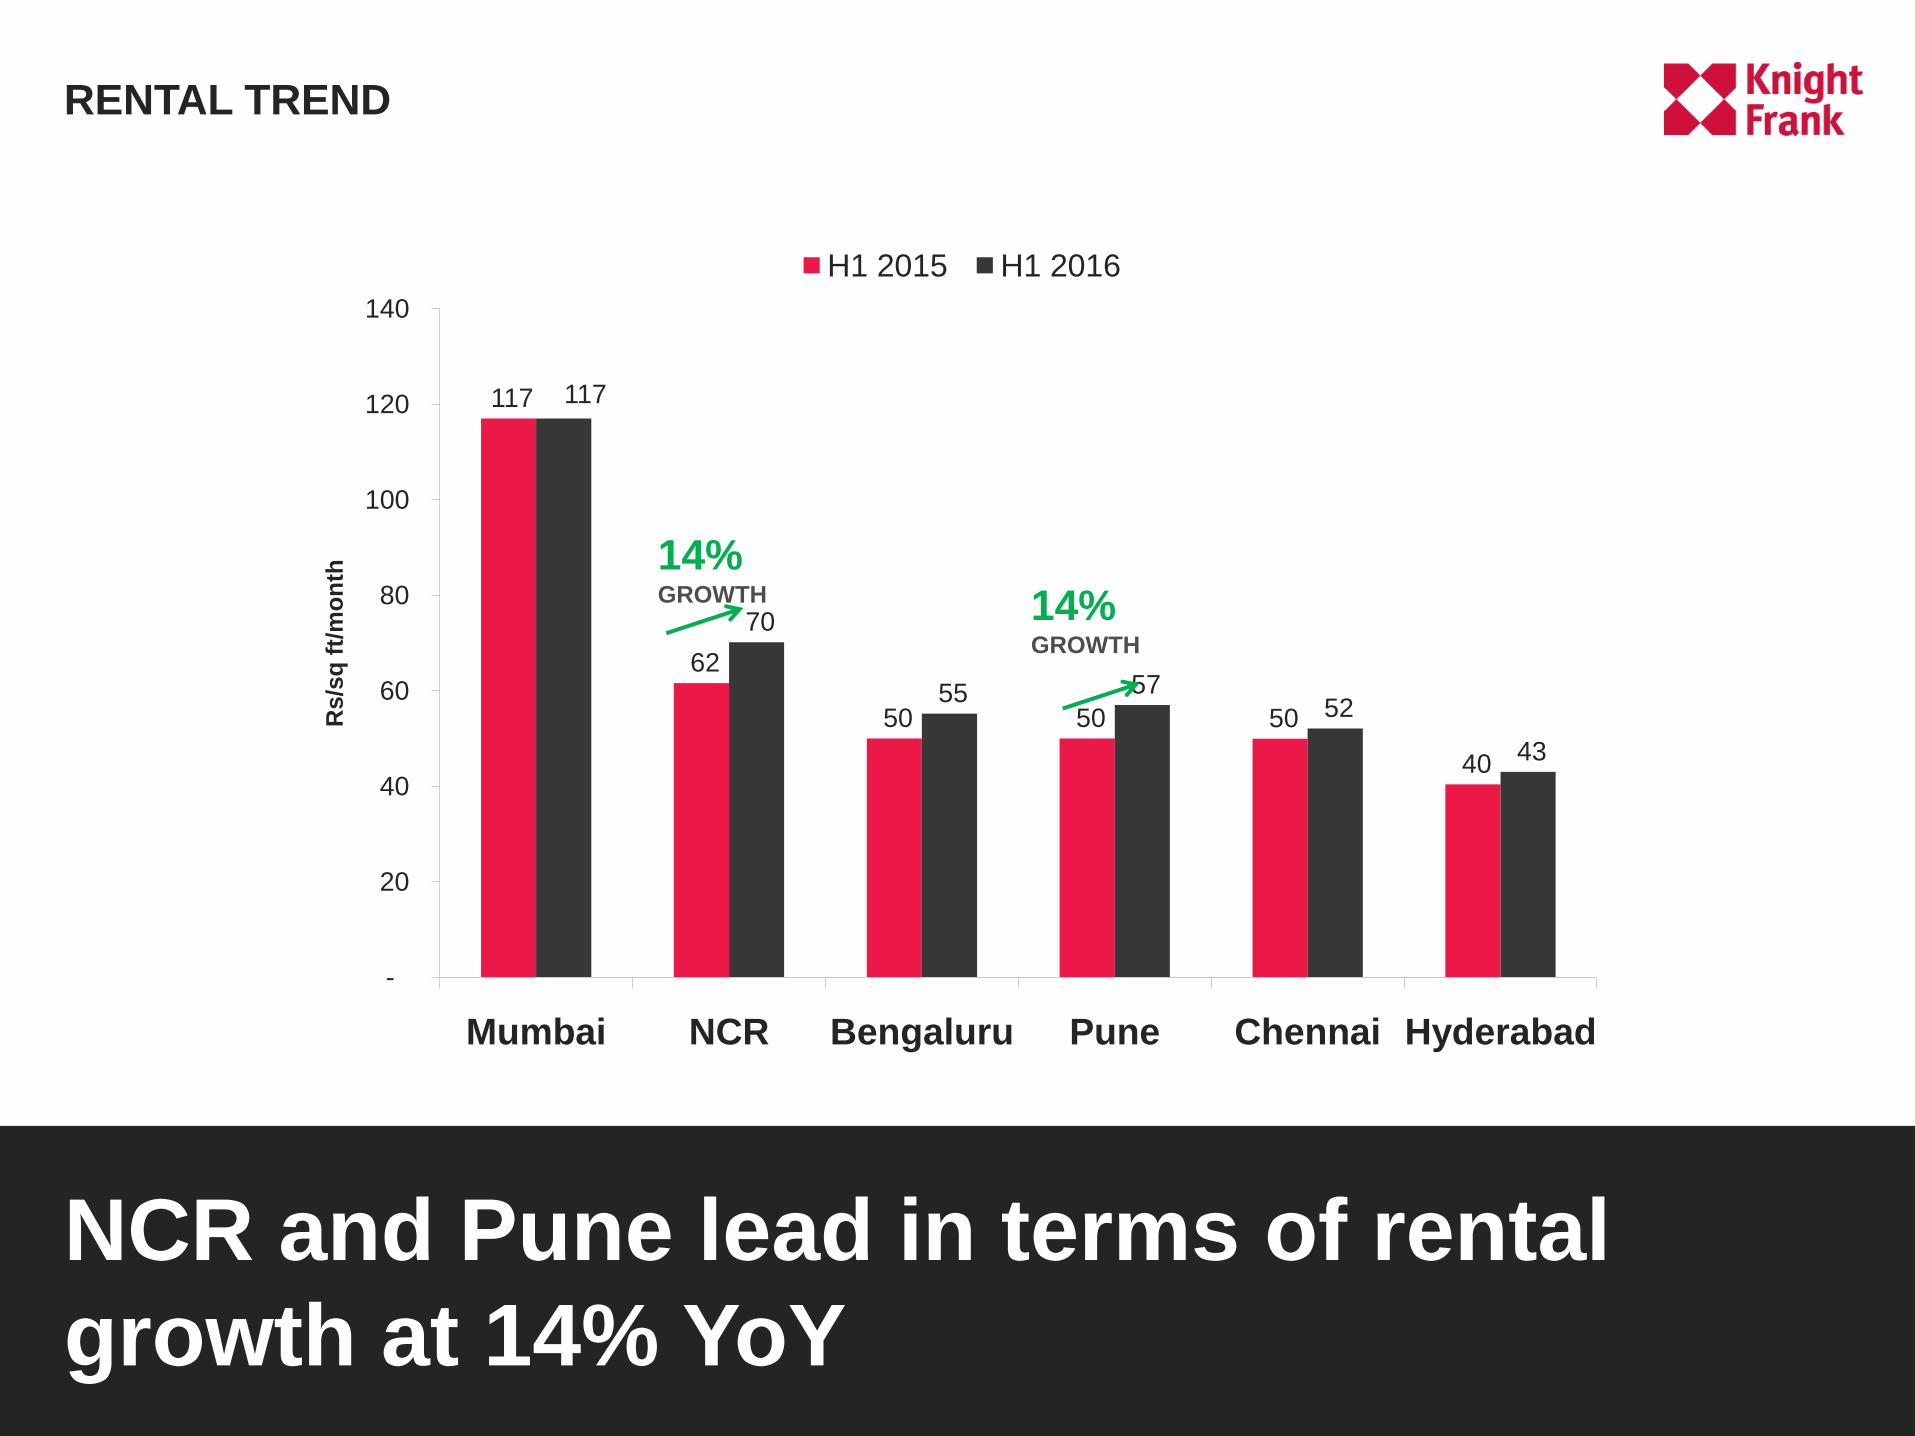
RENTAL TREND
NCR and Pune lead in terms of rental
growth at 14% YoY
117
62
50 50 50
40
117
70
55 57 52
43
-
20
40
60
80
100
120
140
Mumbai NCR Bengaluru Pune Chennai Hyderabad
Rs/s
q f
t/m
on
th
H1 2015 H1 2016
14% GROWTH
14% GROWTH
KEY TAKEWAYS
INCREASE IN
TRANSACTION
LED BY
HYDERABAD AND
MUMBAI
VACANCY LEVELS
REACH A RECORD
8-YEAR LOW -
PUNE AND
BENGALURU IN
SINGLE DIGIT
RENTALS IN
PUNE AND NCR
INCREASED BY
14%
E-COMMERCE
TRANSACTIONS
DECLINED BY
78%

INVESTOR PRO
P O W E R P O I N T P R E S E N T A T I O N T E M P L A T E
JANUARY TO JUNE 2016
RESIDENTIAL & OFFICE
Related Documents