Alaska Data Facts Report Early Childhood Physical Activity, Nutrition and Obesity Published 2019 ALASKA DIVISION OF Public Health P r e v e n t i o n P r o m o t i o n P r o t e c t i o n

Welcome message from author
This document is posted to help you gain knowledge. Please leave a comment to let me know what you think about it! Share it to your friends and learn new things together.
Transcript
Alaska
Data Facts ReportEarly Childhood Physical Activity, Nutrition and Obesity
Published 2019 ALASKA DIVISION OFPublic Health
Preve
ntion Promotion Protection
Alaska Early Childhood Physical Activity, Nutrition, and Obesity
Facts Report
Published December 2019
Michael J Dunleavy, Governor
Adam Crum, MSPH, Commissioner, Department of Health and Social Services
Anne Zink, MD, Chief Medical Officer, Department of Health and Social Services
Heidi Hedberg, Director, Division of Public Health
Tari O’Connor, MSW, Section Chief, Chronic Disease Prevention & Health Promotion
Suggested Citation:
Alaska Department of Health and Social Services. Alaska Early Childhood Physical Activity,
Nutrition and Obesity Facts Report. Anchorage, Alaska: Section of Chronic Disease
Prevention and Health Promotion, Division of Public Health. December 2019.
Copyright Information:
All material in this document is in the public domain and may be reproduced or copied
without permission; citation as to source, however, is appreciated.
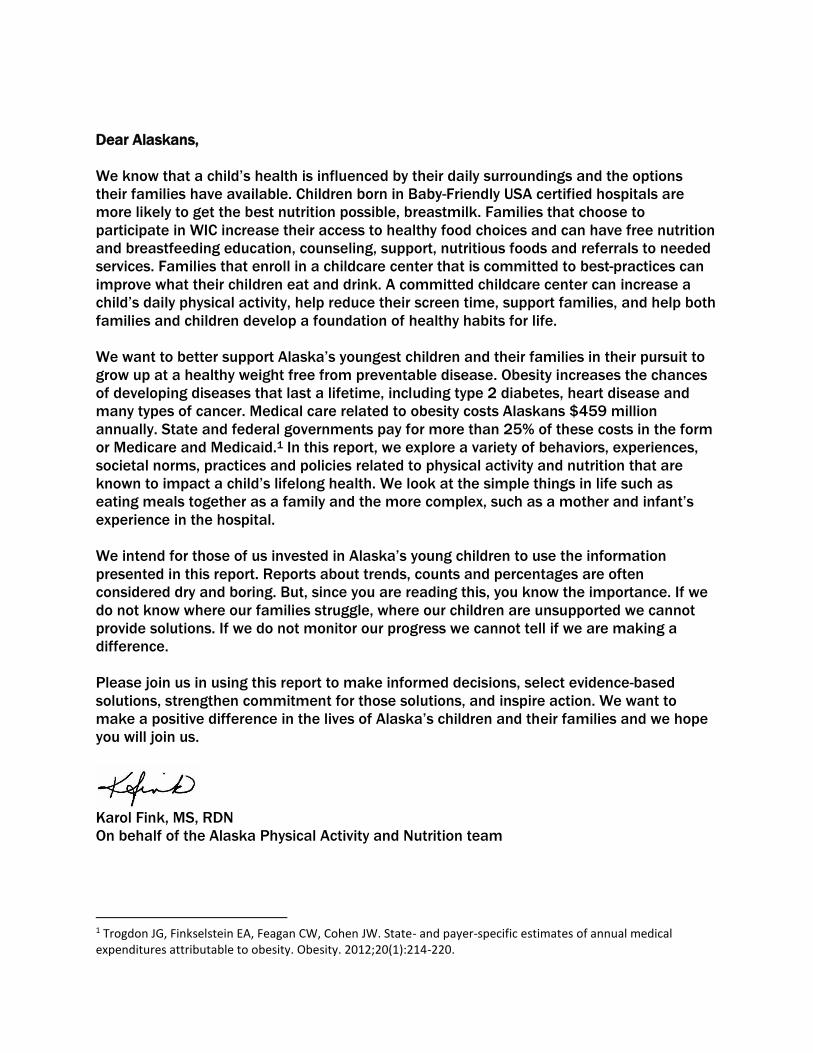
Dear Alaskans,
We know that a child’s health is influenced by their daily surroundings and the options
their families have available. Children born in Baby-Friendly USA certified hospitals are
more likely to get the best nutrition possible, breastmilk. Families that choose to
participate in WIC increase their access to healthy food choices and can have free nutrition
and breastfeeding education, counseling, support, nutritious foods and referrals to needed
services. Families that enroll in a childcare center that is committed to best-practices can
improve what their children eat and drink. A committed childcare center can increase a
child’s daily physical activity, help reduce their screen time, support families, and help both
families and children develop a foundation of healthy habits for life.
We want to better support Alaska’s youngest children and their families in their pursuit to
grow up at a healthy weight free from preventable disease. Obesity increases the chances
of developing diseases that last a lifetime, including type 2 diabetes, heart disease and
many types of cancer. Medical care related to obesity costs Alaskans $459 million
annually. State and federal governments pay for more than 25% of these costs in the form
or Medicare and Medicaid.1 In this report, we explore a variety of behaviors, experiences,
societal norms, practices and policies related to physical activity and nutrition that are
known to impact a child’s lifelong health. We look at the simple things in life such as
eating meals together as a family and the more complex, such as a mother and infant’s
experience in the hospital.
We intend for those of us invested in Alaska’s young children to use the information
presented in this report. Reports about trends, counts and percentages are often
considered dry and boring. But, since you are reading this, you know the importance. If we
do not know where our families struggle, where our children are unsupported we cannot
provide solutions. If we do not monitor our progress we cannot tell if we are making a
difference.
Please join us in using this report to make informed decisions, select evidence-based
solutions, strengthen commitment for those solutions, and inspire action. We want to
make a positive difference in the lives of Alaska’s children and their families and we hope
you will join us.
Karol Fink, MS, RDN
On behalf of the Alaska Physical Activity and Nutrition team
1 Trogdon JG, Finkselstein EA, Feagan CW, Cohen JW. State- and payer-specific estimates of annual medical expenditures attributable to obesity. Obesity. 2012;20(1):214-220.

Acknowledgements
The Alaska Early Childhood Physical Activity, Nutrition & Obesity Facts Report was
produced for the Physical Activity and Nutrition unit, Section of Chronic Disease Prevention
and Health Promotion, Division of Public Health, Alaska Department of Health and Social
Services in part by Program Design and Evaluation Services, Multnomah County Health
Department and Oregon Public Health Division.
Major contributors to the development of this report include:
Program Design and Evaluation Services
Erik Everson, MPH
Myde Boles, PhD
Physical Activity and Nutrition unit
Karol Fink, MS, RDN, Manager
Lauren Kelsey, MPH, Physical Activity & Nutrition Specialist
Diane Peck, MPH, RDN, Early Care and Education Program Coordinator
We would like to acknowledge the following individuals and organizations for their
contributions to this report:
Alaska Department of Health and Social Services
Division of Public Health
Section of Women’s, Children’s, and Family Health
Kathy Perham-Hester, MS, MPH, PRAMS Coordinator
Margaret B. Young, MPH, CUBS Coordinator
Sherrell Holtshouser, RN, MPH, Nurse Consultant II
Section of Chronic Disease Prevention and Health Promotion
Andrea Fenaughty, PhD, Deputy Section Chief
Dawn Groth, RN, BSN, MSEd, Physical Activity & Nutrition Specialist

Alaska Early Childhood Physical Activity, Nutrition and Obesity Facts Report Page i
Contents
I. Introduction .......................................................................................................................................... 1
Report Highlights .................................................................................................................................. 1
II. Early Care and Education in Alaska ................................................................................................... 2
Licensed Child Care Facilities ............................................................................................................. 3
Head Start and Early Head Start ........................................................................................................ 3
Pre-Elementary (or Pre-K) School Programs .................................................................................... 4
Tribally-Approved Child Care Providers ............................................................................................. 4
III. Nutrition Assistance Programs for ECEs and Families with Young Children .................................. 5
Child and Adult Care Food Program .................................................................................................. 5
Women, Infants and Children Program ............................................................................................ 5
Supplemental Nutrition Assistance Program .................................................................................. 5
IV. Weight status ....................................................................................................................................... 6
Classifying Weight Status ................................................................................................................... 6
Women, Infants, and Children (WIC) Participants ........................................................................... 7
Alaska 3-year-olds .............................................................................................................................. 13
Alaska Kindergarten Students ......................................................................................................... 19
Mothers of Young Children ................................................................................................................ 25
V. Breastfeeding .................................................................................................................................... 26
A. Initiation ............................................................................................................................................... 26
B. Duration and Exclusivity .................................................................................................................... 28
C. Mother’s Experiences ......................................................................................................................... 32
D. Healthcare Facilities and Providers .................................................................................................... 34
VI. Healthcare and Child Care ............................................................................................................... 35
A. Healthcare Access .............................................................................................................................. 35
Child Care Access ............................................................................................................................... 39
Healthcare Provider Advice ............................................................................................................... 41
VII. Nutrition & Screen Time Measures ................................................................................................. 45
100% Juice .......................................................................................................................................... 45
Milk ....................................................................................................................................................... 46
Water .................................................................................................................................................... 48
Sugary Drinks ...................................................................................................................................... 49
Food Security ....................................................................................................................................... 55

Alaska Early Childhood Physical Activity, Nutrition and Obesity Facts Report Page ii
Screen Time......................................................................................................................................... 56
VIII. Data Sources ..................................................................................................................................... 57
Pregnancy Risk Assessment Monitoring System (PRAMS) ................................................................. 57
Childhood Understanding Behaviors Survey (CUBS) ............................................................................. 58
Student Weight Status Surveillance System (SWSSS) ......................................................................... 59
Women, Infants and Children (WIC) Nutrition Program ....................................................................... 60
Maternity Practices in Infant Nutrition and Care (mPINC) Survey ...................................................... 60
National Immunization Surveys (NIS) ...................................................................................................... 61

Alaska Early Childhood Physical Activity, Nutrition and Obesity Facts Report Page iii
Table of Figures
Figure 1. High weight-for-length ratio, Alaska WIC 3-23 month olds, 2008-2014^ ........................... 7
Figure 2. High weight-for-length ratio, Alaska WIC 3-23 month olds, 2014 ........................................ 8
Figure 3. Overweight prevalence, Alaska WIC 2-4 year-olds, 2008-2014 ........................................... 9
Figure 4. Overweight prevalence, Alaska WIC 2-4 year-olds, 2014 .................................................... 10
Figure 5. Obesity prevalence, Alaska WIC 2-4 year-olds, 2008-2014 ................................................ 11
Figure 6. Obesity prevalence, Alaska WIC 2-4 year-olds, 2014 ........................................................... 12
Figure 7. Overweight/obesity prevalence among Alaska 3-year-olds, by age of mother^, 2012-
2017 ............................................................................................................................................. 13
Figure 8. Overweight/obesity prevalence among Alaska 3-year-olds, by maternal demographics,
2017 ............................................................................................................................................. 14
Figure 9. Overweight prevalence among Alaska 3-year-olds, by age of mother^, 2012-2017 ...... 15
Figure 10. Overweight prevalence among Alaska 3-year-olds, by maternal demographics, 2017 . 16
Figure 11. Obesity prevalence among Alaska 3-year-olds, by age of mother^, 2012-2017 ............. 17
Figure 12. Obesity prevalence among Alaska 3-year-olds, by maternal demographics, 2017 ........ 18
Figure 13. Overweight/obesity prevalence, Kindergarten students, Anchorage and Matanuska-
Susitna Borough School Districts combined, 2003-04 to 2017-18 school years ............ 19
Figure 14. Overweight/obesity prevalence, Kindergarten students, Anchorage and Matanuska-
Susitna Borough School Districts combined, 2016-17 and 2017-18 school years* ...... 20
Figure 15. Overweight prevalence, Kindergarten students, Anchorage and Matanuska-Susitna
Borough School Districts combined, 2003-04 to 2017-18 school years .......................... 21
Figure 16. Overweight prevalence, Kindergarten students, Anchorage and Matanuska-Susitna
Borough School Districts combined, 2016-17 and 2017-18 school years* ..................... 22
Figure 17. Obesity prevalence, Kindergarten students, Anchorage and Matanuska-Susitna Borough
School Districts combined, 2003-04 to 2017-18 school years .......................................... 23
Figure 18. Obesity prevalence, Kindergarten students, Anchorage and Matanuska-Susitna Borough
School Districts combined, 2016-17 and 2017-18 school years* ..................................... 24
Figure 19. Excess maternal weight gain by pre-pregnancy weight status, Alaska, 2017 ................. 25
Figure 20. Breastfeeding initiation by age of mother^, Alaska, 2012-2017 ....................................... 26
Figure 21. Breastfeeding initiation by maternal demographics, Alaska, 2017 .................................. 27
Figure 22. Exclusive breastfeeding at 4 weeks by maternal demographics, Alaska, 2017 ............. 28
Figure 23. Exclusive breastfeeding at 8 weeks by maternal demographics, Alaska, 2017 ............. 29
Figure 24. Breastfeeding duration and exclusivity, among U.S. and Alaska children born in 2016 30
Figure 25. Reasons mothers stopped breastfeeding, at time of survey, Alaska, 2015..................... 31
Figure 26. Sources that provided breastfeeding information, Alaska, 2017 ...................................... 32
Figure 27. Breastfeeding experiences at birthing hospital, Alaska, 2017 ........................................... 33
Figure 28. Ideal maternity practice response, Alaska hospitals, 2015 ................................................ 34
Figure 29. Health insurance coverage before, during, and after^ pregnancy, Alaska, 2017 ........... 35
Figure 30. Health insurance coverage in month before pregnancy, Alaska, 2017 ............................ 36
Figure 31. Health insurance coverage during pregnancy, Alaska, 2017 ............................................. 37
Figure 32. Health insurance coverage after pregnancy^, Alaska, 2017 .............................................. 38
Figure 33. Child care types regularly used, Alaska mothers of 3-year-olds, 2017 ............................. 39

Alaska Early Childhood Physical Activity, Nutrition and Obesity Facts Report Page iv
Figure 34. Reasons for not using preferred type of child care, Alaska mothers of 3-year-olds, 2017
....................................................................................................................................................... 40
Figure 35. Prior to pregnancy, discussed maintaining a healthy weight with health care worker,
Alaska, 2017 ............................................................................................................................... 41
Figure 36. During prenatal visit, discussed pregnancy weight gain with health care worker, Alaska,
2017 ............................................................................................................................................. 42
Figure 37. During postpartum checkup, discussed healthy eating, exercise, and losing weight
gained during pregnancy with health care worker, Alaska, 2017 ...................................... 43
Figure 38. During postpartum checkup, discussed how long to wait before next pregnancy with
health care worker, Alaska, 2017 ........................................................................................... 44
Figure 39. Daily 100% fruit juice consumption, Alaska 3-year-olds, 2017 .......................................... 45
Figure 40. Daily milk consumption, Alaska 3-year-olds, 2017 .............................................................. 46
Figure 41. Type of milk typically drank, Alaska 3-year-olds, 2017........................................................ 47
Figure 42. Daily water consumption, Alaska 3-year-olds, 2017 ............................................................ 48
Figure 43. Daily soda consumption, Alaska 3-year-olds, 2017 ............................................................. 49
Figure 44. Daily sweetened or fruit drink consumption, Alaska 3-year-olds, 2017 ............................ 50
Figure 45. Any daily sugary drink consumption, Alaska 3-year-olds, by maternal demographics,
2017 ............................................................................................................................................. 51
Figure 46. Any daily sugary drink consumption, Alaska 3-year-olds, by region, 2015-2017 ............ 52
Figure 47. Daily diet drink consumption, Alaska 3-year-olds, 2017 ..................................................... 53
Figure 48. Average days per week parent or household member eats meal with child, Alaska 3-
year-olds, 2017 ........................................................................................................................... 54
Figure 49. Use of food assistance services in past 3 months, Alaska mothers of 3-year-olds, 2017
....................................................................................................................................................... 55
Figure 50. Daily time spent in front of a screen, Alaska 3-year-olds, 2017 ......................................... 56

Alaska Early Childhood Physical Activity, Nutrition and Obesity Facts Report Page 1
I. Introduction Report Highlights
Overweight and obesity:
More than one in three (35%) Alaska 3-year-olds are overweight or obese, which
increases their chance of developing weight-related chronic diseases.
Overweight/obesity prevalence among Alaska 3-year-olds did not change between
2008 and 2014.
Overweight/obesity prevalence among 3-year-old children is significantly lower
among children of White mothers than of Alaska Native mothers, and lower in
higher socioeconomic status (SES) families compared to low-SES families.
Breastfeeding:
93% of Alaska mothers initiate breastfeeding of their babies and initiation rates did
not change significantly between 2012 and 2017.
42% of Alaska babies are breastfed exclusively through 6 months.
Half (51%) are fed breastmilk up to 12 months.
Among Alaska mothers who had ceased breastfeeding before 8 weeks, almost 20%
stated it was because they went back to work or school.
In 2018, 3.4% of Alaska births occurred at Baby-Friendly USA certified hospitals. By
2020, we estimate 19% of births in Alaska will occur at a certified hospital.
Child care:
One of every five (21%) Alaska 3-year-olds is cared for regularly at a child care
center, preschool, or Head Start program.
41% of Alaska mothers of 3-year-olds use some type of child care arrangement on a
regular basis.
Cost is a prohibitive factor for two-thirds (67%) of mothers of 3-year-olds who are
not using their preferred type of child care.
Beverages and screen time
28% of Alaska 3-year-old children drink a sugary drink every day.
Alaska 3-year-old children in:
o low SES families were more likely to consume sugary drinks than those in
higher SES families, 39% vs 21%.
o the Northern and Southwest regions were significantly more likely than
children in other regions to consume sugary drinks.
Children of Alaska Native mothers are significantly more likely than children of
White mothers to consume a sugary drink on a typical day, 57% vs 17%.
77% of Alaska 3-year-olds have an hour or more of screen time (watching television,
movies, or video games) on a typical day.
Only 13% of Alaska 3-year-olds typically drink fat-free (skim or nonfat) and low-fat
(1%) milk as recommended by the US Dietary Guidelines.

Alaska Early Childhood Physical Activity, Nutrition and Obesity Facts Report Page 2
II. Early Care and Education in Alaska
Early care and education (ECE) and quality child care positively impact children, families,
and communities. ECE can improve children’s development and act as a protective factor
against the future onset of adult disease and disability.2 The ECE sector in Alaska is
comprised of a wide variety of programs and providers that includes licensed child care
centers, family child care homes and child care group homes; Head Start and Early Head
Start programs; public and private pre-elementary school programs; military child care
providers; tribally-approved child care providers; and an unknown number of
unregulated/non-licensed providers.
ECE programs that serve low-income and at-risk children can counteract the disadvantage
some children experience and provide them with an equal opportunity to achieve school
readiness, and lifelong employment, income, and health. Participation in Head Start has
been associated with reductions in body mass index (BMI) and obesity.3
ECE center policies may directly impact what children consume and how active they are, as
well as help them develop a foundation of healthy habits for life. ECE programs can
implement national standards and best practices to improve what children eat and drink,
increase their physical activity, reduce their screen time, and support families who
breastfeed.4
In Alaska, there are an estimated 39,000 children under six years of age potentially in
need of child care (children in two-parent families, both parents in labor force and children
in single-parent families, parent in the labor force).5 A survey conducted in 2015 of Alaska
households with children under 13 years of age showed that 55% of children under six
years of age typically received care by someone other than a parent or guardian at some
time during the month preceding the survey.6 Among children under six years of age who
received care the month prior to the survey:
41% were in pre-elementary school or licensed center-based care
34% received care at someone else’s home
2 CDC. Office of the Associate Director for Policy and Strategy. Hi-5: Early Childhood Education. https://www.cdc.gov/policy/hst/hi5/earlychildhoodeducation/index.html. Accessed 3/5/2019 3 Lumeng JC, Kaciroti N, Sturza J, et al. Changes in body mass index associated with Head Start participation. Pediatrics 2015;135(2): e449-e456. 4 American Academy of Pediatrics, American Public Health Association, National Resource Center for Health and Safety in Child Care and Early Education. Caring for Our Children: National Health and Safety Performance Standards: Guidelines for Early Care and Education Programs. 4rd Ed. Elk Grove Village, IL: American Academy of Pediatrics. 2019. Available: http://cfoc.nrckids.org/CFOC. 5 Child Care Aware of America. 2018 State Child Care Facts in the State of: Alaska. 2019. http://usa.childcareaware.org/advocacy-public-policy/resources/research/statefactsheets/. 6 McDowell Group. Economic Impact of Early Care and Learning in Alaska. Prepared for the Alaska Early Childhood Coordinating Council. October 2015.
Alaska Early Childhood Physical Activity, Nutrition and Obesity Facts Report Page 3
30% received care in the child’s home
8% were in Early Head Start/Head Start programs
4% received various other forms of care (some children received care from more
than one type of provider)
Licensed Child Care Facilities
Licensed child care facilities within the Municipality of Anchorage (MOA) are regulated by
the Anchorage Health Department. All other licensed child care facilities in the state are
regulated by the State of Alaska Department of Health and Social Services, Child Care
Program Office (CCPO).
Licensed child care facilities in Alaska and the MOA include7:
221 Child Care Centers
260 Family Child Care Homes
76 Child Care Group Homes (Includes foster group homes [no more than 8 children
in care] and residential group homes [no more than 12 children in care])8
The total capacity for these licensed facilities in Alaska is 17,307 children.8
In Alaska there are 14 centers that are not licensed, but are approved by CCPO or
monitored to ensure they meet or exceed state licensing regulations. These include
Department of Defense, Coast Guard, and Tribally Approved or Certified sites.
Head Start and Early Head Start
Head Start (ages 3-5) and Early Head Start (birth-3 years) are federally-funded programs
specifically serving low-income and at-risk children. Head Start programs are typically
center-based, while Early Head Start can be provided in a center or through home visits.
Most Head Start programs in Alaska are not licensed, but grantees receive funding from
the Alaska Department of Education and Early Development (EED) to support quality
activities in Head Start programs.
17 grantees operate 107 Head Start programs9, reaching 2,501 children8
9 grantees operate 21 Early Head Start program, reaching 498 children10 (Some
grantees have both Head Start and Early Head Start programs.)
7 US Department of Health and Human Services, Administration for Children & Families, Early Childhood Training and Technical Assistance System. State/Territory Profile – Alaska. https://childcareta.acf.hhs.gov/state-profiles/profiles/AK. Accessed 6/18/19. 8 Alaska State Legislature (2019-2020). Alaska Admin Code 7 AAC 50.990. Definitions. http://www.akleg.gov/basis/aac.asp#7.50.990. Access 6/21.19. 9 Alaska Head Start Association. https://www.akheadstart.org/. Accessed 1/10/19
Alaska Early Childhood Physical Activity, Nutrition and Obesity Facts Report Page 4
Pre-Elementary (or Pre-K) School Programs
School districts and Head Start agencies can receive approval from the Alaska Department
of Education and Early Development (EED) Early Learning Program to operate pre-
elementary programs for children ages 3-5. These programs are exempt from licensing,
but may become licensed to access federal Child Care Development Funds (CCDF).
11 school districts have Pre-K programs in 295 schools/sites (2017/18 school
year)10
All Head Starts have to apply for EED Pre-K approval (which is why they are exempt
from licensing)11
Tribally-Approved Child Care Providers
Child care sites and family child care providers may be tribally-approved, but not state
approved or licensed. These providers can receive federal Child Care Development Block
Grant (CCDBG) Tribal Allocations to run their programs.
30 grantees distribute CCDBG funds to an unknown number of providers in 2018.12
In 2006, there were close to 280 tribally-approved child care providers.2 (More
recent data are not available.)
10 Alaska Department of Education and Early Development. Count of Alaska’s Public Schools by Grade Configuration, 2017-1018 School Year. https://education.alaska.gov/data-center# Accessed 6/18/19. 11 Personal communication with Supanika Ackerman, Alaska EED Early Learning Program. 1/10/19. 12 Personal communication with Staci Collier, Alaska DHSS Child Care Program Office. 1/11/19.
Alaska Early Childhood Physical Activity, Nutrition and Obesity Facts Report Page 5
III. Nutrition Assistance Programs for ECEs and Families with Young
Children
Child and Adult Care Food Program
The Child and Adult Care Food Program (CACFP) is a federally-funded, state-administered
program that provides healthy meals and snacks to children and adults receiving day care.
It plays a vital role in improving the quality of day care and making healthy meals more
affordable for low-income families.
In Alaska, participating sites include:
219 Child Care Centers (includes Head Start Programs)
230 Family Child Care Homes8
Women, Infants and Children Program
The Women, Infants and Children Program (WIC) is a federally-funded, state-administered
public health program providing nutrition and breastfeeding education, counseling,
support, nutritious foods, and referrals to needed services. WIC serves low-income and at-
risk babies and children up to age five, pregnant women, and new mothers.
In Alaska:
43.5% of income-eligible women, infants, and children participated in WIC in 2016
o 56.8% of eligible infants participated
o 56.7% of eligible children age 1 participated
o 38.5% of eligible children age 2 participated
o 36.1% of eligible children age 3 participated
o 27.7% of eligible children age 4 participated13
Supplemental Nutrition Assistance Program
The Supplemental Nutrition Assistance Program (SNAP) is a federally-funded, state-
administered program that provides food benefits to supplement the budget of low-income
families.
In Alaska, there are (data from 2018, unduplicated count):
• 14,228 SNAP households with children age 5 years or younger
• 21,102 children age 5 years or younger that received SNAP benefits14
13 US Department of Agriculture, Food and Nutrition Service. National and State Level Estimates of WIC Eligibility and WIC Program Reach in 2016. https://www.fns.usda.gov/wic/national-and-state-level-estimates-wic-eligibility-and-wic-program-reach-2016. Accessed 1/22/19. 14 Personal communication with Ginger Shoemaker, DHSS Division of Public Assistance. 1/17/19.
Alaska Early Childhood Physical Activity, Nutrition and Obesity Facts Report Page 6
IV. Weight status
Classifying Weight Status
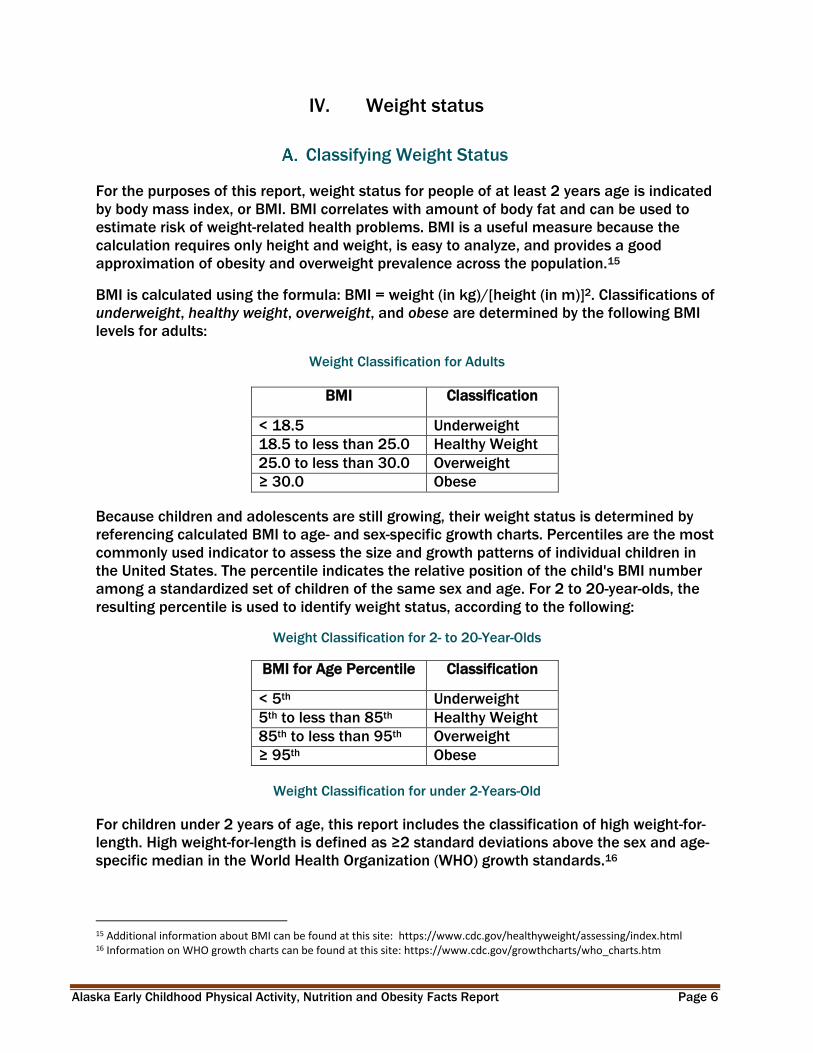
For the purposes of this report, weight status for people of at least 2 years age is indicated
by body mass index, or BMI. BMI correlates with amount of body fat and can be used to
estimate risk of weight-related health problems. BMI is a useful measure because the
calculation requires only height and weight, is easy to analyze, and provides a good
approximation of obesity and overweight prevalence across the population.15
BMI is calculated using the formula: BMI = weight (in kg)/[height (in m)]2. Classifications of
underweight, healthy weight, overweight, and obese are determined by the following BMI
levels for adults:
Weight Classification for Adults
BMI Classification
< 18.5 Underweight
18.5 to less than 25.0 Healthy Weight
25.0 to less than 30.0 Overweight
≥ 30.0 Obese
Because children and adolescents are still growing, their weight status is determined by
referencing calculated BMI to age- and sex-specific growth charts. Percentiles are the most
commonly used indicator to assess the size and growth patterns of individual children in
the United States. The percentile indicates the relative position of the child's BMI number
among a standardized set of children of the same sex and age. For 2 to 20-year-olds, the
resulting percentile is used to identify weight status, according to the following:
Weight Classification for 2- to 20-Year-Olds
BMI for Age Percentile Classification
< 5th Underweight
5th to less than 85th Healthy Weight
85th to less than 95th Overweight
≥ 95th Obese
Weight Classification for under 2-Years-Old
For children under 2 years of age, this report includes the classification of high weight-for-
length. High weight-for-length is defined as ≥2 standard deviations above the sex and age-
specific median in the World Health Organization (WHO) growth standards.16
15 Additional information about BMI can be found at this site: https://www.cdc.gov/healthyweight/assessing/index.html 16 Information on WHO growth charts can be found at this site: https://www.cdc.gov/growthcharts/who_charts.htm

Alaska Early Childhood Physical Activity, Nutrition and Obesity Facts Report Page 7
Women, Infants, and Children (WIC) Participants
Figure 1. High weight-for-length ratio, Alaska WIC 3-23 month olds, 2008-2014^
Source: Women, Infants, and Children (WIC) Participant and Program Characteristics
^At the time of this publication, 2014 was the most current state-specific WIC PPC results available.
The percentage of Alaska WIC-enrolled children age 3-23 months with a high weight-for-
length decreased between 2008 and 2014 from 19% to 14%. The percent children with a
high weight-for length in 2014 is significantly less than in 2008.
Among WIC 3-23 month olds, boys have consistently had a higher prevalence of high
weight-for-length than girls.
WIC-enrolled children are not necessarily representative of Alaska’s overall 3-23 month-old
population.
Alaska Early Childhood Physical Activity, Nutrition and Obesity Facts Report Page 8
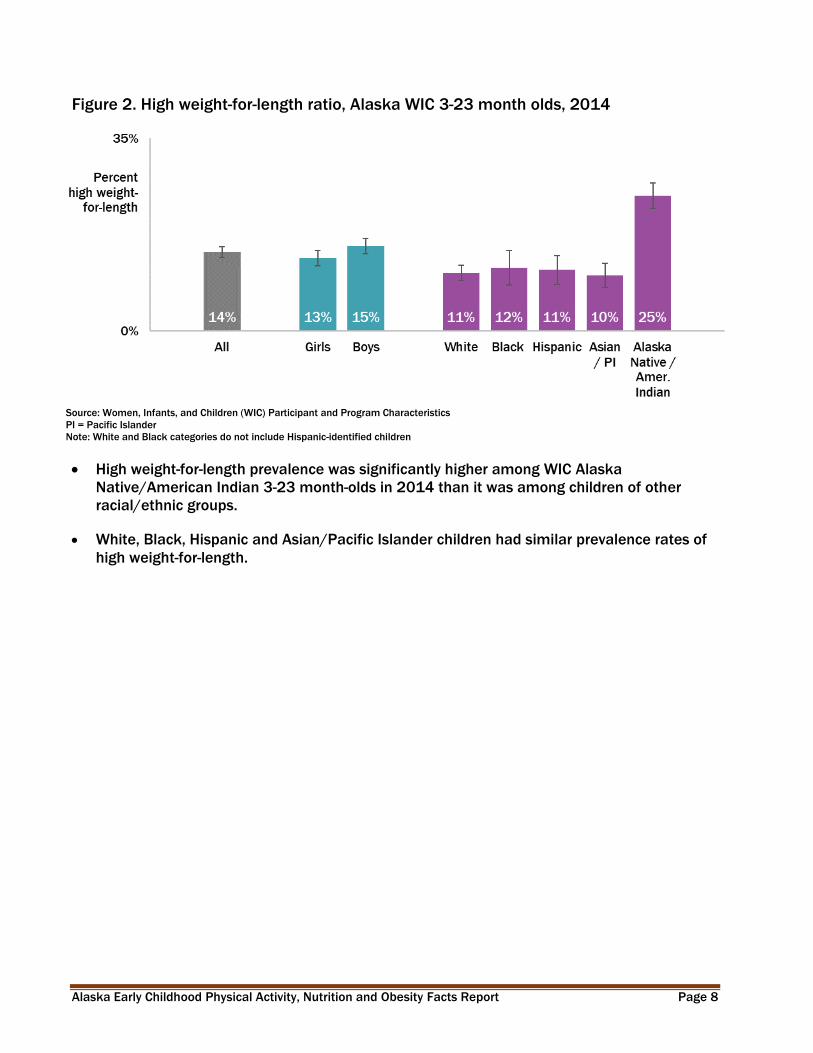
Figure 2. High weight-for-length ratio, Alaska WIC 3-23 month olds, 2014
Source: Women, Infants, and Children (WIC) Participant and Program Characteristics
PI = Pacific Islander
Note: White and Black categories do not include Hispanic-identified children
High weight-for-length prevalence was significantly higher among WIC Alaska
Native/American Indian 3-23 month-olds in 2014 than it was among children of other
racial/ethnic groups.
White, Black, Hispanic and Asian/Pacific Islander children had similar prevalence rates of
high weight-for-length.
Alaska Early Childhood Physical Activity, Nutrition and Obesity Facts Report Page 9
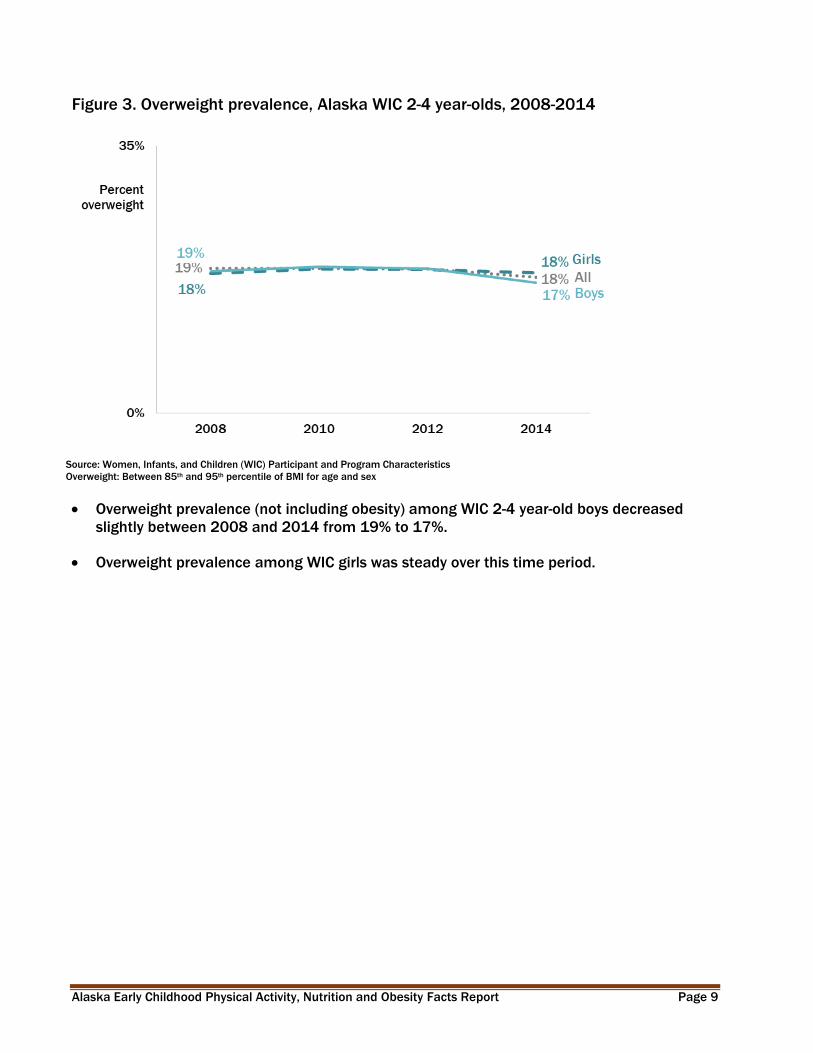
Figure 3. Overweight prevalence, Alaska WIC 2-4 year-olds, 2008-2014
Source: Women, Infants, and Children (WIC) Participant and Program Characteristics
Overweight: Between 85th and 95th percentile of BMI for age and sex
Overweight prevalence (not including obesity) among WIC 2-4 year-old boys decreased
slightly between 2008 and 2014 from 19% to 17%.
Overweight prevalence among WIC girls was steady over this time period.
Alaska Early Childhood Physical Activity, Nutrition and Obesity Facts Report Page 10
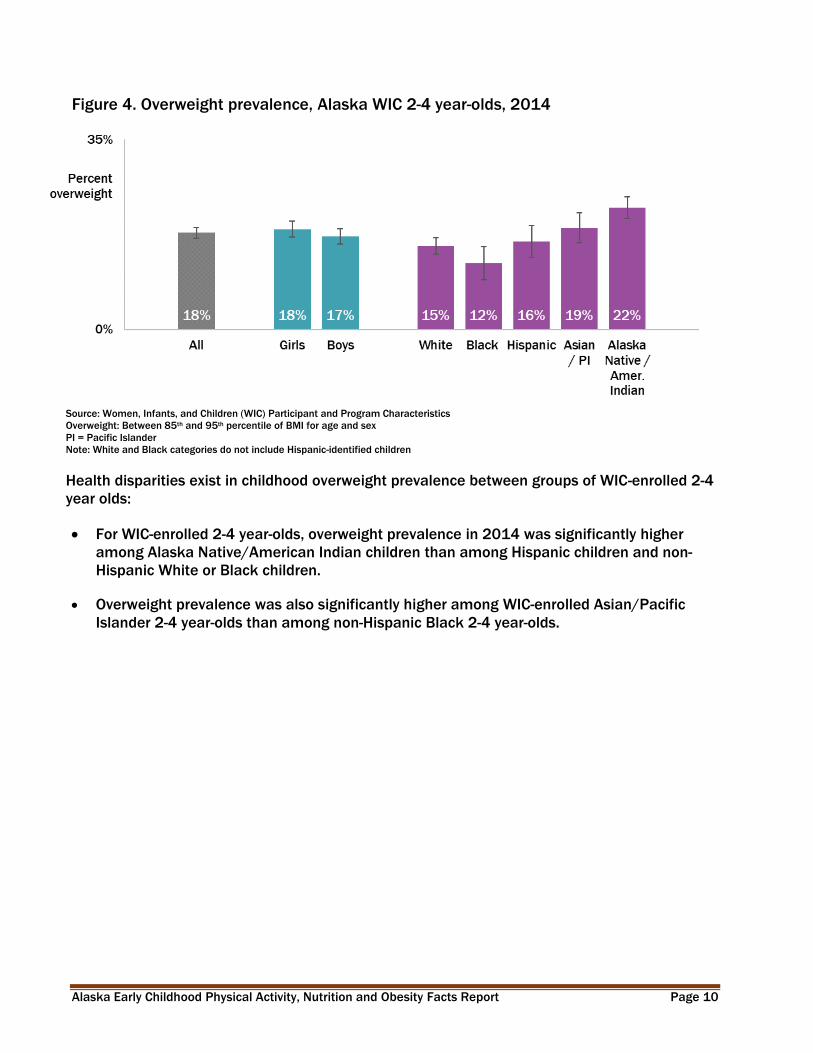
Figure 4. Overweight prevalence, Alaska WIC 2-4 year-olds, 2014
Source: Women, Infants, and Children (WIC) Participant and Program Characteristics
Overweight: Between 85th and 95th percentile of BMI for age and sex
PI = Pacific Islander
Note: White and Black categories do not include Hispanic-identified children
Health disparities exist in childhood overweight prevalence between groups of WIC-enrolled 2-4
year olds:
For WIC-enrolled 2-4 year-olds, overweight prevalence in 2014 was significantly higher
among Alaska Native/American Indian children than among Hispanic children and non-
Hispanic White or Black children.
Overweight prevalence was also significantly higher among WIC-enrolled Asian/Pacific
Islander 2-4 year-olds than among non-Hispanic Black 2-4 year-olds.
Alaska Early Childhood Physical Activity, Nutrition and Obesity Facts Report Page 11
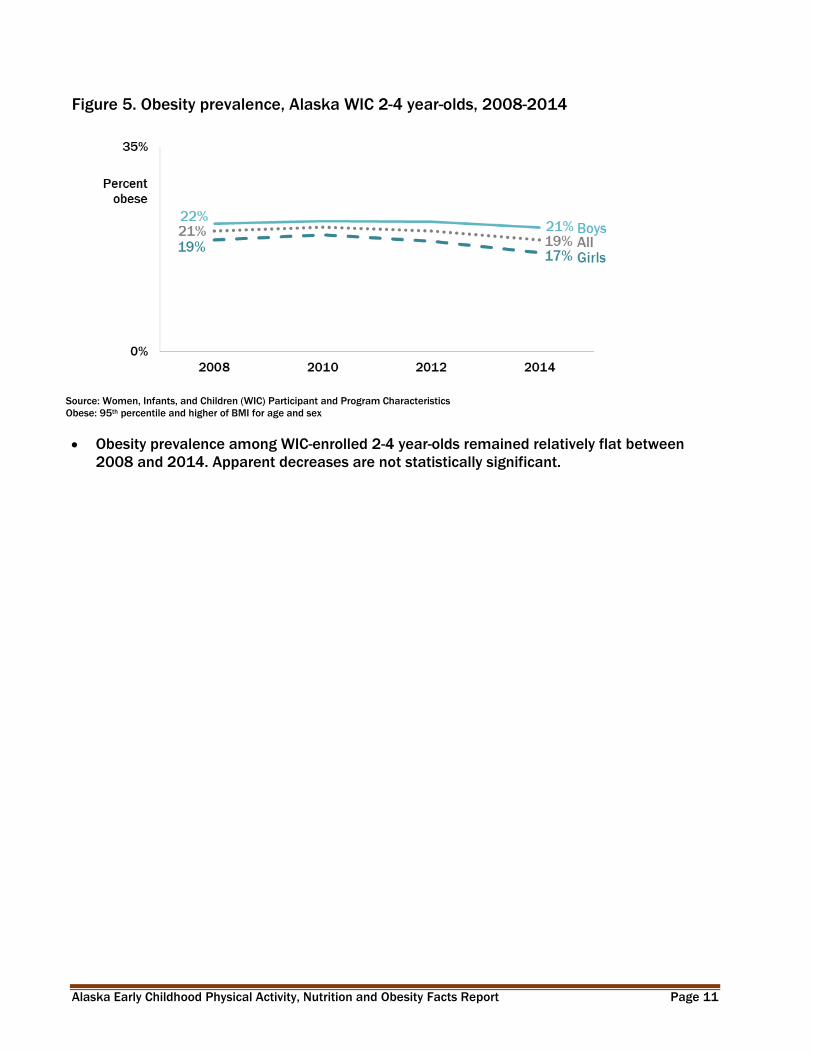
Figure 5. Obesity prevalence, Alaska WIC 2-4 year-olds, 2008-2014
Source: Women, Infants, and Children (WIC) Participant and Program Characteristics
Obese: 95th percentile and higher of BMI for age and sex
Obesity prevalence among WIC-enrolled 2-4 year-olds remained relatively flat between
2008 and 2014. Apparent decreases are not statistically significant.

Alaska Early Childhood Physical Activity, Nutrition and Obesity Facts Report Page 12
Figure 6. Obesity prevalence, Alaska WIC 2-4 year-olds, 2014
Source: Women, Infants, and Children (WIC) Participant and Program Characteristics
Obese: 95th percentile and higher of BMI for age and sex
PI = Pacific Islander
Note: White and Black categories do not include Hispanic-identified children
Health disparities exist in childhood obesity between groups of WIC-enrolled 2-4 year olds:
Obesity prevalence was significantly higher among WIC-enrolled 2-4 year-old boys than
among girls in 2014.
Alaska Native/American Indian and Asian/Pacific Islander 2-4 year-olds each experienced
significantly higher rates of obesity than did children of other race/ethnicity groups.
Obesity prevalence was significantly lower among non-Hispanic Whites than among 2-4
year-olds of all other race/ethnicity groups.

Alaska Early Childhood Physical Activity, Nutrition and Obesity Facts Report Page 13
Alaska 3-year-olds
Figure 7. Overweight/obesity prevalence among Alaska 3-year-olds, by age of mother^,
2012-2017
Source: Alaska Childhood Understanding Behaviors Survey (CUBS)
Overweight/obesity: 85th percentile and higher of BMI for age and sex
^Age of mother at the time the child was born
Overweight/obesity prevalence among Alaska 3 year-olds remained relatively flat between
2012 and 2017. Apparent decreases are not statistically significant.
Alaska Early Childhood Physical Activity, Nutrition and Obesity Facts Report Page 14
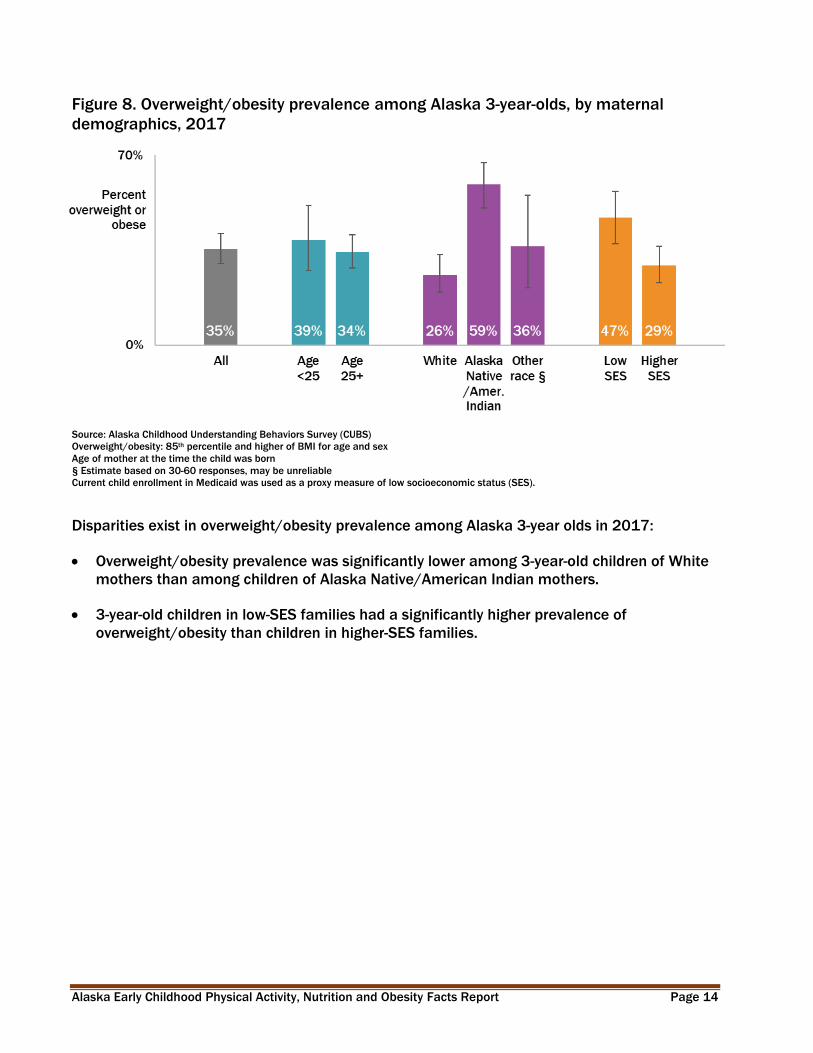
Figure 8. Overweight/obesity prevalence among Alaska 3-year-olds, by maternal
demographics, 2017
Source: Alaska Childhood Understanding Behaviors Survey (CUBS)
Overweight/obesity: 85th percentile and higher of BMI for age and sex
Age of mother at the time the child was born
§ Estimate based on 30-60 responses, may be unreliable
Current child enrollment in Medicaid was used as a proxy measure of low socioeconomic status (SES).
Disparities exist in overweight/obesity prevalence among Alaska 3-year olds in 2017:
Overweight/obesity prevalence was significantly lower among 3-year-old children of White
mothers than among children of Alaska Native/American Indian mothers.
3-year-old children in low-SES families had a significantly higher prevalence of
overweight/obesity than children in higher-SES families.
Alaska Early Childhood Physical Activity, Nutrition and Obesity Facts Report Page 15
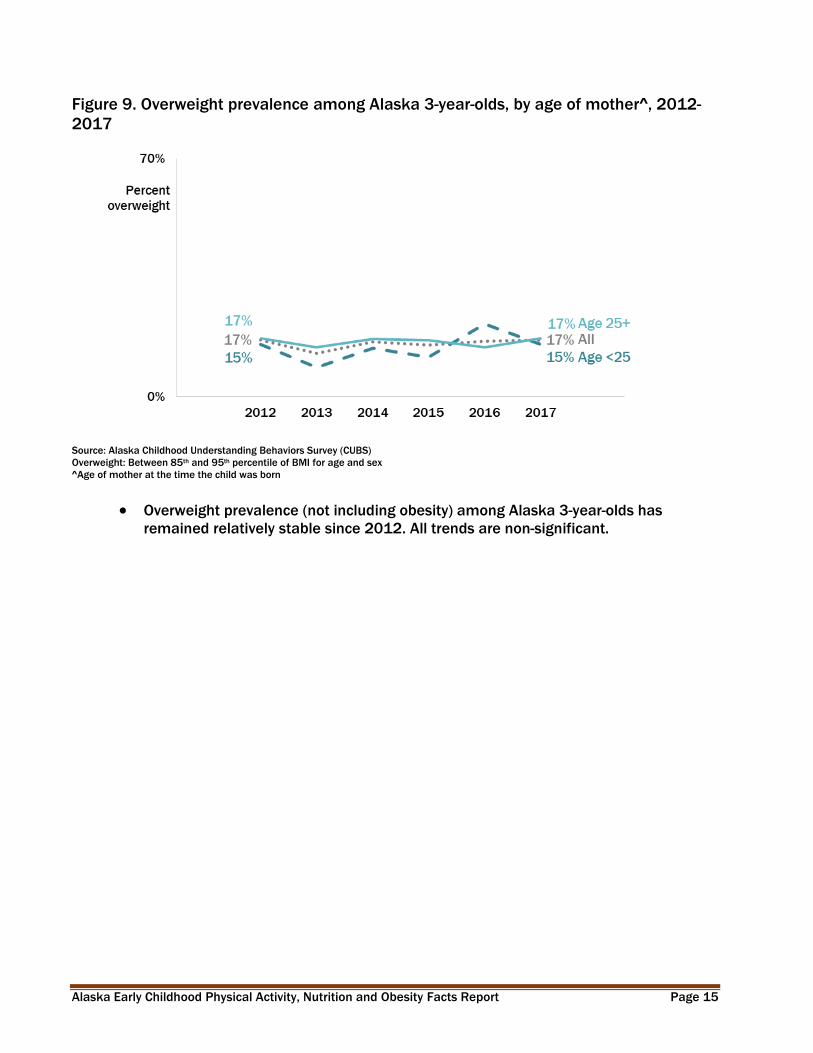
Figure 9. Overweight prevalence among Alaska 3-year-olds, by age of mother^, 2012-
2017
Source: Alaska Childhood Understanding Behaviors Survey (CUBS)
Overweight: Between 85th and 95th percentile of BMI for age and sex
^Age of mother at the time the child was born
Overweight prevalence (not including obesity) among Alaska 3-year-olds has
remained relatively stable since 2012. All trends are non-significant.
Alaska Early Childhood Physical Activity, Nutrition and Obesity Facts Report Page 16
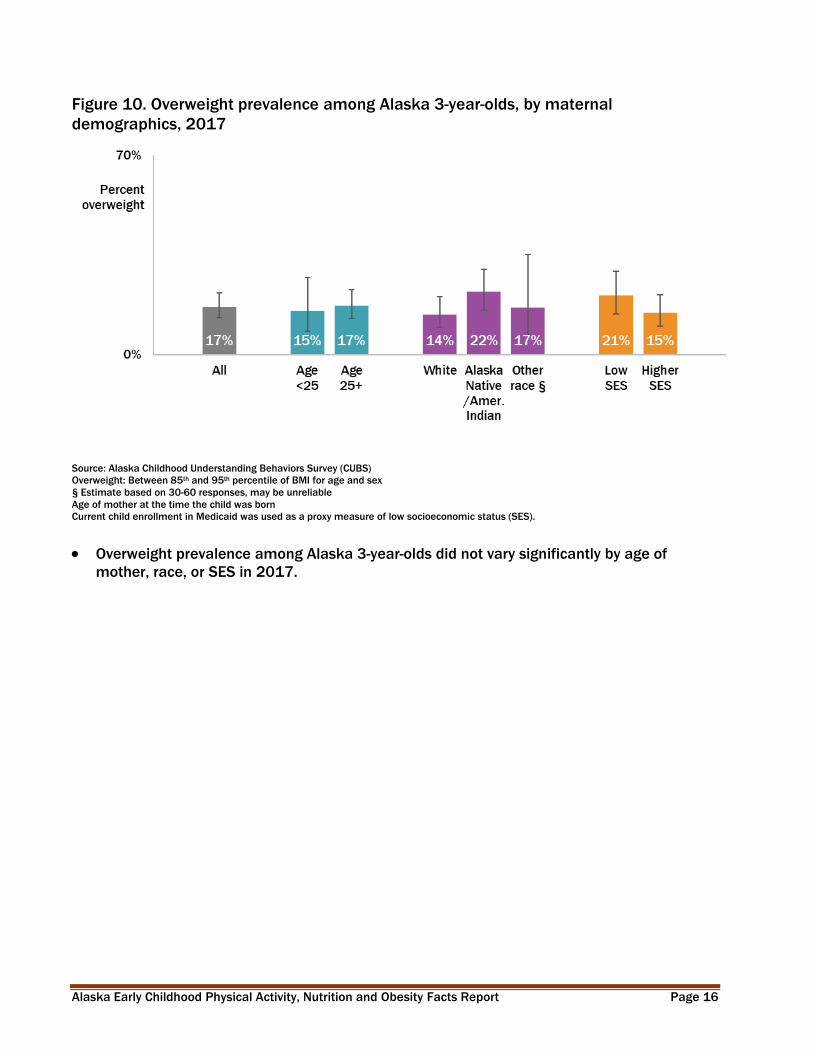
Figure 10. Overweight prevalence among Alaska 3-year-olds, by maternal
demographics, 2017
Source: Alaska Childhood Understanding Behaviors Survey (CUBS)
Overweight: Between 85th and 95th percentile of BMI for age and sex
§ Estimate based on 30-60 responses, may be unreliable
Age of mother at the time the child was born
Current child enrollment in Medicaid was used as a proxy measure of low socioeconomic status (SES).
Overweight prevalence among Alaska 3-year-olds did not vary significantly by age of
mother, race, or SES in 2017.
Alaska Early Childhood Physical Activity, Nutrition and Obesity Facts Report Page 17
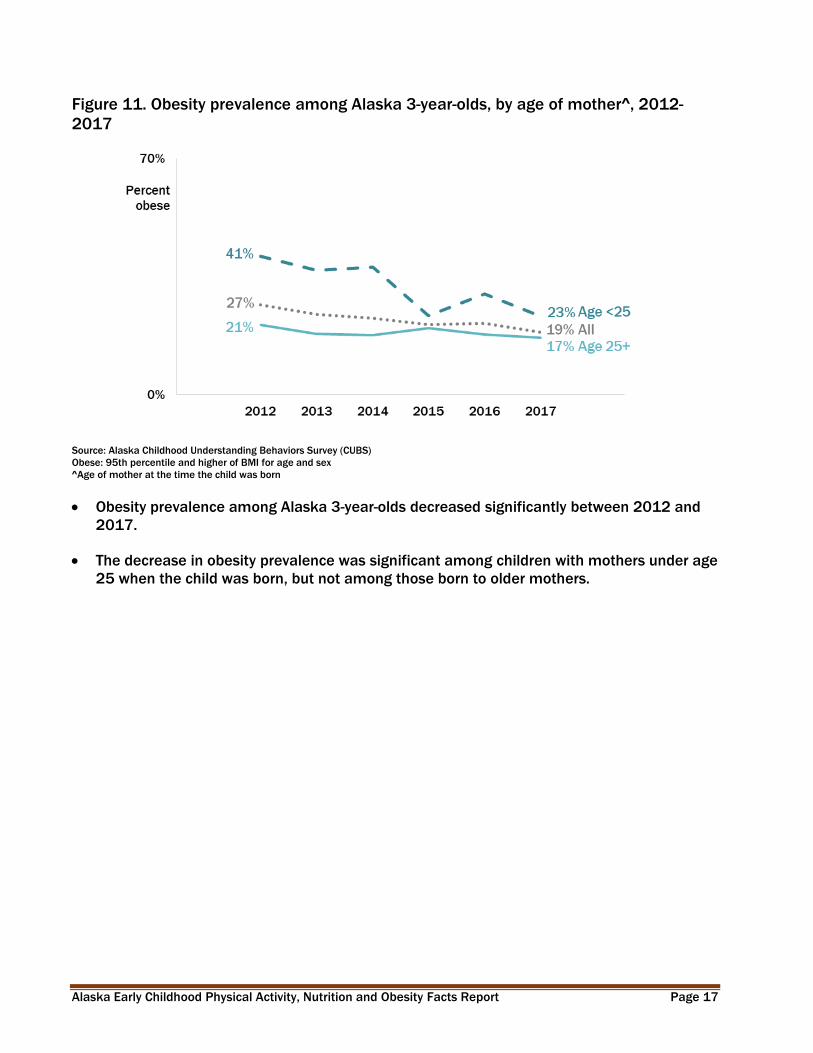
Figure 11. Obesity prevalence among Alaska 3-year-olds, by age of mother^, 2012-
2017
Source: Alaska Childhood Understanding Behaviors Survey (CUBS)
Obese: 95th percentile and higher of BMI for age and sex
^Age of mother at the time the child was born
Obesity prevalence among Alaska 3-year-olds decreased significantly between 2012 and
2017.
The decrease in obesity prevalence was significant among children with mothers under age
25 when the child was born, but not among those born to older mothers.

Alaska Early Childhood Physical Activity, Nutrition and Obesity Facts Report Page 18
Figure 12. Obesity prevalence among Alaska 3-year-olds, by maternal demographics,
2017
Source: Alaska Childhood Understanding Behaviors Survey (CUBS)
Obese: 95th percentile and higher of BMI for age and sex
Age of mother at the time the child was born
§ Estimate based on 30-60 responses, may be unreliable
Current child enrollment in Medicaid was used as a proxy measure of low socioeconomic status (SES).
Obesity prevalence in 2017 was significantly lower among Alaska 3-year-old children of
White mothers than among children of Alaska Native/American Indian mothers. No
differences were found by age of mother or SES.

Alaska Early Childhood Physical Activity, Nutrition and Obesity Facts Report Page 19
Alaska Kindergarten Students
Figure 13. Overweight/obesity prevalence, Kindergarten students, Anchorage and
Matanuska-Susitna Borough School Districts combined, 2003-04 to 2017-18 school
years
Source: Alaska Student Weight Status Surveillance System
Overweight/obesity: 85th percentile and higher of BMI for age and sex
The prevalence of overweight/obesity decreased slightly but not significantly between the
2003-04 and 2017-18 school years for Kindergarten students in the Anchorage and
Matanuska-Susitna Borough school districts.
Approximately 75% of Kindergarten students in these districts were 5 years old at the time
of measurement.
Kindergarten students in the Anchorage and Matanuska-Susitna Borough school districts in
2017-18 represented over half of the Kindergarten students in the state (51%).

Alaska Early Childhood Physical Activity, Nutrition and Obesity Facts Report Page 20
Figure 14. Overweight/obesity prevalence, Kindergarten students, Anchorage and
Matanuska-Susitna Borough School Districts combined, 2016-17 and 2017-18 school
years*
Source: Alaska Student Weight Status Surveillance System
*SES data is from 2016-17 school year, all other metrics from 2017-18 school year
Low SES: Enrollment in free- and reduced-price meal programs, a proxy measure of low socioeconomic status (SES)
Overweight/obesity: 85th percentile and higher of BMI for age and sex
Overweight/obesity prevalence was significantly lower among White Kindergarten students
than among Alaska Native students or students of other races in the 2017-18 school year.
Students of low socioeconomic status (SES) had a significantly higher prevalence of
overweight/obesity than higher-SES students in 2016-17.
Alaska Early Childhood Physical Activity, Nutrition and Obesity Facts Report Page 21
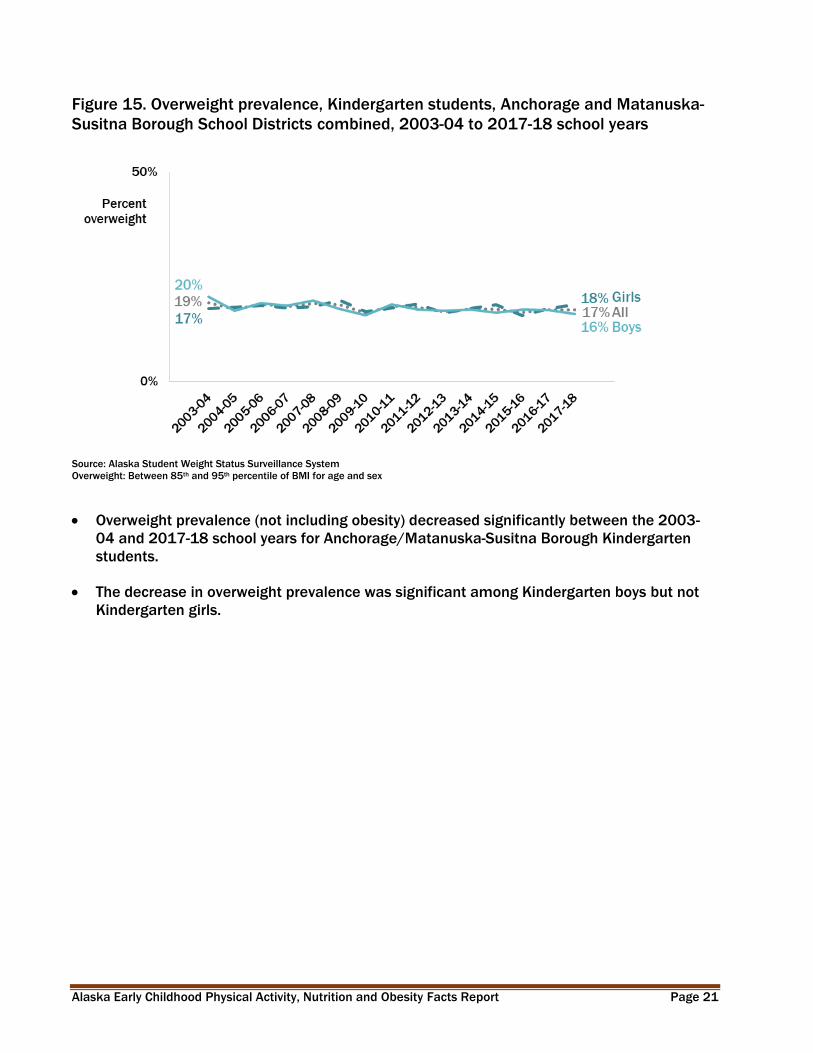
Figure 15. Overweight prevalence, Kindergarten students, Anchorage and Matanuska-
Susitna Borough School Districts combined, 2003-04 to 2017-18 school years
Source: Alaska Student Weight Status Surveillance System
Overweight: Between 85th and 95th percentile of BMI for age and sex
Overweight prevalence (not including obesity) decreased significantly between the 2003-
04 and 2017-18 school years for Anchorage/Matanuska-Susitna Borough Kindergarten
students.
The decrease in overweight prevalence was significant among Kindergarten boys but not
Kindergarten girls.

Alaska Early Childhood Physical Activity, Nutrition and Obesity Facts Report Page 22
Figure 16. Overweight prevalence, Kindergarten students, Anchorage and Matanuska-
Susitna Borough School Districts combined, 2016-17 and 2017-18 school years*
Source: Alaska Student Weight Status Surveillance System
*SES data is from 2016-17 school year, all other metrics from 2017-18 school year
Low SES: Enrollment in free- and reduced-price meal programs, a proxy measure of low socioeconomic status (SES)
Overweight: Between 85th and 95th percentile of BMI for age and sex
Health disparities exist in overweight prevalence among Anchorage and Matanuska-Susitna
Borough school district Kindergarten students in 2016-18:
Overweight prevalence was significantly higher among Alaska Native Kindergarteners than
among students identified as White or other races.
Low SES Kindergarten students had a significantly higher overweight prevalence than
higher-SES students.
Alaska Early Childhood Physical Activity, Nutrition and Obesity Facts Report Page 23
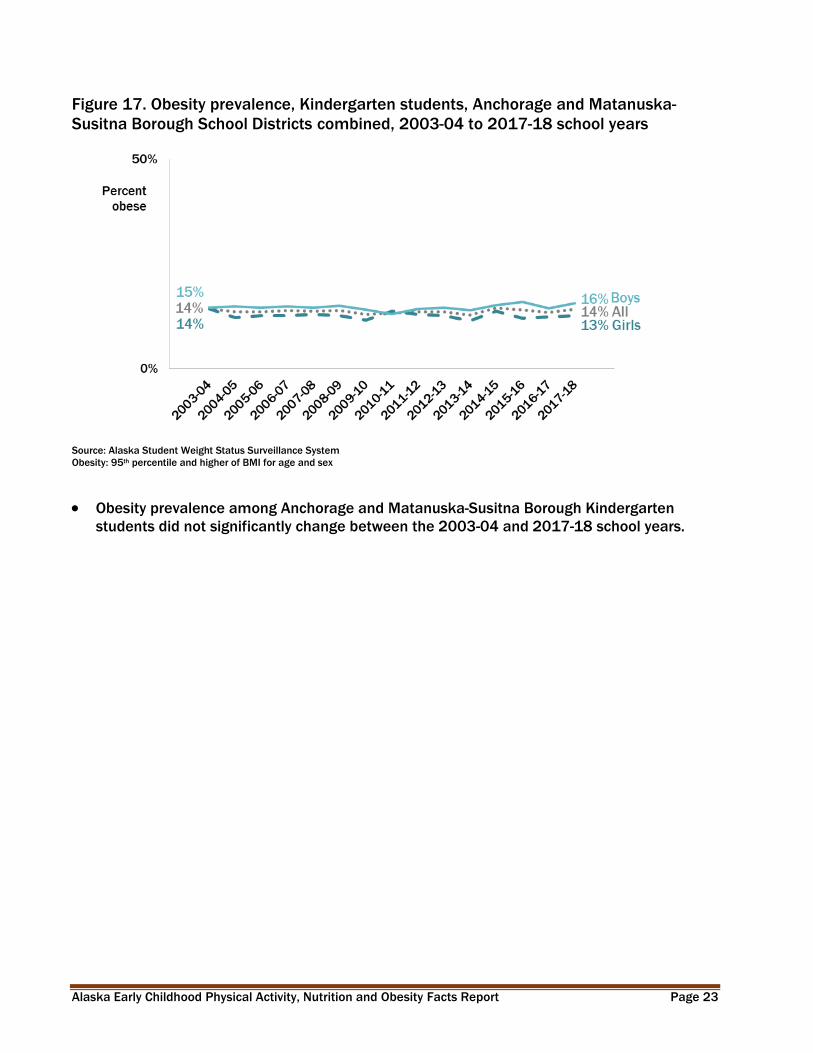
Figure 17. Obesity prevalence, Kindergarten students, Anchorage and Matanuska-
Susitna Borough School Districts combined, 2003-04 to 2017-18 school years
Source: Alaska Student Weight Status Surveillance System
Obesity: 95th percentile and higher of BMI for age and sex
Obesity prevalence among Anchorage and Matanuska-Susitna Borough Kindergarten
students did not significantly change between the 2003-04 and 2017-18 school years.
Alaska Early Childhood Physical Activity, Nutrition and Obesity Facts Report Page 24
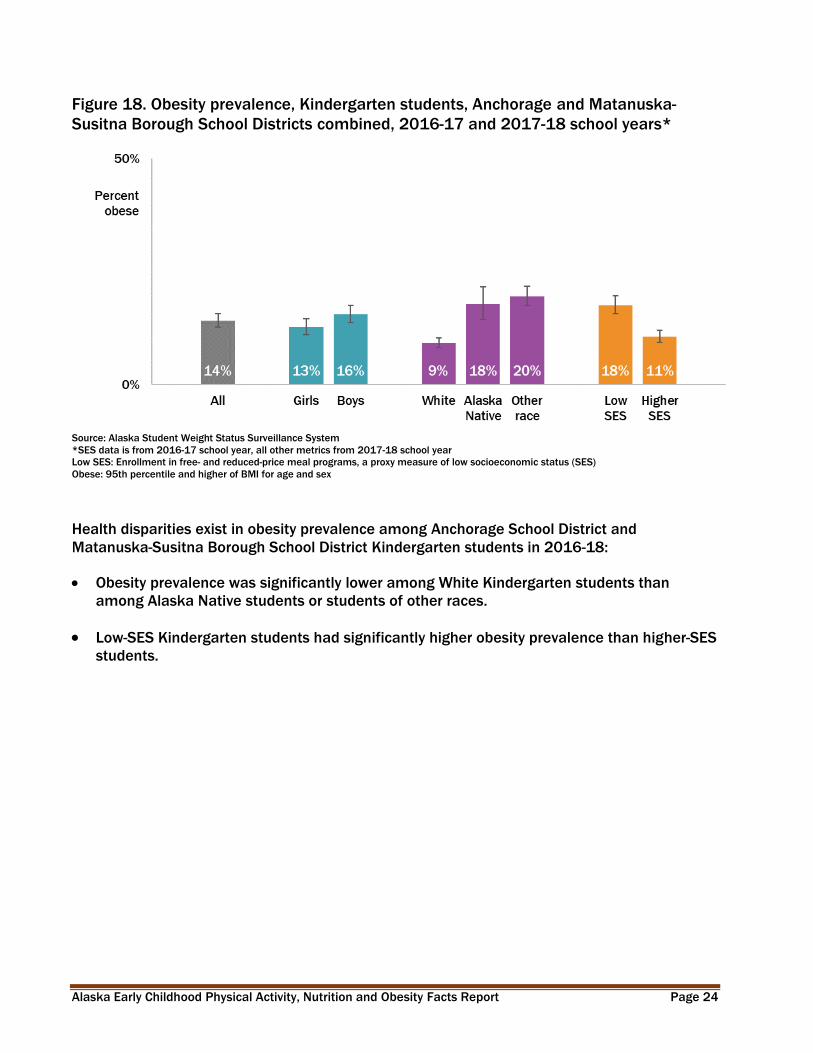
Figure 18. Obesity prevalence, Kindergarten students, Anchorage and Matanuska-
Susitna Borough School Districts combined, 2016-17 and 2017-18 school years*
Source: Alaska Student Weight Status Surveillance System
*SES data is from 2016-17 school year, all other metrics from 2017-18 school year
Low SES: Enrollment in free- and reduced-price meal programs, a proxy measure of low socioeconomic status (SES)
Obese: 95th percentile and higher of BMI for age and sex
Health disparities exist in obesity prevalence among Anchorage School District and
Matanuska-Susitna Borough School District Kindergarten students in 2016-18:
Obesity prevalence was significantly lower among White Kindergarten students than
among Alaska Native students or students of other races.
Low-SES Kindergarten students had significantly higher obesity prevalence than higher-SES
students.

Alaska Early Childhood Physical Activity, Nutrition and Obesity Facts Report Page 25
Mothers of Young Children
Figure 19. Excess maternal weight gain by pre-pregnancy weight status, Alaska, 2017
Source: Alaska Pregnancy Risk Assessment Monitoring System (PRAMS)
The Institute of Medicine (IOM) recommendations for weight gain during pregnancy
consider both infant and maternal health. The recommendations are based on a woman’s
pre-pregnancy weight status and differ if the mother is pregnant with one child or twins.
The best health outcomes for both mother and child are achieved when women start their
pregnancy at a healthy weight and gain the recommended amount of weight during
pregnancy17.
Approximately half of Alaska mothers were overweight or obese just before their
pregnancy (data not shown).
In half of all Alaska births in 2017, mothers exceeded the recommended amount of
maternal weight gain.
Mothers who were overweight or obese just before their pregnancy were significantly more
likely to experience excess maternal weight gain than were healthy-weight or underweight
mothers.
In 28% of births, the mother gained within the recommended weight range (data not
shown).
17 Institute of Medicine and National Research Council, 2009. Weight gain during pregnancy: Reexamining the guidelines. Washington
DC: The National Academies Press.

Alaska Early Childhood Physical Activity, Nutrition and Obesity Facts Report Page 26
V. Breastfeeding
A. Initiation
Figure 20. Breastfeeding initiation by age of mother^, Alaska, 2012-2017
Source: Alaska Pregnancy Risk Assessment Monitoring System (PRAMS)
^Age of mother at the time the child was born
Breastfeeding, with its many known health benefits for infants, children, and mothers, is a
key strategy to improve public health.18 In the United States, the American Academy of
Pediatrics (AAP) currently recommends:19
Infants should be fed breast milk exclusively for the first 6 months after birth.
Exclusive breastfeeding means that the infant does not receive any additional foods
(except vitamin D) or fluids unless medically recommended.
After the first 6 months and until the infant is 1 year old, the AAP recommends that
the mother continue breastfeeding while gradually introducing solid foods into the
infant's diet.
In recent years, over 90% of Alaska mothers have initiated breastfeeding; this is well above
the Healthy People 2020 target of 82%.20
Breastfeeding initiation rates did not change significantly between 2012 and 2017.
18 The Surgeon General's Call to Action to Support Breastfeeding. Rockville (MD): Office of the Surgeon General (US); 2011. 19 American Academy of Pediatrics. (2012). Breastfeeding and the use of human milk. Pediatrics, 129(3), e827–e841. Retrieved April 27, 2012, from http://pediatrics.aappublications.org/content/129/3/e827.full.pdf+html 20Healthy People 2020 [Internet]. Washington, DC: U.S. Department of Health and Human Services, Office of Disease Prevention and Health Promotion. Objective MICH-21. 6/28/19 Available from: https://www.healthypeople.gov/2020/topics-objectives/topic/maternal-infant-and-child-health/objectives
Alaska Early Childhood Physical Activity, Nutrition and Obesity Facts Report Page 27
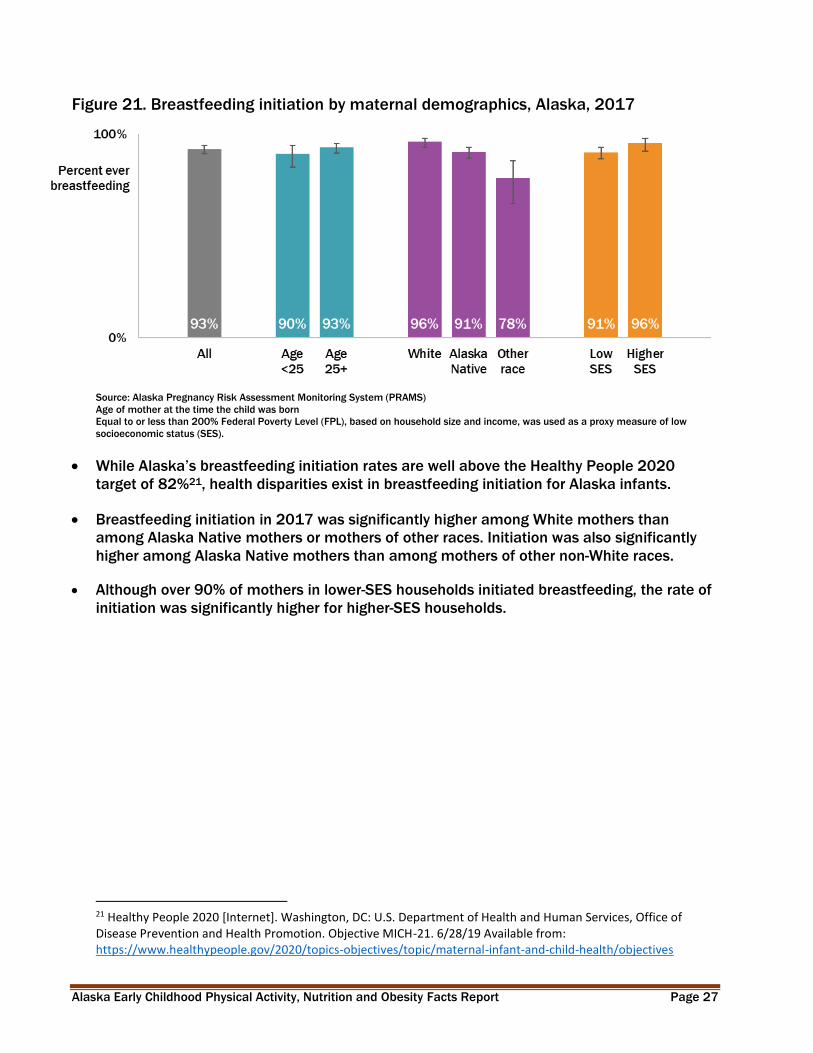
Figure 21. Breastfeeding initiation by maternal demographics, Alaska, 2017
Source: Alaska Pregnancy Risk Assessment Monitoring System (PRAMS)
Age of mother at the time the child was born
Equal to or less than 200% Federal Poverty Level (FPL), based on household size and income, was used as a proxy measure of low
socioeconomic status (SES).
While Alaska’s breastfeeding initiation rates are well above the Healthy People 2020
target of 82%21, health disparities exist in breastfeeding initiation for Alaska infants.
Breastfeeding initiation in 2017 was significantly higher among White mothers than
among Alaska Native mothers or mothers of other races. Initiation was also significantly
higher among Alaska Native mothers than among mothers of other non-White races.
Although over 90% of mothers in lower-SES households initiated breastfeeding, the rate of
initiation was significantly higher for higher-SES households.
21 Healthy People 2020 [Internet]. Washington, DC: U.S. Department of Health and Human Services, Office of Disease Prevention and Health Promotion. Objective MICH-21. 6/28/19 Available from: https://www.healthypeople.gov/2020/topics-objectives/topic/maternal-infant-and-child-health/objectives

Alaska Early Childhood Physical Activity, Nutrition and Obesity Facts Report Page 28
B. Duration and Exclusivity
Figure 22. Exclusive breastfeeding at 4 weeks by maternal demographics, Alaska,
2017
Source: Alaska Pregnancy Risk Assessment Monitoring System (PRAMS)
Age of mother at the time the child was born
Equal to or less than 200% Federal Poverty Level (FPL), based on household size and income, was used as a proxy measure of low
socioeconomic status (SES).
While 62% of Alaska women exclusively breastfed their babies at 4 weeks postpartum,
disparities exist in breastfeeding exclusivity:
Exclusive breastfeeding at 4 weeks was significantly higher among White mothers (70%)
than among Alaska Native mothers (52%) or mothers of other races (44%).
Mothers in higher-SES households were significantly more likely to exclusively breastfeed
at 4 weeks than were mothers in lower-SES households, 69% vs 57%, respectively.
Alaska Early Childhood Physical Activity, Nutrition and Obesity Facts Report Page 29
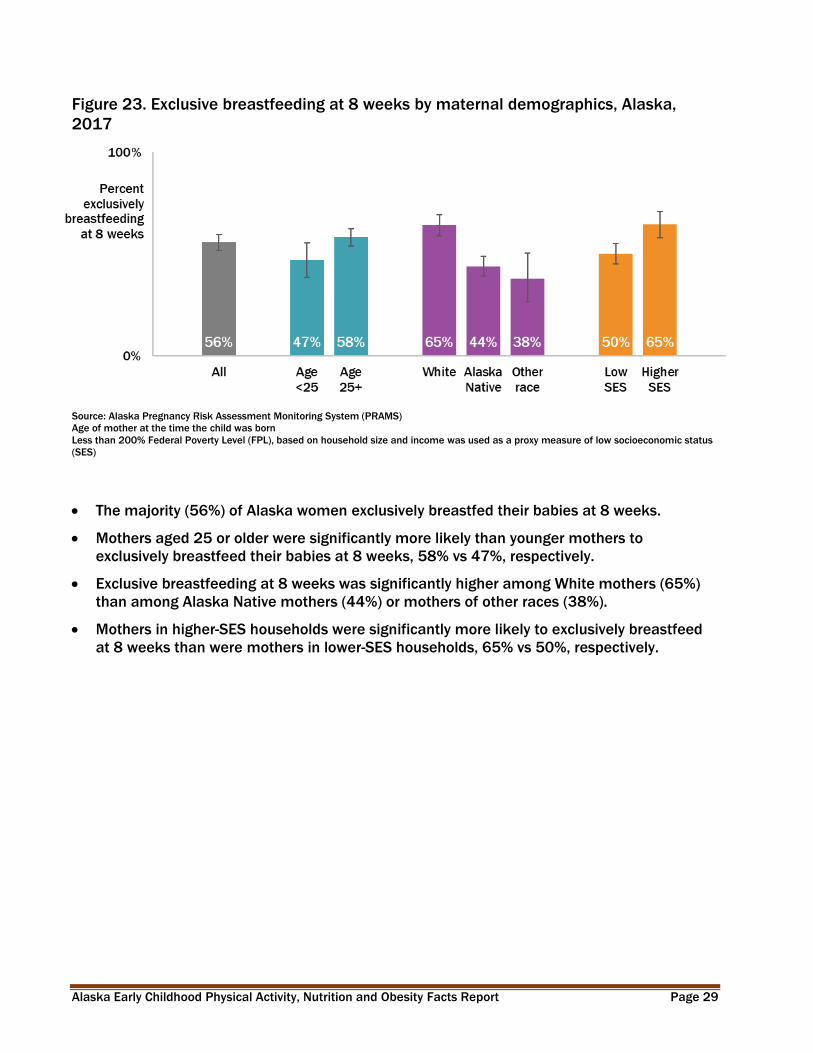
Figure 23. Exclusive breastfeeding at 8 weeks by maternal demographics, Alaska,
2017
Source: Alaska Pregnancy Risk Assessment Monitoring System (PRAMS)
Age of mother at the time the child was born
Less than 200% Federal Poverty Level (FPL), based on household size and income was used as a proxy measure of low socioeconomic status
(SES)
The majority (56%) of Alaska women exclusively breastfed their babies at 8 weeks.
Mothers aged 25 or older were significantly more likely than younger mothers to
exclusively breastfeed their babies at 8 weeks, 58% vs 47%, respectively.
Exclusive breastfeeding at 8 weeks was significantly higher among White mothers (65%)
than among Alaska Native mothers (44%) or mothers of other races (38%).
Mothers in higher-SES households were significantly more likely to exclusively breastfeed
at 8 weeks than were mothers in lower-SES households, 65% vs 50%, respectively.

Alaska Early Childhood Physical Activity, Nutrition and Obesity Facts Report Page 30
Figure 24. Breastfeeding duration and exclusivity, among U.S. and Alaska children born
in 2016
71%
51%
62%
42%
57%
36%
48%
25%
0% 100%
Breastfed at 6 months
Breastfed at 12 months
Exclusive breastfeeding
through 3 months
Exclusive breastfeeding
through 6 months
Percent of mothers
Alaska
U.S.
Source: National Immunization Survey, Centers for Disease Control and Prevention, Department of Health and Human Services
Alaska mothers’ breastfeeding duration and exclusivity rates are significantly higher than
the national average. Compared to other states, Alaska has some of the highest duration
and exclusivity breastfeeding rates in the nation.
Alaska Early Childhood Physical Activity, Nutrition and Obesity Facts Report Page 31
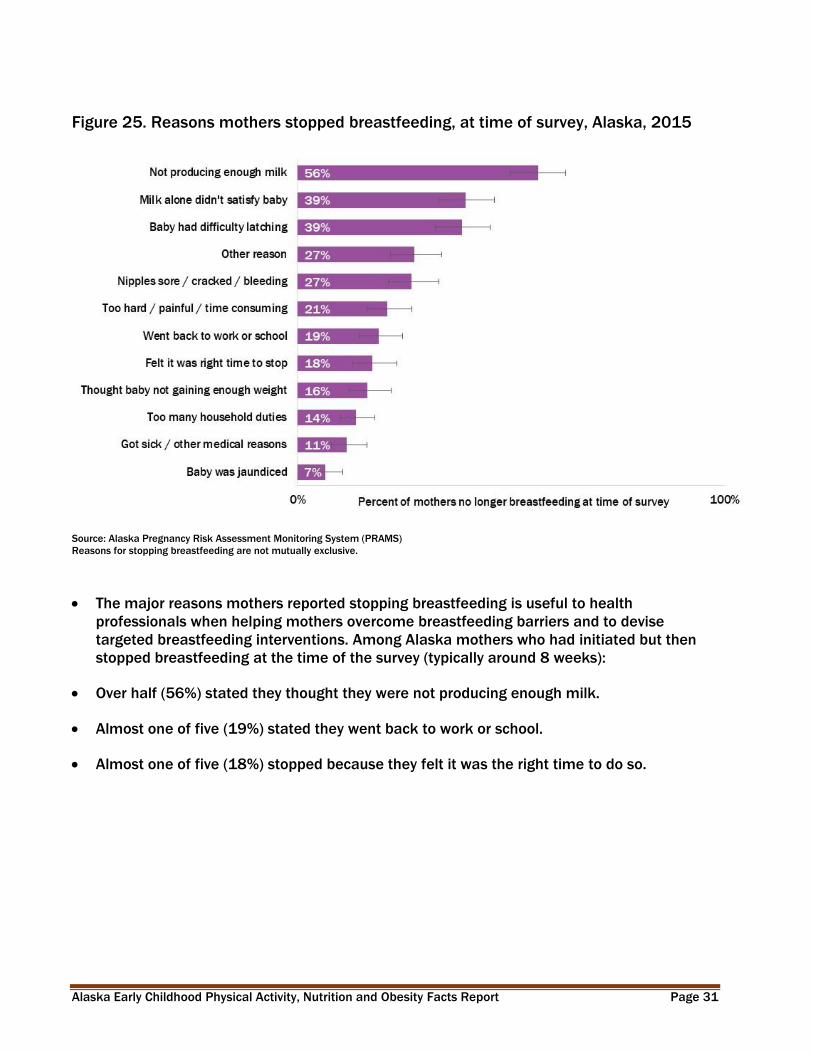
Figure 25. Reasons mothers stopped breastfeeding, at time of survey, Alaska, 2015
Source: Alaska Pregnancy Risk Assessment Monitoring System (PRAMS)
Reasons for stopping breastfeeding are not mutually exclusive.
The major reasons mothers reported stopping breastfeeding is useful to health
professionals when helping mothers overcome breastfeeding barriers and to devise
targeted breastfeeding interventions. Among Alaska mothers who had initiated but then
stopped breastfeeding at the time of the survey (typically around 8 weeks):
Over half (56%) stated they thought they were not producing enough milk.
Almost one of five (19%) stated they went back to work or school.
Almost one of five (18%) stopped because they felt it was the right time to do so.
Alaska Early Childhood Physical Activity, Nutrition and Obesity Facts Report Page 32
C. Mother’s Experiences
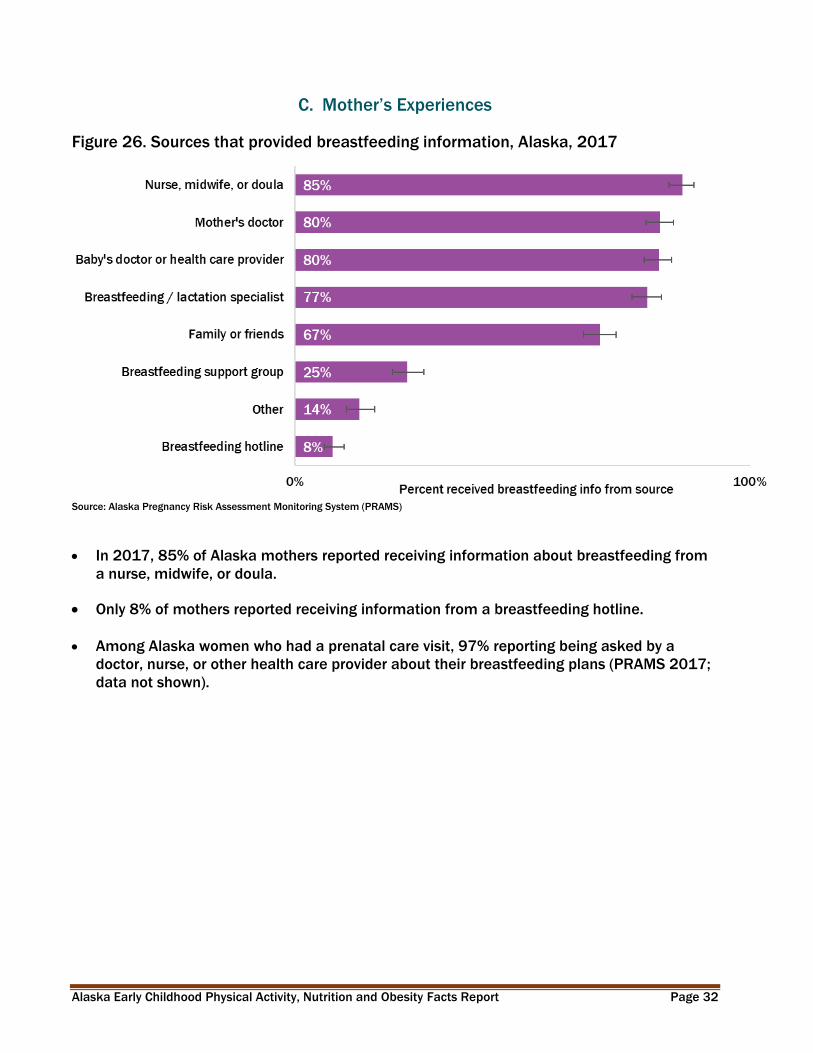
Figure 26. Sources that provided breastfeeding information, Alaska, 2017
Source: Alaska Pregnancy Risk Assessment Monitoring System (PRAMS)
In 2017, 85% of Alaska mothers reported receiving information about breastfeeding from
a nurse, midwife, or doula.
Only 8% of mothers reported receiving information from a breastfeeding hotline.
Among Alaska women who had a prenatal care visit, 97% reporting being asked by a
doctor, nurse, or other health care provider about their breastfeeding plans (PRAMS 2017;
data not shown).
Alaska Early Childhood Physical Activity, Nutrition and Obesity Facts Report Page 33
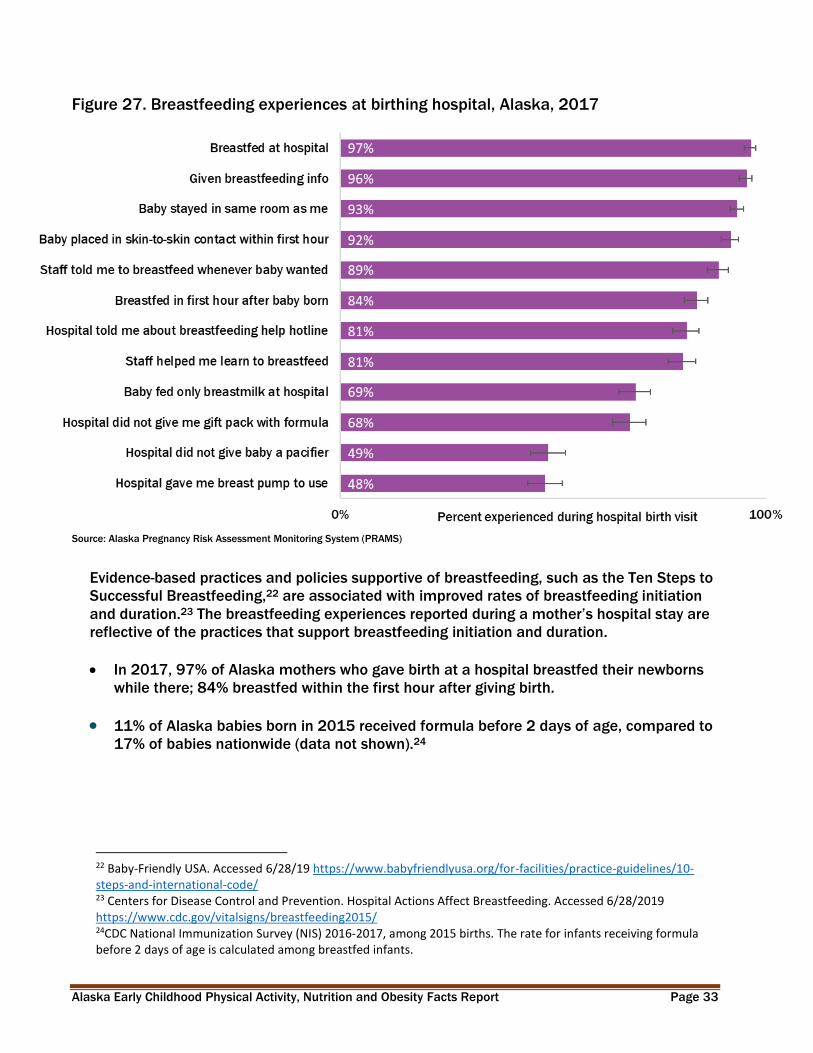
Figure 27. Breastfeeding experiences at birthing hospital, Alaska, 2017
Source: Alaska Pregnancy Risk Assessment Monitoring System (PRAMS)
Evidence-based practices and policies supportive of breastfeeding, such as the Ten Steps to
Successful Breastfeeding,22 are associated with improved rates of breastfeeding initiation
and duration.23 The breastfeeding experiences reported during a mother’s hospital stay are
reflective of the practices that support breastfeeding initiation and duration.
In 2017, 97% of Alaska mothers who gave birth at a hospital breastfed their newborns
while there; 84% breastfed within the first hour after giving birth.
11% of Alaska babies born in 2015 received formula before 2 days of age, compared to
17% of babies nationwide (data not shown).24
22 Baby-Friendly USA. Accessed 6/28/19 https://www.babyfriendlyusa.org/for-facilities/practice-guidelines/10-steps-and-international-code/ 23 Centers for Disease Control and Prevention. Hospital Actions Affect Breastfeeding. Accessed 6/28/2019 https://www.cdc.gov/vitalsigns/breastfeeding2015/ 24CDC National Immunization Survey (NIS) 2016-2017, among 2015 births. The rate for infants receiving formula before 2 days of age is calculated among breastfed infants.
Alaska Early Childhood Physical Activity, Nutrition and Obesity Facts Report Page 34
D. Healthcare Facilities and Providers
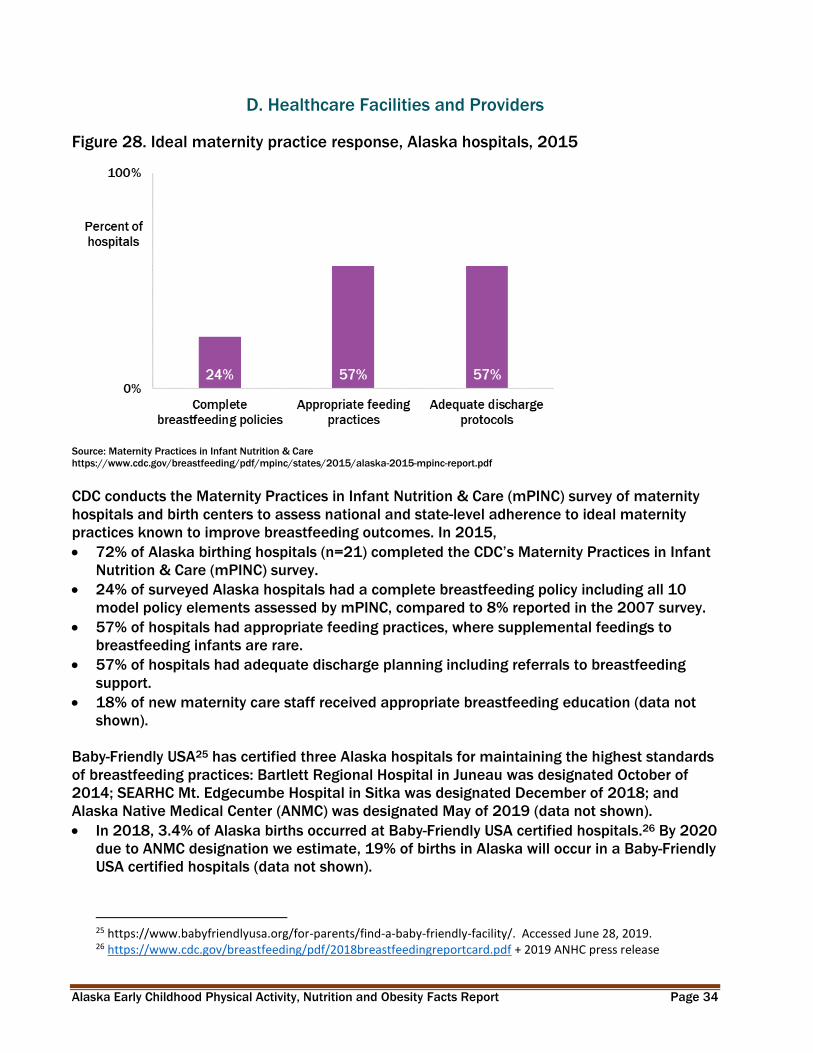
Figure 28. Ideal maternity practice response, Alaska hospitals, 2015
Source: Maternity Practices in Infant Nutrition & Care
https://www.cdc.gov/breastfeeding/pdf/mpinc/states/2015/alaska-2015-mpinc-report.pdf
CDC conducts the Maternity Practices in Infant Nutrition & Care (mPINC) survey of maternity
hospitals and birth centers to assess national and state-level adherence to ideal maternity
practices known to improve breastfeeding outcomes. In 2015,
72% of Alaska birthing hospitals (n=21) completed the CDC’s Maternity Practices in Infant
Nutrition & Care (mPINC) survey.
24% of surveyed Alaska hospitals had a complete breastfeeding policy including all 10
model policy elements assessed by mPINC, compared to 8% reported in the 2007 survey.
57% of hospitals had appropriate feeding practices, where supplemental feedings to
breastfeeding infants are rare.
57% of hospitals had adequate discharge planning including referrals to breastfeeding
support.
18% of new maternity care staff received appropriate breastfeeding education (data not
shown).
Baby-Friendly USA25 has certified three Alaska hospitals for maintaining the highest standards
of breastfeeding practices: Bartlett Regional Hospital in Juneau was designated October of
2014; SEARHC Mt. Edgecumbe Hospital in Sitka was designated December of 2018; and
Alaska Native Medical Center (ANMC) was designated May of 2019 (data not shown).
In 2018, 3.4% of Alaska births occurred at Baby-Friendly USA certified hospitals.26 By 2020
due to ANMC designation we estimate, 19% of births in Alaska will occur in a Baby-Friendly
USA certified hospitals (data not shown).
25 https://www.babyfriendlyusa.org/for-parents/find-a-baby-friendly-facility/. Accessed June 28, 2019. 26 https://www.cdc.gov/breastfeeding/pdf/2018breastfeedingreportcard.pdf + 2019 ANHC press release
Alaska Early Childhood Physical Activity, Nutrition and Obesity Facts Report Page 35
VI. Healthcare and Child Care
A. Healthcare Access
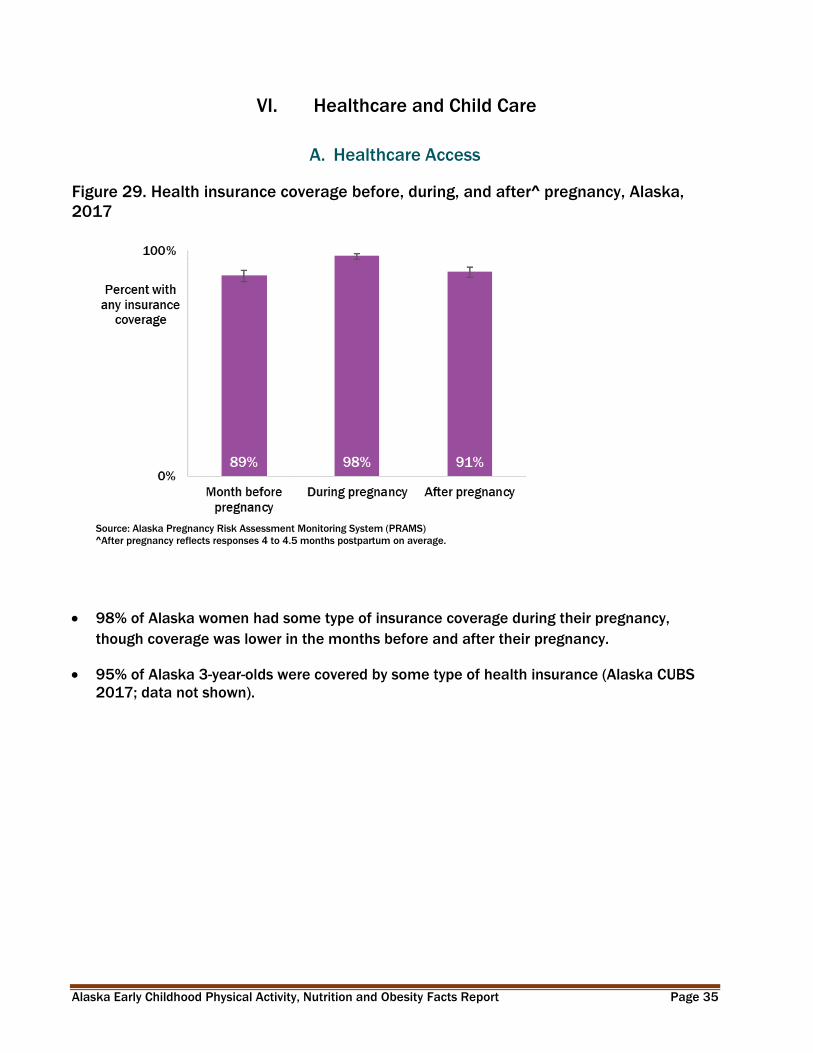
Figure 29. Health insurance coverage before, during, and after^ pregnancy, Alaska,
2017
Source: Alaska Pregnancy Risk Assessment Monitoring System (PRAMS)
^After pregnancy reflects responses 4 to 4.5 months postpartum on average.
98% of Alaska women had some type of insurance coverage during their pregnancy,
though coverage was lower in the months before and after their pregnancy.
95% of Alaska 3-year-olds were covered by some type of health insurance (Alaska CUBS
2017; data not shown).

Alaska Early Childhood Physical Activity, Nutrition and Obesity Facts Report Page 36
Figure 30. Health insurance coverage in month before pregnancy, Alaska, 2017
Source: Alaska Pregnancy Risk Assessment Monitoring System (PRAMS)
Equal to or less than 200% Federal Poverty Level (FPL), based on household size and income, was used as a proxy measure of low
socioeconomic (SES)
Health disparities exist in insurance coverage for Alaska mothers in 2017:
Alaska Native mothers were significantly more likely than mothers of other, non-White
races to have had some form of health insurance coverage in the month before pregnancy
in 2017.
Alaska women living in higher-SES households were more likely than those in lower-SES
households to have had insurance in the month before pregnancy.
Alaska Early Childhood Physical Activity, Nutrition and Obesity Facts Report Page 37
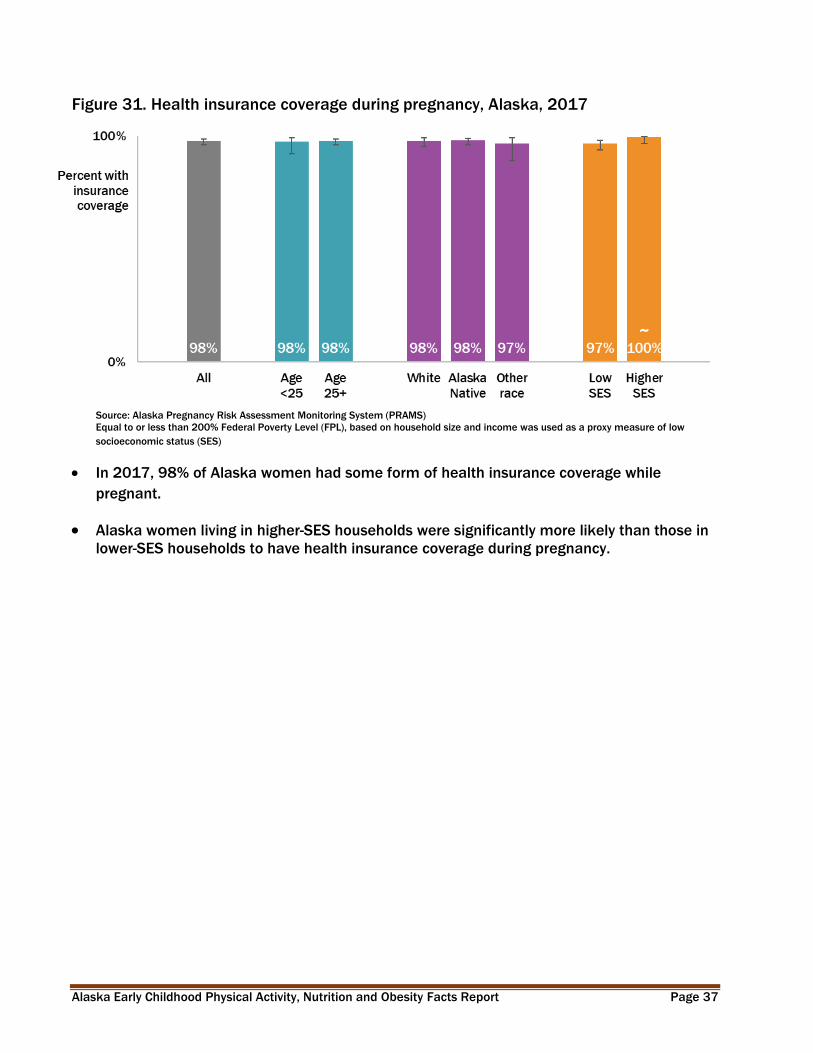
Figure 31. Health insurance coverage during pregnancy, Alaska, 2017
~
Source: Alaska Pregnancy Risk Assessment Monitoring System (PRAMS)
Equal to or less than 200% Federal Poverty Level (FPL), based on household size and income was used as a proxy measure of low
socioeconomic status (SES)
In 2017, 98% of Alaska women had some form of health insurance coverage while
pregnant.
Alaska women living in higher-SES households were significantly more likely than those in
lower-SES households to have health insurance coverage during pregnancy.
Alaska Early Childhood Physical Activity, Nutrition and Obesity Facts Report Page 38
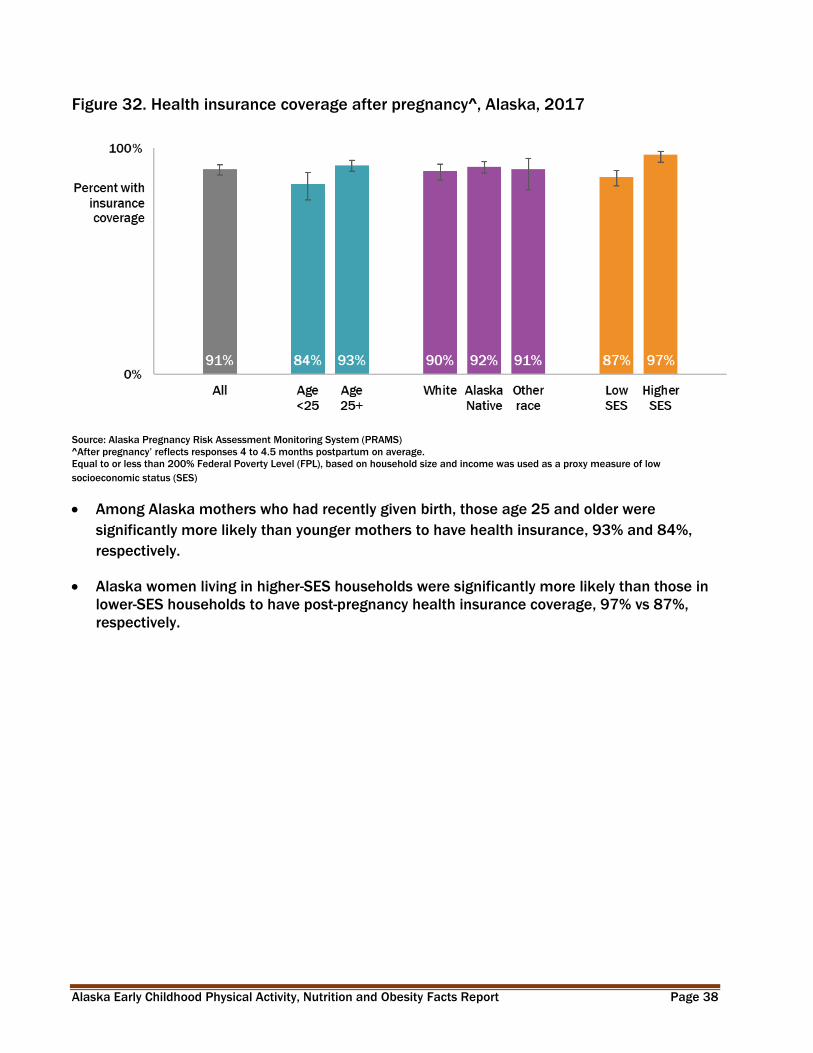
Figure 32. Health insurance coverage after pregnancy^, Alaska, 2017
Source: Alaska Pregnancy Risk Assessment Monitoring System (PRAMS)
^After pregnancy’ reflects responses 4 to 4.5 months postpartum on average.
Equal to or less than 200% Federal Poverty Level (FPL), based on household size and income was used as a proxy measure of low
socioeconomic status (SES)
Among Alaska mothers who had recently given birth, those age 25 and older were
significantly more likely than younger mothers to have health insurance, 93% and 84%,
respectively.
Alaska women living in higher-SES households were significantly more likely than those in
lower-SES households to have post-pregnancy health insurance coverage, 97% vs 87%,
respectively.
Alaska Early Childhood Physical Activity, Nutrition and Obesity Facts Report Page 39
Child Care Access
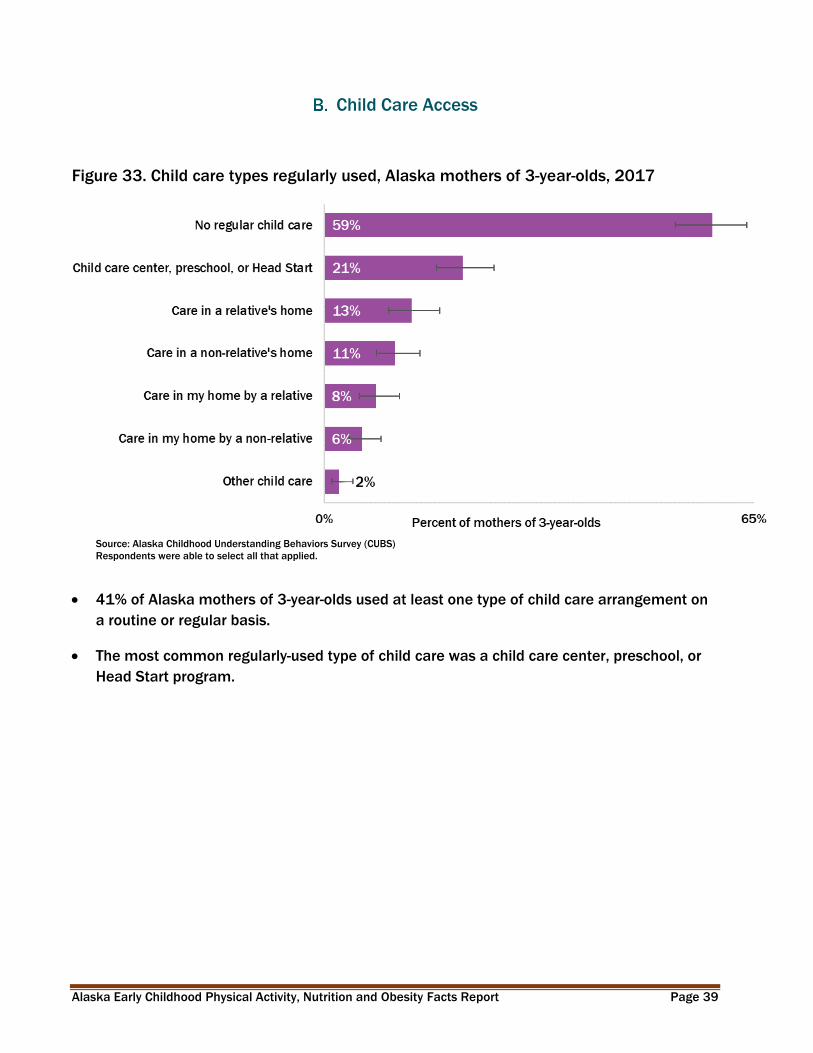
Figure 33. Child care types regularly used, Alaska mothers of 3-year-olds, 2017
Source: Alaska Childhood Understanding Behaviors Survey (CUBS)
Respondents were able to select all that applied.
41% of Alaska mothers of 3-year-olds used at least one type of child care arrangement on
a routine or regular basis.
The most common regularly-used type of child care was a child care center, preschool, or
Head Start program.
Alaska Early Childhood Physical Activity, Nutrition and Obesity Facts Report Page 40
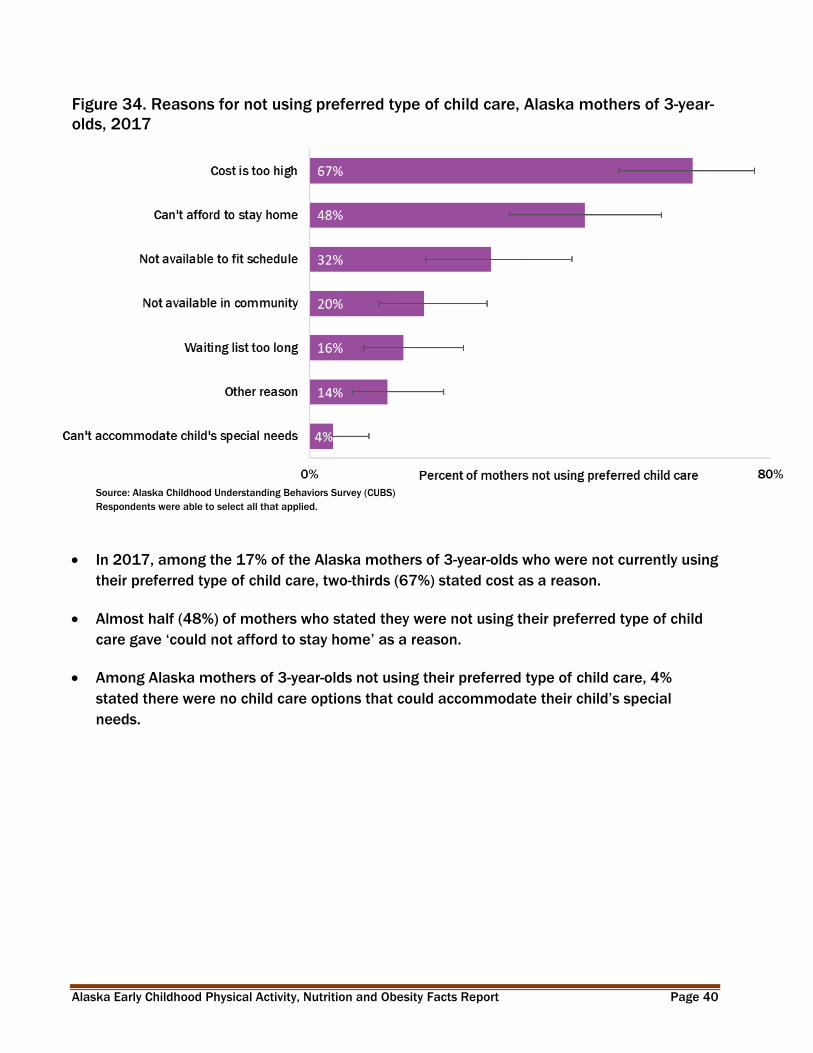
Figure 34. Reasons for not using preferred type of child care, Alaska mothers of 3-year-
olds, 2017
Source: Alaska Childhood Understanding Behaviors Survey (CUBS)
Respondents were able to select all that applied.
In 2017, among the 17% of the Alaska mothers of 3-year-olds who were not currently using
their preferred type of child care, two-thirds (67%) stated cost as a reason.
Almost half (48%) of mothers who stated they were not using their preferred type of child
care gave ‘could not afford to stay home’ as a reason.
Among Alaska mothers of 3-year-olds not using their preferred type of child care, 4%
stated there were no child care options that could accommodate their child’s special
needs.

Alaska Early Childhood Physical Activity, Nutrition and Obesity Facts Report Page 41
Healthcare Provider Advice
Figure 35. Prior to pregnancy, discussed maintaining a healthy weight with health care
worker, Alaska, 2017
Source: Alaska Pregnancy Risk Assessment Monitoring System (PRAMS)
Equal to or less than 200% Federal Poverty Level (FPL), based on household size and income was used as a proxy measure of low
socioeconomic status (SES)
Among Alaska mothers who had a health care visit with a doctor, nurse, or other health
care worker in the 12 months before becoming pregnant, 36% discussed maintaining a
healthy weight.
Alaska Early Childhood Physical Activity, Nutrition and Obesity Facts Report Page 42
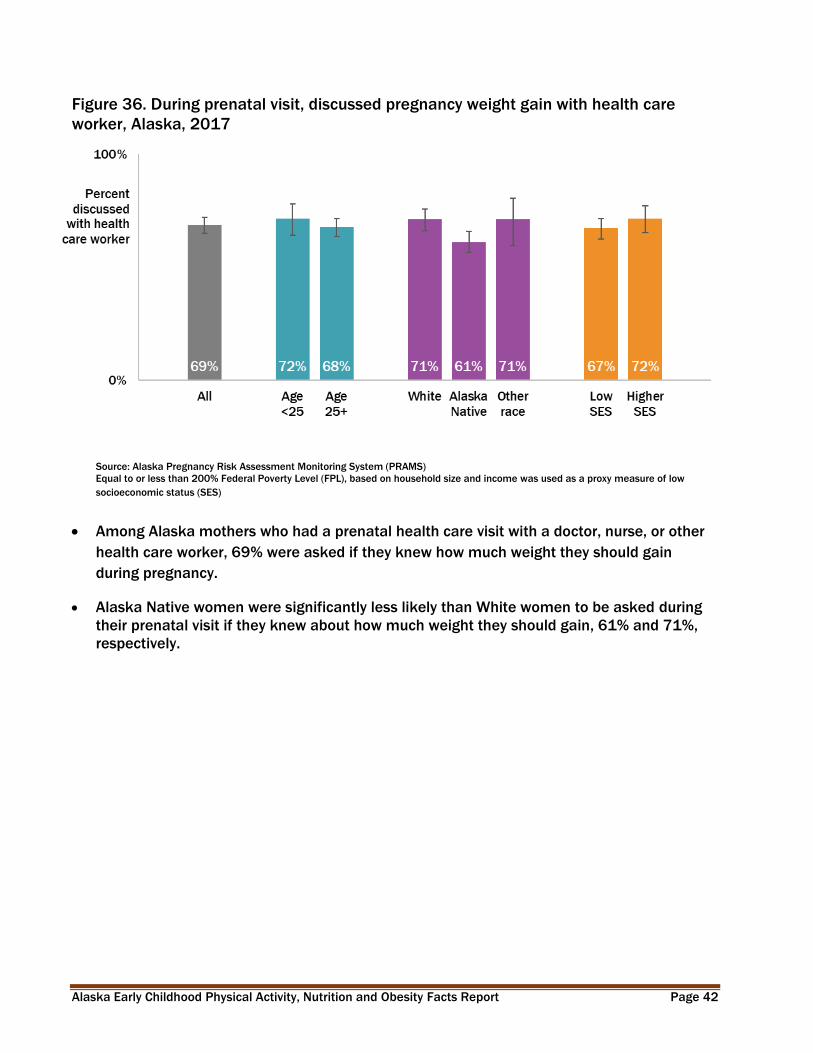
Figure 36. During prenatal visit, discussed pregnancy weight gain with health care
worker, Alaska, 2017
Source: Alaska Pregnancy Risk Assessment Monitoring System (PRAMS)
Equal to or less than 200% Federal Poverty Level (FPL), based on household size and income was used as a proxy measure of low
socioeconomic status (SES)
Among Alaska mothers who had a prenatal health care visit with a doctor, nurse, or other
health care worker, 69% were asked if they knew how much weight they should gain
during pregnancy.
Alaska Native women were significantly less likely than White women to be asked during
their prenatal visit if they knew about how much weight they should gain, 61% and 71%,
respectively.
Alaska Early Childhood Physical Activity, Nutrition and Obesity Facts Report Page 43
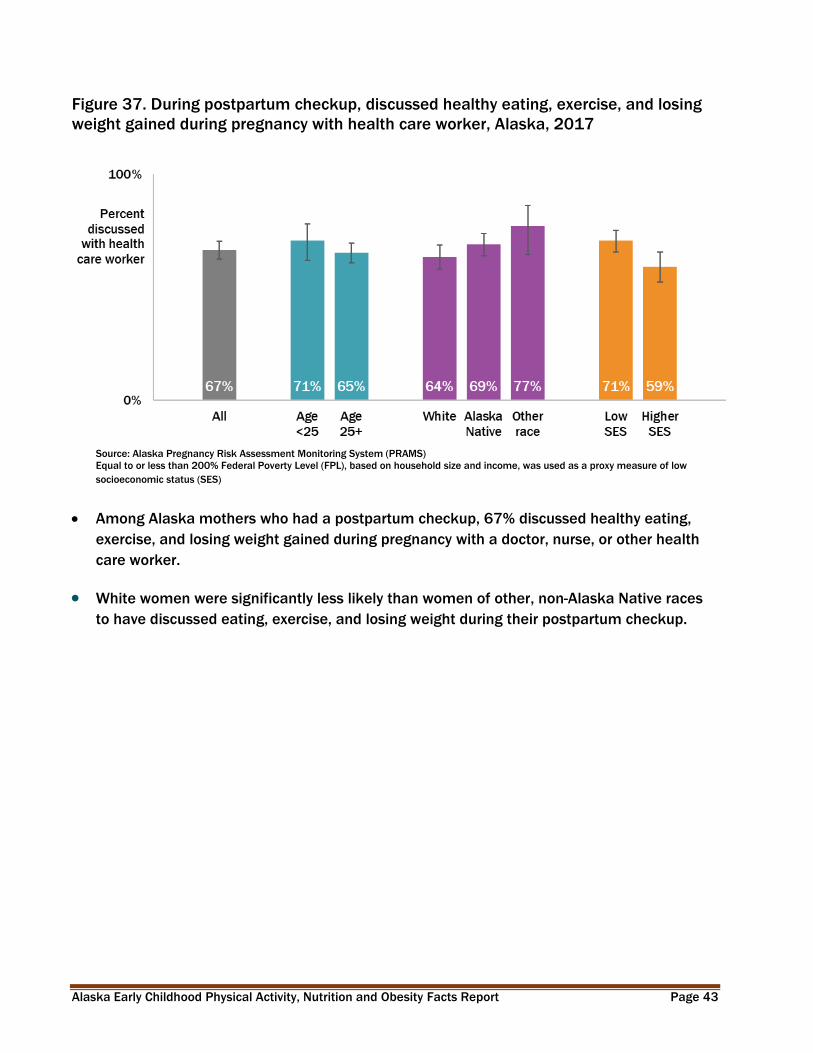
Figure 37. During postpartum checkup, discussed healthy eating, exercise, and losing
weight gained during pregnancy with health care worker, Alaska, 2017
Source: Alaska Pregnancy Risk Assessment Monitoring System (PRAMS)
Equal to or less than 200% Federal Poverty Level (FPL), based on household size and income, was used as a proxy measure of low
socioeconomic status (SES)
Among Alaska mothers who had a postpartum checkup, 67% discussed healthy eating,
exercise, and losing weight gained during pregnancy with a doctor, nurse, or other health
care worker.
White women were significantly less likely than women of other, non-Alaska Native races
to have discussed eating, exercise, and losing weight during their postpartum checkup.
Alaska Early Childhood Physical Activity, Nutrition and Obesity Facts Report Page 44
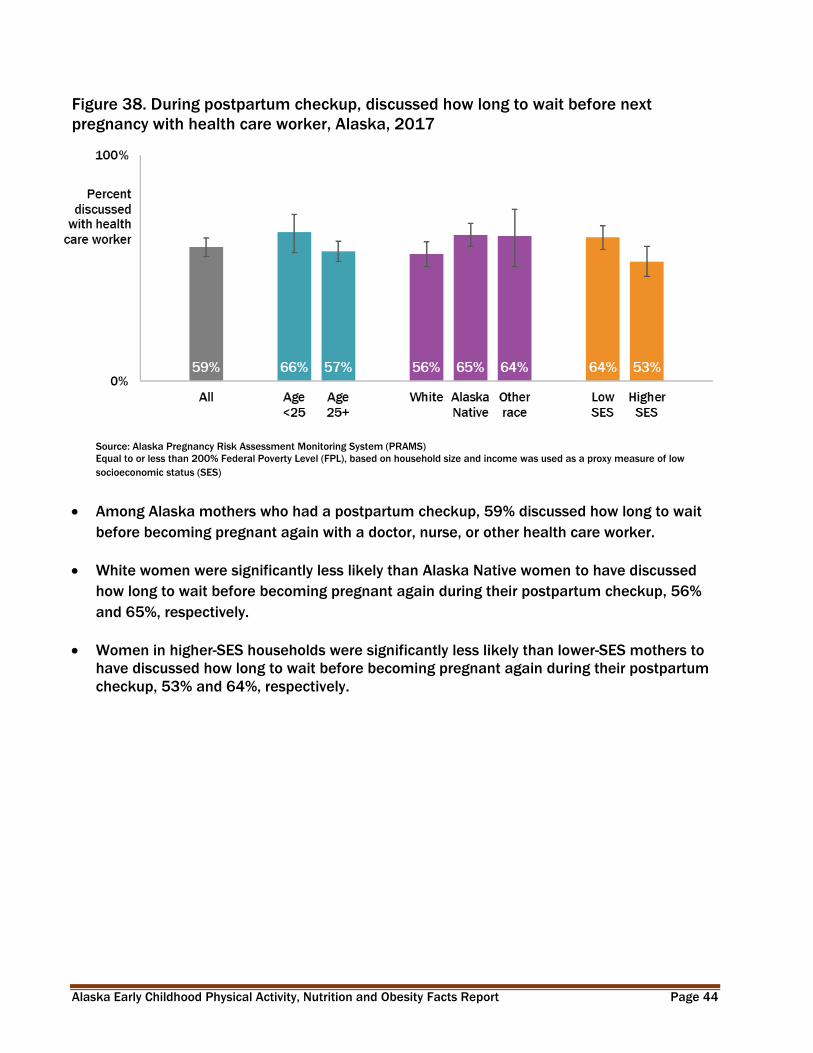
Figure 38. During postpartum checkup, discussed how long to wait before next
pregnancy with health care worker, Alaska, 2017
Source: Alaska Pregnancy Risk Assessment Monitoring System (PRAMS)
Equal to or less than 200% Federal Poverty Level (FPL), based on household size and income was used as a proxy measure of low
socioeconomic status (SES)
Among Alaska mothers who had a postpartum checkup, 59% discussed how long to wait
before becoming pregnant again with a doctor, nurse, or other health care worker.
White women were significantly less likely than Alaska Native women to have discussed
how long to wait before becoming pregnant again during their postpartum checkup, 56%
and 65%, respectively.
Women in higher-SES households were significantly less likely than lower-SES mothers to
have discussed how long to wait before becoming pregnant again during their postpartum
checkup, 53% and 64%, respectively.
Alaska Early Childhood Physical Activity, Nutrition and Obesity Facts Report Page 45
VII. Nutrition & Screen Time Measures
100% Juice
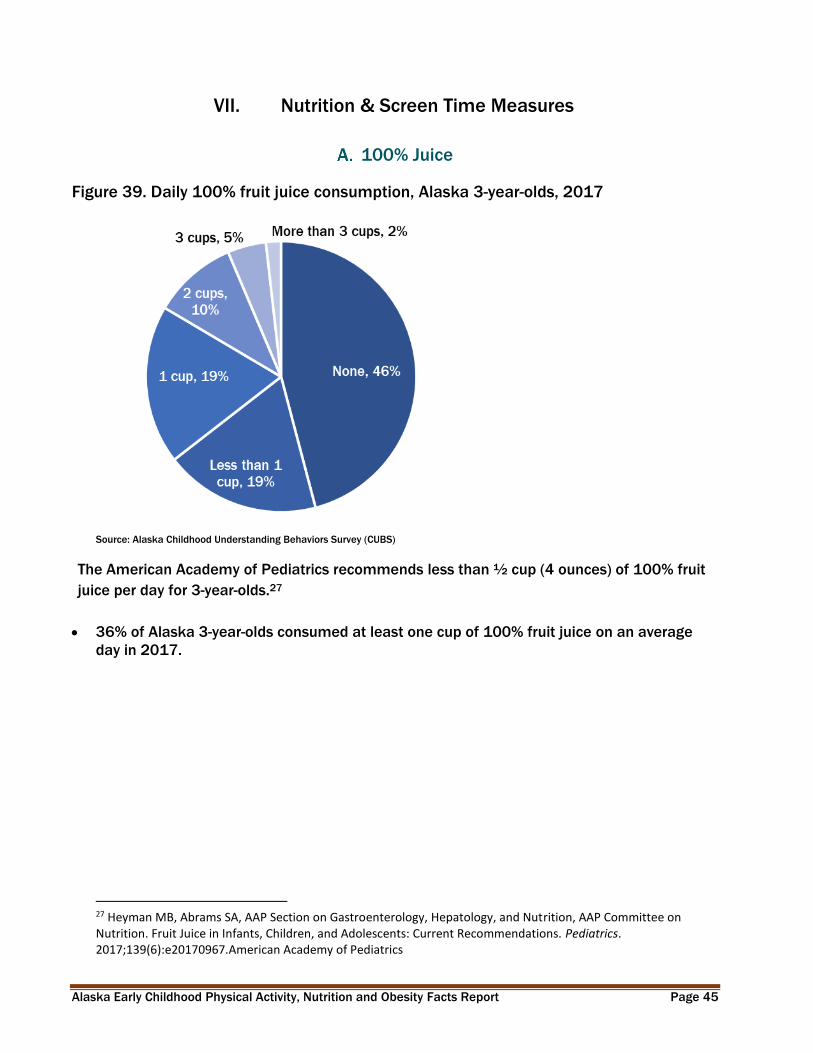
Figure 39. Daily 100% fruit juice consumption, Alaska 3-year-olds, 2017
Source: Alaska Childhood Understanding Behaviors Survey (CUBS)
The American Academy of Pediatrics recommends less than ½ cup (4 ounces) of 100% fruit
juice per day for 3-year-olds.27
36% of Alaska 3-year-olds consumed at least one cup of 100% fruit juice on an average
day in 2017.
27 Heyman MB, Abrams SA, AAP Section on Gastroenterology, Hepatology, and Nutrition, AAP Committee on Nutrition. Fruit Juice in Infants, Children, and Adolescents: Current Recommendations. Pediatrics. 2017;139(6):e20170967.American Academy of Pediatrics
Alaska Early Childhood Physical Activity, Nutrition and Obesity Facts Report Page 46
Milk
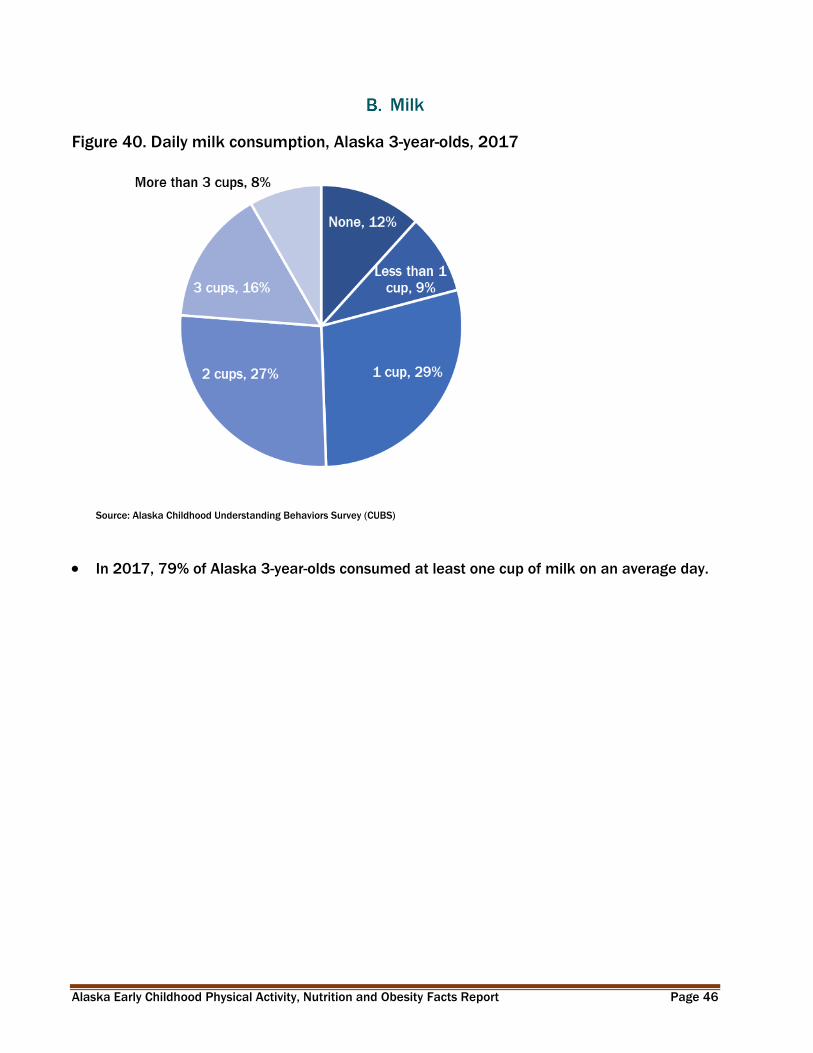
Figure 40. Daily milk consumption, Alaska 3-year-olds, 2017
Source: Alaska Childhood Understanding Behaviors Survey (CUBS)
In 2017, 79% of Alaska 3-year-olds consumed at least one cup of milk on an average day.
Alaska Early Childhood Physical Activity, Nutrition and Obesity Facts Report Page 47
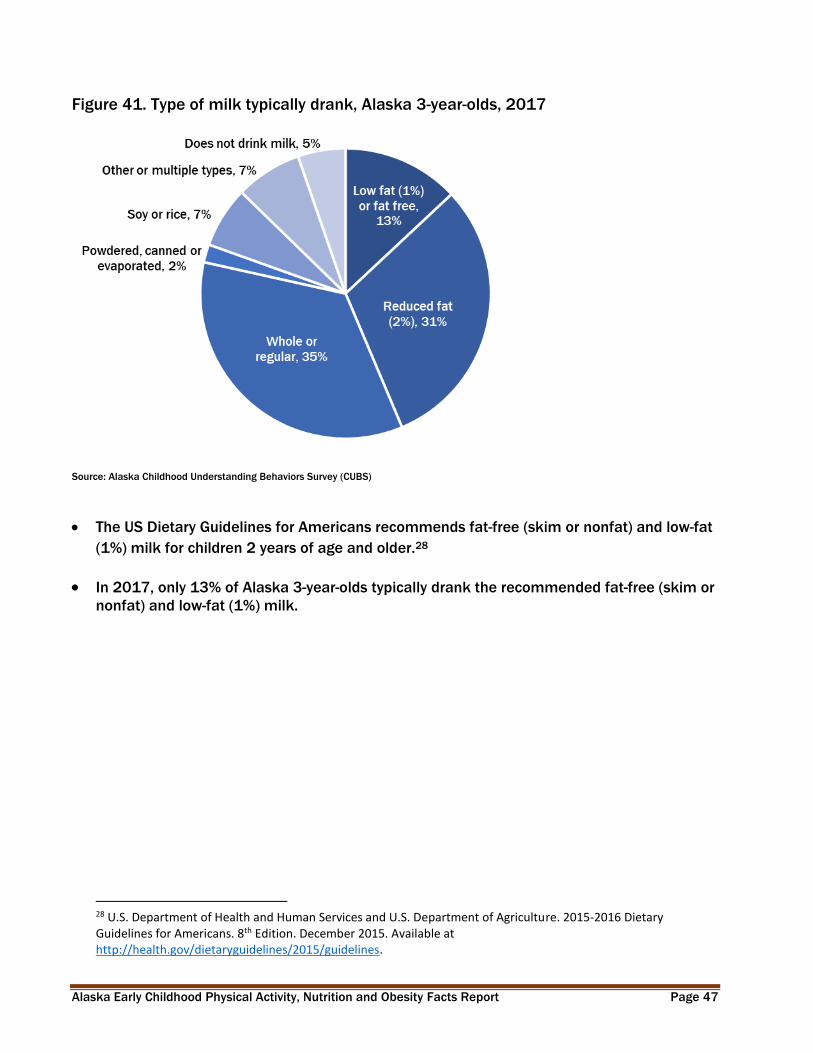
Figure 41. Type of milk typically drank, Alaska 3-year-olds, 2017
Source: Alaska Childhood Understanding Behaviors Survey (CUBS)
The US Dietary Guidelines for Americans recommends fat-free (skim or nonfat) and low-fat
(1%) milk for children 2 years of age and older.28
In 2017, only 13% of Alaska 3-year-olds typically drank the recommended fat-free (skim or
nonfat) and low-fat (1%) milk.
28 U.S. Department of Health and Human Services and U.S. Department of Agriculture. 2015-2016 Dietary Guidelines for Americans. 8th Edition. December 2015. Available at http://health.gov/dietaryguidelines/2015/guidelines.
Alaska Early Childhood Physical Activity, Nutrition and Obesity Facts Report Page 48
Water
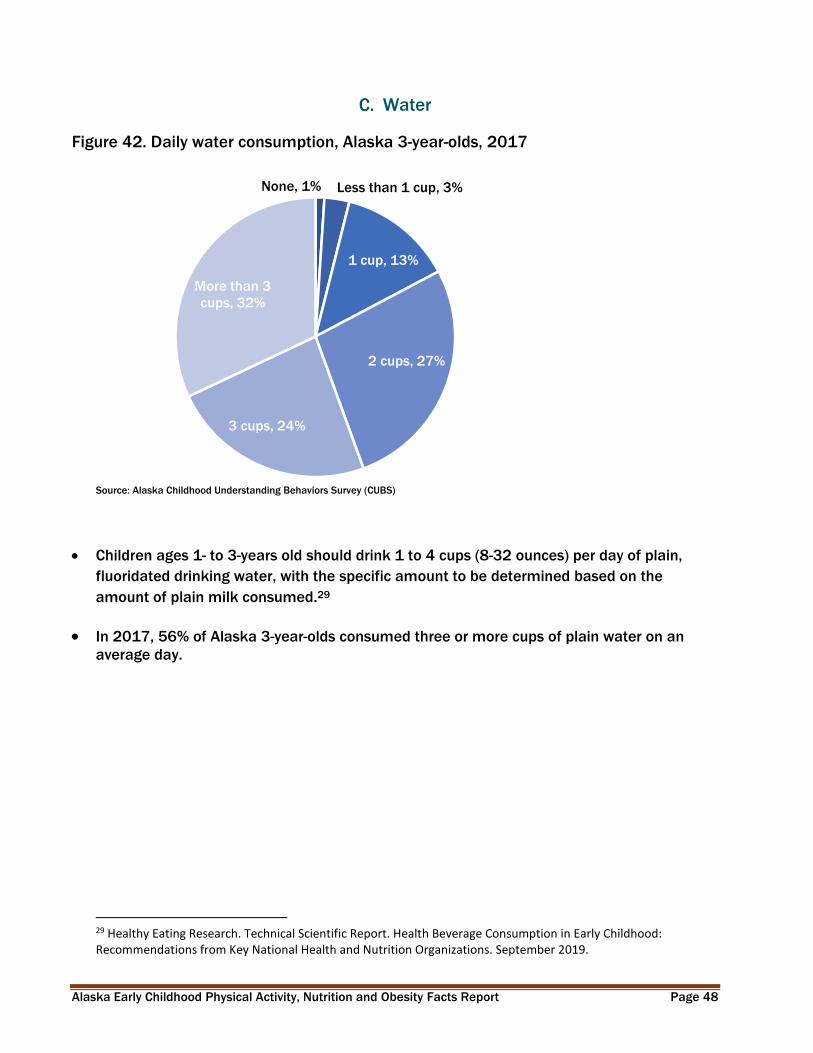
Figure 42. Daily water consumption, Alaska 3-year-olds, 2017
Source: Alaska Childhood Understanding Behaviors Survey (CUBS)
None, 1% Less than 1 cup, 3%
1 cup, 13%
2 cups, 27%
3 cups, 24%
More than 3
cups, 32%
Children ages 1- to 3-years old should drink 1 to 4 cups (8-32 ounces) per day of plain,
fluoridated drinking water, with the specific amount to be determined based on the
amount of plain milk consumed.29
In 2017, 56% of Alaska 3-year-olds consumed three or more cups of plain water on an
average day.
29 Healthy Eating Research. Technical Scientific Report. Health Beverage Consumption in Early Childhood: Recommendations from Key National Health and Nutrition Organizations. September 2019.
Alaska Early Childhood Physical Activity, Nutrition and Obesity Facts Report Page 49
Sugary Drinks
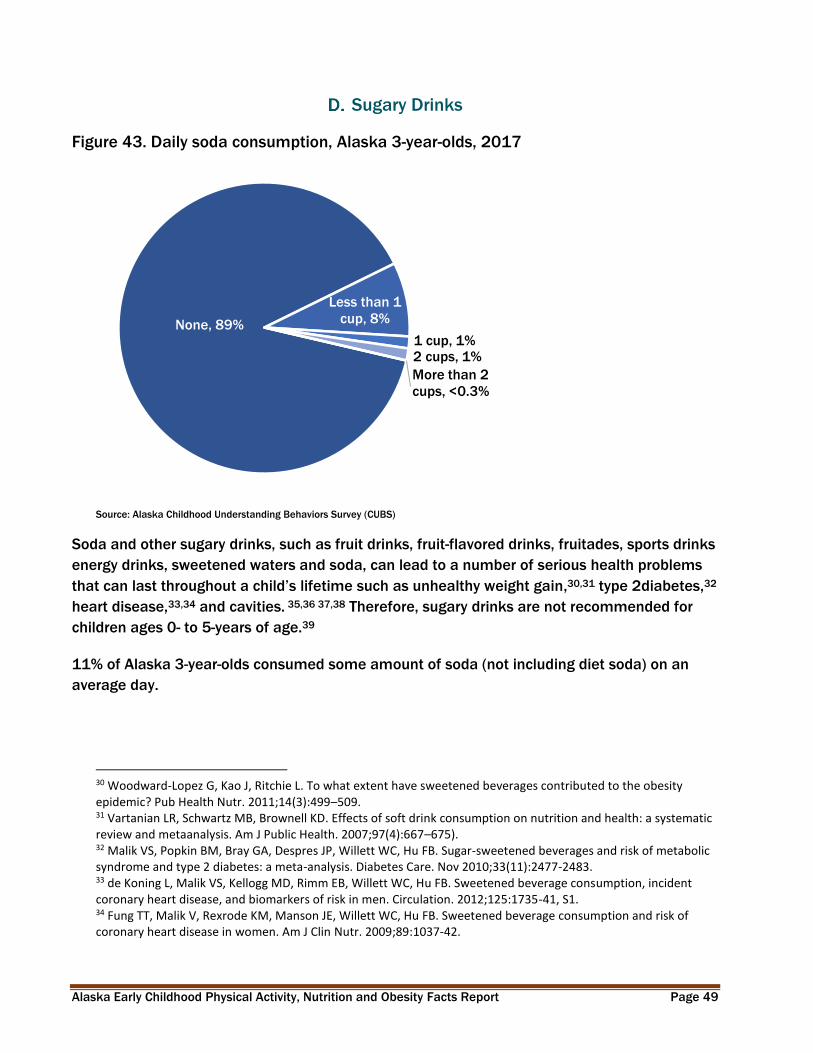
Figure 43. Daily soda consumption, Alaska 3-year-olds, 2017
None, 89%
Less than 1
cup, 8%
1 cup, 1%2 cups, 1%
More than 2
cups, <0.3%
Source: Alaska Childhood Understanding Behaviors Survey (CUBS)
Soda and other sugary drinks, such as fruit drinks, fruit-flavored drinks, fruitades, sports drinks
energy drinks, sweetened waters and soda, can lead to a number of serious health problems
that can last throughout a child’s lifetime such as unhealthy weight gain,30,31 type 2diabetes,32
heart disease,33,34 and cavities. 35,36 37,38 Therefore, sugary drinks are not recommended for
children ages 0- to 5-years of age.39
11% of Alaska 3-year-olds consumed some amount of soda (not including diet soda) on an
average day.
30 Woodward-Lopez G, Kao J, Ritchie L. To what extent have sweetened beverages contributed to the obesity epidemic? Pub Health Nutr. 2011;14(3):499–509. 31 Vartanian LR, Schwartz MB, Brownell KD. Effects of soft drink consumption on nutrition and health: a systematic review and metaanalysis. Am J Public Health. 2007;97(4):667–675). 32 Malik VS, Popkin BM, Bray GA, Despres JP, Willett WC, Hu FB. Sugar-sweetened beverages and risk of metabolic syndrome and type 2 diabetes: a meta-analysis. Diabetes Care. Nov 2010;33(11):2477-2483. 33 de Koning L, Malik VS, Kellogg MD, Rimm EB, Willett WC, Hu FB. Sweetened beverage consumption, incident coronary heart disease, and biomarkers of risk in men. Circulation. 2012;125:1735-41, S1. 34 Fung TT, Malik V, Rexrode KM, Manson JE, Willett WC, Hu FB. Sweetened beverage consumption and risk of coronary heart disease in women. Am J Clin Nutr. 2009;89:1037-42.

Alaska Early Childhood Physical Activity, Nutrition and Obesity Facts Report Page 50
Figure 44. Daily sweetened or fruit drink consumption, Alaska 3-year-olds, 2017
Source: Alaska Childhood Understanding Behaviors Survey (CUBS)
Sugary drinks include Soda and/or Sweetened or fruit drinks (such as Tang, Kool-Aid, Capri Sun, energy or sports drinks). It does not
include Diet drinks (such as Crystal light and diet soda).
In 2017, 28% of Alaska 3-year-olds consumed some amount of sweetened or fruit drinks
(such as Tang, Kool-Aid, Capri Sun, energy or sports drinks) on an average day
35 Sohn W, Burt BA, Sowers MR. Carbonated soft drinks and dental caries in the primary dentition. J Dent Res. 2006; 85(3): 262–266. 36 Centers for Disease Control and Prevention Morbidity and Mortality Weekly Report. Dental Caries in Rural Alaska Native Children --- Alaska, 2008 September 23, 2011 / 60(37);1275-1278 http://www.cdc.gov/mmwr/preview/mmwrhtml/mm6037a2.htm 37 Sohn W, Burt BA, Sowers MR. Carbonated soft drinks and dental caries in the primary dentition. J Dent Res. 2006; 85(3): 262–266. 38 Centers for Disease Control and Prevention Morbidity and Mortality Weekly Report. Dental Caries in Rural Alaska Native Children --- Alaska, 2008 September 23, 2011 / 60(37);1275-1278 39 Healthy Eating Research. Technical Scientific Report. Health Beverage Consumption in Early Childhood: Recommendations from Key National Health and Nutrition Organizations. September 2019.

Alaska Early Childhood Physical Activity, Nutrition and Obesity Facts Report Page 51
Figure 45. Any daily sugary drink consumption, Alaska 3-year-olds, by maternal
demographics, 2017
Source: Alaska Childhood Understanding Behaviors Survey (CUBS)
Age of mother at the time the child was born
Current child enrollment in Medicaid was used as a proxy measure of low socioeconomic status (SES)
Sugary drinks include Soda and/or Sweetened or fruit drinks (such as Tang, Kool-Aid, Capri Sun, energy or sports drinks). It does not
include Diet drinks (such as Crystal light and diet soda).
28% of Alaska 3-year-olds drink some sugary drink on an average day. This combined
measure of all sugary drinks (28.3%) and is only slightly different from the percent of
Alaska 3-year-olds who drink sweetened fruit drinks (27.7%). This suggests that the 11% of
3-year-olds who are drinking soda are also drinking sweetened fruit drinks.
Disparities exist in sugary drink consumption among Alaska 3-year-olds:
Alaska 3-year-old children of Alaska Native/American Indian mothers were significantly
more likely than children of White mothers to consume a sugary drink, 57% vs 17%.
Low SES 3-year-old children were more likely to consume sugary drinks than higher SES
children, 39% vs 21%.
Alaska Early Childhood Physical Activity, Nutrition and Obesity Facts Report Page 52
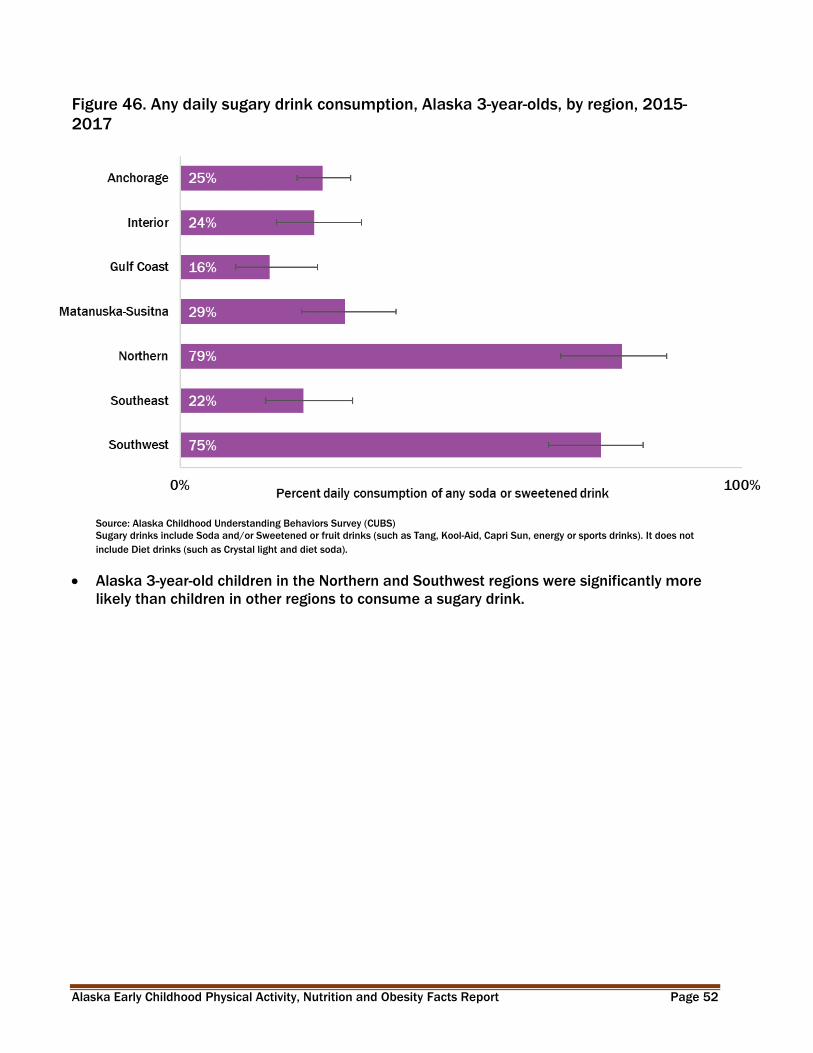
Figure 46. Any daily sugary drink consumption, Alaska 3-year-olds, by region, 2015-
2017
Source: Alaska Childhood Understanding Behaviors Survey (CUBS)
Sugary drinks include Soda and/or Sweetened or fruit drinks (such as Tang, Kool-Aid, Capri Sun, energy or sports drinks). It does not
include Diet drinks (such as Crystal light and diet soda).
Alaska 3-year-old children in the Northern and Southwest regions were significantly more
likely than children in other regions to consume a sugary drink.
Alaska Early Childhood Physical Activity, Nutrition and Obesity Facts Report Page 53
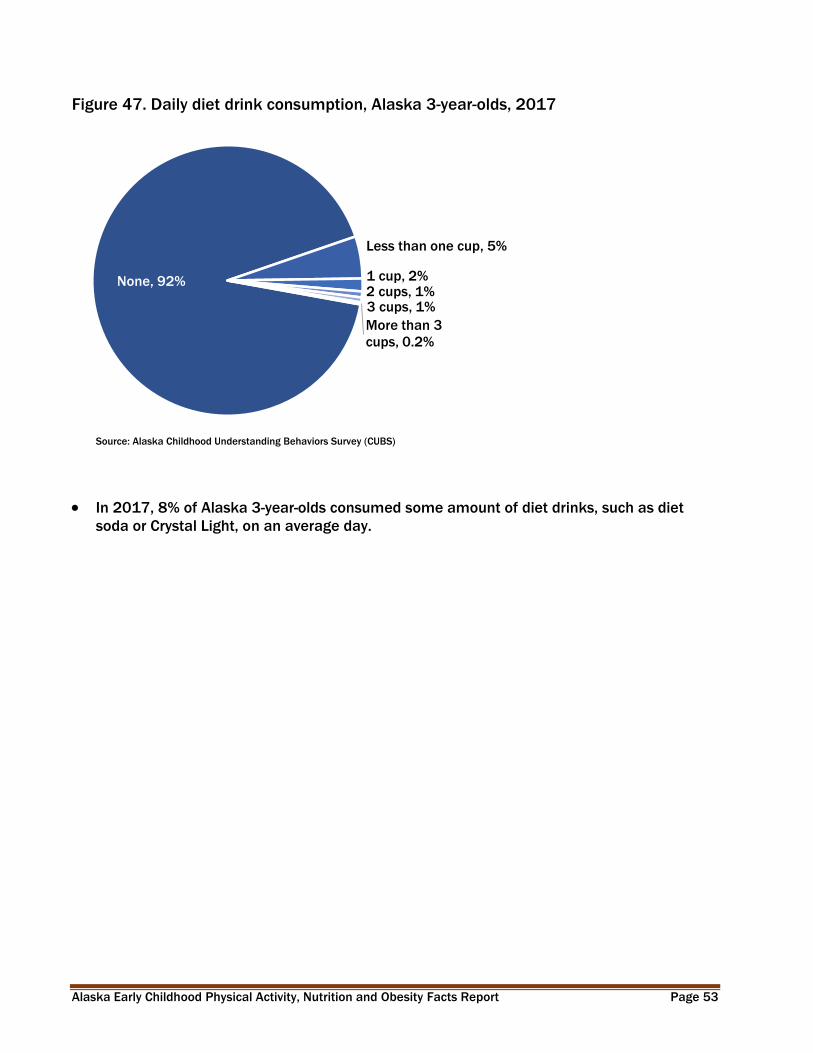
Figure 47. Daily diet drink consumption, Alaska 3-year-olds, 2017
Source: Alaska Childhood Understanding Behaviors Survey (CUBS)
None, 92%
Less than one cup, 5%
1 cup, 2%2 cups, 1%3 cups, 1%
More than 3
cups, 0.2%
In 2017, 8% of Alaska 3-year-olds consumed some amount of diet drinks, such as diet
soda or Crystal Light, on an average day.
Alaska Early Childhood Physical Activity, Nutrition and Obesity Facts Report Page 54
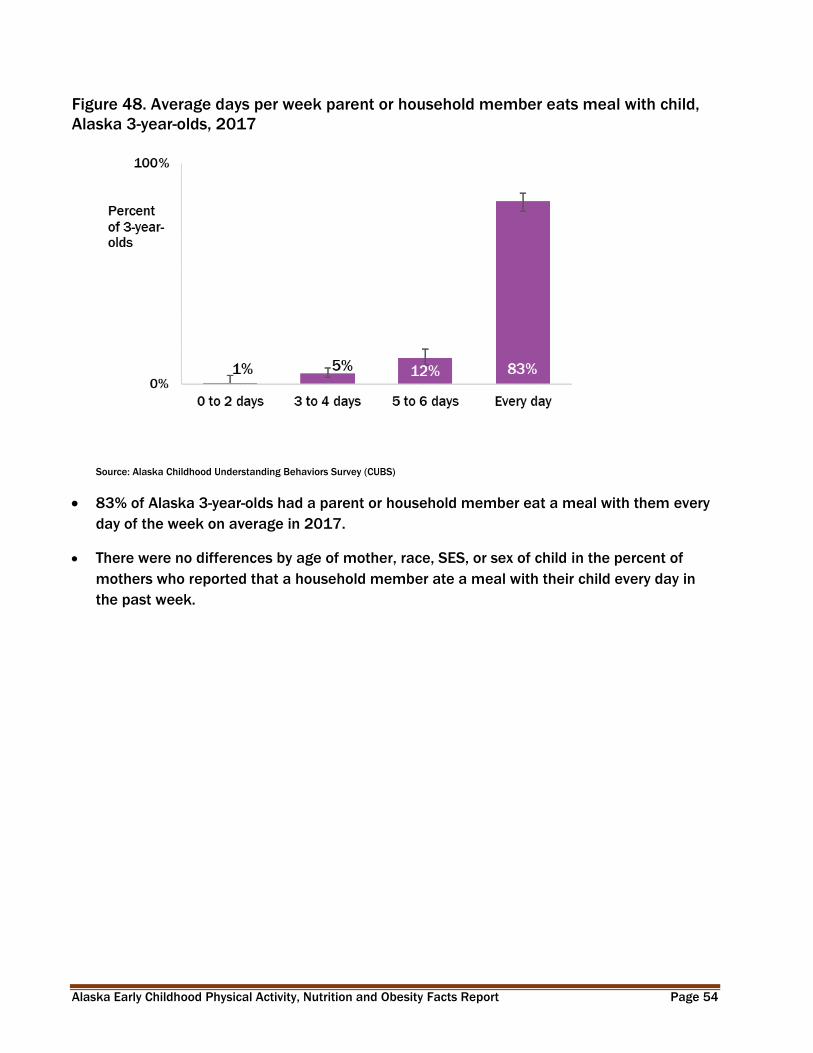
Figure 48. Average days per week parent or household member eats meal with child,
Alaska 3-year-olds, 2017
Source: Alaska Childhood Understanding Behaviors Survey (CUBS)
83% of Alaska 3-year-olds had a parent or household member eat a meal with them every
day of the week on average in 2017.
There were no differences by age of mother, race, SES, or sex of child in the percent of
mothers who reported that a household member ate a meal with their child every day in
the past week.
Alaska Early Childhood Physical Activity, Nutrition and Obesity Facts Report Page 55
Food Security
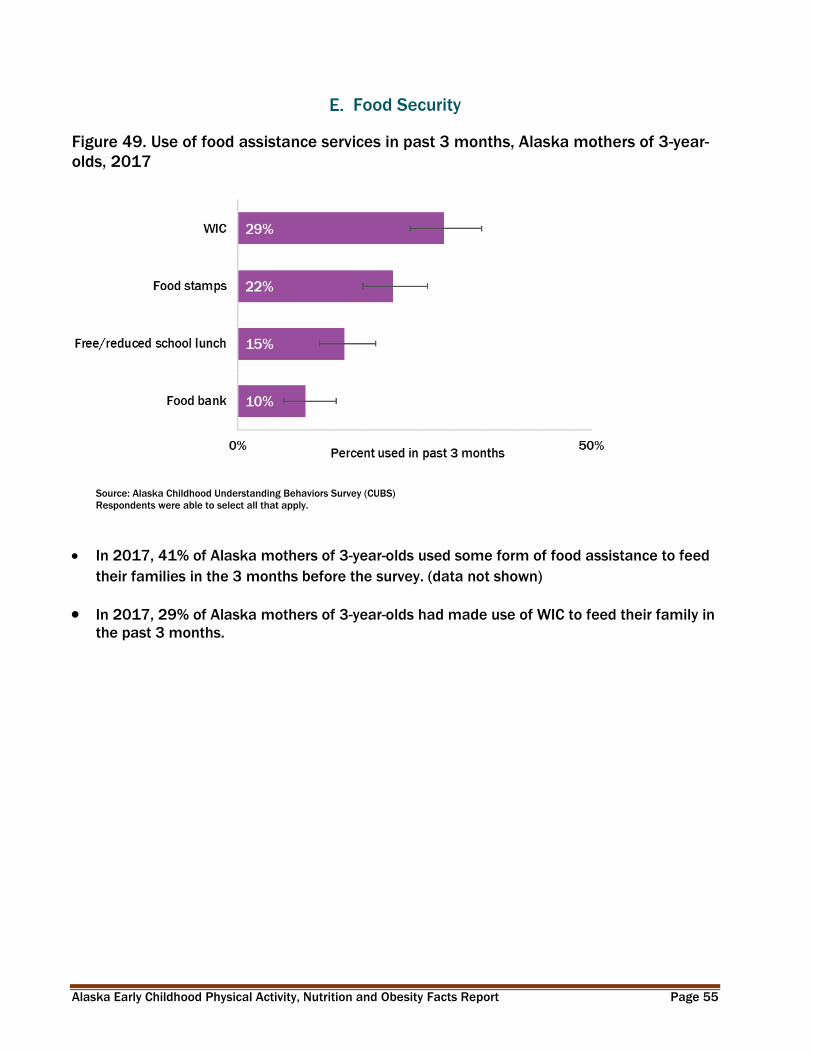
Figure 49. Use of food assistance services in past 3 months, Alaska mothers of 3-year-
olds, 2017
Source: Alaska Childhood Understanding Behaviors Survey (CUBS)
Respondents were able to select all that apply.
In 2017, 41% of Alaska mothers of 3-year-olds used some form of food assistance to feed
their families in the 3 months before the survey. (data not shown)
In 2017, 29% of Alaska mothers of 3-year-olds had made use of WIC to feed their family in
the past 3 months.

Alaska Early Childhood Physical Activity, Nutrition and Obesity Facts Report Page 56
Screen Time
Figure 50. Daily time spent in front of a screen, Alaska 3-year-olds, 2017
None,
10%
Less than 30
minutes, 3%
30 minutes to
less than 1
hour, 11%
1 hour to
less than 2
hours, 33%
2 hours to
less than 3
hours, 30%
3+ hours,
14%
Source: Alaska Childhood Understanding Behaviors Survey (CUBS)
The American Academy of Pediatrics recommends limiting media to one hour or less per day
of high-quality programming in children older than 2 years.40
77% of Alaska 3-year-olds had an hour or more of screen time (watching television, videos,
movies, or playing video games) on an average day in 2017.
40 AAP Council on Communication and Media. Media and Young Minds. Pediatrics. 2016; 138(5):e20162591.
Alaska Early Childhood Physical Activity, Nutrition and Obesity Facts Report Page 57
VIII. Data Sources
Pregnancy Risk Assessment Monitoring System (PRAMS)
The Pregnancy Risk Assessment Monitoring System (PRAMS) is an ongoing, population-
based surveillance system designed to identify and monitor selected maternal behaviors
and experiences that occur before and during a woman’s pregnancy and during the early
infancy of her child. PRAMS was developed by the Centers for Disease Control and
Prevention (CDC) Division of Reproductive Health in 1987 as part of an initiative to reduce
infant mortality and low birth weight. The Alaska PRAMS Project was initiated by the State
of Alaska, Division of Public Health, Section of Maternal, Child and Family Health in 1990.
PRAMS was designed to supplement data from vital records and to generate data for
planning and assessing perinatal health programs in participating states. Because PRAMS
data are population-based, findings from data analyses can be generalized to an entire
state’s population of women having a live birth. PRAMS is designed not only to generate
state-specific data, but also to allow comparisons among states through the use of
standardized data collection methods.
Currently PRAMS operates in 51 project sites and surveillance covers approximately 83%
of all U.S. births. Each site utilizes the same core questions and adds a limited number of
its own state--specific questions. Topics covered include preconception health; prenatal
care; use of tobacco and alcohol and other substances; insurance coverage; breastfeeding;
intimate partner violence; infant sleep environment, and life stressors such as illness, job
loss, debt; plus many other topics.
In Alaska, approximately one of every six mothers of newborns is selected for PRAMS.
Mothers are surveyed approximately 2 to 6 months after delivery of their baby. See
http://dhss.alaska.gov/dph/wcfh/Pages/mchepi/prams for more information about
PRAMS questionnaires and methodology.
Race definition for PRAMS
Race refers only to the race of the mother as reported on the birth certificate. For the
purposes of this report:
“Alaska Native” refers to women who identify as Alaska Native or American Indian,
either alone or in combination with other races.
“White” refers to women who identify as White alone.
“Other” refers to women who identify as any race other than Alaska Native (alone or
in combination) or White (alone).
Alaska Early Childhood Physical Activity, Nutrition and Obesity Facts Report Page 58
Mother’s age grouping
Mother’s age grouping (less than 25 and 25 years or older) were dichotomized and
presented in this report to explore behaviors and access to services of younger mothers.
The World Health Organization and United Nations have identified those 24 years and
under as a period needing special attention.41 Additionally research has pointed to a
number of changes in the brain and behavior which have implications for young adult
health care. 42 It has been noted that during the transition years (age 19 - 25), individuals
receive few preventative health visits43, lack of transition services44 and lack health
insurance.45 Due to these circumstances we determined the difference were worth
exploring and dichotomizing the results by age.
Childhood Understanding Behaviors Survey (CUBS)
Alaska Childhood Understanding Behaviors Survey (CUBS) is a program designed to find
out about the health and early childhood experiences of young children in Alaska. CUBS
collects information by conducting a follow-up survey to the Alaska Pregnancy Risk
Assessment Monitoring System (PRAMS). PRAMS sends a survey to approximately one of
every 6 mothers of newborns in Alaska, and CUBS sends a follow-up survey three years
later to all mothers who completed PRAMS and are still living in Alaska. CUBS asks
questions about both the mother and her child. About 90 Alaskan mothers are sent a CUBS
survey every month.
The purpose of CUBS is to provide information on health conditions, health care utilization,
child development and other health related behaviors of young children and to evaluate
the association between prenatal and immediate postnatal factors with early childhood
health and welfare. Survey responses are weighted so that the reported prevalence
accurately describes all mothers of 3-year old children born in Alaska in a single calendar
year. See http://dhss.alaska.gov/dph/wcfh/Pages/mchepi/cubs/default.aspx for more
information about CUBS questionnaires and methodology.
Race definition for CUBS
Race refers only to the race of the mother as reported on the birth certificate. For the
purposes of this report:
41 World Health Organization. Health for the world’s adolescents. http://apps.who.int/adolescent/second-decade/section2/page1/recognizing-adolescence.html 42 Colver A, Longwell S. New understanding of adolescent brain development; relevance to transitional healthcare for young people with long term conditions. Arch Dis Child. 2013 Nov; 98(11): 902–907. 43 National Adolescent and Young Adult Health Information Center. http://nahic.ucsf.edu/resource_center/new-article-increasing-preventive-services-does-the-preventive-visit-help/ 44 Child and Adolescent Health Measurement Initiative. 2017 National Survey of Children’s Health (NSCH) data query. https://www.childhealthdata.org/browse/survey/results?q=6696&r=3 45 Centers for Medicare & Medicaid Services. https://www.cms.gov/CCIIO/Resources/Files/adult_child_fact_sheet.html
Alaska Early Childhood Physical Activity, Nutrition and Obesity Facts Report Page 59
“Alaska Native” refers to women who identify as Alaska Native or American Indian,
either alone or in combination with other races.
“White” refers to women who identify as White alone.
“Other” refers to women who identify as any race other than Alaska Native (alone or
in combination) or White (alone).
Student Weight Status Surveillance System (SWSSS)
SWSSS is comprised of Alaska student weight status data obtained voluntarily from
partner school districts that have contributed their data as a means of monitoring obesity
trends. Participating school districts provide the Department of Health and Social Services
(DHSS) de-identified student data (i.e., measured height and weight, age, and sex). DHSS
conducts the analysis to generate body mass index (BMI) percentile, and the associated
weight status classifications of underweight, healthy weight, overweight and obese, as
described in the Introduction, Classifying Weight Status. SWSSS data differs slightly from
other data sources by reporting ‘American Indian/Alaska Native’ on breakdowns by race
because that is how the school district partners classify the data.
School districts across the state vary in the grades for which they routinely collect height
and weight data. Some districts aim to measure and weigh every student, every year, while
other districts target only students in Kindergarten, 1st, 3rd, 5th, and 7th grades. Analysis
scales measurement results to represent the enrolled population for each grade.
Anchorage and Matanuska-Susitna Borough school districts combined are used in Healthy
Alaskans 2020 and in this report because they have the longest trend and represent a
large proportion of students in the state (15% of Kindergarten students in 2017-2018).
The following school districts have participated in SWSSS in various years since its
inception: Anchorage, Dillingham, Kenai Peninsula Borough, Ketchikan Gateway Borough,
Kodiak Island Borough, Lake & Peninsula, Matanuska-Susitna Borough, Nome, North Slope
Borough, Petersburg, and Sitka. Individual school district weight status reports are
available at http://dhss.alaska.gov/dph/Chronic/Pages/Obesity/weightstatus.aspx

Alaska Early Childhood Physical Activity, Nutrition and Obesity Facts Report Page 60
Women, Infants and Children (WIC) Nutrition Program
WIC is a supplemental food and nutrition program for pregnant and breastfeeding women
and their children from birth to age 5. Alaska WIC provides nutrition information,
counseling, breastfeeding support, and periodic health screening, along with supplemental
food vouchers for infant formula and healthy foods. Children’s height and weight are
measured and recorded by a health care professional at clinics as part of the application
and renewal process. Alaska data are available at the United States Department of
Agriculture, Food and Nutrition Service website: https://www.fns.usda.gov/pd/wic-
program.
Maternity Practices in Infant Nutrition and Care (mPINC) Survey
In 2007, CDC administered the first national survey of maternity care practices related to
breastfeeding to every facility in the United States and territories that routinely provided
maternity care services. Known as the Maternity Practices in Infant Nutrition and Care
(mPINC) survey, this survey is a national census of facilities routinely providing maternity
care.
The initial survey established measures of practices in place at intrapartum care facilities
across the United States and territories and showed how the practices varied by state. CDC
administered the survey every other year thereafter until 2015 to monitor and examine
changes in practices over time. After the 2015 administration, CDC redesigned the survey
to reflect changes in maternity care practices that had occurred in the United States over
the past decade. The newly designed survey launched in 2018.
Each survey year CDC screens hospitals by telephone. CDC contacts the mother-baby nurse
manager or the manager of the labor and delivery unit to help identify the best person to
complete a survey that includes questions about infant nutrition, such as breastfeeding,
using formula to feed healthy newborns, and feeding routines. Because CDC follow this
process each time that we administer a new survey, the person identified to receive the
survey one year is not necessarily the person identified to receive the survey in a later
cycle.
Alaska Early Childhood Physical Activity, Nutrition and Obesity Facts Report Page 61
National Immunization Surveys (NIS)
Each year, CDC’s National Center for Immunizations and Respiratory Diseases (NCIRD), in
partnership with the National Center for Health Statistics, conducts the National
Immunization Survey (NIS). The NIS uses random-digit dialing to survey households with
children and teens. The telephone survey asks questions about childhood immunization.
Beginning in July 2001 and continuing through December 2002, a subsample of
respondents was asked about breastfeeding. Starting in January 2003, all respondents
with children aged 19 to 35 months are asked the breastfeeding questions.
The Council of American Survey and Research Organizations response rates for landline
sample of NIS years 2001–2017 ranged from 51.9% to 76.1%. Response rates for the
cellular telephone sample of NIS years 2011–2018 ranged from 24.6% to 33.5%. A more
detailed description of the methods can be found at the National Immunization Survey
website (https://www.cdc.gov/vaccines/imz-managers/nis/about.html).
Related Documents