Airport Strategic Stand Capacity Assess- ment Applied Through a Value-Focused Thinking Process Master’s Thesis H. El Uamari Technische Universiteit Delft

Welcome message from author
This document is posted to help you gain knowledge. Please leave a comment to let me know what you think about it! Share it to your friends and learn new things together.
Transcript

Airport Strategic Stand Capacity Assess-ment Applied Through a Value-FocusedThinking ProcessMaster’s Thesis
H. El Uamari
Tech
nisc
heUn
iversiteitDe
lft


Airport Strategic Stand CapacityAssessment Applied Through aValue-Focused Thinking Process
Master’s Thesis
by
Hamza El Uamari
to obtain the degree of
Master of Sciencein Aerospace Engineering
at the Delft University of Technology,to be defended publicly on Monday April 19, 2021 at 14:30.
Student number: 4357485Project duration: May 1, 2020 – April, 2021Thesis committee: Prof.dr.ir. J.M. Hoekstra TU Delft, Chair
ir. P.C. Roling, TU Delft, Supervisordr.ir. A. Bombelli TU Delft, Examiner
Cover image is taken from [59]
An electronic version of this thesis is available at http://repository.tudelft.nl/.


PrefaceDear reader,
This report delineates my graduation project titled ’Airport Strategic Stand Capacity Assessment Applied Through aValue-Focused Thinking Process’ as part of my graduation for the Master of Science in Aerospace Engineering at theDelft University of Technology. Over the past year, this project has led me to a more profound insight concerningairport operations and the power of mathematical optimisations. Furthermore, it has allowed me to get a better un-derstanding and improve my knowledge with respect to operations research techniques.
I would like to express my sincere gratitude towards my supervisor Paul Roling for giving me this opportunity and hissupport and guidance throughout the challenging period during which this thesis project has been conducted. Fur-thermore, I would like to thank Alessandro Bombelli for his helpful feedback during the different review meetings.
As this thesis report and my colloquium marks the end of my journey at the Delft University of Technology, I wouldlike to thank all the staff at the faculty of Aerospace Engineering for their dedication, knowledge base and opennesstowards their students. It was always fascinating to perceive the sparks of passion from all of you.
A special thanks to my family and friends for their support and encouragement throughout my student time. I want tocontribute this thesis to my mother and father, Karima and Hassan. They have always been by my side and supportedme throughout difficult times. No words can describe nor thank you for your encouragement and inspiration. Thankyou for educating me with dedication and learning me to always work hard for my dreams and to never give up.
H. El UamariDelft, April 2021
i


Contents
Preface i
List of Figures iv
List of Tables v
Nomenclature vi
Introduction vii
I Master of Science Thesis Paper 1
II Literature Study (previously graded under AE4020) 29
1 Literature Study Introduction 30
2 An Introduction to Airport Planning & Design 312.1 Airport Development Phases . . . . . . . . . . . . . . . . . . . . . . . . . . . . . . . . . . . . . . . 312.2 Conventional Master Planning . . . . . . . . . . . . . . . . . . . . . . . . . . . . . . . . . . . . . . 322.3 Adaptive Strategic Airport Planning . . . . . . . . . . . . . . . . . . . . . . . . . . . . . . . . . . . . 332.4 Conclusion . . . . . . . . . . . . . . . . . . . . . . . . . . . . . . . . . . . . . . . . . . . . . . . . 34
3 Review on Stand Capacity Assessment within Airport Design 353.1 Introduction into Strategic Planning and Capacity evaluation . . . . . . . . . . . . . . . . . . . . . . 353.2 Forecasting . . . . . . . . . . . . . . . . . . . . . . . . . . . . . . . . . . . . . . . . . . . . . . . . 363.3 Stand Capacity Within Airport Development . . . . . . . . . . . . . . . . . . . . . . . . . . . . . . . 393.4 The Apron System. . . . . . . . . . . . . . . . . . . . . . . . . . . . . . . . . . . . . . . . . . . . . 403.5 Aircraft Stands . . . . . . . . . . . . . . . . . . . . . . . . . . . . . . . . . . . . . . . . . . . . . . 413.6 Conclusion and Reflection . . . . . . . . . . . . . . . . . . . . . . . . . . . . . . . . . . . . . . . . 47
4 Review on Stand Capacity Assessment Procedures 484.1 Factors of influence . . . . . . . . . . . . . . . . . . . . . . . . . . . . . . . . . . . . . . . . . . . . 484.2 Analytical Stand Capacity Assessment Policies . . . . . . . . . . . . . . . . . . . . . . . . . . . . . . 504.3 Industry Methods . . . . . . . . . . . . . . . . . . . . . . . . . . . . . . . . . . . . . . . . . . . . . 514.4 Stand Capacity Assessment Performance Indicators . . . . . . . . . . . . . . . . . . . . . . . . . . . 514.5 Conclusion . . . . . . . . . . . . . . . . . . . . . . . . . . . . . . . . . . . . . . . . . . . . . . . . 51
5 Review on Modelling and Optimisation Frameworks 535.1 Optimisation Frameworks in Literature . . . . . . . . . . . . . . . . . . . . . . . . . . . . . . . . . . 535.2 Optimisation Objectives . . . . . . . . . . . . . . . . . . . . . . . . . . . . . . . . . . . . . . . . . 545.3 Optimisation Constraints . . . . . . . . . . . . . . . . . . . . . . . . . . . . . . . . . . . . . . . . . 565.4 Resolution Methods. . . . . . . . . . . . . . . . . . . . . . . . . . . . . . . . . . . . . . . . . . . . 585.5 Multi-Objective Optimisation . . . . . . . . . . . . . . . . . . . . . . . . . . . . . . . . . . . . . . . 605.6 Conclusion and Reflection . . . . . . . . . . . . . . . . . . . . . . . . . . . . . . . . . . . . . . . . 62
6 Conclusions 63
III Further elaboration on thesis work 64
A Extended Framework Input 65A.1 Stand Types . . . . . . . . . . . . . . . . . . . . . . . . . . . . . . . . . . . . . . . . . . . . . . . . 65A.2 Stand Sizes and Terminal Types . . . . . . . . . . . . . . . . . . . . . . . . . . . . . . . . . . . . . . 66A.3 Stand Compatibility and Allocation Principles . . . . . . . . . . . . . . . . . . . . . . . . . . . . . . 67A.4 Capital Cost . . . . . . . . . . . . . . . . . . . . . . . . . . . . . . . . . . . . . . . . . . . . . . . . 68A.5 Operational Cost . . . . . . . . . . . . . . . . . . . . . . . . . . . . . . . . . . . . . . . . . . . . . 69
ii
Contents iii
B Model Architecture 70
C Model Verification & Validation 72C.1 Verification . . . . . . . . . . . . . . . . . . . . . . . . . . . . . . . . . . . . . . . . . . . . . . . . 72C.2 Validation Strategy . . . . . . . . . . . . . . . . . . . . . . . . . . . . . . . . . . . . . . . . . . . . 75C.3 Validation Results . . . . . . . . . . . . . . . . . . . . . . . . . . . . . . . . . . . . . . . . . . . . . 77
D Sensitivity Analysis 83D.1 Cost Factors . . . . . . . . . . . . . . . . . . . . . . . . . . . . . . . . . . . . . . . . . . . . . . . . 83D.2 Time Factors . . . . . . . . . . . . . . . . . . . . . . . . . . . . . . . . . . . . . . . . . . . . . . . 84D.3 Robust Scheduling . . . . . . . . . . . . . . . . . . . . . . . . . . . . . . . . . . . . . . . . . . . . 85
E Model Data 86E.1 Aircraft Data . . . . . . . . . . . . . . . . . . . . . . . . . . . . . . . . . . . . . . . . . . . . . . . 86E.2 Stand Compatible Data . . . . . . . . . . . . . . . . . . . . . . . . . . . . . . . . . . . . . . . . . . 90E.3 Design Day Flight Schedule . . . . . . . . . . . . . . . . . . . . . . . . . . . . . . . . . . . . . . . . 92
F Recommendations for Further Research 93
Bibliography 95

List of Figures
2.1 Airport Development Phases [68] . . . . . . . . . . . . . . . . . . . . . . . . . . . . . . . . . . . . . . . . . . . 312.2 Flowchart of steps to be followed to obtain an airport master plan [38] . . . . . . . . . . . . . . . . . . . . 33
3.1 Strategic planning framework [78] . . . . . . . . . . . . . . . . . . . . . . . . . . . . . . . . . . . . . . . . . . 353.2 Overview of forecasting methods [41] . . . . . . . . . . . . . . . . . . . . . . . . . . . . . . . . . . . . . . . . 373.3 Peak hour passenger aircraft movements forecasting methodologies [41] . . . . . . . . . . . . . . . . . . . 393.4 Strategic planning framework [68] . . . . . . . . . . . . . . . . . . . . . . . . . . . . . . . . . . . . . . . . . . 403.5 Overview of airport systems [38] . . . . . . . . . . . . . . . . . . . . . . . . . . . . . . . . . . . . . . . . . . . 403.6 Overview of a general airport stand and its elements [71]) . . . . . . . . . . . . . . . . . . . . . . . . . . . . 413.7 Angled nose-in parking [44] . . . . . . . . . . . . . . . . . . . . . . . . . . . . . . . . . . . . . . . . . . . . . . 413.8 Angled nose-out parking [44] . . . . . . . . . . . . . . . . . . . . . . . . . . . . . . . . . . . . . . . . . . . . . 413.9 Parallel parking [44] . . . . . . . . . . . . . . . . . . . . . . . . . . . . . . . . . . . . . . . . . . . . . . . . . . . 423.10 Taxi-in, push-out parking [44] . . . . . . . . . . . . . . . . . . . . . . . . . . . . . . . . . . . . . . . . . . . . . 423.11 Representation of the simple concept in terminal design [44] . . . . . . . . . . . . . . . . . . . . . . . . . . 423.12 Representation of the linear concept in terminal design [44] . . . . . . . . . . . . . . . . . . . . . . . . . . . 423.13 Representation of the pier concept in terminal design [44] . . . . . . . . . . . . . . . . . . . . . . . . . . . . 433.14 Representation of the satellite concept in terminal design [44] . . . . . . . . . . . . . . . . . . . . . . . . . 433.15 Representation of the transporter concept in terminal design [44] . . . . . . . . . . . . . . . . . . . . . . . 433.16 Representation of the hybrid concept in terminal design [44] . . . . . . . . . . . . . . . . . . . . . . . . . . 433.17 Schematic representation of a stationary passenger loading bridge [44] . . . . . . . . . . . . . . . . . . . . 443.18 Schematic representation of an apron drive passenger loading bridge [80] . . . . . . . . . . . . . . . . . . 443.19 Example of swing stands at Melbourne International Airport [77]) . . . . . . . . . . . . . . . . . . . . . . . 453.20 Design of a MARS stand [79] . . . . . . . . . . . . . . . . . . . . . . . . . . . . . . . . . . . . . . . . . . . . . . 45
4.1 Schematic overview of a three-level pier design [2] . . . . . . . . . . . . . . . . . . . . . . . . . . . . . . . . 49
A.1 Design of a MARS stand [79] . . . . . . . . . . . . . . . . . . . . . . . . . . . . . . . . . . . . . . . . . . . . . . 66
B.1 Schematic representation of the model architecture . . . . . . . . . . . . . . . . . . . . . . . . . . . . . . . 71
C.1 Schematic overview of the flight assignments to stands in the base run. The colours depict the stand types 73C.2 Schematic overview of the flight assignments to stands in the MARS run . . . . . . . . . . . . . . . . . . . 74C.3 Schematic overview of the flight assignments to stands in the flight splitting run . . . . . . . . . . . . . . 75C.4 Schematic overview of the case-study set up . . . . . . . . . . . . . . . . . . . . . . . . . . . . . . . . . . . . 75C.5 Topology of the code to obtain the peak day flight movements . . . . . . . . . . . . . . . . . . . . . . . . . 76C.6 The number of flight movements per week in 2018 operated at Amsterdam Airport Schiphol as obtained
from the OAG data . . . . . . . . . . . . . . . . . . . . . . . . . . . . . . . . . . . . . . . . . . . . . . . . . . . 76C.7 The number of flight movements per day in week 21 (2018) operated at Amsterdam Airport Schiphol as
obtained from the OAG data . . . . . . . . . . . . . . . . . . . . . . . . . . . . . . . . . . . . . . . . . . . . . . 77C.8 Boxplots depicting the variations in the number of equipment for the different αCC cases for the base
cases (NF) and the cases in which the flight frequency is considered (WF) . . . . . . . . . . . . . . . . . . 82C.9 Boxplots depicting the variations in stand utilisation times for the different αCC cases for the base cases
(NF) and the cases in which the flight frequency is considered (WF) . . . . . . . . . . . . . . . . . . . . . . 82
D.1 Variation in the number of stands per type for the base case and the sensitivity analysis of the standcapital cost . . . . . . . . . . . . . . . . . . . . . . . . . . . . . . . . . . . . . . . . . . . . . . . . . . . . . . . . 83
D.2 Variation in the number of stands per type for the base case and the sensitivity analysis of the equipmentcapital cost . . . . . . . . . . . . . . . . . . . . . . . . . . . . . . . . . . . . . . . . . . . . . . . . . . . . . . . . 84
D.3 Variation in the number of stands per type for the base case and the sensitivity analysis of the operationalcost . . . . . . . . . . . . . . . . . . . . . . . . . . . . . . . . . . . . . . . . . . . . . . . . . . . . . . . . . . . . 84
D.4 Variation in the number of stands per type for the base case and the sensitivity analysis of the time factorsof the bussing and towing operations . . . . . . . . . . . . . . . . . . . . . . . . . . . . . . . . . . . . . . . . 85
D.5 Variation in the number of stands per type for the base case and the sensitivity analysis of the buffer times 85
iv

List of Tables
3.1 Aircraft Design Groups as defined by ICAO [45] [80] . . . . . . . . . . . . . . . . . . . . . . . . . . . . . . . . 463.2 Guidelines for gate types as defined by FAA [2] . . . . . . . . . . . . . . . . . . . . . . . . . . . . . . . . . . . 463.3 Wing tip clearances of different aircraft design groups as recommended by ICAO [80] . . . . . . . . . . . 46
A.1 Aircraft Design Groups as defined by ICAO [45] [80] . . . . . . . . . . . . . . . . . . . . . . . . . . . . . . . . 67A.2 Stand compatibility of contact and non-contact stands . . . . . . . . . . . . . . . . . . . . . . . . . . . . . . 67
C.1 Flight Schedule used for the Verification Runs . . . . . . . . . . . . . . . . . . . . . . . . . . . . . . . . . . . 72C.2 Verification results for the test schedule . . . . . . . . . . . . . . . . . . . . . . . . . . . . . . . . . . . . . . . 72C.3 Assignments of the flights to stands in the base run . . . . . . . . . . . . . . . . . . . . . . . . . . . . . . . . 73C.4 Assignments of the flights to stands in the MARS run . . . . . . . . . . . . . . . . . . . . . . . . . . . . . . . 74C.5 Assignments of the flights to stands in the flight splitting run . . . . . . . . . . . . . . . . . . . . . . . . . . 74C.6 Number of stands per type for the base case in which the αCC is altered from 0.05-0.99 in 19 steps. Ops
= Operational . . . . . . . . . . . . . . . . . . . . . . . . . . . . . . . . . . . . . . . . . . . . . . . . . . . . . . 78C.7 Number of equipment and movements for the base case in which the αCC is altered from 0.05-0.99 in 19
steps. NB = Narrow-Body, WB = Wide-Body, TT = Tow Truck . . . . . . . . . . . . . . . . . . . . . . . . . . . 78C.8 Average utilisation of the different stand types in minutes for the base case in which the αCC is altered
from 0.05-0.99 in 19 steps . . . . . . . . . . . . . . . . . . . . . . . . . . . . . . . . . . . . . . . . . . . . . . . 79C.9 Number of flights split into 2/3 phases, the area used and the percentage of flights assigned to an equiv-
alent stand size or to a larger stand size for the base case in which the αCC is altered from 0.05-0.99 in 19steps . . . . . . . . . . . . . . . . . . . . . . . . . . . . . . . . . . . . . . . . . . . . . . . . . . . . . . . . . . . 79
C.10 Model results for the case in which the αCC is altered from 0.05-0.99 in 19 steps and the weekly flightfrequency is considered. Ops = Operational . . . . . . . . . . . . . . . . . . . . . . . . . . . . . . . . . . . . 80
C.11 Number of equipment and movements for the case in which theαCC is altered from 0.05-0.99 in 19 stepsand the weekly flight frequency is considered . . . . . . . . . . . . . . . . . . . . . . . . . . . . . . . . . . . 80
C.12 Average utilisation of the different stand types in minutes for the case in which the αCC is altered from0.05-0.99 in 19 steps and the flight frequency is considered . . . . . . . . . . . . . . . . . . . . . . . . . . . 81
C.13 Number of flights split into 2/3 phases, the area used and the percentage of flights assigned to an equiv-alent stand size or to a larger stand size for the case in which theαCC is altered from 0.05-0.99 in 19 stepsand the flight frequency is considered . . . . . . . . . . . . . . . . . . . . . . . . . . . . . . . . . . . . . . . . 81
v

Nomenclature
List of AbbreviationsADG Aircraft Design Group
APM Adaptive policymaking
BB Branch and Bound
BC Branch and Cut
BIP Binary Integer Programming
CC Capital Cost
CPP Clique Partitioning Problem
DDFS Design day flight schedules
DSP Dynamic strategic planning
EASA European Aviation Safety Agency
FAA Federal Aviation Administration
FSP Flexible strategic planning
GAP Gate Allocation Problem
IATA International Air Transport Association
ICAO International Civil Aviation Organisation
KPI Key Performance Indicator
LP Linear Programming
MARS Multi-Aircraft Ramp System
MILP Mixed-Integer Linear Programming
MINP Mixed-Integer Nonlinear Programming
NB Narrow-Body
O&D Origin and Destination traffic
OC Operational Cost
PBB Passenger boarding bridge
PLB Passenger loading bridge
PO Pareto Optimal
RON Remain Overnight Stand
SAP Stand Allocation Problem
SPL Amsterdam Airport Schiphol
TT Tow truck
WB Wide-Body
WSM Weighted Sum Method
WSS Weight Space Search
vi

IntroductionStand capacity assessment is a key planning factor within airport development processes and is part of the demandand capacity analysis phase of an airport master plan. As the infrastructural and facility investments associated withairport stand capacity are substantial, airport stakeholders try to postpone or spread investments to mitigate associ-ated risks. The area used is an important factor in airport design and planning. One of the core objectives is to min-imise the land area used for developments and to take the needed area for future expansions into account. Differentmathematical optimisation models are to be found aiding aviation decision-makers within tactical and operationaltime frames. However, not many of the frameworks consider the stand capacity assessment problem within a strategictime frame. As different factors influence the needed stand capacity and the fact that in a strategic time frame, theairport infrastructure is not defined yet, a clear gap exists. This gap concerns an optimisation framework that incor-porates a trade-off between operational factors (robustness, flexibility, use of equipment), the use of specific standtypes (e.g. remote, contact, MARS), and area limitations into a single optimisation framework.
Therefore, this research’s main focus is developing a Mixed Integer Linear Programming optimisation model incorpo-rating the above objectives through a value-focused thinking process. The decision-maker defines the optimisationobjectives a priori, after which alternatives to comply with the set values are explored. The following research objectivehas been defined:
To define recommendations to improve current practices of Airport Stand Capacity Assessment within astrategic time frame, by developing an optimisation framework incorporating a trade-off between standtypes, operational factors (towing, robustness, flexibility) and area limitations through a value-focusedthinking process.
The research scope will be on the development of a mathematical optimisation framework that enables a decision-maker to obtain results considering the objectives and factors mentioned above. Forecasting flight schedules andrelated demand is not part of this scope. Furthermore, the research will focus on applying mathematical techniquesthrough a Mixed-Integer Linear Programming formulation, using exact algorithms to obtain solutions (which haveproven to work for strategic stand capacity in other researchers work). Multi-objective optimisation is part of the re-search scope. It will be investigated how a trade-off between two objectives can be made.
The following research questions have been defined and form the backbone of the thesis process. Research questions1 and 2 are answered through a literature study to support the research. Research question 3 relates to the definedoptimisation framework.
RQ1: Which relevant factors in airport design and planning influence the stand capacity problem in a strategic timeframe?Sub1-RQ1: How is stand capacity embedded in airport (master) planning?Sub2-RQ1: Which factors determine the characteristics of an aircraft stand?Sub3-RQ1: Which airport systems influence the stand capacity?
RQ2: What are the relevant criteria and objectives for assessing the stand capacity of an airport in a strategic timeframe?Sub1-RQ2: Which (operational) factors influence the stand capacity assessment in a strategic time frame?Sub2-RQ2: What are the objectives in stand capacity determination for strategic use?
RQ3: To what extent can strategic stand capacity assessment be aided by a framework allowing a decision-maker tomake a trade-off between optimising for stand types, operational factors and area limitations?Sub1-RQ3: Which methodologies and strategies can be distinguished for the modelling and optimisation of the standcapacity problem?Sub2-RQ3: What are current industry practices regarding strategic stand capacity assessment?Sub3-RQ3: What is the solution to a stand capacity problem after applying the optimisation framework?
The remainder of this thesis report is organised as follows: In Part I, the scientific paper is presented. Part II containsthe relevant Literature Study that supports the research. Finally, in Part III, further elaboration on the thesis work ispresented. In chapter A an extended description is given of the framework input, after which the architecture of thedeveloped model is elaborated upon in Chapter B. The methodology followed for the model verification and validation
vii

viii
is presented in Chapter C. The results of the model sensitivity analysis are discussed in Chapter D. An overview of themodel data is given in Chapter E. Finally, some recommendations for further research are described in Chapter F.

IMaster of Science Thesis Paper
1

Airport Strategic Stand Capacity Assessment Applied Through a Value FocusedThinking Process
Author: Hamza El Uamaria,Supervisor: ir. P.C. Rolinga
aFaculty of Aerospace Engineering, Delft University of Technology, HS 2926 Delft, The Netherlands
Abstract
Stand capacity assessment is an essential factor in airport planning and design due to the large investments associatedwith airport development. Fulfilling anticipated demand while still considering future growth is key in airport masterplanning. In this paper, a mixed-integer linear programming optimisation model is proposed, which determines thestand mix and needed operational equipment through a value-focused thinking process. The decision-maker defines apriori the optimisation objectives (what to optimise for and the factors incorporated within the optimisation), afterwhich different cases will be explored. The framework incorporates a trade-off between operational factors, differentstand types, area limitations and flight frequency through two objectives: capital cost and operational cost. A trade-offbetween the two objectives is made through weight factors, which results in a Pareto curve. The model is validatedthrough a case study performed using a design day flight schedule of Amsterdam Airport Schiphol. This paper showsthe implications of the trade-off between capital cost and operational cost, the drivers for flight splitting, the use ofswing stands, incorporation of area limitations and the implications of incorporating the weekly frequency of flightson the stand mix. It is recommended to apply the weighted sum method and the creation of Pareto curves to createa value-focused thinking process for a decision-maker. The availability of an optimisation framework, which allowsairport stakeholders and decision-makers to get insights into implications of strategic decisions on stand capacity inthe form of a trade-off between objectives and optimisation factors, will benefit the airport development process.
Keywords: Strategic Stand Capacity, Optimisation, MILP, Area Limitations, Airport Stands, Robust Scheduling,Stand Mix, Multiple Aircraft Receiving Stands, Flight Frequency
1. Introduction
Before the corona pandemic, which evolved during thefirst months of 2020 [1], the aviation industry was oneof the fastest growing industries in the world. Theexpected yearly growth in demand was set to around4.3% [2] [3]. Not only growth in air traffic demand wasexpected, but also an increase in the aircraft sizes wasanticipated [4]. One of the main objectives in airportdevelopment is the minimisation of the land used whilestill enabling the fulfilment of forecast demand andleaving room for any future expansions [5]. This stressesout the importance of proper demand and capacitydetermination for any of the airport systems. The standcapacity assessment plays a key role in the airport plan-ning and design process and is embedded in an airportmaster plan. Accurate planning and assessment of thecapacity are of key importance to mitigate associatedrisks. The objective is to avoid disinvestments and toassure that developments are just in time. However, theprocess is generally associated with high risks due tothe strategic time frame associated with the analysis.
To aid airport planners in determining the stand ca-pacity within a strategic time frame, the need arisesfor optimisation frameworks that determine the neededstand-mix and its associated area use. The applicationof mathematical optimisation models for strategic stand
capacity assessment is not well defined in the literature.Therefore, the following challenges with respect to standcapacity assessment within a strategic time frame areinvestigated in this paper:
1. Consideration of land area limitations: Minimisa-tion of the land area is key in the airport develop-ment process but is not considered in existing opti-misation frameworks.
2. Aid decision-makers in making a trade-off betweenoptimising for different stand types, operational fac-tors (towing, robustness and flexibility) and arealimitations.
3. Adaptation of a value-focused thinking approachin the optimisation framework: since the objec-tive in strategic stand capacity assessment is toproactively assess the implications of different deci-sions regarding the optimisation objectives; a value-focused thinking approach can be beneficial. In suchan approach, the decision-maker defines the objec-tives (values), after which alternatives that complywith the set values are explored [6].
In this paper, an optimisation framework is proposedemploying a Mixed Integer Linear Programming modelthat incorporates a trade-off between stand types,operational factors and area limitations. The objectiveof the proposed model is the determination of the
Delft University of Technology

number of stands (differentiated by type) which allowsfor the fulfilment of the expected air traffic demand andis optimised for user-specific objectives. Optimisationmodels that allow airport designers to make a trade-offbetween different optimisation objectives will help air-port designers obtain quick insights and make strategicdecisions.
The remainder of this paper considers the results from aliterature study in Section 2, in which an analysis is per-formed concerning the existing optimisation frameworksin the field of mathematical optimisation modelling ap-plied to stand capacity assessment. Furthermore, in Sec-tion 3, the research methodology is further elaboratedupon. This consists of the conceptual framework, themodel topology, the framework input, the mathematicalmodel formulation and the resolution method. Section4 describes the results of the proposed model throughan analysis of a case study performed using data fromAmsterdam Airport Schiphol. This paper is concludedin Section 5 with conclusions and recommendations.
2. Literature Survey
2.1. Airport Master Planning
The design and planning of airports is a very complexand time-consuming process without a single solution.Stakeholders involved in the decision-making process ofairport planning make use of different guidelines stipu-lated by aviation organisations such as the InternationalCivil Aviation Organisation (ICAO), the InternationalAir Transport Association (IATA) and the Federal Avi-ation Administration (FAA). The different phases of air-port planning are depicted in Figure 1.
Figure 1: Airport Development Phases [4]
An airport master plan encompasses the airport plan-ners’ ultimate vision of the development of the airport[7]. A master plan can be developed for both newand existing airports. As described by de Neufville[8] a master plan should involve the following threefactors: ultimate vision (a view of the long term futureof the airport), development (i.e. physical facilities onthe airside and landside such as runways and terminalbuildings) and consider a specific airport (not theregional or national aviation system).
For the master planning process different internationaland national guidelines are to be used from e.g.: ICAO[9] [7], EASA (CS-ADR-DSN) [10], FAA (for the UnitedStates) [11] and IATA [12]. Airport planners andother stakeholders aim for good strategic thinking andflexibility in the master planning process to make surethat the developed plans assess a wide range of scenariosand possibilities and thus are robust for different futurechanges [8]. This objective can be realised by creatingflexible and adaptable designs.
2.2. Optimisation Frameworks in Literature
Solving the assignment of aircraft to gates/stands is inthe literature also known as the Gate Allocation Prob-lem (GAP) or the Stand Allocation Problem (SAP).The first paper regarding GAP dates back to 1974 [13].Throughout the last decades, multiple solutions areproposed. The programming formulation of the modelsdepends on the objective variables (integer, binary,quadratic) and objective function (linear, non-linear).
The core objective of the SAP is the assignment ofaircraft/flights to a stand while optimising for costefficiency, passenger convenience and the operationalefficiency of the airport operations [14]. Many methodsare to be found regarding the modelling and optimisa-tion of the problem. Bouras [14] performed an extensiveliterature review regarding the state-of-the-art in thefield of GAP/SAP.
Lim et al. [15], Diepen et al. [16], formulated theproblem as an Integer Linear Programming (ILP) modelwith the objective of minimising the passenger walkingdistance. The research of Lim et al. [15] showed that anILP Solver (CPLEX) was outperformed in both runningtime and solution quality by heuristics.
A Binary Integer Programming (BIP) framework isused by Tang et al. [17] , Kumar and Bierlaire [18],Mangoubi and Mathaisel [19], Bihr [20], and Yan et al.[21]. These frameworks optimise either for the passengerwalking distance or the cost of assigning an aircraft toa stand. Mixed Integer Linear Programming (MILP)models are defined among others in literature by Bolat[22] [23], Seker and Noyan [24], Neuman [25], Guepet[26], Deken [27], Kaslasi [28], and Boukema [29]. Theobjective functions of these MILP models are relatedto minimisation of the range of slack times (the timebetween the two successive assignments of flights to astand), minimisation of the range of gate idle times,minimisation of buffer times, maximisation of aircraftassigned to contact stands and minimisation of towingmovements.
Mixed-Integer Nonlinear Programming (MINP) modelsare defined by Li [30] and Bolat [22]. Li [30] defineda model in which the number of gate conflicts of anytwo adjacent aircraft assigned to the same stand isminimised. In the model of Bolat [22] the variance ofgate idle times is minimised. For an extensive overview
2

of these methods and the associated papers, the readeris referred to the overview as presented by Bouras [14]and Boukema [29].
Not much of the investigated literature regarding theSAP/GAP and stand capacity assignment considersthe problem within a strategic time frame. Most ofthe research considers existing airport infrastructures.However, only two research papers are found whichconsidered the stand capacity assessment problemwithin a strategic time frame.
Boukema [29] described the strategic stand allocationproblem as a MILP model with the objective of min-imising the capital cost and operational cost relatedto the use of certain stand types. Boukema defined aframework in which the stand capacity is determined fora design flight schedule, after which a stand allocationmodel is optimised to allocate the flights to individualstands. In this research, no explicit area limitationshave been considered. However, the cost of a certainstand is based on its area, which is also minimised dueto the objective’s minimisation formulation. Kaslasi [28]also defined a stand capacity assessment model usinga MILP formulation in which both infrastructure costand allocation costs are minimised. The objective ofthe framework of Kaslasi is to minimise the number ofstands and their size. This is done by incorporating thestand sizes in the objective function.
2.3. Resolution Methods
Different resolution methods can be found in theliterature on SAP/GAP. Resolution methods canbe distinguished concerning the algorithmic methodused to find a solution to the defined optimisationproblem. The optimisation techniques applied in thestand capacity/allocation problem can be dividedinto three groups: exact algorithms, heuristics, andmeta-heuristics. Exact algorithms yield an optimalsolution [14] using different algorithms such as branch& bound, simplex, primal-dual and column generation.Heuristics are employed in case an optimal solutioncannot be attained within reasonable time. Meta-heuristics are used to capture a known drawback ofheuristics of reaching a local optimum and getting stuck.
Furthermore, to solve an optimisation model, a solver isneeded. A solver is a software type applying differentoptimisation principles such as branch & bound tosolve defined problems. In the literature regarding thestand allocation problem, commercial solvers such asCPLEX and Gurobi are mainly used. Research hasrevealed that CPLEX and Gurobi is able to solve MILPformulations of the stand allocation/capacity problemwithin reasonable time ([15], [31], [26], [29], [28], [25],[18]).
2.4. Multi-Objective Optimisation
In the early developments of stand allocation andcapacity assessment, the models were mainly formulatedwith a single objective (such as in Haghani [32]).Throughout the years, frameworks have been developed,which opened the need for multi-objective approachesto capture the problem’s complexity. As differentfactors influence the assessment and allocation problem,the challenge of multi-objective optimisation is findingan optimal solution based on a trade-off between thedifferent objectives (which might be conflicting). Inthe case of multi-objective optimisation, a ParetoOptimal (PO) solution should be sought. In a Paretooptimal solution no objective can be increased exceptby decreasing another one [33] [28].
Different methods for multi-objective optimisation aredescribed by Miettinen [33]. These methods are groupedinto four categories: no-preference methods, a posteriorimethods, a priori methods and interactive methods.In no-preference methods, the decision-maker does notplay a role. The decision-maker is presented a POsolution based on preset importance of the objectives.Multiple PO solutions are generated in a posteriorimethods. These solutions are subsequently presented tothe decision-maker. In a priori methods, the decision-maker defines the preferences regarding the objective.Interactive methods are highly-developed methods thatrequire a high involvement from the decision-maker todirect the solution process [33]. These methods generatefewer solutions with no interest for the decision-maker,reducing the information load presented [33].
2.5. Theoretical Relevance
The area used is an important factor in airport designand planning. The core objective is to minimise theland area used for developments and to take the neededarea for future expansions into account [34] [5]. Thisobjective is not found in almost any of the literatureon stand capacity assessment and allocation frameworks.
Based on the performed literature study, in which theresearch field of stand capacity assessment is investi-gated, it is concluded that many frameworks can be usedto model and solve the stand allocation problem. Thechosen objective functions mainly define the program-ming formulation. Only two studies considered the SAPwithin a strategic time frame (in which the capacity wasnot predetermined). As different factors influence theneeded stand capacity and the fact that in a strategictime frame, the airport infrastructure is not defined yet,a clear gap exists concerning an optimisation frameworkthat incorporates a trade-off between operational factors(robustness, flexibility, use of equipment), the use of spe-cific stand types (remote, contact, MARS etc.), and arealimitations into a single optimisation framework. Con-sideration of these factors through a value-focused think-ing process, in which the decision-maker defines the opti-misation objectives a priori after which possible alterna-tives to comply with the set values are explored, might
3
be beneficial for application within a strategic time frameframework.
3. Methodology
The proposed framework is based on a mixed-integerlinear programming formulation. As described inSection 2, stand capacity assessment is known in theliterature as the Stand Allocation Problem (SAP)or Gate Allocation Problem (GAP). The researchmethodology applied is depicted in Figure 2. Sincethis methodology is found throughout the paper, it willbe elucidated before we dive into the specifics of theproposed framework. The methodology followed can bedivided into four main blocks. The first block consists ofdesk research. The main objective of this was to assessthe state of the art with respect to airport design andplanning, stand capacity assessment procedures andmodelling and optimisation techniques. The results ofthis part are already elaborated upon in Section 2. Aspart of the experiment, an optimisation framework isdefined based on a mathematical model. The specificsof this mathematical model are defined in Section 3.4along with a description of the proposed model topologyin Section 3.2. Furthermore, the third block is centredaround the validation of the proposed framework.This is done through a case study in which the model’sperformance is assessed along with a sensitivity analysis.These three research blocks formed the basis of thedefinition of conclusions and recommendations withrespect to strategic stand capacity assessment.
In this section, first the conceptual framework will beelaborated upon in Section 3.1, followed by a descrip-tion of the model topology in Section 3.2. The inputof the framework will be discussed in Section 3.3. A de-scription of the mathematical optimisation model will bedescribed in Section 3.4, after which the section will beconcluded with an elaboration on the resolution methodused in Section 3.5.
Figure 2: Research Methodology followed
3.1. Conceptual Framework
In this research, a framework is proposed that is basedon a mixed-integer linear programming formulation.The proposed framework is based on two importantobjectives within stand capacity assessment, being thecapital cost of needed investments and the operationalcost of flight handling. It is chosen to adapt these twoas the model’s main objectives due to the strategictime frame linked to the decisions that have to be madewith respect to stand capacity in airport planning.
Since the airport infrastructure is not defined yet, themost profound objective is the cost. These costs arerelated to other optimisation objectives (values) thatare considered in the optimisation framework, such asthe area of the stands, the use of equipment etc.
A clear distinction has to be made between modelobjectives and optimisation objectives in this paper.The model objectives relate to the objectives usedin the objective function of the mathematical modelimplemented in the framework. On the other hand,the optimisation objectives refer to factors that areof importance to the decision-maker and that areconsidered in the framework.
The following optimisation objectives are part of the pro-posed framework:
1. Area Limitations: As described earlier, one of thekey objectives in stand capacity assessment is theminimisation of the area used. To capture the dy-namics of this optimisation objective, area limita-tions are considered in the proposed framework.
2. Robustness: Uncertainties characterise a strategicoptimisation time frame with respect to the quan-tity of anticipated demand as well as the fulfilmentof the anticipated demand. Robust scheduling isapplied in frameworks to capture the dynamics ofoperations concerning delays. This is done in theproposed framework through the implementation ofbuffer times (at the choice of the decision-maker).
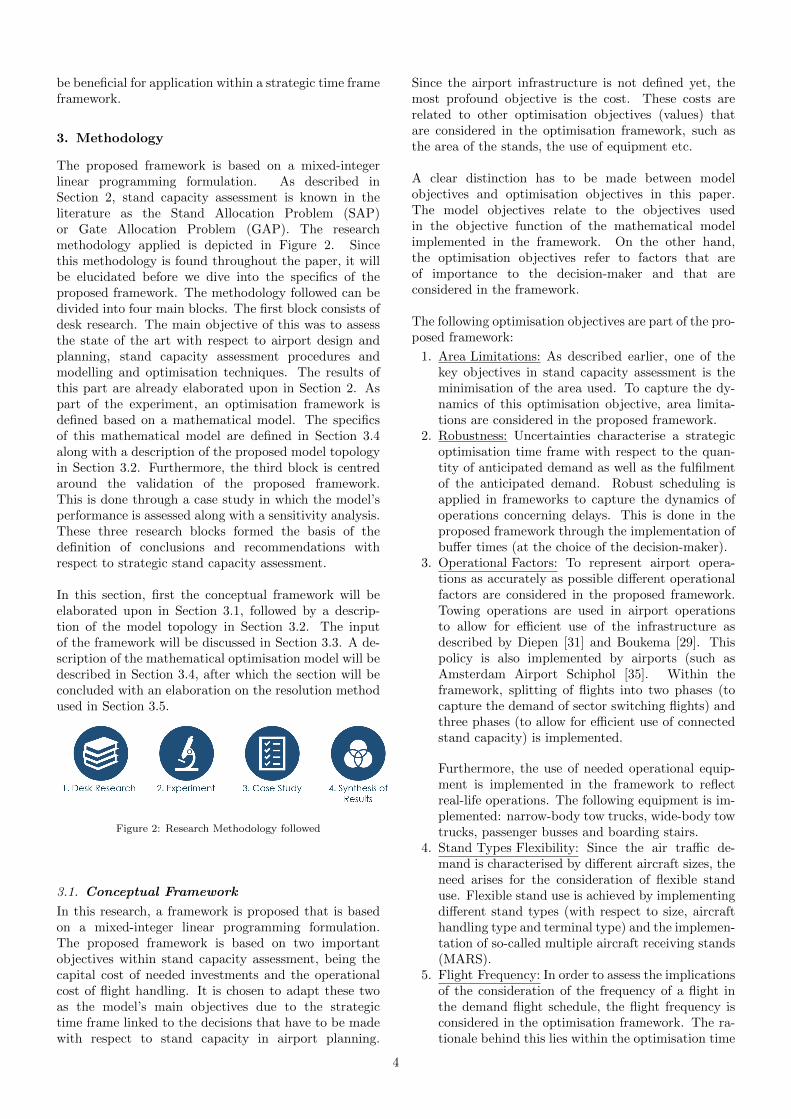
3. Operational Factors: To represent airport opera-tions as accurately as possible different operationalfactors are considered in the proposed framework.Towing operations are used in airport operationsto allow for efficient use of the infrastructure asdescribed by Diepen [31] and Boukema [29]. Thispolicy is also implemented by airports (such asAmsterdam Airport Schiphol [35]. Within theframework, splitting of flights into two phases (tocapture the demand of sector switching flights) andthree phases (to allow for efficient use of connectedstand capacity) is implemented.
Furthermore, the use of needed operational equip-ment is implemented in the framework to reflectreal-life operations. The following equipment is im-plemented: narrow-body tow trucks, wide-body towtrucks, passenger busses and boarding stairs.
4. Stand Types Flexibility: Since the air traffic de-mand is characterised by different aircraft sizes, theneed arises for the consideration of flexible standuse. Flexible stand use is achieved by implementingdifferent stand types (with respect to size, aircrafthandling type and terminal type) and the implemen-tation of so-called multiple aircraft receiving stands(MARS).
5. Flight Frequency: In order to assess the implicationsof the consideration of the frequency of a flight inthe demand flight schedule, the flight frequency isconsidered in the optimisation framework. The ra-tionale behind this lies within the optimisation time
4

frame that is adopted. As the stand capacity as-sessment is performed by considering a design flightschedule of the peak day, the frequency of flightmovements is not considered in the adopted cost.By incorporating the flight frequency in the objec-tive cost, the hypothesis is that the stand mix willbetter represent the use of the airport infrastruc-ture.
6. Stand Input: To aid a decision-maker in the decisionprocess and for validation purposes, it is needed tobe able to define the stand input a priori. This isimplemented in two ways: the number of stands asa hard input or a minimal input.
3.2. Model Topology
The proposed mathematical model can be visualisedthrough the conceptual schematic depicted in Figure 3.The schematic is divided into three parts. As describedin Section 3.1, the decision-maker is facilitated with afew optimisation choices. These consist of the choiceto include or exclude: the consideration of robustnessthrough buffer times, area limitations, multi-case simu-lation (to create a Pareto curve with a trade-off betweenoperational and capital cost), flight frequency and thestand input (either through a hard input or a minimalconstraining case).
A mixed-integer linear programming formulation isadopted in the proposed framework due to the char-acteristics of the defined stand capacity assessmentproblem. The stand capacity assessment problem’s ob-jective is formulated as the determination of the neededstand-mix to fulfil the anticipated demand in a strategictime frame. Therefore, the model’s output should be thenumber of stands per type (integer decision variable)and the assignment of a flight to a stand type (binary).As described in Section 3.1 the proposed framework alsoconsiders the equipment needed to fulfil the air trafficdemand. This is done in the form of decision variablesrepresenting the number of needed tow trucks andbusses. The proposed framework considers the capitalcost of the investments, which are related to the stands(the area, terminal and passenger boarding bridges),the tow trucks (capital cost), the busses (capital cost)and the area limitations (induced cost due to exceedingthe available area). Furthermore, the operational costis considered in the form of the cost needed to handlea flight at a specific stand. This includes the cost ofboarding stairs and the operational cost of tow truckoperations and bussing operations. The framework isimplemented in Python and optimised using the Gurobioptimiser. Upon literature research concerning thedifferent optimisation solvers, it is found that CPLEXand Gurobi are the best-suited solvers for the standcapacity problem. Due to the convenient connectionbetween Python and Gurobi, it is chosen to adaptGurobi as the optimisation solver. Furthermore, it ischosen to model the framework in Python due to theopen-source availability of the programming language.
The topology of the proposed framework is schemat-ically depicted in Figure 4. Different blocks can bedistinguished within the stand capacity assessmentmodel. The main block consists of the optimisationunit. This unit consists of the mathematical optimisa-tion model implemented through the objective functionand the needed constraints. In order to be able to runan optimisation, the model needs input data. Thisinput data consists of the design day flight schedule,the available stand types and their characteristics,and optimisation policies (such as the decision-makerschoice to include or exclude an objective but also theparameters used in the optimisation). By using a designday flight schedule, not only peak hour characteristicsare taken into account, but also the effective use ofstands over a longer time frame is considered.
The input data is partly fed by a database consistingof three parts. The first part consists of the stand data(the different stand types and their characteristics), theaircraft data (consisting of the design group an aircrafttype falls into) and airport data (consisting of thespecifics of each airport in the world). The airport datais obtained from https://ourairports.com/data/
and altered (addition of a Schengen, Non-Schengendesignator)
All of this is processed in a data processing unit.This unit’s objective is to read and store data, createoperations from the flight schedule, assess conflictingoperations, and create aircraft-stand compatibility data.After which, the optimisation is executed. The results ofthe optimisation are processed in the output unit in theform of solution dashboards, which the decision-makercan access.
The idea behind the defined topology and the concep-tual framework is the incorporation of a value-focusedthinking process in the optimisation framework. Avalue-focused thinking process can be distinguishedin four steps described by Keeney [6]. The first stepconsists of the objective definition. In this step, theimportant objectives for the decision-maker(s) aredefined, followed by a filtration step. In this secondstep, the goal is to assure that the defined objectivesare actually objectives. Following this, the alternativesare created, after which the possible alternatives areassessed.
This process is implemented in the following way in theproposed framework: the decision-maker defines a priorithe optimisation objectives (the values that are consid-ered in the optimisation) and, for example, constrainingfactors. By implementing a weighted sum method be-tween the two earlier defined objective parts (capital costand operational cost), the model can generate multiplealternatives. These alternatives are run in a multi-casesimulation, which implies a predefined range of factors,αCC (ranging from 0 to 1), for the capital cost and fac-tors 1 − αCC for the operational cost. This multi-caserun is then processed in a visualisation dashboard which
5

Figure 3: Conceptual Overview of the Optimisation Model
Figure 4: Model Topology
Figure 5: Schematic overview of the interactions between the de-cision maker and the optimisation model
depicts the Pareto curve (trade-off between capital andoperational cost) and the characteristics of a chosen spe-cific alternative. The decision-maker can then decideon a specific alternative, which can be further analysedthrough a single case run (obtain extensive output datafor a single choice of αCC). The interactions betweenthe decision-maker and the optimisation model are sim-
plified in Figure 5.
3.3. Framework Data
As described in Section 3.2, the defined framework usesdifferent data sets, such as the different stand types, thedifferent cost factors used in the optimisation and thepolicies implemented (such as stand allocation princi-ples).
3.3.1. Stand Types
Within the framework, 35 different stand types areconsidered. A differentiation is made with respect tothree factors: the handling type, terminal type and thestand size. Five types can be distinguished concerninghandling type: contact stands (connected handling ofpassengers using a passenger boarding bridge), non-contact stands (stands close to the terminal withoutconnected handling of passengers), remote operationalstands, remote non-operational stands (used for theparking of aircraft) and multiple aircraft receivingstands (MARS). MARS stands are capable of handlingtwo narrow-body aircraft simultaneous or a singlewide-body aircraft.
6

Three different terminal types are considered withinthe framework: domestic (Schengen), international(Non-Schengen) and swing terminals. Large airportsexperiencing flights with different origins and desti-nations require efficient handling of flights flying todifferent areas (with different customs and immigrationregulations). Swing stands are a versatile solution tothis problem. These stands can accommodate flightswith different origins and destinations (domestic andinternational), through a multi-level terminal design,which allows the separation of passenger flows ondifferent levels through sterile corridors [36]. Thesestands allow for efficient use for sector switching flightsand cross utilisation of the available infrastructure (usefor a specific sector during peaks).
To allow for a distinction with respect to aircraft type,four different stand sizes are considered: C, D, E and F.These are linked to the aircraft design groups (ADGs)as defined by ICAO [9]. The characteristics of the 35different stand types are depicted in Table A.3.
3.3.2. Cost Factors
The proposed framework considers two main objectives:the capital cost of investments and the operational costassociated with the assignment of flights to a compatiblestand.
Capital CostThe capital cost implemented can be split into threemain parts: the investment cost associated with thestands, the equipment needed and the cost for exceedingthe area limitation. The capital cost of the standsconsists of the need for passenger boarding bridges,the stand area and the terminal needed. The area of astand is modelled by incorporating the terminal area,the aircraft parking area and the taxiway area. Thecost are based on literature research ([29], [37], [38])and the analysis of policies implemented at referenceairport ([35]. In the definition of the areas, the fol-lowing requirements have been implemented: wingtipclearances [36], nose to building clearances [36] and thetaxi lane to object clearance [36]. The definition of theunderlying capital costs of the different stand types isdepicted in Table A.4 in AppendixAppendix A. Thestands’ capital cost is determined using a depreciationperiod of 20 years [39].
As described above, the cost of busses and tow trucksis considered within the optimisation framework. Anoverview of the capital cost of the equipment is depictedin Table B.5 in AppendixAppendix B. The capital costof the equipment is determined using a depreciation of10 years.
Operational CostThe operational cost is linked to the cost associated withthe assignment of a flight operation to a specific stand.The operational cost can consist of the cost for boardingstairs, busses and tow trucks. The operational cost isdefined through three main factors: the electricity/fuel,
the personnel and maintenance cost. An overview ofthe operational cost factors is depicted in Table B.6 inAppendix Appendix B.
3.3.3. Allocation Principles
The compatibility of a flight to a stand is determinedbased on three aspects: the aircraft size (limitingthe compatible stand size), the origin airport andthe destination airport (defining the flight sector andthe compatible terminal). One would expect that anaircraft is compatible with any stand size larger thanthe aircraft design group of the aircraft. However, this isnot the case for the contact stands. Due to restrictionsconcerning the slope of passenger boarding bridges [40],a type C aircraft is only compatible with type C and Dcontact stands.
As described in Section 3.1, flight splitting is imple-mented in the framework to allow for the efficientallocation of flights to stands. Two types of flight split-ting are considered. The first type is a two-split (arrivaland departure part) for aircraft with a turnaround timeof minimum 120 minutes. The second implementedtype is a three-split (arrival, parking and departurepart) version. Flights are eligible for a three split ifthe turnaround time is minimum 170 minutes. Thesepolicies are determined upon analysis of the principlesimplemented at Amsterdam Airport Schiphol [35].To assure the model performs no unnecessary twosplits, the towing cost of non-sector switching flightsis penalised by a factor of two. In line with the policybehind flight splitting, the assignment of split phasesof a flight to remote stands is prohibited within themodel. The parking phase of a three split operation canbe assigned to a remote operational stand or a remotenon-operational stand (which can only be used for flightparking).
Furthermore, busses are needed for passenger trans-porting to and from remote stands. The capacity of thebusses is set to 55 passengers per bus (based on analysisof reference airport). Furthermore, an assumption hadto be made regarding the task scheduling time (thetime a bus is occupied with a specific flight operation).This is set to 20 and 30 minutes for narrow-body andwide-body aircraft, respectively. For the arrival part,busses are assigned at the scheduled arrival time of aflight, while for the departure part, busses are assigned45 minutes before the scheduled departure time. Dueto the complexity associated with the assignment ofbusses to departure parts of a flight (passengers are notat the same time at the same place), it is decided topenalise the assignment of busses to departure partsof a flight by a factor of 1.5. This is also based uponother research performed in the field of strategic standcapacity assessment [29],
Tow trucks are needed for the departure pushback ofaircraft as well as the towing of flights that are split. Incase of a two split, the following policy is implemented:aircraft are towed away 40 minutes after departure to
7

a second stand. In case of a three split, an aircraftis towed to a remote parking stand 60 minutes afterarrival and is towed back to an operational stand 60minutes before departure. Also, for the tow trucks,an assumption had to be made regarding the taskscheduling time of tow trucks (the time a tow truck isoccupied with a task). This is set to 15 minutes fornarrow-body aircraft and 20 minutes for wide-bodyaircraft. The implication of this assumption will also beanalysed through a sensitivity analysis.
For full cargo flights, it is chosen not to implement dedi-cated cargo stands, but to handle these flights at remoteoperational stands. This policy is chosen due to a lackof developed airport plans associated with the strategictime frame of this framework.
3.4. Mathematical Model Formulation
The proposed optimisation framework is implementedthrough a mathematical model definition. This mathe-matical model is defined around decision variables andsets, an objective function and the necessary constraints.
3.4.1. Decision Variables and Sets
As described in Section 3.1, the defined framework iscentred around two main objectives: the capital cost ofinvestments and the operational cost.
SetsO = {1, .., i}: Set of operationsO2 = {1, .., i}: Set of operations eligible for a two splitO3 = {1, .., i}: Set of operations eligible for a three splitT = {1, .., t}: Set of unique arrival times of all theoperationsTB = {1, .., tB}: Set of unique start times of bussingoperationsTT = {1, .., tT }: Set of unique start times of towingoperationsOt = {1, .., i}: Set of operations i which are conflictingat time tOtf = {1, .., i}: Set of operations i in phase f which areconflicting at time tOtBA
= {1, .., iBA}: Set of arrival bussing operationsiBA which are conflicting at time tBOtBD
= {1, .., iBD}: Set of departure bussing operationsiBD which are conflicting at time tBOtTDp = {1, .., iT }: Set of departure towing operationsiTD which are conflicting at time tT for tow truck typepOtT2Tp
= {1, .., iT }: Set of two split towing operationsiT2T (towing to departure stand) which are conflictingat time tT for tow truck type pOtT3Tp
= {1, .., iT }: Set of three split towing operationsiT3T (towing to parking stand and departure stand)which are conflicting at time tT for tow truck type pS = {1, .., j}: Set of stand typesSi ∈ S: Set of stand types compatible with operation iSM ∈ S: Set of MARS type standsSNM ∈ S: Set of Non-MARS type standsSB ∈ S: Set of stands that need bus operationsF = {Nosplit, A2, D2, A3, P3, D3}: Set of phases (no
split, arrival two split, departure two split, arrival threesplit, parking three split, departure three split)FBA = {Nosplit, A2, A3}: Set of bus arrival phases (nosplit, arrival two split, arrival three split)FBD = {Nosplit,D2, D3}: Set of bus departure phases(no split, departure two split, departure three split)FTD = {Nosplit,D2, D3}: Set of departure push-backphases (no split, departure two split, departure threesplit)FT3T = {P3, D3}: Set of three split tow phases (threesplit parking, three split departure)P = {NB,WB}: Set of tow trucks (narrow-body,wide-body)
Decision VariablesXij : Binary decision variable representing if operation iis assigned to stand type jXi2Aj : Binary decision variable representing if thearrival part of the two split version of operation i isassigned to stand type jXi2Dj : Binary decision variable representing if thedeparture part of two the split version of operation i isassigned to stand type jXi3Aj : Binary decision variable representing if thearrival part of the three split version of operation i isassigned to stand type jXi3Pj : Binary decision variable representing if theparking part of three the split version of operation i isassigned to stand type jXi3Dj : Binary decision variable representing if thedeparture part of three the split version of operation iis assigned to stand type jYj : The number of stands needed of type j (Integer)B: The number of busses neededTTNB : The number of narrow-body tow trucks neededTTWB : The number of wide-body tow trucks neededAC1: The area assigned to block 1 of the area limitoptimisation (Integer)AC2: The area assigned to block 2 of the area limitoptimisation (Integer)AC3: The area assigned to block 3 of the area limitoptimisation (Integer)V 1i: Binary decision variable defining the choice for theno split version of operation iV 2i: Binary decision variable defining the choice for thetwo split version of operation iV 3i: Binary decision variable defining the choice for thethree split version of operation i
Parametersocij : The operational cost of assigning operation i tostand type joci2Aj : The operational cost of assigning the arrival partof the two split version of operation i to stand type joci2Dj : The operational cost of assigning the departurepart of the two split version of operation i to stand typejoci3Aj : The operational cost of assigning the arrival partof the three split version of operation i to stand type joci3Pj : The operational cost of assigning the parkingpart of the three split version of operation i to stand
8

type joci3Dj : The operational cost of assigning the departurepart of the three split version of operation i to standtype jccj : The capital cost of stand type jcB : The capital cost of the bussesccTTNB : The capital cost of a narrow-body tow truckccTTWB : The capital cost of a wide-body tow truckc1: The cost induced for the available area (which is 0)c2: The cost induced for the available area at the cost ofpavementc3: The cost induced for the available area at the cost ofpavement and land area purchasingai: MARS stand parameter, 0.5 for a narrow-body air-craft and 1 for a wide-body aircraftareaj : The area of stand type jBusiA : The number of busses needed for the arrival partof operation iBusiD : The number of busses needed for the departurepart of operation i
3.4.2. The objective
The model’s objective function is centred around min-imising the capital cost (CC) and operational cost (OC).Since research within the field of strategic stand capac-ity assessment has revealed that the choice regarding thestand mix implemented at an airport is based on a trade-off between these two, it is decided to implement thesetwo costs through a multi-objective perspective. This isdone by the assignment of a factor αCC to the capitalcost and subsequently the assignment of a factor 1−αCCto the operational cost as depicted in Equation 1.
min[αCC · CC + (1− αCC) ·OC] (1)
The terms of the capital cost are depicted in Equation 2.This consists of the capital cost of the stands (the firstterm), the capital cost of the narrow-body and wide-body tow trucks (the second and third term, respec-tively) and the cost for exceeding the area limitation(the fourth term).
CC = (∑
j ∈Sccj ·Yj) + (cB ·B) + (cTTNB · TTNB)
+ (cTTWB · TTWB)+
(c1 ·AC1 + c2 ·AC2 + c3 ·AC3)(2)
As described earlier in this paper, the operational costis considered through the cost implied by assigning anoperation to a stand type. This is further divided intothe cost for the two and three split versions of an opera-tion. The mathematical formulation of this objective isdepicted in Equation 3.
OC = [∑
i∈O
∑
j∈Si
ocij ·Xij
+∑
i∈O2
∑
j∈Si
(oci2Aj ·XiA2j + oci2Dj ·XiD2j)+
∑
i∈O3
∑
j∈Si
(oci3Aj ·XiA3j + oci3Pj ·XiP3j + oci3Dj ·XiD3J)]
(3)
3.4.3. Constraints
In order to represent real life operations and restrictingfactors, different constraints are implemented to con-strain the defined optimisation model. These will beelaborated upon in the following subsections.
Constraint set 1 - Flight Assignment to StandThe first set of constraints relates to the assignmentof each operation to a single stand. As described inSection 3.1 the flights with a long turnaround time canbe split into two or three phases. To assure that onlyone of the three possible versions of a flight is chosenand that each of the phases of the version is assigned toa stand, the following sets have been defined. First ofall, Equation 4 defines that only one of the version ofoperation i is used. Furthermore, Equation 5 restrictsthe assignment of operation i to a compatible stand ifthe no split version is chosen. The same logic is appliedfor the two split and three split versions. Equations6 assure that both the arrival and departure part ofoperation i are assigned to compatible stands, whileEquations 7 do the same for the three split versions.
It has been chosen to define the aforementioned restric-tions through multiple equations instead of a single equa-tions upon the literature study that has been performedas part of this research. It has been proven that a sin-gle equation formulation results in a longer run timecompared to the restrictions as imposed by the multi-ple equations [29].
V1i + V2i + V3i = 1
∀i ∈ O (4)
∑
j∈Si
Xij − V1i = 0
∀i ∈ O (5)
∑
j∈SiA2
XiA2j − V2i = 0
∑
j∈SiD2
XiD2j − V2i = 0
∀i ∈ O2, O3
(6)
9

∑
j∈SiA3
XiA3j − V3i = 0
∑
j∈SiP3
XiP3j − V3i = 0
∑
j∈SiD3
XiD3j − V3i = 0
∀i ∈ O3
(7)
Constraint 2 - Overlap of Operationsand Dynamic Stand CapacityThe second set of constraints has two objectives: assur-ing that there is no overlap between operations assignedto a stand and that a sufficient number of stands isacquired.
To assure that there is no overlap between the assign-ment of flights to stands, the assignment of conflictingoperations to the same stand has to be restricted.This is where the time factor has to be considered.Within the literature on stand capacity/allocationassessment, two methodologies are to be found. Insingle-time slot models conflicting flights are defined,after which the model is constrained to only allocatea single flight from a set of conflicting flights [41] [42].Multiple-time slot models consider the entire time-frameof flights by defining a fixed number of time slots [42].A drawback of multiple-time slots is the influence onstand utilisation and the fact that these models areless exact compared to the single-time slot models.Furthermore, due to the increase in decision variables inmultiple-time slot models, the running time of the mod-els also increases rapidly. Research performed by Deken[27] revealed that the running time for a multiple-timeslot model is double the time for a single-time slot model.
Therefore, it has been chosen to adapt the followingmethodology (which can be linked to the single-time slotmodels): first the unique arrival times of all the opera-tions within the flight schedule are defined, from whichfor each unique arrival time conflicting operations are as-sessed. This is done for each phase f ∈ F . The conflictingsets are linked to these phases (Otf). In the definitionof this constraint, it is constrained that sufficient standsare acquired for each of the unique arrival times (basedon the number of conflicting operations assigned to thesame stand type). Lastly, a distinction has been maderegarding non-MARS Stands (Equation 8), and MARSStands (Equation 9), due to the policy implemented forMARS stands. These stands are capable of handlingtwo narrow-body aircraft or a single wide-body aircraftat the same time. Therefore, an alternative formulationis implemented for the MARS stands consisting of a pa-rameter (ai), which defines each narrow-body aircraft as0.5. Since no half stands can be built, the number ofneeded stands is rounded up.
∑
f∈F
∑
i∈Otf
Xifj − Yj ≤ 0
∀t ∈ T, j ∈ SNM(8)
∑
f∈F
∑
i∈Otf
ai ·Xifj − Yj ≤ 0
∀t ∈ T, j ∈ SM(9)
Constraint 3 - Area LimitationTo consider imposed area limitations separately, it ischosen to model these through the addition of an ad-ditional set of constraints. Area limitations are consid-ered through a split into three parts. The first part islinked to the integer decision variable AC1, representingthe area available at no penalty cost. The limit to thisarea is constrained through the second equation in Equa-tion set 10. The same policy is implemented for the areaavailable at the cost of pavement (AC2, with a cost c2 of110 euro/m2 based on an average cost for pavement inairport development [43]) and the area available at thecost of purchasing (set to 150 euro/m2) and pavement(AC3). To assure that the area assigned to AC1, AC2
and AC3 is equal to the total area of the assigned num-ber of stands per type, the first equation of Equation set10 is defined.
AC1 +AC2 +AC3 −∑
j∈Sareaj · Yj = 0
0 ≤ AC1 ≤ 100000
0 ≤ AC2 ≤ 100000
0 ≤ AC3 ≤ 100000
(10)
Note:The decision-maker defines if this constraint set is usedin the optimisation model or not. The implications ofconsideration of this constraint are assessed in the casestudy of this research.
Constraint 4 - Bussing OperationsBussing operations are needed for aircraft assigned toremote stands. The number of busses needed for thearrival and departure parts is predetermined throughBusiA and BusiD. Bus operations are created based onthe arrival and departure times of a flight, consideringthe policy described in 3.3. This constraint set aimsto assure a sufficient number of busses is acquired inthe model by considering conflicting bus operations anddynamic bus capacity. Therefore, the same policy as forthe aircraft stands (constraint set 2) is implemented toconsider the time factor to ensure no overlap betweenbus operations.
From the created bus operations, all the unique start-ing times are obtained. For each of the unique startingtimes, it is analysed which bus operations are conflict-ing. For each of the unique starting times, a constraintis added consisting of all the conflicting operations atthe specific time. The number of busses is linked tothe maximum number of assigned conflicting bus oper-ations. This is considered through the decision variableXifBAj . The fBA and fBD parts refer to the consideredphase from the bus arrival and bus departure phases.
10

Equation 11 depicts the mathematical form of the busconstraint. It considers the arrival and departure opera-tions for each of their specific phases that are conflictingat all the unique starting times (t ∈ TB) of the assignedbus operations.
∑
fBA∈FBA
∑
OtBA
∑
j∈SB
BusiA ·XifBAj+
∑
fBD∈FBD
∑
OtBD
∑
j∈SB
BusiD ·XifBDj −B ≤ 0
∀t ∈ TB
(11)
Constraint 5 - Towing OperationsTo facilitate departure pushbacks and aircraft towing,sufficient tow trucks must be considered in the opti-misation model. The same policy as adapted for thebusses and stands is implemented for the tow trucks.The difference lies within the two sets of tow trucks(narrow-body and wide-body tow trucks). Equation12 depicts the constraint’s mathematical formulation,assuring sufficient tow trucks are considered within theframework.
As for the busses, tow truck operations have been cre-ated, from which all the unique starting times are ob-tained. These times (t ∈ TT ) are used to define the con-flicting operations. For each of the times, a constraint isadded for each of the tow truck types (p ∈ P ). This con-straint consists of three parts. The first part considersall the departure pushback operations (which apply forthe departure tow phases fTD ∈ FTD) that are conflict-ing (OtTDp) at time t ∈ TT for tow truck type p ∈ P ).The second part consists of the towing operations of twosplits to the departure stand. The third part considersthe three split tows, consisting of two phases (tow toparking and tow to departure stand).
∑
fTD∈FTD
∑
i∈OtTDp
∑
j∈SXifTDj +
∑
i∈OtT2T p
∑
j∈SXiD2j+
∑
fT3T∈FT3T
∑
i∈OtT3T p
∑
j∈SXifT3Tj − TTp ≤ 0
∀t ∈ TT ,∀p ∈ P(12)
Constraint 6 - Stand Capacity Hard InputIt is desirable to be able to assess the results of real-life implemented cases through a fixed stand mix. Ahard input of the stand mix for a known case can alsobe used to fine-tune the optimisation model’s parametersettings (to obtain the parameter set that represents thereal-life case best). Furthermore, in order to be ableto perform a case study to assess how a real-life caseperforms compared to the model results, it is necessaryto be able to use the stand mix as hard input. Therefore,the constraint as depicted in Equation 13 is defined inthe optimisation model. To also facilitate a minimumstand capacity case (a minimum number of stands of aspecific type), the constraint as depicted in Equation 14is also implemented.
Yj − capj = 0
∀j ∈ S (13)
Yj −min capj ≥ 0
∀j ∈ S (14)
Note:The decision-maker defines if this constraint set isused in the optimisation model. The implications ofconsidering this constraint are assessed in the case studyof this research.
Flight Frequency UnitA flight frequency unit is implemented in the developedmodel to assess the effect of incorporating the weeklyflight frequency on the stand mix within the framework.This unit can be turned on or off. It incorporatesthe weekly flight frequency in the operational costassigned to an operation as depicted in Equation 15.OCFrequencyCost is the operational cost incorporatingthe weekly frequency of the operation, f the weeklyfrequency of a flight movement and OCcost the dailyoperational cost.
It has to be noted that a weekly time frame is used forthe operational cost in this unit. To make sure that thecapital cost also reflects a weekly time frame, the capitalcost is increased to a weekly cost (multiplication by 7).
OCFrequencyCost = f ·OCcost (15)
3.5. Resolution Method
The mathematical model defined in Section 3.4 isimplemented in Python and solved through the GurobiOptimizer. The performed literature study has revealedthat the stand capacity problem can be modelled andsolved differently. Research performed by Bouras [14]showed that a binary integer formulation could bebest solved using the primal simplex algorithm. Thisis also validated in the research performed by Diepenand Hoogeveen [16], Boukema [29] and Kaslasi [28].As described in Section 2 (Resolution Methods), whenthe primal simplex algorithm is not sufficient to solvea defined problem within a reasonable time, heuristicscan be employed.
Within the optimisation toolbox of Gurobi, differentbuilding blocks are used to solve an optimisation prob-lem. The first method used by the Gurobi optimiseris an LP Presolve. This method aims to reduce theproblem size to speed up linear algebra during thesolution process. This is done through the reductionof redundant constraints and substitution. The secondmethod explored is the LP relaxation. In this method,the integrality constraint is relaxed.
Within the literature on operations research techniques,the branch-and-bound algorithm is well-known. Withinbranch-and-bound subproblems are assessed by drop-ping the integrality constraint, after which a solution
11

tree is created. Solutions are explored until there areno better solutions considering all the set constraints[44]. Furthermore, cutting planes can be used to reducethe feasibility region without compromising any feasiblesolutions. The goal of the branch-and-bound andcutting planes methods is to reduce the needed time toobtain an optimal solution.
The Gurobi optimiser [45] employs a hybrid method thatcombines both the branch-and-bound and cutting planesmethods. This is called the branch & cut method. Thecutting planes approach is applied before the branch-ing step in the branch-and-bound algorithm. Withinthe cutting plane method, cutting plane constraints aregenerated (through, e.g. Gomory cuts, Flow cover cuts,Lift-and-project cuts and zero-half cuts [45]) and addedto the LP relaxation, in which fractional optimal solu-tions of the root problem are explored while keeping allinteger solutions intact. By applying this method, thealgorithm computes the gap between the lower and up-per bound. Optimality is proven once these have thesame value (and thus, a gap of 0% is found).
4. Results
The following section will dive into the results of theresearch. It is kicked off with a description of the veri-fication and validation methodology used in Section 4.1,followed by an analysis of the used input data in Sec-tion 4.2. Furthermore, in Section 4.3 the results of theperformed case studies will be presented, after which themodel performance will be analysed in Section 4.4.
4.1. Verification and Validation Methodology
The proposed framework is verified in the followingway: quality control (by assessment of the efficiencyand clarity of the code), code verification (verificationof parts of the code using numerical cases with a knownoutput) and system verification (verification of theframework through a numerical case). For an extensiveoverview of the verification cases and their results, thereader is referred to the accompanying thesis report.
In order to assess the performance and results of theproposed optimisation framework, a case study hasbeen set up. The goal of the case study was to validatethe capabilities of the proposed framework to define theanticipated stand-mix for an airport based on a designday flight schedule.
As described in the methodology part of this paper,the optimisation framework uses a flight schedule todetermine the needed stand-mix and equipment. Totest the model for an existing airport, it is chosen to useAmsterdam Airport Schiphol as the case study airport.This airport has been chosen due to the availability offlight data, stand data and the short line of connectionbetween the Delft University of Technology and theairport.
The raw input data for the case study consists of twoparts: flight movement data as obtained from the OAGdatabase for the year 2018 and the stand mix. Theflight movement data is analysed for the number ofmovements per week for the year 2018 as well as for thepeak day. According to the analysis performed, week 21was the peak week in 2018. From the peak week, thepeak day is obtained. This resulted in the definition ofMonday 21 May as the peak day for the year 2018. Thisis validated using flight data obtained from AmsterdamAirport Schiphol.
The peak day is represented by 1583 flight move-ments as obtained from the OAG database. Usingan in-house developed flight movement pairing model(which matches arrival and departure flight move-ments amongst others based on the turnaround time,aircraft type, and airline), pairings are created forthe flight movements. This resulted in 769 pairings(of which 80 are overnight pairings). These pairingshave been validated using a developed pairing algorithm.
The case study has been performed through three steps.First, the input data is analysed to understand thespecifics of the input design day flight schedule. An anal-ysis of different predefined cases follows this. In each ofthe cases, different parts of the optimisation model aretested or compared. The case study is concluded with asensitivity analysis.
4.2. Data Analysis
4.2.1. Input Flight Schedule
As described in Section 4.1, a design day flight schedulehas been created based on the peak day flight movementsat Amsterdam Airport Schiphol in 2018. This resultedin 769 pairings (1583 flight movements). The number ofarrivals and departures throughout the day are depictedin Figure 6. The flight schedule is characterised byalternating arrival and departure peaks. In the morning,most of the transatlantic flights arrive between 06:00and 08:00, while the short-haul flights arrive between08:00 and 09:00. The peak between 09:00-10:00 isdue to the the departing transatlantic and short-haulflights (this is also the largest departure peak of the day).
Figure 7 depicts the air traffic demand throughout theday with differentiation in aircraft size. It is visible thatat the start of the day, the large aircraft (ICAO AircraftDesign Group E) arrive. It can be seen in Figure 8 thatthese flights arrive from Non-Schengen destinations anddepart to Non-Schengen destinations. Furthermore, itcan be seen that the most significant part of the flightmovements is operated by type C aircraft. Around 22%of the flights switch between sectors from their arrival totheir departure.
4.2.2. Stand Data
To assess the performance of the model based on theoperations at Amsterdam Schiphol Airport (SPL), theavailable stands are needed. The available stand types
12

Figure 6: Number of arrivals and departures throughout the day of the input flight schedule
Figure 7: Case study flight schedule air traffic demand throughoutthe day with a differentiation in aircraft size
Figure 8: Case study flight schedule air traffic demand throughoutthe day with a differentiation in flight sector (NS: Non-Schengen,S: Schengen, first part is the origin sector, the second part is thedestination sector)
are obtained from Amsterdam Airport Schiphol (SPL)and translated back to the stand types implemented inthe proposed framework. For this, some assumptionshave been used. First of all, SPL uses ten aircraft cat-egories for their stands. These categories have beenadapted to stand sizes C, D, E and F. Furthermore; theairport uses dedicated cargo stands for full cargo flights.
These are modelled as remote operational stands in thecase study analysis. Lastly, an assumption has beenmade regarding the sector usability of the stands (B andC piers: Schengen, E-G piers: Non-Schengen, D/H-Mpiers: Swing).
4.3. Model Results & Analysis
The developed optimisation model is assessed through aset of cases developed. The results of these cases will bedescribed in the following section.
4.3.1. Pareto Multi Case Results - Base Case
First, the model is run for the design day flight scheduleby varying the factors assigned to the capital costand operational cost in the objective function. Inthis first case, no additional units are considered (norobustness, no area limitations, no flight frequency).The factor assigned to the capital cost, αCC , is alteredfrom 0.05-0.99 in 19 steps. The results of the trade-offbetween operational and capital cost is depicted inFigure 9. Each of the points depicts a solution for aspecific αCC . It can be seen that an increase in capitalcost allows for a decrease in operational cost.
Stand Mix:Figure 10 depicts a boxplot of the number of standsper type built in the multi-case run. It can be seenthat the contact stands and remote operational standshave the largest spread. The highest number of contactstands is chosen for αCC = 0.05 (132 contact stands).At this αCC , the highest number of total stands is built(142). This can be explained by the fact that at thischoice, the operational cost is dominant. Since contactstands do not induce any operational cost in the definedframework, these stands are chosen. This is also visiblein Figure 12 in the number of busses (4) used in thissolution. As the αCC increases, the number of contactstands decreases, and more remote operational standsare used (at the cost of more busses). The total numberof stands doesn’t vary very much after αCC = 0.05
13

Figure 9: Pareto curve for the base case
(variance of 0.28).
Figure 10: Boxplot graph of the number of stands per type for thebase case. Ops = Operational
It turns out that MARS stands are only used in the caseαCC = 0.05. A MARS stand is not very cost-efficient.The capital cost is 4.5 times higher than a contactswing stand (for ADG C). Therefore, a use case inwhich a MARS stand is used for handling two type Caircraft simultaneously followed by handling a type Eaircraft without the need to build an additional standwould make it viable. Having an in-depth look at thedesign day flight schedule reveals that the demand isinsufficient to employ such solutions. At the start ofthe day, the demand consists mainly of type E aircraft,after which the portion of type E aircraft reduces.
To test the implications of the flight schedule, a testcase has been produced. A schedule has been createdwith the same number of flight movements as the inputschedule. However, this schedule consists of alternatingpeaks of type C and type E arrivals. In this caseMARS stands are indeed used up to αCC = 0.18. The
percentage of MARS stands (out of the total number ofstands per run case) ranges from 4.9% (αCC = 0.15) to43% (αCC = 0.05).
From the output results, it is seen that as the αCCincreases, more flights are split into three phases untilαCC = 0.31 when the maximum of 10 flights is reached.This is due to the implemented policy for flight splittingin the framework. Assignment of flight splits to remotestands is not allowed due to the inefficiency associatedwith such a solution and as the number of remoteoperational stands increases by an increase in the αCCthe number of flights split into three phases reduceswhich each step of increase.
Figure 11: Boxplot graph of the average stand utilisation (in min-utes) for the base case. Ops = Operational
Figure 11 depicts boxplots of the average utilisationtime for each stand type. It can be seen that the remoteoperational and non-operational stands have the highestaverage stand utilisation time. Since only the parkingphase of a three split can be assigned to a remote
14

non-operational stands, this is logical. Furthermore,upon further analysis of the solutions it can be seenthat around 50% of the overnight flights is assignedto remote operational stands, which also increases thestand utilisation time.
Use of Equipment:It can be seen in Figure 12 that there is no variationin the number of tow trucks. This can be explainedbecause a tow truck is needed for the pushback for anyof the stands. The splitting of flights into two or threephases does not impact the number of tow trucks. Thevisible variation in the number of busses is related to theincrease in the number of remote handling operationsdue to an increase in the αCC . The validity of thelarge number of busses for an existing airport will beconsidered in Section 4.3.2.
Figure 12: Boxplot graph of the number of equipment for the basecase. NB = Narrow-Body, WB = Wide-Body, TT = Tow Truck
Area Limitations:Since being able to assess area limitations is one of thekey aspects of the proposed framework, the total areafor each of the case runs is analysed. Figure 13 depictsthe total area for each of the αCC cases that have beenrun. It can be seen that through the choice for an αCC ,a trade-off can be made regarding the total area used.The largest area refers to the lowest considered αCC inwhich 93% of the stands are contact stands, while thelowest area is represented by full remote handling offlights.
Utilisation of Swing Stands:From the model output, the use of swing stands is fur-ther analysed. The case αCC = 0.1 is chosen from thePareto curve since this is the first solution in which al-most all flights are handled at connected stands. As de-scribed in Section 3.3, swing stands are efficient for sectorswitching flights as well as for cross use during peaks ofa specific sector. From the analysis, it is obtained thataround 50% of the flights assigned to swing stands are
Figure 13: Total area used for different αCC values along thePareto curve
sector switching flights. Figure 14a depicts the demandon the swing stands of flights departing to Schengen des-tinations, while Figure 14b depicts the demand on swingstands of flights departing to Non-Schengen destinations.It can clearly be seen that the swing stands are crossutilised for both types of flights and that the demand iscaptured by alternating peaks, which validates the policyfor these stands.
4.3.2. Validation using Amsterdam AirportSchiphol Data
The real case performance at Amsterdam AirportSchiphol compared to the model output is also analysed.In this part of the case study, the stand data describedin Section 4.2.2 is implemented in the model as a hardinput. Furthermore, the capital cost and operationalcost in the objective function are equally taken intoaccount (no consideration of an αCC factor). Theorange dot in Figure 9 depicts the position of thesolution in which the number of stands at SchipholAirport is used as hard input. The result is a cap-ital cost of 181,865 euro and an operational cost of65,608 euro. It can be seen that the solution is notoptimal. Apparently, the airport uses more stands thanneeded. Based on the developed model and throughinterpolation, it is found that the operational cost couldbe reduced by around 15%. However, this gap couldbe expected as stand capacity assessment is not onlydriven by a peak day analysis. The proposed frameworkdetermines the minimum number of stands, which doesnot incorporate general aviation flights and emergencies.
It has to be noted that only the stands are modelledas hard input in this analysis. The needed equipmentis not restricted. The model assigns the number ofbusses needed to operate the aircraft assigned to a re-mote stand. This is independent of the number of re-mote stands built. The number of busses needed for thedesign day flight schedule based on Amsterdam Airport
15

(a) Demand on swing stands for flights departing to Schengen destinations(case αCC = 0.1)
(b) Demand on swing stands for flights departing to Schengen destinations(case αCC = 0.1)
Figure 14: Demand on swing stands for the case αCC = 0.1
Schiphol’s stand mix is 31. Upon analysis of the avail-able number of busses at the airport (around 35 busses),it is validated that the developed model is accurate inreflecting the actual operations.
4.3.3. Consideration of Weekly Flight Frequency
As described in Section 3 the consideration of the flightfrequency is also implemented in the developed frame-work. To analyse the implications of incorporation ofthe flight frequency on the model output, the same casestudy has been performed as described in Section 4.3.1.However, the flight frequency unit has been turned onin this analysis. Therefore, the weekly frequency offlight operations is now also included in the optimisation.
Figure 15 depicts boxplots of the number of standsfor the multi-case runs of the model without flightfrequency (NF) and with flight frequency (WF). Thesame range of 123-125 for the total number of standsbuilt is obtained if the model is run with the flightfrequency unit (if the first case αCC = 0.05 is excludedfrom the analysis). Furthermore, there are no significantvariations with respect to the number of equipment inthe two runs (for the tow trucks, there is no variation atall). However, it is clear from Figure 15 that a differentvariation of stands is used if the flight frequency isconsidered. Flights are handled more remotely in thiscase (fewer contact stands and more remote operationalstands).
The variation in stands is also visible from the total areaused in both the runs. Figure 16 depicts the area used inboth case runs 1 and 2 for a variation in the αCC factor.It can be clearly seen that turning on the considerationof the flight frequency results in a lower area compared tothe base case (without the flight frequency). The flightfrequency run results in an area reduction from 0.1% upto 6.5% compared to the base case. This leads to a costreduction between 15% and 20%. This percentage getslower and lower as the αCC is increased. The lower areais a result of the reduction in contact stands and increasein the number of remote stands. Upon further analysisof the results, it is found that the percentage of aircraftassigned to a stand with an equivalent stand size (insteadof a larger size) reduces as the αCC increases for both
the run with and without flight frequency. However, ifthe flight frequency is considered on average 0.5% fewerflights are assigned to an equivalent stand size comparedto the case without flight frequency.
Figure 16: Total area used as a function of αCC for the base case(NF) and the case including flight frequency (WF)
4.3.4. Consideration of Area Limitations
To test the implications of the area limitations unit, athird case study has been set up. As described in Section3, the area limitations are considered in three blocks:a block of the available area, the second block of thearea available at the cost of pavement and a third blockcontaining the area available at the cost of pavementand purchasing. In this case study the available area atno cost is set to 960,000 m2 (the average area used bythe model in case 1), the area at cost of pavement to300,000 m2 and the area at the cost of pavement andpurchasing to 100,000 m2. As with the other two multi-case runs, the αCC is varied from 0.05 to 0.99 in 19 steps.
From the model results, no significant differences arefound between the model output for the base run(case run 1) and the area limitation case. A lowermaximum number of contact stands is observed if the
16

Figure 15: Boxplot graph of the number of stands per type for the base case (NF) and case including flight frequency (WF)
area limitation unit is used.
Figure 17: Total area used as a function of αCC for the base case(NF) and the case with area limitations (AL)
Interesting conclusions can be drawn upon analysisof the area used for this case study run. Figure 17depicts the area used as a function of αCC for thebase run (without area limitations) and the run witharea limitations (AL). It can be seen that the arealimitation case results in a lower area due to the setrestrictions. Upon analysis of the solution character-istics, it is found that the model splits more flightsinto three phases until the point of the set area isreached, after which the graphs are almost equal.The minor deviations between the two lines once the960,000 m2 is reached at αCC = 0.42 can be linkedto the optimisation cut-offs, the optimisations of thearea limitation run are not optimised until a 0% gap,but are at some points cut off between a 0% and 1% gap.
From the results, it can be said that the base model(without the area limit run) already allows for a trade-off with respect to the area used. However, the arealimitation unit in the proposed framework is useful fora single case study in which a decision-maker assesseswhat the implications on the stand mix and cost are byimplying area restrictions. As can be seen in Figure 17the unit reduces the area up to the set threshold for thesame αCC factor.
Figure 18: Number of flights split into two or three phases as afunction of αCC for the base case (NF) and the case with arealimitations (AL)
17

4.3.5. Implications of Flight Splitting Policy
To test the implications of flight splitting, a small casestudy has been performed in which the operational costfor split phases is lowered. In the base definition of themodel, the operational cost for the split phases is thesame as for the no split versions of a flight (thus, if aflight is split, the operational cost is induced twice orthrice). For this analysis, the operational cost of thesplit phases is reduced to 50%. This is done to push themodel towards the employment of flight splitting.
Tables 1 and 2 depict the results of this analysis. Itcan be seen in Table 2 that the number of busses isreduced as the cost is reduced. The total number ofstands in both runs is 123. There is a small variation inthe number of stands per type. From the results, it isobtained that an increase in the number of flights splitresults in a higher service level (more flights are assignedto contact stands). Furthermore, this also results in alower number of busses needed (less remote operations).
The described policy for flight splitting was adapted afterthe validation performed using the case study data. Itwas found that the model also executed unnecessary towsdue to the lower stand occupation time. If a flight istowed away, the stand occupation time is lowered due tothe needed towing time during which the flight does notoccupy a stand. Therefore, two split tows of non-sectorswitching flights is penalised by a factor of 2 and threesplit tows are restricted to be assigned to non-remotestands (to assure that these will only be used if it resultsin efficient use of the infrastructure).
Run CapitalCost (Euro)
OperationalCost (Euro)
Base 103,568 82,22550% decreasein split cost
105,027 78,934
Table 1: Capital cost and operational cost results of the flightsplitting analysis
Run Number ofBusses
Number ofNarrow-Body TowTrucks
Number ofWide-BodyTow Trucks
Base 84 36 1250% decreasein split cost
77 36 12
Table 2: Number of equipment results of the flight splitting anal-ysis
4.3.6. Model Sensitivity
The sensitivity of the defined parameters on the modeloutput has been assessed through a sensitivity analysis.This analysis is performed around three categories: cost
factors, time factors and robust scheduling.
The capital cost of the stands is more dominant thanthe operational cost associated with operating boardingstairs, tow trucks and busses. Altering the capital costof the stands results in a change of the number of standsper type through more contact handling of flights, whichis linked to the number of busses needed. For analysisin which the capital cost of the stands is reduced in 5steps from 5% to 25%, the number of contact standsincreases on average with 8%, the number of remotestands is reduced by 6% and the number of busses isreduced with 8% (all relative to a 5% reduction in thecapital cost). The total number of stands does not vary.The capital cost of the equipment is not a dominantfactor.
As described, the framework also incorporates the abil-ity to create robust schedules through the addition ofbuffer times. An analysis has been performed in whichthe buffer times have been increased from 0-20 minutes insteps of 4 minutes (2 minutes subtracted from the sched-uled arrival times and 2 minutes added to the scheduleddeparture time of flights). It is found that the total num-ber of stands increases on average by 3% for every 4minutes of buffer time.
4.3.7. Decision Maker Dashboards
Interpretation of output data can be cumbersome for adecision-maker or stakeholder. As described in Section4, the proposed framework is extended with solutiondashboards to aid a decision-maker in interpreting themodel output and making decisions. The features of thevisualisation dashboards are depicted in Figure 19. Twominimum viable products (MVP) of analysis dashboardshave been developed. The first version refers to the leftbranch in Figure 19 and consists of data visualisationsfor a single case (a run for a single choice of αCC andαOC). This encompasses the input schedule analysis bymeans of the analysis of the traffic demand throughoutthe day with respect to differentiation in size and sectorand the analysis of the model output. This analysis ofthe model output consists of the stand mix, equipmentand stand utilisation. A screenshot of this dashboardcan be found in Figure C.22.
Figure 19: Schematic overview of the dashboard features
18

The second developed dashboard aids a decision-makerin the interpretation of results and decision making fora multi-cases run. This dashboard depicts the Paretocurve, the area for each of the cases and the bus/towoperations as is depicted in Figure C.23. Based on thesegraphs, the decision-maker can investigate the charac-teristics (stand mix, equipment, stand utilisation time)of a specific solution, as shown in the right part of Fig-ure C.23. These MVPs allow for an easily accessible andinteractive interface for a decision-maker to interpret themodel output.
4.4. Model Performance
The model performance is assessed through the per-formed case studies as described in Sections 4.3.1, 4.3.3and 4.3.4. The developed model has been tested usinga laptop with:
• Processor: Intel Core i7-8550U CPU 1.80GHz, 2001MHz, 4 CPU Cores, 8 threads.
• Python 3.7
• Gurobi Optimizer version 9.1.1 build v9.1.1rc0
The developed mathematical optimisation model con-sists of 11,102 rows and 46,116 columnsThe computational time for each of the three runs:base (1), consideration of flight frequency (2) andconsideration of area limitations (3) is depicted inFigure 20 as a function of the αCC factor (the com-putational time of each of the individual case runs).Figure 21 depicts the computational times of the basecase and the case with the flight frequency consideration.
Note: The computational times depicted in Figures20 and 21 consist of the computational time needed byGurobi to solve each of the αCC cases.
The total computational time needed to run 19 casesof αCC for the base case, and the flight frequency isaround 7 minutes (of which 4 minutes are needed for theGurobi optimisation). A single case is performed withina minute, including the output set up (graphs, etc.).The Gurobi optimizer solves the defined optimisationproblem using the methodology described in Section3.5. The developed mathematical optimisation modelconsists of 11,102 rows and 46,116 columns. First, thepresolve module is used, which removed 5631 rows and28075 columns and reduced the problem to 5471 rowsand 18,041 columns. This is followed by root relaxation,after which the branch & cut algorithm is used. Threecutting plane methods are used for the base runs orruns with the flight frequency unit (Gomory, MIR andZero half).
As can be seen in Figure 20, the area limit unit rapidlyincreases the computational time. To investigate howthis can be reduced, the single case at αCC = 0.57 isfurther analysed. The running time of the model withthe area limitation unit was initially around 52 minutes.
Upon further inspection of the solution it is found thatthe definition of the αCC and αOC factors as floatsincreases the solution time. By altering these factorsto 2 digits, the model’s running time with the arealimitations (for 19 cases) is lowered by around 50%.
Furthermore, no time limit or gap limit is imposed withinthe framework as an average optimisation time of 11 sec-onds (the time needed by the Gurobi optimiser) for acase is deemed as acceptable. The results have been ob-tained. However, it is analysed how the running time forthe area limitation unit can be improved. The objectivebound is moving slowly in some of the cases in which thearea limitation constraint is included. For these cases,the high-level solution strategy can be changed using theGurobi parameter ”MIPFocus” [46]. For the runs withthe area limitation unit, the MIP Focus has been set tofocus on the bound.
Figure 20: Computational time of the multi case runs per run case(αCC)
Figure 21: Computational time of the base case and the case withflight frequency consideration per run case (αCC)
19

5. Conclusion & Recommendations
In this research paper, a mathematical optimisationmodel capable of determining the needed stand mixand equipment for a design day has been developed.The proposed framework combines the incorporationof area limitations, robust scheduling, operationalfactors, different stand types and flight frequencywithin a single framework. It has been proven thatthere is no one answer to such a problem. Within theproposed framework, the trade-off is made betweenoperational cost and capital cost using weight factors tothe objectives (αCC for the capital cost and 1 − αCCfor the operational cost), after which a Pareto curveis created. This allows a decision-maker to make atrade-off between the level of service (through connectedstands), the number of needed equipment and area use.For this, a value-focused thinking process is employed.The decision-maker defines a priori the optimisationobjectives (what to optimise for and the factors incor-porated within the optimisation), after which differentcases will be run. These cases will be presented to thedecision-maker, after which a decision can be made.Furthermore, the decision-maker can also decide tofurther analyse a specific solution through a single run.Data visualisation dashboards have been developed toaid a decision-maker in this process. The proposedframework has been modelled within Python 3.7 andoptimised using the Gurobi optimiser. To validate themodel, a case-study analysis has been performed. Thiscase study has been performed by defining a design dayflight schedule for the peak day of 2018 (using OAGdata), which has been validated using data obtainedfrom Amsterdam Airport Schiphol.
From the case study, it became clear that the totalnumber of stands does not vary very much along thePareto curve. The variation lies within the number ofspecific stand types and the needed equipment. MARSstands are not used within the framework (except for thecase αCC = 0.05) due to the high cost associated withthese stands and the relatively low demand of aircraftbelonging to aircraft design group E within the designday flight schedule. As the αCC is increased, the modelshifts towards the use of remote stands, which lowersthe total needed infrastructural area. The implementedarea limitations unit within the model has provento lower the needed area for specific solution casessuccessfully. Furthermore, the model is validated usingthe available stands at Amsterdam Airport Schiphol in2018. This showed that the model accurately reflectedthe operations (the need for 31 busses, while the airporthad 35 busses available). However, the solution turnedout to be sub-optimal. A reduction in the operationalcost by around 15% could be gained by employing asolution along the Pareto curve.
Two specific implemented policies have been validated:flight splitting and the use of swing stands. Flightsplitting is employed within the framework to allowfor optimal use of the infrastructure by towing long
stay aircraft to a remote stand to free up connectedstand capacity. It has been validated that an increasein splitting flight increases the number of connectedhandled flights. Furthermore, the use of swing standsis centred around demand from sector switching flightsas well as capturing sector peaks (to Schengen orNon-Schengen destinations).
The effect of incorporating the weekly flight frequencyhas also been assessed within the research. It turns outthat the cost can be reduced by around 15%-20% com-pared tot the base case. This is due to the adaptationin the stand mix employed by the optimisation model.The model reduces the number of connected handledflights (at contact or non-contact stands), which allowsfor a reduction in the area used up to 6.5%.
The proposed framework contributes to the bodyof knowledge and the assessment tools available fordecision-makers within strategic airport planning. Uponthe research results, it is recommended to apply theweighted sum method along with the creation of Paretocurves to create a value-focused thinking process fora decision-maker. Practical optimisation models forstrategic stand capacity assessment are scarce withinthe literature. Furthermore, no framework exists thatincorporates operational factors, the use of differentstand types, area limitations and flight frequency withina single framework. The developed model capturesthis by providing the backbone and MVP dashboardsfor a decision-making tool, allowing a decision-makerto analyse a best-fit solution through a value-focusedthinking process.
For further research within the domain of strategic standcapacity assessment it firstly recommended to furtheranalyse the implications of anticipated demand and itsimplications on the stand mix. In this research, a de-sign day schedule has been developed using OAG datawhich is not perfect (it contains both scheduled and ex-ecuted flights). The proposed framework could be usedto perform scenario analysis and to incorporate multipleair traffic demand scenarios (e.g. for multiple time spanswithin the strategic time frame). E.g. this can be usedto consider investments based on the anticipated demandnow and in X years. Moreover, to reflect actual airportoperations, it is desired to tune the made operationalassumptions through collaborative research with airportstakeholders. Furthermore, as the proposed framework isaimed at a strategic development time frame, the phys-ical airport layout is not considered. Therefore, it isinteresting to analyse the effects of different factors re-lated to the physical layout on the stand mix (such asplacement of roads, handling of aircraft, and stand adja-cency constraints). Lastly, as the proposed model definesthe needed equipment, it could be extended to includethe needed workforce for the operations (passenger andaircraft handling) and how this could be used within astrategic time frame.
20

References
[1] World Health Organization, COVID-19 Timeline,Retrieved 5-1-2021, from: https://www.who.int/
emergencies/diseases/novel-coronavirus-2019/
interactive-timeline?gclid=CjwKCAiAudD_
BRBXEiwAudakX_tciELvGwaZSp8G7K7FhGaPfWC7UvH_
FwoM7bdetwR94JxHOeLARhoCGKgQAvD_BwE#!
[2] International Civil Aviation Organization, Future of Avi-ation, Retrieved 5-1-2021, from: https://www.icao.int/
Meetings/FutureOfAviation/Pages/default.aspx#:~:
text=The%20air%20transport%20industry%20is,carried%
20around%204.1%20billion%20passengers.&text=If%
20this%20growth%20path%20is,GDP%20to%20the%20world%
20economy.
[3] Airbus, Global Market Forecast 2019-2038, Retrieved 5-1-2021, from: https://www.airbus.com/aircraft/market/
global-market-forecast.html.[4] Oostra, R, NACO - Strategic Airport Planning, company Pre-
sentation, Retrieved on: 22-05-2020 (2019).[5] Janic, M, Airport Analysis, Planning and Design : Demand,
Capacity and Congestion, Nova Science Publishers, Incorpo-rated, New York, UNITED STATES, 2013.
[6] Keeney, R.L., Value-focused thinking: Identifying decisionopportunities and creating alternatives, European Journal ofOperational Research 92 (3) (1996) 537–549.
[7] ICAO, International Civil Aviation Organization, AirportPlanning Manual, Part 1, Master Planning, 2nd Edition,ICAO, Montreal, Canada, 1987.
[8] de Neufville, R.L. and Odoni, A.R. and Belobaba, P. andReynolds, T.G., Airport Systems, Second Edition: Planning,Design and Management, McGraw-Hill Education, 2013.
[9] ICAO, International Civil Aviation Organization, Annex 14:Aerodromes - Aerodrome Design and Operations, Vol. 1,ICAO, Montreal, Canada, 2009.
[10] EASA, European Aviation Safety Agency, CS–ADR-DSN —AERODROMES DESIGN, EASA, 2017.
[11] FAA, Federal Aviation Administration, Advisory Circular150/5070-6B: Airport Master Plans, U.S. Government Print-ing Office, Washington, DC, 2015.
[12] IATA, International Air Transport Association, Airport De-velopment Reference Manual, 10th Edition, 2014.
[13] G. N. Steuart, Gate position requirements at metropolitanairports, Transportation Science 8 (2) (1974) 169–189.
[14] Bouras, A. and Ghaleb, M. A. and Suryahatmaja, U. S. andSalem, A. M., The airport gate assignment problem: A sur-vey, Scientific World Journal 2014 (2014) 923859.
[15] Lim, A. and Rodrigues, B. and Zhu, Y., Airport GateScheduling with Time Windows, Artif. Intell. Rev. 24 (2005)5–31.
[16] Diepen, G. and Akker, J. M. and Hoogeveen, J. A. andSmeltink, J. W., Using column generation for gate planningat Amsterdam Airport Schiphol, Report, Utrecht University(2007).
[17] Tang, Ching-Hui and Yan, Shangyao and Hou, Yu-Zhou, Agate reassignment framework for real time flight delays, 4OR8 (2010) 299–318. doi:10.1007/s10288-009-0112-1.
[18] Prem Kumar, V. and Bierlaire, M., Multi-objective airportgate assignment problem in planning and operations, Journalof Advanced Transportation 48 (7) (2014) 902–926.
[19] Mangoubi, R. S. and Mathaisel, Dennis F. X., OptimizingGate Assignments at Airport Terminals, Transportation Sci-ence 19 (2) (1985) 173–188.
[20] Bihr, R.A., A conceptual solution to the aircraft gate as-signment problem using 0, 1 linear programming, ComputersIndustrial Engineering 19 (1) (1990) 280–284. doi:https:
//doi.org/10.1016/0360-8352(90)90122-3.[21] Yan, S. and Shieh, C. and Chen, M., A simulation frame-
work for evaluating airport gate assignments, Transporta-tion Research Part A: Policy and Practice 36 (2002) 885–898.doi:10.1016/S0965-8564(01)00045-3.
[22] Bolat, A., Models and a genetic algorithm for static aircraft-gate assignment problem, Journal of the Operational Re-search Society 52 (10) (2001) 1107–1120. doi:10.1057/
palgrave.jors.2601190.[23] Bolat, A., Assigning arriving flights at an airport to the avail-
able gates, Journal of the Operational Research Society 50 (1)(1999) 23–34.
[24] Seker, M. and Noyan, N., Stochastic optimization modelsfor the airport gate assignment problem, Transportation Re-search Part E: Logistics and Transportation Review 48 (2)(2012) 438–459.
[25] Neuman, U.M. and Atkin, J.A.D., Airport Gate AssignmentConsidering Ground Movement, in: D. Pacino, S. Voß, R. M.Jensen (Eds.), Computational Logistics, Springer Berlin Hei-delberg, 2013, pp. 184–198.
[26] Guepet, J. and Acuna-Agost, R. and Briant, O. and Gayon,J. P., Exact and heuristic approaches to the airport stand al-location problem, European Journal of Operational Research246 (2) (2015) 597–608. doi:10.1016/j.ejor.2015.04.040.
[27] Deken, J.O., Robust scheduling for the bay and gate assign-ment - a kenya airways case study, Msc thesis, Delft Universityof Technology (2015).
[28] Kaslasi, R, Aircraft Stand Allocation Model for Strategic Use,Msc thesis, Delft University of Technology (2019).
[29] Boukema, M, Aircraft Stand Capacity Model for StrategicAirport Planning - A Schiphol Airport Case Study, Msc the-sis, Delft University of Technology (2018).
[30] Li, C., Airport Gate Assignment A Hybrid Model and Imple-mentation, ArXiv abs/0903.2528 (2009).
[31] Diepen, G. and Van Den Akker, J. M. and Hoogeveen, J. A.and Smeltink, J. W., Finding a robust assignment of flights togates at Amsterdam Airport Schiphol, Journal of Scheduling15 (6) (2012) 703–715.
[32] Haghani, A. and Chen, M. C., Optimizing gate assignmentsat airport terminals, Transportation Research Part A: Policyand Practice 32A (6) (1998) 437–454.
[33] Miettinen, K. , Introduction to Some Methods and Appli-cations of Nonlinear Multiobjective Optimization, Depart-ment of Math. Inform. Technology University of Jyvaskyla,Finland. Retrieved 30-6-2020, from: https://www.lnmb.nl/
conferences/2014/programlnmbconference/Kaisa.pdf.[34] Horonjeff, R.M. and McKelvey, F.X. and Sproule, W.J. and
Young, S., Planning and Design of Airports, 5th Edition,McGraw-Hill Education, 2010.
[35] Schiphol Group, RASAS - Regulation AircraftStand Allocation Schiphol, Retrieved 5-1-2021, from:https://www.schiphol.nl/en/download/b2b/1554102691/
1h2NOsKSncc2uywE8OE02W.pdf.[36] TRB, Transportation Research Board, ACRP Report 96 -
Apron Planning and Design Guidebook, ACRP, Washington,DC, 2013.
[37] Beudeker, M, Reallocating aircraft stand capacity, Msc thesisreport, Delft University of Technology (2015).
[38] Blow, C., Transport Terminals and Modal Interchanges, Tay-lor Francis, 2012.
[39] ICAO, International Civil Aviation Organization, AirportEconomics Manual, 3rd Edition, ICAO, Montreal, Canada,2013.
[40] FAA, Federal Aviation Administration, Airport terminalplanning, Retrieved on 22-5-2020, from: (2018).URL https://www.faa.gov/documentLibrary/media/
Advisory_Circular/AC-150-5360-13A-Airport-Terminal-Planning.
[41] Drexl, A and and Nikulin, Y, Multicriteria airport gate as-signment and Pareto simulated annealing, IIE Transactions40 (2008) 385–397. doi:10.1080/07408170701416673.
[42] Dorndorf, U. and Drexl, A. and Nikulin, Y. and Pesch, E.,Flight gate scheduling: State-of-the-art and recent develop-ments, Omega 35 (3) (2007) 326–334.
[43] IEA - Energy Technology Network, Aviation Infrastruc-turel, Retrieved 5-1-2021, from: https://iea-etsap.org/
E-TechDS/PDF/T16_Aviation_Infrastructure_v4%20Final.
pdf.[44] Hillier, F.S. and and Lieberman, G. J., Introduction to op-
erations research, McGraw-Hill Education, New York, NY,2015.
[45] Gurobi Optimization, Mixed Integer Programming, Retrieved20-2-2021, from: http://co-at-work.zib.de/berlin2015/
files/Gurobi_MIP.pdf.[46] Gurobi Optimization, MIPFocus, Retrieved 20-2-2021, from:
https://www.gurobi.com/documentation/9.1/refman/
21

mipfocus.html.[47] Kolb, O. and Siegemund, S., Final Report - Study on the
Implementation of Article 7(3) of the “Directive on the De-ployment of Alternative Fuels Infrastructure” – Fuel PriceComparison, Publications Office of the European Union, Lux-embourg, 2014.
22

Appendix A. Stand Type Information
Nr Type Size Terminal Area (in m2) Capital Cost perday (in EUR)
Bussing BoardingStairs
1 Contact C Domestic 5000 771 No No2 Contact C International 5000 771 No No3 Contact C Swing 5000 1045 No No4 Contact D Domestic 9277 943 No No5 Contact D International 9277 943 No No6 Contact D Swing 9277 1217 No No7 Contact E Domestic 14840 2383 No No8 Contact E International 14840 2383 No No9 Contact E Swing 14840 3150 No No10 Contact F Domestic 19656 3120 No No11 Contact F International 19656 3120 No No12 Contact F Swing 19656 4107 No No13 Non-Contact C Domestic 5000 702 No Yes14 Non-Contact C International 5000 702 No Yes15 Non-Contact C Swing 5000 976 No Yes16 Non-Contact D Domestic 9277 929 No Yes17 Non-Contact D International 9277 929 No Yes18 Non-Contact D Swing 9277 1203 No Yes19 Non-Contact E Domestic 14840 2246 No Yes20 Non-Contact E International 14840 2246 No Yes21 Non-Contact E Swing 14840 3013 No Yes22 Non-Contact F Domestic 19656 2915 No Yes23 Non-Contact F International 19656 2915 No Yes24 Non-Contact F Swing 19656 3901 No Yes25 Remote Operational C NA 4298 132 Yes Yes26 Remote Operational D NA 8368 344 Yes Yes27 Remote Operational E NA 12709 609 Yes Yes28 Remote Operational F NA 16979 814 Yes Yes29 MARS NA Domestic 16350 3455 No No30 MARS NA International 16350 3455 No No31 MARS NA Swing 16350 4688 No No32 Remote Non-Operational C NA 4298 103 No No33 Remote Non-Operational D NA 8368 287 No No34 Remote Non-Operational E NA 12709 522 No No35 Remote Non-Operational F NA 16979 698 No No
Table A.3: Overview of the different stand types and their specifics
23

Sta
nd
CD
EF
CNC
DNC
ENC
FNC
MARS
Remote
CNOP
Remote
DNOP
Remote
ENOP
Remote
FNOP
Remote
COP
Remote
DOP
Remote
EOP
Remote
FOP
Nr
PB
B1
22
30
00
03
00
00
00
00
PB
BC
ost
500,
000
50,
000
500,
000
500,
000
500,0
0050
0,000
500,
000
500,
000
500
,000
00
00
00
00
Tota
lPBB
Cost
500,
000
100,0
001,
000
,000
1,5
00,
000
00
00
1,50
0,00
00
00
00
00
0
Are
aA
rea
Cost
(EU
R/m
2)22
530
035
035
022
530
035
035
035
017
525
030
030
022
530
035
035
0A
rea
m2
5,00
09,
277
14,8
4019
,656
5,000
9,27
714
,840
19,6
5616
,350
4,298
8,36
812
,709
16,9
794,
298
8,36
812,
709
16,9
79Tota
lAre
aCost
1,12
5,000
2,78
3,1
00
5,19
4,00
06,8
79,
600
1,125
,000
2,7
83,1
005,
194
,000
6,87
9,60
05,
722,
500
752,0
632,
092,
075
3,81
2,64
05,
093,5
68966
,938
2,51
0,4
904,
448,
080
5,942
,496
Term
inal
Cost
Lay
ers
22
22
22
22
20
00
00
00
0S
win
gL
ayer
s3
33
33
33
33
00
00
00
00
Wid
th[m
]50
5070
9050
50
7090
900
00
00
00
0D
epth
[m]
10
1020
2010
10
2020
250
00
00
00
0B
uil
din
gA
rea
Cos
t(E
UR
/m
2)4,
000
4,00
04,0
004,
000
4,00
04,0
004,
000
4,0
004,0
000
00
00
00
0C
ost
sin
gle
sect
or
term
inal
4,000
,000
4,0
00,
000
11,2
00,0
00
14,4
00,0
00
4,00
0,0
004,
000
,000
11,
200,
000
14,4
00,0
0018
,000
,000
00
00
00
00
Cos
tsw
ing
term
inal
6,00
0,0
006,
000,
000
16,8
00,0
00
21,6
00,0
00
6,00
0,00
06,
000,
000
16,8
00,0
0021,
600,
000
27,0
00,0
000
00
00
00
0Tota
lsingle
secto
rcost
5,62
5,000
6,88
3,1
00
17,3
94,0
00
22,7
79,6
00
5,12
5,00
06,7
83,1
0016
,394
,000
21,2
79,
600
25,2
22,5
0075
2,0
632,0
92,0
753,8
12,6
405,0
93,5
68966,
938
2,5
10,4
904,
448,
080
5,94
2,49
6Tota
lsw
ingterm
inalcost
7,62
5,000
8,88
3,1
00
22,9
94,0
00
29,9
79,6
00
7,12
5,00
08,7
83,1
0021
,994
,000
28,4
79,
600
34,2
22,5
000
00
00
00
0
Dep
reci
atio
np
erd
ay(E
UR
)77
1943
2,38
33,1
20
702
929
2,2
462,
915
3,45
510
328
752
2698
132
344
609
814
Dep
reci
atio
np
erd
aysw
ing
(EU
R)
1,0
45
1,21
73,
150
4,1
0797
61,
203
3,01
33,
901
4,688
00
00
00
00
Tab
leA
.4:
Dis
tin
ctio
nb
etw
een
cap
ital
cost
of
the
diff
eren
tair
craft
stan
ds
base
don
stan
dsi
ze,
the
use
of
aP
BB
an
dte
rmin
al
layer
s.N
C=
Non
-Conta
ctst
an
d,
NO
P=
Non
-Op
erati
on
al,
OP
=O
per
ati
on
al.
24

Appendix B. Cost Factors
Equipment Capital Cost (Euro) Depreciation per day (Euro)
Bus 500,000 137Boarding Stairs 32,000 9NB Tow Truck 200,000 55WB Tow Truck 500,000 137
Table B.5: Overview of the capital cost of the implemented equipment
Equipment Fuel/Electricity Cost Maintenance Cost Personnel Cost
Bus 0.32 Euro/km (Electricity) 0.40 Euro/km 5 Euro/operationNB Tow Truck 44 Euro/operation (Fuel) 1 8 Euro/operation 2 9 Euro/operation 3
WB Tow Truck 65.5 Euro/operation (Fuel) 1 13 Euro/operation 2 9 Euro/operation 3
Table B.6: Overview of the operational cost of the equipment implemented in the model (NB: Narrow-body, WB: Wide-body)
1Based on: a daily cost of 655 euro for fuel (6,152,726 MJ/year [43], an energy content of 36 MJ/liter for diesel [47], an average priceof 1.40 euro/liter for diesel [47]) which is translated back to a cost per operation based on an assumption of the average movements perday for narrow-body trucks (15 movements) and wide-body trucks (10 movements).
2Based on: an average maintenance cost of 25 euro/hour [43] and an assumption of 5 hours for the in use time of the tow trucks. Thisis translated back to a cost per movement upon an assumption of the average movements per day as for the fuel
3Based on: an assumption of the average gross salary of personnel (50,000 euro per year)
25

Appendix C. Decision Maker Dashboards
Figure C.22: Single Case Dashboard
26

Fig
ure
C.2
3:
Dash
board
toan
aly
sem
ult
iple
case
s
27

Fig
ure
C.2
3:
Dash
board
toan
aly
sem
ult
iple
case
s
27

IILiterature Study (previously graded under AE4020)
29

1Literature Study Introduction
Airport design and planning is an iterative process in which significant investments are to be considered. One of thekey objectives in airport design and planning is the minimisation of the land used while still anticipating for additionalneeded capacity in the future. Assessing the implication of different scenario choices on the needed stand capacity ina strategic time frame will help airport planners determine the required land area with more precision. It will result inin-depth insights regarding the factors defining the needed capacity. Furthermore, it allows decision-makers to obtainresults based on their own choices regarding stand types, operational factors and the area used.
The following chapters describes the results of a literature study regarding airport stand capacity assessment within astrategic time frame. This literature study is performed as part of an MSc. graduation project at the Delft Universityof Technology. The objective is to analyse the research field and to find a gap within the literature. This encom-passes applying mathematical modelling to solving gate and stand assignment problems, the underlying objectivesand consideration of the strategic time frame. Although the focus is on the analysis of stand types, factors of influ-ence, assessment policies and optimisation frameworks, the report also contains a review of the literature regardingairport planning & design and forecasting to assure the broader context in which airport stand capacity fits, is alsounderstood. It has to be noted that forecasting stand demand is out of scope.
The literature study has been performed in two phases. First, a general search is performed to get acquainted with thedifferent concepts related to stand capacity assessment and stand allocation. Three high-level concepts have beendefined from the first phase: airport design and planning, stand capacity assessment and modelling & optimisationtechniques. These concepts formed the foundation of the second phase. In this phase, the literature regarding thesetopics has been investigated and analysed. Based on the performed literature study, the following research objectiveis defined:
“To define recommendations to improve current practices of Airport Stand Capacity Assessment within astrategic time frame, by developing a mathematical optimisation model which allows a trade-off betweenoptimising for stand types, operational factors and area limitations”.
.
The report starts with an introduction into airport planning and design in Chapter 2, in which the different develop-ment phases are described along with the characteristics of airport master planning. Chapter 3 contains the review ofstand capacity assessment within airport designs. It encompasses subjects as forecasting, the apron system and dif-ferent stand types. Following this, the factors of influence, analytical assessment policies and performance indicatorsare described in Chapter 4. Furthermore, Chapter 5 contains a literature review of the modelling and optimisationframeworks for stand capacity assessment. Based on the performed literature study, the research scope and objectiveare defined. The literature study is concluded with a conclusion in Chapter 6.
30

2An Introduction to Airport Planning & Design
The objective of the following chapter is to establish a profound introduction regarding airport planning and design.This will act as the basis for the remainder of the literature study. It starts with a description of the phases in airportdevelopment in Section 2.1, followed by a description of conventional master planning and adaptive planning inSections 2.2 and 2.3, respectively. The chapter is ended with a conclusion in Section 2.4.
2.1. Airport Development PhasesThe design and planning of airports is a very complex and time-consuming process without a single solution. Stake-holders involved in the decision-making process of airport planning make use of different guidelines stipulated byaviation organisations such as the International Civil Aviation Organisation (ICAO), the International Air TransportAssociation (IATA) and the Federal Aviation Administration (FAA). Before diving into the specifics of master planning,the different phases of airport planning are described.
Figure 2.1 depicts the different airport development phases from top to down. Every airport planning process startswith an analysis of the current situation. This can be a situation where there is no traffic yet (a new to be build airport)or the case in which an existing infrastructure needs to be expanded.
Figure 2.1: Airport Development Phases [68]
The definition of a clear vision through strategy development is crucial for the next phase: traffic forecasting. Traf-fic forecasting is conducted by analysing both market demand, and airline capacity [40]. Multiple factors should betaken into account, such as the airline industry, national and international economies and socioeconomic conditionswithin the airport catchment area [40].
Before the facilities can be sized, a thorough analysis of the current infrastructure needs to be performed using theforecasts of the earlier phase [68]. The required capacity needs to be assessed concerning the fulfilment of the de-
31

2.2. Conventional Master Planning 32
mand. Once a decision is made on how to assess the demand and the strategy to fulfil the demand (peak demand,design day etc.), the facilities can be sized. Facility sizing consists of the airside and landside infrastructure. However,if the development concerns a new airport, the new airport sites must first be selected and evaluated. This evaluationcan be based on operational capability (weather, airspace), the capacity potential (the available land), ground access(to assess the location of the airport concerning the anticipated catchment area for demand), development costs, andenvironmental impact [38].
From the facility sizing phase, a land-use plan can be created. A land-use plan is a high-level plan of the allocationof the airport facilities and airside infrastructure [68] and determines the land acquisition. A land-use plan should beflexible, find the most efficient placement of the airport’s most important functional areas, and be cost-effective.
The main functional areas which should be taken into account in the land use plan are airside infrastructure, thepassenger terminal, air cargo facilities, aircraft maintenance facilities, military facilities (if applicable), support facili-ties, and landside access [68]. By developing multiple options and through evaluation, the best option can be selected.
Now that a high-level overview of the needed land and the position of different facilities is known, the master plan canbe created. This is the objective of the next phase. The master plan defines the aforementioned functional areas inthe land use plan to the level of individual elements of infrastructure. A master plan should encompass the planners’vision of the ultimate development potential of the airport. Furthermore, a master plan should entail how the capacitymay proceed over both short term (0-5 years) and long term (6-10 years) [40]. The time horizon of a master plan is notpreset. However, generally, a time horizon of 20 years is used [31].
The next phase in airport planning consists of the development phasing. This is to define the different stages neededto obtain the defined objectives in the master plan. It is vital to integrate the master plan objectives with daily airportoperations to facilitate traffic growth [40]. Assessing the environmental impact of the defined development plan is ofkey importance to ensure acceptance of the master plan. In the assessment procedure, both the environmental effectsof the defined developments and possible mitigation procedures should be defined [40].
The final phase in airport development consists of financial analysis. Although considering the financial side of in-vestments is an important factor throughout all development phases discussed before, proving that the development’sfinancial side is in line with the defined strategy at the start of the first development phase will ensure acceptance ofthe master plan. Conventionally, the breakdown of costs for the defined master plan is more detailed for the first yearsof the plan than for the periods after that [40]. It is much more difficult to predict traffic growth, movements, passen-gers/cargo movements and inflation for long periods.
The steps mentioned above cover the most widely applied phases in the aviation industry by airport associationsand consulting firms [68] [40]. Once the development process has been finished, the airport stakeholders’ aim shiftstowards commercialisation and optimisation [40]. To ensure the literature study to be specific and condensed, thesephases will not be discussed because they are out of scope for the research topic as described in the introduction tothe literature study.
2.2. Conventional Master PlanningAs described in Section 2.1, an airport master plan encompasses the airport planners’ ultimate vision of the devel-opment of the airport [43]. A master plan can be developed for both new and existing airports. As described by deNeufville [15] a master plan should involve the following three factors: ultimate vision (a view of the long term futureof the airport), development (i.e. physical facilities on the airside and landside such as runways and terminal build-ings) and consider a specific airport (not the regional or national aviation system).
For the master planning process different international and national guidelines are to be used from e.g.: ICAO [45][43], EASA (CS-ADR-DSN) [26], FAA (for the United States) [31] and IATA [40]. In conventional master planning, it isassumed that the planners only consider a single forecast. Multiple factors influence future traffic, and thus no singlescenario can be developed. Furthermore, by considering only a single forecast, future growth potential risks are ne-glected, which is a big flaw in conventional master planning.
Therefore, airport planners and other stakeholders aim for good strategic thinking and flexibility in the master plan-ning process to ensure that the developed plans assess a wide range of scenarios and possibilities and thus are robustfor different future changes [15]. This objective can be realised by creating flexible and adaptable designs.Airport Master Plans are developed by application of a linear process as described by de Neufville [15]:
• Analysis of existing conditions.

2.3. Adaptive Strategic Airport Planning 33
• Forecast creation of future demand.
• Identification of facility requirements.
• Development and evaluation of alternatives to fulfil the defined demand.
• Choice of an alternative and further translation into a master plan.
A schematic overview of a flowchart to prepare an airport master plan is defined by Horonjeff [38] and is depicted inFigure 2.2.
Figure 2.2: Flowchart of steps to be followed to obtain an airport master plan [38]
The drawbacks of conventional master planning became painfully evident in the development of Amsterdam AirportSchiphol. A plan developed in 1995 for the airport became obsolete only four years after the first development dueto the unanticipated rapid growth of the aviation demand [55]. This plan was initially developed to cover a period of20 years. Another example is the development of Denver Airport. The developed master plan for this research endedup not representing the actual traffic at the airport. The airport ended up with fewer air transport movements thananticipated for [17].
2.3. Adaptive Strategic Airport PlanningAs described in Section 2.2 it is not convenient for airport planners to use single forecasts in the development process.Predictions always differ from reality and serve as a basis to build upon future developments. However, they inevitablyadd risk to the process. For example, no one could predict the corona crisis and its impact on the aviation industry(also affecting multiple airport master plans). To capture the dynamics of the future demand and allow for mitigation

2.4. Conclusion 34
strategies, dynamic strategic planning can be applied [15].
The core objective of dynamic planning is flexibility. Assessing multiple forecasts makes it easier for the decision-maker to assure that the developed plan is at least flexible to changes in the forecasts, which are inevitable. It directsdecision-makers towards assessing the performance of the developed plan upon the different forecasts and the per-formance in different scenarios. The airport planner needs to consider the developed plans’ effect, as the traffic loadapplied to a development plan can easily block future changes. For example, if an airport terminal is designed specif-ically for low-cost carriers, future changes to facilitate network carriers might not be possible.
Key in dynamic planning is identifying the starting position, which allows for an effective response to changing con-ditions. The objective is not necessarily to develop a plan that will always work out for any future scenario but ratheran adaptable plan.
Different methodologies for dynamic/adaptive strategic planning can be distinguished in literature. Kwakkel et al.[55] assessed three of the different methods described in the literature: dynamic strategic planning, adaptive policy-making and flexible strategic planning.
Dynamic strategic planning (DSP) is based on forecasting a range of future traffic along with different scenarios anddeveloping facility requirements along with various alternatives for the range of scenarios defined at the start. Thisshould be followed by selecting the first-phase development, which enables appropriate responses to changes in thedemand forecast [15].
Adaptive policymaking (APM) is defined as a generic approach to deal with uncertainties. It is based on the notionthat a fixed policy is likely to fail and that a decision-maker learns more about reducing uncertainties over time. Theprocess is divided into two phases, namely a thinking phase and an implementation phase. During the thinking phase,a basic form of the policy is defined and further analysed for the possible vulnerabilities. The most certain ones aretaken into account by defining mitigation procedures in the basic policy. Furthermore, actions are prepared for un-certain exposures once these take place. The thinking phase is followed by the implementation phase, during whichevents are monitored and measures are taken if needed. If it turns out that the defined policy is not on track to achievethe intended objectives, a reassessment is necessary.
Burghouwt [12] defines flexible strategic planning (FSP) as an alternative for traditional airport master planning. Inshort, FSP builds upon DSP and adds pro-active planning and contingency planning to the process. FSP is based onthe assessment of real options, contingency planning, monitoring, experimentation, and diversification [55]. How-ever, FSP lacks a detailed explanation of the application in practice.
Although all the three methods differ in their descriptions, they all have the same objective of achieving master plansor decision-making, which is robust for unexpected future changes. They differ primarily in consideration of ro-bustness, flexibility and planning process. Concerning the consideration of robustness, only DSP doesn’t explicitlyconsider robustness in the process. Furthermore, ADP and FSP both explore a more extended consideration of theflexibility of the plan. They both consider flexibility by some kind of contingency planning by pre-specification ofresponses. Lastly, the three approaches can be distinguished based on their planning process. Only the FSP does nothave a straightforward process specified.
Although different policies can be found in literature, their core objective is the same: establishing a continuing plan-ning process to monitor the defined plan and the conditions to be able to adjust the plan based on the circumstances.
2.4. ConclusionIt can be concluded that airport development is a versatile process prone to different uncertainties about the future.Airport planners and designers try to follow predefined distinct phases to ensure well-defined plans. However, tra-ditional master planning is prone to flaws due to considering single forecasts and developing strategies that are notrobust enough for the dynamic world. Recent research in this field focuses on the development of dynamic masterplanning processes.
Although different policies regarding dynamic master planning can be found in literature, their core objective is thesame: establishing a continuing planning process to monitor the defined plan and the conditions to adjust the planbased on the circumstances. Considering a hybrid combination of the different approaches will be the most beneficialfor decision-makers.

3Review on Stand Capacity Assessment
within Airport DesignIt is important to clearly understand the definitions of capacity to assess stand capacity to define strategic decisions.This encompasses how capacity can be measured and how the demand can be obtained using forecasting techniques.Although the thesis work will not be dedicated solely to forecasting demand, it helps to understand the broader con-text in which stand capacity assessment fits. Furthermore, before a framework can be defined, the different aircraftstands in airport development need to be investigated and their characteristics, pros and cons.
This chapter follows the aforementioned steps. It starts with an introduction into strategic planning and capacityevaluation in Section 3.1, followed by a description of forecasting techniques used within airport development inSection 3.2. After this, the context of stand capacity assessment within airport development is defined in Section 3.3.Following on this, a description of the apron system and the different aircraft stands is given in Sections 3.4 and 3.5,respectively. The chapter ends with a conclusion in Section 3.6.
3.1. Introduction into Strategic Planning and Capacity evaluationAs described in the introduction to this report, this research’s context lies within the field of stand capacity assessmentin strategic airport design. As a starting point, first, the term "strategic" will be outlined, followed by a description ofcapacity within aviation.
3.1.1. Strategic PlanningTo start with, it is vital to understand the meaning of "strategic" in the context of airport planning. In general, strategicplanning constitutes the steps followed by any organisation in which its future is defined through a plan to get theorganisation from its current state to its objective vision [78].
Strategic airport planning relates to the long-term future developments of an airport. The applicable period can differfrom 3-5 years up to 20 years [78]. A general overview of the strategic planning framework and the different objectivesis depicted in Figure 3.1. A master plan (as described in Chapter 2) is a result of the strategic development phase andis generally accompanied by a communications and monitoring plan [78]. The communications plan aims to serveas a means to inform the involved stakeholders and receive feedback from them. It contains the details on how thecommunication and interaction between the stakeholders should take place. On the other hand, the monitoring plancontains a description on the evaluation policy of the defined strategic plan.
Figure 3.1: Strategic planning framework [78]
35

3.2. Forecasting 36
3.1.2. Capacity within Airport DevelopmentCapacity is defined by Janic (2013) as: "the maximum number of units of demand, which can be accommodated dur-ing a given period of time under given constraints" [49]. The International Air Transport Association (IATA) definescapacity as: "the quantitative measure for the supply of service of a processing facility to accommodate sustaineddemand over a specified period of time, under given service conditions" [40]. These descriptions are similar and boildown to defining capacity as a system’s capability of fulfilling the demand presented to it.
The capacity of a system can be assessed using different measurements. IATA defines the following measurementsfor capacity [40]: dynamic, static, sustained, maximum and declared capacity. Dynamic capacity relates to the max-imum processing of demand through a system per unit of time. On the other hand, static capacity is defined by themaximum demand that a facility can withstand at any moment in time depending on the chosen level of service [39].The sustained capacity is represented by the demand, which can be sustained by the system per time unit withoutnegatively impacting the service’s objective level.
The measurements explained in the above paragraph serve as a means to define and assess the capacity of the differ-ent airport systems. Within the airside infrastructure, this can relate to runways, taxiways, aprons and stands. For thelandside infrastructure, a capacity assessment relates to the processing (passenger and baggage transactions), holding(waiting areas), and circulation facilities (movement between subsystems) [40].
Demand and capacity imbalance is a clear reason stressing out the importance of capacity assessment in airportplanning and balancing demand and capacity. An imbalance between the two factors will lead to delays. The objectivein strategy planning is not necessarily to avoid any delays, as a trade-off needs to be made between many factors suchas the costs of delays and the costs of capacity addition.
3.1.3. Stand Capacity MeasurementsIn strategic stand capacity assessment, the objective is to determine the number of stands (differentiated by type),which satisfies the requirements defined in the airport stakeholders’ vision. If the measurements for capacity as de-scribed in Subsection 3.1.2 are projected onto stand capacity assessment, the following distinctions can be made.
First of all, the static stand capacity can be described as the available number of stands (in any form) per aircraft type[49]. This can also be seen as the maximum number of aircraft that can be parked simultaneously at the apron com-plex. Seen in a broader context, an apron complex’s ultimate capacity should also incorporate the facility interface’sability to fulfil effective transfer of passengers, baggage and freight between the aircraft and the airport terminal [49].However, this literature study will not elaborate upon this, as this part of the assessment is out of the research scope.
The other form by which the stand capacity can be defined is the dynamic stand capacity. The dynamic capacity canbe seen as the maximum number of aircraft that can be facilitated during a particular time at the apron complex [49].This capacity is influenced by the number of stands (the static capacity), the aircraft mix, and the demand distribu-tion in time by aircraft category. Furthermore, the flight type is also a critical factor. The flight type relates to theorigin and destination of a flight. The following flight types can be distinguished: domestic, international, originating,terminating, and transit.
3.2. ForecastingFor any airport development process, airport planners have to rely on traffic forecasts to define their policies. As itis impossible to predict the future perfectly, the objective of forecasts is to provide airport development stakeholdersinformation concerning traffic scenarios, which can be used to evaluate uncertainties about the future [42]. for standcapacity assessment, airport planners have to rely on forecasts as input data for their assessment methods. The fol-lowing section describes a brief background on forecasting for airport developments, followed by an explanation ofthe forecast data used for stand capacity assessment.
It is chosen to limit the description in the following subsections to a description of the idea behind forecasts, a briefoverview of the techniques, and how forecasting fits within stand capacity. This to assure that the literature studyremains in line with the overall research objective as introduced in the introduction to this report. Developing trafficforecasts is not part of this objective. However, one can argue that a brief discussion aids the researcher in havinga broader context and understanding possible relations between the research objective results and processes at thebase of capacity assessment, such as forecasting.
3.2.1. Forecasting within Airport DevelopmentTwo levels of forecasting can be distinguished in general, aggregate forecasting and disaggregate forecasting. Ag-gregate forecasts consider the region’s total aviation activity (country, metropolitan area) of the considered airport.

3.2. Forecasting 37
Variables related to aggregate forecasts are the number of enplaned passengers, total revenue passenger-kilometres,and aircraft operations. Disaggregate forecasts assess the aviation activity at a specific airport. Some of the variablesconsidered in disaggregate forecasts are the number of enplaned passengers, air traffic movements, passenger origin-destination traffic characteristics and the number of origins and destinations. [38]
The International Air Transport Association defines in the airport development reference manual different forecastsfor the various development phases [40].
The scale and timing of facility development or expansion are based on annual traffic forecasts embedded in the Air-port Master Plan. Furthermore, estimates of peak hour passenger movements are appropriate for the sizing of thedifferent subsystems such as check-in counters, baggage reclaim areas and immigration desks. Lastly, the airside ca-pacity and runway requirements should be based on the forecasting of air traffic movements. However, since forecastsare generally "wrong" [15], forecasts should be based on appropriate techniques, be supported by information in thedefined study and should justify defined development policies.
As described earlier, each subsystem or part of the airport development process should rely on its appropriate fore-casting method. So what are these forecasting methods? Different forecasting techniques can be distinguished, eachwith its specifics. The International Civil Aviation Organisation (ICAO) divides forecasting methodologies into quan-titative and qualitative methods in their Manual on Air Traffic Forecasting [41]. It is chosen to use this description ofthe forecasting methodologies for the remainder of this subsection. The overview presented by ICAO is much moreextensive and follows a clear division between the different methods.
Figure 3.2 schematically depicts the main forecasting techniques as described by ICAO.
Figure 3.2: Overview of forecasting methods [41]
Quantitative forecasting methods can be subdivided into time-series analysis and causal methods. Time-series anal-ysis relies on historical data and assumes historical patterns to continue. Trend projection is a form of time-seriesanalysis. The available historical data is studied, from which a trend is determined. The main assumption in this isthat the factors which have driven past developments will continue to drive future traffic. Therefore, these forecastingtechniques heavily rely on stability in past developments. The result of trend projection is a graph with the dependentvariable (e.g. traffic) on the vertical axis and the independent variable (e.g. time) on the x-axis. The obtained graphcan be characterised by a trend curve, which can be represented by different mathematical relations, such as linear,exponential, parabolic and Gompertz. [41]
An other type of time-series analysis methods is the decomposition methods. These methods break the forecastingproblem down into multiple components. In case of strong seasonality in the historical data or other repeating pat-

3.2. Forecasting 38
terns, these methods can identify the following aspects of the data pattern: the trend factor, the seasonality factor andthe cyclical factor if applicable [41]. The characteristics and the specifics of the different methods will not be elabo-rated upon in this literature study, as the main objective of this part is understanding the objective of forecasting andobtaining an idea of the methods. The goal is not to understand the specifics of all the different forecasting methodsto conduct forecasts. For further information regarding these methods, the reader is referred to the ICAO Manual onAir Traffic Forecasting [41].
As described earlier, the second type of quantitative forecasting methods is the causal methods. Causal methods arebased on the incorporation of causal relations which affect the forecast variables. These causal relations can relateto economic, operational and social conditions. The idea behind causal methods is assessing the significance of thedependent variable’s mathematical relationship to the independent variables upon changes in these variables [41].One of the most widely used causal methods in the forecasting of aviation demand is regression analysis. The core ob-jective of regression analysis is to consider other variables defined as having a causal relation to the historical values.Simultaneous equations models are another type of quantitative forecasting methods. These methods involve morethan a single equation. The name of this methods is derived from the fact that these models’ variables simultane-ously satisfy all the defined equations. The main advantage of simultaneous equations models is that the model itselfcontains the variables which explain the obtained results. The last causal method, as described by ICAO, is spatialequilibrium models. These models’ core objective is to establish a relationship describing the movement of traffic be-tween two centres or regions. These techniques are mainly used to determine air traffic distributions between certainregions and are based on the proportionality of a region’s traffic to its size and inverse proportionality to the region’sdistance. [41]
If historical data or a profound understanding of the underlying patterns is lacking, qualitative forecasting methodsare applied. These methods are mainly based on expert judgement. The Delphi technique is a qualitative forecastingmethod based on the combination of the different prospects of the future. It uses the judgement of experts to deter-mine the most probable course of development. Technological forecasting is another qualitative forecasting method.Technology forecasting can be executed by assessing future conditions based on the current knowledge of a specificvariable. Another way of technological forecasting is to determine needed developments based on the assessment offuture goals and objectives. [41]
As described earlier in this subsection, there are many different forecasting methods to be distinguished. Quantitativemethods rely on the availability of historical data and data on the underlying influencing variables, while qualitativemethods are based on the qualitative judgement of developments based on, e.g. expert judgements. As the research’sobjective doesn’t incorporate the forecasting of variables, it is still decided to add a small background to the differ-ent techniques to assure that the broader context of airport development and the possible input of stand capacityassessment (which can be a forecast) is understood.
3.2.2. Forecasting for Stand Capacity AssessmentAfter a brief introduction regarding the general forecasting methods used in aviation forecasting, the following sub-section will describe how forecasting is used within stand capacity assessment.
The air traffic demand needs to be known to assess the required stand capacity of an airport. The specifics of thisdemand can differ per assessment method/framework used. The stand demand can be determined from forecastsof high-level airport systems, such as the runway system. This can result in obtaining the aircraft fleet mix, and thepeak demand on the apron [80]. The peak demand can be the hourly peak demand [38], which indicates the numberof aircraft to be parked simultaneously. This can be translated to the needed apron facility requirements. By also in-corporating the aircraft mix into this, the stand mix can be determined. Using the peak demand, the aircraft mix, andturn around times is also the current policy used within airport consultancy firms [68].
ICAO defines two methodologies for predicting the peak hour passenger aircraft movements in their Airport Plan-ning Manual [42]. Figure 3.3 depicts these two methodologies schematically. The main difference between the twomethodologies is the use of annual forecast data in method A and an aircraft peak day ratio to end up at the move-ments on a day level, from which a peak hour passenger aircraft movement by aircraft type is obtained. Method Brelies on a forecast of the peak hour passenger volume, from which the peak hour passenger aircraft movements aredetermined using a peak hour average load factor and a forecast of the aircraft mix. ICAO also acknowledges the dif-ficulty of forecasting a future aircraft mix. This difficulty can be tackled by analysis of trends in the world regardingaircraft mix and consultation of the airlines that will make use of the airport.

3.3. Stand Capacity Within Airport Development 39
Figure 3.3: Peak hour passenger aircraft movements forecasting methodologies [41]
The necessity for peak period forecasts in use for determination of demand lies within the objective of the to be de-signed facilities. The developed facilities’ design level should assure that they aren’t underutilised or overused [40].
In case of the need for extensive assessments of demand for the sizing of facilities (both passenger and aircraft han-dling facilities), design day flight schedules (DDFS) can be developed for a design day [40]. These flight schedulescontain detailed information regarding the scheduled flights, flight types, aircraft types, seating, origins and destina-tions, and arrival/departure times. This level of detail is beneficial to estimate the volumes of passengers throughoutthe terminal (for terminal design) and the volume of aircraft. The latter is mainly useful for stand capacity assess-ment as it contains all the necessary data needed to determine the needed capacity with a level of detail, enabling theairport planner/designer to assess multiple scenarios.
3.3. Stand Capacity Within Airport DevelopmentNow that an introduction has been given concerning airport capacity and forecasting, the following section will iden-tify where stand capacity assessment fits within the broader context of airport development.
One of the main objectives in airport development is the minimisation of the land used while still enabling the fulfil-ment of forecast demand and leaving room for any future expansions [49]. This stresses out the importance of properdemand and capacity determination for any of the airport systems. Mirkovic [62] and Janic [49] identify the runwaysystem as the primary airport capacity constraint. The development of the runway system is a large project in termsof the involved investment costs and the determination of the airport operational capacity (the number of aircraftmovements/operations which can be facilitated per hour). Although the runway characteristics (size and number)are driving the capacity of an airport, being able to assess the implication of the area used for the stands will aid theairport planners in determining the needed land area with more precision, as the stand mix (number and size) alsodetermines the apron size as well as the terminal configuration [42].
In strategic stand capacity assessment, the objective is to determine the number of stands (differentiated by type),i.e. the stand-mix, which satisfies the expected air traffic demand [62] [3]. Figure 3.4 depicts where stand capacityassessment fits within airport development phases as described in Chapter 2. The stand capacity is assessed as partof the apron complex capacity. The definition of the apron complex will be elaborated upon later in this chapter. Asdescribed earlier in this chapter, the stand capacity is based on the expected air traffic demand.
The stand demand is primarily related to the type of user. These users are airlines, cargo carriers, general aviation, andhelicopters [80]. Each airline flies its fleet mix, routes (domestic, international or mixed) and has its own service needs(requirements of aircraft and passenger handling). Based on forecasting techniques, as described in Section 3.2.2,the air traffic demand is determined. This can be a peak demand of air traffic movements [68] or a design day flightschedule. From this demand, the capacity needed is assessed, from which the land area required can be determined.This is an iterative process in which multiple solutions exist, all affecting the related airport systems.

3.4. The Apron System 40
Figure 3.4: Strategic planning framework [68]
3.4. The Apron SystemThe airport system comprises different subsystems. These subsystems are in literature generally grouped into twocomponents, namely airside and landside. Figure 3.5 depicts the different airport systems categorised by these twogroups schematically.
Figure 3.5: Overview of airport systems [38]

3.5. Aircraft Stands 41
Aircraft stands are part of a more extensive system, called the apron system. The apron is defined as: "a definedarea intended to accommodate aircraft for purposes of loading and unloading passengers, mail or cargo, fuelling andparking or maintenance " [44]. The apron system consists of the aircraft stands/gates (for parking aircraft, passengerembarking/disembarking and maintenance of aircraft), holding pads, de-icing pads and the taxiway system [62] [80].
3.5. Aircraft StandsAs described in Section 3.4, aircraft stands are part of the apron system. The following section will dive into the charac-teristics of airport stands and their designs, starting with a discussion on the different ways an aircraft can be parked,followed by a description of the methods of aircraft handling, and concluding with an elaboration concerning how thesizes of aircraft stands are determined or influenced.
Figure 3.6 depicts the general layout of an aircraft stand and its elements. It contains the physical area for parking ofthe aircraft, dedicated spaces for servicing equipment and the passenger loading bridges to enplane and deplane thepassengers. The thick red line below the aircraft’s tail defines the border between the aircraft stand and the apron taxiarea.
Figure 3.6: Overview of a general airport stand and its elements [71])
3.5.1. Parking an AircraftAircraft can enter and leave stands in different ways. The manoeuvres can be performed either using the power ofthe aircraft or with the help of towing vehicles. These procedures are largely determined by the terminal design. Fourdifferent methods of aircraft parking can be distinguished in literature.
The first method is called angled nose-in parking, as depicted in Figure 3.7. In this apron design, the aircraft is parkedat an angle with respect to the terminal building. The aircraft enters and leaves the stand using its power. Figure3.8 depicts the angled nose-out method. The obvious difference between this method and the angled nose-in is theopposite placement of the aircraft nose.
Figure 3.7: Angled nose-in parking [44] Figure 3.8: Angled nose-out parking [44]
Figures 3.9 and 3.10 depict the parallel parking and the taxi-in/push-out parking methods, respectively. In the par-

3.5. Aircraft Stands 42
allel parking method, also the aircraft’s power is used. However, in this method, the aircraft is parked parallel withrespect to the terminal building. The taxi-in/push-out method is the most conventional parking method applied inthe world’s busiest airports [44], in which the aircraft is parked perpendicular to the terminal building. In this method,the aircraft’s power is used during the taxi-in and is assisted by a towing vehicle during the taxi-out. The parallelparking method is the easiest method concerning the manoeuvres needed to taxi-in and out of the stand. However,this method also implies the largest stand area needed out of the four methods described. The angled nose-in andnose-out methods are second regarding the stand area needed, while the taxi-in/push-out method needs the leastarea [44].
Figure 3.9: Parallel parking [44] Figure 3.10: Taxi-in, push-out parking [44]
Terminal DesignThe apron design (including the positioning of stands) is related to the terminal layout applied in the airfield design,which is again related to the parking methods used. Different layouts can be used in the design of a terminal. Themost simple layout is the simple concept. This concept is characterised by a simplistic layout in which the aircraft isparked angled nose-in or nose-out to ease the operations. This concept is most widely applied at low traffic airports[44]. A representation of this concept is depicted in Figure 3.11.
Figure 3.11: Representation of the simple concept in terminal design[44]
Figure 3.12: Representation of the linear concept in terminal design[44]
The linear concept may be seen as an extended form of the simple concept. It is characterised by a linear positioningof the aircraft with respect to the terminal. Furthermore, the aircraft can be parked parallel or using the taxi-in/push-out method. A representation of this concept is depicted in Figure 3.12. Figure 3.13 depicts the pier concept. Thislayout consists of several linear concepts joined together, resulting in a pier design. The pier design allows for aircraftparking on both sides of the concourse [44]. The aircraft can be parked in several ways, either taxi-in/push-out, par-allel or angled. This is based on the terminal design.

3.5. Aircraft Stands 43
Figure 3.13: Representation of the pier concept in terminal design [44]Figure 3.14: Representation of the satellite concept in terminal design[44]
Another possible terminal design is the transporter concept, as depicted in Figure 3.15. This concept is also knownas a remote apron or open apron concept. The apron (and thus the aircraft stands) is located remotely from theterminal building, making it necessary to exploit any form of transportation of the passengers, luggage, and cargo.This concept’s benefit is to be found within the close location of stands to the runway, leading to short taxiing times.The final design is the hybrid concept. As the name would suggest, this concept might contain elements of otherconcepts resulting in a hybrid design.
Figure 3.15: Representation of the transporter concept in terminal de-sign [44]
Figure 3.16: Representation of the hybrid concept in terminal design[44]
3.5.2. Methods of Aircraft HandlingDifferent types of aircraft stands can be distinguished based on the parking method of the aircraft and the methodsused for handling of the aircraft and passengers. The following section will dive into the difference of aircraft standsbased on their handling of flights.
Contact StandsAn aircraft can be handled at so-called contact stands. These stands connect the terminal building and the aircraftseamlessly, which can be accessed directly from the terminal without the need for passenger bussing [40]. The avail-ability of fixed servicing equipment characterises these stands and the availability of a passenger loading bridge (PLB)[80]. The PLB is a corridor connecting the terminal and aircraft door to enable enplaning and deplaning of passengers.Two different types of PLBs can be distinguished from literature: stationary loading bridges and apron drive loadingbridges [80] [44]. A stationary loading bridge is characterised by a fixed link from the terminal concourse to a pedestalon the stand. The bridge has very limited manoeuvrability and supports minor variations between the terminal andthe aircraft’s main deck [44]. A schematic representation of a stationary PLB design is depicted in Figure 3.17.

3.5. Aircraft Stands 44
On the other hand, apron drive loading bridges are manoeuvrable around the stand and can adapt to different aircrafttypes and even provide over the wing servicing. Figure 3.18 depicts the design and use of an apron drive loadingbridge. The advantage of stationary loading bridges is the reduced area needed on the stand compared to apron driveloading bridges. However, this comes with a reduction in the usability of the bridge for different aircraft types.
Figure 3.17: Schematic representation of a stationary passenger load-ing bridge [44]
Figure 3.18: Schematic representation of an apron drive passengerloading bridge [80]
Non-Contact StandsNon-contact stands are related to contact stands. Non-contact stands are also located close to the terminal building.The difference between contact and non-contact stands is the use of stairs, mobile stairs or aircraft stairs to enplaneand deplane passengers [80]. Non-contact refers to the lack of a direct link between the terminal and the aircraft.
Non-contact stands offer a lower level of service and are mainly used by low-cost airlines seeking short turnaroundsand a reduction in the service level provided to their passengers.
Remote StandsRemote stands are located away from the terminal building and can require bus operations to transport the passen-gers to the aircraft. Remote stands are characterised by mobile servicing equipment, and the use of (mobile) staircases[44]. Furthermore, remote stands are used for overnight parking of aircraft, assuring no scarce contact positions aretaken by aircraft with long layovers. The stands used for overnight parking are also called RON (Remain Overnight)stands [80].
Remote stands provide a lower service level to passengers due to transportation operations from the terminal to theremotely located aircraft stands. On the other hand, remote stands also have some benefits, such as the flexible useof the available area. Furthermore, remote stands can accommodate a broad range of aircraft with a relatively simpleinfrastructure, and they require lower investment costs than contact stands. However, remote stands do imply opera-tional costs for the transportation of passengers. [79]
Swing StandsLarge airports experiencing flights with different origins and destinations require efficient handling of flights flyingto other areas (with different customs and immigration regulations). Swing stands are a versatile solution to thisproblem. These stands can accommodate flights with different origins and destinations (domestic, international,Schengen, Non-Schengen). The flights all have other requirements regarding customs and immigration. Swing standsare equipped with a multi-level terminal design to facilitate these flights, which allows the separation of passengerflows on different levels through sterile corridors [80]. These stands are, in essence, contact or non-contact stands,with additional functionality. Figure 3.19 depicts an example of the use of swing stands at Melbourne InternationalAirport. The use of swing stands results in the efficient use of the available land area and infrastructure and omits theneed for flight-specific dedicated terminals and stands.

3.5. Aircraft Stands 45
Figure 3.19: Example of swing stands at Melbourne International Airport [77])
MARS StandsTo assure efficient use of the infrastructure at busy airports, with different traffic waves across the day, so-called Multi-Aircraft Ramp System Stands (MARS) can be used. These stands can accommodate two narrow-body aircraft, or asingle wide-body aircraft [40] within the same area footprint. This results in the flexible use of the airport infrastruc-ture as well as flexibility in the planning. Furthermore, MARS stands increase the stand utilisation and reduce theinfrastructure cost [40]. Figure A.1 depicts the design of a MARS stand.
Figure 3.20: Design of a MARS stand [79]
3.5.3. Stand SizesThe size of a stand is influenced by multiple factors, such as the dimensions of the aircraft to be accommodated, thetype of stand (use of equipment such as a PLB influence the needed area), the aircraft parking method (based on theterminal layout) and separation requirements.
Aircraft Design GroupsICAO has grouped aircraft in different Aircraft Design Groups (ADGs), based on aircraft wingspan. The ADG is used todetermine the aerodrome reference code [45], which defines the type of aircraft an airport can accommodate. Table

3.5. Aircraft Stands 46
A.1 depicts the different groups along with the wingspan requirements. Furthermore, the table also contains an exam-ple of aircraft for each of the defined groups. Group A consists of general aviation aircraft, which are generally handledat non-contact stands [80]. Group B consists of regional jets, while group C is defined by narrow-body aircraft. GroupsD, E and F, consist mainly of wide-body aircraft. However, it has to be noted that the descriptions provided here arearbitrary, as there are some exceptions. An example of such an exception is the Boeing 757-200 with a wingspan of 38meters [6]. This aircraft belongs to design group D based on its wingspan, while it is labelled as a narrow-body aircraft.
AircraftGroup
Wingspan(meter)
Example Aircraft
A <15 Cessna 172, Cessna 525 Citation Jet, Piper PA-28 CherokeeB 15 <24 Bombardier CRJ100/200/700, Embraer ERJ-135/140/145C 24 <36 Airbus A318/A319/A320/A321, Boeing 737 (All Models), Bombardier
CRJ705/900/1000, Embraer E-170/-190 (All Models), McDonnellDouglas, MD-80/-90 (All Models)
D 36 <52 Boeing 757 (All Models), Boeing 767 (All Models)E 52 <65 Airbus A340 (All Models), Boeing 747-400, Boeing 777 (All Models),
Boeing 787 (All Models)F 65 <80 Airbus A380, Boeing 747-8
Table 3.1: Aircraft Design Groups as defined by ICAO [45] [80]
The Federal Aviation Administration (FAA) also defined a set of six aircraft design groups [30] similar to the groups asdefined by ICAO. Since the criteria as defined by the FAA are almost equal to the definition of ICAO, these are omittedfrom the report.
Furthermore, the FAA defined guidelines for five gate types in terms of sizing and the required clearances. Theseguidelines are summarised in Table 3.2.
Gate Type FAA DesignGroup
Criteria
A III Wingspan between 24 m and 36 mB IV Wingspan between 36 m and 52 m AND fuselage length less than 49
mC IV Same wingspan as for gate type B, fuselage length larger than 49 mD V Wingspan between 52 m and 60 mE VI Wingspan between 65 m and 80 m
Table 3.2: Guidelines for gate types as defined by FAA [2]
Aircraft Clearances and SeparationsSufficient separation between aircraft of adjacent stands is essential to avoid collisions between wingtips or othermovable parts of the aircraft. Table 3.3 depicts the recommended wingtip clearances per aircraft design group asstipulated by ICAO. These clearances also influence the stand sizes. It can be clearly seen that the bigger an aircraft,the larger the recommended wingtip clearance.
ICAO Aircraft Code Clearance (meters)
A 3.0B 3.0C 4.5D 7.5E 7.5F 7.5
Table 3.3: Wing tip clearances of different aircraft design groups as recommended by ICAO [80]
The needed wingtip clearance is also affected by the airport planner/designer’s vision concerning the design of accessof the stands. Having a vehicle servicing road between stands requires additional separation between aircraft. TheTransportation Research Board suggests an additional separation of 5 feet (1.5 meters) between the wingtip of a parkedaircraft and the edge of vehicle road in case of vehicle road between stands [80].

3.6. Conclusion and Reflection 47
3.6. Conclusion and ReflectionA clear understanding of the broader context of stand capacity assessment within airport development is the basis ofthis chapter. Stand capacity represents the quantitative supply of service to accommodate the service’s demand, asdefined by IATA [40]. Different measurements can be distinguished, such as static and dynamic capacity. However,the literature study did not elaborate on other measurements such as ultimate capacity and consideration of transferof passengers and baggage between the aircraft and terminal. This is defined as out of scope.
The anticipated demand is needed to assess stand capacity. Different forecasting methods are used for this. Basedon available forecasts of, e.g. the runway system and the fleet mix, the peak demand can be obtained. This can beused to obtain the hourly or peak hour demand for the stand capacity assessment process. However, forecasting ofschedules is defined as out of scope for the research project. Furthermore, design day flight schedules can be used todetermine the demand. The advantage of this is that not only peak hour characteristics are taken into account, butthat the effective use of stands is taken into account over a day. Therefore, a design day flight schedule will be used inthe research project.
Airport stands are part of the apron system, which is part of the airport system’s airside part. Aircraft stands can begrouped into contact or remote stands. Contact stands offer a higher service level to passengers due to a short (fixed)connection between the terminal and aircraft through a passenger loading bridge. Furthermore, a distinction can bemade regarding passenger servicing (swing stands) and aircraft servicing (MARS stands). Swing stands allow efficientuse of airport infrastructure due to the ability to serve aircraft with multiple customs and immigrations requirementsbased on the origin and destination. This is done by a multi-level terminal. Furthermore, the use of MARS stands,which enable facilitating two narrow-body or a single wide-body aircraft simultaneously, also influences the effectiveuse of infrastructure. Therefore, it is chosen for the thesis work to consider different stands (contact, remote, swing,and MARS stands) and their influence on the needed stand capacity in the framework.

4Review on Stand Capacity Assessment
ProceduresBefore the literature is analysed regarding existing optimisation frameworks and models, it is chosen to take a stepback and consider the different factors influencing stand capacity assessment in Section 4.1. Furthermore, some ofthe analytical assessment policies in literature will be touched upon along with the industry practices in Sections 4.2and 4.3, respectively. Lastly, the performance indicators in stand capacity assessment will be reviewed along with aconclusion in Sections 4.4 and 4.5, respectively.
4.1. Factors of influenceIt is essential to understand the influencing factors on stand capacity assessment before a proper theoretical frame-work can be established to contribute to the field. Therefore, the objective of the following section is to discuss thesefactors. To make sure that the description is structured to a certain extent, the different factors are grouped in thefollowing three groups, which also define the different subsections of this section: Economical/Operational Factorsare discussed in Section 4.1.1, Technical Factors in Section 4.1.2 and Safety Factors in Section 4.1.3.
4.1.1. Economical/Operational FactorsThe users of an airport, i.e. airlines, operators, and ground handling agents, define the characteristics of the availableairport infrastructure to a certain extent. The influence is represented by the user requirements regarding the levelof service to be provided. The Level of Service an airport offers in the form of, e.g. contact stands, terminal layout(walking times of passengers), and other facilities is determined by the airline community making use of the specificairport [40]. The negotiated level of service between an airport and the airline community using the airport facilitiesis noted down in a so-called service level agreement between the two parties [39].
A distinction can be made regarding the agreements made between the airport users and the airport operator in ex-clusive, preferential and common-use agreements [80]. Exclusive use agreements refer to airlines having the sole rightgranted to operate a certain gate or stand. If other airlines are also allowed to use stands that are granted solely to anoperator, this is referred to as preferential use agreements. In common-use agreements, there is no primary user ofstands. This adds much more flexibility to the planning process for airport operators compared to the other two agree-ments. Preferential and common-use agreements are characterised by higher average utilisation due to the dynamicuse of the stands by different airlines [80].
Even if an airport is equipped with stands defined under common use agreements, airlines might still prefer thetype of stand, based on the level of service an airline aims to provide to its passengers. A low-cost airline with shortturnaround times might prefer non-contact stands, due to the lower costs [73]. This airline preference can be a con-straining factor in stand capacity assessment.
The stand demand is described by the flights arriving at and departing from an airport. The flight schedule operated atan airport defines the spatial time peaking of aircraft demand. The gate occupancy time or turnaround times also in-fluence the needed stand capacity [68] and one of the factors determining the peak aircraft demand. The turnaroundtime (gate occupancy time), which can be extracted from the flight schedule, is a factor of influence, to be taken intoaccount in stand capacity assessment.
48

4.1. Factors of influence 49
The gate occupancy time is dependent on the aircraft type, the flight turnaround characteristics (is the flight origi-nating, a turnaround or a through flight), the number of passengers on the flight and correspondingly the amountof baggage and cargo, and lastly, the efficiency and productivity of the servicing/handling operations (the planning,productivity of personnel) [2].
4.1.2. Technical FactorsA factor not described in subsection 4.1.1 is the aircraft mix making use of the airport infrastructure. This aircraft mixis deduced from the flight schedule operated by the different carriers. As described in Section 3.5.3 the aircraft sizesdetermine the needed stand area. Since not all stand sizes can accommodate all the different aircraft groups (e.g.stand type D can accommodate all aircraft up to aircraft design group D, while the opposite is not true), the aircraftmix is a factor of influence.
Consideration of the airport site is an important factor throughout the airport design and planning process. Thisalso holds for stand capacity assessment. Site constraints might be in place regarding the physical area available forthe infrastructure, ground flow operating configurations, critical surfaces, and environmental considerations [80]. Ifapplicable, this should be considered a constraining factor in the stand capacity assessment.
4.1.3. Safety FactorsAssuring the safety and well-being of both passengers and aircraft is of key importance in the airport design process.As described in Section 3.5.3, to avoid collisions between aircraft on the apron area, separation requirements are de-fined as a recommended practice. These requirements have to be taken into account as constraining factors in thestand capacity assessment process.
Furthermore, national/international regulations impose requirements regarding the separation of passengers basedon their origin and destination to assure flight safety. Passengers flying domestically have less strict customs andimmigration requirements imposed on them during their travel, compared to, e.g. passengers flying internationally.Customs and immigration requirements might be translated into the separation of passenger flows by using differentterminals (and thus dedicated stands per flight type) or by having mixed stands (swing stands) that can be used byspecific O&D traffic. These are constraining factors which have to be taken into account by the airport planner andincorporated in the design.
Several options and policies can be distinguished to facilitate customs and immigration requirements: the first possi-bility is using dedicated terminals for domestic and international flights. In this case, the stands corresponding to theterminals are only to be used by the specific flight types, which can be accommodated in the respective terminal [62].The second option is using mixed terminals and swing stands (as described in Section 3.5.3. These terminals allowfor vertical separation between the different passenger flows (domestic and international). An example of an airportin which separation of passenger flows is achieved through vertical separation is Amsterdam Airport Schiphol. Thisairport has been reconstructed to facilitate these operations in a three-level pier design [2]. A schematic overview ofsuch a pier design is depicted in Figure 4.1. In the case of mixed flights, i.e. aircraft with a mix of domestic and interna-tional rotations, these can only be handled at mixed terminals. The design choice influences the capacity assessmentprocess in the form of additional constraints regarding the stand mix.
Figure 4.1: Schematic overview of a three-level pier design [2]
European airports have to deal with another factor regarding the separation of passenger flows. A free movement ofpassengers within all countries belonging to the Schengen area in the European Union is agreed upon, consisting ofboth EU and non-EU states [29]. Therefore, European airports have to deal with the separation of passengers travellingwithin the Schengen area and the passengers travelling from or/to the non-Schengen and intercontinental area [62].

4.2. Analytical Stand Capacity Assessment Policies 50
4.2. Analytical Stand Capacity Assessment PoliciesDifferent analytical methods to analyse or assess stand capacity are to be found in the literature. These methodsare based on the high-level assessment of capacity based on the expected traffic demand and averages for the gateoccupancy times and the traffic mix. The following section will describe two of the analytical methods found in theliterature: the numerical capacity assessment methods as described by EUROCONTROL [28] and Ashford et al. [2].
EUROCONTROL Capacity AssessmentEUROCONTROL defines in their Airport Capacity Assessment Methodology Manual (ACAM Manual) [28] three stepsof airside capacity assessment. These steps are related to the airport development phases. During the macro strategictime frame, structural airside capacity is assessed. At this point in time, the stand capacity is assessed at a macro level,not imposing constraints concerning aircraft stand compatibility. However, it must be noted that the described stepsof capacity assessment assume an already existing airport. Incorporating these constraints in a strategic time framefor new airports will help the airport stakeholders determine the needed capacity with much more precision.
The second step, as described by EUROCONTROL [28] is the determination of the planned airside capacity. Thisshould be calculated 18 months before the actual operations. This is in line with the strategic-tactical time frame inairport planning. During this assessment, the average turnaround time for aircraft should be incorporated as well asgate compatibility, overnight parking and towing operations.
As defined by EUROCONTROL in their ACAM Manual, the last step is the definition of operational capacity. This isthe most detailed capacity assessment before the actual day of operation. During this assessment, detailed weatherscenarios should be incorporated as well as ground handler constraints, landside capacity, the actual scheduled fleetmix and known overnight parking and towing operations [28].
Ashford et al. Analytical AssessmentAshford et al. describe in the book "Airport Engineering" [2] two analytical methods to determine the stand capacityfor the case in which each stand is available to all users and the case in which airlines have exclusive rights to usestands.
In both cases, the input data needed is the traffic mix divided over a set of aircraft classes and the average service timeper aircraft class (which can also be classified as the turnaround time). Equation 4.1 depicts the formula to calculatethe stand capacity in aircraft per hour.
C =Gc =G1
weighted service time(4.1)
In which C is the stand capacity, G the number of available gates and c the inverse of the weighted gate occupancytime. The weighted service time is determined by multiplying the average stand occupancy time of an aircraft class bythe percentage of aircraft belonging to the aircraft class.
In case of stands that are to be used exclusively by an airline, Ashford et al. defined Equation 4.2 to determine thestand/gate capacity of a system with exclusive use of stands by a specific aircraft group or class.
C = mi nall i
[Gi
Ti Mi
](4.2)
In which C is again the stand capacity, Gi the number of stands that can accommodate aircraft of class i, Ti the meangate occupancy time of aircraft of class i and Mi the fraction of aircraft class i demanding service. In this method,an additional input variable is needed compared to the all use case: the number of stands that can accommodate acertain aircraft class. Equation 4.2 can also be seen as the determination of the capacity per aircraft class i and thentaking the minimum capacity as the system capacity. In the case of exclusive use, the system capacity is not just thesum of the capacities of the different subgroups.
This simplistic analytical method’s clear drawback is that the number of stands has to be known beforehand, while itis desirable for strategic assessment of stand capacity to have the number of stands needed as the dependent variable.Furthermore, average gate occupancy times are used in the method as well as fractions of the different aircraft typesexpected, which might not always accurately represent the actual traffic.
Reflection and ConclusionAlso, other numerical stand capacity assessments are defined by other researchers and institutions. ICAO defined anassessment method based on a formula in which the needed stand capacity is based on a peak hour passenger fore-cast, the gate occupancy time per aircraft group and the number of arriving aircraft during the peak hour per aircraft

4.3. Industry Methods 51
group. Other analytical methods are amongst others defined by the following researchers: Janic (2001) [48], Newelland Edwards (1969) [27], Steuart (1974) [74], and Mirkovic [62].
The analytical methods described in this section are used for the first-order assessment of needed stand capacity.They have many drawbacks, such as considering average stand occupancy times and only considering peak hourdemand (which does not consider stand utilisation over the day). Using a peak hour demand does not capture alldemand characteristics and influencing factors such as the influences of runway capacity, as described by Mirkovic[62]. Furthermore, these methods do not consider the use of different stand types and do not optimise the stand-mixfor cost and efficiency. Therefore, they are not considered in the remainder of the project.
4.3. Industry MethodsDecision-makers can use different industry tools within airport planning and design. These tools are either in-housedeveloped or attained through partners (e.g. consultancy firms). The tools are capable of allocating aircraft to stands/gatesbased on specific objectives and constraining factors. An example of these tools is CAST Stand & Gate Allocation, de-veloped by Airport Research Center [1].
These tools are suitable for allocations within a tactical or operational time frame, in which the airport infrastructure isalready known. For stand capacity assessment within a strategic time frame, these industry programs are not suitabledue to the need for optimisation trade-offs between different objectives. This is mainly because of multiple existingsolutions for the problem.
4.4. Stand Capacity Assessment Performance IndicatorsTo assess, analyse and interpret any results obtained from a framework, it is important to define key performanceindicators (KPIs), which can be assessed for different scenarios and changes in variables. The following section willdescribe some of the key performance indicators found in the literature regarding stand capacity assessment.
Operational EfficiencyMany factors are related to operational efficiency, such as infrastructure availability, design and safety. The differentfactors influence the traffic flows at the airport, which inherently influences how servicing and stand demand is met[80].
One of the KPIs related to operational efficiency is the utilisation rate of stands, representing the utilisation per standover a specifically defined time frame. This can be the percentage of time during which the stand is used. Further-more, another KPI is the number of aircraft handled (per stand type) over the defined time frame [37]. The maximumnumber of occupied stands per type (simultaneously) related to the total number of stands per type can also be usedto determine the efficiency. The stand idle time also represents the operational efficiency. It depicts the time betweentwo consecutive assignments of flights to a stand.
Flexibility and RobustnessThe flexibility of an airport infrastructure determines its ability to react or cope with the dynamic airport world. Airlineschedules are not static. The same applies to the aircraft fleets [80]. Having a flexible infrastructure is represented bythe stand-mix’s ability to fulfil changes in demand or allowing cross usage of stands. This can be assessed by analysingthe change in the resulting stand mix by changing the aircraft fleet in the flight schedule (larger aircraft). This is rep-resented by the allocation rate to a stand type (the percentage of the flights handled at each stand type) for differentscenarios.
Robustness is related to the ability of the designed allocation schedule to cope with unexpected changes in the sched-ule. These changes can be delays in the scheduled arrival or departure times. A KPI related to robustness is the numberof reassignments needed due to a change in the flight schedule, as described by Deken [16].
4.5. ConclusionUnderstanding the factors influencing stand capacity assessment is of key importance in defining a framework to as-sess stand capacity assessment since these factors define the physical constraints and the factors which have to betaken into account. Different factors can be distinguished. These can be grouped into economic/operational factors,technical factors and safety factors.
Concerning economic/operational factors, airline level of service can be a constraining factor since it limits the as-

4.5. Conclusion 52
signment of stands to aircraft and also influences the resulting stand-mix. Furthermore, an influencing factor froman operational perspective is the turnaround time. However, this will be considered during the thesis as part of therobustness analysis. From a technical perspective, the aircraft mix as part of the flight schedule is another factor ofinfluence. This will be considered as part of a sensitivity analysis, as the flight schedule is the input of the to be definedframework. Another important factor is the available land area, which will be considered one of the framework’s keyfactors. Furthermore, physical safety factors are implied to assure the safety of passengers and aircraft. These factorsrange from separation requirements between aircraft to factors regarding the use of specific stands based on the ori-gin and destination of a flight.
Analytical methods for stand capacity assessment are found in literature, which provides a high-level estimate. Thesemethods will not be used in the definition of a framework due to their drawbacks. These methods are based on mul-tiple assumptions regarding the gate occupancy time of aircraft (averages are used) and the expected aircraft mix.Furthermore, these methods are generally defined around peak hour demands. This does not allow the decision-maker to consider all demand characteristics (throughout the day).
Decision-makers within the aviation industry (e.g. airport planners) might use in-house developed optimisationframeworks for stand capacity assessment. These tools are not well-suitable for application within a strategic timeframe since multiple assumptions have to be made regarding factors such as the expected traffic and turnaroundtimes.
Performance indicators are needed to analyse any defined framework. It is decided to use performance indicatorsregarding operational efficiency and flexibility/robustness. An important indicator is stand utilisation as well as theidle time between consecutive assignments. However, these indicators will also follow once a framework is definedand developed.

5Review on Modelling and Optimisation
FrameworksThe following chapter will describe the literature review results regarding modelling and optimisation frameworks inthe field of (strategic) stand capacity assessment. It starts with a description of the found frameworks in Section 5.1,followed by a description of the objectives used in frameworks in Section 5.2. Since in every optimisation model, cer-tain constraints are needed, Section 5.3 will elaborate on this. Section 5.4 will dive into the resolution methodologiesapplied to solve stand capacity and allocation models, followed by a description of multi-objective optimisation inSection 5.5. The chapter is concluded with a conclusion in Section 5.6.
5.1. Optimisation Frameworks in LiteratureSolving aircraft assignment to gates/stands is in the literature referred to as the Gate Allocation Problem (GAP) or theStand Allocation Problem (SAP). Different frameworks using different formulations can be distinguished. As describedby Dorndorf et al. [22], the research field can be divided into two main research streams. The first stream concernsmathematical programming techniques, while the second stream considers rule-based expert systems. The followingsection will describe the different frameworks found.
Static and Dynamic ModelsCheng et al. [13] classified the GAP/SAP into two types: static and dynamic models. Static models are characterisedby time-independence. Dynamic models, on the other hand, are time-dependent and have internal memory. Dy-namic models are further classified into stochastic and robust models. Stochastic models are based on probabilisticuncertainty (e.g. flight delays). Robust models are based on the assumption that the uncertainty is deterministic (e.g.known flight delays).
Mathematical Programming TechniquesThe core objective of the SAP is the assignment of aircraft/flights to a stand while optimising for cost efficiency, pas-senger convenience and the operational efficiency of the airport operations [11]. Many methods are to be foundregarding the modelling and optimisation of the problem. Bouras [11] performed an extensive literature review re-garding the state-of-the-art in the field of GAP/SAP. The first paper regarding GAP dates back to 1974. In this paper,Steuart [74] proposed a stochastic model to assess the behaviour of flights relative to their schedule and proposed amethod for estimating the number of required gates. Throughout the last decades, multiple solutions are proposed.The models’ programming formulation depends on the objective variables (integer, binary, quadratic) and objectivefunction (linear, non-linear).
The GAP is, in essence, a Quadratic Assignment Problem, which is an NP-hard problem as proven by Obata [67]. Limet al. [58], Diepen et al. [18], formulated the problem as an Integer Linear Programming (ILP) model to minimise thepassenger walking distance. The research of Lim et al. [58] showed that an ILP Solver (CPLEX) was outperformed inboth running time and solution quality by heuristics.
A Binary Integer Programming (BIP) framework is used by Tang et al. [75] and Kumar and Bierlaire [69], Mangoubi andMathaisel [60], Bihr [4], and Yan et al. [84]. These frameworks optimise either for the passenger walking distance or thecost of assigning an aircraft to a stand. Mixed Integer Linear Programming (MILP) models are defined among othersin literature by Bolat [9] [7], Seker and Noyan [85], Neuman [66], Guepet [35], Deken [16], Kaslasi [52], and Boukema[10]. The objective functions of these MILP models are related to minimisation of the range of slack times (the time
53

5.2. Optimisation Objectives 54
between the two successive assignment of flights to a stand), minimisation of the range of gate idle times, minimisa-tion of buffer times, maximisation of aircraft assigned to contact stands and minimisation of towing movements.
Mixed-Integer Nonlinear Programming (MINP) models are defined by Li [57] and Bolat [9]. Li [57] defined a model inwhich the number of gate conflicts of any two adjacent aircraft assigned to the same stand is minimised. In the modelof Bolat [9] the variance of gate idle times is minimised.
Other formulations found in literature defined the SAP as a clique partitioning problem (CPP), a stochastic model, ascheduling problem, and a network representation. For an extensive overview of these methods and the associatedpapers, the reader is referred to the overview as presented by Bouras [11] and Boukema [10].
Rule-Based Expert SystemsRule-based expert systems are based on a set of predefined rules regarding decision making based on human exper-tise. These rules are ordered by importance and are used in optimisation decision making. An example of rule-basedsystems for the allocation of stands to flights is described by Hamzawi [37]. Advantages of these systems are thathuman expertise is taken into account in decision making, and the systems can continuously be improved [14]. Thedrawbacks of these systems as described by Cheng [14] are the inefficiency of the systems regarding running time(comparing the different rules is time consuming), the systems often only represent a selection of a domain, andthese systems are not suited for solving numerical multi-objective optimisation problems efficiently.
Strategic Time Frame OptimisationsNot much of the investigated literature regarding SAP/GAP and stand capacity assignment considers the problemwithin a strategic time frame. Most of the research considers existing airport infrastructure. However, two researchpapers are investigated, which considered the stand capacity assessment problem within a strategic time frame.
Boukema [10] described the strategic stand allocation problem as a MILP model with the objective of minimising thecapital cost and operational cost related to the use of certain stand types. Boukema defined a framework in which thestand capacity is determined for a design flight schedule, after which a stand allocation model is optimised to allocatethe flights to individual stands. In this research, no explicit area limitations have been considered. However, the costof a specific stand is based on its area, which is also minimised due to the minimisation formulation of the objective.Kaslasi [52] also defined a stand capacity assessment model using a MILP formulation in which both infrastructurecost and allocation costs are minimised. The objective of the framework of Kaslasi is to minimise the number of standsand their size. This is done by incorporating the stand sizes in the objective function.
ConclusionBased on a literature review, it can be concluded that many frameworks can be used to model and solve the standallocation problem. The programming formulation is mainly defined by the chosen objective functions. Only twostudies considered the SAP within a strategic time frame (in which the capacity was not predetermined). Based onresearch performed by Bouras [11] it can be said that a formulation using a binary or an integer model formulationalong with the application of a linear programming tool is preferred in terms of modelling complexity and runningtime [11] [10].
5.2. Optimisation ObjectivesAs described in Section 5.1 different objectives can be distinguished in the literature regarding the SAP/GAP. The fol-lowing section will describe the different optimisation objectives.
Cost-BenefitsCost is not considered often in definitions of the SAP and GAP. One of the cost factors used in the stand allocationproblems in literature is capital cost and operational cost. Capital costs are associated with the needed investments(e.g. PLBs, area cost, building cost, pavement) to build the stands along with the related servicing equipment, themaintenance of the stands and depreciation costs [3] [80] [10]. On the other hand, operational costs are related to thecosts induced by operating specific stands. The operational costs consist of passenger transportation costs, equip-ment transportation, costs for leasing busses, and the aircraft towing costs. One might argue why these operationalcosts have to be included in analysing the stand capacity process. The reason for this is simply that the overall costand benefits of a specific stand decision are not only related to the needed capital cost. If only the capital cost wereto be included, there would be no need, e.g. for contact stands (due to the higher cost compared to remote stands).However, remote stands induce additional operational costs, which contact stands do not induce.
The application of the cost as an objective is found in the research of Boukema [10]. Boukema [10] defined the capitaland operational costs per stand type based on expert knowledge. The capital cost is determined to incorporate the

5.2. Optimisation Objectives 55
cost for a passenger loading bridge, the area cost, the building costs per square meter, utilities, and depreciation cost.Furthermore, Boukema considered the depreciation costs of the investments over a time frame of 20 years for thestands. The useful life used by airport stakeholders for depreciation of aprons (stands) is 24-60 years [64] [70].
On the other hand, the operational cost is defined by Boukema to include the cost for busses, boarding stairs and de-preciation cost. Since the trade-off between capital and operational cost is different for every airport and dependenton the stakeholders’ vision, Boukema considered weighting factors in the objective to make sure that a trade-off canbe made between the two costs based on the stakeholder interest.
Equations 5.1 and 5.2 depict the objective functions as defined by Boukema for the operational costs and capital costs,respectively.
M I N α∑i∈O
∑j∈Si
c2i j xi j [10] (5.1)
M I N (1−α)∑
j∈Si
c1 j y j [10] (5.2)
In which α is the weight factor given to the operational cost in the objective function, c2i j being the operational costof assigning operation i to stand type j , y j the number of stands of a particular stand type j , and c1 j the capital coststo build stand type j.
Kaslasi [52] adopted a cost objective based on the cost of a stand type, terminal complexity and the cost of allocatinga flight to a stand type (based on the handling preference, terminal area preference and the size fit).
Efficient use of stands can be reached by planning long stay aircraft at multiple stands, of which an remote stand isused for intermediate parking to free capacity at operational stands. This policy is already incorporated by airports,such as Amsterdam Airport Schiphol, as described by Diepen and Hoogeveen [19]. This flight splitting is found inresearch performed amongst others by Boukema [10], Kaslasi [52] and Prem Kumar [69]. Based on a defined timeinterval, aircraft turnarounds are split into two or three segments (of which an intermediate parking phase).
Maintenance CostThe maintenance cost of a stand depends on the infrastructure, the equipment (e.g. loading bridges), and the pave-ment (concrete or flexible pavement) [80]. The maintenance cost tends to increase with the lifetime of the infrastruc-ture [80]. No research has been found in which the stand allocation problem incorporated the maintenance costs of astand. Beudeker [3] did mention this in his research, however with lack of a proper definition on how to incorporatemaintenance costs into the objective.
RobustnessAs described in Subsection 3.1.1, the strategic time frame refers to multiple years before the actual day of operations.Therefore, considering operational delays is not possible (since the flight schedule is not flown yet). However, it ispossible to assess the robustness of the obtained results by adding buffer times (to the scheduled arrival and depart-ing time), simulating changes during the day of operations [22]. These buffer times will simulate the effect of delayson the capacity. Optimising a model for robustness is mainly performed for tactical and operational time frames.
Deken [16] proposed a robust scheduling methodology for the robust allocation of stands/gates to aircraft. Other re-search work in this field is performed amongst others by Bolat [8], Dorndorf et al. [22] and Kaller [51].
Prem Kumar [69] presented a mathematical framework in which robustness in a gate allocation problem is includedusing a so-called minimum gate rest. This gate rest represents the idle time between two successive assignments ofaircraft to a gate. The objective of this addition is to be able to cope with delays in the flight schedule.
Land Area MinimisationThe area used is an important factor in airport design and planning. The core objective is to minimise the land areaused for developments and take into account the needed area for future expansions [38] [49]. This objective is notfound in almost any of the literature on stand capacity assessment and allocation frameworks. Boukema [10] andKaslasi [52] considered the land use in their frameworks through the cost function in the objective function. The costof assigning an aircraft to stands is based on the stand size in these studies. In the research of Boukema [10], theland area used is minimised by the cost objective (a larger and more complex stand also has a higher cost). The sameprinciple is applied by Kaslasi [52], in which the number of stands and size are minimised. This is done by taking intoaccount the size of stands in the objective function.

5.3. Optimisation Constraints 56
Level of ServiceThe level of service can also be the objective in stand capacity assessment instead of only a constraining factor. Most ofthe early developed frameworks on SAP and GAP use a form of modelling the level of service as an objective. Minimis-ing the passenger walking distance is a widely used objective ([60], [84], [4], [83], [25]). Another used objective is themaximisation of the assignment of flights to their preferred stand ([25]) or the minimisation of the aircraft allocatedto remote stands ([35], [33], [58], [69]).
Airport Operational EfficiencySome of the models in the literature use objectives in which operational efficiency is considered. The objectives foundare: the minimisation of the number of towing operations [25], [23], [24], minimisation of the number of stand con-flicts between flights [20], maximisation of the idle times [18] [24] [23], and minimisation of the waiting time for aflight allocation to a stand [58].
5.3. Optimisation ConstraintsOperational and physical restrictions are modelled through constraints in modelling frameworks. The following sec-tion will describe the different constraints found in the literature on stand capacity/allocation frameworks. It firststarts with a description of the essential constraints in Section 5.3.1, followed by a description of user-specific con-straints in Section 5.3.2.
5.3.1. Essential ConstraintsMany of the earlier described optimisation frameworks apply constraints based on the objective of the model. How-ever, there are some constraints that any developed model or mathematical formulation should obey. Drexl andNikulin defined two necessary constraints: only a single aircraft can be assigned to a stand simultaneously, and everyoperation should be only assigned to a single stand [25]. Dorndorf et al. defined an additional constraint regardingspace and service restrictions of adjacent stands [22].
Single Stand per AircraftThe most obvious and most important constraint is the stand processing constraint. This constraint represents thephysical constraint that only one stand can be assigned to handle/service an aircraft. This constraint is modelled inall the literature found using different variables. However, the idea behind this constraint is the same and boils downto the formulation as depicted in Equation 5.3. If xi j is the binary variable expressing the assignment of operation ito stand type j with Si the set of stands compatible for operation i , this constraint assures that the sum of all possibleassignments to operation i is 1. This is equivalent to only assigning one of the compatible stand types to an aircraft.∑
j∈Si
xi j = 1 ∀i ∈O [10] (5.3)
One Aircraft per StandTo assure no overlapping between the assignment of operations/aircraft to the same gate, a time variable has to betaken into account in the modelling of stand capacity assessment. If this is not constrained, multiple operations oraircraft might be allocated to the same stand. Different definitions of this constraint can be found in the literatureregarding stand/gate allocation.
Within the literature on stand capacity/allocation assessment, two types of time modelling methodologies can be dis-tinguished. In single-time slot models conflicting flights are defined, after which the model is constrained to onlyallocate a single flight from a set of conflicting flights [25] [22]. Multiple-time slot models consider the entire timeframe of flights by defining a fixed number of time slots [22]. A drawback of multiple-time slots is the influence onstand utilisation and the fact that these models are less exact compared to the single-time slot models. Furthermore,due to the increase in decision variables in multiple-time slot models, the models’ running time also increases rapidly.Research performed by Deken [16] revealed that the running time for a multiple-time slot model is double the timefor a single-time slot model.
Stand CompatibilityAs described in Section 3.5.3 stand sizes are defined based on the aircraft design group an aircraft falls into. There-fore, in stand capacity optimisation, not every stand type can be assigned to an aircraft. The compatibility of a standwith a specific aircraft operation needs to be taken into account in the model’s definition. Deken [16] formulated aconstraint that assures that the number of assigned stands for an aircraft is equal to 1 by checking a matrix containingbinary information regarding a flights compatibility with a specific stand. Boukema defined a set of compatible standtypes Si for an operation, from which a stand is chosen in the optimisation framework.

5.3. Optimisation Constraints 57
Variable Stand CapacityIn the literature on stand/gate allocation, capacity is generally a fixed variable. Most of the literature solves the standallocation problem in a tactical or operational time frame. Research performed by Boukema [10] and Kaslasi [52] de-fined stand capacity as a variable instead of a fixed number.
Boukema combined the variable stand capacity constraint with the earlier described "one aircraft per stand" con-straint (which assures only a single operation is allocated to a stand simultaneously). Different strategies are foundin the literature regarding the modelling of this constraint. The definition of this constraint should be carefully con-sidered as it might influence the model’s running time significantly [10] [16]. This possible significant influence isfounded by the introduction of time. A check has to be performed, which assures that for every moment in time (sec-ond, minute etc.), there is no overlap in the allocation for every aircraft for every stand, which increases the numberof variables depending on the definition.
An efficient formulation is defined by Boukema [10] based on the single-time slot formulation as described earlier inthe description of the "one aircraft per stand" constraint. Conflicting sets of operations are defined for each uniquearrival time. For each aircraft selected in a conflicting set, an additional stand must be added due to the constraint.The definition of this constraint assures that no aircraft are overlapping and that the stand capacity is variable, as de-picted in Equation 5.4.
C (10, j , t ) :∑
i∈Ot
xi j ≤ y j ∀t ∈ T, ∀ j ∈ Si [10] (5.4)
Note: It might be desirable to fix the stand capacity (of all the stand types or a single stand type) to be able to assessthe performance of a solution. In such a case, an additional constraint needs to be modelled, limiting the addition ofstands of a specific type up to a defined capacity level.
5.3.2. User Specific ConstraintsThe second set of constraints found in the literature is specific to the defined model and objective defined by a re-searcher. A selection of these constraints will be elaborated upon below. The focus will be on the constraints whichare important for strategic stand capacity assessment.
Flight SplittingFlight splitting concerns long stay aircraft which are assigned to multiple stands (up to three) to ensure that the avail-able infrastructure is not occupied by non-operational aircraft. Flights with a long turnaround time can be first as-signed to a contact stand to allow the passengers to disembark, followed by an assignment to a remote stand, afterwhich it can be assigned again to an operational stand for the next flight. In this way, the available capacity can beused more efficiently.
Boukema defined three types of flight splitting. The first type considers no flight splitting. In this case, a flight ishandled at a single stand. In the second type, an aircraft is handled at two different stands with an arrival part and adeparture part. Finally, the third type is the most extended type considered in the research of Boukema. It considers athree-split of a flight in an arrival phase, a parking phase and a departure phase. This three-split is beneficial for long-stay aircraft, as it assures that scarce and valuable contact stands are not blocked by non-operational flights openingup the capacity for other flights. Furthermore, it increases the flexibility of scheduling operations [10].
The mathematical formulation of the flight splitting as defined by Boukema is depicted in Equation 5.5. Boukemaaltered the set of operations O based on the turnaround time of a flight. Based on flight eligibility for a two or three-split, two or three operations are added to the set of operations. To assure that only a single version of a flight can bechosen, constraint 5.5 is defined. In which V1i , V2i and V3i define the selection of the no-split, two-split or three-splitversion, respectively (binary variable). Based on the selected split version, additional constraints are formulated.
C (1, i ) : V1i +V2i +V3i = 1 ∀i ∈O [10] (5.5)
Equation 5.6 defines the assignment of a single stand for a no-split flight from the set of compatible stands Si . In thecase of a two-split flight, Equation 5.7 defines the allocation of both the arrival and departure phase of the flight toa compatible stand. Variables A2,i and D2,i define the allocation of a stand to the arrival and departure phase of atwo-split flight, respectively. Constraints 5.8 and 5.9 assure that only a single stand is assigned to the two phases.
C (2, i ) : V1i =∑
j∈Si
xi j ∀i ∈O [10] (5.6)

5.4. Resolution Methods 58
C (3, i ) : 2V2i = A2,i +D2,i ∀i ∈O2 [10] (5.7)
C (4, i ) : A2,i =∑
j∈Si
xi j ∀i ∈O2 [10] (5.8)
C (5, i ) : D2,i =∑
j∈Si
xi j ∀i ∈O2 [10] (5.9)
The same set of constraints are defined for a three-split version of a flight. Equation 5.10 defines that the arrival,parking and departure phase are all assigned to a stand. The Equations 5.11, 5.12 and 5.13 constrain the differentphases to be assigned to exactly one stand.
C (6, i ) : 3V3i = A3,i +P3,i +D3,i ∀i ∈O3 [10] (5.10)
C (7, i ) : A3i =∑
j∈Si
xi j ∀i ∈O3 [10] (5.11)
C (8, i ) : P3i =∑
j∈Si
xi j ∀i ∈O3 [10] (5.12)
C (9, i ) : D3i =∑
j∈Si
xi j ∀i ∈O3 [10] (5.13)
Examining the constraints above, one might argue the need for so many constraints in the definition of an optimi-sation framework. In the research of Boukema, clear reasoning is provided for the choice of 9 constraints, namely adecrease in the running time of the model. Boukema describes a decrease by a factor 8 in the model’s running timewith the earlier described constraints compared to the use of a single more complex constraint [10]. An example of asingle flight splitting constraint in literature is found in the research of Deken [16].
MARS Stand ConstraintsAs described in Section 3.5.3, MARS stands can accommodate a single wide-body aircraft or two narrow-body aircraftsimultaneously. In the earlier defined constraints, the model is limited to only assigning a single aircraft operation to astand, which is conflicting. To solve this conflict and model the allocation of aircraft to MARS stands correctly, Kaslasidefined additional constraints for MARS stands [52]. Two types of constraints can be distinguished for the modellingof MARS stands. The first type concerns the modelling of two narrow-body stands by assuring the number of narrow-body stands being twice the number of wide-body stands. The other type concerns the "blocking" of the narrow-bodypositions of a MARS stand in case of occupation by a wide-body aircraft.
Stand Sector Compatibility / Level of ServiceBased on the origin and destination of a flight, certain customs and immigration requirements are imposed [62].These requirements are translated into the separation of passenger flows through separate terminals or multi-levelterminals [2]. The division can be made in domestic (e.g. Schengen), international (Non-Schengen) or swing stands(both domestic and international flights). This has to be constrained. The same applies to the user-specific level ofservice constraints, such as assigning certain flights to a specific type of stand.
Another user-specific constraint is sector compliance. In the case of airports in which a clear division has to be madebetween different sectors (domestic, international, Schengen, Non-Schengen), aircraft operations to certain standshave to be constrained.
5.4. Resolution MethodsDifferent resolution methods can be found in the literature on SAP/GAP. Resolution methods can be distinguishedconcerning the algorithmic method used to find a solution to the defined optimisation problem. Furthermore, a dis-tinction can be made regarding the solver applied. The following section will describe the state-of-the-art concerningthe methods and solvers used in stand capacity/allocation assessment.
5.4.1. MethodsThe optimisation techniques applied in the stand capacity/allocation problem can be divided into three groups: exactalgorithms, heuristics, and meta-heuristics. These methods will be described below.

5.4. Resolution Methods 59
Exact AlgorithmsExact algorithms yield an optimal solution [11] using different algorithms such as branch & bound, simplex, primal-dual and column generation. The branch and bound (B&B) algorithm is based on a search of the solution space bydefining subproblems. Different solutions are explored. Instead of exploring all the possible solutions, the algorithmexplores branches of a created tree (with the candidate solutions) that result in a better solution [10]. Another exam-ple is the branch and cut (B&C) algorithm. The B&C algorithm is based on the same principle as B&B. However, B&Cadds a cutting-plane method, in which the feasible set of solutions is refined using cuts (linear inequalities) [51]. Thedrawback of the B&C algorithm is the inability to deal with symmetrical solution branches. However, the BC and BBalgorithms can also use heuristics to, e.g. determine an upper bound [56] (therefore, they are sometimes classified asheuristics).
The core of column generation is considering variables and resources in an optimisation framework only if they influ-ence the result positively. Therefore, certain "columns" (which might depict the choice for a certain resource) are notconsidered at all, reducing the running time significantly [18]. Mangoubi and Mathaisel [60] defined an ILP model forminimising the total passenger walking distance. The integrality was relaxed, and the relaxed model was solved usingcolumn generation. Bihr [4] used a primal-dual simplex algorithm to find an optimal solution and was successful infinding one. Yan and Huo [83], Bolat [7] [8], and Wang [81] applied branch and bound to solve their developed models.
Heuristic AlgorithmsObata [67] described in his research the gate allocation problem as a quadratic assignment problem, which is an NP-Hard problem. Therefore, different researchers have proposed different heuristic algorithms to solve the NP-Hardproblem. Since it can be impossible to obtain an optimal solution in a reasonable time frame in some formulations,heuristics and meta-heuristics are applied [10]. Ding et al. [20] [21] used a greedy algorithm to solve the gate assign-ment problem with an objective of minimising the number of ungated flights. Lim [58] also used a greedy algorithmalong with approaches with an "insert move algorithm" and an "interval exchange move algorithm". A drawback ofheuristic algorithms is that they do not always provide an optimal solution due to reaching a local optimal solutionand getting stuck [11].
Guépet et al. [35] analysed the difference between exact algorithms (applied using the commercial solver CPLEX) andthe use of heuristic algorithms. The following algorithms were compared: decomposition methods, the ejection chainalgorithm and the greedy algorithm. The performance of the different methods was assessed using real-case data oftwo major European airports. The results of this research showed that for a stand allocation formulation, the exactalgorithms yield better results compared to using heuristics at the cost of a longer running time (dependent on thenumber of operations). The greedy algorithm outperformed all the other algorithms in terms of computational time.However, it also compromised the optimality of the solution the most. This can be explained based on the foundationof the greedy algorithm. It chooses the most optimal solution available at the current stage of the solution search byconsidering the local optimum rather than the global optimum, as described in Neuman [65].
Meta-Heuristic AlgorithmsTo capture the aforementioned drawback of heuristic algorithms, meta-heuristics have been developed. Meta-heuristicsare often also labelled as modern heuristics. The difference between meta-heuristics and heuristics is the introductionof systematic rules in meta-heuristics which result in an ability of the algorithms to move out from local optima [11].This is done by allowing solutions that result in a worse objective function result. Different meta-heuristic algorithmscan be found in literature, such as the genetic algorithm (Gu and Chung [34], Bolat [9]) and tabu search (Lim et al.[58], Xu and Bailey [82]).
Xu and Bailey [82] analysed the performance difference between an exact algorithm (branch and bound) and a meta-heuristic (tabu search). They concluded that both approaches yield optimal solutions. However, the tabu searchalgorithm outperformed the branch and bound algorithm with respect to CPU time. Cheng et al. [13] have performeda study on the performance difference between several meta-heuristic algorithms. They analysed the genetic algo-rithm, tabu search, simulated annealing, and a hybrid form of simulated annealing and tabu search [11]. The tabusearch algorithm outperformed simulated annealing and the genetic algorithm. However, the hybrid method wasbetter than the tabu search algorithm concerning the solution quality.
Conclusion and ReflectionDifferent optimisation techniques can be distinguished from the literature on stand/gate capacity assessment andstand allocation frameworks. Exact algorithms are used to obtain optimal solutions, if possible, within a reasonabletime frame. If due to the problem formulation it takes a lot of time to converge to a solution, heuristics and meta-heuristics can be applied. Heuristics tend to converge to local optima, which is avoided in meta-heuristics.
A detailed overview of the different techniques applied within this research field with many more research papers can

5.5. Multi-Objective Optimisation 60
be found in the research performed by Bouras [11]. Boukema added some other literature to the overview of Bourasfrom the years 2015-2017 [10]. It has to be noted that the conclusions of the different researchers regarding the perfor-mance of different optimisation techniques do not necessarily hold for alterations in the definition of the optimisationmodels (alterations in the objective function and constraints). The only thing which can be stated with certainty isthat their conclusions hold for their specific defined optimisation frameworks.
Since not much research is done in the application of stand capacity assessment within a strategic frame, the researchwork of Boukema [10] and Kaslasi [52] is used as a basis to define the framework and justify the choices regarding theformulations and optimisation methods. The choice for a resolution method is based on their research and encom-passes the use of exact algorithms to solve the strategic stand capacity assessment problem.
5.4.2. SolversA solver is needed to solve an optimisation model. A solver is a software type applying different optimisation princi-ples such as branch and bound to solve defined problems. In the literature regarding the stand allocation problem,commercial solvers such as CPLEX and Gurobi are mainly used. Research has revealed that CPLEX is able to solveMILP formulations of the stand allocation/capacity problem within reasonable time ([58], [19], [35], [10], [52], [66],[69]).
A research study performed by Mittelmann [63] regarding benchmarks of optimisation solving software (simplex LPsolvers) revealed that commercial software outperforms free versions. The following optimisation software was anal-ysed in the benchmark of October 2018: CPLEX 12.8, Gurobi 8.1, Mosek 8.1, FICO Xpress 8.5, Coin-OR CLP 1.16.11,Google-GLOP, SOPLEX 4.0, LP Solve 5.5.2, GLPK 4.64, MATLAB R2018a, and SAS-OR 14.3. The results showed thatGurobi outperformed the other two commercial software, CPLEX and FICO Xpress. The best free optimisation tool interms of running time was Coin-OR CLP 1.16.11, which CPLEX in the benchmark study slightly outperformed.
A similar study has been performed regarding the performance of the solvers for mixed-integer linear programmingmodels [63]. These results show that the commercial tools Gurobi, CPLEX and FICO Xpress outperform the other freeones concerning running time.
Note: In 2019, the commercial companies FICO and CPLEX withdrew themselves from the benchmark results of Mit-telmann, after which also the results of Gurobi have been omitted. Therefore, it has been decided to include the latestbenchmark results in which the commercial solvers are taken into account in this literature study.
ConclusionBased on the analysis of the benchmark results of Mittelmann [63], and the availability of a Gurobi license for studentsat the Delft University of Technology, it has been decided to use Gurobi as the optimisation tool in the course ofthe thesis work. The results of research performed by Diepen and Hoogeveen [18] [19], Kaslasi [52], and Boukema[10] revealed that the use of CPLEX (which has comparable performance as Gurobi) along with the use of a simplexalgorithm successfully solved stand capacity and stand allocation problems.
5.5. Multi-Objective OptimisationIn the early developments of stand allocation and capacity assessment, the models were mainly formulated with asingle objective (such as in Haghani [36]). Throughout the years, frameworks have been developed, which openedthe need for multi-objective approaches to capture the complexity of the problem. As different factors influence theassessment and allocation problem, as is described in the earlier sections. The challenge of multi-objective optimisa-tion is finding an optimal solution based on a trade-off between the different objectives (which might be conflicting).In the case of multi-objective optimisation, a Pareto Optimal (PO) solution should be sought. In a Pareto optimal so-lution, none of the objectives can be improved without decreasing another objective. [61]
Different methods for multi-objective optimisation are described by Miettinen [61]. These methods are grouped intofour categories: no-preference methods, a posteriori methods, a priori methods and interactive methods.
In no-preference methods, the decision-maker does not play a role. The decision-maker is presented a PO solutionbased on the preset importance of the objectives. Multiple PO solutions are generated in a posteriori methods, whichare then presented to the decision-maker. A posteriori methods are computationally expensive. In a priori methods,the decision-maker defines the preferences regarding the objective. However, defining the preferences can be difficultdue to underlying correlations if the decision-maker does not well understand the problem. Interactive methods arehighly-developed methods that require a high involvement from the decision-maker to direct the solution process.These methods generate fewer solutions with no interest for the decision-maker, reducing the information load pre-sented [61].

5.5. Multi-Objective Optimisation 61
One of the a posteriori methods is the Weighted Sum Method (WSM). This method requires the assignment of weightsto the different objectives, representing the objective’s priority. An example of the use of a Pareto Front analysis (ina posteriori setting) is to be found in the research of Boukema [10]. The weight of a weight factor (α), related to theweight given to the optimisation for operational cost in the objective function, is determined using a Pareto Frontanalysis in which the decision-maker decides on the solution point for a specific al pha. In this Pareto analysis, theresults of the trade-off between the capital and operational cost are assessed (based on the choice for certain weightfactors). The analysis conducted by Boukema [10] was extended by investigating the influence of the weight choiceon KPIs (such as the number of tow movements and bus movements).
A drawback of WSM is the ambiguity associated with the assignment of weights to objectives. Correlations and non-linear effects might be overseen. A variant of WSM is lexicographic ordering (a priori method), in which a hierarchy isdefined for the objectives, which is subsequently translated into the weight factors. The drawback of this is the lack ofa trade-off between the objectives. Furthermore, objectives with a lower ordering might have no chance to influencethe solution, since the method stops if the current objective in the hierarchy has a unique solution [61].
Földes [33] applied the posteriori WSM through a Weight Space Search (WSS) algorithm for an objective function con-sisting of 5 objectives. Many solutions were created with different weight factor settings, which were then clusteredinto unique weight ranges that resulted in comparable objectives using the k-means clustering method. Földes con-cluded that the individual weights of the objectives do not represent the value of the Pareto optimal objective value,but the weight combinations do. This reveals the disadvantage of a priori methods. If the decision-maker does notwell understand the objectives and their correlations, this can result in unexpected results.
Deken [16] assigned weights to the objectives in a priori setting. The importance of objectives is defined in advanceby objective hierarchy. The weights linked to the objectives are determined using the maximum achievable value ofan objective part.
Decision Making ProcessThe a posteriori methods as described earlier, in which the decision-maker improves the desired solution by control-ling the importance of the objectives, can be seen as a form of alternative-focused thinking [53]. However, it might bedesirable to first define the objectives (values) of the stand capacity assessment problem, after which possible alter-natives to comply with the set values are explored. This process is also known as value-focused thinking [53]. Sincethe objective in strategic stand capacity assessment is to proactively assess the implications of different decisions re-garding the optimisation objectives, a value-focused thinking approach is beneficial.
Keeney [53] described four steps in a value-focused thinking framework. The first step is the identification of objec-tives. This can be achieved through a discussion between the involved stakeholders. After objectives have been iden-tified, they have to be structured. This step assures that every objective defined is a fundamental objective (insteadof e.g. alternatives, constraints and criteria). The next step consists of creating alternatives to the defined problem,followed by the final step, which consists of defining decision opportunities. A value-focused thinking approach issuccessfully applied by Földes [33] in his research on tactical stand capacity assessment.
ConclusionDifferent objectives are involved within stand capacity assessment, which might be conflicting. Multi-objective op-timisation captures the optimisation complexity of problems through different assessment methods: no-preferencemethods, a posteriori methods, a priori methods and interactive methods. Based on the application of these methodswithin research, different pros and cons can be defined. Research performed by Boukema [10] concerning strategicstand capacity assessment revealed that multi-objective optimisation using a posteriori methods provides a com-prehensive insight into the problem. However, it requires engagement from the decision-maker to choose a specificsolution based on the generated solutions. Furthermore, a posteriori methods tend to have the highest computationaltimes [61]. On the other hand, a priori methods provide less insight into the problem than a posteriori methods butrequire less user engagement and have a lower computational time [61]. However, defining the weights of objectivesin a priori methods can be ambiguous and require the decision-maker to have a well-defined understanding of thepossible correlations between objectives. If not, unexpected results can be obtained [52].
The optimal solution in multi-objective optimisation can be a trade-off between conflicting objectives. This meansthat a solution can not be further improved without lowering one of the objectives. Therefore, Pareto Optimal solu-tions are found in the literature, in which a decision concerning a solution is made using, e.g. a graphical representa-tion of the relation between two objectives.
Enabling a decision-maker to decide through a value-focused thinking process can be beneficial to proactively assess

5.6. Conclusion and Reflection 62
the implications of decisions and obtain solutions based on the desired objectives and values. The thesis aims toinvestigate the added value of value-focused thinking in strategic stand capacity assessment. This will be linked to themulti-objective optimisation method to be used (either a posteriori or a priori method).
5.6. Conclusion and ReflectionOptimisation frameworks are essential in the assessment of complex mathematical problems such as stand capacityassessment. The different frameworks, objectives, constraints, resolution methods, and multi-objective optimisationmethodologies are described in this chapter based on a literature review.
Both static and dynamic models can be distinguished in literature. The difference between the two is the time-dependency in dynamic models. Furthermore, the research field can be divided into mathematical programmingtechniques and rule-based expert systems. Much of the research concerning the stand capacity and stand allocationproblem concerns mathematical programming techniques. Different formulations are to be found for the problem.However, not much research is found in which stand capacity assessment is addressed within a strategic time frame.Based on research performed, it is concluded that mixed-integer programming formulations and applying a linearprogramming tool are preferred in terms of complexity and running time.
The objectives used in formulations of the stand allocation problem differ from passenger-oriented (minimisationof the passenger walking distance) to airport efficiency-oriented (maximisation of the use of stands, minimisation ofidle times between stand assignments, minimisation of towing operations). Furthermore, land area minimisation isgenerally not considered explicitly in optimisation frameworks. However, the stand sizes and area are minimised us-ing cost objectives. Therefore, consideration of area limitations either through an objective or constraints is definedas a gap in the literature, which is assessed in the thesis work. No research is found which considered robustness instrategic stand capacity assessment. Therefore, the aim of the thesis will be the definition of a framework which allowsthe assessment of the influence of different stand types, operational factors (towing operations, robustness, flexibility)and area limitations (either through an objective or constraints). The prior research performed by Boukema [10] andKaslasi [52] form the basis of this, as the frameworks have proven to be able to assess stand capacity assessment withina strategic time frame.
To represent the physical world in mathematical formulations, constraints have to be modelled. These constraintsimpose that solutions meet requirements such as only a single aircraft is assigned to a stand, only a single stand isassigned to an aircraft, and the assigned stand is compatible with the aircraft type. Furthermore, some user-specificconstraints are found in literature based on the modelling objectives (such as incorporating flight splitting to ensureefficient use of stands). These constraints will be assessed during the thesis work and applied if deemed necessary.However, some of the essential constraints have to be modelled in any formulation.
Different resolution methods can be distinguished in literature, such as exact algorithms, heuristic algorithms andmeta-heuristic algorithms. Exact algorithms yield an optimal solution. Heuristic and meta-heuristic algorithms areused if it is impossible to obtain an optimal solution within a reasonable time. Based on research in the field, it isconcluded to apply exact algorithms to solve the strategic stand capacity assessment problem. Exact algorithms haveproven to yield better results than heuristics [35]. However, the running time has to be considered carefully. Further-more, it is decided to use Gurobi to solve the framework due to its availability and good benchmark results as obtainedfrom the literature.
Stand capacity and allocation problems can be defined as multi-objective problems. In a Pareto Optimal solution,none of the objectives can be increased without decreasing another objective. Different methods can be applied inmulti-objective optimisation, such as no-preference methods, a posteriori methods, a priori methods and interactivemethods. The choice for one of the methods depends on the running time, desired insights and user engagement.Both a priori and a posteriori methods have been applied to solve the strategic stand capacity assessment problem inthe past. For the course of the thesis, the choice for a method will be based on the desire to obtain a framework basedon value-focused thinking (which is linked to a priori and a posteriori methods). Therefore, weighting methods mightbe used both in a priori or a posteriori settings to assess the difference.

6Conclusions
Stand demand is one of the key parameters in airport planning and design. It influences the needed facilities and, sub-sequently, the land area needed. Based on anticipated stand demand, stand capacity is assessed by decision-makersas part of an airport development process. Stand capacity represents the quantitative supply of service to accommo-date the demand for the service. There is no single answer to define stand capacity for an airport. It depends on thestakeholders’ strategic vision, as the stand capacity problem can be optimised for different objectives and considermultiple constraints.
This part of the report consists of the results of a literature study performed regarding stand capacity assessmentwithin a strategic time frame as part of an MSc. graduation project at the Delft University of Technology. The lit-erature study is focused on best practices and the current state of the art regarding modelling and optimising standcapacity assessment. However, to assure that the broader context in which stand capacity assessment fits is under-stood, it also contains a review on airport development and forecasting methods. It has to be noted that forecastingof stand demand is out of the scope of the research.
Different factors influence stand capacity assessment. These factors range from economic, operational to technicaland safety factors. Some of the factors have to be considered as constraining factors, such as the aircraft stand com-patibility and immigration requirements (regarding the separation of passenger flows).
Based on the performed literature study, it can be concluded that the stand assignment problem is widely discussedwithin the literature. However, the research’s focus is generally on the application within a tactical or operational timeframe. Not many research studies have been found considering the stand capacity problem within a strategic timeframe. Furthermore, to be able to perform a well-defined trade-off between different optimisation strategies, opti-misation models and frameworks are needed. Analytical methods are not suited for this purpose, as these methodsare based on assumptions such as gate occupancy times and the expected traffic mix. Furthermore, these methodsgenerally consider peak hour demand, which does not capture all demand characteristics over a period.
The chosen objective defines the mathematical definition of a model, which subsequently defines the resolutionmethods which can be used. Different resolution methods can be distinguished in literature, such as exact algo-rithms, heuristic algorithms and meta-heuristic algorithms. Exact algorithms yield an optimal solution. Heuristic andmeta-heuristic algorithms are used if it is impossible to obtain an optimal solution within a reasonable time frame.Strategic stand capacity assessment models are formulated in literature as mixed-integer linear programming optimi-sation models and solved using exact algorithms. These algorithms have proven to yield better results compared toheuristics, as is proven by Guepet [35].
A clear gap can be defined within the research field. This gap relates to the definition of an optimisation frameworkallowing a decision-maker to consider a trade-off between different stand types, operational factors (robustness, flex-ibility) and area limitations through value-focused thinking. As the effectiveness of the use of a mixed-integer lin-ear programming model and an exact algorithm modelled through the optimiser CPLEX is proven by Diepen andHoogeveen [19], Kaslasi [52] and Boukema [10], a framework will be based on this. Therefore, the thesis’s scope willbe on the development of a mathematical optimisation framework that incorporates the aforementioned gap. Thiswill contribute to the body of knowledge in the field of airport planning and design and aid decision-makers in theirairport planning process.
63

IIIFurther elaboration on thesis work
64

AExtended Framework Input
The following chapter contains an extended description of the framework input, complementary to the thesis paper.First, the different used stand types are described in Section A.1, followed by the considered stand sizes and terminaltypes in Section A.2. Furthermore, the stand compatibility and allocation principles are discussed in Section A.3. Anin-depth overview of the capital cost and operational cost definitions is described in Sections A.4 and A.5, respectively.
A.1. Stand TypesAircraft stands are part of a larger system, called the apron system. The apron is defined as: "a defined area intendedto accommodate aircraft for purposes of loading and unloading passengers, mail or cargo, fuelling and parking ormaintenance" [44].
The apron system consists of the aircraft stands/gates (for parking aircraft, passenger embarking/disembarking andmaintenance of aircraft), holding pads, de-icing pads and the taxiway system [62] [80].
Different types of aircraft stands can be distinguished not only based on the aircraft’s parking method but also on themethods used for handling the aircraft and passengers. The following stand types are implemented in the framework.
Contact StandsAn aircraft can be handled at so-called contact stands. These stands connect the terminal building and the aircraftseamlessly, which can be accessed directly from the terminal without the need for passenger bussing [40]. The avail-ability of fixed servicing equipment and a passenger loading bridge (PLB) [80] characterises these stands. The PLB isa corridor connecting the terminal and aircraft door to enable enplaning and deplaning of passengers.
Non-Contact StandsNon-contact stands are related to contact stands. Non-contact stands are also located close to the terminal building.The difference between contact and non-contact stands is the use of stairs, mobile stairs or aircraft stairs to enplaneand deplane passengers [80]. Non-contact refers to the lack of a direct link between the terminal and the aircraft.
Non-contact stands offer a lower level of service and are mainly used by low-cost airlines seeking short turnaroundsas well as a reduction in the service level provided to their passengers.
Remote StandsRemote stands are located away from the terminal building and can require bus operations to transport the passen-gers to the aircraft. Remote stands are characterised by mobile servicing equipment, and the use of (mobile) staircases[44]. Furthermore, remote stands are used for overnight parking of aircraft, assuring no scarce contact positions aretaken by aircraft with long layovers. The stands used for overnight parking are also called RON (Remain Overnight)stands [80].
Remote stands provide a lower service level to passengers due to the need for transport operations from the terminalto the remotely located aircraft stands. On the other hand, remote stands also have some benefits, such as the flexibleuse of the available area. Furthermore, remote stands can accommodate a broad range of aircraft with a relativelysimple infrastructure, and they require lower investment costs than contact stands. However, remote stands do implyoperational costs for the transportation of passengers [79]. Two types of remote stands are implemented within theproposed framework, being: operational and non-operational stands. Non-operational stands are not used for em-
65

A.2. Stand Sizes and Terminal Types 66
barking/disembarking of passengers, but only for intermediate parking of aircraft with a long turnaround time.
MARS StandsTo assure efficient use of the infrastructure at busy airports, with different traffic waves across the day, so-called Multi-Aircraft Ramp System (MARS) [40] stands can be used. These stands can accommodate two narrow-body aircraft, ora single wide-body aircraft [40] within the same area footprint. This results in the flexible use of airport infrastruc-ture as well as flexibility in the planning. Furthermore, MARS stands increase the stand utilisation and reduce theinfrastructure cost [40].
Figure A.1: Design of a MARS stand [79]
A.2. Stand Sizes and Terminal TypesIn determining the different stand types, a differentiation is made concerning stand sizes and terminal types. This isan added layer to the aforementioned sets of stands that are differentiated regarding handling type.
Stand SizesThe defined stand types are based on the Aircraft Design Groups (ADGs) as defined by ICAO. The ADG is used to de-termine the aerodrome reference code [45], which defines the type of aircraft an airport can accommodate. TableA.1 depicts the different groups along with the wingspan requirements. Furthermore, the table also contains an ex-ample of aircraft belonging to each of the defined groups. Group A consists of general aviation aircraft, which aregenerally handled at remote stands [80]. Group B consists of regional jets, while group C is defined by narrow-bodyaircraft. Groups D, E and F, consist mainly of wide-body aircraft. However, it has to be noted that the descriptionsprovided here are arbitrary, as there are some exceptions. An example of such an exception is the Boeing 757-200 witha wingspan of 38 meters [6]. This aircraft belongs to design group D based on its wingspan, while it is labelled as anarrow-body aircraft. In the proposed framework, the following stand sizes are defined: C, D, E and F. These standsizes all refer to the aircraft design groups from Table A.1. Groups A and B are not considered since the aircraft in thesegroups do not limit the stand capacity in the framework proposed.

A.3. Stand Compatibility and Allocation Principles 67
AircraftGroup
Wingspan(meter)
Example Aircraft
A <15 Cessna 172, Cessna 525 Citation Jet, Piper PA-28 CherokeeB 15 <24 Bombardier CRJ100/200/700, Embraer ERJ-135/140/145C 24 <36 Airbus A318/A319/A320/A321, Boeing 737 (All Models), Bombardier
CRJ705/900/1000, Embraer E-170/-190 (All Models), McDonnellDouglas, MD-80/-90 (All Models)
D 36 <52 Boeing 757 (All Models), Boeing 767 (All Models)E 52 <65 Airbus A340 (All Models), Boeing 747-400, Boeing 777 (All Models),
Boeing 787 (All Models)F 65 <80 Airbus A380, Boeing 747-8
Table A.1: Aircraft Design Groups as defined by ICAO [45] [80]
Terminal TypesLarge airports experiencing flights with different origins and destinations require efficient handling of flights flyingto different areas (with different customs and immigration regulations). Swing stands are a versatile solution to thisproblem. These stands can accommodate flights with different origins and destinations (domestic, international,Schengen, Non-Schengen) through a multi-level terminal design, which allows the separation of passenger flows ondifferent levels through sterile corridors [80]. These stands allow for efficient use for sector switching flights and crossutilisation of the available infrastructure (use for a specific sector during peaks). Therefore the following three termi-nal types are defined: domestic, international and swing.
A.3. Stand Compatibility and Allocation PrinciplesThe compatibility of a flight to the stand types is determined in the "Data Processing Unit" of the framework, as ex-plained in Section 3.2 of the paper. This is determined based on three aspects: the aircraft size, the origin airport andthe destination airport. The aircraft size determines the compatibility concerning the stand size. On the other hand,the origin and destination airports define the sectors a flight falls into (Schengen, Non-Schengen/International or acombination), limiting the terminal type. The compatible terminal type also depends on if a flight is split.
The stand compatibility of contact and non-contact stands is depicted in Table A.2. In principle, this stand compat-ibility is straightforward; a stand can handle all aircraft up to the respective ADG. However, there is an essential con-sideration in the story, being the passenger boarding bridges. Due to passenger boarding bridge slope requirements[32], a C-type aircraft cannot be handled at an E and F stand. This is validated upon analysis of reference airport, suchas Amsterdam Airport Schiphol [72].
ADG Handling Type Compatible Stand Size
C Contact C, DD Contact D, E, FE Contact E, FF Contact FC Non-Contact C, D, E, FD Non-Contact D, E, FE Non-Contact E, FF Non-Contact F
Table A.2: Stand compatibility of contact and non-contact stands
Stand Compatibility Policy Flight SplittingAircraft with long turnaround times can be split into two or three parts to create efficient schedules or free up con-nected stand capacity. Within the framework, the following restrictions are implemented. If a flight is split into twophases, the split parts can only be assigned to contact or non-contact stands. The same applies to the arrival anddeparture parts of a three-phase split flight. The parking part of a three split can be assigned to either a remote oper-ational or remote non-operational stand (not used for passenger processes). The reason for this lies within the policybehind the implementation of the split versions, as described in the thesis paper. A flight can be split into two phasesif it results in efficient use of the infrastructure (e.g. for sector switching aircraft). Furthermore, a flight can be splitinto three phases if it frees up connected stand capacity. These policies are validated upon research of the policies

A.4. Capital Cost 68
implemented at Amsterdam Airport Schiphol.
To assure no unnecessary two splits are performed by the model, towing of non-sector switching aircraft is penalisedby a factor 2. This is done through the analysis of the turning point at which no unnecessary tows are performed.
Allocation Principles Remote Stands and Cargo FlightsTwo restrictions are imposed within the framework. The first restriction concerns the remote non-operational stands.These stands are only compatible with the parking phase of the three split version of a flight. Furthermore, full cargoflights are always assigned to remote operational stands. These decisions have been validated upon analysis of poli-cies implemented at Amsterdam Airport Schiphol [72].
Allocation Principles Towing and Bussing OperationsIn order to be able to use remote stands, busses are needed for the transportation of passengers from the terminal tothe aircraft. Therefore the number of needed busses is implemented in the model. A few decision had to be maderegarding the policies for bussing operations. First of all, the busses’ capacity is set to 55 passengers per bus (basedon analysis of reference airport). Furthermore, an assumption had to be made regarding the task scheduling time (thetime a bus is occupied with a particular flight operation). This is set to 20 and 30 minutes for narrow-body and wide-body aircraft, respectively. The implications of this choice are assessed through a sensitivity analysis, as describedin Chapter D. Busses are assigned both for the arrival and departure part of a flight. For the arrival part, busses areassigned at the scheduled arrival time of a flight, while for the departure part, busses are assigned 45 minutes beforethe scheduled departure time. Due to the complexity of assigning busses for departure parts of a flight (passengersare not at the same time at the same place), it is decided to penalise the assignment of busses to departure parts of aflight by a factor of 2.5, upon other research performed in the field of strategic stand capacity assessment [10].
Furthermore, the number of tow trucks is modelled. Tow trucks are needed for the departure pushback of aircraft aswell as the towing of flights that are split. A distinction has been made concerning narrow-body and wide-body towtrucks. In case of a two split, the following policy is implemented: aircraft are towed away 40 minutes after departureto a second stand. In case of a three split, an aircraft is towed to a remote parking stand 60 minutes after arrival andis towed back to an operational stand 60 minutes prior to departure. Also, for the tow trucks, an assumption had tobe made regarding the task scheduling time of tow trucks (the time a tow truck is occupied with a task). This is set to15 minutes for narrow-body aircraft and 20 minutes for wide-body aircraft. The implication of this assumption is alsoanalysed through a sensitivity analysis in Chapter D.
A.4. Capital CostThe objective of the proposed framework is the minimisation of the capital and operational cost. The definition of thedifferent cost factors will be elaborated upon below.
StandsEach stand type’s capital cost is based on three aspects: the stand area, the terminal, and the need for a passengerboarding bridge. The stand area is defined around three parts: the terminal area, the area for the aircraft parking andthe taxiway area. The terminal cost is considered through the building cost (based on the number of layers). Thecost factors for a PBB, area cost and building cost are based on a literature search ([10], [3], [5]) and the analysis ofpolicies implemented at reference airport ([72]. In the definition of the areas, the following requirements have beenimplemented: wingtip clearances [80], nose to building clearances [80] and the taxi lane to object clearance [80].
In the definition of the different areas, a few assumptions have been made. The area cost per m2 is higher for E and Fstands due to the increased complexity associated with a larger stand (such as an increase in the number of passengerboarding bridges). The same cost is adapted for MARS stands. Furthermore, the area cost of remote stands is lowerthan operational stands of the same type due to the decrease in stand complexity (e.g. no need for underground sys-tems ). The same policy is adopted for the area cost of remote non-operational stands, as these stand types requireno operational equipment (they are only used for remote parking). The capital cost is deduced to a cost per day byadopting a depreciation period of 20 years [46].
Area LimitationsThe proposed framework is capable of incorporating area constraints on the optimisation problem. This can be donein multiple ways, such as constraining the available area for the optimisation problem or by incorporating the area inthe objective function. Due to the nature of the strategic stand capacity assessment problem in which the cost is thepredominant factors, it is chosen to adopt the following policy. An area limitation block is implemented consisting ofthree parts: the freely available area (this consists of the area that is available for the optimisation case at no inducedcost), the area available at the cost of paving and the area that is available at the cost of acquisition and pavement. By

A.5. Operational Cost 69
adopting this policy, there is no interference between objective functions due to the adopted KPI (the area limitationis implemented as a cost induced in the objective function as a penalty in the minimisation problem). The pavementcost is set to 110 euro/m2 based on an average cost for pavement in airport development [47]. Furthermore, the costof land acquisition is primarily set to 150 euro/m2. This is based on the land cost per m2 in the Netherlands withan added factor to represent the degree of how constraining it is having to use any area within the third "block" ofavailable land area.
EquipmentAnother essential factor in stand capacity assessment is the use of equipment, such as busses and tow trucks and theirimplications on the stand mix. Therefore, the number of needed busses and tow trucks are implemented as part ofthe decision variables. The capital cost of busses is set to 500,000 euro (based on analysis of bus prices) for a passen-ger bus with a capacity of 55 passengers. This implies a capital cost of 146 euro with a depreciation of 10 years [47](including the cost of boarding stairs).
For the tow trucks, a distinction is made between narrow-body and wide-body tow trucks. The capital cost of a narrow-body tow truck is set to 200,000 euro [47] (55 euro with a depreciation of 10 years). The investment cost of a wide-bodytow truck is based on the price of a narrow-body tow truck as obtained from literature and is set to 500,000 euro (137euro per day) with a depreciation of 10 years.
As described in the discussion regarding the capital cost of busses, boarding stairs have also been added to the busses’respective capital cost. However, the number of boarding stairs is not implemented as a decision variable in theproposed framework because these are partly linked to the busses (the needed number of boarding stairs can partlybe deduced from obtained bus decision variable) and the lack of a clear added value to the stand capacity assessmentproblem within a strategic time frame.
A.5. Operational CostThe second main objective of the proposed framework is the operational cost. The operational cost comprises thecost induced by the use of equipment (busses, tow trucks and boarding stairs). For the boarding stairs, the opera-tional cost comprises the investment cost (this is not considered in the capital cost part of the objective as is done forthe busses and tow trucks), the personnel cost, cost for fuel and maintenance cost. This is set to 6 euro per boardingstairs operation for narrow-body aircraft and to 12 euro for wide-body aircraft (due to assignment of two boardingstairs). This policy has been validated upon reference research [10].
For the tow trucks and busses, the operational cost consists of three parts: fuel/electricity cost, maintenance cost andpersonnel cost. The following assumptions are made for the operational cost of bus operations. The operational costof a bus is set to 15 Euro per operation. This is based on an electricity cost of 0.32 Euro/km [50], a maintenance costof 0.40 Euro/km [76] and personnel cost of 5 Euro per operation.
The operational cost of the tow trucks is centred around the same three main factors as for the busses. The operationalcost for narrow-body tow trucks is set to 60 euro per operation and 88 euro per operation for wide-body tow trucks.This based on:
1. A daily cost of 655 euro for fuel (6,152,726 MJ/year [47], an energy content of 36 MJ/liter for diesel [54], anaverage price of 1.40 euro/liter for diesel [54]) which is translated back to a cost per operation based on anassumption of the average movements per day for narrow-body trucks (15 movements) and wide-body trucks(10 movements).
2. An average maintenance cost of 8 euro for narrow-body tow trucks and 13 euro for wide-body tow trucks peroperation. This determined based on average maintenance cost of 25 euro/hour [47], an assumption of 5 hoursfor the in-use time of the tow trucks. This is translated back to a cost per movement upon an assumption of theaverage movements per day as for the fuel.
3. Personnel cost of around 9 euro per movement. This based on an assumption of the average gross salary ofpersonnel (50,000 euro per year).

BModel Architecture
The following chapter will describe the architecture of the developed model. The model can be found in the filestand_capacity_model.py. A flow diagram of the model is presented in Figure B.1. It consists of multiple parts, whichwill be explained below. The designators in the figure (top left of each block) refer to specific labels in the model code.
P0 - Read Input Data: In this part of the model, the input data is read. The input data consists of four databases storedthrough Excel sheets, inputSchedule.xlsx (containing the design day flight schedule), actypes.xlsx (containing thecompatibility of all the aircraft types), input_stands.xlsx (containing the stand data: costs, areas, operational costs)and airport.xlsx (containing geographical information of all the worldwide airports).
P1 - Set Optimisation Goals: The first part consists of the unit switches through which the optimisation goals aredefined: to (not) consider area limitations, flight frequencies, stand hard input, stand minimal input, multi cases (tocreate a Pareto), limit the running time or robust scheduling.
P2 - Set Optimisation Parameters: In this part, the different optimisation parameters are defined, such as the cost ofthe equipment and the times for towing and bussing operations.
P3 - Functions: To assure a efficient use of the model some functions have been defined, which are used multipletimes throughout the code. Functions have been created to convert datetime strings to minutes for arithmetical op-erations and the other way around, assess if two flights are conflicting, and obtain unique times from a list (used forthe definition of conflicting operations).
P4- Process Input Data: After the optimisation parameters have been set, the data is processed to obtain: the needednumber of busses per flight, split eligibility of flights, bussing and towing operations, conflicting flight sets, flight tostand compatibility data.
P5 - Optimisation Unit: Once all the data is processed, the optimisation model is created (P5A) in which the decisionvariables are added, the objective is set, and the constraints are added (P5B), after which the Gurobi optimisation pa-rameters are set (max running time, Focus etc.).
P6 - Store Results and create output files: If an optimal solution is found, the optimisation results are stored andfurther processed into, e.g. graphs.
P7 - Decision Maker Dashboards: The output data is store in the so-called spydata format. These are used in twoseparate files to obtain interactive decision-maker dashboards, which are modelled through the DASH framework.Dasboard.py can be used to obtain a dashboard in which a single case run can be analysed, while Dasboard_MR.pycan be used to obtain a dashboard in which multi cases can be analysed.
70

71
Figure B.1: Schematic representation of the model architecture
Needed Python Packages:gurobipyopenpyxl (load_workbook)mathnumpydatetimeplotly.expresspandasmatplotlibmatplotlib.pyplotplotly.subplotsplotly.iopio.renderers.default=’browser’dashdash_core_componentsdash_html_componentsdash_bootstrap_componentsplotly.graph_objectstimeit

CModel Verification & Validation
The following chapter will describe the verification and validation strategy employed. Verification has been performedin three ways: quality control (by assessment of the efficiency and clarity of the code), code verification (verificationof parts of code using numerical cases) and system verification (verification of the framework through a numericalcase). The validation and model performance is described in the paper in Part I of this thesis report. The followingchapter will summarise part of the performed system verification of the developed mathematical model in SectionC.1. Furthermore, the methodology followed for the validation will be elaborated upon in Section C.2 after whichsome data is presented to support the defined results and conclusions in Section C.3.
C.1. VerificationC.1.1. Test ScheduleTo verify the capabilities and results of the developed optimisation model, a verification study has been performed. Atest schedule has been created consisting of four international flights. The flight schedule is depicted in Table C.1. Itis chosen to adapt a simple schedule of which the solutions are also easily computed by hand.
Flight Nr 1 Flight Nr 2 Arrival Time Departure Time Origin Destination A/C Type Passengers Arrival Passengers Departure Weekly Frequency
UA20 UA21 09:00:00 12:00:00 IAH IAH 738 189 189 7XC21 XC802 09:00:00 12:00:00 AYT AYT 738 189 189 2AM25 AM26 11:30:00 13:30:00 MEX MEX 789 274 243 7DL46 DL47 13:30:00 15:00:00 JFK JFK 76W 226 226 6
Table C.1: Flight Schedule used for the Verification Runs
C.1.2. Verification ResultsThe input schedule as described in Section C.1.1 is used in the developed model. The model is run for a single cost inwhich both the operational and capital cost are equally taken into account (no trade-off between the two). The resultsof the optimisation are depicted in Table C.2. The table shows the costs and the number of equipment for three runs:the base run (in which the model is ran without any additions), the MARS run (in which the MARS stands are verified)and the flight splitting run (in which the splitting of flights is verified).
Run Base MARS stands Flight Splitting
Objective Function Value: 3,726 1,660 1,119Capital Cost: 3,231 1,376 847Operational Cost: 4,901 280 268Number of busses: 5 0 0Number of NB Tow Trucks: 2 2 2Number of WB Tow Trucks: 1 1 1
Table C.2: Verification results for the test schedule
Base RunAs described, in the base run the model is optimised for a single case in which both the operational and capital costwere taken into account equally. Table C.3 depicts the assignments of the flights to stands. This is graphically depicted
72

C.1. Verification 73
in Figure C.1 through a GANTT chart. For the base run, the model builds three stands. This is sufficient for the sched-ule.
The assigned stands are all compatible with the flight sectors of the aircraft. From the results, it can be seen that allflights are assigned to compatible stands (based on size). This verifies constraint set 1 and 2. Furthermore, only one ofthe flights is assigned to a larger stand (flight 2). In this solution, two narrow-body tow trucks are needed (flights 1 and2 are conflicting) and a single wide-body tow truck (for flight 4). Since only flight 3 is assigned to a remote operationalstand, five busses are needed (274/55) for passenger transportation. Both the number of tow trucks and busses isverified with the model results, as shown in Table C.2 (this verifies constraints 4 and 5).
Flight Stand Type Stand Size
Flight1 14 Non-Contact CFlight2 5 Contact DFlight3 27 Remote Operational EFlight4 5 Contact D
Table C.3: Assignments of the flights to stands in the base run
Figure C.1: Schematic overview of the flight assignments to stands in the base run. The colours depict the stand types
MARS ConstraintAs described in the paper, the framework also incorporates so-called MARS stands. These stands can handle two typeC aircraft simultaneously or a single type E aircraft. Within this run, the MARS constraint (assignment of flights toMARS stands) of the model is verified. Since these stands are more expensive than "regular" stand types, the cost ofthese stands is lowered to 100 Euros during this verification run.
The results of this run are depicted in Table C.4 and graphically in Figure C.2. The model builds three stands (twoMARS stands and a non-contact stand). This is an expected result, due to the lower cost. Flights 1 and 2, both type C,are assigned to one of the MARS stands. Flight 3 (a type E) aircraft is assigned to the second MARS stand. No bussesare assigned, which is also correct (no remote handling of flights in the solution). This verified the capabilities of themodel in the assignment of the MARS stands.

C.1. Verification 74
Flight Stand Type Stand Size
Flight1 31 MARS NAFlight2 31 MARS NAFlight3 31 MARS NAFlight4 17 Non-Contact D
Table C.4: Assignments of the flights to stands in the MARS run
Figure C.2: Schematic overview of the flight assignments to stands in the MARS run
Flight SplittingLastly, the developed model is verified concerning the ability to split flights and correctly assign them to a stand (theflight splitting constraints from constraint set 1). To trigger a solution in which the flights are split, the contact stands’capital cost is lowered, and the operational cost of flights that are split is set to zero. The results of this run are depictedin Table C.5 and graphically in Figure C.3.
The model builds five stands (three contact stands and two remote non-operational stands). Flight 1 and 2 are splitinto three phases (turnaround time longer than 170 minutes). The remote non-operational stands are needed for theparking phase of flights 1 and 2. Furthermore, every phase of the splits is assigned to a single stand, and no busses areneeded. With this the flight splitting capabilities of the framework are verified.
Flight Stand Type Stand Size
Flight1A 6 Contact DFlight1P 32 Remote Non-Operational CFlight1D 3 Contact CFlight2A 3 Contact CFlight2P 32 Remote Non-Operational CFlight2D 6 Contact DFlight3 9 Contact EFlight4 6 Contact D
Table C.5: Assignments of the flights to stands in the flight splitting run
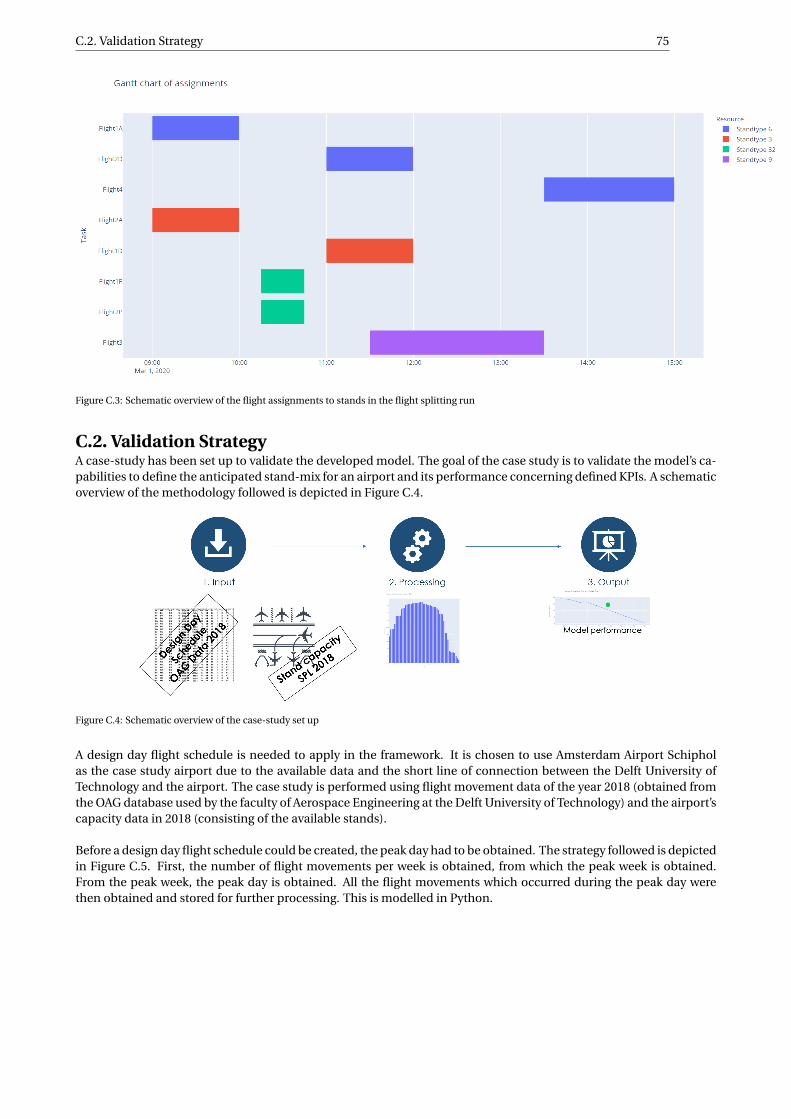
C.2. Validation Strategy 75
Figure C.3: Schematic overview of the flight assignments to stands in the flight splitting run
C.2. Validation StrategyA case-study has been set up to validate the developed model. The goal of the case study is to validate the model’s ca-pabilities to define the anticipated stand-mix for an airport and its performance concerning defined KPIs. A schematicoverview of the methodology followed is depicted in Figure C.4.
Figure C.4: Schematic overview of the case-study set up
A design day flight schedule is needed to apply in the framework. It is chosen to use Amsterdam Airport Schipholas the case study airport due to the available data and the short line of connection between the Delft University ofTechnology and the airport. The case study is performed using flight movement data of the year 2018 (obtained fromthe OAG database used by the faculty of Aerospace Engineering at the Delft University of Technology) and the airport’scapacity data in 2018 (consisting of the available stands).
Before a design day flight schedule could be created, the peak day had to be obtained. The strategy followed is depictedin Figure C.5. First, the number of flight movements per week is obtained, from which the peak week is obtained.From the peak week, the peak day is obtained. All the flight movements which occurred during the peak day werethen obtained and stored for further processing. This is modelled in Python.

C.2. Validation Strategy 76
Figure C.5: Topology of the code to obtain the peak day flight movements
It is obtained that week 21 was the peak week in 2018, as can be seen in Figure C.6. Furthermore, Monday was thepeak day, as shown in Figure C.7. From this analysis, Monday 21 May is defined as the peak day in 2018. This hasbeen validated through the executed flight movement data as obtained from the airport (confidential data). Thisanalysis has led to 1583 flight movements. From these flight movements, a schedule had to be created by pairing theindividual flight movements. For this, an in-house developed optimisation framework from ir. P.C. Roling is used. Thisoptimisation framework pairs different flight movements by considering, amongst others, the airline, aircraft type,turnaround time, origin and destination. The obtained pairings have been validated through a check with respect toviability (same airline and turnaround times). All the non-viable pairings have been removed. This resulted in 769pairings, which are then used in the case study analysis to assess the model performance and characteristics.
Figure C.6: The number of flight movements per week in 2018 operated at Amsterdam Airport Schiphol as obtained from the OAG data

C.3. Validation Results 77
Figure C.7: The number of flight movements per day in week 21 (2018) operated at Amsterdam Airport Schiphol as obtained from the OAG data
C.2.1. DiscussionThe OAG data used to create a design day flight schedule did show some deficiencies. The data consists of a mix be-tween scheduled and actual operated flight movements. The data is characterised by a multitude of double entriesrelated to alterations in the scheduled time of a flight movement for a specific period in the year or change in the op-erated aircraft type. Therefore, the data had to be filtered and sorted. This still resulted in some flight movements thatcould not be paired with other flights. Upon an in-depth analysis, it is found that the main reason for this is the factthat some airlines operate a specific flight movement using multiple aircraft types throughout the year. This drawbackis captured in the pairing creations by allowing some pairings with different aircraft types operated by the same airlineand a viable destination.
These discrepancies are known but were not leading, since the developed flight schedule still represents the expectedtraffic waves at the airport. Furthermore, these were deemed acceptable since the goal of the validation part was theassessment of the model performance and its characteristics, rather than perfectly reflecting a real-life airport case.
C.3. Validation ResultsThe following section depicts some additional results related to the Thesis Paper in Part 1 of this report. This datagives the reader an in-depth view and supports the defined results. First, the obtained model results for the base caseare defined in Tables C.6, C.7, C.8 and C.9. Secondly, the model results for the cases in which the flight frequencyare considered are defined in Tables C.10, C.11, C.12 and C.13. Lastly, two graphs are presented which allow a quickcomparison between the two results sets in Figures C.8 and C.9.

C.3. Validation Results 78
Pareto Multi Case Results - Base Case
αCC Capital Cost(Euro)
OperationalCost (Euro)
Number of Stands # Contact Stands # MARS Stands # Non-ContactStands
# RemoteOps Stands
# RemoteNon-OpsStands
0.05 190,362 54,847 142 132 3 1 6 00.10 170,793 56,266 125 98 0 21 6 00.15 150,284 59,241 124 90 0 16 12 60.21 138,356 61,922 123 85 0 12 21 50.26 130,231 64,560 123 81 0 9 29 40.31 124,514 66,822 123 80 0 6 34 30.36 119,313 69,432 123 80 0 3 37 30.42 114,586 72,537 123 70 0 7 45 10.47 109,870 76,382 123 57 0 14 51 10.52 100,706 85,265 123 44 0 17 62 00.57 95,629 91,505 123 30 0 23 70 00.62 92,602 96,108 123 27 0 20 76 00.68 87,888 104,941 123 17 0 23 83 00.73 85,336 110,787 123 8 0 27 88 00.78 83,827 115,102 123 4 0 28 91 00.83 82,198 121,778 123 4 0 22 97 00.89 80,831 130,653 123 3 0 17 103 00.94 80,262 136,678 123 0 0 15 108 00.99 79,998 138,821 124 0 0 11 113 0
Table C.6: Number of stands per type for the base case in which the αCC is altered from 0.05-0.99 in 19 steps. Ops = Operational
αCC Number of Busses Number of NB TT Number of WB TT Busmovements Towmovements
0.05 4 36 12 26 8480.10 4 36 12 26 8540.15 16 36 12 128 8620.21 25 36 12 251 8650.26 36 36 12 367 8670.31 42 36 12 473 8700.36 52 36 12 623 8660.42 59 36 12 770 8620.47 67 36 12 923 8640.52 92 36 12 1,358 8590.57 107 36 12 1,616 8590.62 120 36 12 1,857 8570.68 144 36 12 2,281 8510.73 154 36 12 2,509 8510.78 161 36 12 2,694 8510.83 177 36 12 3,050 8510.89 195 36 12 3,515 8510.94 211 36 12 3,829 8510.99 224 36 12 4,145 849
Table C.7: Number of equipment and movements for the base case in which the αCC is altered from 0.05-0.99 in 19 steps. NB = Narrow-Body, WB= Wide-Body, TT = Tow Truck

C.3. Validation Results 79
αCC Contact (Min) Non - Contact (Min) Remote - Ops (Min) MARS (Min) Remote Non-Ops (Min)
0.05 126 293 229 96 00.10 120 186 212 0 00.15 116 167 230 0 2090.21 108 165 270 0 1790.26 106 144 256 0 1570.31 106 114 251 0 1170.36 105 123 239 0 1130.42 100 147 227 0 1030.47 94 146 218 0 820.52 90 127 200 0 00.57 79 121 194 0 00.62 77 117 186 0 00.68 72 101 179 0 00.73 63 88 174 0 00.78 63 80 170 0 00.83 64 77 160 0 00.89 63 74 150 0 00.94 0 69 146 0 00.99 0 67 141 0 0
Table C.8: Average utilisation of the different stand types in minutes for the base case in which the αCC is altered from 0.05-0.99 in 19 steps
αCC # 2 Split Flights # 3 Split Flights Total Area (m2) % flights assigned same size % flights assigned larger size
0.05 0 0 1,143,486 86 140.10 0 3 1,041,259 89 110.15 0 7 1,014,954 89 110.21 1 8 994,342 90 100.26 1 9 985,139 88 120.31 2 10 973,226 87 130.36 2 8 965,404 89 110.42 2 6 959,760 87 130.47 2 7 953,911 87 130.52 1 5 944,695 83 170.57 1 5 937,647 81 190.62 1 4 931,797 82 180.68 1 1 931,004 80 200.73 1 1 927,492 80 200.78 1 1 925,384 75 250.83 1 1 921,169 71 290.89 1 1 916,748 75 250.94 1 1 913,030 82 180.99 1 0 914,311 74 26
Table C.9: Number of flights split into 2/3 phases, the area used and the percentage of flights assigned to an equivalent stand size or to a largerstand size for the base case in which the αCC is altered from 0.05-0.99 in 19 steps

C.3. Validation Results 80
Pareto Multi Case Results - Consideration of Flight Frequency
αCC Capital Cost(Euro)
OperationalCost (Euro)
Number of Stands # Contact Stands # MARS Stands # Non-ContactStands
# RemoteOps Stands
# RemoteNon-OpsStands
0.05 1,191,615 255,093 130 103 0 15 12 00.10 1,046,743 266,346 125 94 0 10 20 10.15 945,960 281,185 124 85 0 10 25 40.21 887,106 294,667 123 79 0 9 31 40.26 834,443 310,258 123 75 0 8 37 30.31 808,339 320,759 123 68 0 11 41 30.36 780,258 334,415 123 58 0 16 47 20.42 726,697 368,425 123 49 0 14 59 10.47 690,227 396,792 123 35 0 22 66 00.52 654,439 430,425 123 24 0 25 74 00.57 638,218 450,029 123 22 0 23 78 00.62 610,812 491,220 123 15 0 23 85 00.68 593,502 522,946 123 10 0 22 91 00.73 583,925 545,423 123 4 0 26 93 00.78 574,161 575,731 124 3 0 22 99 00.83 565,815 613,947 123 3 0 17 103 00.89 563,567 629,496 124 1 0 16 107 00.94 560,808 655,690 124 0 0 13 111 00.99 559,988 669,167 124 0 0 11 113 0
Table C.10: Model results for the case in which the αCC is altered from 0.05-0.99 in 19 steps and the weekly flight frequency is considered. Ops =Operational
αCC Number of Busses Number of NB TT Number of WB TT Busmovements Towmovements
0.05 12 36 12 104 8500.10 27 36 12 221 8610.15 39 36 12 372 8630.21 41 36 12 509 8660.26 51 36 12 722 8660.31 54 36 12 826 8660.36 59 36 12 964 8650.42 85 36 12 1359 8640.47 98 36 12 1617 8590.52 111 36 12 1941 8530.57 123 36 12 2114 8530.62 143 36 12 2491 8510.68 161 36 12 2760 8510.73 166 36 12 2917 8510.78 179 36 12 3239 8490.83 195 36 12 3628 8510.89 204 36 12 3802 8490.94 217 36 12 4078 8490.99 224 36 12 4263 849
Table C.11: Number of equipment and movements for the case in which theαCC is altered from 0.05-0.99 in 19 steps and the weekly flight frequencyis considered

C.3. Validation Results 81
αCC Contact (Min) Non - Contact (Min) Remote - Ops (Min) MARS (Min) Remote Non-Ops (Min)
0.05 117 184 274 0 00.10 111 155 278 0 4000.15 107 139 271 0 1820.21 105 125 251 0 1570.26 103 128 233 0 1250.31 100 141 224 0 1380.36 96 135 214 0 1380.42 91 126 200 0 850.47 84 120 193 0 00.52 80 116 182 0 00.57 77 109 179 0 00.62 75 94 173 0 00.68 70 87 168 0 00.73 70 80 164 0 00.78 67 79 157 0 00.83 66 74 150 0 00.89 74 74 147 0 00.94 0 72 142 0 00.99 0 68 140 0 0
Table C.12: Average utilisation of the different stand types in minutes for the case in which the αCC is altered from 0.05-0.99 in 19 steps and theflight frequency is considered
alphaCC # 2 Split Flights # 3 Split Flights Total Area (m2) % flights assigned same size % flights assigned larger size
0.05 0 1 1,069,026 88 120.10 1 6 1,026,258 89 110.15 1 7 997,226 89 110.21 2 8 980,876 88 120.26 2 8 966,833 87 130.31 2 8 962,594 87 130.36 3 7 961,518 88 120.42 2 7 949,504 83 170.47 1 5 942,432 82 180.52 1 2 943,042 83 170.57 1 2 939,009 78 220.62 1 1 931,028 81 190.68 1 1 925,384 82 180.73 1 1 923,979 77 230.78 1 0 924,558 78 220.83 1 1 916,748 72 280.89 1 0 918,526 79 210.94 1 0 915,716 81 190.99 1 0 914,311 72 28
Table C.13: Number of flights split into 2/3 phases, the area used and the percentage of flights assigned to an equivalent stand size or to a largerstand size for the case in which the αCC is altered from 0.05-0.99 in 19 steps and the flight frequency is considered

C.3. Validation Results 82
Comparison Graphs
Figure C.8: Boxplots depicting the variations in the number of equipment for the different αCC cases for the base cases (NF) and the cases in whichthe flight frequency is considered (WF)
Figure C.9: Boxplots depicting the variations in stand utilisation times for the differentαCC cases for the base cases (NF) and the cases in which theflight frequency is considered (WF)

DSensitivity Analysis
A sensitivity analysis has been performed to assess the sensitivity of the model parameters used in the optimisationframework. This is centred around three main themes: cost factors, time factors and robust scheduling. Within thesensitivity analysis, the implications of altering specific parameters on the model output have been assessed. Theseare then compared with the base case. The base case refers to a single run in which the capital cost and operationalcost are equally taken into account.
D.1. Cost FactorsThe developed model’s main factors and parameters are based on costs, such as capital cost of stands and equipment.To assess the model output’s sensitivity with respect to a change in any of the main factors, the following analysis hasbeen performed.
Capital Cost StandsFirst, the capital cost of the stands is reduced in 5 steps from 5% to 25% (while keeping all other parameters as defined).This is then compared to the base run (with the standard defined costs). The results of this analysis are depictedthrough the bar chart in Figure D.1. It can be seen that there is no variation in the total number of stands built. As thecapital cost of the stands is increased, the number of contact stands increases while the number of remote operationalstands decreases. This is also visible in the number of busses (which reduces by 8% on average per 5% reduction incapital cost. The total number of contact stands increases on average with 7.7% per 5% reduction in the capital costof the stands. The number of remote stands is reduced with 6% on average per 5% reduction in the capital cost of thestands. There is no variation visible in the number of tow trucks nor the area used.
Figure D.1: Variation in the number of stands per type for the base case and the sensitivity analysis of the stand capital cost
Capital Cost EquipmentThe second cost parameters that have been assessed are the capital cost of the tow trucks and busses. These costparameters were also reduced in 5 steps from 5% to 25%. The results of this assessment are depicted in Figure D.2.
83

D.2. Time Factors 84
There is no difference in the number of stands per type, up to a reduction of 10%. From a 15% reduction in theoperational cost, the number of remote stands increases by 7% and remains equal. The number of busses increaseswith 10% at a 15% reduction of the equipment cost and remains equal up to the 25% reduction.
Figure D.2: Variation in the number of stands per type for the base case and the sensitivity analysis of the equipment capital cost
Operational CostThe last cost parameters that have been assessed are the operational cost factors. These parameters relate to the costassociated with operating boarding stairs, busses and tow trucks. As with the other two analysed cost factor sets,the operational cost has been reduced in 5 steps from 5% to 25%, while keeping all the other parameters as definedoriginally. The results of this analysis are depicted in Figure D.3. As expected, the number of contact stands is reduceddue to a reduction in the operational cost (more cost-efficient to operate remote stands). The number of contactstands is reduced with 10% on average for every 5% reduction in the number of contact stands, the number of remotestands increases with 4% on average (for every 5% reduction in the operational cost). Due to the increase in thenumber of remote stands, the number of busses increases. These increase on average by 5% for every 5% reduction inthe operational cost.
Figure D.3: Variation in the number of stands per type for the base case and the sensitivity analysis of the operational cost
D.2. Time FactorsIn the second part of the sensitivity analysis, the implications of the time factors have been assessed. Within theframework, assumptions had to be made regarding the duration of bussing operations and towing operations. Theimplication of these assumptions have been tested through the following sensitivity analysis: the assumed operational

D.3. Robust Scheduling 85
times (for bussing and towing) have been increased in 5 steps with 5% to 25%. The results of this analysis are depictedin Figure D.4. As can be seen in the bar chart, there are no considerable variations visible.
Figure D.4: Variation in the number of stands per type for the base case and the sensitivity analysis of the time factors of the bussing and towingoperations
D.3. Robust SchedulingCreating and assessing the implications of robust scheduling is important for operational and tactical time frames ofairport planning. Incorporating buffer times in strategic stand capacity assessment allows decision-makers to obtainbetter insight into the needed stand capacity for different scenarios. To assess the implications of buffer times on themodel output, the model is tested for multiple buffer time settings and compared with the base case. The buffer timeis increased by steps of four minutes (aircraft arrival 2 minutes earlier than scheduled and a departure 2 minutes laterthan the schedule).
The results of this analysis are depicted in Figure D.5. As expected, the total number of stands increases as the buffertimes are increased. These increase on average by 3% for every 4 minutes of buffer time. The model employs bothmore remote stands and contact stands which both increase on average with the same percentage. As the buffer timesare increased, the number of busses is reduced (more flights are split into phases). The total area used increases onaverage with 2% for every 4 minutes of buffer time added.
Figure D.5: Variation in the number of stands per type for the base case and the sensitivity analysis of the buffer times

EModel Data
The following chapter contains the model data used within the thesis work. The following data can be distinguished:- Aircraft Data in Section E.1: containing the categorisation of the different aircraft types to a design group. This datais obtained from Boukema [10].- Stand Compatibility Data (Flight Sector) in Section E.2.1: containing the compatibility of every stand type to theflight sectors.- Stand Compatibility Data (Aircraft Size) in Section E.2.2: containing the compatibility of every stand type to thedifferent aircraft sizes.- The design day flight schedule used for the validation in Section E.3.
E.1. Aircraft Data
Code Manufacturer Type Compatible StandAT5 Aerospatiale/Alenia ATR 42-500 CATR Aerospatiale/Alenia ATR CAT4 Aerospatiale/Alenia ATR 42-300/320 CAT7 Aerospatiale/Alenia ATR 72 C319 Airbus A319 C320 Airbus A320-100/200 C32A Airbus A320 sharklets C321 Airbus A321-100/200 C32S Airbus A318 C318 Airbus A318 C32S Airbus A318/319/320/321 C32B Airbus A321 sharklets CAN6 Antonov An-26/30/32 CA26 Antonov An-26 CA28 Antonov An-28 CA30 Antonov An-30 CA32 Antonov An-32 CA40 Antonov An-140 CA81 Antonov An-148-100 CAN4 Antonov An-24 CAN7 Antonov An-72/74 CAR8 Avro RJ85 Avroline CAR8 Avro RJ85 Avroliner CARJ Avro RJ Avroliner CAR1 Avro RJ100 Avroliner CAR7 Avro RJ70 Avroliner CARX Avro RJX CAX1 Avro RJX100 CAX8 Avro RJX85 C738 Boeing 737 800 pax C739 Boeing 737-900 pax C757 Boeing 757 all pax models C
86

E.1. Aircraft Data 87
788 Boeing 787-800 C733 Boeing 737-300 pax C734 Boeing 737-400 pax C735 Boeing 737-500 pax C73G Boeing 737-700 C73H Boeing 737 C73W Boeing 737 C721 Boeing 727-100 C733 Boeing 737-300 C737 Boeing 737 C72B Boeing 727-100 Combi C72F Boeing 727 Freighter C72M Boeing 727 Combi C72S Boeing 727-200 C72X Boeing 727-100 Freighter C72Y Boeing 727-200 Freighter C73C Boeing 737-300 C73E Boeing 737-900ER C73J Boeing 737-900WithWinglets C73N Boeing 737-300Mixed Config C73Q Boeing 737-400Mixed Config C73S Boeing 737 Advanced C717 Boeing 717-200 C722 Boeing 727-200 C727 Boeing 727 C731 Boeing 737-100 C732 Boeing 737-200 C735 Boeing 737-500 C736 Boeing 737-600 C72A Boeing 727-200 Advanced C72C Boeing 727-200 Combi C73A Boeing 737-200/200C Advanced C73F Boeing 737 Freighter C73G Boeing 737-700 C73H Boeing 737-800WithWinglets C73M Boeing 737-200 Combi C73P Boeing 737-400 Freighter C73W Boeing 737-700WithWinglets C73X Boeing 737-200 Freighter C73Y Boeing 737-300 Freighter CD92 Boeing/McDonnell Douglas DC-9-20 CD95 Boeing/McDonnell Douglas DC-9-50 CD9C Boeing/McDonnell Douglas DC-9-30 Freighter CM88 Boeing/McDonnell Douglas MD-88 CD3F Boeing/McDonnell Douglas CD6F Boeing/McDonnell Douglas DC-6A/B/C Freighter CD91 Boeing/McDonnell Douglas CD93 Boeing/McDonnell Douglas DC-9-30 CD94 Boeing/McDonnell Douglas CD9F Boeing/McDonnell Douglas DC-9-40 Freighter CD9S Boeing/McDonnell Douglas CD9X Boeing/McDonnell Douglas DC-9-10 Freighter CDC3 Boeing/McDonnell Douglas CDC6 Boeing/McDonnell Douglas DC-6 CDC9 Boeing/McDonnell Douglas CDCF Boeing/McDonnell Douglas DC-9 Freighter CM80 Boeing/McDonnell Douglas CM87 Boeing/McDonnell Douglas MD-87 CM90 Boeing/McDonnell Douglas CCR9 Bombardier CRJ900 C

E.1. Aircraft Data 88
CS3 Bombardier CS300 CDH4 Bombardier Q400 CGLE Bombardier Global Express C142 British Aerospace BAe 146-200 C146 British Aerospace BAe 146 C14F British Aerospace BAe 146 Freighter C14X British Aerospace BAe 146-100QT/QC CB11 British Aerospace BAC One Eleven CB12 British Aerospace BAC One Eleven 200 CB15 British Aerospace BAC One Eleven 500 C141 British Aerospace BAe 146-100 C143 British Aerospace BAe 146-300 C14Y British Aerospace BAe 146-200QT/QC C14Z British Aerospace BAe 146-300QT/QC CB13 British Aerospace BAC One Eleven 300 CB14 British Aerospace BAC One Eleven 400 CATP British Aerospace ATP CCRK Canadair Regional Jet 1000 CCR7 Canadair Regional Jet 700 CCRA Canadair Regional Jet 705 CDHC De Havilland Canada DHC-4 Caribou CDH1 De Havilland Canada DHC-8-100 Dash 8/8Q CDH2 De Havilland Canada DHC-8-200 Dash 8/8Q CDH3 De Havilland Canada DHC-8-300 Dash 8/8Q CDH7 De Havilland Canada DHC-7 Dash 7 CDH8 De Havilland Canada DHC-8 Dash 8 All S. CE17 Embraer 170-200 CE70 Embraer 170 CE75 Embraer 175 CE90 Embraer 190 CE95 Embraer 195 CEMJ Embraer 170/190 CEM9 Embraer E190 CF70 Fokker 70 CGRJ Gulfstream G500 C310 Airbus all pax models D313 Airbus A310 DABB Airbus A300-600ST Beluga D312 Airbus A310-200 D31F Airbus A310 Freighter DAB6 Airbus A300-600 D31X Airbus A310-200 Freighter DAB4 Airbus A300B2/B4/C4 DAB3 Airbus A300 DABF Airbus A300 Freighter DABX Airbus A300B4/C4/F4 Freighter DABY Airbus A300-600 Freighter D31Y Airbus A310-300 Freighter DANF Antonov An-12 D752 Boeing 757-200 D753 Boeing 757-300 pax D763 Boeing 767-300 D752 Boeing 757-200 pax D75W Boeing 757 200 pax D76W Boeing 767-300 D707 Boeing 707/720 D70F Boeing 707-300 Freighter D76F Boeing 767 Freighter DB72 Boeing 720B D703 Boeing 707-300 D

E.1. Aircraft Data 89
762 Boeing 767-200 D764 Boeing 767-400 D70M Boeing 707-300 Combi D75F Boeing 757-200 Freighter D75M Boeing 757-200 Combi D767 Boeing 767 all paxmodels D76X Boeing 767-200 Freighter D76Y Boeing 767-300 Freighter DD8M Boeing/McDonnell Douglas DC-8 Combi DD8Q Boeing/McDonnell Douglas DC-8-72 DD8Y Boeing/McDonnell Douglas DC-8-71/72/73 Freighter DM83 Boeing/McDonnell Douglas MD-83 DD10 Boeing/McDonnell Douglas DC-10 DD11 Boeing/McDonnell Douglas DC-10-10/15 DD1C Boeing/McDonnell Douglas DC-10-30/40 DD1F Boeing/McDonnell Douglas DC-10 Freighter DD1X Boeing/McDonnell Douglas DC-10-10 Freighter DD1Y Boeing/McDonnell Douglas DC-10-30/40 Freighter DD8F Boeing/McDonnell Douglas DC-8 Freighter DD8L Boeing/McDonnell Douglas DC-8-62 DD8T Boeing/McDonnell Douglas DC-8-50 Freighter DD8X Boeing/McDonnell Douglas DC-8-61/62/63 Freighter DDC8 Boeing/McDonnell Douglas DC-8 DM11 Boeing/McDonnell Douglas MD-11 DM1F Boeing/McDonnell Douglas MD-11 Freighter DM1M Boeing/McDonnell Douglas MD-11 Combi DM81 Boeing/McDonnell Douglas MD-81 DM82 Boeing/McDonnell Douglas MD-82 D330 Airbus A330 all models E342 Airbus A340-200 E343 Airbus A340-300 E359 Airbus A359 E340 Airbus A340 E332 Airbus A330-200 E333 Airbus A330-300 E345 Airbus A340-500 E346 Airbus A340-600 E330 Airbus A330 E351 Airbus A350-1000 E359 Airbus A350-900 E744 Boeing 747-400 pax E772 Boeing 777-200 E777 Boeing 777 all pax models E787 Boeing 787 E789 Boeing 787-9 pax E74E Boeing 747-400 Combi E74F Boeing 747 freighter E74Y Boeing 747-400 freighter E74Z Boeing 747 E77W Boeing 777-300 E77X Boeing 777-300 E741 Boeing 747-100 E74D Boeing 747-300 Combi (including-200SUD) E74J Boeing 747-400 Domestic E74M Boeing 747 Combi E74T Boeing 747-100 Freighter E74V Boeing 747SR Freighter E74X Boeing 747-200 Freighter E742 Boeing 747-200 E743 Boeing 747-300 (including -100SUD and -200SUD) E

E.2. Stand Compatible Data 90
747 Boeing 747 E773 Boeing 777-300 E74C Boeing 747-200 Combi E74L Boeing 747SP E74U Boeing 747-300 Freighter E74N Boeing 747-800 Freighter E77F Boeing 777 Freighter E77L Boeing 777-200LR E77W Boeing 777-300ER E380 Airbus A380 F388 Airbus A380 pax F38F Airbus A380 Freighter FA4F Antonov An-124 Ruslan FBH2 Bell Helicopters XH25 British Aerospace (Hawker Siddeley) HS.125 XJ31 British Aerospace Jetstream 31 XJ32 British Aerospace Jetstream 32 XJ41 British Aerospace Jetstream 41 XJST British Aerospace Jetstream 31/32/41 XHS7 British Aerospace Hawker Siddeley HS748 XCCX Canadair privejetCanadair Global Express XCRJ Canadair Regional Jet XCCJ Canadair Challenger XCR1 Canadair Regional Jet 100 XCR2 Canadair Regional Jet 200 XCNJ Cessna Citation XCNT Cessna twin turboprop engines XCN1 Cessna single piston engine XCNA Cessna XCNC Cessna single turboprop engine XDFL Dassault Falcon XEM2 Embraer 120 XER4 Embraer RJ145 Amazon CERJ Embraer Embraer RJ135 / RJ140 / RJ145 XE55 Embraer 505 phantom XEMB Embraer EMB-110 Bandeirante XER3 Embraer ERJ-135 Regional Jet XERD Embraer ERJ-140 Regional Jet XD28 Fairchild Dornier Do-228 XD38 Fairchild Dornier Do-328 X100 Fokker 100 XF22 Fokker F28 Fellowship 2000 XF28 Fokker F28 Fellowship XF50 Fokker 50 XF21 Fokker F28 Fellowship 1000 XF23 Fokker F28 Fellowship 3000 XF24 Fokker F28 Fellowship 4000 XF27 Fokker F27 Friendship/FairchildF27 XAW1 Police Netherlands helicopter XS20 Saab Saab 2000 CSF3 Saab SF-340 XSFB Saab SF-340B XTB7 Socata TBM-900 XSWM Swearingen Merlin twin prop X
E.2. Stand Compatible DataE.2.1. Stand Compatibility Flight SectorThe following table depicts the compatibility (1: compatible, 2: incompatible) of the 35 defined stand types withspecific flight sectors (the last four columns). These columns depict the flight sector a flight belongs to. The first

E.2. Stand Compatible Data 91
part refers to the sector a flight is arriving from, while the second part refers to the sector the aircraft is flying to. S =Schengen, NS = Non-Schengen.
Nr Type Size Terminal S-S S-NS NS-S NS-NS1 Contact C Domestic 1 0 0 02 Contact C International 0 0 0 13 Contact C Swing 1 1 1 14 Contact D Domestic 1 0 0 05 Contact D International 0 0 0 16 Contact D Swing 1 1 1 17 Contact E Domestic 1 0 0 08 Contact E International 0 0 0 19 Contact E Swing 1 1 1 110 Contact F Domestic 1 0 0 011 Contact F International 0 0 0 112 Contact F Swing 1 1 1 113 Non-Contact C Domestic 1 0 0 014 Non-Contact C International 0 0 0 115 Non-Contact C Swing 1 1 1 116 Non-Contact D Domestic 1 0 0 017 Non-Contact D International 0 0 0 118 Non-Contact D Swing 1 1 1 119 Non-Contact E Domestic 1 0 0 020 Non-Contact E International 0 0 0 121 Non-Contact E Swing 1 1 1 122 Non-Contact F Domestic 1 0 0 023 Non-Contact F International 0 0 0 124 Non-Contact F Swing 1 1 1 125 Remote Operational C NA 1 1 1 126 Remote Operational D NA 1 1 1 127 Remote Operational E NA 1 1 1 128 Remote Operational F NA 1 1 1 129 MARS NA Domestic 1 0 0 030 MARS NA International 0 0 0 131 MARS NA Swing 1 1 1 132 Remote Non-Operational C NA 0 0 0 033 Remote Non-Operational D NA 0 0 0 034 Remote Non-Operational E NA 0 0 0 035 Remote Non-Operational F NA 0 0 0 0
E.2.2. Stand Compatibility Aircraft SizeThe following table depicts the compatibility of the different stand types with each aircraft design group (1: compati-ble, 2: incompatible).
Nr Type Size Terminal C D E F X1 Contact C Domestic 1 0 0 0 02 Contact C International 1 0 0 0 03 Contact C Swing 1 0 0 0 04 Contact D Domestic 1 1 0 0 05 Contact D International 1 1 0 0 06 Contact D Swing 1 1 0 0 07 Contact E Domestic 0 1 1 0 08 Contact E International 0 1 1 0 09 Contact E Swing 0 1 1 0 010 Contact F Domestic 0 1 1 1 011 Contact F International 0 1 1 1 012 Contact F Swing 0 1 1 1 013 Non-Contact C Domestic 1 0 0 0 014 Non-Contact C International 1 0 0 0 015 Non-Contact C Swing 1 0 0 0 016 Non-Contact D Domestic 1 1 0 0 0

E.3. Design Day Flight Schedule 92
17 Non-Contact D International 1 1 0 0 018 Non-Contact D Swing 1 1 0 0 019 Non-Contact E Domestic 1 1 1 0 020 Non-Contact E International 1 1 1 0 021 Non-Contact E Swing 1 1 1 0 022 Non-Contact F Domestic 1 1 1 1 023 Non-Contact F International 1 1 1 1 024 Non-Contact F Swing 1 1 1 1 025 Remote Operational C NA 1 0 0 0 126 Remote Operational D NA 1 1 0 0 127 Remote Operational E NA 1 1 1 0 128 Remote Operational F NA 1 1 1 1 129 MARS NA Domestic 1 0 1 0 030 MARS NA International 1 0 1 0 031 MARS NA Swing 1 0 1 0 032 Remote Non-Operational C NA 1 0 0 0 133 Remote Non-Operational D NA 1 1 0 0 134 Remote Non-Operational E NA 1 1 1 0 135 Remote Non-Operational F NA 1 1 1 1 1
E.3. Design Day Flight ScheduleThe design day flight schedule used in the thesis work can be found in the Gitlab MSc_Thesis page of the faculty ofAerospace Engineering.

FRecommendations for Further Research
In this chapter, some recommendations for further research will be described. The following recommendations aredefined:
• Multi-Objective Optimisation: The developed framework allows for a trade-off between two related objectives(both costs). It has been proven with this thesis that multiple objectives can play a role in decision making.These are mainly indirectly considered through the cost factors in the proposed optimisation framework (e.g.cost for exceeding area limitations). For further research, it is recommended to analyse and identify the criticalobjectives and how these can be considered explicitly through an optimisation framework. Assessment of theviability and usability is key in such research as the complexity increases rapidly with the addition of objectives(with, e.g. other metrics). Furthermore, such a research project can be used to investigate how the stakeholder(e.g. airports, airlines, alliances) interests can be reflected in a framework. Furthermore, it can be analysed howother multi-objective methods can be used in the strategic stand capacity assessment problem.
• Demand Analysis: Demand analysis was not included in the research objective of the project. The differenttechniques have been partly assessed in the accompanying literature study (to assure understanding of the fullspectrum of stand capacity assessment). As part of the thesis work, a design day flight schedule has been createdto test and validate the developed model’s capabilities. For further research, it is recommended to investigatethe implications of demand on the stand capacity. This can be done for single demand cases, which are thenused to define the stand mix for changes in the anticipated demand. This can be used for scenario analysis andwould aid decision-makers through an extra level of insights regarding the problem. Another interesting topicrelates to the consideration of multiple demand time frames (e.g. demand now, demand in 5 years, 10 yearsetc.). This can be added as an extension to the developed optimisation model through which investments areplaced in the demand horizon’s perspective. E.g. if it is known that in 5 years, the demand will introduce theneed for a specific number of stands, it can be wise to incorporate this in the first development phase already(taking into account the costs of the initial demand, the costs of having to remove stands and having to buildnew stands). Such a framework can also be used to adapt the framework to be dynamic. This can be achievedby incorporating policies to assess the implications of alterations in anticipated future traffic or creating robustschedules.
• Reflection of real life airport operations: Within the executed research, multiple assumptions had to be maderegarding e.g. towing times of flights. To further tune the operational assumptions, it is recommended to per-form collaborative research with the aviation industry (e.g. a consulting firm executing airport developmentprocesses for airport stakeholders). In this way, the developed framework can be validated to be used for differ-ent airport use cases (regional airport, hub and spoke etc.).
• Consideration of Airport Layouts: Traditionally airport layouts are considered in the land use plan and facilitysizing phases of an airport master plan. However, since these decisions also impact the stand capacity it isdesirable to consider the critical factors and design choices as early as possible; as this is linked to a strategictime frame, the level of detail should be tuned to this. It is recommended to investigate the impact of factorsrelated to decisions concerning airport layouts (e.g. placement of service roads, runway placements, handlingof aircraft etc.) on stand capacity and how these can be incorporated within a strategic time frame.
• Integration with consecutive airport development stpes: The defined framework defines not only the neededstand mix but also the needed equipment. It can be analysed how this framework can be further extended tobe used in later development steps of an airport master plan, such as facility sizing and determination of theneeded workforce (as the number of equipment is known). This can, e.g. be extended to consider the number
93

94
of ground staff. Furthermore, the viability and usability of linking/considering follow up processes in the standcapacity assessment process can be investigated.

Bibliography[1] Airport Research Center GmbH. CAST Stand Gate Allocation. Retrieved 7-7-2020, from: https://arc.de/
cast-stand-gate-allocation/.
[2] Ashford, N.J. and Mumayiz, S. and Wright, P.H. Airport Engineering: Planning, Design, and Development of 21stCentury Airports. Wiley, 2011. ISBN 9781118005477.
[3] Beudeker, M. Reallocating Aircraft Stand Capacity. Msc thesis report, Delft University of Technology, 2015.
[4] Bihr, R.A. A conceptual solution to the aircraft gate assignment problem using 0, 1 linear programming. Com-puters Industrial Engineering, 19(1):280–284, 1990. ISSN 0360-8352. doi: https://doi.org/10.1016/0360-8352(90)90122-3.
[5] Blow, C. Transport Terminals and Modal Interchanges. Taylor Francis, 2012. ISBN 9781136352300.
[6] Boeing. Boeing 757. Retrieved 19-6-2020, from: https://www.boeing.com/resources/boeingdotcom/company/about_bca/startup/pdf/historical/757_passenger.pdf.
[7] Bolat, A. Assigning arriving flights at an airport to the available gates. Journal of the Operational Research Society,50(1):23–34, 1999. doi: 10.1057/palgrave.jors.2600655.
[8] Bolat, A. Procedures for providing robust gate assignments for arriving aircrafts. European Journal of OperationalResearch, 120(1):63–80, 2000. doi: 10.1016/S0377-2217(98)00375-0.
[9] Bolat, A. Models and a genetic algorithm for static aircraft-gate assignment problem. Journal of the OperationalResearch Society, 52(10):1107–1120, 2001. doi: 10.1057/palgrave.jors.2601190.
[10] Boukema, M. Aircraft Stand Capacity Model for Strategic Airport Planning - A Schiphol Airport Case Study. Mscthesis, Delft University of Technology, 2018.
[11] Bouras, A. and Ghaleb, M. A. and Suryahatmaja, U. S. and Salem, A. M. The airport gate assignment problem:A survey. Scientific World Journal, 2014:923859, 2014. ISSN 1537-744X (Electronic) 1537-744X (Linking). doi:10.1155/2014/923859.
[12] Burghouwt, G. Airline Network Development in Europe and Its Implications for Airport Planning. Ashgate, 2007.ISBN 9780754645061.
[13] Cheng, C. H. and Ho, S. C. and Kwan, C. L. The use of meta-heuristics for airport gate assignment. Expert Systemswith Applications, 39(16):12430–12437, 2012. ISSN 0957-4174. doi: 10.1016/j.eswa.2012.04.071.
[14] Cheng, Yu. A knowledge-based airport gate assignment system integrated with mathematical programming.Computers Industrial Engineering, 32(4):837–852, 1997. ISSN 0360-8352.
[15] de Neufville, R.L. and Odoni, A.R. and Belobaba, P. and Reynolds, T.G. Airport Systems, Second Edition: Planning,Design and Management. McGraw-Hill Education, 2013. ISBN 9780071770590.
[16] Deken, J.O. Robust Scheduling for the Bay and Gate Assignment - A Kenya Airways Case Study. Msc thesis, DelftUniversity of Technology, 2015.
[17] Dempsey, P.S. and Goetz, A.R. and Szyliowicz, J.S. Denver international airport: lessons learned. McGraw-Hill,1997.
[18] Diepen, G. and Akker, J. M. and Hoogeveen, J. A. and Smeltink, J. W. Using column generation for gate planningat Amsterdam Airport Schiphol. Report, Utrecht University, 2007.
[19] Diepen, G. and Van Den Akker, J. M. and Hoogeveen, J. A. and Smeltink, J. W. Finding a robust assignmentof flights to gates at Amsterdam Airport Schiphol. Journal of Scheduling, 15(6):703–715, 2012. doi: 10.1007/s10951-012-0292-y.
[20] Ding, H. and Lim, A. and Rodrigues, B. and Zhu, Y. Aircraft and gate scheduling optimization at airports. InProceedings of the 37th Annual Hawaii International Conference on System Sciences, 2004., page 8 pp., 2004. doi:10.1109/HICSS.2004.1265219.
95

Bibliography 96
[21] Ding, H. and Lim, A. and Rodrigues, B. and Zhu, Y. New heuristics for over-constrained flight to gate assignments.Journal of the Operational Research Society, 55(7):760–768, 2004. ISSN 1476-9360. doi: 10.1057/palgrave.jors.2601736.
[22] Dorndorf, U. and Drexl, A. and Nikulin, Y. and Pesch, E. Flight gate scheduling: State-of-the-art and recentdevelopments. Omega, 35(3):326–334, 2007. ISSN 0305-0483. doi: https://doi.org/10.1016/j.omega.2005.07.001.
[23] Dorndorf, U. and Jaehn, F. and Pesch, E. Modelling Robust Flight-Gate Scheduling as a Clique Partitioning Prob-lem. Transportation Science, 42:292–301, 2008. doi: 10.1287/trsc.1070.0211.
[24] Dorndorf, U. and Jaehn, F. and Pesch, E. Flight gate scheduling with respect to a referenceschedule. Annals of Operations Research, 194(1):177–187, 2012. ISSN 1572-9338. doi: 10.1007/s10479-010-0809-8. URL https://doi.org/10.1007/s10479-010-0809-8https://link.springer.com/content/pdf/10.1007/s10479-010-0809-8.pdf.
[25] Drexl, A and and Nikulin, Y. Multicriteria airport gate assignment and Pareto simulated annealing. IIE Transac-tions, 40:385–397, 2008. doi: 10.1080/07408170701416673.
[26] EASA, European Aviation Safety Agency. CS–ADR-DSN — AERODROMES DESIGN. EASA, 2017.
[27] Edwards, J. and Newell, G. A study of gate use at honolulu international airport. Transportation Science, 3:183–191, 1969. doi: 10.1287/trsc.3.3.183.
[28] EUROCONTROL. Airport capacity assessment methodology manual. Report,2016. Retrieved 1-6-2020, from: https://www.eurocontrol.int/publication/airport-capacity-assessment-methodology-acam-manual.
[29] European Commission. Migration and Home Affairs. Retrieved 19-6-2020, from: https://ec.europa.eu/home-affairs/what-we-do/policies/borders-and-visas/schengen_en.
[30] FAA, Federal Aviation Administration. Advisory Circular 50/5300-13A: Airport Design. U.S. Government PrintingOffice, Washington, DC, 2014.
[31] FAA, Federal Aviation Administration. Advisory Circular 150/5070-6B: Airport Master Plans. U.S. GovernmentPrinting Office, Washington, DC, 2015.
[32] FAA, Federal Aviation Administration. Airport terminal planning, 2018. Retrieved on 22-5-2020,from:= https://www.faa.gov/documentLibrary/media/AdvisoryC i r cul ar /AC − 150 − 5360 − 13A − Ai r por t −Ter mi nal −Pl anni ng .pd f .
[33] Földes, G.I. A Many-Objective Tactical Stand Allocation: Stakeholder Trade-offs and Performance Planning. Mscthesis, Delft Uniersity of Technology, 2017.
[34] Gu, Y. and Chung C.A. Genetic Algorithm Approach to Aircraft Gate Reassignment Problem. Journal of Trans-portation Engineering, 125(5):384–389, 1999. doi: 10.1061/(ASCE)0733-947X(1999)125:5(384).
[35] Guépet, J. and Acuna-Agost, R. and Briant, O. and Gayon, J. P. Exact and heuristic approaches to the airport standallocation problem. European Journal of Operational Research, 246(2):597–608, 2015. doi: 10.1016/j.ejor.2015.04.040.
[36] Haghani, A. and Chen, M. C. Optimizing gate assignments at airport terminals. Transportation Research Part A:Policy and Practice, 32A(6):437–454, 1998. ISSN 0965-8564. doi: Doi10.1016/S0965-8564(98)00005-6.
[37] Hamzawi, S.G. Management and planning of airport gate capacity: a microcomputer-based gate assignmentsimulation model. Transportation Planning and Technology, 11(3):189–202, 1986. ISSN 0308-1060. doi: 10.1080/03081068608717341.
[38] Horonjeff, R.M. and McKelvey, F.X. and Sproule, W.J. and Young, S. Planning and Design of Airports. McGraw-HillEducation, 5th edition, 2010. ISBN 9780071642552.
[39] IATA, International Air Transport Association. Airport Service Level Agreement (SLA) – Best Practice. Re-trieved 30-5-2020, from: https://www.iata.org/contentassets/4eae6e82b7b948b58370eb6413bd8d88/airport-service-level-agreement.pdf.
[40] IATA, International Air Transport Association. Airport Development Reference Manual. 10th edition, 2014.
[41] ICAO, Internatiocal Civil Aviation Organization. Manual on Air Traffic Forecasting. ICAO, 3rd edition, 2006.

Bibliography 97
[42] ICAO, International Civil Aviation Organization. Airport Planning Manual, Part 1, Master Planning. ICAO, Mon-treal, Canada, 2nd edition, 1987.
[43] ICAO, International Civil Aviation Organization. Airport Planning Manual, Part 1, Master Planning. ICAO, Mon-treal, Canada, 2nd edition, 1987.
[44] ICAO, International Civil Aviation Organization. Aerodrome Design Manual - Part 2 Taxiways, Aprons and HoldingBays. ICAO, Montreal, Canada, 4th edition, 2005.
[45] ICAO, International Civil Aviation Organization. Annex 14: Aerodromes - Aerodrome Design and Operations, vol-ume 1. ICAO, Montreal, Canada, 2009.
[46] ICAO, International Civil Aviation Organization. Airport Economics Manual. ICAO, Montreal, Canada, 3rd edition,2013.
[47] IEA - Energy Technology Network. Aviation Infrastructurel. Retrieved 5-1-2021, from: https://iea-etsap.org/E-TechDS/PDF/T16_Aviation_Infrastructure_v4%20Final.pdf.
[48] Janic, M. Airport analysis, planning and design: Demand, capacity and congestion. Airport Analysis, Planningand Design: Demand, Capacity and Congestion, pages 1–275, 2011.
[49] Janic, M. Airport Analysis, Planning and Design : Demand, Capacity and Congestion. Nova Science Publishers,Incorporated, New York, UNITED STATES, 2013. ISBN 9781617615603.
[50] Johnson, C. and Nobler, E. and Eudy,L. and Jeffers, M. Financial Analysis of Battery Electric Transit Buses.Retrieved 5-1-2021, from: https://afdc.energy.gov/files/u/publication/financial_analysis_be_transit_buses.pdf.
[51] Kaller, D.I.W.A. Robust model for operational stand and gate planning Schiphol. Msc thesis, Delft University ofTechnology, 2019.
[52] Kaslasi, R. Aircraft Stand Allocation Model for Strategic Use. Msc thesis, Delft University of Technology, 2019.
[53] Keeney, R.L. Value-focused thinking: Identifying decision opportunities and creating alternatives. European Jour-nal of Operational Research, 92(3):537–549, 1996. ISSN 0377-2217. doi: https://doi.org/10.1016/0377-2217(96)00004-5. URL http://www.sciencedirect.com/science/article/pii/0377221796000045https://www.sciencedirect.com/science/article/abs/pii/0377221796000045?via%3Dihub.
[54] Kolb, O. and Siegemund, S. Final Report - Study on the Implementation of Article 7(3) of the “Directive on theDeployment of Alternative Fuels Infrastructure” – Fuel Price Comparison. Publications Office of the EuropeanUnion, Luxembourg, 2014.
[55] Kwakkel, J. and Walker, W. and Marchau, V. Adaptive Airport Strategic Planning. European Journal of Transportand Infrastructure Research, 10:249, 2010. doi: 10.18757/ejtir.2010.10.3.2891. URL https://journals.open.tudelft.nl/ejtir/article/download/2891/3076.
[56] Lee, E.K. and Mitchell, J.E. Encyclopedia of Optimization - Integer Programming: Branch and BoundMethods. Retrieved 16-7-2020, from: https://link.springer.com/referenceworkentry/10.1007%2F978-0-387-74759-0_286.
[57] Li, C. Airport Gate Assignment A Hybrid Model and Implementation. ArXiv, abs/0903.2528, 2009.
[58] Lim, A. and Rodrigues, B. and Zhu, Y. Airport Gate Scheduling with Time Windows. Artif. Intell. Rev., 24:5–31,2005. doi: 10.1007/s10462-004-7190-4.
[59] Lu, H. Unsplash. Retrieved 20-2-2021, from: https://unsplash.com/photos/ak0KHs8sedw.
[60] Mangoubi, R. S. and Mathaisel, Dennis F. X. Optimizing Gate Assignments at Airport Terminals. TransportationScience, 19(2):173–188, 1985. ISSN 00411655, 15265447. URL www.jstor.org/stable/25768171.
[61] Miettinen, K. . Introduction to Some Methods and Applications of Nonlinear Multiobjective Optimization.Department of Math. Inform. Technology University of Jyväskylä, Finland. Retrieved 30-6-2020, from: https://www.lnmb.nl/conferences/2014/programlnmbconference/Kaisa.pdf.
[62] Mirkovic, B. and Tosic, V. Airport apron capacity: Estimation, representation, and flexibility. Journal of advancedtransportation, 48:97–118, 2014. doi: 10.1002/atr.1250.
[63] Mittelmann, H.D. . Latest Benchmark Results INFORMS Annual Conference - 7 Nov 2018. Retrieved 30-6-2020,from: http://plato.asu.edu/talks/informs2018.pdf.

Bibliography 98
[64] Munich Airport. Financial Report 2018. Retrieved 16-7-2020, from: https://www.munich-airport.com/_b/0000000000000006771266bb5d10d6da/FMG_IB2018_Financial-report.pdf.
[65] Neuman, U.M. Modelling and analysis of real world airport gate allocation problem. Phd thesis, University ofNottingham, 2015.
[66] Neuman, U.M. and Atkin, J.A.D. Airport Gate Assignment Considering Ground Movement. In Dario Pacino,Stefan Voß, and Rune Møller Jensen, editors, Computational Logistics, pages 184–198. Springer Berlin Heidelberg,2013. ISBN 978-3-642-41019-2.
[67] Obata, T. Quadratic Assignment Problem: Evaluation of Exact and Heuristic Algorithms. Report, RensselaerPolytechnic Institute, 1979.
[68] Oostra, R. NACO - Strategic Airport Planning, 2019. Company Presentation, Retrieved on: 22-05-2020.
[69] Prem Kumar, V. and Bierlaire, M. Multi-objective airport gate assignment problem in planning and operations.Journal of Advanced Transportation, 48(7):902–926, 2014. ISSN 0197-6729. doi: 10.1002/atr.1235. URL https://onlinelibrary.wiley.com/doi/abs/10.1002/atr.1235.
[70] Royal Schiphol Group. Financial Statements 2019. Retrieved 16-7-2020, from: https://www.annualreportschiphol.com/xmlpages/resources/TXP/Schiphol_web_2019/pdf/Schiphol_Financial_Statements_2019.pdf.
[71] Schiphol Group. Pocket Guide - SafetySecurity, . Retrieved 17-6-2020, from: https://assets.ctfassets.net/1msjktcn08sc/6D5rLzcoSscKcYkc2w4wcY/4bee106eaebb2f8aed6ada94c144794f/Zakboek_S_S_-_versie_april_2017-_EN.PDF.
[72] Schiphol Group. RASAS - Regulation Aircraft Stand Allocation Schiphol, . Retrieved 5-1-2021, from: https://www.schiphol.nl/en/download/b2b/1554102691/1h2NOsKSncc2uywE8OE02W.pdf.
[73] Schiphol Group. Airport charges and conditions 2020, . Retrieved 19-6-2020, from: https://www.schiphol.nl/nl/route-development/pagina/ams-airport-charges-levies-slots-and-conditions/.
[74] Gerald N. Steuart. Gate position requirements at metropolitan airports. Transportation Science, 8(2):169–189,1974. URL https://EconPapers.repec.org/RePEc:inm:ortrsc:v:8:y:1974:i:2:p:169-189.
[75] Tang, Ching-Hui and Yan, Shangyao and Hou, Yu-Zhou. A gate reassignment framework for real time flightdelays. 4OR, 8:299–318, 2010. doi: 10.1007/s10288-009-0112-1.
[76] TCRP, Transit Cooperative Research Program. Battery Electric Buses State of the Practice. TRCP, Washington, DC,2018.
[77] The Airport Professional. Melbourne looks towards swing gate solution. Retrieved 23-6-2020, from: https://airportprofessional.asn.au/major-airports/melbourne-looks-toward-swing-gate-solution/.
[78] TRB, Transportation Research Board. ACRP Report 20 - Strategic Planning in the Airport Industry. ACRP,Washington, D.C., 2009. URL http://www.calairports.com/ACRP%20Report%2020%20-%20Strategic%20Planning%20in%20the%20Airport%20Industry.pdf.
[79] TRB, Transportation Research Board. ACRP Report 25 - Airport Passenger Terminal Planning and Design. TRB,Washington, DC, 2010.
[80] TRB, Transportation Research Board. ACRP Report 96 - Apron Planning and Design Guidebook. ACRP, Washing-ton, DC, 2013.
[81] Wang, L. Optimized Assignment of Civil Airport Gate. 2010 International Conference on Intelligent System Designand Engineering Application, 2:33–38, 2010. ISSN 978-0-7695-4212-6. doi: 10.1109/ISDEA.2010.346. URL https://ieeexplore.ieee.org/document/5746132/.
[82] Xu, J. and Bailey, G. The Airport Gate Assignment Problem: Mathematical model and a tabu search algorithm.Proceedings of the Hawaii International Conference on System Sciences, page 77, 2001. doi: 10.1109/HICSS.2001.926327.
[83] Yan, S. and Huo, C. Optimization of multiple objective gate assignments. Transportation Research Part A: Policyand Practice, 35(5):413–432, 2001. ISSN 0965-8564. doi: https://doi.org/10.1016/S0965-8564(99)00065-8.
[84] Yan, S. and Shieh, C. and Chen, M. A simulation framework for evaluating airport gate assignments. Transporta-tion Research Part A: Policy and Practice, 36:885–898, 2002. doi: 10.1016/S0965-8564(01)00045-3.
https://www.schiphol.nl/nl/route-development/pagina/ams-airport-charges-levies-slots-and-conditions/

Bibliography 99
[85] Seker, Merve and Noyan, Nilay. Stochastic optimization models for the airport gate assignment problem.Transportation Research Part E: Logistics and Transportation Review, 48(2):438–459, 2012. ISSN 1366-5545.doi: https://doi.org/10.1016/j.tre.2011.10.008. URL http://www.sciencedirect.com/science/article/pii/S1366554511001335.

Tech
nisc
heUn
iversiteitDe
lft
Related Documents