Saimaa University of Applied Sciences Business Administration, Lappeenranta Degree Programme in International Business Management International Business Management Katja Kapanen AIRPORT PERFORMANCE IMPROVEMENT CASE MIKKELI CITY AIRPORT Master`s Thesis 2014

Welcome message from author
This document is posted to help you gain knowledge. Please leave a comment to let me know what you think about it! Share it to your friends and learn new things together.
Transcript
Saimaa University of Applied Sciences Business Administration, Lappeenranta Degree Programme in International Business Management International Business Management Katja Kapanen
AIRPORT PERFORMANCE IMPROVEMENT
CASE MIKKELI CITY AIRPORT Master`s Thesis 2014
2
Abstract Katja Kapanen Airport performance improvement, Case Mikkeli City Airport, 95 pages Saimaa University of Applied Sciences Business Administration, Lappeenranta Degree Programme in International Business Management Business Administration Master`s Thesis 2014 Instructors: Lecturer Marianne Viinikainen, Saimaa University of Applied Sci-ences, Managing Director Juha-Pekka Paananen, Global Navigator Oü. The purpose of the study was to find reasons why Mikkeli City airport perfor-mance should be improved and most of all how it could be done. The aim of the study was to find good practices from the best practices example Stockholm Skavsta airport for Mikkeli City airport for improving the airport performance.
This study is qualitative research using case study approach where research data was collected using interviewing and analysing of secondary data. Study was carried out using the benchmarking technique for finding the ways of improving the performance of Mikkeli City airport. Performance indicators used in the study were input: employment effect and production capacity, and output: quantity of passengers. Hypothesis of the study was that from Stockholm Skavsta airport could be learned practises, which can be used to improve the performance of the Mikkeli City airport.
The results of the study show that there is significant potential in Mikkeli City airport to improve the performance of the airport. Employment effect of the Mik-keli City airport is now 5.5 FTE and within 10 years it could be 35 FTE with 500,000 passengers. City of Mikkeli is gaining economic benefit directly from the municipality tax. The amount is now 28 930€ and it could be after 10 years 211 700€. From employees on the Mikkeli region 0.03% are employed by the Mikkeli City airport and after 10 years 0.19%. Production capacity of the Mikkeli City airport is with current facilities 12 planes and maximum 3600 passengers per week. Lengthening the opening hours the production capacity could be 70 planes and maximum 21,000 passengers per week. Lengthening the runway and opening hours the production capacity could be 70 planes and maximum 42,000 passengers per week. These calculations are hypothetical and do not take into account any variables. The study also shows that developing the per-formance of the Mikkeli City airport could gain big economic benefits to the Mik-keli region. Besides the municipality tax, the municipality could gain economic benefit from the passengers arriving to the region. According to the calculations tourism income could be with 500,000 passengers, 25€ million. Also the study confirms the hypothesis that there are practices in Stockholm Skavsta airport the Mikkeli City airport should apply in practice: 1. Segmentation: to become leading tourism airport in Finland, 2. Destinations: offering wide range of tourism destinations and 3. Ownership: privatizing the airport.
Keywords: regional airport, performance indicators, economic benefit

3
GLOSSARY OF TERMS .................................................................. 4 1 INTRODUCTION ......................................................................... 6
1.1 Background of the study ......................................................................... 6 1.2 Objective and delimitations ..................................................................... 9 1.3 Research questions ................................................................................ 9 1.4 Theoretical framework .......................................................................... 10 1.5 Research method .................................................................................. 12 1.6 Structure of the study ............................................................................ 15
2 AIRPORT INDUSTRY ............................................................... 17 2.1 Airport operations .................................................................................. 17 2.2 Revenues and cost structure of airport ................................................. 18 2.3 Airport network in Finland ..................................................................... 20 2.4 Development of aviation sector ............................................................. 23
3 AIRPORT PERFORMANCE ...................................................... 30 3.1 Performance management techniques for airports ............................... 31 3.2 Performance Indicators for airports ....................................................... 33
4 AIRPORT PRESENTATION ...................................................... 43 4.1 General information .............................................................................. 43 4.2 History in brief ....................................................................................... 49
5 AIRPORT PERFORMANCE COMPARISON ............................ 52 5.1 Airport input ........................................................................................... 53
5.1.1 Direct and indirect employment ...................................................... 53 5.1.2 Production capacity of the airport system ...................................... 58
5.2 Airport output ........................................................................................ 60 5.3 Economic benefits for the City of Mikkeli .............................................. 66
6 PROPOSAL FOR MIKKELI CITY AIRPORT ............................. 70 7 CONCLUSIONS ........................................................................ 78 LIST OF FIGURES ......................................................................... 85 LIST OF TABLES ........................................................................... 86 LIST OF PICTURES ....................................................................... 87 LIST OF REFERENCES. ................................................................ 88

4
GLOSSARY OF TERMS
AERODROME Any area of land or water designed for the taking off and landing of aircraft. Small aerodrome without air traffic control services, light aerodromes any place for the taking off and landing, for instance, field.
AERONAUTICAL REVENUE
Aeronautical or commercial revenues are those sources of income that arise directly from the operation of aircraft and the processing of passengers and freight, for instance fees for landing and passengers.
AIRFIELD A place where planes can fly from, especially one used by military planes. Also an area of land given over to runways, taxiways and aprons.
AIR TRANSPORT MOVEMENT (ATM)
Air transport movement is the handling of aircraft at the airport. Requires approximately the same effort as handling 100 WLU (1 WLU = one passenger or 100 kg of freight).
AIRPORT A civil aerodrome designed for the take-off and landing of passenger-carrying aircraft for the general public and/or cargo aircraft. Part of the air transport system. Consists of infrastructure divided to airside and land-side.
AIRPORT COMMERCIALISATION
The transformation of an airport from a public utility to a commercial enterprise and the adoption of a more business-like management philosophy.
AIRPORT PRIVATISATION
Transfer of full or majority ownership of facilities and services to the private sector by a variety of methods as share flotation’s, the adoption of strategic partner-ship and the introduction of private management con-tracts.

5
AIRPORT THROUGHPUT UNIT (ATU)
Performance indicator of output of the airport. Used with big international airports. Combines the passen-gers and freight with aircraft movements. Airport throughput unit is counted as: ATU = (passengers+10) x (freight tonnes+100) x ATM (air transport movement).
BENCHMARKING The process of making performance comparison be-tween two organizations (external benchmarking) in or-der to make improvements.
BEST PRACTICES Practices that, over time, have proven cost-effective, efficient and successful in developing airport.
CUSTOMER Customers for an airport are airline operators and pas-sengers.
FULL TIME EQUIVALENT (FTE)
Amount of full-time employees, part-time employees should convert to FTE`s when counting the employ-ment effect of the airport.
KPA Key Performance Areas of performance corresponding to the expectations of providers, regulators, users and other interested parties.
KPI (PI) Key Performance Indicator (Performance Indicator), basic tool – metrics – for measuring airport perfor-mance. Are divided to key performance areas.
NON-AERONAUTICAL REVENUE
Non-aeronautical or commercial revenues are those generated by activities that are not directly related to the operation of aircraft, but those from commercial ac-tivities within the terminal and rents for terminal space and airport land.
WORK LOAD UNIT (WLU)
Performance indicator of output of the airport. Com-bines passengers and freight. One WLU = one pas-senger or 100 kg of freight.
(CROCKER 2005; GRAHAM 2014; ICAO 2013; LONGMAN 2001.)

6
1 INTRODUCTION
An airport`s buildings, runways, passengers, employees, aircrafts etc. create
the place where the journey really begins; a fast transport mode, which can take
you within few hours to the heart of Europe. This study is a story about small
regional airport in eastern part of Finland. The story began before the Second
World War and it has overcome challenging times. Today the airport is at a
crossroad and it has to choose the way to go on. Today the main users of the
airport are the Finnish Army by using the airport to transport staff to and from its
South Savo Regional Office of Army Command Finland and the active leisure
time and aviation training users. This study is a story about Mikkeli City airport.
1.1 Background of the study
In 2014 we are having challenging times. Worldwide we have an economic re-
cession, GDP`s are not increasing as economists have wanted, and our Finnish
government is talking about the balancing of the public economics. Mikkeli City
airport is municipality owned and it has been working mainly by public funding.
According to the EU legislation this has to be stopped: Mikkeli City airport oper-
ations should be based on profitable business, not to violate against EU legisla-
tion about governmental support for aviation (Ministry of Transport and Com-
munications 2014).
The Mikkeli City airport is important not only for helping people from South Savo
to travel from Mikkeli, but also for the enterprises having operations in South
Savo, transferring people and goods, and also bringing new customers and
tourists to Mikkeli. TAK Oy (Tutkimus- ja Analysointikeskus 2011) has studied
the amount of money Russian flight tourists are leaving to Lappeenranta area,
also location of small regional airport in Eastern part of Finland, and according
to their research, one passenger leaves to the region 140€. The money is used
mainly for services. According to these calculations, 100,000 Russian tourists,
who will come to the area because of fast and cheap flights, would leave at min-
imum 14€ million to the area, and in some scenarios even more. (Tak Oy 2011.)
In the Mikkeli City airport`s catchment area, a 150 km radius covers over
500,000 people in Finland, including Lappeenranta, Imatra, Kouvola, Savonlin-
7
na, Varkaus, Heinola, Lahti and Jyväskylä, which is 9.2% of the whole Finnish
population. From these cities, regional airports belonging to the State-owned
Finavia airport network can be found in Lappeenranta, Varkaus, Savonlinna and
Jyväskylä. In 2013 Lappeenranta had 98 300, Varkaus 6 759, Savonlinna 12
215 and Jyväskylä 50 570 annual passengers from which in Lappeenranta
99.8% (98 153), in Varkaus 25.7% (1 737), in Savonlinna 22.3% (2 718) and in
Jyväskylä 26.4% (13 333) were international passengers (Finavia 2013). East-
ern part of Finland has an advantage, which other regions in Finland do not
have, the distance from the City of Mikkeli to St. Petersburg is only 320 km. St.
Petersburg and the whole Leningrad region with its over 8 million inhabitants
provides a unique possibility to gain Russian tourists to the area. Flight time
from Moscow to Mikkeli is 1.5 hours and from St. Petersburg to Mikkeli 0.5
hours. (City of Mikkeli 2012; Finavia 2013; Mikkeli City airport 2012; Paananen
2014a.)
The situation with all the regional airports in Finland have also challenging times
ahead. A work group appointed by the Ministry of Transport and Communica-
tions, should complete the air transport strategy for Finland at the end of 2014.
The strategy will include considerations of the impacts of various airport network
alternatives on regional accessibility and the service level in Finnish airports.
(Ministry of Transport and Communications 2013a.)
The aim of the work group is to produce a comprehensive evaluation of Fin-
land`s airport networks, using different criteria; economic indicators, service
level, regional accessibility, and the needs of airport managing bodies and air-
lines. The most crucial for regional airports is the considered level of service.
According to the Ministry of Transport and Communications (2013b) it is im-
portant that the journey to the airport takes less than three hours, and that the
total length of the entire travel chain from the regions to the Helsinki-Vantaa
airport doesn`t exceed six hours. A three-hour train or bus trip is a competitive
alternative for short-distance flights together with the waiting time at the airport.
The group will also examine the needs of tourism and business operations in
the impact area of the airport. According to the Finland`s ex-Minister of
Transport, Ms Merja Kyllönen (Ministry of Transport and Communications
8
2013b), the strategy is aimed to secure Finland`s competitiveness and main-
taining good air connections to and from the country. (Ministry of Transport and
Communications 2013b.)
Finland is a country of extensive area and long transport distances. It is admit-
ted by the Finnish Ministry of Transport and Communications (2012) that good
traffic connections are also a key condition for regional development and one of
the most important factors influencing the location and operating environment
for companies. That`s why the question about the future of the regional airports
influences more widely than one could imagine. And behind all of this is the
most powerful thing in the whole world – money. If there is not enough money to
run all the current regional airports, some actions have to be taken. These ac-
tions can be closing down or privatizing some of the regional airports. If some
regional airports are closed down it has big influences to the region, not only for
the accessibility of the region, but also more widely for the business life of the
region. Direct and indirect influences can cost a lot for the regions, and that is
why some of the regions have been attracting aviation companies with different
kinds of contributions. Many municipalities are using directly the taxpayers`
money to secure the flights to the regional airport. There are now many discus-
sions for and against efforts for maintaining regional airports.
The author`s interest in the subject of this thesis arises from work experience in
a municipality-owned business development company doing close cooperation
with aviation companies and other aviation related partners for maintaining re-
gional airport in use for long-distance flights from Finland to overseas destina-
tions. The situation at the Finnish regional airports is now crucial. Economic cri-
ses, increased costs, decreased amount of passengers and the fast changing
environment in aviation has set big challenges for maintaining regional airports.
Air transport strategy by the Ministry of Transport and Communications will set
governmental priorities according to the need for accessibility and national
strategy outlines for regional airports. Now it is a time for regional airports to
develop their business strategies and convince relevant parties that maintaining
a regional airport can be a profitable business as a business unit, and it has
many positive effects on the region and its development.
9
1.2 Objective and delimitations
The main objective of this thesis is to make a proposal for Mikkeli City airport for
developing airport performance. The aim is to present an airport performance
comparison between Mikkeli City airport and a best practise example, Stock-
holm Skavsta airport. The comparison between these airports will be done us-
ing metrics such as employment, production capacity and the quantity of pas-
sengers for offering justifications why regional airport is worth maintaining and
worth future development. This model provides the information for decision-
makers and other airport performance interested parties about the factors be-
hind the importance of the regional airport on the regional level.
The results of this study will give decision-makers in the City of Mikkeli the big-
ger picture behind the passenger figures, which will help them to make deci-
sions about the future of Mikkeli City airport, and whether the Mikkeli City airport
is worthy of future development. In case the airport performance is not im-
proved, it can have big influences on the region, and once the airport is closed
down, it is not easy task to open it again for traffic.
This study is limited to airport performance comparison between best practise
example – Stockholm Skavsta and Mikkeli City airports, but if necessary to un-
derstand the business environment of these airports, facts from other airports
are also included. Also Finnish state owned Finavia is mentioned many times,
because it is an authority responsible for the airport network in Finland, and for
offering air traffic control and aviation security services in the whole of Finland.
The air transport strategy proposal will also have an influence not only for the
future of the regional airport network, but also for the future of the Mikkeli City
airport.
1.3 Research questions
The main research question in this thesis is:
• How to improve the performance of Mikkeli City airport?
Purpose of this question is to prepare proposal for the City of Mikkeli about what
could be done to improve the performance of the Mikkeli City airport. To be able
10
to answer this question, the performance of Mikkeli City airport is compared to
performance of the successful partially privatised Stockholm Skavsta airport, in
Sweden and to learn from their experience how it is possible to develop small
airports, once in military use, to become one of the biggest passenger hubs in
Scandinavia.
The sub-questions are:
• Why to improve the performance of Mikkeli City airport?
• What is airport performance and how it is measured?
• What can be learned from Stockholm Skavsta airport -case?
This issue is relevant for all the regional airports in Finland gaining economical
independency and possible profit from the airport business. It is not an easy
task to do and now the EU legislation has forced municipality-ran airports to
gain it. It is now a question of trying to achieve economical independence or
not.
1.4 Theoretical framework
Theoretical framework of the study is built on the key performance areas and
key performance indicators of airport performance studies. Main sources of in-
formation have been used from the studies conducted by Mrs Anne Graham
from University of Westminster, London, and Mr Hans-Arthur Vogel from IUBH
International University of Applied Sciences, Bad Honnef and Bad Reichenhall,
and also University of Westminster, London. They have studied and published
studies about airport performance individually, together, and with other re-
searchers within the decade of 2000. (Graham 2014; Graham 2005; Vogel
2004; Vogel, H. –A., Graham, A. 2010.)
Main sources of information used in this study are input – output performance
indicators according to Graham and Vogel (Graham 2014, p. 86; Vogel 2004,
pp. 24–25). Also other key performance indicators have been used when com-
paring the performance of airports. Within the airport organisations the perfor-
mance indicators have been introduced by ACI Europe – European region of
Airports Council International (2014), ICAO – International Civil Aviation Organi-

11
sation (ICAO 2013; 2012) and American Federal Aviation Administration
(through ACRP – Airport Cooperative Research Programme 2011). Graham
(2014, pp. 87–88) also introduces the performance indicators used by senior
management level. According to Humphreys et al. (2002, p. 80) performance
measures of the airport can be divided into financial, commercial and opera-
tional performance measures and these are commonly used measures when
moving towards privatising airports. In the financial sector creditors and inves-
tors in airports are using financial measures of key performance indicators – key
ratios, to be able to compare the performance of an airport with other business
sectors (Graham 2014, p. 90; Vogel 2004, p. 25).
The use of input – output ratios or performance indicators of an airport can give
an understandable picture about the performance of an airport for those who
are not accepting credit applications or making investment decisions, or those
who are not making worldwide performance comparisons for members of airport
organisations, or those who are not giving detailed information about the airport
for airport management, but for those who are interested about airports and
about the basic performance of an airport. They can give a picture about what is
happening inside the airport and they can be used for comparing incomparable
airports. The use of other indicators in comparison needs comparable airports
and comparable information about these airports. This study, as a part of devel-
opment project for the Mikkeli City airport, can give with input – output ratios a
comparison between Mikkeli City airport and the best practices example airport,
basic information about the performance of Mikkeli City airport and how it could
be improved.
Graham (2014) has been used as a main source of airport business infor-
mation. Graham`s book is about managing airports. It gives a wide picture of
the airport business starting from the airport definition and ending with environ-
mental effects of an airport. Also researchers as Graham Francis, Ian Hum-
phreys, and Jackie Fry (2002; 2005), Ian Humphreys and Graham Francis
(2002) and Oum et al. (2003) have studied a lot about airport business, and
some of their studies have also been used as theoretical framework in this
study.
12
This thesis is justified as providing a proposal for performance improvement for
the City of Mikkeli for future development of the airport. Many master`s theses
studies have been made about the services provided at the regional airports
and the service expectations of different passenger groups at the regional air-
ports. The main concern at this moment is how to develop airport operations to
be able to bring customers, passengers and aviation companies to the airport.
1.5 Research method
Current study is qualitative research using case study approach.
According to Eriksson et al. (2008, p. 5), qualitative research is an adequate
method of knowledge production and that a qualitative approach, such as a
case study, is concerned with interpretation and understanding reality. Gillham
(2010, p. 10) argues that qualitative methods are also descriptive and inferential
in character. Qualitative methods focus on evidence that will enable under-
standing the meaning of what is going on, according to Gillham (2010, p. 10),
and all evidence is pulled into the case study from researcher`s data collection
from what people say and what they do. A case study, according to Gillham
(2010, pp. 1–2), investigates answers to specific research questions and seeks
a range of different kinds of evidence, which is there in the case setting and
which has to be abstracted and collated to get the best possible answers to the
research questions. Using multiple sources of evidence, each with its strengths
and weaknesses is, according to Gillham (2010, p. 2), a key characteristic of
case study research. Second characteristic of case study is, according to Gill-
ham (2010, p. 2), that research can not start with a priori theoretical notions be-
cause until the researcher gets in there and gets hold of the data and gets to
understand the context, researcher won`t know what theories or explanations
work best or make the most sense. According to Eriksson et al. (2008, pp. 120–
121), case study researcher is an interpreter who both constructs the case and
analyses it and that the uniqueness of the case justifies the appropriateness of
the case study approach.
In this study, data collection was conducted using two methods. According to
Eriksson et al. (2008, p. 126), case studies are usually considered more accu-
rate, convincing, diverse and rich if they are based on several sources of empir-

13
ical data. In this study first of all has been used interviewing and second, an
analysis of the secondary data. Interviews were open-ended interviews with just
a few key open questions, e.g. “elite interviewing”. According to Gillham (2010,
pp. 63–64), the élite interviewing means that the interviewed person is someone
in a position of authority, or expert, or authoritative people who are capable of
giving answers with insight and a comprehensive grasp of what is being re-
searched. Principal sources of data are the interviews made with Juha-Pekka
Paananen, Managing Director, Global Navigator Oü, who is responsible for the
development project of the Mikkeli City airport, Sakari Silvennoinen, Director of
the Mikkeli City airport, Dot Gade Kulovuori, Managing Director of the Stock-
holm Skavsta Airport AB, and Eric Carlgren, Municipality Director of the Munici-
pality of Nyköping. No questionnaires were done, but these sources answered
the questions concerning the inputs and outputs of the airports and also the
questions concerning the history and current situations of these airports. Munic-
ipality Director of Nyköping, Eric Carlgren opened the municipality point of view
about the Stockholm Skavsta airport. To complement the picture about the
business environment of airports, multiple data sources such as various interna-
tional publications, articles, books and statistics, in air transport journals, data-
bases, webpages etc. were studied. Some of that information and those theo-
ries are brought to this work to give guidelines about what general theories exist
about airports as a business unit and to introduce the airport business more
widely.
As an analytical technique of collected data in this study, benchmarking, which
is today widely used airport performance technique, has been used. The use of
this management tool has increased together with the commercial and business
pressure within the airport sector. According to Graham (2005, p. 99), bench-
marking has been viewed as a particularly difficult task because of the diversity
in the outputs, inputs and operational environments, but in recent years various
developments have encouraged the airport industry to change its attitude to-
wards benchmarking. According to Graham (2005, p. 99), many airports have
become much more commercially oriented and have adopted a much more
business like management philosophy. Transformation away from the view of
airports as public utilities towards being considered as commercial enterprises
14
has according to Graham (2005, p. 99), led to airports seeking ways to gain in-
sights into their operations and to improve their performance by benchmarking
themselves against others. Many airports no longer see their role as merely
providers of infrastructure but according to Graham (2005, p. 100), instead they
view themselves more and more as just any other industry that requires a wide
range of business competencies and skills together with the adoption of effec-
tive management and business techniques, including benchmarking. According
to Patterson (1996, p. 8), benchmarking helps companies in two ways by first
focusing on significant improvements rather than incremental improvements to
help identify real-life targets, and secondly by providing a measurement system
which helps figuring out what benchmark moves you need to measure your own
processes.
Financial metrics and productivity measures are the two basic approaches to
performance measurement in airport performance studies. Different analytical
techniques have been used to measure airport performance with a variety of
input and output variables. Two basic approaches of performance indicators are
partial versus total measures. While Partial Factor Productivity (PFP) measures
examine the relationship between one or more inputs (e.g. labour, capital etc.)
and one or more outputs (e.g. passengers, freight, etc.), Total Factor Productivi-
ty (TFP) and Data Envelopment Analysis (DEA) are producing an overall meas-
urement of the combined factor inputs in relation to the total output produced.
Total Factor Productivity (TFP) and Data Envelopment Analysis (DEA) can`t be
used in Mikkeli City airport case because of the need for multiple inputs in gen-
erating multiple outputs. (Vogel 2004, pp. 35–39; Oum et. al. 2003, p. 287.)
To be able to find an answer to the research question “How to improve the per-
formance of the Mikkeli City airport”, the performance of the airport is bench-
marked with the performance of the Stockholm Skavsta airport by means of par-
tial factor productivity (PFP) which measures the relationship between one or
more inputs (e.g. labour, capital etc.) and one of more outputs (e.g. passengers,
freight, etc.). As inputs are seen the economical effects of the direct and indirect
employment, and as capital input the production capacity of the airport i.e. the
capacity of aircrafts the airport can handle. Output is the amount of passengers
15
the airport could handle in the current situation at the Mikkeli City airport and
after lengthening the runway. Also the economic effects of the amount of pas-
sengers to the Mikkeli region are counted.
Main limitations of the partial benchmarking measures are that they tend to be
very much data led and relate to areas where data is readily available rather
than where performance assessment is ideally needed (Humphreys and Francis
2000 via Graham 2005). Also partial measures only give “partial” and rather
disjointed diagnosis of the situation and can be misleading if only selected indi-
cators are chosen. (Graham 2005, p. 106.)
The hypothesis in this thesis is that Mikkeli City Airport could improve it`s per-
formance by learning practises from Stockholm Skavsta airport. That is why the
theoretical and empirical material stands for the fact that Mikkeli City Airport
could improve its performance.
1.6 Structure of the study
The first chapter of this study gives an introduction of the case and also justifies
the importance of the study. In the theoretical part of the study, in the second
chapter of the study, the airport industry is introduced, first introducing the air-
port operations, and the formulation of how revenues and costs of an airport are
built. Then the airport network of Finland is introduced and the current situation
and future prospects of an aviation sector, especially in Finland is presented by
concentrating on the economic effects of an aviation sector to the Finnish econ-
omy. Third chapter is about airport performance and what performance man-
agement techniques in airport studies have been used and what kind of perfor-
mance indicators there exists when performance of an airport is presented and
compared with another airports. In fourth chapter the Mikkeli City and Stock-
holm Skavsta airports are presented with general information and history of the-
se airports.
In the empirical part of the study the Mikkeli City airport performance is bench-
marked with the performance of the best practise example airport – Stockholm
Skavsta airport. In 2013 Skavsta had 2.2 million passengers (Stockholm
Skavsta airport 2014a; Swedish transport agency 2014a), but its success story

16
has begun from a similar situation with Mikkeli City airport almost 20 years ago.
The survey is trying to find the key issues Mikkeli could adopt from Stockholm
Skavsta airport to be able to improve its performance. Profitability is the main
concern when thinking about service development at the regional airports, but
there are not many ways to do it. At this very moment either the government is
funding regional airports or the municipalities via different contributions. In the
public discussion has arisen a question about running the regional airport with-
out the help of public sector as an entirely private business. One of the ways of
doing it is to collect the money for running the airport from the tourists who are
using the airport. It is called passenger fee. Low-cost airlines are against it, be-
cause it would raise the ticket prices, but in the long run if the users of the air-
port aren`t paying for the airport operations, who will?
The study ends with the chapter where the proposal for Mikkeli City airport is
presented. The proposal includes practices, which have come up when making
the airport performance comparison. Stockholm Skavsta airport is a unique
case and there can be found many issues the Mikkeli City airport could use for
improving airport performance. A proposal for the City of Mikkeli with main prac-
tices from the comparison is presented.

17
2 AIRPORT INDUSTRY
2.1 Airport operations
Airports are an essential part of the air transport system. They provide all the
needed infrastructure to enable passengers and freight to transfer from surface
to air modes of transport and to allow airlines to take off and land. The basic
airport infrastructure (Figure 1) consists of runways, taxiways, apron space,
gates, passenger and freight terminals, and ground transport interchanges. The
airport system is divided to airside and landside of an airport. On the airside of
an airport is the aircraft flow and on the landside passenger flow. (Graham
2014, p. 1; Rauhamäki et. al. 2006, pp. 47–48.)
Figure 1. Airside and landside of an airport. (Adapted from Horonjeff 1975 via Rauhamäki et al. 2006, p. 48.)
Airports bring together a wide range of facilities and services to be able to fulfil
their role within the air transport industry. These services include air traffic con-
trol, security, and fire and rescue in the airfield. Handling facilities are needed
18
for transferring passengers, baggage, and freight successfully between aircraft
and terminals, and processed within the terminal. Airports can also offer a wide
variety of commercial facilities ranging from shops and restaurants to hotels,
conference services and business parks. (Graham 2014, p. 1.)
Development of the airport sector has moved from an industry characterised by
public sector ownership and national requirements, into a new era of airport
management where the private sector and international airport companies play
a major role. According to Graham (2014) airports are now complex enterprises
that require a wide range of business competencies and skills, as any other in-
dustry. Airports are no longer just infrastructure providers, but providers of facili-
ties to meet the needs of their users. (Graham 2014, p. 6.)
2.2 Revenues and cost structure of airport
Within the airport, commercialisation and more business-like management phi-
losophy has been adopted. Airport operations can be divided to revenues and
cost structures. According to ACI, Airports Council International (worldwide pro-
fessional association of airport operators), airport revenue is usually classified
into two main categories: aeronautical or aviation and non-aeronautical or
commercial revenues (Figure 2). Aeronautical revenues are those sources of
income that arise directly from the operation of aircraft and the processing of
passengers and freight such as landing fees, passenger fees, aircraft parking
and hangar fees, security fees, handling fees (if handling is provided by the air-
port operator), terminal rental fees (e.g. in USA) and other aeronautical fees, for
instance, air traffic control, lighting, air bridges and so on. Non-aeronautical rev-
enues are those generated by activities that are not directly related to the op-
eration of aircraft, notably those from commercial activities within the terminal
and rents for terminal space and airport land, such as retail*, food and beverage
(F&B)*, car hire*, advertising*, car park*, recharges (for gas, water, electricity
etc.) and other non-aeronautical revenue (consultancy, visitor and business
services, property development etc.). (* Usually called as “concession revenue”
if provided by a third party.) (ACI International 2012; Graham 2014, pp. 74–75.)
19
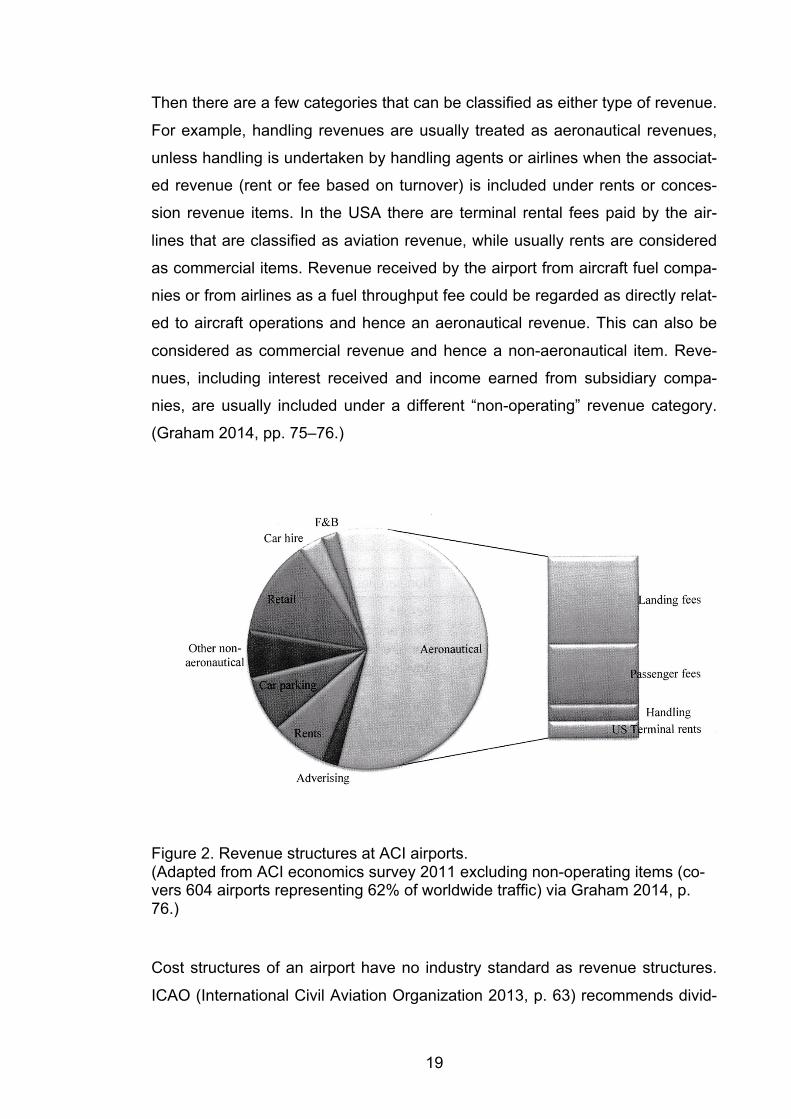
Then there are a few categories that can be classified as either type of revenue.
For example, handling revenues are usually treated as aeronautical revenues,
unless handling is undertaken by handling agents or airlines when the associat-
ed revenue (rent or fee based on turnover) is included under rents or conces-
sion revenue items. In the USA there are terminal rental fees paid by the air-
lines that are classified as aviation revenue, while usually rents are considered
as commercial items. Revenue received by the airport from aircraft fuel compa-
nies or from airlines as a fuel throughput fee could be regarded as directly relat-
ed to aircraft operations and hence an aeronautical revenue. This can also be
considered as commercial revenue and hence a non-aeronautical item. Reve-
nues, including interest received and income earned from subsidiary compa-
nies, are usually included under a different “non-operating” revenue category.
(Graham 2014, pp. 75–76.)
Figure 2. Revenue structures at ACI airports. (Adapted from ACI economics survey 2011 excluding non-operating items (co-vers 604 airports representing 62% of worldwide traffic) via Graham 2014, p. 76.)
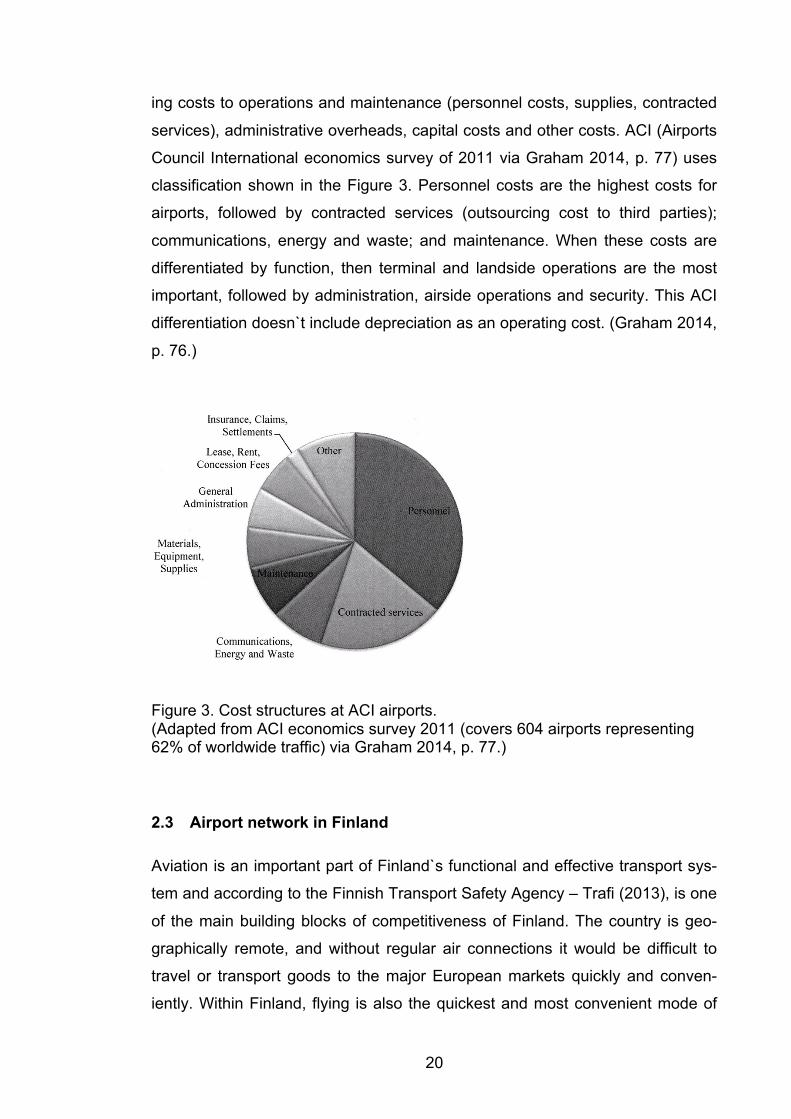
Cost structures of an airport have no industry standard as revenue structures.
ICAO (International Civil Aviation Organization 2013, p. 63) recommends divid-
20
ing costs to operations and maintenance (personnel costs, supplies, contracted
services), administrative overheads, capital costs and other costs. ACI (Airports
Council International economics survey of 2011 via Graham 2014, p. 77) uses
classification shown in the Figure 3. Personnel costs are the highest costs for
airports, followed by contracted services (outsourcing cost to third parties);
communications, energy and waste; and maintenance. When these costs are
differentiated by function, then terminal and landside operations are the most
important, followed by administration, airside operations and security. This ACI
differentiation doesn`t include depreciation as an operating cost. (Graham 2014,
p. 76.)
Figure 3. Cost structures at ACI airports. (Adapted from ACI economics survey 2011 (covers 604 airports representing 62% of worldwide traffic) via Graham 2014, p. 77.)
2.3 Airport network in Finland
Aviation is an important part of Finland`s functional and effective transport sys-
tem and according to the Finnish Transport Safety Agency – Trafi (2013), is one
of the main building blocks of competitiveness of Finland. The country is geo-
graphically remote, and without regular air connections it would be difficult to
travel or transport goods to the major European markets quickly and conven-
iently. Within Finland, flying is also the quickest and most convenient mode of
21
travel. Finnish Transport Safety Agency – Trafi, is the state`s national civil avia-
tion authority with responsibility for ensuring that air transport is as safe and as
environmentally friendly as possible and also for promoting the facilitation and
flow of air traffic. (Trafi 2013.)
On an international level, Trafi co-operates with Civil Aviation Organisation
(ICAO), who sets the minimum standards and issues recommendations for in-
ternational air transport. On European level, aviation authorities co-operate un-
der the European Civil Aviation Conference (ECAC) for promoting safety, effi-
ciency and sustainable development in civil aviation. High standard of flight
safety throughout Europe is also the aim of the European Aviation Safety Agen-
cy (EASA), which is the joint aviation authority for all EU countries. In the future
European Union will take more responsibility for publishing most standards re-
lating to airworthiness, maintenance, and flight operations and licensing. On
national level, Trafi is responsible for regulating military, state aviation (customs,
police, Border Guard), ultra light, amateur-built and historical aircraft flight oper-
ations in Finland. The basic rules for Finnish aviation are established in the Avi-
ation Act. Aviation regulations are divided into series as General, Aerodromes
and Ground Aids, Air Navigation Services, Airworthiness, Operations, Person-
nel Licensing and Training, Security, and in the near future International. (Trafi
2013.)
In Finland can be found 25 airports (Table 1 and Picture 1) belonging to the
Finavia airport network, which is a public limited company owned by the Finnish
State. Two independent airports, not part of the Finavia airport network, from
which Mikkeli is municipality owned and Seinäjoki owned by the Rengonharju
Foundation. All these airports have the permission from Trafi for aviation opera-
tions and offer air traffic control services for the aircrafts to take-off and land.
Besides these airports, in Finland can be found 56 (on 3.3.2014) small aero-
dromes or airfields, having permission from Trafi for aviation operations, but
they do not offer air traffic control services. Different interest groups run them:
municipalities, privatized airport companies, foundations, aviation clubs or indi-
vidual persons. These airfields are mainly used for leisure time aviation. Also,
several other aviation related places can be found, for instance fields or light

22
aerodromes for take-off and landing for small leisure time air vehicles. These
places are run without aviation permission from Trafi and they do not offer air
traffic control services. Users of such a places are the leisure aviation users. In
Finland can also found 24 heliports, from which most of the heliports are locat-
ed, within the hospitals or central hospitals. (City of Seinäjoki 2013; Finavia
2014a; Lentopaikat 2014; Mikkeli City airport 2012; Trafi 2014.)
Table 1 and Picture 1. Finavia network airports with passenger volumes. (Adapted from Finavia 2014b.)
According to interim report of working group responsible for the Finnish air
transport strategy by the Ministry of transport and communications (2013c), the
Finnish airports are divided into six categories: the main airport being the Hel-
sinki-Vantaa with 15 million annual passengers. To basic regional airport net-
work, with connection flights to Helsinki-Vantaa and with general aviation or
mixed general and military aviation belongs Oulu, Rovaniemi, Vaasa, Kuopio
and Maarianhamina. Airports supporting tourism and seasonal flights are Kittilä,
Ivalo, Kuusamo, Kajaani and Enontekiö. Airports within cities, with international
23
flights are Tampere-Pirkkala and Turku. Other airports are found in Helsinki-
Malmi, Joensuu, Lappeenranta, Kokkola-Pietarsaari, Jyväskylä, Kemi-Tornio,
Pori, Savonlinna, Varkaus, Halli, Kauhava and Utti. To the sixth category belong
Mikkeli and Seinäjoki airports. From these airports, Halli, Kauhava and Utti are
military airports and Helsinki-Malmi will be closed down until 2016. (Ministry of
transport and communications 2013c, pp. 15–18; Helsingin Sanomat 2014.)
Revenue for the Finavia Group (including Helsinki-Vantaa airport, Airport net-
work, Passenger services, Air navigation services, Airpro, and Real estate op-
erations) in 2013 was 352.8€ million, which was -2.0% compared with 359.2€
million in 2012. Revenue for Helsinki-Vantaa airport was 149.3€ million, which
was 1.6% better than 146.9€ million in 2012. Revenue for airport network in
2013 was 41.3€ million, which was -3.7% from 42.9€ million in 2012. Result of
the whole Finavia Group for the 2013 was 15.1€ million, which was 4.3% from
the revenue and -3.0% worse than 15.5€ million with 4.3% from the revenue in
2012. Almost half of the profit of Helsinki-Vantaa is needed to cover the ex-
penses of the airport network. According to Lassi Hilska from Ministry of
Transport and Communications (2013c; 2013d), in 2011 from Finavia network
airports only Helsinki-Vantaa made a profit, and all the regional airports needed
compensation for 22€ million to cover the expenses. It is estimated that in 2020
passengers in Helsinki-Vantaa will be 20 million and in 2030 there will be 23
million passengers, and in the whole airport network 25 million passengers in
2030. (Finavia 2014c; Ministry of transport and communications 2013c, p. 18,
24; Ministry of Transport and Communications 2013d, p. 11.)
2.4 Development of aviation sector
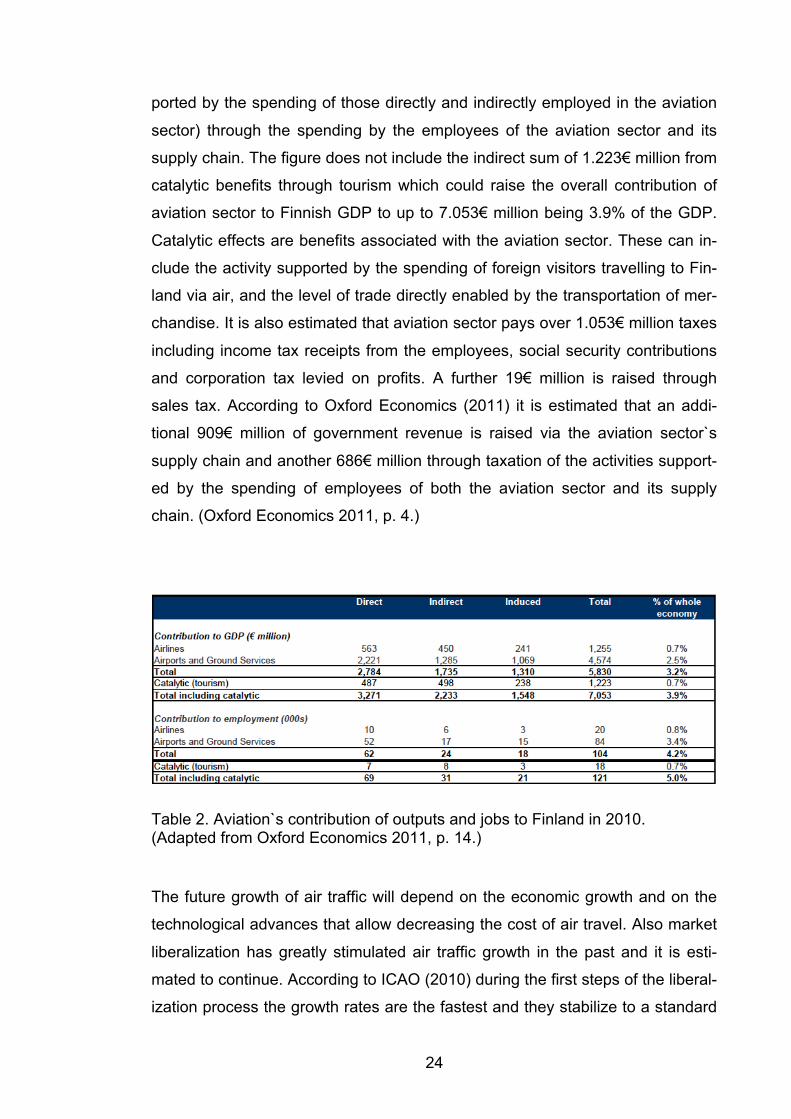
Economic benefits from air transport to Finland have been estimated to be 3.2%
(in 2010 – Table 2) from Finnish GDP being 5.830€ million. This figure includes
2.784€ million directly (direct effect – the output and employment of the firms in
the aviation sector) contributed through the output of the aviation sector, includ-
ing airlines, airports and ground services. 1.735€ million indirectly (indirect ef-
fect – the output and employment supported through the aviation sector`s Finn-
ish based supply chain) contributed through the aviation sector`s supply chain,
and 1.310€ million contributed (induced effect – employment and output sup-
24
ported by the spending of those directly and indirectly employed in the aviation
sector) through the spending by the employees of the aviation sector and its
supply chain. The figure does not include the indirect sum of 1.223€ million from
catalytic benefits through tourism which could raise the overall contribution of
aviation sector to Finnish GDP to up to 7.053€ million being 3.9% of the GDP.
Catalytic effects are benefits associated with the aviation sector. These can in-
clude the activity supported by the spending of foreign visitors travelling to Fin-
land via air, and the level of trade directly enabled by the transportation of mer-
chandise. It is also estimated that aviation sector pays over 1.053€ million taxes
including income tax receipts from the employees, social security contributions
and corporation tax levied on profits. A further 19€ million is raised through
sales tax. According to Oxford Economics (2011) it is estimated that an addi-
tional 909€ million of government revenue is raised via the aviation sector`s
supply chain and another 686€ million through taxation of the activities support-
ed by the spending of employees of both the aviation sector and its supply
chain. (Oxford Economics 2011, p. 4.)
Table 2. Aviation`s contribution of outputs and jobs to Finland in 2010. (Adapted from Oxford Economics 2011, p. 14.)
The future growth of air traffic will depend on the economic growth and on the
technological advances that allow decreasing the cost of air travel. Also market
liberalization has greatly stimulated air traffic growth in the past and it is esti-
mated to continue. According to ICAO (2010) during the first steps of the liberal-
ization process the growth rates are the fastest and they stabilize to a standard

25
level after the market has absorbed the changes. For instance, in Europe the
development of aviation sector has been fast in 2004 and 2007 when European
Union got new member states from Eastern Europe, because the level of avia-
tion sector was lower in the new member states than in other member states in
the Europe. According to the interim report of Ministry of transport and commu-
nications (2013) it is estimated that the aviation sector will be growing globally
4.5–5% annually until 2030. Most of all the aviation will be growing in China and
other parts of Asia on average 6–7% annually. Annual growth in Europe and in
Northern-America will be around 2% until 2030 because of the current level of
aviation development in the areas. Today the main aviation area is within Eu-
rope and Northern America and with flights between them, but in 2030 the main
aviation area in the world will be in Asia and in the Pacifics. (Ministry of
transport and communications 2013c, p. 4; ICAO 2010, pp. 4–5.)
Figure 4. Passenger Traffic Forecast by ICAO Statistical Region according to revenue passenger kilometres (RPK) through to 2030. (Adapted from ICAO 2010, p. 5.)
Ministry of Employment and the Economy have estimated that the growth of
international tourism would bring over 7€ billion income to Finnish national
economy in 2020. Within this calculation the impact of aviation only in tourism
sector would increase the employment up to 121,000 persons and the share of

26
GDP to 3.9%. According to Lassi Hilska from Ministry of transport and commu-
nications (2013e), over half of the international trips over the Finnish borders
were done via Finnish airports. (Ministry of transport and communications
2013c, p. 5; Ministry of transport and communications 2013e, p. 5.)
The share of aviation within all the Finnish domestic trips is now 1%. The share
of aviation from all the domestic trips increases fast for the trips over 550 kilo-
metres. Within long distances the share of aviation is one of the third from all
the domestic trips. According to the future scenarios through 2025 by Finnish
Transport Safety Agency – Trafi (2012), the amount of domestic flights in Fin-
land will not increase, instead it may decrease. Still it is estimated that in the
future, regions may still have scheduled connection flight opportunities with Hel-
sinki-Vantaa but not between other regions. (Ministry of transport and commu-
nications 2013c, p. 7; Ministry of transport and communications 2013e, p. 5;
Trafi 2012, p. 41.)
Trips from Finland to abroad, especially to Central Europe increased in 2013
(Figure 5 and Table 3). According to Statistics Finland`s survey (2014a), Finns
made 7.8 million leisure trips abroad in 2013. The main leisure destinations for
Finnish residents were: 1. Estonia (most of all day and overnight cruises); 2.
Sweden (most of all day and overnight cruises); 3. Spain (increase of 21% to
Continental Spain). Other European destinations, which increased the amount
of Finnish passengers, were Russia, Germany, France, Turkey, and United
Kingdom. The number of domestic leisure trips with paid accommodation was
almost 6.6 million, from which one million trips were made to Lapland and
Kainuu. Also the amount of business trips within Finland and to abroad de-
creased from the previous years. According to Statistics Finland (2014a), lei-
sure trips of an average Finn in 2013 were: 1.5 domestic leisure trips with paid
accommodation; 1.3 trips abroad that include overnight stay in the country of
destination; and 0.5 same-day trips abroad or cruises to neighbouring areas.
Accommodation and tickets for leisure trips are mainly booked online. When
travelling abroad the package tours are more popular than in domestic travel-
ling, from leisure trips to abroad including at least one overnight stay in the des-
tination country, 33% were package tours. For the study all together 18,246

27
persons aged 15 to 84 permanently resident in Finland were interviewed. (Sta-
tistics Finland 2014a, pp. 1–3; 11–12.)
Figure 5 and Table 3. Finnish travel 2000 to 2013 and Finnish residents` favour-ite destination countries for leisure trips with overnight stay the destination in 2013 and 2012. (Adapted from Statistics Finland 2014a, pp. 1–2.)
Consumer prises for aviation tickets also influences the development of aviation
sector in Finland. According to the Statistics Finland (2012) the domestic flights
in Finland were in 2011 more expensive than the international flights (Table 4).
(Statistics Finland 2012, p. 50.)

28
Table 4. Consumer prices of flights in 1990–2011. (Adapted from Statistics Finland 2012, p. 50.)
Interim report of the air transport strategy (Ministry of transport and communica-
tions 2013c) presents four different scenarios for future development of the
Finnish airport network. According to the first scenario, Finavia would maintain
the Finnish airport network with 25 airports until 2030 and Mikkeli City Airport
and Seinäjoki would be part of the airport network as independent airports as
now, but the subsidies from the Finnish state would be cut according to the EU
legislation. Second scenario suggests that airport network would be given up
and Helsinki-Vantaa would continue as an independent airport. In this model
regional airports could lower their airport fares, which would bring more compet-
itors to Mikkeli City Airport. Today the air carriers can get discount from Finavia
for new routes from the landing fees (first year -70%, second and third year -
50%) and in the long-distance flight (over 5 000 kilometres routes) on fourth and
fifth year also -50%. Also discount from passenger fees can be granted -70%
within the first year and on the regional airports (not Helsinki-Vantaa) -50% on
also the second year. Still it is estimated that some of the regional airports could
not survive without the contribution from the Finavia airport network or from the
state, municipality or region. Third and Forth scenarios are about different kinds
of airport network models where some of the airports were moved away from
Finavia airport network. These scenarios will be decided after evaluating the
economical, social, transportation, environmental and security impacts. (Ministry
of transport and communications 2013c, pp. 18–21.)
The air transport strategy preparation is criticised for concentrating too much on
the needs of Helsinki-Vantaa airport and Finnish air carrier Finnair, of which the
Finnish state owns 55.81% (Finnair 2014). According to aviation journalist Jyri
Raivio`s opinion (2013), the interim report can be understood like this: Helsinki-
29
Vantaa will be independent, but a Finavia-owned airport with 23 million annual
passengers and these passengers are brought to Helsinki-Vantaa from Oulu,
Rovaniemi, Vaasa, Kuopio and Maarianhamina by scheduled flights, one in the
morning, second in the afternoon and third in the late night. For tourism purpos-
es will be kept open Kittilä, Ivalo, Kuusamo and Kajaani, but only in the high
season. These small airports are kept open by the profit of Helsinki-Vantaa,
from which is paid dividends to the government and further as subsidies to the
airports. Other airports have to survive on their own. Tampere-Pirkkala has mili-
tary aviation; others do not have even that. Most of the rest of the airports, 14
airports belonging to Finavia network and Mikkeli City Airport and Seinäjoki, will
be growing grass by 2030. Not to mention the economic effects on the national
economy or the loss of income from tourism, which is crucial for tourism regions
in Finland. According to the mayor of the Enontekiö municipality Mikko Kärnä
(2014), direct tourism income for the municipality of Enontekiö is 22€ million
annually and it will be lost without direct flight connection to the region. (Raivio
2013; Kärnä 2014.)

30
3 AIRPORT PERFORMANCE
Systematic monitoring and comparing of airport economic performance has
been practised more widely from 1980`s. Until that airports weren`t under com-
mercial or business pressure and benchmarking as study techniques within
public sector was suffering the lack of experience. It was difficult to make mean-
ingful comparisons because of varying involvement in airport activities and dif-
ferent accounting policies. With airport commercialisation and privatisation has
come a marked interest in performance comparisons and benchmarking. As
airports have become more commercially oriented, they have been keen to
identify the strong performers in the industry and adopt what are seen as best
practises. (Graham 2014, p. 85.)
Investors and bankers, who are traditionally much more used to using financial
ratios and other benchmarking techniques, are interested to identify possible
business opportunities and to ensure their chosen airport investment continues
to perform well. Airlines, which are now operating in a much more cost-
conscious and competitive environment, have an interest in identifying those
airports that are being inefficiently managed, because they are lobbying against
increases in user charges. Economic regulators of privatised or autonomously
managed airports also have good reason to monitor airport performance to en-
sure users are being charged fairly and that the airports are run efficiently. Local
communities may also be interested to ensure that the airport is being run in an
efficient manner so that they can benefit fully from the economic benefits, such
as tourism and inward investment, that the airport can bring. (Graham 2014, p.
85.)
In this chapter, the theoretical framework of the study is introduced and the rea-
sons behind choosing benchmarking as technique for analysing the collected
data is justified. Best Practice Benchmarking as a tool is introduced as well as
performance indicators for airports. Justifications for City of Mikkeli why Best
Practice Benchmarking can be used when analysing the performance of an air-
port using input–output ratios for improving the performance of Mikkeli City air-
port are presented.
31
3.1 Performance management techniques for airports
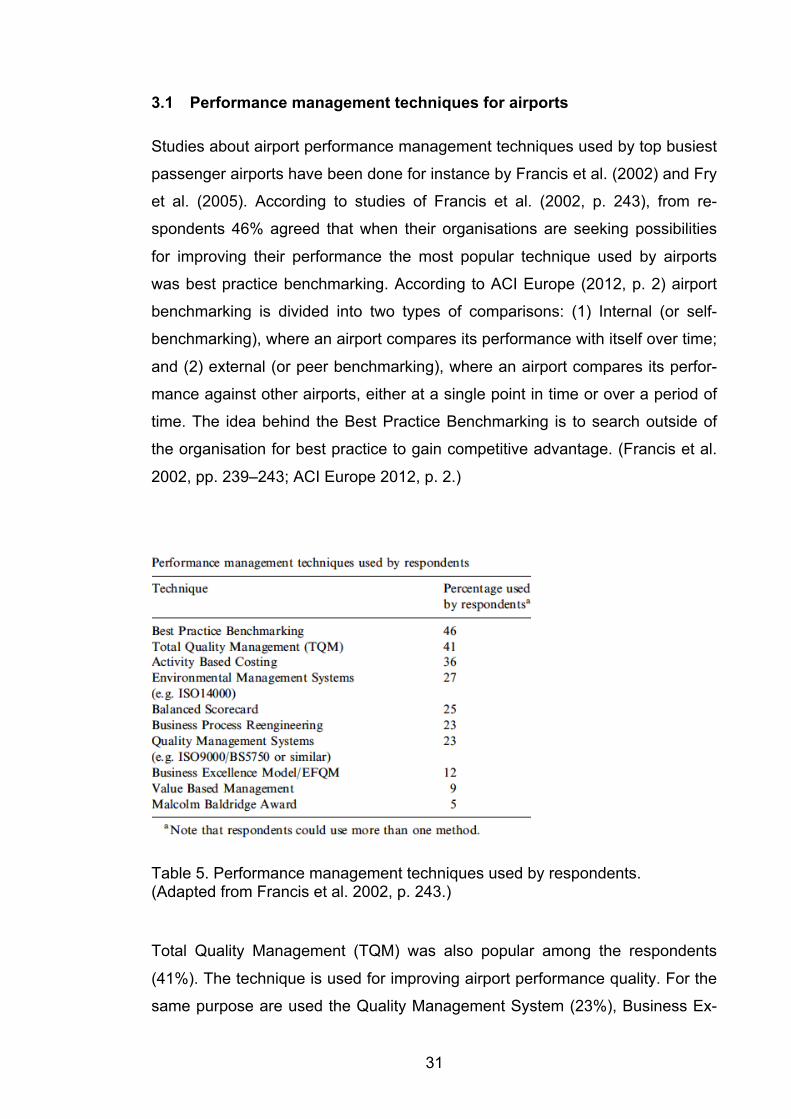
Studies about airport performance management techniques used by top busiest
passenger airports have been done for instance by Francis et al. (2002) and Fry
et al. (2005). According to studies of Francis et al. (2002, p. 243), from re-
spondents 46% agreed that when their organisations are seeking possibilities
for improving their performance the most popular technique used by airports
was best practice benchmarking. According to ACI Europe (2012, p. 2) airport
benchmarking is divided into two types of comparisons: (1) Internal (or self-
benchmarking), where an airport compares its performance with itself over time;
and (2) external (or peer benchmarking), where an airport compares its perfor-
mance against other airports, either at a single point in time or over a period of
time. The idea behind the Best Practice Benchmarking is to search outside of
the organisation for best practice to gain competitive advantage. (Francis et al.
2002, pp. 239–243; ACI Europe 2012, p. 2.)
Table 5. Performance management techniques used by respondents. (Adapted from Francis et al. 2002, p. 243.)
Total Quality Management (TQM) was also popular among the respondents
(41%). The technique is used for improving airport performance quality. For the
same purpose are used the Quality Management System (23%), Business Ex-

32
cellence Model (12%) and Malcolm Baldridge Award (5%). Activity Based Cost-
ing (36%) is used for improving and understanding the cost structure and re-
source utilisation of an airport. Value Based Management tries to measure fi-
nancial performance in terms of the creation value for shareholders (9%). Bal-
anced Scorecard (%) tries to create a balance between a range of financial and
non-financial performance criteria. According to the respondents 95% had used
data collection surveys, 25% interviews and 20% consultants. (Francis et al.
2002, p. 243.)
The response rate was 32% from 195 questionnaires from the top 200 busiest
passenger airports as ranked by ACI in terms of total passengers for 1999. Ge-
ographically, 48% were from North America, 38% from Europe, 5% from Pacific,
5% from Asia, 2% from Latin America/Caribbean and 2% from Africa. From the-
se airports 29% were handling 1–4 million passengers, 24% from 5 to 9 million
passengers, 23% from 10 to 19 million passengers and 24% from 20 and above
million passengers. 67% of the airports were publicly owned, 19% privately and
14% Part privately–part publicly owned. (Francis et al. 2002, pp. 242–243.)
According to the survey of Francis et al. (2002, pp. 243–244) the focus on
benchmarking was with similar airports, 72% of respondents reported they were
using benchmarking, 46% that they were involved specifically with Best Practice
Benchmarking and from these respondents 97% compared themselves to other
airports. 42% of respondents compared service qualitative data and 50% of re-
spondents compared financial data. According to Francis et al. (2002, pp. 244–
245), in the future the respondents may be able to gain more benefits in terms
of performance improvement from benchmarking if they place more emphasis
on learning from the processes that are generating the relative measures of per-
formance. Also further benefits from benchmarking may be realised if managers
consider looking for exemplar practices of the processes they are trying to
manage and improve at dissimilar airports. According to Francis et al. (2002, p.
245) looking at the management issues from this wider perspective may be
more risky but can give greater benefits, benchmarking has the potential to play
an increasingly important role in performance management and improvement at
airports given the pressures coming from changing ownership patterns, in-
33
creased commercial business focus, regulation, rapid passenger growth, global-
isation of airport ownership, increased concern for the natural environment and
technical innovation. Performance improvement can create competitive ad-
vantage and can offer potential to improve the efficiency and effectiveness of
airport management across the range of challenges. (Francis et al. 2002, pp.
244–246.)
3.2 Performance Indicators for airports
The airport industry is very diverse and heterogeneous with a high degree of
quality differentiation, different ownership and regulatory structures, different
mixes of services and operating characteristics, as well as external constraints
such as location and environmental factors. Because of these reasons, measur-
ing and comparing the performance of airports is difficult. The task is even more
challenging when the best practice benchmarking is done between successful
international airport as Stockholm Skavsta airport and small Finnish regional
airport, Mikkeli City airport, which is just at the start of its development path to
make decisions about the future of the airport. It is important to develop perfor-
mance measures, which will provide meaningful comparison between the study
objects. According to Oum et al. (2003, p. 286), there is no accepted industry
practice for measuring and comparing airport performance. (Oum et al. 2003, p.
286.)
The aviation institutions and organizations such as ACI Europe – European re-
gion of Airports Council International (ACI Europe 2014), ICAO – International
Civil Aviation Organisation (ICAO 2013; 2012), and American Federal Aviaton
Administration (through ACRP – Airport Cooperative Research Programme)
have provided their own variations on the key performance areas and indica-
tors. ACRP (2011) has a rather technical approach and focuses on the imple-
mentation of a performance management system while ICAO (2013; 2012) has
more strategical focus, and the most important of them is ACI Europe – Euro-
pean Region of Airports Council International (ACI Europe 2014), with the wide-
ly used key performance areas and indicators within airports worldwide. ACI is
the worldwide professional association of airport operators. ACI Europe repre-
sents over 450 airports in 44 European countries. This study objects Mikkeli

34
City airport and Stockholm Skavsta are not members of ACI Europe. In 2012,
member airports of ACI Europe handled 90% of commercial air traffic in Europe,
over 1.6 billion passengers, 16.7 million tonnes of freight and more than 16 mil-
lion aircraft movements. ACI Europe (2014) has collected data about KPI`s –
Key Performance Indicators, from its 36 active members representing 106 air-
ports since 2003. In the next table (Table 6) is presented the Key Performance
Areas (KPA) and Key Performance Indicators (KPI) according to the ACI Eu-
rope. (ACI Europe 2014; ACI Europe 2012, pp. 9–10.)
35
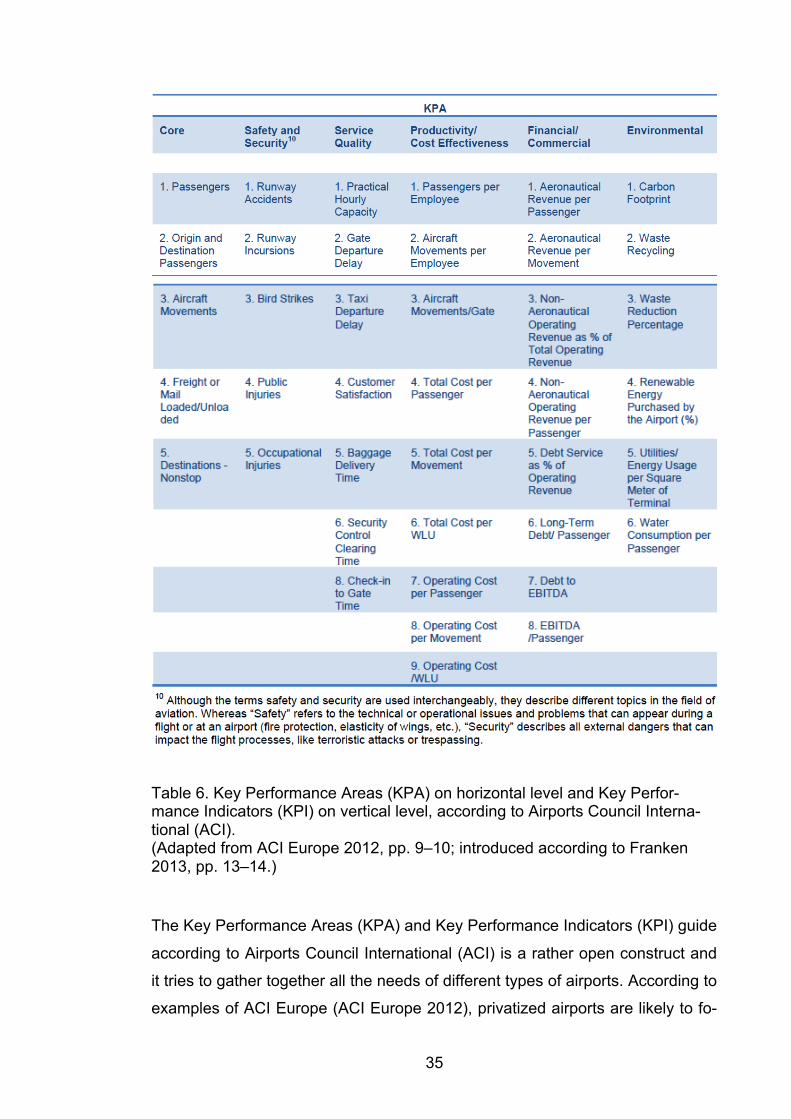
Table 6. Key Performance Areas (KPA) on horizontal level and Key Perfor-mance Indicators (KPI) on vertical level, according to Airports Council Interna-tional (ACI). (Adapted from ACI Europe 2012, pp. 9–10; introduced according to Franken 2013, pp. 13–14.)
The Key Performance Areas (KPA) and Key Performance Indicators (KPI) guide
according to Airports Council International (ACI) is a rather open construct and
it tries to gather together all the needs of different types of airports. According to
examples of ACI Europe (ACI Europe 2012), privatized airports are likely to fo-

36
cus on different financial Performance Indicators than non-profit government-
owned airports. Larger airports are likely to focus on different Performance Indi-
cators than smaller airports. Airports with large developable land areas are like-
ly to focus on different Performance Indicators than tightly constrained airports
in large urban areas. Even among airports with similar characteristics, manag-
ers will have different views regarding which Performance Indicators are most
important, and how many Performance Indicators the airport should track. A
smaller set of closely monitored Performance Indicators is likely to be a more
effective performance management tool than a larger set of Performance Indi-
cators that attracts less focus. According to ACI Europe (2012), over time, the
set of Performance Indicators of most importance to the individual airport will
change as new issues arise. A key example of this is the currently evolving area
of Environmental Performance Indicators, which until recently was not a key
performance management area for many airports. (ACI Europe 2012, pp. 1–2.)
On the European Union level, there are no common metrics and indicators used
for measuring and comparing airport performance. Mobility and Transport De-
partment (DG – Directorate-General) under the European Commission is the
body responsible for airport issues on European Union level. According to Eu-
ropean Commission DG Mobility and Transport (2012), air transport mode is
strategically important sector, with its contribution to the EU`s overall economy
and employment: aviation supports 5.1 million jobs and contributes 365€ billion,
or 2.4% to European GDP. Despite the current economic crisis, global air
transport over the long term is expected to grow by around 5% annually until
2030. Almost 800 million passengers travel each year by air from, to and within
the European Union and has caused the situation that if this present trend con-
tinues, nineteen of European airports will be unable to accommodate any more
flights by 2030. The goal of European Commission in DG Mobility and Transport
in airport issues is with legislative proposals for European Parliament and the
Council in order to become Community Law to help solving capacity shortage at
Europe`s airports and improve the quality of services offered to passengers.
(European Commission 2012.)
37
European Commission does not have performance indicators for airports, but it
is a member of Eurocontrol, an organization which with non-EU member states
aims towards safe, efficient and environmentally-friendly air traffic operations
across the European region. Eurocontrol was founded in 1960, and it works
closely with member states, air navigation service providers (ANSPs), civil and
military airspace users, airports, the aerospace industry, professional organisa-
tions, intergovernmental organisations and the European Institutions. Eurocon-
trol has defined Key Performance Areas (KPAs), and associated performance
indicators to measure the performance of Air Traffic Management. The most
used from KPIs by Eurocontrol are the indicators for comparing and measuring
delays. In their annual NM Network Operations Report 2013 – ANNEX III – Air-
ports (Eurocontrol 2013) the airport performance is self-benchmarked with pre-
vious years, using indicators as yearly ATFM arrival delay by cause of delay
(Aerodrom Capacity, ATC Capacity, Staffing, Weather, Environment, Other),
arrival punctuality, departure punctuality. This might be the cause for the need
for Mobility and Transport Department (DG – Directorate-General) under the
European Commission to understand the capacity of European airspace and
the reasons for delays when planning the use of airspace. (Eurocon-
trol 1999, pp. 41–42; Eurocontrol 2013.)
Within the academic literature many studies about airport performance indica-
tors can be found. Among these are Graham and Vogel (Graham 2014, p. 87;
Vogel 2004, 24–25), who have studied the airport performance indicators indi-
vidually and together for many years (Graham 2005; Vogel 2004; Vogel, H.-
A., Graham, A. 2010). They have defined input – output performance indicators
in measuring airport performance of an airport which can assess different as-
pects of its performance and identify where its strengths and weaknesses lie.
These indicators according to Graham and Vogel (Graham 2014, p. 87; Vogel
2004, 24–25) can be grouped forward into certain categories, such as cost effi-
ciency, labour and capital productivity, revenue generation, and commercial
performance and profitability (Table 7). In addition to these input – output ratios,
a few other key measures, for instance share of revenue from aeronautical
sources, can give further insights into comparative performance. In the next pic-
ture is presented the latest version of the key performance indicators (KPIs)

38
according to Graham (2014, p. 87), which are typically used at senior manage-
ment level. Each KPI has an important target that links to the airport achieving
its strategic and operational goals. The WLU – work load unit, originated from
the airline industry and it is a standard gauge of output combining both passen-
gers and freight. One WLU means one passenger or 100 kg of freight. (Graham
2014, p. 87; Vogel 2004, 24–25.)
Table 7. Performance indicators commonly used to assess economic perfor-mance. (Adapted from Graham 2014, p. 88.)
The economic performance measures commonly used to assess economic per-
formance are only partial measures of performance giving an indication of per-
formance according to the chosen inputs and outputs. They need only limited
data, if available, are easy to count, and simple to understand. They can high-
light strengths and weaknesses, but they cannot give the “big picture” about the
performance of an airport. They give only partial diagnosis of the current situa-
tion of an airport and can easily mislead if only selected indicators are chosen.

39
To be able to cover all areas of an airport performance many measures are
needed. It is also difficult to take into account the differences in the prices of the
input, for instance the costs for labour or choosing an output measure, which
covers a number of outputs. (Graham 2014, p. 91.)
The move towards privatisation and the new commercial emphasis at European
airports has led to new performance measures being introduced to reflect the
changing management goals. New measures, which are presented by Hum-
phreys et al. (2002, p. 80), can be divided into three categories: financial
measures to monitor commercial performance, measures to meet the require-
ments of government regulators, and environmental measures. Commercial
pressure from ownership forms that demand a degree of financial accountability
have led many airports to become more focussed on measuring operational and
business performance within the airport company. Operational performance
measures that relate passenger level of service to international standards are
still widely used. According to Humphreys et al. (2002, p. 80) the major weak-
ness with this type of measure is that they are too crude. The level of service
delivered is contingent upon various passenger characteristics and a certain
design may deliver totally different levels of service for passengers depending
on the purpose and nature of their journey. The business passengers` view of a
particular level of service can be different when comparing passengers´ view
with a passenger travelling on a package holiday. (Humphreys et. al. 2002, pp.
80–81.)
40
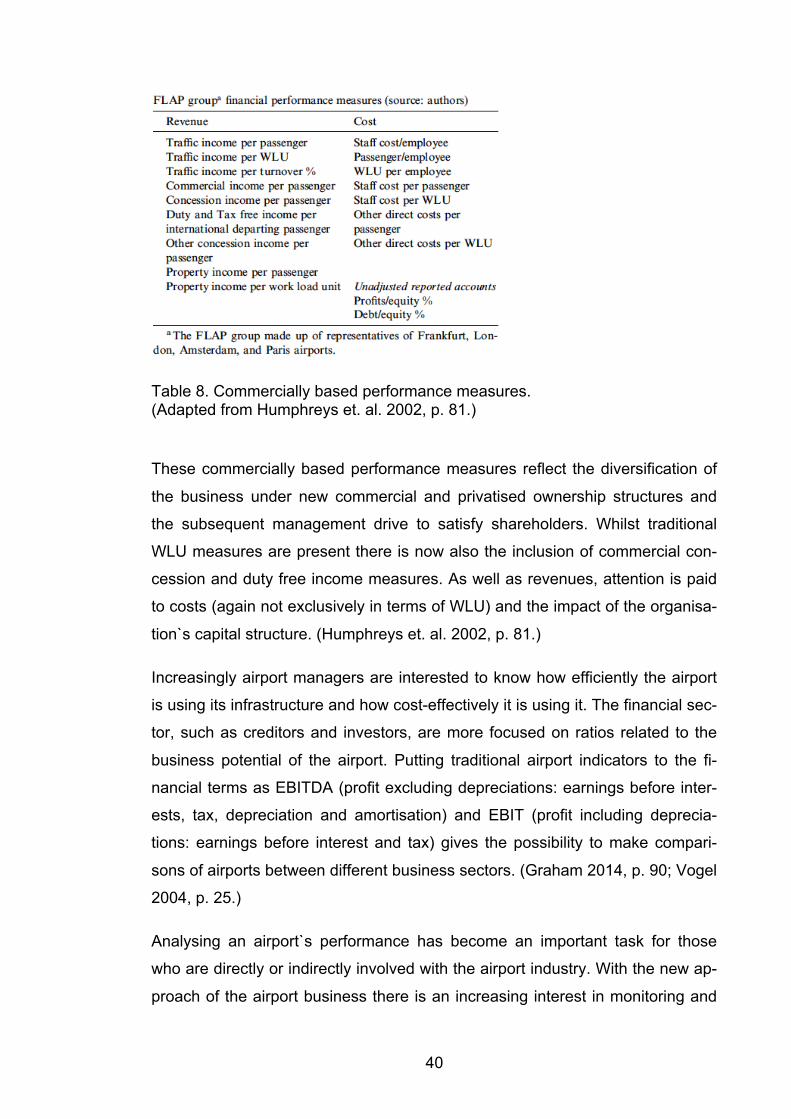
Table 8. Commercially based performance measures. (Adapted from Humphreys et. al. 2002, p. 81.)
These commercially based performance measures reflect the diversification of
the business under new commercial and privatised ownership structures and
the subsequent management drive to satisfy shareholders. Whilst traditional
WLU measures are present there is now also the inclusion of commercial con-
cession and duty free income measures. As well as revenues, attention is paid
to costs (again not exclusively in terms of WLU) and the impact of the organisa-
tion`s capital structure. (Humphreys et. al. 2002, p. 81.)
Increasingly airport managers are interested to know how efficiently the airport
is using its infrastructure and how cost-effectively it is using it. The financial sec-
tor, such as creditors and investors, are more focused on ratios related to the
business potential of the airport. Putting traditional airport indicators to the fi-
nancial terms as EBITDA (profit excluding depreciations: earnings before inter-
ests, tax, depreciation and amortisation) and EBIT (profit including deprecia-
tions: earnings before interest and tax) gives the possibility to make compari-
sons of airports between different business sectors. (Graham 2014, p. 90; Vogel
2004, p. 25.)
Analysing an airport`s performance has become an important task for those
who are directly or indirectly involved with the airport industry. With the new ap-
proach of the airport business there is an increasing interest in monitoring and
41
comparing the performance of individual airports. In simple terms, airport per-
formance measures analyse the relationship between inputs and outputs at an
airport. This relationship can be expressed in both financial and physical terms.
As in any other business, labour and capital are the major inputs of the airport
system. The simplest physical measure of the labour input is the total number of
employees. Any part-time and temporary staff should be converted to full-time
equivalents. To be able to capture the effect of the cost of labour as well as
productivity per head, the labour input can also be measured in financial terms:
employee wages and salaries. (Graham 2014, p. 86; Vogel 2004, pp. 24–25.)
Measure of capital input is much more difficult. In physical terms, capital input is
measured by the production capability or capacity of the system. At an airport
this cannot be assessed by one measure. The capacity of the runways, termi-
nals, gates and so on, all have to be considered. Capacity can be measured on
an hourly, daily or annual basis. Depreciation or asset values can be used to
measure the financial capital input. According to Graham (Graham 2014, p. 86)
these will, however, reflect the accounting policies of the specific airport and
may not always be closely related to its economic production capability. (Gra-
ham 2014, p. 86; Vogel 2004, pp. 24–25.)
The financial measurement of output can be measured by considering the total
revenues generated. Output of an airport can be assessed in three ways: in
terms of quantities of aircraft, passengers or freight. According to the Graham
(Graham 2014, p. 87) these measures do not cover all aspects of an airport, for
instance airports` role as a retail facility, but they do capture the key outputs.
The use of aircraft movements is not ideal; as such measures will not make dif-
ference between different sizes and different types of aircraft. Airports can han-
dle both passengers and freight, and this suggests the use of an output meas-
ure that combines both of them, such as the WLU (work load unit). According to
Graham (Graham 2014, p. 87) some have argued that the focus should be on
passenger numbers, as freight handling at airports is very much an airline activi-
ty and has little impact on an airport`s economic performance. (Graham 2014,
p. 87; Vogel 2004, pp. 24–25.)

42
The WLU (work load unit) is commonly used when measuring the performance
of an airport. Still there are few problems when using it. WLU links two outputs
together, but the same weight of passengers and freight doesn`t involve using
the same resources. According to Graham (Graham 2014, p. 87) WLU formula
should therefore reflect the relative importance or value of the different outputs
and perhaps should include an aircraft movement element. Costs or employee
numbers associated with the different outputs theoretically could be used to de-
termine the scaling factor, but there is problem of joint costs or joint tasks un-
dertaken by the staff. An alternative scaling parameter could according to Gra-
ham (Graham 2014, p. 87) be the relative prices of the outputs, put this as-
sumes a close relationship between price and cost which is not usually the case
at airports because of market imperfections, regulation and government inter-
ference and cross-subsidies between different traffic. There is the additional
problem that there are even different costs and revenues associated with differ-
ent passenger types, the most notable examples being international and do-
mestic passengers or terminal and transfer passengers. (Graham 2014, p. 87.)
Transport movement is taken into account in LeighFishers (via Graham 2014, p.
87) annual global benchmarking and it uses a different measure of output than
work load unit (WLU), the airport throughput unit (ATU). The airport throughput
unit is also suggested in Transport Research Laboratory (via Graham 2005, p.
6), which combines output measures of WLUs per ATM (air transport move-
ment). It is defined as: ATU = (passengers + 10) x (freight tonnes + 100) x ATM.
In this model the WLU relationship of 1:10 between passengers and freight is
kept the same, but unlike WLU, this model includes an aircraft movement com-
ponent. According to LeighFisher, the value of 100 was derived by looking at
past studies and determining that handling one air transport movement (ATM)
required approximately the same effort as handling 100 WLU. (Graham 2014, p.
87.)

43
4 AIRPORT PRESENTATION
Case companies studied in this thesis are the Mikkeli City airport in Mikkeli, Fin-
land by comparing its performance with the well-performed Stockholm Skavsta
airport in Sweden. In this chapter these airports are introduced and their histori-
cal backgrounds are opened.
4.1 General information
Stockholm Skavsta airport and Mikkeli City airport have many differences but
also some similarities. In the next table are presented general information about
these airports.
General information Mikkeli City airport Stockholm
Skavsta airport
ICAO-code EFMI ESKN
IATA-code MIK NYO
Address
Mikkelin lentoasema Lentokentänkatu 4–6
FI–50150 Mikkeli Finland
Stockholm Skavsta Flygplats AB
Box 44 SE–611 22 Nyköping
Sweden
Phone +358 (0) 15 366 427 +46(0) 155 28 04 00 (Switchboard)
Fax +358 (0) 15 151 674 +46(0) 155 28 04 49
E-mail [email protected]
[email protected] (General Airport information)
Web http://www.mikkeli.fi/palvelut/ mikkelin-lentoasema www.skavsta.se
Airport Location 230 km northeast
of Helsinki City 4 km west of Mikkeli City
100 km southwest of Stockholm City 7 km northwest of Nyköping City
Amount of inhabitants at the region in 2013
Mikkeli 54 614, 19th biggest City in Finland
Nyköping 53 000 60th biggest municipality
in Sweden
Other interesting Highest number of free-time residences in 2013 – 10 195
in whole Finland
1 000 enterprises offering tourism services, 15% from passengers are
staying at the region
Catchment area
150 km radius covers over 500,000 people, which is 9,2% of the population
100 km radius covers 2.4 million people, 27% of the
population
Started operations 1930`s, during the WW II in military use, today Army
1930`s, opened for civil aviation in 1984
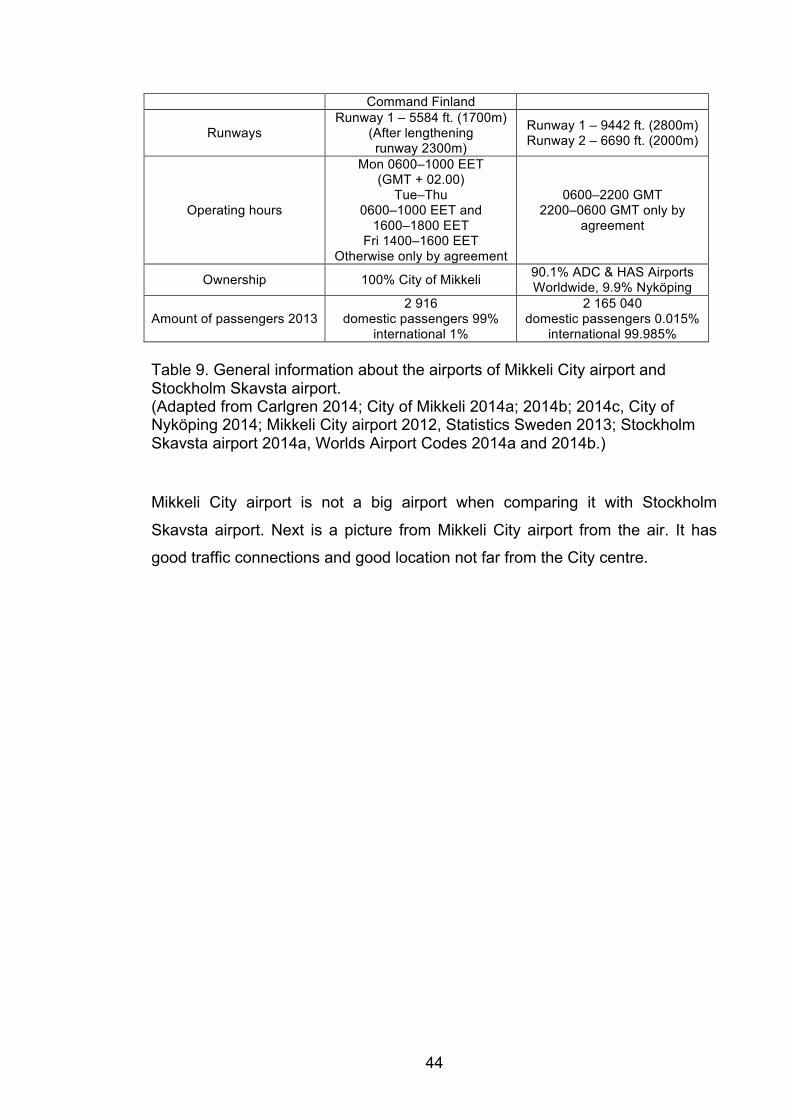
44
Command Finland
Runways Runway 1 – 5584 ft. (1700m)
(After lengthening runway 2300m)
Runway 1 – 9442 ft. (2800m) Runway 2 – 6690 ft. (2000m)
Operating hours
Mon 0600–1000 EET (GMT + 02.00)
Tue–Thu 0600–1000 EET and
1600–1800 EET Fri 1400–1600 EET
Otherwise only by agreement
0600–2200 GMT 2200–0600 GMT only by
agreement
Ownership 100% City of Mikkeli 90.1% ADC & HAS Airports Worldwide, 9.9% Nyköping
Amount of passengers 2013 2 916
domestic passengers 99% international 1%
2 165 040 domestic passengers 0.015%
international 99.985% Table 9. General information about the airports of Mikkeli City airport and Stockholm Skavsta airport. (Adapted from Carlgren 2014; City of Mikkeli 2014a; 2014b; 2014c, City of Nyköping 2014; Mikkeli City airport 2012, Statistics Sweden 2013; Stockholm Skavsta airport 2014a, Worlds Airport Codes 2014a and 2014b.)
Mikkeli City airport is not a big airport when comparing it with Stockholm
Skavsta airport. Next is a picture from Mikkeli City airport from the air. It has
good traffic connections and good location not far from the City centre.

45
Picture 2. Mikkeli City airport from the air. Picture by Sakari Silvennoinen. (Paananen 2014a.)
Stockholm Skavsta is much bigger airport than Mikkeli City airport with it`s big
passenger terminal with six gates and two runways. Next is a picture from
Stockholm Skavsta airport from the air.

46
Picture 3. Stockholm Skavsta airport from the air. Screen shot from Google maps on 4th of March 2014.
Stockholm Skavsta airport was in 2013 the fourth largest airport in Sweden with
its 2.2 million annual passengers, from which 2.2 million were international and
324 were domestic. Ownership of the airport is public private partnership with
ownership of 90.1% ADC & HAS Airports Worldwide and 9.9% of the munici-
pality of Nyköping (Stockholm Skavsta airport 2014a.). According to Swedish
transport styrelsen (Swedish Transport Agency 2014a), bigger airports than
Stockholm Skavsta in Sweden in 2013 according to the amount of passengers
were Stockholm Arlanda 20.7 million passengers, from which 15.8 million inter-
national and 4.9 million domestic, Göteborg Landvetter 5 million passengers
from which 3.6 million international and 1.4 domestic, and Stockholm Bromma
2.3 million passengers from which 254 thousand international and 2 million do-
mestic. (Swedish Transport Agency 2014a.)
In Sweden there are 49 airports which are approved by Swedish transport
agency for aircraft and helicopter operations. At these airports can be found air
navigation support. Also four airports without air navigation support are also
47
approved by Swedish transport agency, but they are in use only in good weath-
er conditions. Airports in Sweden are mainly owned and run by Swedavia AB,
region, municipality or enterprise. Swedish transport agency is responsible for
controlling of all the Swedish airports to be sure of the high level of air security.
(Swedish Transport Agency 2014b.)
In Finland, 25 airports belong to the Finavia, public limited company owned by
the Finnish State, run Finnish airport network (Finavia 2014a). Besides them in
Finland can be found two privately owned airports in Seinäjoki and Mikkeli.
Seinäjoki airport is run by Rengonharju Foundation, which is owned by munici-
palities of Seinäjoki, Ilmajoki, Kurikka, Jalasjärvi and Lapua. Passengers at the
Seinäjoki airport were in 2012, 6 325 passengers, and in 2011, 39 381 passen-
gers. The airport has domestic flights in winter to and from Seinäjoki – Kittilä,
charter holiday flights from Seinäjoki to holiday destinations, private charter
flights, first aid flights and leisure time aviation. (City of Seinäjoki 2013.)
Mikkeli City airport is 100% owned by the Municipality of Mikkeli. Mikkeli City
airport with its 1658 annual passengers in 2012 is not the smallest airport in
Finland (Mikkeli City airport 2012). According to Finavia (2012), smaller airports
than Mikkeli in 2012 were: Halli Kuorevesi 0 passengers, Helsinki-Malmi 0,
Kauhava 1 622 and Utti 34 passengers. Passengers of the military flights are
not counted. These airports do not have scheduled flights but they are in active
authority, pilot training and leisure time aviation use. Passengers of Mikkeli City
airport consist mainly of flights of private charter flights, pilot training flights, first
aid flights and leisure time aviation. Flight passengers of Finnish Air Force and
Eastern Command Headquarters’ South Savo Regional Office connection
flights are not counted. The airport does not have domestic or international
scheduled passenger traffic at this time. (City of Mikkeli 2014a; Mikkeli City air-
port 2012.)
Mikkeli City airport has a goal to reach 500,000 annual passengers within 10
years according to the Mikkeli City airport development project run by Juha-
Pekka Paananen (Paananen 2014a). With this amount of passengers it would
be in third place compared to the passengers statistics in 2013 (Finavia 2013),
after Helsinki-Vantaa 15.3 million, from which 12.9 international and 2.4 domes-
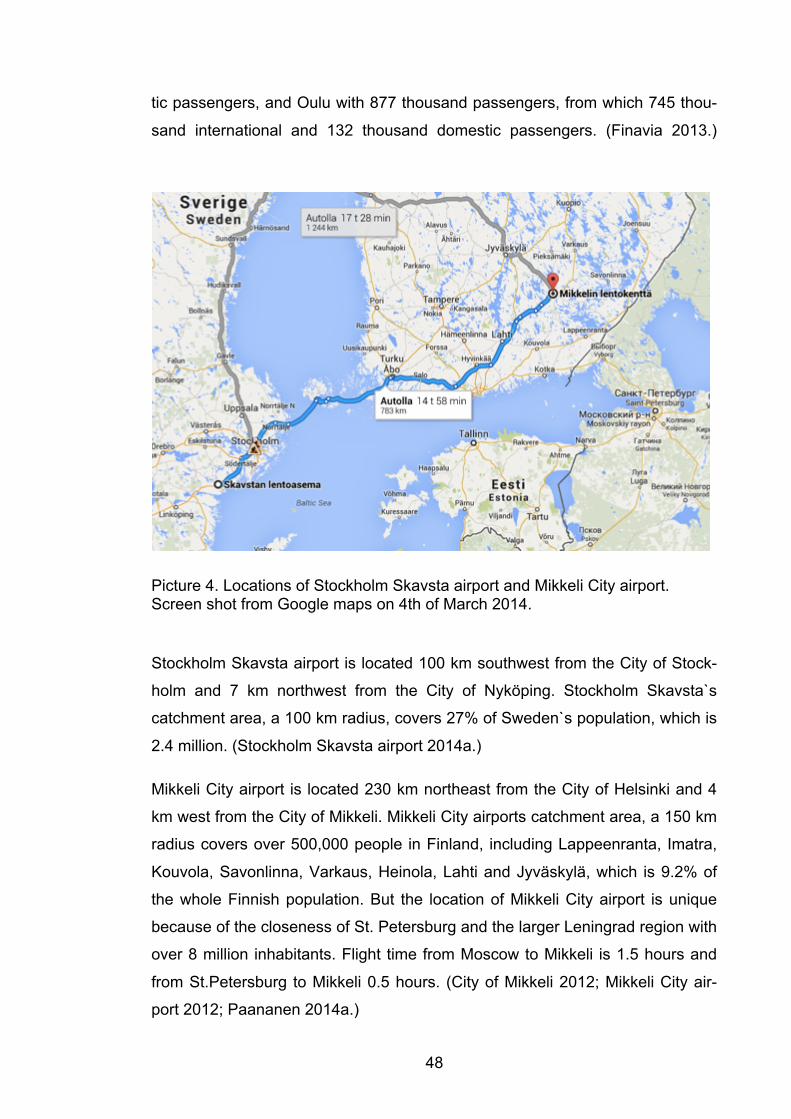
48
tic passengers, and Oulu with 877 thousand passengers, from which 745 thou-
sand international and 132 thousand domestic passengers. (Finavia 2013.)
Picture 4. Locations of Stockholm Skavsta airport and Mikkeli City airport. Screen shot from Google maps on 4th of March 2014.
Stockholm Skavsta airport is located 100 km southwest from the City of Stock-
holm and 7 km northwest from the City of Nyköping. Stockholm Skavsta`s
catchment area, a 100 km radius, covers 27% of Sweden`s population, which is
2.4 million. (Stockholm Skavsta airport 2014a.)
Mikkeli City airport is located 230 km northeast from the City of Helsinki and 4
km west from the City of Mikkeli. Mikkeli City airports catchment area, a 150 km
radius covers over 500,000 people in Finland, including Lappeenranta, Imatra,
Kouvola, Savonlinna, Varkaus, Heinola, Lahti and Jyväskylä, which is 9.2% of
the whole Finnish population. But the location of Mikkeli City airport is unique
because of the closeness of St. Petersburg and the larger Leningrad region with
over 8 million inhabitants. Flight time from Moscow to Mikkeli is 1.5 hours and
from St.Petersburg to Mikkeli 0.5 hours. (City of Mikkeli 2012; Mikkeli City air-
port 2012; Paananen 2014a.)
49
4.2 History in brief
The history of Stockholm Skavsta airport started in the 1930`s, when a minor
airfield was built near the farm called Skavsta within a few kilometres of the City
of Nyköping. The airfield served as a war airfield to an air force division. 1941
the air wing F11 was stationed in Skavsta to survey the Swedish borders during
the World War II. During the following 20 years, F11 was the largest air wing in
Sweden, but in 1974 the Swedish government decided about termination and
six years later it was shut down. (Stockholm Skavsta airport 2014b.)
In 1984 the airport was opened for civil aviation by the municipalities of Nykö-
ping and Oxelösund. On 23rd of September 1984 the Nyköpings/Oxelösunds
Flygplats AB was inaugurated. These municipalities bought the airport from the
Swedish Army for 1 Swedish Crown. “The price was cheap but maintaining the
airport took a couple of million Swedish Crowns per year”, confirmed the Munic-
ipality Director Eric Carlgren from the Municipality of Nyköping. Annual passen-
gers the airport gained 50–100 000. In 1990`s the airport name was changed to
Stockholm Skavsta Airport. In 1997 the cooperation with Ryanair started within
the first route out of Great Britain Skavsta–London. In 1998 Nyköping municipal-
ity sold shares of 90.1% of the airport to the British TBI becoming the first pri-
vately owned airport in Sweden. According to the Municipality Director Eric
Carlgren: “the municipality wanted to have shares in the airport company be-
cause the airport was and is a big part of the development of the City of the
Nyköping”. It was good also for TBI, because of the local knowledge received
from the City to the airport company. (Carlgren 2014; Kulovuori 2014a; Stock-
holm Skavsta airport 2014b.)
In 2003 Ryanair located their Scandinavian base at Skavsta airport with three
aircrafts and six new routes. In 2004 the cooperation with Wizz Air began with
two routes and Ryanair placed the fourth aircraft to Skavsta airport. In 2005 the
Spanish Infrastructure group ACDL acquired all the TBI airports. In 2006 tour
operators Fritidsresor (TUI) and Ving started their charter holiday flights from
Skavsta airport. In 2007 Ryanair expanded its base to six aircraft and 30 desti-
nations and the Skavsta airport became the third largest airport in Sweden. Af-
ter the renegotiation with Ryanair the sixth aircraft was removed from Skavsta

50
airport. In 2013 the US-based ADC & HAS Airports Worldwide completed the
acquisition of part of the TBI airports, including Stockholm Skavsta. Today the
Skavsta airport is the fourth largest airport in Sweden with over 30 Ryanair
routes and seven Wizz Air routes. (Kulovuori 2014a; Stockholm Skavsta airport
2014c.)
The history of Mikkeli City airport is quite similar with the history of Stockholm
Skavsta airport. Mikkeli City airport was also built in the 1930´s and it was ready
for the use in 1937. The initiative for building the airport in Mikkeli came from
the Finnish Air defence union. In the early years the airport was used in leisure
time aviation. During the World War II the airport was occupied mainly by Finn-
ish Air Forces and even today the airport is used for Eastern Command Head-
quarters’ of South Savo Mikkeli Office connections` flights. The airport was the
base for Air Squadron 12 with its Closter Gladiators, and air bombing squadron
44 with its Blenheim aircrafts. Also fighter planes, four Brewsters, were located
in Mikkeli City airport. After the war the airport has been in active leisure time
aviation use. (City of Mikkeli 2012.)
At the Mikkeli City airport there have been several attempts to run scheduled
flights to Helsinki. First attempt was in 1951–1952 by Savon Lentolinjat Ltd with
two planes. Second was 1959–1960 by Flight Service with one plane. Third at-
tempt was 1970–1972 with by Sir – Air Ltd with two planes. Fourth attempt was
in 1973 by Finnair, owned by the Finnish state. In the 1970`s–1980`s the airport
was in active leisure time and pilot training aviation use. (City of Mikkeli 2012.)
In 1980`s postal flights were operated from Helsinki to Mikkeli, first by Finnavia-
tion Ltd, but they were transferred to land transportation in 1997. Also other
freight was carried to Mikkeli City airport from Helsinki by Siimes Aviation Ltd
and Finnair and from 1986 Finnaviation Ltd (daughter company of Finnair) by
their scheduled flights until they stopped flights completely to Mikkeli in 1993.
The biggest amount of passengers at the Mikkeli City airport was in 1987 when
the amount of passengers was 28 222. (City of Mikkeli 2012.)
In 1990 there were three daily flights (Mon to Fri) from Helsinki–Mikkeli and one
on Saturday and one on Sunday plus the freight flights two times per night on

51
weekdays. Employees at the airport were 18. Morning flights were operated by
Finnaviation Ltd and the day and evening flights were operated by Air Botnia
Ltd. In 1993 passengers were only 13 542 and the Finnaviation Ltd/Finnair Ltd
stopped flying to Mikkeli. Subsidies were paid to Air Botnia Ltd by the govern-
ment and the City of Mikkeli for operating Helsinki–Mikkeli flights three times a
day. In 1998 Air Botnia Ltd became a part of SAS. After challenging years Air
Botnia Ltd stopped Helsinki–Mikkeli flights in 1999. In the same year Flying En-
terprise started flights from Mikkeli to Helsinki two times a day. Route wasn`t
profitable and the shares of Flying Enterprise were sold to Skyways Holding Ltd
belonging to SAS. In 2000 the City of Mikkeli denounced the agreement with the
operator. In 2000, flights from Savonlinna–Mikkeli–Helsinki were started by
Golden Air, with the morning flight to Helsinki and the evening back. The plane
stayed overnight in Savonlinna. 2004–2005 flights were operated by European
Executive, first in cooperation with Savonlinna, then without Savonlinna. In Oc-
tober 2005 scheduled flights to Helsinki were stopped and the Mikkeli City air-
port has not had scheduled passenger flights ever since. (City of Mikkeli 2012.)
52
5 AIRPORT PERFORMANCE COMPARISON
Mikkeli City airport is now at a crossroads. It has to decide whether it will make
effort on gaining scheduled flights and more passengers to the airport, or will it
focus on the current situation, where the airport is in active military, first aid and
leisure time use. Almost 20 years ago, Stockholm Skavsta airport had the same
situation. They chose to develop the airport and today with its over 2 million an-
nual passengers we can say that it is the best option for best practice bench-
marking example for Mikkeli City airport. But because today these airports are
on different levels on their development paths, it is impossible to compare the
performance of these airports by using the most popular key performance indi-
cators, which was introduced in Chapter 3.2 Performance Indicators for Air-
ports. Mikkeli City airport does not have much to measure, but the idea of input
– output ratios, introduced by Graham and Vogel (Graham 2014, p. 86; Vogel
2004, pp. 24–25) does not give too tight frames for the analysis of such a in-
comparable pair of airports. In this approach it doesn`t matter if the airports
have different ownership patterns, different locations, different environmental
factors and so on. They have employees, they have production capacity, and
they have aircrafts and passengers, but most of all in this study the main find-
ings can be done behind these inputs and outputs of the airports. Aircrafts allow
people to reach the Mikkeli region and the other way around. It is a fast way
from Mikkeli region to other destinations. Passengers bring money to Mikkeli
City airport and wider to the Mikkeli region. Not to mention the direct and indi-
rect employment effect the bigger amount of passenger can create for the re-
gion. According to the strategy of the City of Mikkeli (2013), the goal for 2017 is
to get new enterprises up to 140 annually (now 122 annually), increase the
workplaces in service sector for 1 100 persons and add the number of tourism
enterprises from 400 up to 440, decrease unemployment rates, and increase
the number of tourists staying overnight in the region from 216 500 up to 280
000 annually. These are the reasons for comparing and measuring the airport
performance of Mikkeli City airport and Stockholm Skavsta airport.
53
5.1 Airport input
Labour and capital are the major inputs of the airport system according to Gra-
ham and Vogel (Graham 2014, p. 86; Vogel 2004, pp. 24–25). Personnel costs
are the highest costs for airport, but over the years these costs for airports have
been decreasing due to more outsourcing being undertaken by airport opera-
tors, particularly in the handling area, and in many cases the use of a more pro-
ductive labour force as a result of a focus on greater efficiency. Various techno-
logical developments have also reduced the need for so many staff. However,
airport operators tend to have less willingness for reducing staff costs compared
with some industries, including the airline sector, as the majority of staff func-
tions tend to be related to the essential safety and security aspects of operating
and airport. Airports are fixed-cost businesses, having longer planning horizons
than airlines and requiring major investments in runways, terminals and equip-
ment. As a result, airports have limited flexibility to adjust these costs when traf-
fic fluctuates. According to Graham (2014), if passenger demand falls by 10%,
the operating cost will reduce by just 4.4%. (Graham 2014, pp. 76–77.)
Airport inputs as labour and capital are seen from the airport point of view as
costs, but from Mikkeli municipality point of view labour and capital inputs can
be seen as source of income for the City. Capital input means the production
capacity of the airport system: runways, terminals and gates. It can be meas-
ured an hourly, daily or annual bases. To be able to have production capacity at
an airport, it needs employees to make it possible. Labour i.e. employees pay
taxes to the municipality from their salaries and those employees who are living
in the area are most probably spending their salaries in the region. The bigger
the airport capacity is the more employees are working at the airport and the
more passengers are using the Mikkeli City airport as gateway to and from the
Mikkeli region.
5.1.1 Direct and indirect employment
In this analysis with direct employment is meant the employees of an airport
taking care of running the airport: airport management, administration/financial
and property operations, air traffic control, security, and technical support. Also

54
handling is seen as direct employment, because at Mikkeli City airport and
Stockholm Skavsta airport handling (check-in, boarding, baggage handling,
marshaling, dispatch) is done in-house. With indirect employment is meant the
employees who are working at the airport, but with passenger services, such as
retail, food and beverage, car hire, car park etc.
Direct employment in Mikkeli City airport, with 2 916 passengers in 2013, was 5
FTE (full-time equivalent) and indirect employment 0.5 FTE. Border and cus-
toms formalities can be organised at the airport when needed. (Silvennoinen
2014a.)
Direct employment in Stockholm Skavsta, with 2 165 040 passengers in 2013,
was 115 FTE (full-time equivalent) and 173 heads (Stockholm Skavsta has
many part time staff, who only come when needed). According to Managing
Director of Stockholm Skavsta airport, Dot Gade Kulovuori (2014b), without
handling operations Stockholm Skavsta would have 30–40 FTE, which is the
same amount of employees as when the airport had 200,000 passengers. (Ku-
lovuori 2014b.)
Indirect employment in Stockholm Skavsta, with passenger services as service
center, retail, food and beverage, car hire, car park, car wash, foreign exchange
and tourist information at the airport and at the business park within the Stock-
holm Skavsta airport where approximately 40 companies are located are all to-
gether approximately 1 300 employees. (Stockholm Skavsta airport 2014a;
2014d.)

55
Airport operations Mikkeli City Airport
Stockholm Skavsta
Airport management 0,5 3 directors, 6 managers Admin/Finance/Property 0,5 12
Air traffic control 1 LFV (air navigation services of Sweden) is the supplier
Security 1 Outsourced to Securitas Technical support 1 15
Handling 1 76 (incl. Rescue) Passenger services 0,5 App. 1 300
Table 10. Direct and indirect employment effects of Mikkeli City airport and Stockholm Skavsta airport. (Adapted from Kulovuori 2014b; Silvennoinen 2014a; Stockholm Skavsta airport 2014a.)
Municipality income comes from municipal income tax, corporate tax, property
tax and from governmental compensation in order to compensate for the differ-
ences between the municipalities in demographic and economic conditions. In
2013 the Municipality of Mikkeli gained 163€ million from municipality income
tax, 9€ million from corporate tax, 15€ million from property tax and 101€ million
from governmental compensation. Municipal income tax is remarkable for the
economy of the municipality. Last year the municipality income tax in Mikkeli
was 19.75% and for this year, 2014, the City of Mikkeli increased the municipali-
ty tax up to 20%. According to the Association of Finnish Local and Regional
Authorities (2010) in 2010 the municipality income tax rate in Finland was on
average 19%, but the effective municipality tax rate from earned income was
14%. This is because of the influence of the depreciations to the amount of in-
come, which is taken into account when counting the municipality tax. The
mathematic formula which defines the amount of municipality income tax goes
as follows: from earned income are subtracted depreciations in municipality
taxation and the result is the earned income in municipality taxation. This
amount has to be multiplied by the municipality tax rate and the result is the
municipality income tax according to the earned income. From this sum is sub-
tracted depreciations in taxations and the result is the amount of municipality
income tax, which must be paid to the municipality. For example: an earned
income of 20 000€ – depreciations 4 000€ in municipality taxation = 16 000€
multiplying with municipality tax rate 20% = municipality tax of 3 200€ before the

56
depreciations in taxation. The total amount of municipality tax is then 3 200€
municipality tax before the depreciations in taxations – depreciations in taxa-
tions 700€ = 2 500€. According to Association of Finnish Local and Regional
Authorities (2010) if the municipality increases the level of municipality income
tax by one per cent the effect to the effective municipality tax rate is 0.7% from
earned income. That is why in our calculations we are using effective municipal-
ity tax rate according to Association of Finnish Local and Regional Authorities
(2010) of 14.7% (responses to the municipality income tax rate level of 20% in
Mikkeli) to make sure that the results of the calculations are as much as possi-
ble following the real municipality tax income result for the City of Mikkeli. (City
of Mikkeli 2014b; Association of Finnish Local and Regional Authorities 2010,
pp. 1–2.)
In these calculations about municipality income tax, we are using the monthly
wage of 2 980€ in 2013 in public sector in Finland according to Statistics of Fin-
land (2014b).
Direct employment effect of the Mikkeli City airport to the City of Mikkeli is now:
2 980€ x 12 months x 14.7% x 5 FTE = 26 283.6€ ∼ 26 300€ per year. This
means that the direct employment effect of the Mikkeli City airport to the munic-
ipality of Mikkeli is 26 300€ in 2014. Of course now when the owner of the air-
port is the municipality itself, it is also responsible for paying the salaries.
If this idea of direct employment effect is further developed, as far as 10 years
ahead, the goal for developing the Mikkeli City airport is to reach 500,000 pas-
sengers within 10 years (Paananen 2014a). It also can have effects on the
ownership pattern of the airport. According to Statistics of Finland (2013), the
average mothly salary in private sector in Finland was 3 428€ in 2012. Accord-
ing to Juha-Pekka Paananen (2014b) it could be possible to run the Mikkeli City
airport with 25 FTE when there would be 500,000 passengers, with right sched-
uled flights. This calculations doesn`t take into account any variables as in-
creases in level of salaries or increases in level of municipality tax. Direct em-
ployment effect is as follows: 3 428€ x 12 months x 14.7% x 25 FTE = 151
174.8€ ∼ 151 200€. This means that the direct employment effect of the Mikkeli
City airport to the municipality of Mikkeli would be 151 200€ in 2024. Privatisa-

57
tion of the airport would cut the costs of City of Mikkeli, and instead the City
could get more benefits from the airport development.
If the Mikkeli City airport would have 500,000 passengers within 10 years, it
would also have an effect on the indirect employment of the airport. 500,000
passengers already need different kinds of services, and it would be a good
business opportunity for many kinds of firms. As in Stockholm Skavsta, Mikkeli
City airport could offer passenger services such as service center, retail, food
and beverage, car hire, car park, car wash, foreign exchange and tourist infor-
mation at the airport and so on. Today the indirect employment effect of the
Mikkeli City airport is: 2 980€ x 12 months x 14.7% x 0.5 FTE = 2 628.36€ ∼ 2
630€. This sum can not be seen as income to the City of Mikkeli because the
City is now responsible for paying the salaries. According to Juha-Pekka
Paananen (Paananen 2014b), indirect employment could be with 500,000 pas-
sengers 10 FTE. This calculations does not take into account any variables
such as increases in level of salaries or increases in level of municipality tax.
Indirect employment effect could then be after 10 years as follows: 3 428€ x 12
months x 14.7% x 10 FTE = 60 469.92€ ∼ 60 500€. That is already direct in-
come for the City of Mikkeli.
At this time, the economic benefits of the Mikkeli City airport for the City of Mik-
keli have not been high. According to Centre for Economic Development,
Transport and the Environment (2013), in 2012 enterprises in Mikkeli region
were 5 369 and employees all together 17 748 from which 0.03% were em-
ployed by Mikkeli City airport. If the amount of all the employees in the region
would be the same after 10 years, the effect of the Mikkeli City airport with di-
rect employment of 25 FTE would be already 0.14%. And with direct employ-
ment of 25 FTE and indirect employment 10 FTE the effect would be already
0.19% from all the employees of the Mikkeli region. According to the City of
Nyköping in Sweden (City of Nyköping 2014), where the Stockholm Skavsta
airport is located, 4 533 enterprises were located in the Municipality of Nyköping
in 2013. Employees all together at the municipality area were 23 449, from
which the biggest employer is the municipality itself with 3 836 employees and
the Stockholm Skavsta is the 8th biggest employer with 190 employees employ-

58
ing 0.81% from all the employees on the municipality region. (Centre for Eco-
nomic Development, Transport and the Environment 2013; City of Nyköping
2014.)
5.1.2 Production capacity of the airport system
Capital in the sense of production capacity or capacity of the airport system,
e.g. capacity of the runways, terminals, gates, hourly, daily or annual basis can
also be seen as input of an airport. The airports production capacities are
counted on a theoretical basis and it does not take into account any variables.
Production capacity of Mikkeli City airport with one runway of 1 700 metres and
with one gate is one plane within 1.5 hours. With current opening hours the pro-
duction capacity of the airport is 12 planes, 24 movements per week, on Mon-
days 2 planes, on Tuesdays–Thursdays 3 planes per day and on Fridays 1
plane, on a yearly basis it means 624 planes, 1 248 movements annually (Table
11). With similar opening hours as in Stockholm Skavsta airport the capacity of
Mikkeli City airport could be 10 planes, 20 movements per day, 70 planes, 140
movements per week and 3 640 planes, 7 280 movements per year (Table 11).

59
Production capacity of the airport system Mikkeli City airport
Stockholm Skavsta
Runways 1 –1700 m (2300 m) 1 – 2800 m 1 – 2000 m
Terminal 1 1 Gate 1 6
Hourly capacity 1 plane – 2 movements within 1,5 hours
4–12 planes/8–24 move-ments per hour depending on direction of wind and share of
starts/landings
Opening hours
Mon 0600–1000 EET (GMT + 02.00)
Tue–Thu 0600–1000 EET and 1600–1800 EET Fri 1400–1600 EET
Otherwise only by agreement
0600–2200 GMT daily
2200–0600 GMT only by agreement
Daily capacity
Mon – 2 planes/4 mov. Tue–Thu – 3 planes/day/
6 movements Fri – 1 plane/2 mov.
With opening hours of Stockholm Skavsta
10 planes/20 movements day
From 64 planes/128 move-ments up to 192 planes/384 movements per day depend-ing on direction of wind and
share of starts/landings (6 simultaneous flights – two
simultaneous arrivals)
Annually
624 planes – 1 248 movements
(with current hours) 3 640 planes –
7 280 movements (with Skavsta hours)
From 23 296 planes/46 592 movements up to
69 888 planes/ 139 776 movements
limited to 37 500 planes/ 75 000 movements according
to environmental permit Table 11. Production capacities of Mikkeli City airport and Stockholm Skavsta airport. (Adapted from Kulovuori 2014a; 2014c; Silvennoinen 2014a.)
Stockholm Skavsta airport (2014a) has two runways, 1st runway of 9 442 feet –2
800 meters, and 2nd runway of 6 690 feet – 2 000 metres. According to the ter-
minal map of the Stockholm Skavsta airport (Picture 5), there is one big pas-
senger terminal with six gates. According to the Managing director of Stockholm
Skavsta airport, Dot Gade Kulovuori (2014a), the terminal building with current
gates has capacity of 3 million annual passengers and six simultaneous flights
from which are two simultaneous arrivals. At the stands can be six aircrafts
parked at the same time. Runway capacity is 4–12 planes/8–24 movements per
hour depending on direction of wind and share of starts/landings. Stockholm
Skavsta is now capable of handling 3 million passengers per year, and it is de-
signed for further expansion. According to the environmental permit, annual ca-
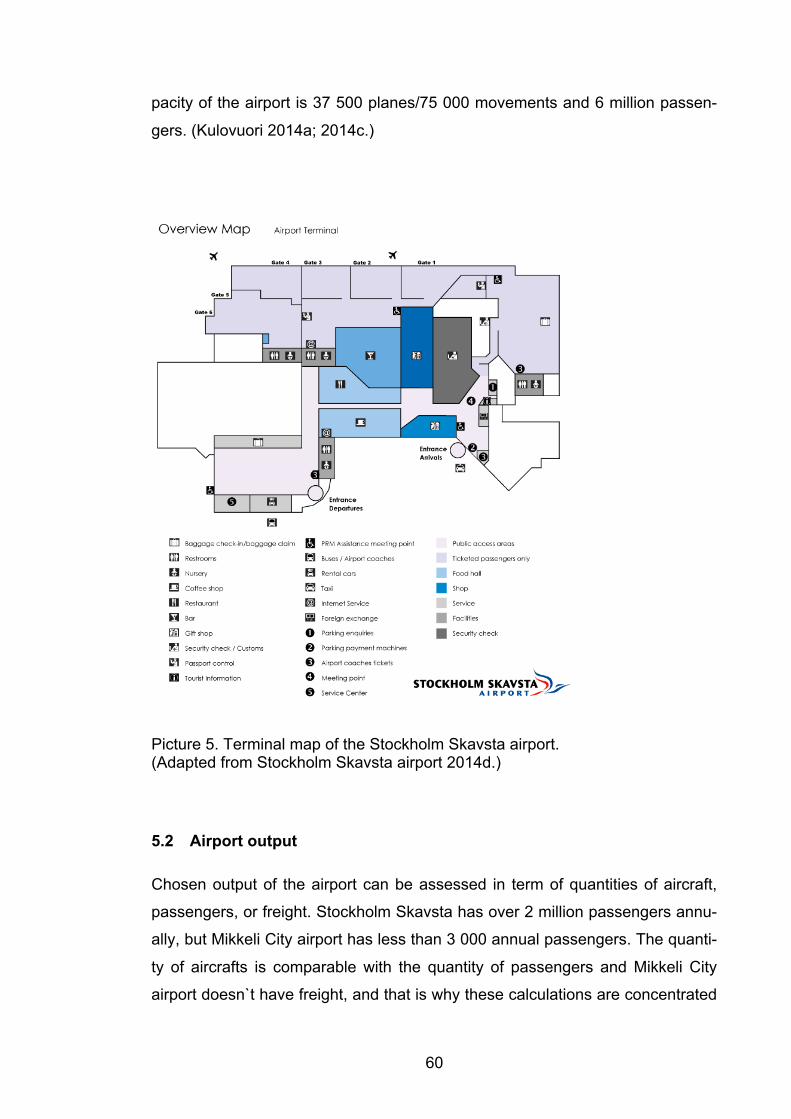
60
pacity of the airport is 37 500 planes/75 000 movements and 6 million passen-
gers. (Kulovuori 2014a; 2014c.)
Picture 5. Terminal map of the Stockholm Skavsta airport. (Adapted from Stockholm Skavsta airport 2014d.)
5.2 Airport output
Chosen output of the airport can be assessed in term of quantities of aircraft,
passengers, or freight. Stockholm Skavsta has over 2 million passengers annu-
ally, but Mikkeli City airport has less than 3 000 annual passengers. The quanti-
ty of aircrafts is comparable with the quantity of passengers and Mikkeli City
airport doesn`t have freight, and that is why these calculations are concentrated

61
on the quantity of passengers. Because Mikkeli City airport does not have many
passengers, a few calculated future scenarios of the quantities of passengers
Mikkeli City airport could handle in the future after developing the airport and it`s
services and the economical effects of these theoretically calculated amounts of
passengers to the Mikkeli region are presented. The airport outputs are counted
on a theoretical basis and they do not take into account any variables such as
capacity utilization.
A runway with the length of 1 700 metres makes the landing possible for planes
with only 100–150 passengers. In the development project for Mikkeli City air-
port (Paananen 2014a) has arisen the question about investment for lengthen-
ing the runway up to 2 300 metres. After the investment, also the bigger air-
crafts (250–300 passengers) could land at Mikkeli City airport. At the Mikkeli
City airport is only one passenger terminal available but there are possibilities to
change the use of hangar next to the terminal into a new passenger terminal.
The history of Mikkeli City airport is interesting. First attempt to organize sched-
uled flights from Mikkeli to Helsinki was in 1951. Since then there has been
several carriers trying to offer Mikkeli – Helsinki scheduled flights but these at-
tempts have turned out to be unsuccessful. Flights to Helsinki hve been organ-
ised not only individually, but also with cooperation with City of Savonlinna. Ac-
cording to City of Mikkeli (2012) the biggest amount of passengers at the Mik-
keli City airport was in 1987 when the amount of passengers was 28 222.
Scheduled flights from Mikkeli to Helsinki stopped in October 2005 and the Mik-
keli City airport has not had scheduled passenger flights ever since. According
to the passenger statistics of Mikkeli City airport between 1993–2013 (figure
5.4), the amount of passengers has been decreasing since 1994, being 14 262
in 1994 and ending up to 2 916 in 2013. These passenger figures do not take
into account the passengers of Finnish Army Command. (City of Mikkeli 2012;
Silvennoinen 2014a; 2014b.)
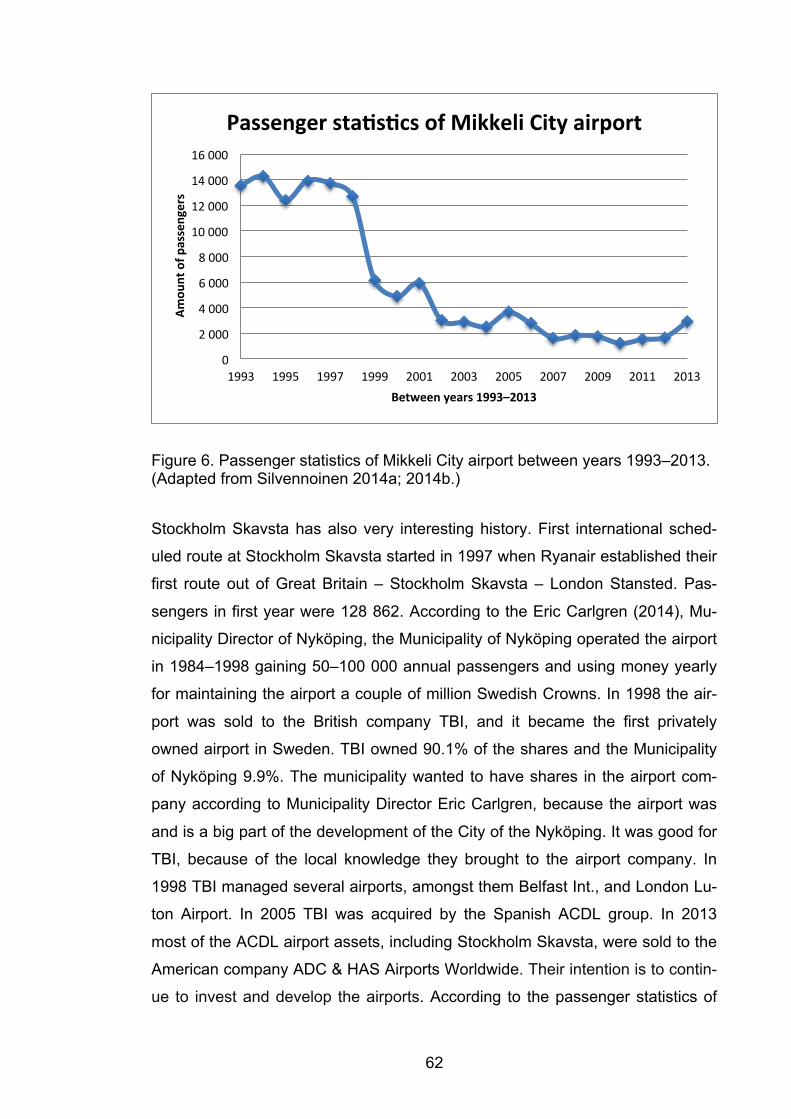
62
Figure 6. Passenger statistics of Mikkeli City airport between years 1993–2013. (Adapted from Silvennoinen 2014a; 2014b.)
Stockholm Skavsta has also very interesting history. First international sched-
uled route at Stockholm Skavsta started in 1997 when Ryanair established their
first route out of Great Britain – Stockholm Skavsta – London Stansted. Pas-
sengers in first year were 128 862. According to the Eric Carlgren (2014), Mu-
nicipality Director of Nyköping, the Municipality of Nyköping operated the airport
in 1984–1998 gaining 50–100 000 annual passengers and using money yearly
for maintaining the airport a couple of million Swedish Crowns. In 1998 the air-
port was sold to the British company TBI, and it became the first privately
owned airport in Sweden. TBI owned 90.1% of the shares and the Municipality
of Nyköping 9.9%. The municipality wanted to have shares in the airport com-
pany according to Municipality Director Eric Carlgren, because the airport was
and is a big part of the development of the City of the Nyköping. It was good for
TBI, because of the local knowledge they brought to the airport company. In
1998 TBI managed several airports, amongst them Belfast Int., and London Lu-
ton Airport. In 2005 TBI was acquired by the Spanish ACDL group. In 2013
most of the ACDL airport assets, including Stockholm Skavsta, were sold to the
American company ADC & HAS Airports Worldwide. Their intention is to contin-
ue to invest and develop the airports. According to the passenger statistics of
0
2 000
4 000
6 000
8 000
10 000
12 000
14 000
16 000
1993 1995 1997 1999 2001 2003 2005 2007 2009 2011 2013
Amou
nt of p
assengers
Between years 1993–2013
Passenger sta9s9cs of Mikkeli City airport
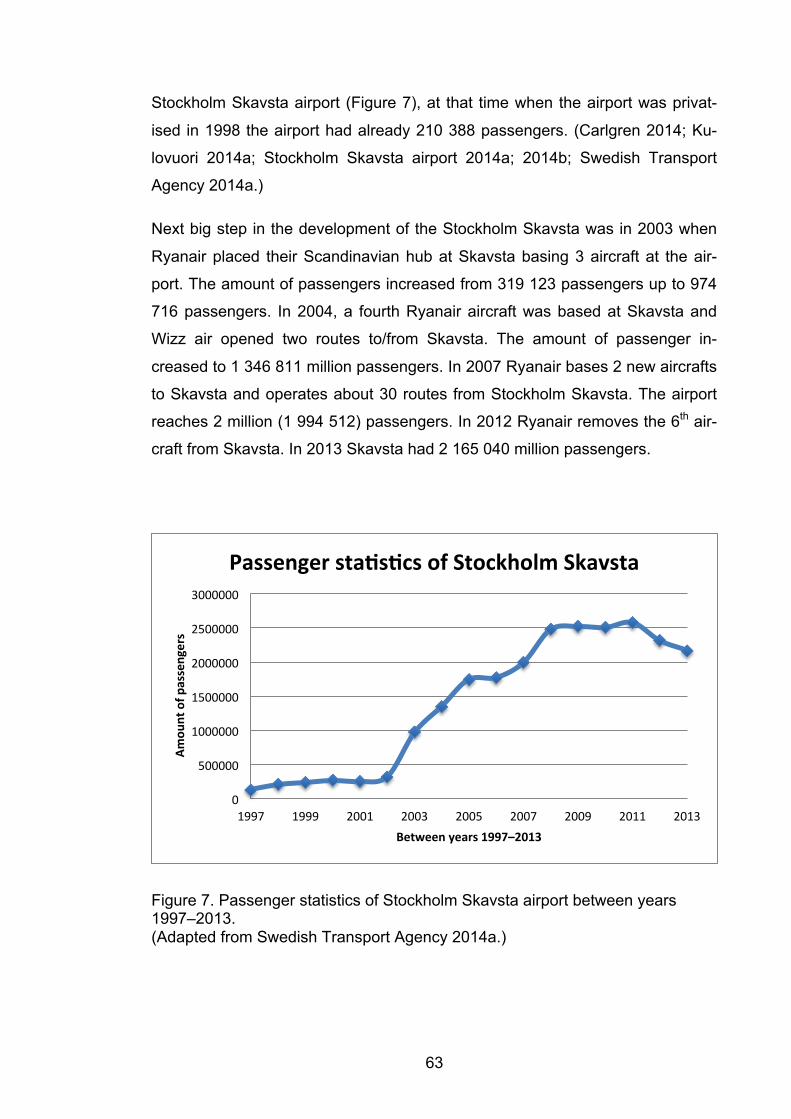
63
Stockholm Skavsta airport (Figure 7), at that time when the airport was privat-
ised in 1998 the airport had already 210 388 passengers. (Carlgren 2014; Ku-
lovuori 2014a; Stockholm Skavsta airport 2014a; 2014b; Swedish Transport
Agency 2014a.)
Next big step in the development of the Stockholm Skavsta was in 2003 when
Ryanair placed their Scandinavian hub at Skavsta basing 3 aircraft at the air-
port. The amount of passengers increased from 319 123 passengers up to 974
716 passengers. In 2004, a fourth Ryanair aircraft was based at Skavsta and
Wizz air opened two routes to/from Skavsta. The amount of passenger in-
creased to 1 346 811 million passengers. In 2007 Ryanair bases 2 new aircrafts
to Skavsta and operates about 30 routes from Stockholm Skavsta. The airport
reaches 2 million (1 994 512) passengers. In 2012 Ryanair removes the 6th air-
craft from Skavsta. In 2013 Skavsta had 2 165 040 million passengers.
Figure 7. Passenger statistics of Stockholm Skavsta airport between years 1997–2013. (Adapted from Swedish Transport Agency 2014a.)
0
500000
1000000
1500000
2000000
2500000
3000000
1997 1999 2001 2003 2005 2007 2009 2011 2013
Amou
nt of p
assengers
Between years 1997–2013
Passenger sta9s9cs of Stockholm Skavsta

64
With the current production capacity of Mikkeli City airport with one runway of
1700 metres and with one gate it is possible to handle 12 planes/24 movements
per week (calculation in Chapter 5.1.2). That means that the airport can handle
one turn of one plane of 100–150 passengers, 12 times per week. This could
mean a minimum of 2 400 passengers (24 movements per week x 100 passen-
gers per movement) or maximum 3 600 passengers (24 movements per week x
150 passengers per movement) per week with current facilities and current
opening hours of the airport. This amount of passengers would already be big-
ger than the current annual amount of passengers the airport is now handling.
On a yearly basis the quantity of passengers would be a minimum of 124 800
and maximum 187 200 passengers.
If Mikkeli used Stockholm Skavsta opening hours, the daily amount of planes
would be 10 planes/20 movements, and the weekly amount of passengers
would already be minimum 14 000 (20 movements per day, 7 days a week x
100 passengers/movement) and maximum 21 000 (20 movements per day, 7
days a week x 150 passengers/movement) passengers without lengthening the
runway of Mikkeli City airport. Annual figures would be with 100 passengers per
plane, 10 planes per day, seven days per week, 728 000 passengers annually.
And with 150 passengers per plane, 10 planes per day, seven days per week, 1
092 000 passengers annually.
The lengthening of the runway from 1 700 metres up to 2 300 metres would
make possible to land to Mikkeli City airport with aircrafts of 250–300 passen-
gers. It would mean with current opening hours, 12 planes/24 movements per
week, minimum 6 000 (24 movements x 250 passengers per movement) pas-
sengers weekly and 312 000 passengers annually. The maximum level of pas-
sengers would be weekly 7 200 (24 movements x 300 passengers per move-
ment) passengers and annually 374 400 passengers. Using Skavsta opening
hours in Mikkeli, the level of passengers would be much higher. With daily 10
planes/20 movements, seven days per week, the minimum level of weekly pas-
sengers would be 35 000 (20 movements per day, 7 days a week x 250 pas-
sengers per movement) passengers. The annual amount of passengers would
be a minimum 1 820 000 passengers. And with the bigger planes of 300 pas-
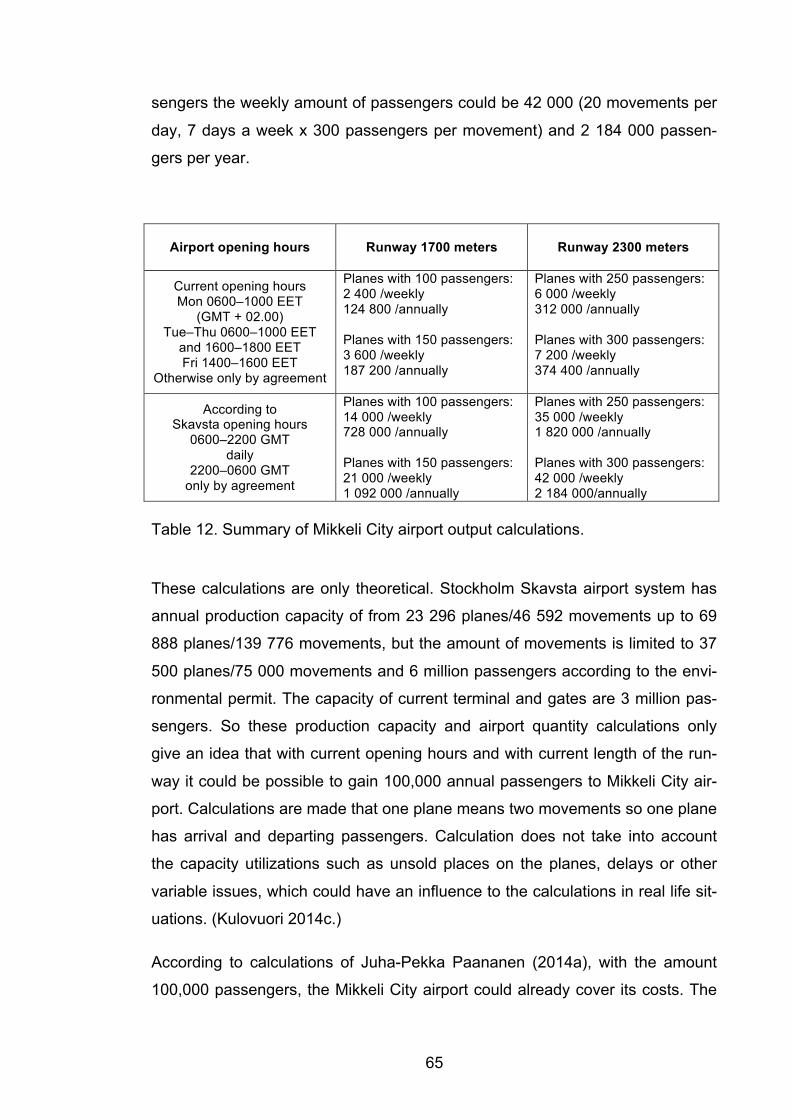
65
sengers the weekly amount of passengers could be 42 000 (20 movements per
day, 7 days a week x 300 passengers per movement) and 2 184 000 passen-
gers per year.
Airport opening hours
Runway 1700 meters
Runway 2300 meters
Current opening hours Mon 0600–1000 EET
(GMT + 02.00) Tue–Thu 0600–1000 EET
and 1600–1800 EET Fri 1400–1600 EET
Otherwise only by agreement
Planes with 100 passengers: 2 400 /weekly 124 800 /annually Planes with 150 passengers: 3 600 /weekly 187 200 /annually
Planes with 250 passengers: 6 000 /weekly 312 000 /annually Planes with 300 passengers: 7 200 /weekly 374 400 /annually
According to Skavsta opening hours
0600–2200 GMT daily
2200–0600 GMT only by agreement
Planes with 100 passengers: 14 000 /weekly 728 000 /annually Planes with 150 passengers: 21 000 /weekly 1 092 000 /annually
Planes with 250 passengers: 35 000 /weekly 1 820 000 /annually Planes with 300 passengers: 42 000 /weekly 2 184 000/annually
Table 12. Summary of Mikkeli City airport output calculations.
These calculations are only theoretical. Stockholm Skavsta airport system has
annual production capacity of from 23 296 planes/46 592 movements up to 69
888 planes/139 776 movements, but the amount of movements is limited to 37
500 planes/75 000 movements and 6 million passengers according to the envi-
ronmental permit. The capacity of current terminal and gates are 3 million pas-
sengers. So these production capacity and airport quantity calculations only
give an idea that with current opening hours and with current length of the run-
way it could be possible to gain 100,000 annual passengers to Mikkeli City air-
port. Calculations are made that one plane means two movements so one plane
has arrival and departing passengers. Calculation does not take into account
the capacity utilizations such as unsold places on the planes, delays or other
variable issues, which could have an influence to the calculations in real life sit-
uations. (Kulovuori 2014c.)
According to calculations of Juha-Pekka Paananen (2014a), with the amount
100,000 passengers, the Mikkeli City airport could already cover its costs. The
66
yearly costs of running the Mikkeli City airport are now 514 688€
(City of Mikkeli 2014c) and they could be covered with 5–7 scheduled flights per
week to the airport, for instance with Boeing 757 or Airbus 320. According to
these calculations (Chapter 5.1.2.) the production capacity of the Mikkeli City
airport system could handle the amount of planes and passengers with current
facilities, but the airlines are using bigger planes (250–300) because of the cost
structure of the airlines and that is why the need for lengthening the runway of
the Mikkeli City airport is needed for further development of the airport. The in-
come to the airport would be gathered from different sources, but taking into
account only the passenger fee, €10 per passenger, it would already mean €1
million income to the airport (Paananen 2014a). The Mikkeli model would be
much more cost efficient than for instance the Lappeenranta airport now. With
yearly 100,000 passengers the Lappeenranta airport is now making big losses,
approximately over 1€ million, and the future of the Lappeenranta airport as a
part of Finavia airport network is not clear (Ministry of Transport and Communi-
cations 2013c).
5.3 Economic benefits for the City of Mikkeli
Airports have a strategic importance to the regions they serve. According to
Graham (2014) airports can bring greater wealth, provide substantial employ-
ment opportunities and encourage economic development and can be a lifeline
to isolated communities, they have an effect to the environment in which they
are located and on the quality of live of residents living nearby. (Graham (2014,
p. 1)
Next are presented two studies acquired by the City of Lappeenranta to give an
answer to a question about how much money flight passengers are leaving to
the region. Fist study is made by Tak Oy in 2011. According to Tak Oy (2011),
one flight passenger, not from the region of South-Karelia, will leave to the re-
gion 140€ per person when departing/arriving to the City. Money was used as
follows: accommodation 19€, Restaurants, bars and cafes 21€, groceries 20€,
department stores 15€, clothes and footwear stores 21€, and other expenses
36€. Tak Oy (2011) has made the study in cooperation with the City of Lap-
peenranta and state owned airport network company Finavia. Flight Passenger
67
Study is about the economic benefits of the Lappeenranta airport answering to
the questions who are the passengers at the airport, what is the reason for
flight, how much money they have spent and are the passengers satisfied with
the services of the City of Lappeenranta. Study was conducted in from July 5–
26, 2011 by asking questions from 10–36 passengers per departing flight.
Flights were chosen 16. All together answers were 456. According to Flight
Passenger Study made by Tak Oy (2011) flight passengers will leave to the
Lappeenranta region approximately 5.5€ million and air traffic will benefit the
region up to 7.9€ million annually in 2011 using estimated amount of passen-
gers 117 000. According to the study, almost half of the passengers are staying
in the City after returning from the trip. Spending of inhabitants of South-Karelia
was not studied, other Finns used 35€, Russians 145€ and other foreigners
153€. From the passengers 27% were inhabitants of South-Karelia, other Finns
11%, Russians 54%, from which 48% from St. Petersburg and other foreigners
8%. (Tak Oy 2011, pp. 1–2; 17–18.)
Second study is made by MC-Info Oy (2014) ordered by Wirma Lappeenranta
Oy, which is the business development company owned by the City of Lap-
peenranta. The study is about economic benefits of the air traffic for the Lap-
peenranta region. According to the study flight passenger will leave 155€ to the
region. Study was conducted by asking 172 flying passengers about their
spending in Lappeenranta region during March 2014. From 172 passengers
40% answered that they will use money in the region. This figure includes the
one day visitors and visitors staying overnight. The amount of used money was
155,23€ without value added taxes. According to the study of MC-Info Oy
(2014) with 400,000 passengers the Lappeenranta region could gain 21.5€ mil-
lion euro tourism income, 5.7€ million with salaries and 150 FTE. (MC-Info Oy
2014, pp. 3; 11–15.)
According to the studies of Tak Oy and MC-Info Oy, flight passengers are using
money in the region from 140€ (Tak Oy) up to 155€ (MC-Info Oy) per passen-
ger. If we think about the margin of error, which can be +/-48€ (Tak Oy 2011, p.
2) we could use in our calculation the amount of money of 100€, which each
passenger could leave to the region. In Mikkeli City airport case, the amount of

68
money passengers are leaving to the region could be from 291 000€ with 2 916
passengers (including arriving and departing passengers) in 2013, and per per-
son using 100€, up to 25€ million with the 500,000 passengers, which is the 10
years development project goal of the Mikkeli City airport, using 100€ per per-
son. All together the economic effect to the Mikkeli region is with the current
situation as follows. Direct employment effect is 5 FTE with municipality tax of
26 300€ annually. Indirect employment effect is 0.5 FTE with municipality tax of
2 630€ annually being all together 28 930€. Tourism income with 2 916 annual
passengers could be 291 000€.
Reaching the goal of 500,000 passengers annually within 10 years would have
effects to the economics of Mikkeli region as follows: Direct employment effect
could be 25 FTE with municipality tax of 151 200€. Indirect employment effect
could be 10 FTE with municipality tax of 60 500€. Now 0.03% from the employ-
ees of the region is employed by airport, and after 10 years the per cent from all
the employees of the area employed by the Mikkeli City airport could be 0.19%.
Current production capacity is 12 planes/24 movements and 3 600 passengers
per week and 624 planes/1248 movements and 187 200 passengers annually.
With longer opening hours the production capacity could be 10 planes/20
movements per day, 70 planes and 21 000 passengers per week and 3 640
planes/7 280 movements and 1 092 000 passengers annually. Output of the
Mikkeli City airport could be in the current situation minimum 124 800 passen-
gers annually and maximum 187 200 passengers annually. If one passenger
would use money 100€, Mikkeli region could gain minimum 12.5€ million and
maximum 18.7€ million annually with current opening hours and with current
runway. With lengthening the runway and lengthening the opening hours ac-
cording to the Skavsta model the Mikkeli City airport could gain minimum 1 820
000 passengers annually and maximum 2 184 000 annual passengers. Accord-
ing to this calculation the Mikkeli region could gain minimum 182€ million and
maximum 218.4€ million as income from the Mikkeli City airport passengers.
These amounts are hypothetical: they would mean that all the planes should be
fully booked and that the airport should be open 16 hours per day, turning one
plane per 1.5 hours. When keeping the 500,000 annual passengers as a goal

69
for Mikkeli City airport tourism income for the Mikkeli region would be 25€ mil-
lion and this amount of money is realistic.
70
6 PROPOSAL FOR MIKKELI CITY AIRPORT
The aim of this work was to prepare a proposal for the City of Mikkeli about how
Mikkeli City airport performance could be developed by comparing the perfor-
mance of the Mikkeli City airport with a best practise example, Stockholm
Skavsta airport. Skavsta case is unique and it is not the purpose the make a
proposal for Mikkeli to follow the Skavsta example with the same steps. Skavsta
case is not even possible to copy: time is different, and the business environ-
ment is different. As the Managing Director of Stockholm Skavsta airport Dot
Gade Kulovuori (2014b) said, when asked about the reasons behind the suc-
cess story of Skavsta, that things were “a lot easier in those days”. The Market-
ing Manager of Stockholm Skavsta airport was in the right place at the right
time, when meeting with Chief Executive Officer of Ryanair, Mr. Michael
O`Leary. But there is something Mikkeli could adopt when developing the Mik-
keli City airport. These propositions are segmentation, destinations and owner-
ship.
First of all – segmentation. To become leading tourism airport in Finland. Mikkeli City airport should concentrate either to become leading leisure aviation
base or leading tourism airport. Leisure aviation base would be possible with
current facilities, but becoming leading tourism airport there are need for
lengthening of the runway up to 2 300 metres. Stockholm Skavsta has two run-
ways 2 800 and 2 000 metres. When choosing the tourism airport segment the
municipality could gain bigger income from employees working at the airport
and from tourism income. Theoretically calculated, the annual production ca-
pacity of Mikkeli City airport could be with longer runway and longer opening
hours 3 640 planes or 7 280 movements and over 2 million annual passengers.
If Mikkeli could gain 500,000 annual passengers it would bring over 25€ million
income to the municipality. In this calculation is not counted the salaries of the
employees of the Mikkeli City airport, which most likely are living in Mikkeli re-
gion and spending biggest part of their salaries in the area. It doesn`t either take
into account the catalytic effects to the municipality from the enterprises offering
tourism services for the increasing amount of tourists coming to Mikkeli region.
According to the Municipality Director of Nyköping Eric Carlgren (2014) from the
71
passengers of Stockholm Skavsta airport 15% (325 438) are staying over night
in the region, and 1000 enterprises are offering tourism services.
Stockholm Skavsta has the Ryanair base with 5 based aircrafts and with over
30 destinations and Wizz air with seven destinations. Fritidsresor (TUI) also of-
fers direct charter holiday flights with 2 destinations. Skavsta has chosen tour-
ists and business people as their main customers and they offer around 30 des-
tinations annually. This means that it is important to choose the right customer
segments because it is not possible to serve everybody with limited resources.
In Mikkeli these customer segments could be, besides Finnish military forces,
either the leisure aviation or tourism and business people. A lot of new business
possibilities could be for Mikkeli City airport now when the Helsinki-Malmi airport
will be closed down. Helsinki-Malmi has been in really active leisure aviation
use and the Mikkeli City airport could be in the future active leisure aviation
base. Or another possibility could be following the Skavsta example when offer-
ing a wide range of routes for tourists and business people. Possible solutions
could be cooperation with tour operators, as Fritidsresor (TUI) in Skavsta and
air carriers with possibilities to operate with smaller aircrafts (100–150 passen-
gers) until lengthening the runway of Mikkeli City airport. By following the
Skavsta example, Mikkeli City airport could be the leading tourism airport in Fin-
land within 10 years. But to be able to reach the goal, it would need the invest-
ment for lengthening the runway and for passenger facilities. Value of this in-
vestment is according to the calculations of development project of the Mikkeli
City airport made by Juha-Pekka Paananen (2014a) from €8 up to €10 million.
Second of all – destinations. Offering wide range of tourism destinations. Possible destinations from Mikkeli City airport are popular holiday destinations,
and big passenger hubs so that passengers could easily continue travelling to
overseas destinations and also these destinations, from where the biggest tour-
ism groups are coming to Mikkeli region. The main destinations from Stockholm
Skavsta are routes within Europe (Stockholm Skavsta airport 2014c). According
to the statistics of Stockholm Skavsta (Swedish Transport Agency 2014a) there
have been flights outside of Europe, but mainly in summer season. Same thing
has been with the domestic flights. At Skavsta in 2013 from over 2 million pas-
72
sengers (2 165 040), domestic passengers were 0.015% and international were
99.985% (Stockholm Skavsta airport 2014a). According to the future scenarios
thorough 2025 by Finnish Transport Safety Agency – Trafi (2012) the amount of
domestic flights in Finland, will not increase, but instead it may decrease. In Fin-
land, the Seinäjoki airport has had domestic flights during the winter season, to
Kittilä. This could also be one big possibility for Mikkeli City airport, charter holi-
day flights within the country to northern parts of Finland, for example, Kittilä,
Kuusamo and others. In the summer season flights to southern parts of Finland,
for instance Turku would be good. To destinations with distances over 550 km,
where by car or by train would be time-consuming and difficult to travel, these
domestic flights could be also done by smaller planes.
Helsinki has been the main destination by plane from Mikkeli, but is it worth try-
ing to organize? By car it takes 2.5 hours and by train approximately 2.5 hours.
The connection flights to Helsinki from Mikkeli have not been popular. Several
air carriers have tried it since 1951 and the biggest amount of passengers was
in 1987 when the amount of passengers was 28 222 (City of Mikkeli 2012).
Flight time from Mikkeli to Helsinki is not long, approximately 30 min, but if the
travel destination is located in the City centre of Helsinki, there has to be count-
ed also the travel time from the airport to the City, minimum 45 min. Also the
flight schedules mean a lot. If a person has to be in Europe at nine, and the
connection flight from Helsinki-Vantaa is leaving at eight, the flight from Mikkeli
should be early enough to be able to reach the connection, and vice versa,
when the person is coming back in the evening via Helsinki-Vantaa to home in
Mikkeli. Direct flights to the destination from Mikkeli City airport, as from Stock-
holm Skavsta airport, would be the best option for Mikkeli City airport. It would
also serve better the Finnish people in Mikkeli region and more widely inside the
radius of 150 kilometres from Mikkeli where 500,000 people, 9.2% of the Finn-
ish population are living. Most of the competitor airports of Mikkeli City airport
are concentrating to gain flights from the region to Helsinki-Vantaa.
According to the Statistics Finland (2014a) the main leisure destinations for
Finnish residents were in 2013 first of all Estonia (most of all day and overnight
cruises), second of all Sweden (most of all day and overnight cruises), and third
73
of all Spain (increase of 21% to Continental Spain). Other European destina-
tions, which increased the amount of Finnish passengers, were Russia, Germa-
ny, France, Turkey, and the United Kingdom. The number of domestic leisure
trips with paid accommodation was almost 6.6 million, from which one million
trips were done to Lapland and Kainuu. Also the amount of business trips within
Finland and to abroad decreased from the previous years. (Statistics Finland
2014a.)
Huge possibilities for the inhabitants of the Mikkeli region could be offering
flights to bigger passenger hubs, for instance to Stockholm Skavsta, to be able
to reach a wide range of destinations with low amount of effort for traveling.
Travel time to Skavsta would be around 1.5 hours, and after that almost the
whole of Europe could be reached. The theme for further research could be in-
quiries for representatives of businesses and other organisations in the Mikkeli
region about the needs for international connections and destinations. Also the
inquiry could be directed to the inhabitants of the Mikkeli for asking also about
the opinions and needs for international connections and destinations.
This destination issue should also be thought of from another point of view. Ac-
cording to the strategy of the City of Mikkeli (2013) the goal for 2017 is to get
new enterprises up to 140 annually (now 122), increase the workplaces in ser-
vice sector for 1 100 persons and add the number of tourism enterprises from
400 up to 440, decrease unemployment rates, and increase the number of tour-
ists staying over night in the region from 216 500 up to 280 000 annually.
Theme for further research could be a survey about the countries or cities of
destination from where the tourists to Mikkeli are coming. Then marketing ac-
tions could be directed to these destinations and with direct flights to Mikkeli,
more tourists could be gained to the region. Mikkeli had the highest number of
free-time residences in 2013 in Finland – 10 195 (City of Mikkeli 2014b). Could
there be need for direct domestic flights to their holiday destinations? These
flights could also be organised with smaller planes during the best tourism sea-
son.
Potential passenger group. When comparing Mikkeli with Skavsta, Mikkeli has
one big advantage that Skavsta lacks – location next to a huge passenger po-

74
tential – St. Petersburg and the Leningrad region. Stockholm Skavsta is located
next to the capital of Sweden, Stockholm (0.9 million inhabitants) from 100 kil-
ometres from the City, radius 100 km covering 2.4 million people which is 27%
of the Swedish population, but next to the City of Stockholm are also located the
two big airports: Stockholm Arlanda and Stockholm Bromma, which are in pas-
senger figures bigger airports than Skavsta. Arlanda is located 42 km from
Stockholm with 20.7 million passengers from which 76.3% are international and
23.7% domestic. Bromma is 9 km from Stockholm with 2.3 million passengers
from which 11.1% are international and 88.9% domestic. Also, the second big-
gest airport of Sweden is located not so far from Skavsta. Göteborg Landvetter
is located 450 km from Stockholm and has 5 million annual passengers, from
which 72% are international and 28% domestic. (Swedish Transport Agency
2014a)
One big passenger group for Mikkeli City airport could be Russian tourists.
Within a flight time of 30 minutes is live over 5 million inhabitants in the City of
St. Petersburg. According to the studies about the travel destinations and the
overnight stayings of Russian tourists (for example, Worlds Tourism Organisa-
tion and European Travel Commission 2009), the European destinations re-
cording the highest number of nights of Russian tourists staying in 2007 were
Turkey, Italy, Spain, the United Kingdom and Greece. Four of these countries,
Turkey, Italy, Spain and Greece, are popular summer holiday destinations and
the United Kingdom is an important destination for business, educational and
VFR (visiting friends and relatives) travel from Russia. Over the study period
2000–2007, many destinations reported double-digit growth in overnight volume
from Russia: Austria, Croatia, Czech Republic, Estonia, France, Italy, Latvia,
Lithuania, Malta, Monaco, Portugal, Romania, Sweden, Switzerland and Tur-
key. The strongest annual increase was recorded by Montenegro. When choos-
ing the destination, Russians value destinations, prices and transport connec-
tions, for instance direct flights. (Worlds Tourism Organisation and European
Travel Commission 2009, pp. 48–49; 117–118.)
Travel time from St. Petersburg to Mikkeli is by car 4 hours (5 hours to Helsinki),
of course depending on the traffic at the border, and by train 3.5 hours with one

75
change (3.5 hours to Helsinki). It is estimated that within the increase of the
economic development in Russian Federation the level of salaries is increasing
and so is increasing the possibilities for Russians to travel abroad. In 2011 the
average household net-adjusted disposable income (the amount of money that
a household earns each year after taxes and transfers) per capita was estimat-
ed at 17 230 USD a year, which is lower than the OECD average of 23 938
USD (OECD 2011). According to the studies of Worlds Tourism Organisation
and European Travel Commission (2009) Russian outbound travel by purpose
of trip points to a 56% share for holiday trips, 19% for other leisure and 25% for
business travel. Russians are interested in sun and beach opportunities, but
also history and culture. Russians as a passenger group could be helping the
Mikkeli City airport to gain its goal – 500,000 passengers annually, but also it
could help the City of Mikkeli to gain its strategic goals – increase over night
stayings in the region, amount of workplaces and amount of tourism enterpris-
es. (Worlds Tourism Organisation and European Travel Commission 2009, pp.
32–33.)
Mikkeli City airport has a competitive advantage over the Pulkovo airport in St.
Petersburg in that Mikkeli City airport can offer lower fares for air carriers than
Pulkovo airport, which will increase airport charges in 2014 – 19% and until
2018 up to 51.9%. Being after that 30% more expensive than Sheremetjevo D-
terminal in Moscow, which is now the most expensive airport in Russia. The
reasons behind this decision are that Pulkovo airport has to pay 11.5% from the
turnover to the City of St. Petersburg, and because of the costs of credit 1.2
billion euro for expansion of terminal 3. (Delovoi Petersburg 2013.)
Third of all – ownership. Privatizing the airport company, leaving part of the ownership to the City of Mikkeli. The City of Mikkeli should privatise the
Mikkeli City airport, but still keep part of the ownership in its own hands. Possi-
bilities for getting best possible benefit from the airport company after selling the
shares of the airport should be studied further. Stockholm Skavsta is today
90.1% owned by ADC & HAS Airports Worldwide, and 9.9% by the Municipality
of Nyköping. Under the ownership of the Municipality of Nyköping the Stock-
holm Skavsta had 50–100 000 annual passengers before the deal with Ryanair
76
in 1997. In 1998 the airport was privatised, when selling the shares of 90.1% of
the Airport, including the land, to British company TBI. Within 10 years of time,
Stockholm Skavsta gained almost 2 million passengers. When thinking about
the goal of Mikkeli City airport, 500,000 passengers, Stockholm Skavsta gained
it within 5.5 years. It was before Ryanair placed their Scandinavian hub at
Skavsta in 2003 basing 3 aircrafts to the airport. In the sixth year Skavsta had
already one million passengers. According to the Municipality Director of the
Municipality of Nyköping Eric Carlgren (2014) the municipality wanted to keep
part of the ownership because the airport is seen as a big development part of
the City of Nyköping. The City still has the 9.9% ownership of the airport com-
pany, but it has no other income since the selling of the airport shares. Accord-
ing to Eric Carlgren (2014), it was a big sum of money, and it was used for local
energy company`s investments. That is why the City of Mikkeli, if privatizing the
Mikkeli City airport, should study the privatizing options carefully to be able to
get the best possible benefit. Municipality Director Carlgren (2014) also said
that the Swedish government-owned airport network company, Swedavia, was
not interested to take over the Skavsta airport. According to the scenarios of Air
transport strategy in Finland, Finnish government-owned airport network com-
pany Finavia, seems not interested to take over Mikkeli City airport. (Carlgren
2014; Kulovuori 2014a; Ministry of Transport and Communications 2013c; Swe-
dish Transport Agency 2014a.)
Annual production capacity of Mikkeli City airport is with current opening hours
624 planes/1 248 movements, but with Skavsta opening hours 3 640 planes/7
280 movements. This amount of planes is not possible to handle in Mikkeli City
airport without investments to the infrastructure. Airport output i.e. quantity of
passengers is with current runway maximum 1 092 000 annual passengers but
after lengthening of the runway 2 184 000 annual passengers. These amounts
are just theoretical, but it should be noticed that the Mikkeli City airport has big
growth potential. The goal for the development project for Mikkeli City airport is
realistic. The quicker the City of Mikkeli is ready to develop the Mikkeli City air-
port further, the quicker the City can have a possibility to get direct, indirect and
catalytic benefits from the airport especially from the output i.e. passengers of
the airport.

77
At the end. Mikkeli City airport has also a chance to do nothing. Airport will be
kept open mainly for Finnish Army Command, private charter flights, and pilot
training flights, first aid flights and leisure time aviation, but before deciding for
the future of the airport, all the possibilities should be counted carefully. Most of
all the goals for future development of the airport should be kept realistic. Ac-
cording to Municipality Director Eric Carlgren (2014), still, after 2 million annual
passengers, in the City of Nyköping is openly discussed about the need for an
airport in the region. Still it is a fact that with international connections, Mikkeli
has bigger potential to gain regional benefits than without these connections. It
would mean a loss of jobs and economic activities of regional businesses, loss
of purchasing power and demand for consumer goods. It would have a big in-
fluence for the future development of the Mikkeli region, but it is difficult to esti-
mate the loss solely in terms of money. Within this study we have counted the
direct and indirect effect of the employment for the region and the amount of
money the passengers could leave. These effects – over 25€ million – would be
counted as a loss for the region. Not to mention all the other uncountable bene-
fits starting from the reputation and attractiveness among tourists.
78
7 CONCLUSIONS
Future of the Mikkeli City airport is current at this very moment. Governmental
support for running the airport will be stopped after a transition time and com-
pleting the Air Transport Strategy to Finland at the end of year 2014 have creat-
ed a new environment for Mikkeli City airport where the City of Mikkeli has to
decide what do. It is not cheap to keep the airport open as currently costs for
running the Mikkeli City airport are approximately 500 000€ annually, and it is
not the task for the municipality to run the airport or even cover the expenses of
running the airport from the taxpayers` pockets.
The main research question in this thesis was: How to improve the performance
of Mikkeli City airport? And the sub-questions were: Why to improve the perfor-
mance of Mikkeli City airport?, What is airport performance and how it is meas-
ured? And: What can be learned from Stockholm Skavsta airport case?
This study was a qualitative case study research using interviewing and sec-
ondary data analysis as the study method. Analytical technique of collected da-
ta has been used benchmarking, comparing the performance of Mikkeli City
airport with successful partially privatised Stockholm Skavsta airport, with an
approach of partial factor productivity (PFP) performance indicator measures,
which examine the relationship between inputs as employment and production
capacity and output of quantity of passengers.
Results of this study shows that direct employment effects of Mikkeli City airport
is currently 5 FTE and indirect employment effect 0.5 FTE with 2 916 annual
passengers. Direct employment effect of Stockholm Skavsta airport is 115 FTE
with 173 heads, from which many are part time employees. Indirect employment
effect of Stockholm Skavsta is approximately 1300 heads working approximate-
ly in 40 companies, which are offering different kinds of passenger services.
City of Mikkeli gets municipality tax income from the Mikkeli City airport person-
nel 26 300€ annually. The goal for Mikkeli City airport is to achieve 500,000
passengers within 10 years. With this amount of passengers the direct employ-
ment effect could be 25 FTE and indirect 10 FTE. In Stockholm Skavsta the
current direct employment effect would be with 2 165 040 passengers 30–40

79
FTE without handling services, which are now made in-house, which is the
same amount of employees the airport had with 200,000 passengers. Achieving
the 500 000 annual passengers the City of Mikkeli could get municipality tax
income from the Mikkeli City airport personnel 211 700€ annually. Today in the
City of Mikkeli 5 369 companies are employing 17 748 people. Mikkeli City air-
port with its 5.5 employees employ 0.03% from the whole workforce. After actu-
alizing the 10 years goal, with 35 employees the 0.19% of the whole workforce
would be employed by the Mikkeli City airport. In municipality of Nyköping,
where the Stockholm Skavsta is located, 4 533 companies are employing 23
449 people. Stockholm Skavsta airport with its 190 heads is the 8th biggest em-
ployer of the municipality and it employs 0.81% from the whole work force.
Production capacity of Mikkeli City airport is 1 plane/2 movements within 1.5
hours. Production capacity of Stockholm Skavsta airport is 4–12 planes/8–24
movements per hour depending on direction of wind and share of starts and
landings. Skavsta airport can handle 6 simultaneous flights from which 2 simul-
taneous arrivals. With current opening hours daily capacity of Mikkeli City air-
port could handle 2 planes/4 movements on Mondays, 3 planes/6 movements
daily on Tuesday, Wednesday and Thursday, and 1 plane/2 movements on Fri-
days. Daily Stockholm Skavsta capacity is from 64 planes/128 movements up to
192 planes/384 movements depending on direction of wind and share of starts
and landings. Weekly capacity in Mikkeli City airport is with current opening
hours 12 planes/24 movements but when lengthening the opening hours ac-
cording to Stockholm Skavsta, 16 hours per day, the Mikkeli City airport weekly
capacity could be already 10 planes/20 movements day and 70 planes/140
movements per week. Weekly production capacity in Stockholm Skavsta is from
448 planes/896 movements up to 1344 planes/2 688 movements depending on
direction of wind and share of starts and landings. Annual production capacity in
Mikkeli City airport is with current opening hours 624 planes/1248 movements
and with Skavsta opening hours 3 640 planes/7 280 movements. Annual pro-
duction capacity of Stockholm Skavsta is from 23 296 planes/46 592 move-
ments up to 69 888 planes/139 776 movements. According to environmental
permit the annual production capacity of Stockholm Skavsta airport is limited to
37 500 planes/75 000 movements.
80
Output of the airport is the quantity of passengers the airport can handle. In
Stockholm Skavsta the annual amount of passengers is currently over 2 million.
The current capacity of Stockholm Skavsta with current facilities, one terminal
and six gates, is 3 million passengers and it is designed for further expansion.
But according to the environmental permit, the annual capacity is limited to 6
million passengers. Production capacity at Mikkeli City airport has to be counted
in two ways, with current facilities and after lengthening the runway from 1 700
metres up to 2 300 metres. With current facilities, runway of 1 700 metres and
current opening hours, it is possible to land to Mikkeli City airport by planes with
100–150 passengers. Weekly capacity with 12 planes/24 movements would be
minimum 2 400 passengers and maximum 3 600 passengers. And after length-
ening the runway and opening hours according to Skavsta, the weekly produc-
tion capacity would be with 70 planes/140 movements and planes with 250–300
passengers minimum 35 000 passengers and maximum 42 000 passengers.
Annual capacity of Mikkeli City airport with current facilities and 624
planes/1248 movements is minimum 124 800 passengers and maximum 187
200 passengers. Annual production capacity with lengthening the runway and
opening hours according to Skavsta with 3 640 planes/7 280 movements is min-
imum 1 820 000 passengers and maximum 2 184 000 passengers.
Production capacity and passenger quantity calculations are hypothetical and
they do not take into account any variables such as the capacity utilizations or
weather conditions or other variables, which could have influence on the calcu-
lations in real life situations.
The study results verify that in theory it is possible to gain 100,000 annual pas-
sengers with current facilities and 500,000 annual passengers after lengthening
the runway and opening hours. 500,000 annual passengers means weekly 5–7
scheduled flights. It also verifies that with 100,000 annual passengers the yearly
expenses of 500 000€ for running the airport could be covered. 100,000 annual
passengers would bring a 10€ per passenger fee, which already means 1€ mil-
lion income. It also shows that strategic goals for 2017 of the City of Mikkeli
could be reached, new service sector enterprises, increase in service sector
workplaces, decrease in unemployment rate and increase in tourist staying over
81
night. In Nyköping, when the Stockholm Skavsta has over 2 million passengers,
1000 enterprises are offering tourism services and 15% from the passengers,
currently 325 438, are staying over night in the Nyköping region. In Mikkeli, after
reaching the goal for 500,000 passengers annually, 75,000 passengers would
stay over night in the Mikkeli region.
The main objective of this study was to prepare a proposal for the City of Mikkeli
for developing the Mikkeli City airport performance. These proposals are: be-
coming the leading tourism airport in Finland, offering a good selection of tour-
ism destinations and privatizing the airport. Now is the time when the City of
Mikkeli has to decide what to do with the Mikkeli City airport. Is the airport con-
centrating to become a leading leisure aviation base or is it ready to follow the
Skavsta example and invest in the airport to become the leading tourism airport
in Finland. Stockholm Skavsta is offering around 30 destinations annually,
mostly within Europe. From annual two million passengers, 99.985% are inter-
national passengers. Estimations show that domestic flights within Finland will
decrease but the international flights within Europe will grow from 2% up to 5%
annually until 2030. Europe is the direction the Mikkeli City airport should also
follow. Third example from the Stockholm Skavsta airport is privatizing the air-
port. Municipality of Nyköping still has 9.9% from the airport company`s shares.
To be able to invest money for developing the Mikkeli City airport, big invest-
ments of 8–10€ million must be made. The City itself cannot make such an in-
vestment, so other investors are needed. Stockholm Skavsta was first in the
hands of British TBI, then Spanish ACDL and now American ADC & HAS Air-
ports Wordwide having now bigger experience and bigger knowledge of the air-
port business and also wider experience about how to make the airport become
a profitable business. This is also the knowledge the Mikkeli City airport now
lacks.
The purpose of this study was to find how to improve the performance of Mikkeli
City airport and giving reasons why Mikkeli City airport performance should be
improved. Main findings of the study to question how to improve the Mikkeli City
airport performance are lengthening the runway and opening hours and gaining
new customers to the airport: passengers, leisure aviation activists and most of

82
all aviation companies offering air connections. The reason for this, is money.
According to direct and indirect employment a current effect of about 28 930€
up to 211 700€ after reaching the goal for 500,000 passengers within 10 years.
Tourism income is with current passengers 291 000€ and it could be after 10
years and 500,000 passengers 25€ million. With 100,000 passengers the air-
port could cover its expenses and after transition time there is a need for in-
come when the governmental support ends. Passenger fee 10€ per passenger
leads to 1€ million income. This amount would be left to the airport. Tourism
income 100€ per tourist – 10€ million. This amount would be left to the Mikkeli
City area. What is meant by airport performance and how it is measured de-
pends on the views of interested parties. Since there are no widely accepted
industry practices for measuring and comparing airport performance, all the in-
terest groups around the airport have their own indicators. Creditors and inves-
tors are using the traditional financial key ratios, to be able to compare the per-
formance of the airport with other businesses. Senior management of the airport
operators are using other indicators, mostly to be able to estimate that is the
airport operating and using its infrastructure as cost efficiently, productivity, and
profitable as it could, compared with competitors. Indicators can be divided to
financial measures monitoring the commercial performance, measures to meet
the requirements of government regulators and environmental measures.
Commercial pressure from ownership forms that demand a degree of financial
accountability have led many airports to become more focused on measuring
operational and business performance within the airport company. Also aviation
organisations are using their own performance indicators. American Federal
Aviation Administration through Airport Cooperative Research Programme
(ACRP) is using a technical approach and is focused on the implementation of a
performance management system. International Civil Aviation Organisation
(ICAO) has a more strategical focus. The most used performance indicators
are presented by European region of Airports Council International (ACI Eu-
rope). It is a set of key performance areas and key performance indicators,
which can be used differently depending of the need of airport and its manag-
ers. Eurocontrol, which has aim to understand the capacity of European air-
space and the reasons for delays when planning the use of airspace is interest-
ed in such an indicators as delays, and punctuality of arrivals and departures.

83
As to what could be learned from Stockholm Skavsta case for Mikkeli City air-
port for improving the airport performance are according to the proposal for the
City of Mikkeli as follows: becoming leading tourism airport in Finland, offering
good selection of tourism destinations, and privatizing the airport.
Hypothesis of the study was that from Stockholm Skavsta airport could be
learned practises, which can be used to improve the performance of the Mikkeli
City airport. This study shows the hypothesis to be correct. These issues are
segmentation: to become leading tourism airport in Finland, destinations: offer-
ing wide range of tourism destinations and ownership: privatizing the airport.
This research is reliable when conducting the study using benchmarking with an
approach of partial factor productivity (PFP) when analysing the data and find-
ing the answer to the research questions. Partial factor productivity showed well
the relationship between inputs such as employment and production capacity
and output of quantity of passengers. Collected data is valid corresponding to
the requirements for minimum amount of data according to Graham and Vogel
(2014; 2004) for comparing airport performance using input and output indica-
tors. This study has validity, where used data, method and results, justifies the
proposals for the City of Mikkeli for developing the Mikkeli City airport perfor-
mance. Study method measures the phenomenon, using employment effect,
production capacity and quantity of passengers, and is reliable and it can be
replicated. According to the researcher there can be variations in what kind of
economic benefits the City could gain from increased passenger volume de-
pending on the effective municipality tax rate and the level of passenger fee and
tourism income sum per passenger. Study results and arguments made accord-
ing to the analysis of the collected data are also reliable and can be replicated.
Themes for further research could be an analysis of potential investors for con-
tinuing the Mikkeli City airport development project, which could need funds of
8–10€ million and finding the best possible partners for a future privatized Mik-
keli City airport company. Another big need for future research would be finding
out what aviation companies would be interested to operate from Mikkeli, and
making a marketing proposal for the Mikkeli City airport.
84
In the end it is important to study the Mikkeli City airport development very care-
fully. There is a possibility to do nothing to the airport, but after transition time,
there are no possibilities to get funds from the government for running the Mik-
keli City airport. But if there is willingness to develop the airport to become a
leading tourism airport in Finland the goals for the future have to be realistic. In
Nyköping it is still discussed, even after gaining over 2 million annual passen-
gers, about the need for the airport. There are issues such as regional accessi-
bility, reputation and attractiveness among tourists, which cannot be counted in
money alone. According to our study, economic benefits for the City of Mikkeli
after gaining 500,000 annual passengers, would be over 25€ million annually.
Without first investing money for the development of the Mikkeli City airport this
sum can never be counted as income to the City.
AFTERWORD
Making the current study has been a really interesting journey to the world of
aviation. It has turned out to be very interesting world and in the future I definite-
ly hope to become a part of it one way or another.
85
LIST OF FIGURES
Figure 1. Airside and landside of an airport. ....................................................................................... 17 Figure 2. Revenue structures at ACI airports. ...................................................................................... 19 Figure 3. Cost structures at ACI airports .............................................................................................. 20 Figure 4. Passenger Traffic Forecast by ICAO Statistical Region according to revenue passenger
kilometres (RPK) through to 2030 .............................................................................................. 25 Figure 5. Finnish travel 2000 to 2013 and Finnish residents` favourite destination countries for leisure
trips with overnight stay the destination in 2013 and 2012 ........................................................ 27
Figure 6. Passenger statistics of Mikkeli City airport between years 1993–2013. ................................. 62 Figure 7. Passenger statistics of Stockholm Skavsta airport between years 1997–2013 ....................... 63

86
LIST OF TABLES
Table 1. Finavia network airports with passenger volumes ................................................................. 22 Table 2. Aviation`s contribution of outputs and jobs to Finland in 2010 .............................................. 24 Table 3. Finnish travel 2000 to 2013 and Finnish residents` favourite destination countries for leisure
trips with overnight stay the destination in 2013 and 2012 ........................................................ 27 Table 4. Consumer prices of flights in 1990–2011. .............................................................................. 28 Table 5. Performance management techniques used by respondents. ................................................ 31 Table 6. Key Performance Areas (KPA) on horizontal level and Key Performance Indicators (KPI) on
vertical level, according to Airports Council International (ACI) ................................................. 35 Table 7. Performance indicators commonly used to assess economic performance. ........................... 38 Table 8. Commercially based performance measures. ........................................................................ 40 Table 9. General information about the airports of Mikkeli City airport and Stockholm Skavsta airport.
.................................................................................................................................................. 44
Table 10. Direct and indirect employment effects of Mikkeli City airport and Stockholm Skavsta
airport. ...................................................................................................................................... 55 Table 11. Production capacities of Mikkeli City airport and Stockholm Skavsta airport. ...................... 59
Table 12. Summary of Mikkeli City airport output calculations. .......................................................... 65

87
LIST OF PICTURES
Picture 1. Finavia network airports with passenger volumes. ............................................................. 22 Picture 2. Mikkeli City airport from the air. Picture by Sakari Silvennoinen. ........................................ 45 Picture 3. Stockholm Skavsta airport from the air. .............................................................................. 46 Picture 4. Locations of Stockholm Skavsta airport and Mikkeli City airport.. ....................................... 48 Picture 5. Terminal map of the Stockholm Skavsta airport. ................................................................. 60
88
LIST OF REFERENCES ACI Europe 2014. European region of Airports Council International. Available on: https://www.aci-europe.org/aci-europe-represents-over-400-airports.html. Accessed on 22 March 2014.
ACI Europe 2012. European region of Airports Council International. Guide to Airport Performance Measures. Available on: http://www.aci-lac.aero/Media/aci/ downloads/ACI_APM_Guidebook_2_2012.pdf. Accessed on 4 February 2014.
ACI International 2012. Airports Council International. Airport Economics. Opti-mizing Revenues and maintaining competitive Cost Structures. Presentation on 11th of June 2012 on Taipei. Available on: http://www.cifalatlanta.org/wp/files/2012/06/Session-5_Rafael_Echevarnme.pdf Accessed on 13 April 2014.
ACRP 2011. Airport Cooperative Research Programme (ACRP) Report 19A: Resource Guide to Airport Performance Indicators. Produced by Transportation Research Board of the National Academies and sponsored by the Federal Avia-tion Administration. Available on: http://www.trb.org/main/blurbs/165238.aspx. Accessed on 23 March 2014.
Association of Finnish Local and Regional Authorities 2010. Suomen Kuntaliitto. Kunnallisveroprosentin noston vaikutus kunnan verotuloihin ja valtionosuuksien tasaukseen. Tekijöinä Henrik Rainio ja Jouko Heikkilä. Julkaistu 8.10.2010. Available on: http://www.kunnat.net/fi/asiantuntijapalvelut/kuntatalous/verotus/ veroprosentit/veroprosentti-valtionosuustasaus/Documents/ Kunnallisveroprosentin_nosto.pdf. Accessed on 12 June 2014.
Carlgren, Eric 2014. Telephone conversation on 11 June 2014. Notes from the telephone call are not publicly available.
Centre for Economic Development, Transport and the Environment 2013. Elinkeino-, liikenne- ja ympäristökeskus. Etelä-Savon aluetalouskatsaus 2013. Tekijöinä Kautiainen, Hanna ja Kokkonen, Anne. Available on: http://www.doria.fi/handle/10024/92571. Accessed on 9 May 2014.
City of Mikkeli 2014a. Mikkelin kaupunki. Mikkelin lentoasema. Available on: http://www.mikkeli.fi/palvelut/mikkelin-lentoasema. Accessed on 2 March 2014.
City of Mikkeli 2014b. Mikkelin kaupunki. Tietoa kaupungista. Available on: http://www.mikkeli.fi/tietoa-kaupungista. Accessed on 9 May 2014.
City of Mikkeli 2014c. Mikkelin kaupunki. Esityslistat ja pöytäkirjat. Tekninen lautakunta 3/2014, 18.3.2014, 10 / 36 § Teknisen lautakunnan toimintakertomus ja tilinpäätös 2013. Lentoaseman matkustajamäärät ja laskeutumiset 2013. Available on: https://webdom.mikkeli.fi/kunnari/internet_mikkeli.nsf/ 3e12a7fcbc9e6736c22569d90040f1cd/430ec7f1ec635677c2257ca1002dc8a1?OpenDocument. Accessed on 9 May 2014.

89
City of Mikkeli 2013. Mikkelin kaupunki. Mikkelin strategia vuosille 2014–2017. Kaupungin valtuuston hyväksyntä 2nd of September 2013. Available on: http://www.mikkeli.fi/sisalto/strategia. Accessed on 23 March 2014.
City of Mikkeli 2012. Mikkelin kaupunki. Mikkelin lentokentän historiikki 1932–2012. Available on: http://www2.mikkeli.fi/fi/sisalto/03_mikkeli_tieto/02_ historia/08_liikennehistoriaa/05_lentokentta_koko_historiikki. Accessed on 3 March 2014.
City of Nyköping 2014. Nyköpings kommun. Om Nyköping. Available on: http://nykoping.se/Kommun--politik/Om-Nykoping/. Accessed on 13 June 2014.
City of Seinäjoki 2013. Seinäjoen kaupunki. Lentoliikenteen käynnistäminen Seinäjoen lentoasemalla / sopimus / määräraha / muutokset sopimukseen / rahoitus loppuvuosi 2012 / lentoliikenneselvitys. Kaupungin valtuuston kokous 18.03.2013 § 48 liitteineen. Available on: http://listat.seinajoki.fi/. Accessed on 2 March 2014.
Crocker, David 2005. Dictionary of Aviation. Second edition. Bloomsbury Pub-lishing Plc. Available on: http://www.air.flyingway.com/ books/Dictionary_of_Aviation.pdf. Accessed on 13 April 2014.
Delovoi Peterburg 2013. "Деловой Петербург". Тарифы Пулково взлетают. Александр Сологуб, 16 декабря 2013. Available on: http://www.dp.ru/a/2013/12/16/Tarifi_Pulkovo_vzletajut/. Accessed on 15 May 2014.
Eriksson, Päivi & Kovalainen, Anne 2008. Qualitative Methods in Business Re-search. Sage Publications Ltd.
Eurocontrol 2014. European Organisation for the Safety of Air Navigation. About Eurocontrol. Available on: https://www.eurocontrol.int/about-eurocontrol Accessed on 22 March 2014.
Eurocontrol 2013. Network Operations Report 2013. Network Management. Network Operations Report 2013 – ANNEX III – Airports. Available on: http://www.eurocontrol.int/network-performance/publications Accessed on 23 March 2014.
Eurocontrol 1999. European Organisation for safety of air navigation. The PRC`s European ATM Performance Measurement System. Available on: https://www.eurocontrol.int/sites/default/files/content/documents/ single-sky/pru/publications/other/prc-eu-atm-perf-measurement-system.pdf Accessed on 22 March 2014.
European Commission 2012. DG Mobility and Transport. Air transport mode. Available on: http://ec.europa.eu/transport/modes/air/index_en.htm Accessed on 22 March 2014.
Finavia 2014a. Finavia Corporation. Available on: https://www.finavia.fi/en/finavia-corporation/. Accessed on 2 March 2014.
90
Finavia 2014b. Finavia Corporation. Annual report 2013. Available on: http://vuosikertomus.finavia.fi/en/. Accessed on 13 April 2014.
Finavia 2014c. Finavia Corporation. Annual report 2013. Key indicators. Availa-ble on: http://vuosikertomus.finavia.fi/en/2013/year-2013/key-indicators/. Ac-cessed on 16 April 2014.
Finavia 2013. Finavia Corporation. Traffic statistics 2013. Passengers by Air-ports. Available on: https://www.finavia.fi/en/news-room/statistics/statistics-2013/. Accessed on 2 March 2014.
Finavia 2012. Finavia Corporation. Traffic statistics 2012. Passengers by Air-ports. Available on: https://www.finavia.fi/en/news-room/statistics/statistics-2012/. Accessed on 2 March 2014.
Finnair 2014. Finnair. Investors. Shareholders. Major shareholders. Available on: http://www.finnairgroup.com/investors/investors_4_1.html. Accessed on 2 May 2014.
Francis, Graham & Humphreys, Ian & Fry, Jackie. 2002. The benchmarking of airport performance. Journal of Air Transport Management 8 (2002), pp. 239–247.
Franken, Sven 2013. The KPI Challenge for European Airports. A comparative study on the Performance Measurement activities of commercial airports in Eu-rope. Master Thesis in the Maastricht University, School of Business and Eco-nomics, Faculty of Marketing and Supply Chain Management. Available on: https://www.aci-europe.org/policy/position-papers.html?view=group&group=1&id=6. Accessed on 22 March 2014.
Fry, Jackie & Humphreys, Ian & Francis, Graham 2005. Benchmarking in civil aviation: some empirical evidence. Benchmarking: An International Journal, Vol. 12 No. 2, pp. 125–137. Emerald Group Publishing Limited.
Gillham, Bill 2010. Case Study Research Methods. Continuum International Publishing.
Graham, Anne 2014. Managing airports. An international perspective. 4th edi-tion. Routledge.
Graham, Anne 2005. Airport benchmarking: a review of the current situation. Benchmarking: An International Journal, 12 (2), pp. 99–111.
Helsingin Sanomat 2014. Malmin lentokenttä suljetaan 2016. Kentälle tilalle tu-lee koteja jopa 30 000 asukkaalle. Helsingin Sanomat on 26th of March 2014. Available on: http://www.hs.fi/kaupunki/a1395733764045. Accessed on 16 April 2014.
Humphreys, Ian & Francis, Graham 2002. Performance measurement: a review of airports. International Journal of Transport Management 1 (2002), pp. 79–85.
91
ICAO 2013. International Civil Aviation Organization. Airport Economics Manu-al. Doc 9562. Third Edition. 2013. Available on: http://www.icao.int/ sustainability/Documents/Doc9562_en.pdf. Accessed on 23 March 2013.
ICAO 2012. International Civil Aviation Organization. ICAO`s Policies on Charges for Airports and Air Navigation Services. Doc 9082. Available on: http://www.icao.int/publications/pages/publication.aspx?docnum=9082. Accessed on 23 March 2014.
ICAO 2010. International Civil Aviation Organization. Environmental Report. Aviation Outlook. Available on: http://www.icao.int/environmental-protection/Documents/EnvironmentReport-2010/ICAO_EnvReport10Outlook_en .pdf. Accessed on 20 May 2014.
Kulovuori Dot Gade 2014a. About Stockholm Skavsta airport. E-mail on 18 Feb-ruary 2014. Not publicly available.
Kulovuori Dot Gade 2014b. About Stockholm Skavsta airport. E-mail on 20 Feb-ruary 2014. Not publicly available.
Kulovuori Dot Gade 2014c. About Stockholm Skavsta airport. E-mail on 21 May 2014. Not publicly available.
Kärnä, Mikko 2014. Syntyykö Suomen lentoliikennestrategia siivettömänä? Uusi Suomi, Puheenvuoro 26.2.2014. Available on: http://mikkokarna.puheenvuoro.uusisuomi.fi/161620-syntyyko-suomen-lentoliikennestrategia-siivettomana. Accessed on 17 April 2014.
Lentopaikat 2014. Lentopaikat. Available on: http://lentopaikat.fi/kotisivu/ Accessed on 13 April 2014.
Longman 2001. Dictionary of contemporary English. Third edition. Pearson Ed-ucation Limited.
MC-Info Oy 2014. Lappeenrannan lentoliikenteen taloudelliset vaikutukset seudulle. Tiivistelmä tutkimustuloksista 10.4.2014. Available: http://www.businessinnovations.fi/news/Lappeenrannan-lentoliikenteen-taloudelliset-vaikutukset-seudulle/cwmtb5st/0ee1a9ea-e829-4bce-878f-9dbbbce83ff5. Accessed on 17 May 2014.
Mikkeli City Airport 2012. Annual report 2012. Not publicly available.
Ministry of Transport and Communications 2014. Liikenne- ja viestintäminis-teriö. EU:n uudet lentoasemien valtiontuen suuntaviivat. Uutinen 21.02.2014. Available on: http://www.lvm.fi/uutinen/4387154/eu-n-uudet-lentoasemien-valtiontuen-suuntaviivat. Accessed on 18 May 2014.
Ministry of Transport and Communications 2013a. Drafting of the air transport strategy continues. Press release on 18.12.2013. Available on: http://www.lvm.fi/pressreleases/4375598/drafting-of-the-air-transport-strategy-continues. Accessed on 25 January 2014.

92
Ministry of Transport and Communications 2013b. Finland`s network of airports examined and assessed. Press release on 23.01.2013 Available on: http://www.lvm.fi/pressreleases/4137766/finland-s-network-of-airports-examined-and-assessed. Accessed on 25 January 2014.
Ministry of Transport and Communications 2013c. Air transport strategy. Interim report on 17.12.2013. Available on: http://www.lvm.fi/web/hanke/lentoliikennestrategia. Accessed on 17 April 2014.
Ministry of Transport and Communications 2013d. Liikenne- ja viestintäminis-teriö. Lentoliikennestrategia – missä valmistelussa mennään? Liikenneneuvos Lassi Hilska, Liikenne- ja viestintäministeriö. Esitys Itä-Suomen liikennejärjest-elmäpäiväivillä 30.10.2013 Kuopiossa. Available on: http://www.pohjois-savo.fi/fi/psl/seminaarit/liik_jarj_paivat2013.php. Accessed on 17 April 2014.
Ministry of Transport and Communications 2013e. Liikenne- ja viestintäminis-teriö. Lentoliikenteen vaikutus ilmailualaan ja –teollisuuteen. Esitys. Johtava asiantuntija Hilska Lassi, Liikenne- ja viestintäministeriö. Esitys Suomen il-mailualan ja –teollisuuden näkymät –seminaarissa 21.5.2013 Vantaalla. Availa-ble on: http://vantaainnovation.fi/assets/Uploads/ilmailu/9-HILSKA.pdf. Ac-cessed on 17 April 2014.
Ministry of Transport and Communications 2012. Competitiveness and well-being through responsible transport. Government Report on Transport Policy submitted to the Parliament of Finland 2012. Available on: http://www.lvm.fi/docs/en/1986563_DLFE-16973.pdf Accessed on 25 January 2014.
OECD 2011. The Organisation for Economic Co-operation and Development. Better Life Index. Russian Federation. Available on: http://www.oecd betterlifeindex.org/countries/russian-federation/. Accessed on: 15 May 2014.
Oum, Tae Hoon & Yu, Chunyan & Fu, Xiaowen 2003. A comparative analysis of productivity performance of the world`s major airports: summary report of the ATRS global airport benchmarking research report – 2002. Journal of Air Transport Management 9 (2003), pp. 285–297.
Oxford Economics 2011. Finland Country Report. Economic Benefits from Air Transport in Finland. Available on: http://www.benefitsofaviation.aero/ Documents/Benefits-of-Aviation-Finland-2011.pdf. Accessed on 16 April 2014.
Paananen, Juha-Pekka 2014a. Mikkeli City airport. Cooperation proposition for City of Mikkeli, presentation on 18 February 2014. Not publicly available.
Paananen, Juha-Pekka 2014b. About Mikkeli City airport. E-mail on 8 May 2014. Not publicly available.
Patterson, James G. 1996. Benchmarking basics. Looking for a Better Way. Crisp Publications.
Raivio, Jyri 2013. Kotimaan lentoliikenne: Raportissa karkeita virheitä ja outoja väitteitä. Suomen Kuvalehti 19.12.2013. Available on:

93
http://suomenkuvalehti.fi/jutut/kotimaa/ministerion-lentoliikennestrategia-vilisee-virheita/. Accessed on 17 April 2014.
Rauhamäki, Harri & Mäntynen, Jorma & Mäkelä, Tommi & Sinisalo, Essi & Kalenoja Hanna 2006. Lentoliikenne ja lentoasemat. Opetusmoniste 40. Tam-pereen teknillinen yliopisto. Liikenne- ja kuljetustekniikan laitos. Tampere.
Silvennoinen, Sakari 2014a. About Mikkeli City airport. Passenger figures. E-mail on 2 April 2014. Not publicly available.
Silvennoinen, Sakari 2014b. About Mikkeli City airport. Passenger figures. E-mail on 10 June 2014. Not publicly available.
Statistics Finland 2014a. Official Statistics of Finland. Transport and Tourism 2014. Finnish Travel 2013. Finns´ travel to Central Europe increased in 2013. Available on: http://tilastokeskus.fi/til/smat/2013/smat_2013_2014-04-10_en.pdf. Accessed on 21 April 2014.
Statistics of Finland 2014b. Official Statistics of Finland. Tilastokeskus. Tilastot. Palkat ja työvoimakustannukset. Kuntasektorin palkat. 2013. Johtajilla ja lääkäreillä on kuntasektorin korkeimmat palkat. Available on: http://www.stat.fi/til/ksp/2013/ksp_2013_2014-05-07_tie_001_fi.html. Accessed on 9 May 2014.
Statistics Finland 2013. Official Statistics of Finland. Tilastokeskus. Tilastot, Palkat ja työvoimakustannukset. Yksityisen sektorin kuukausipalkat. 2012. Yksityisen sektorin kuukausipalkkaisten säännöllisen työajan ansio oli 3 428 euroa lokakuussa 2012. Available on: http://tilastokeskus.fi/til /yskp/2012/yskp_2012_2013-08-30_tie_001_fi.html. Accessed on 9 May 2014.
Statistics Finland 2012. Official Statistics of Finland. Transport and Tourism 2012. Transport and Communications Statistical Yearbook of Finland 2012. Available on: http://www.stat.fi/tup/julkaisut/tiedostot/julkaisuluettelo/ ylii_lii_201200_2012_8307_net.pdf. Accessed on 16 April 2014.
Statistics Sweden 2013. Official Statistics of Sweden. Statistiska centralbyrån. Befolkningsstatistik. Folkmöngd i riket, län och kommuner 31 december 2013 ock befolkningsförändringar 2013. Available on: http://www.scb.se/sv_/Hitta-statistik/Statistik-efter-amne/Befolkning/Befolkningens-sammansattning/ Befolkningsstatistik/25788/25795/Helarsstatistik---Kommun-lan-och-riket /370301/. Accessed on 17 September 2014.
Stockholm Skavsta Airport 2014a. About Stockholm Skavsta airport. Corporate information. Available on: http://www.skavsta.se/en/ content/8/141/corporate-information.html. Accessed on 2 March 2014.
Stockholm Skavsta Airport 2014b. About Stockholm Skavsta airport. News & Media. Available on: http://www.skavsta.se/en/content/8/142/news---media.html. Accessed on 3 March 2014.
94
Stockholm Skavsta Airport 2014c. About Stockholm Skavsta airport. Route Map. Available on: http://www.skavsta.se/en/content/4/97/route-map.html Accessed on 3 March 2014.
Stockholm Skavsta Airport 2014d. In the terminal. Terminal map. Available on: http://www.skavsta.se/en/terminal/. Accessed on 8 May 2014.
Swedish Transport Agency 2014a. Transportstyrelsen. Flygplatsstatistik. Avail-able on: https://www.transportstyrelsen.se/sv/Luftfart/Statistik/ Flygplatsstatistik-/. Accessed on 2 March 2014.
Swedish Transport Agency 2014b. Transportstyrelsen. Svenska flygplatser. Available on: https://www.transportstyrelsen.se/sv/Luftfart/Flygplatser-och-flygtrafiktjanst/Svenska-flygplatser1/. Accessed on 2 March 2014.
TAK Oy 2011. Tutkimus- ja Analysointikeskus. Lentoliikenteen matkustajatutki-mus 2011. Lappeenrannan kaupunginhallituksen tulevaisuusjaosto 16.08.2011 § 26, Lappeenrannan kaupunginhallitus 22.08.2011 § 384, Lappeenrannan kaupunginvaltuusto 29.08.2011 § 126. Available on: http://kokoushallinta.lappeenranta.fi/dynastyweb/cgi/DREQUEST.PHP?page=meeting_frames. Accessed on 17 May 2014.
TRAFI 2014. Finnish Transport Safety Agency. Liikenteen turvallisuusvirasto. Lentopaikat. Available on: http:// www.trafi.fi/ilmailu/organisaatioluvat/lentopaikat. Accessed on 13 April 2014.
TRAFI 2013. Finnish Transport Safety Agency. Aviation. Available on: http://www.trafi.fi/en/aviation. Accessed on 13 April 2014.
TRAFI 2012. Finnish Transport Safety Agency. Liikenteen turvallisuusvirasto. Suomen lentoliikenne vuoteen 2025 – neljä skenaariota. Tekijöinä Aalto Elisa, Pöllänen Markus, Mäntynen Jorma, Mäkelä Tommi, Rauhamäki Harri. Liikenteen tutkimuskeskus Verne, Tampereen teknillinen yliopisto. Liikenteen turvallisuusvirasto. Trafin julkaisuja 12/2012. Available on: http://www.trafi.fi/palvelut/julkaisut/2012_julkaisut/ suomenlentoliikenne. Accessed on 13 April 2014.
Vogel, Hans-Arthur 2004. Airport privatisation and performance. PhD thesis, University of Westminster, School of Architecture and the Built Environment. Available on: http://www.westminster.ac.uk/westminsterresearch. Accessed on 4 February 2014.
Vogel, Hans-Arthur & Graham, Anne 2010. A driver-based approach to airport valuation. Journal of Air Transport Studies. Vol. 1 (1), pp. 20–47.
Worlds Airport Codes 2014a. Mikkeli City airport. Available on: http://www.world-airport-codes.com/finland/mikkeli-4712.html Accessed on 2 March 2014.
Worlds Airport Codes 2014b. Stockholm Skavsta airport. Available on: http://www.world-airport-codes.com/sweden/skavsta-5372.html Accessed on 2 March 2014.

95
Worlds Tourism Organisation and European Travel Commission 2009. The Russian Outbound Travel Market with Special Insight into the Image of Europe as a Destination. Worlds Tourism Organisation and European Travel Commis-sion.
Related Documents


