Airbus A319 Database from Dedicated Flyover Measurements to Investigate Noise Abatement Procedures S. Gu´ erin * , U. Michel † , H. Siller ‡ , German Aerospace Center (DLR), Institute of Propulsion Technology , Berlin U. Finke § , University of Hannover, Institute for Meteorology and Climatology, Hannover, Germany G. Saueressig ¶ Lufthansa German Airlines, Frankfurt/Main, Germany A series of flyover noise tests on the Airbus A319 performed in the framework of the German project ”Noise Optimized Approach and Departure Procedures (LAnAb)” took place at Parchim airport (Germany) in June 2004. A noise database was created that will be a support for the validation of aircraft noise prediction models dedicated to investigate noise abatement procedures. In all, 37 take-off and 82 approach conditions were simulated. Depending on the simulated flight phase, different values of engine power, airspeed, position of the high-lift devices, and also of the landing gears were tested. The aim of this paper is to show the different possibilities of using the signals recorded by a phased-array of microphones installed on the ground to analyse aircraft noise and confront some prediction models to the results. I. Introduction A modification of the approach and departure procedures of in-service aircraft is considered to yield a substantial noise reduction in the vicinity of airports, which can be achieved rapidly after implementation without having to wait for the introduction of new and quieter aircraft. The comparison between the various approach and departure procedures is generally performed on the basis of predictions. The validity of the conclusions depends on the accuracy of the noise models applied. But the research community does not always have them available. A national research program was launched in Germany (LAnAb, co-financed by the German Federal Ministry of Education and Research), a program that includes the gathering of the required noise data for a typical aircraft. The data were acquired during a campaign of flyover noise measurements carried out in June 2004 in Parchim (Germany) with a Lufthansa Airbus A319 powered by two CFM56-5A5 engines. A noise database for all configurations in which the aircraft is flown during approach and during take-off was created with the objective to assess noise prediction models. Each aircraft configuration was generally tested for three different airspeeds and for four engine powers including flight idle. In all, 119 flyovers representing 30 different flight situations were performed. The sound field was measured by a phased-array of 168 microphones installed on the ground underneath the flight path and 36 other microphones distributed at various sideline angles. GPS positions of the aircraft and weather conditions were also recorded. Two kinds of results were produced. With the phased-array, the dominant sound sources were localized on the aircraft and their absolute levels were individually estimated as far as this * Research Scientist, [email protected], M¨ uller-Breslau-Str. 8, 10623 Berlin, Germany. † Senior Scientist, [email protected], M¨ uller-Breslau-Str. 8, 10623 Berlin, Germany, AIAA member. ‡ Research Scientist, [email protected], M¨ uller-Breslau-Str. 8, 10623 Berlin, Germany. § Research Scientist, fi[email protected]. ¶ Manager Environmental Concepts, [email protected]. 1 of 14 American Institute of Aeronautics and Astronautics 11th AIAA/CEAS Aeroacoustics Conference (26th AIAA Aeroacoustics Conference) 23 - 25 May 2005, Monterey, California AIAA 2005-2981 Copyright © 2005 by the author(s). Published by the American Institute of Aeronautics and Astronautics, Inc., with permission.

Welcome message from author
This document is posted to help you gain knowledge. Please leave a comment to let me know what you think about it! Share it to your friends and learn new things together.
Transcript

Airbus A319 Database
from Dedicated Flyover Measurements
to Investigate Noise Abatement Procedures
S. Guerin∗, U. Michel†, H. Siller‡,
German Aerospace Center (DLR), Institute of Propulsion Technology , Berlin
U. Finke§,
University of Hannover, Institute for Meteorology and Climatology, Hannover, Germany
G. Saueressig ¶
Lufthansa German Airlines, Frankfurt/Main, Germany
A series of flyover noise tests on the Airbus A319 performed in the framework of theGerman project ”Noise Optimized Approach and Departure Procedures (LAnAb)” tookplace at Parchim airport (Germany) in June 2004. A noise database was created that willbe a support for the validation of aircraft noise prediction models dedicated to investigatenoise abatement procedures. In all, 37 take-off and 82 approach conditions were simulated.Depending on the simulated flight phase, different values of engine power, airspeed, positionof the high-lift devices, and also of the landing gears were tested. The aim of this paperis to show the different possibilities of using the signals recorded by a phased-array ofmicrophones installed on the ground to analyse aircraft noise and confront some predictionmodels to the results.
I. Introduction
A modification of the approach and departure procedures of in-service aircraft is considered to yield asubstantial noise reduction in the vicinity of airports, which can be achieved rapidly after implementationwithout having to wait for the introduction of new and quieter aircraft. The comparison between the variousapproach and departure procedures is generally performed on the basis of predictions. The validity of theconclusions depends on the accuracy of the noise models applied. But the research community does notalways have them available. A national research program was launched in Germany (LAnAb, co-financedby the German Federal Ministry of Education and Research), a program that includes the gathering ofthe required noise data for a typical aircraft. The data were acquired during a campaign of flyover noisemeasurements carried out in June 2004 in Parchim (Germany) with a Lufthansa Airbus A319 poweredby two CFM56-5A5 engines. A noise database for all configurations in which the aircraft is flown duringapproach and during take-off was created with the objective to assess noise prediction models. Each aircraftconfiguration was generally tested for three different airspeeds and for four engine powers including flightidle. In all, 119 flyovers representing 30 different flight situations were performed. The sound field wasmeasured by a phased-array of 168 microphones installed on the ground underneath the flight path and36 other microphones distributed at various sideline angles. GPS positions of the aircraft and weatherconditions were also recorded. Two kinds of results were produced. With the phased-array, the dominantsound sources were localized on the aircraft and their absolute levels were individually estimated as far as this
∗Research Scientist, [email protected], Muller-Breslau-Str. 8, 10623 Berlin, Germany.†Senior Scientist, [email protected], Muller-Breslau-Str. 8, 10623 Berlin, Germany, AIAA member.‡Research Scientist, [email protected], Muller-Breslau-Str. 8, 10623 Berlin, Germany.§Research Scientist, [email protected].¶Manager Environmental Concepts, [email protected].
1 of 14
American Institute of Aeronautics and Astronautics
11th AIAA/CEAS Aeroacoustics Conference (26th AIAA Aeroacoustics Conference)23 - 25 May 2005, Monterey, California
AIAA 2005-2981
Copyright © 2005 by the author(s). Published by the American Institute of Aeronautics and Astronautics, Inc., with permission.
is possible. The signals of the same microphones and of the 36 sparse microphonesa were used to calculateensemble-averaged dedopplerized spectra describing the sound intensity emitted by the aircraft for emissionangles θ from 24 deg to 156 deg relative to the flight direction with an increment of 4 deg. The present paperalso shows how these spectra were processed to separate broadband noise from tones, and how the databasecan help to compute by interpolation or extrapolation the noise emission for many other combinations ofairspeed and engine speed. The same database was used to assess the validity of some prediction models.Some results are reported here.
II. Description of Experiments
In all, 30 different flight situations were investigated including take-off, hold, and final descent. Two dayswere necessary to complete the 119 flyovers. For every flight configuration, a first set of three measurementsat typical flight speed and engine power was done. Then we proceeded with some additional noise records atdifferent values of engine speed and airspeed so that their influence on the noise emission can be analyzed.Depending on the flight situations, the flaps and slats were extended at a different angle (referred as ECAMposition), the airbrake spoilers were deployed or not, and the landing gears were up or down. Table 1 showsthe flap and slat positions of the different ECAM settings.
Table 1. Conversion of the various ECAM positions in angles of extension of the slats/flaps.
Configuration slats flaps
deg deg
ECAM 1 18 0
ECAM 1+F 18 10
ECAM 2 22 15
ECAM 3 22 20
ECAM FULL 27 40
Table 2 shows the several test points performed for the descent approach with the high-lift devices set toECAM 2 position.
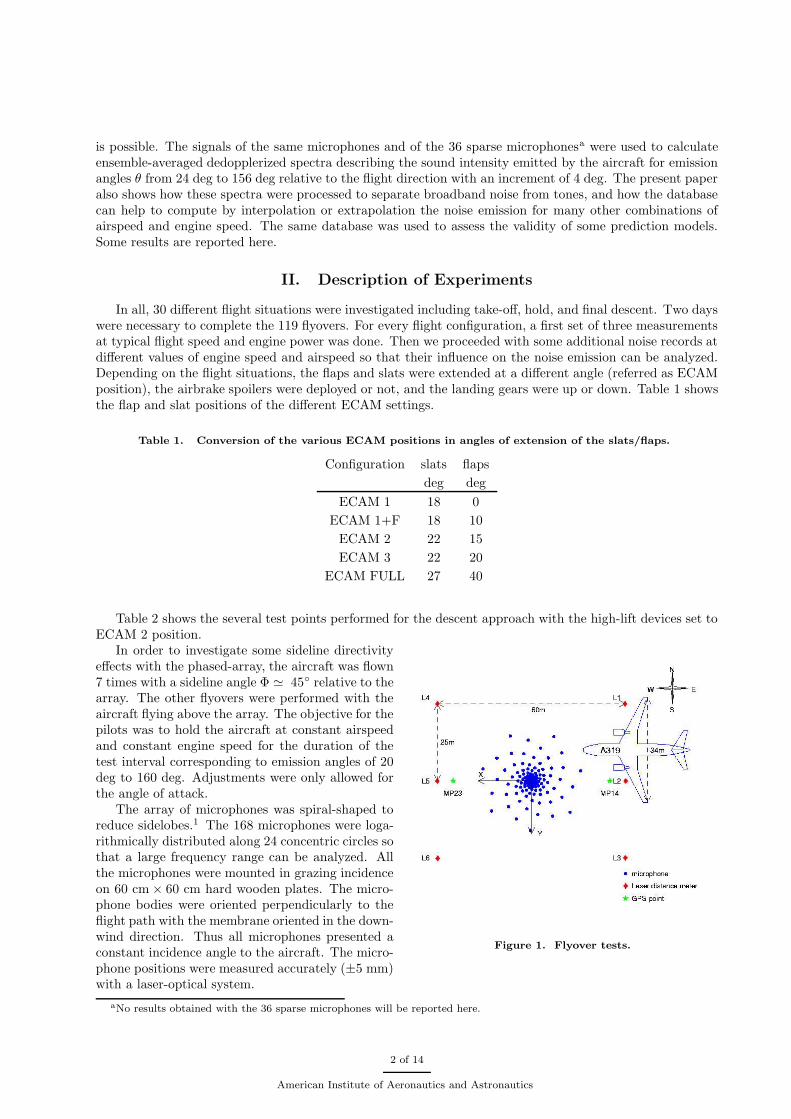
Figure 1. Flyover tests.
In order to investigate some sideline directivityeffects with the phased-array, the aircraft was flown7 times with a sideline angle Φ ' 45◦ relative to thearray. The other flyovers were performed with theaircraft flying above the array. The objective for thepilots was to hold the aircraft at constant airspeedand constant engine speed for the duration of thetest interval corresponding to emission angles of 20deg to 160 deg. Adjustments were only allowed forthe angle of attack.
The array of microphones was spiral-shaped toreduce sidelobes.1 The 168 microphones were loga-rithmically distributed along 24 concentric circles sothat a large frequency range can be analyzed. Allthe microphones were mounted in grazing incidenceon 60 cm × 60 cm hard wooden plates. The micro-phone bodies were oriented perpendicularly to theflight path with the membrane oriented in the down-wind direction. Thus all microphones presented aconstant incidence angle to the aircraft. The micro-phone positions were measured accurately (±5 mm)with a laser-optical system.
aNo results obtained with the 36 sparse microphones will be reported here.
2 of 14
American Institute of Aeronautics and Astronautics

Table 2. Summary of flight parameters at θ = 90 deg descent approach with slats/flaps in ECAM 2 position.
Flight Conf. N1a spoiler z0 b Φ c Uxd Uzd U d climb e pitch e aoa e
% m deg m/s m/s m/s deg deg deg
58 24 30.6 no 210.0 -3.7 88.3 -4.4 88.4 -2.9 -0.4 3.3
59 24 30.6 no 191.4 -0.6 87.8 -5.4 88.0 -3.5 0.5 3.4
60 24 30.4 no 219.0 3.1 85.5 -4.9 85.6 -3.3 -0.1 3.5
61 25 31.3 no 177.2 2.3 97.0 -5.9 97.2 -3.5 -1.6 1.1
62 25 31.2 no 198.9 -2.3 94.7 -6.9 95.0 -4.2 -2.1 1.5
63 26 30.5 full 221.2 1.0 84.4 -9.6 84.9 -6.5 -0.2 5.0
64 26 30.4 full 162.2 -4.2 84.1 -7.1 84.4 -4.8 1.4 5.3
65 27 54.9 no 220.6 3.0 91.0 -2.6 91.0 -1.6 2.0 3.9
66 27 54.6 no 258.8 0.2 89.5 -2.0 89.5 -1.3 2.1 3.6
66b 27 55.3 no 241.9 3.4 93.6 -1.8 93.6 -1.1 2.6 3.7
67 28 60.0 no 204.4 2.5 84.9 0.9 84.9 0.6 4.8 4.2
68 28 60.0 no 194.4 2.9 85.4 0.8 85.4 0.5 4.8 3.9
69 29 64.9 no 200.0 -1.4 85.6 0.2 85.6 0.1 4.1 4.0
70 29 64.9 no 206.2 1.0 86.9 2.2 86.9 1.5 4.9 3.9
a Fan speed given in percent of the reference shaft speed of 5000 rpm of the low-pressure spool.b Altitude above the array.c Sideline angle relative to the array center.d Components of aircraft speeds.e Angles of motion (”aoa” for angle of attack).
The microphones were electret-type 1/4” KE4 Sennheiser microphones. The response amplitude andphase of these microphones measured relative to B&K microphones show that they are accurate enoughwithin the frequency range of interest. The microphones were daily calibrated.
The data acquisition system could record up to 256 channels with a resolution of 24 bits and a highsignal-to-noise ratio. The acquisition sampling frequency and the time of recording were fixed respectivelyto 48192 Hz and 16 s. Tones should slightly suffer from the signal resampling at high frequencies.2 Thusthe amplitude of the third and the following BPF tones emitted by the engine may be truncated at highpower-settings. When necessary the signal were low-pass filtered.
The aircraft noise is investigated within the range of emission angle θ ∈ [24 − 156 deg]. The A319aircraft was equipped on-board with two flight data recorders. The ground data were synchronized to theaircraft data via the recording of the UTC time. The GPS positions recorded on-board the aircraft were notdifferential GPS positions as usually required for such measurements. Therefore the positioning had to beimproved with ground-based equipment, which consisted of a group of six laser distance meters installed onthe ground, and of two calibrated cameras pointing vertically into the sky (see Figure 1). After reduction ofthe data, only four flyovers show a discrepancy larger than 10 m between the two methods of measurementfrom the ground. On the other hand, the GPS positions appeared to be more inaccurate. The otherparameters required (speeds and angles of motion) were found in the data measured on-board. An excellentagreement of ±4 m/s is found for the ground speed and ±2 m/s for the climb speed with the data measuredby the laser distance meters.
The Institute for Meteorology and Climatology of Hannover University recorded some relevant mete-orological parameters with a mast and weather balloons during the flyover measurements. Temperature(measured with ±1 K accuracy), humidity (±4 %), atmospheric pressure were needed to remove the effectof atmospheric attenuation. Wind profiles (±2 m/s) were also measured. The data obtained on day 1 and 2indicate a very low wind level in agreement with the values recorded by the aircraft (the mean wind speednever exceeded 10 m/s below 200 m). One can consider that the tests were done under very good weatherconditions.
3 of 14
American Institute of Aeronautics and Astronautics
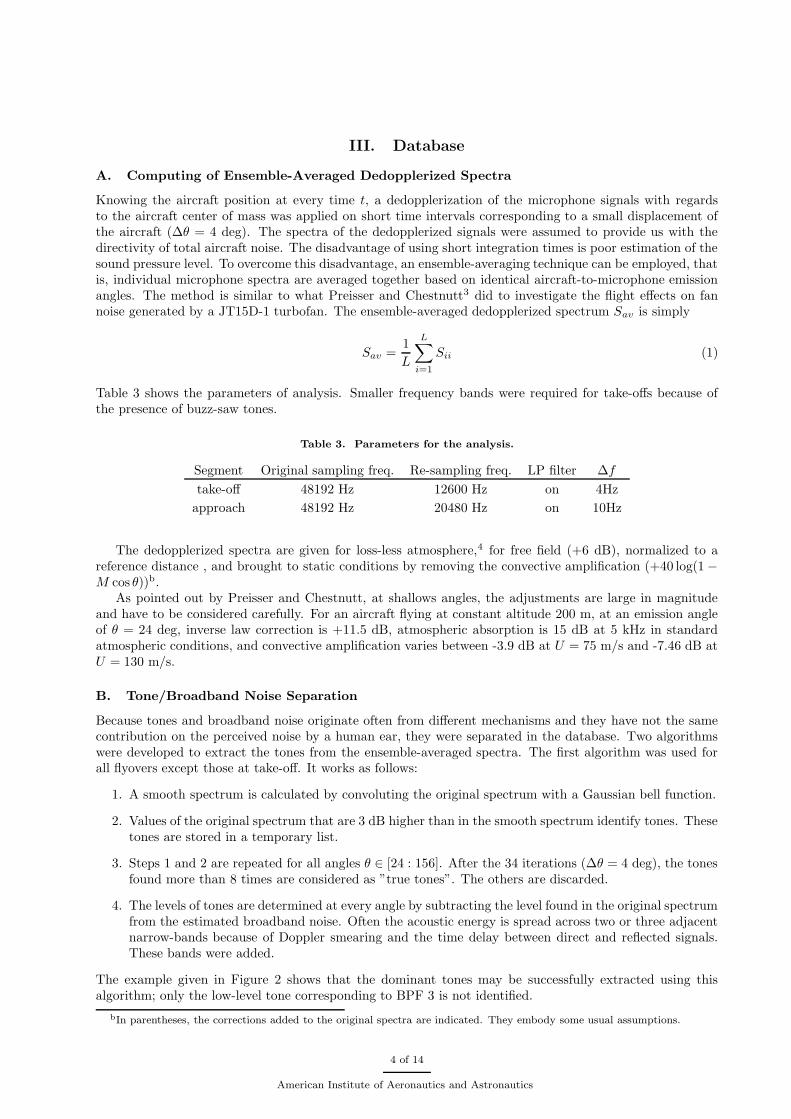
III. Database
A. Computing of Ensemble-Averaged Dedopplerized Spectra
Knowing the aircraft position at every time t, a dedopplerization of the microphone signals with regardsto the aircraft center of mass was applied on short time intervals corresponding to a small displacement ofthe aircraft (∆θ = 4 deg). The spectra of the dedopplerized signals were assumed to provide us with thedirectivity of total aircraft noise. The disadvantage of using short integration times is poor estimation of thesound pressure level. To overcome this disadvantage, an ensemble-averaging technique can be employed, thatis, individual microphone spectra are averaged together based on identical aircraft-to-microphone emissionangles. The method is similar to what Preisser and Chestnutt3 did to investigate the flight effects on fannoise generated by a JT15D-1 turbofan. The ensemble-averaged dedopplerized spectrum Sav is simply
Sav =1
L
L∑
i=1
Sii (1)
Table 3 shows the parameters of analysis. Smaller frequency bands were required for take-offs because ofthe presence of buzz-saw tones.
Table 3. Parameters for the analysis.
Segment Original sampling freq. Re-sampling freq. LP filter ∆f
take-off 48192 Hz 12600 Hz on 4Hz
approach 48192 Hz 20480 Hz on 10Hz
The dedopplerized spectra are given for loss-less atmosphere,4 for free field (+6 dB), normalized to areference distance , and brought to static conditions by removing the convective amplification (+40 log(1−M cos θ))b.
As pointed out by Preisser and Chestnutt, at shallows angles, the adjustments are large in magnitudeand have to be considered carefully. For an aircraft flying at constant altitude 200 m, at an emission angleof θ = 24 deg, inverse law correction is +11.5 dB, atmospheric absorption is 15 dB at 5 kHz in standardatmospheric conditions, and convective amplification varies between -3.9 dB at U = 75 m/s and -7.46 dB atU = 130 m/s.
B. Tone/Broadband Noise Separation
Because tones and broadband noise originate often from different mechanisms and they have not the samecontribution on the perceived noise by a human ear, they were separated in the database. Two algorithmswere developed to extract the tones from the ensemble-averaged spectra. The first algorithm was used forall flyovers except those at take-off. It works as follows:
1. A smooth spectrum is calculated by convoluting the original spectrum with a Gaussian bell function.
2. Values of the original spectrum that are 3 dB higher than in the smooth spectrum identify tones. Thesetones are stored in a temporary list.
3. Steps 1 and 2 are repeated for all angles θ ∈ [24 : 156]. After the 34 iterations (∆θ = 4 deg), the tonesfound more than 8 times are considered as ”true tones”. The others are discarded.
4. The levels of tones are determined at every angle by subtracting the level found in the original spectrumfrom the estimated broadband noise. Often the acoustic energy is spread across two or three adjacentnarrow-bands because of Doppler smearing and the time delay between direct and reflected signals.These bands were added.
The example given in Figure 2 shows that the dominant tones may be successfully extracted using thisalgorithm; only the low-level tone corresponding to BPF 3 is not identified.
bIn parentheses, the corrections added to the original spectra are indicated. They embody some usual assumptions.
4 of 14
American Institute of Aeronautics and Astronautics

Figure 2. Example of automatic broadband noise/tone separation (first algorithm).
During take-off, buzz-saw noise is dominant in the forward arc. The spectra contain many tones that aremultiples of the shaft frequency. Thus it is known a priori where the tones are. The algorithm used in thiscase to separate tones from the broadband noise works as followsc:
1. A precise value of the shaft frequency is determined using the N1 parameter given by the flight datarecorders.
2. The levels of the engine order tones are determined by subtracting the level found in the originalspectrum from the estimated broadband noise. When the level of one tone is not higher than thebroadband noise, its value is put to zero.
3. steps 1 and 2 are repeated for all angles θ ∈ [24 : 156 deg], ∆θ = 4 deg.
C. Database Inter- and Extrapolation
An attempt to interpolate and extrapolate the database is described here. Only the case of broadband noiseis treated here. The broadband noise is produced by the airframe and the engines,
p2 = Sengine + Sairframe (2)
Engine- and airframe-generated sources have multiple origins:
Sengine = sjet + sfan + sturbine + scombustion + etc. (3)
Sairframe = sclean + sLG + sslats + sflaps + sspoiliers + etc. (4)
If all the different sources are assumed to not being correlated and also not interacting, then the pressuremeasured by each microphone is the sum of all the individual sources. Now, the pressure emitted by all thesources is assumed to vary with speed U as follows,
p2 = βUm (5)
Here two speeds are considered: the flight speed on which depends airframe noise and the fan speed whichis assumed here to be the only relevant speed to consider for engine noise. It can be demonstrated indeedthat the expected variations of aircraft speed have only a little impact on engine noise.
Furthermore, we will assume that equation (5) is valid at Strouhal constant,
St =fd
U(6)
cOther tones than engine order tones were not sought.
5 of 14
American Institute of Aeronautics and Astronautics

where f is the frequency, d a geometrical dimension and U the speed. Combining equation (5) and (6), itfollows for one source,
p2(ω) =
(U
U0
)mp2
0(ωU0
U) (7)
The index ”0 ” refers to some known values (measurements for instance). If the speed parameter for enginenoise is assumed to be proportional to the fan speed N , and only one source for engine and another forairframe is considered, then
p2(ω) = α
(U
U0
)mp2
0(ωU0
U) + (1− α)
(N
N0
)np2
0(ωN0
N) (8)
The parameter α accounts for the ratio of airframe noise to total noise. For simplicity, it does not dependon Strouhal number St. Despite of containing rough approximations, Eq. (8) can be used to interpolatesuccessfully the data contained in the database and extrapolate the data providing the parameters are varyingmoderately from the measured ones (see Figure 3).
IV. Localization of Acoustic Sources by Beamforming
Phased-arrays of microphones are efficient tools to generate acoustic images of an aircraft.5, 2 This isan useful support to interprete quantitatively the measurements on the ground. They also can be used toestimate quantitatively the level of the individual sources as explained in section V.B.2 under the conditionthat the acoustic images provided by beamforming have a good resolution. Some ”advanced” beamformingalgorithms are available in the frequency-domain for non-moving sources1, 6 to improve the resolution byminimizing the width of the main lobe and/or by reducing the level of the sidelobes. But source motion isresponsible for a Doppler frequency shift that is not possible to take into account simply in the frequencydomain. Therefore in problems dealing with moving sources, the data are beamformed more easily in thetime domain. The simple formulation for beamforming in the time domain is
p(t) =L∑
i=1
wipi(t+ ri/c0) (9)
where pi are the dedopplerized microphone signals at emission time t, ri the distance source-microphone atemission time t, wi a weighting factor, L the number of microphones and co the sound speed. The spectrumis given by
p2(fk) =
L∑
i=1
L∑
j=1
< wiX ∗i (fk)Xj(fk)wj > (10)
where Xi are the Fourier transforms of the dedopplerized signal pi. In the frequency domain it is com-mon to delete the diagonal of the cross-spectral matrix in order to remove microphone self-noise from the
102
103
70
75
80
85
90
95
100
SP
L [d
B]
one−third octave band [Hz]
F17; 96.7 m/s; 85.3 % F18; 96 m/s; 84.7 % F19; 96.7 m/s; 85.15 %F20; 97.9 m/s; 94.2 % F21; 98.5 m/s; 94.3 % F23; 99.8 m/s; 85.2 % F23b; 104 m/s; 86.5 % Sim; 96 m/s; 100 % Sim; 96 m/s; 76 %
102
103
55
60
65
70
75
80
85
90
SP
L [d
B]
one−third octave band [Hz]
F84; 109.5 m/s; 24.5 % F85; 109.2 m/s; 24.45 % F84b; 109.3 m/s; 24.6 % F84c; 111.3 m/s; 24.65 %F86; 129.7 m/s; 26.7 % F87; 132.9 m/s; 28.7 % F86b; 130.3 m/s; 27.6 % Sim; 90 m/s; 26 % Sim; 150 m/s; 26 %
Figure 3. Example of extrapolation of take-off noise (θ = 120 deg) and landing gear noise (θ = 90 deg).
6 of 14
American Institute of Aeronautics and Astronautics

computation.7 This method can be easily applied to the time domain as follows,
p2(fk) =L∑
i=1
L∑
j=1
< wiX ∗i (fk)Xj(fk)wj > −L∑
i=1
< wiX ∗i (fk)Xi(fk)wi >
= p2(fk)−L∑
i=1
w2i Sii(fk)
(11)
Unlike to the classical simple formulation, the autospectra Sii(fk) are discarded. Negative values may beobtained that are non physical and must be therefore put to zero.
The weighting factors wi are used to normalize the sound amplitude to a reference distance of propagationassuming a spherical spreading of the sound wave, to account for the ground reflection and the convectiveamplification due to source motion, and to improve the acoustic map resolution by changing the effectivemicrophone distribution. The sound attenuation by the atmosphere has to be considered in the frequencydomain.
-10 0 10
-10
0
10
max. level: 69.0 [dB]-10 0 10
-10
0
10
max. level: 62.0 [dB]
No weighting With weighting
Figure 4. Aircraft acoustic images showing the benefit of weighting (TOB=1 kHz, scanning mesh 1 m× 1 m).
Compared to a regular array of microphones, the logarithmic distribution in spiral is equivalent toreducing the effective array diameter. Indeed the microphone density is higher near the array center where alot of microphones are concentrated than in the outer part where the microphones are sparsely distributed.This was counter-balanced by applying a weighting factor equal to the square of the distance of microphoneto the array center R2
Oi. However, there are two risks at applying such a factor. First, aliases of the mainlobe appear when the spacing between microphones is larger than half of the sound wavelength projectedonto the ground. Second, at high frequency, the beamwidth of the main lobe may become smaller than thescanning resolution; in this case sources may not be detected. Therefore, it is necessary to remove the outermicrophones for high frequencies.
Moreover errors in the estimation of the aircraft position, turbulence scattering in the atmosphere increasethe loss of coherence between two microphone signalsd. This loss of coherence increases with microphonespacing and frequency. Theoretically the incoherence of the sources would produce a zero in the off-diagonalterms of equation (10). But when a small number of blocks of FFT points is used (from 1 to 4), it may benevertheless beneficial to avoid to sum up the microphones signal with very low coherence.
Thus the initial shading function R2Oi was multiplied by a spatial window, frequency dependent, in order
to discard progressively the outer microphones when the frequency increases. Some coherence calculationsbetween microphones having different distances of separation leads to support the idea that the coherenceevolution can be modeled with a Butterworth window function
γ2 '√√√√
1
1 +(ffs
)2n (12)
dThe other causes of coherence loss are: presence of several sources, signal resampling, contaminated measurements byadditional sources (wind noise, electronic noise), non-linearities, etc.
7 of 14
American Institute of Aeronautics and Astronautics

whose order n and threshold frequency fs are functions of the microphone spacing. The calculation hasinvolved several flights for which the flyover altitudes and the meteorological conditions were different. Thedistance aircraft-array seems to play only a second order role which would tend to indicate that the effect ofatmosphere is not the predominant effect in coherence loss. The two following equations have been derivedto model the evolution of γ2
fs = 350 +630
Rij(13)
n = − 1
1 + 0.75R2ij
+ 2 (14)
where Rij is the spacing between microphones. The constant 350 in equation (13) should be zero becausewhen the microphone separation tends to infinity the coherence should tend to zero. However the data fitbetter with an offset therefore it was introduced.
Thus, the final weight to apply to a microphone signal was found by evaluating the following expression:
wi ≡ wi(f) = R2Oi
L∑
j=1,j 6=iH(γ2
ij − γ2s )/
L∑
i=1
wi(f) (15)
Here H is the Heaviside function, γ2ij the coherence between microphone i and j calculated with equation
(12) and γ2s a threshold. Equation (15) means that a microphone whose estimated coherence with all other
microphones is above the threshold value will have a maximum weight of R2Oi whereas its weight will be
zero in the opposite case. Typically, γs = 0.3. An example of benefit due to the use of weighting is shownin figure 4.
Concerning the detection of spinning tones generated by the turbomachinery,8 they appear not to becentered on the engine axis because beamforming assumes spherical spreading whereas the wavefront arrivestangentially on the ground with a slight y-offset as shown in Figure 5. (The Figure 5b was computed for anengine inlet with the equivalent source method of Holste9 )
-10 0 10
-10
0
10
max. level: 74.8 [dB]
a) b)
Figure 5. a) Detection of spinning modes using beamforming; b) spinning mode radiating from an inlet intofree field.
V. Aircraft Noise Analysis: Some Results
A. Take-off
The influences of the extension angle of the high-lift devices, the engine power settings, the aircraft speedand the sideline angle Φ on noise emission at take-off are investigated in this section. The contribution frombroadband noise and tones is separately analyzed. The ranges θ < 90 deg and θ > 90 deg describe theforward and the rear arcs, respectively.
8 of 14
American Institute of Aeronautics and Astronautics

-10 0 10
-10
0
10
max. level: 74.8 [dB]-10 0 10
-10
0
10
max. level: 72.1 [dB]-10 0 10
-10
0
10
max. level: 72.6 [dB]
θ = 60 deg θ = 90 deg θ = 120 deg
Figure 6. Engine: the dominant sound source during take-off (F3): N1 = 85.2%, TOB=800Hz.
1. Influence of Engine Power, Aircraft Speed, and Sideline Angle
Figure 7 compares the overall sound pressure level OASPL at fan speed N1 = 85% and 94%. The resultswere measured for three different positions of the high-lift devices (ECAM 1+F, 2 and 3). By increasingthe engine power from 85% to 94%, the level is amplified significantly by about 4-5 decibels in the rear arcwhere jet noise dominates but does not increase below 50 deg where buzz-saw tones are strongly generatedas indicated on the plots on the right-hand side. This is true for all studied positions of the high-lift devices.
30 60 90 120 150
80
90
100
emission angle [°]
[dB
]
OASPL
30 60 90 120 150
80
90
100
emission angle [°]
[dB
]
EO tones/bb. noise
30 60 90 120 150
80
90
100
emission angle [°]
[dB
]
OASPL
30 60 90 120 150
80
90
100
emission angle [°]
[dB
]
EO tones/bb. noise
a) N1 influence (ECAM 1+F) b) N1 influence (ECAM 3)
Figure 7. Influence of engine power on sound emission at take-off: a) ECAM 1+F, b) ECAM 3; (blue) 85%,(red) 94%; (�) broadband noise, (?) EO tones.
The influence of speed was limited to variation of 10 m/s. Figure 8a) shows no significant change in thesound level by an increased airspeed. The noise generated by the high-lift devices is enhanced through thespeed increase, but engine noise, which dominates the radiation, is very little influenced by the 10 m/s speedincrease.
30 60 90 120 150
80
90
100
emission angle [°]
[dB
]
OASPL
30 60 90 120 150
80
90
100
emission angle [°]
[dB
]
EO tones/bb. noise
30 60 90 120 150
80
90
100
emission angle [°]
[dB
]
OASPL
30 60 90 120 150
80
90
100
emission angle [°]
[dB
]
EO tones/bb. noise
a) Airspeed influence b) Sideline angle influence
Figure 8. Influence of aircraft speed and sideline angle on sound emission at take-off: a) (blue) ref, (red)ref+10 m/s; b) (blue) Φ ' 0 deg, (red) Φ ' 45 deg; (�) broadband noise, (?) EO tones, ECAM 3.
Several flight tests were conducted off the x-axis of the microphone array to examine the sideline direc-
9 of 14
American Institute of Aeronautics and Astronautics

tivity. Figure 8b) indicates that noise at sideline angle φ = 45 deg is slightly higher than at φ = 0 deg.This may result from the asymetrical radiation characteristics of the sources, some reflection and refractioneffects.
The results for all the simulated take-offs are now plotted together in one-third octave bands from 80 Hzto 5 kHz in Figure 9. The measurements at N1 = 85% are distinguished from those at 94%. Some sidelineeffects (measured at N1 = 85% only) appear above 400 Hz suggesting that it might be necessary to considerthem into models. The influence of the ECAM position is only noticeable at high frequencies. On EO tones(not shown here), only the sideline emission angle seems to have an influence on the intensity of some tones.
50 100 15065
70
75
80
85
90
95TOB=80Hz
SP
L [d
B]
50 100 15065
70
75
80
85
90
95TOB=100Hz
50 100 15060
70
80
90TOB=125Hz
50 100 15065
70
75
80
85
90
95TOB=160Hz
50 100 15060
70
80
90TOB=200Hz
50 100 15060
70
80
90TOB=250Hz
SP
L [d
B]
50 100 15060
70
80
90TOB=315Hz
50 100 15060
70
80
90TOB=400Hz
50 100 15060
70
80
90TOB=500Hz
50 100 15055
60
65
70
75
80
85TOB=630Hz
50 100 15060
70
80
90TOB=800Hz
SP
L [d
B]
50 100 15060
70
80
90TOB=1000Hz
50 100 15060
70
80
90TOB=1250Hz
50 100 15055
60
65
70
75
80
85TOB=1600Hz
50 100 15055
60
65
70
75
80
85TOB=2000Hz
50 100 15060
70
80
90TOB=2500Hz
SP
L [d
B]
θ [°]50 100 150
60
70
80
90TOB=3150Hz
θ [°]50 100 150
60
70
80
90TOB=4000Hz
θ [°]50 100 150
70
80
90
100TOB=5000Hz
θ [°]
50 100 15070
80
90
100TOB=80Hz
SP
L [d
B]
50 100 15070
80
90
100TOB=100Hz
50 100 15070
80
90
100TOB=125Hz
50 100 15070
80
90
100TOB=160Hz
50 100 15065
70
75
80
85
90
95TOB=200Hz
50 100 15065
70
75
80
85
90
95TOB=250Hz
SP
L [d
B]
50 100 15065
70
75
80
85
90
95TOB=315Hz
50 100 15060
70
80
90TOB=400Hz
50 100 15060
70
80
90TOB=500Hz
50 100 15060
70
80
90TOB=630Hz
50 100 15060
70
80
90TOB=800Hz
SP
L [d
B]
50 100 15060
70
80
90TOB=1000Hz
50 100 15060
70
80
90TOB=1250Hz
50 100 15060
70
80
90TOB=1600Hz
50 100 15055
60
65
70
75
80
85TOB=2000Hz
50 100 15060
70
80
90TOB=2500Hz
SP
L [d
B]
θ [°]50 100 150
60
70
80
90TOB=3150Hz
θ [°]50 100 150
60
70
80
90TOB=4000Hz
θ [°]50 100 150
65
70
75
80
85
90
95TOB=5000Hz
θ [°]
85% 94%
Figure 9. One-third-octave band results; (blue) ECAM1+F with U ' 96 − 104 m/s, (green) ECAM 2 withU ' 77− 92 m/s, (red) ECAM 3 with U ' 70− 85 m/s, (black) ECAM 3 sideline.
2. Buzz-saw Noise
Buzz-saw noise is produced when the relative flow speed at the fan’s blade tip exceeds the speed of sound,which happens during take-off.10, 11 Small dissimilarities in the geometry (like in the stagger angle of theblades) create dissimilar shock waves at each blade that propagate with different velocities away from thefan. Thus tones whose frequencies are multiples of the shaft rotation frequency (engine order) are produced.
The nature of this process suggests that the azimuthal order m of the spinning mode is equivalent to theengine order of the tone. In this case, this would signify over the range of operating conditions that onlythe first order radial modes will give a reasonable approximation to the acoustic pressure field because themajority of higher radial modes will be cut-off. Sarin and Rademaker12 measured the distribution of acousticmodes in the engine inlet of a Fokker 100 aircraft in flight with a ring array of microphones and verified theactual validity of this hypothesis. In our case, this hypothesis was evaluated by comparing the data with theanalytical solution describing approximately this problem.13 Some typical results are presented in Figure 10.At N1 = 85%, there is no agreement between theory and data in the forward arc. According to references14,15 acoustic inlet radiation is expected to be shifted by flight to lower angles. However the discrepancy istoo large (varying here from 20 deg to 50 deg) to be explained by motion. At N1 = 94%, a better agreementis found. This might indicate that the assumption is more correct. This kind of results is also verified onengine static tests.
B. Final Descent
In this section, some preliminary results related to the final descent approach with the high-lift devices fullydeployed and the landing gear down are presented. First the influence of engine noise and aircraft speed isdiscussed. Then some preliminary results on landing gear noise and high-lift device noise will be reported.
10 of 14
American Institute of Aeronautics and Astronautics

50 100 15050
60
70
80EO=25
SP
L [d
B]
50 100 15055
60
65
70
75
80
85EO=26
50 100 15055
60
65
70
75
80
85EO=27
50 100 15050
60
70
80EO=28
50 100 15050
60
70
80EO=29
50 100 15050
60
70
80EO=30
SP
L [d
B]
50 100 15050
60
70
80EO=31
50 100 15055
60
65
70
75
80
85EO=32
50 100 15055
60
65
70
75
80
85EO=33
50 100 15050
60
70
80EO=34
50 100 15050
60
70
80EO=35
SP
L [d
B]
50 100 15070
80
90
100EO=36
50 100 15060
70
80
90EO=37
50 100 15050
60
70
80EO=38
50 100 15045
50
55
60
65
70
75EO=39
50 100 15050
60
70
80EO=40
SP
L [d
B]
θ [°]50 100 150
45
50
55
60
65
70
75EO=41
θ [°]50 100 150
55
60
65
70
75
80
85EO=42
θ [°]50 100 150
45
50
55
60
65
70
75EO=43
θ [°]50 100 150
50
60
70
80EO=44
θ [°]
50 100 15050
60
70
80EO=25
SP
L [d
B]
50 100 15050
60
70
80EO=26
50 100 15050
60
70
80EO=27
50 100 15055
60
65
70
75
80
85EO=28
50 100 15050
60
70
80EO=29
50 100 15055
60
65
70
75
80
85EO=30
SP
L [d
B]
50 100 15055
60
65
70
75
80
85EO=31
50 100 15050
60
70
80EO=32
50 100 15055
60
65
70
75
80
85EO=33
50 100 15060
70
80
90EO=34
50 100 15060
70
80
90EO=35
SP
L [d
B]
50 100 15070
80
90
100EO=36
50 100 15055
60
65
70
75
80
85EO=37
50 100 15060
70
80
90EO=38
50 100 15050
60
70
80EO=39
50 100 15050
60
70
80EO=40
SP
L [d
B]
θ [°]50 100 150
45
50
55
60
65
70
75EO=41
θ [°]50 100 150
50
60
70
80EO=42
θ [°]50 100 150
50
60
70
80EO=43
θ [°]50 100 150
50
60
70
80EO=44
θ [°]
85% 94%
Figure 10. Directivity comparison of the measured EO tones with the Homicz and Lordi theory assumingazimuthal order m = EO and radial mode n = 0 (BPF1 = EO 36).
1. Influence of Engine Power and Airspeed
Unlike in the case of take-off, the engine on approach is not the only dominant source of noise. Airframenoise mainly produced by the slats/flaps and the landing gear contributes also strongly to the total noiseemission. Some broadband noise spectra averaged over the repeated tests are presented in Figure 11 forthree different observation angles. The noise emission is enhanced over all the frequency range by increasingthe engine power. However, the enhancement is only of 1 or 2 decibels within the range 200 Hz to 2-3 kHzwhile N1 varies from flight idle (N1 ' 30%) to 49%. This is to compare with the 4-5 dB increase resultingfrom the 10% N1 variation measured at take-off. As it is suggested by the high dependence of the noise levelon airspeed, the airframe noise is the dominant source in this frequency range. Above 3 kHz, the influenceof engine speed is significant. Thus the level is about equally reinforced by increasing N1 from 49% to 59%or the airspeed from 73 m/s to 89 m/s.
102
103
65
70
75
80
SP
L [d
B]
one−third octave band [Hz]
flight idle; U=73m/sN1=49%; U=73m/s N1=54%; U=73m/s N1=59%; U=72m/s flight idle; U=89m/s
102
103
65
70
75
80
SP
L [d
B]
one−third octave band [Hz]
flight idle; U=73m/sN1=49%; U=73m/s N1=54%; U=73m/s N1=59%; U=72m/s flight idle; U=89m/s
102
103
65
70
75
80
SP
L [d
B]
one−third octave band [Hz]
flight idle; U=73m/sN1=49%; U=73m/s N1=54%; U=73m/s N1=59%; U=72m/s flight idle; U=89m/s
a) θ = 60 deg b) θ = 90 deg c) θ = 120 deg
Figure 11. Influence of engine power and airspeed on broadband noise emitted during the final descentapproach (ECAM FULL, landing gear down).
2. Landing Gear Noise
The A319 landing gear is composed of one twin-wheel nose landing gear and two twin-wheel landing gearspositioned under each wing. The results obtained with engines at low power and high-lift devices retractedare shown in Figure 12. The variance of the data is more important at low frequencies because the number
11 of 14
American Institute of Aeronautics and Astronautics
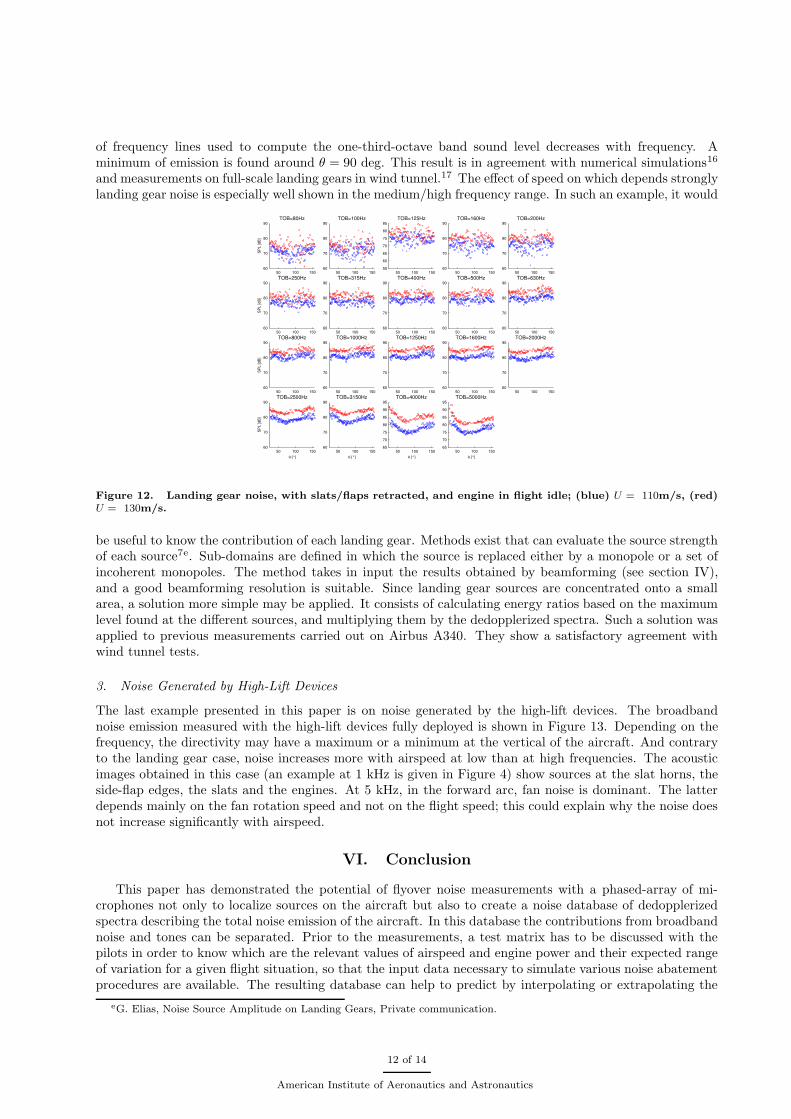
of frequency lines used to compute the one-third-octave band sound level decreases with frequency. Aminimum of emission is found around θ = 90 deg. This result is in agreement with numerical simulations16
and measurements on full-scale landing gears in wind tunnel.17 The effect of speed on which depends stronglylanding gear noise is especially well shown in the medium/high frequency range. In such an example, it would
50 100 15060
70
80
90TOB=80Hz
SP
L [d
B]
50 100 15060
70
80
90TOB=100Hz
50 100 15055
60
65
70
75
80
85TOB=125Hz
50 100 15060
70
80
90TOB=160Hz
50 100 15060
70
80
90TOB=200Hz
50 100 15060
70
80
90TOB=250Hz
SP
L [d
B]
50 100 15060
70
80
90TOB=315Hz
50 100 15060
70
80
90TOB=400Hz
50 100 15060
70
80
90TOB=500Hz
50 100 15060
70
80
90TOB=630Hz
50 100 15060
70
80
90TOB=800Hz
SP
L [d
B]
50 100 15060
70
80
90TOB=1000Hz
50 100 15060
70
80
90TOB=1250Hz
50 100 15060
70
80
90TOB=1600Hz
50 100 15060
70
80
90TOB=2000Hz
50 100 15060
70
80
90TOB=2500Hz
SP
L [d
B]
θ [°]50 100 150
60
70
80
90TOB=3150Hz
θ [°]50 100 150
65
70
75
80
85
90
95TOB=4000Hz
θ [°]50 100 150
65
70
75
80
85
90
95TOB=5000Hz
θ [°]
Figure 12. Landing gear noise, with slats/flaps retracted, and engine in flight idle; (blue) U = 110m/s, (red)U = 130m/s.
be useful to know the contribution of each landing gear. Methods exist that can evaluate the source strengthof each source7e. Sub-domains are defined in which the source is replaced either by a monopole or a set ofincoherent monopoles. The method takes in input the results obtained by beamforming (see section IV),and a good beamforming resolution is suitable. Since landing gear sources are concentrated onto a smallarea, a solution more simple may be applied. It consists of calculating energy ratios based on the maximumlevel found at the different sources, and multiplying them by the dedopplerized spectra. Such a solution wasapplied to previous measurements carried out on Airbus A340. They show a satisfactory agreement withwind tunnel tests.
3. Noise Generated by High-Lift Devices
The last example presented in this paper is on noise generated by the high-lift devices. The broadbandnoise emission measured with the high-lift devices fully deployed is shown in Figure 13. Depending on thefrequency, the directivity may have a maximum or a minimum at the vertical of the aircraft. And contraryto the landing gear case, noise increases more with airspeed at low than at high frequencies. The acousticimages obtained in this case (an example at 1 kHz is given in Figure 4) show sources at the slat horns, theside-flap edges, the slats and the engines. At 5 kHz, in the forward arc, fan noise is dominant. The latterdepends mainly on the fan rotation speed and not on the flight speed; this could explain why the noise doesnot increase significantly with airspeed.
VI. Conclusion
This paper has demonstrated the potential of flyover noise measurements with a phased-array of mi-crophones not only to localize sources on the aircraft but also to create a noise database of dedopplerizedspectra describing the total noise emission of the aircraft. In this database the contributions from broadbandnoise and tones can be separated. Prior to the measurements, a test matrix has to be discussed with thepilots in order to know which are the relevant values of airspeed and engine power and their expected rangeof variation for a given flight situation, so that the input data necessary to simulate various noise abatementprocedures are available. The resulting database can help to predict by interpolating or extrapolating the
eG. Elias, Noise Source Amplitude on Landing Gears, Private communication.
12 of 14
American Institute of Aeronautics and Astronautics

noise at other conditions than those encountered during the tests. The database can also be used to assessthe validity of some noise prediction models. Further work should however be done on the data obtained inthe approach conditions to isolate the contribution of the different sources.
50 100 15055
60
65
70
75
80
85TOB=80Hz
SP
L [d
B]
50 100 15050
60
70
80TOB=100Hz
50 100 15055
60
65
70
75
80
85TOB=125Hz
50 100 15055
60
65
70
75
80
85TOB=160Hz
50 100 15055
60
65
70
75
80
85TOB=200Hz
50 100 15055
60
65
70
75
80
85TOB=250Hz
SP
L [d
B]
50 100 15055
60
65
70
75
80
85TOB=315Hz
50 100 15055
60
65
70
75
80
85TOB=400Hz
50 100 15055
60
65
70
75
80
85TOB=500Hz
50 100 15055
60
65
70
75
80
85TOB=630Hz
50 100 15050
60
70
80TOB=800Hz
SP
L [d
B]
50 100 15050
60
70
80TOB=1000Hz
50 100 15050
60
70
80TOB=1250Hz
50 100 15050
60
70
80TOB=1600Hz
50 100 15050
60
70
80TOB=2000Hz
50 100 15055
60
65
70
75
80
85TOB=2500Hz
SP
L [d
B]
θ [°]50 100 150
55
60
65
70
75
80
85TOB=3150Hz
θ [°]50 100 150
55
60
65
70
75
80
85TOB=4000Hz
θ [°]50 100 150
55
60
65
70
75
80
85TOB=5000Hz
θ [°]
Figure 13. Noise generated with slats/flaps extracted in ECAM FULL position, landing gears up, and enginein flight idle; (blue) U = 76m/s, (red) U = 92m/s.
Acknowledgments
The measurements were performed within the joint project ”Noise Optimized Approach and DepartureProcedures (LAnAb)” that is funded by the German Federal Ministry of Education and Research. Thisfinancial support is appreciated.
Substantial company funds were spent by Lufthansa to support the tests by reserving an aircraft for aperiod of two weeks, providing flight-simulator time for training the procedures, performing the flyovers,and providing the catering on site. The pilots of Lufthansa, Jurgen Schadt, Udo Scheid, Michael Luttin andGeorg Kohne did an excellent job in training and performing the flyovers.
We would also like to thank Joachim Helbig and Stefan Busse for helping to prepare the measurements,and Julien Grilliat for providing figure 5b).
References
1Dougherty, R. and Stocker, R., “Sidelobe suppression for phased array aeroacoustic measurements,” 4th AIAA/CEASAeroacoutics Conference, Toulouse (France), 2-4 June 1998, AIAA paper 98-2242.
2Piet, J., Michel, U., and Boehning, P., “Localization of the acoustic sources of the A340 with a large phased microphonearray during flight tests,” 8th AIAA/CEAS Aeroacoustics Conference, Breckenridge, Colorado (USA), 2002, AIAA paper2002-2506.
3Preisser, J. and Chestnutt, D., “Flight effects on fan noise with static and wind-tunnel comparisons,” Journal of Aircraft ,Vol. 21(7), 1984, pp. 453–461.
4Bass, H., Sutherland, L., Zuckerwar, A., Blackstock, D., and Hester, D., “Erratum: Atmospheric absorption of sound:Further developments,” J.A.S.A., Vol. 99(2), 1996, pp. 1259.
5Howell, G., Bradley, A., McCormick, M., and J.D.Brown, “De-dopplerization and acoustic imaging of aircraft flyovernoise measurements,” Journal of Sound and Vibration, Vol. 105(1), 1986, pp. 151–167.
6Venkatesh, S., Polak, D., and Narayanan, S., “Beamforming algorithm for distributed source localization and its appli-cation to jet noise,” AIAA Journal , Vol. 41(7), 2003, pp. 1238–1246.
7Sijtsma, P. and Stocker, R., “Determination of absolute contributions of aircraft noise components using fly-over arraymeasurements,” 10th AIAA/CEAS Aeroacoustics Conference, Manchester (UK), 10-12 May 2004, AIAA paper 2004-2958.
8Tyler, J. and Sofrin, T., “Axial flow compressor noise studies,” SAE Transaction, Vol. 70, 1962, pp. 309–332.9Holste, F., “An equivalent source method for calculation of the sound radiated from aircraft engines,” Journal of Sound
and Vibration, Vol. 203(4), 1997, pp. 667–695.10Hawkings, D., “Multiple tone generation by transonic compressors,” Journal of Sound and Vibration, Vol. 17(2), 1971,
pp. 241–250.
13 of 14
American Institute of Aeronautics and Astronautics

11McAlpine, A. and Fisher, M., “On the prediction of buzz Saw noise in aero-engine inlet ducts,” Journal of Sound andVibration, Vol. 248(1), 2001, pp. 123–149.
12Sarin, S. and Rademaker, E., “In-flight acoustic measurements in the turbofan engine inlet of Fokker 100 aircraft,” 15thAIAA Aeroacoustics Conference, Long Beach, CA (USA), 25-27 Oct. 1993, AIAA paper 93-4414.
13Homicz, G. and Lordi, J., “A note on the radiative directivity patterns of duct acoustic modes,” Journal of Sound andVibration, Vol. 41(3), 1975, pp. 283–290.
14Parnett, A. and Eversman, W., “Wave envelope and finite element approximations for turbofan noise radiation in flight,”AIAA Journal , Vol. 24(5), 1986, pp. 753–760.
15Preisser, J., Silcox, R., Eversman, W., and Parrett, A., “Flight study of induced turbofan inlet acoustic radiation withtheoretical comparisons,” Journal of Aircraft , Vol. 22(1), 1985, pp. 57–62.
16Guo, Y., “A statistical model for landing gear noise prediction,” Journal of Sound and Vibration, Vol. 282, 2005, pp. 61–87.
17Dobrzynski, W. and Buchholz, H., “Full-scale A320 landing gear airframe noise characteristics,” Tech. rep., DLR Braun-schweig, 1996, IB 129-96/43.
14 of 14
American Institute of Aeronautics and Astronautics
Related Documents
![Communications - SmartCockpit · 2012. 6. 27. · Airbus A319-320-321 [Communications] Page 1. Airbus A319-320-321 [Communications] Page 2. Airbus A319-320-321 [Communications] Page](https://static.cupdf.com/doc/110x72/60bd4f194e56e40eab42d077/communications-smartcockpit-2012-6-27-airbus-a319-320-321-communications.jpg)