Air Pollution Emission Inventory For 2008 Tourism Season Klondike Gold Rush National Heritage Park Skagway, Alaska Prepared for: David Schirokauer, Project Manager Klondike Gold Rush National Historic Park Skagway, Alaska Prepared by: Richard Graw US Forest Service Air Resource Management Program Division of Natural Resources Pacific Northwest Region Portland, OR And Albert Faure Alaska Department of Environmental Conservation Division of Water Cruise Ship Program Juneau, AK February 2, 2010

Welcome message from author
This document is posted to help you gain knowledge. Please leave a comment to let me know what you think about it! Share it to your friends and learn new things together.
Transcript

Air Pollution Emission Inventory
For 2008 Tourism Season
Klondike Gold Rush National Heritage Park
Skagway, Alaska
Prepared for:
David Schirokauer, Project Manager
Klondike Gold Rush National Historic Park
Skagway, Alaska
Prepared by:
Richard Graw
US Forest Service
Air Resource Management Program
Division of Natural Resources
Pacific Northwest Region
Portland, OR
And
Albert Faure
Alaska Department of Environmental Conservation
Division of Water
Cruise Ship Program
Juneau, AK
February 2, 2010

TABLE OF CONTENTS
1.0 Introduction .......................................................................................................................... 1
2.0 Cruise Ships ......................................................................................................................... 1 2.1 NOx Emissions ................................................................................................................... 3 2.2 SO2 Emissions:.................................................................................................................... 6 3.0 Buses .................................................................................................................................. 10 4.0 Trains ................................................................................................................................. 13
5.0 Municipal Waste Incinerator .............................................................................................. 15 6.0 Summary ............................................................................................................................ 16 7.0 References .......................................................................................................................... 17
List of Tables Table 1 Weekly Cruise Ship Schedule .......................................................................................... 2
Table 2 Bus Fuel Consumption and NOx Emission Rates ......................................................... 11 Table 3 Weekly Train Operation in Skagway ............................................................................. 13
List of Figures
Figure 1 Ship Capacity (Passengers and Crew) .......................................................................... 3 Figure 2 Hotel Power of Cruise Ships in Skagway ..................................................................... 5
Figure 3 NOx Emissions ............................................................................................................. 6 Figure 4 Cruise Ship Fuel Consumption ..................................................................................... 7 Figure 5 Sulfur Content of Fuel .................................................................................................. 8
Figure 6 Hourly SO2 Emissions from Cruise Ships in Skagway ................................................ 9
Figure 7 Daily Variations in Cruise Ship Emissions ................................................................. 10 Figure 8 NOx Emissions from Buses ........................................................................................ 11 Figure 9 SO2 Emissions from Buses ......................................................................................... 12
Figure 10 Daily Variations in Bus Emissions ............................................................................. 12 Figure 11 NOx Emissions from Trains. ...................................................................................... 14
Figure 12 SO2 Emissions from Trains ......................................................................................... 14 Figure 13 Emissions from the Municipal Waste Combustor ...................................................... 15 Figure 14 NOx Emissions ........................................................................................................... 16 Figure 15 SO2 Emissions ............................................................................................................. 16 Figure 16 Emissions Summary.................................................................................................... 17
Appendix A – Cruise Ship Survey Responses
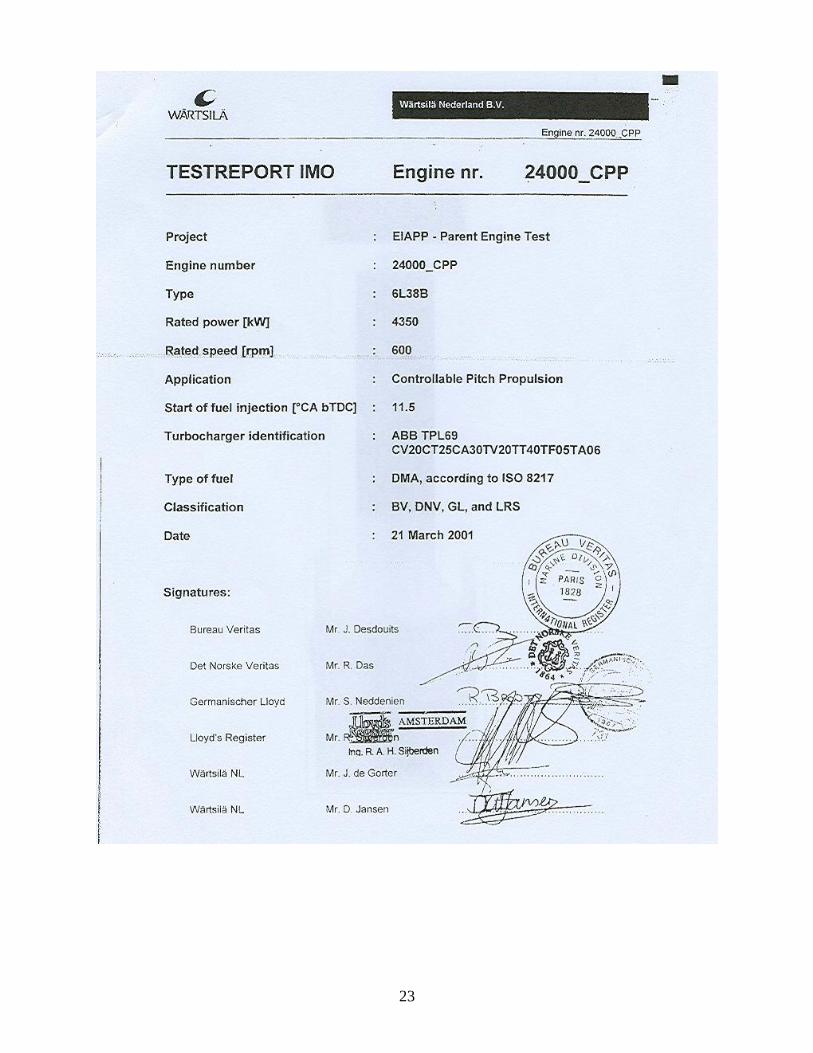
Appendix B – Wartsila NOx Emission Factors

2008 Air Pollution Emission Inventory – Skagway, Alaska
1 02/02/2010
1.0 Introduction
The National Park Service, in conjunction with the USDA Forest Service, is conducting a
research study in Southeast Alaska to address concerns about the environmental effects of
increased numbers of cruise ships and associated tourism to the region. As part of this study, an
air quality analysis is being conducted to help quantify the air pollution emissions from these
sources and their impacts to the environment. This document describes the methodology and
results of the air pollution emission inventory. A subsequent report will be issued to document
the modeling methodology and the model-predicted deposition rates from these sources. While
the study is specific to the Borough of Skagway, it has potential implications for other areas of
Southeastern Alaska.
The tourist season in Skagway begins in May and continues through September. During this
period, cruise ships arrive each day bringing thousands of passengers to the area. While the
ships are docked in Skagway, buses and trains are used to transport the passengers to see the
historic town and the surrounding region. The cruise ships, tour buses, and trains are each a
source of air pollution, which otherwise would not be present without the tourist industry. In
addition to these sources, the town also operates a municipal incinerator to handle the town’s
waste.
An inventory of air pollution emissions was developed for each of these sources for the two
pollutants of concern – nitrogen oxides (NOx) and sulfur dioxide (SO2). The methodology for
developing this emission inventory and a summary of the results are described below. The
methodology and results are presented by the source category, and then summarized as a whole.
2.0 Cruise Ships
Cruise ships are “floating communities” which generate their own electrical and
propulsion power, and heat through the use of combustion equipment installed on-board
the vessels. The size, capacity, and type of this equipment vary among ships.
Typical fuel combustion sources on board of large cruise vessels are:
Diesel engine propulsion,
Diesel engine power generators,
Gas turbine power generation (power / propulsion),
Oil-fired steam boilers,
Incinerators, and
Emergency gas turbines and diesel electric generators.
Typical fuel combustion source on board of small cruise vessels and ferries are:
Diesel engine propulsion,
Diesel electric power generators,
Oil-fired steam boilers, and
Emergency diesel electric generators.

2008 Air Pollution Emission Inventory – Skagway, Alaska
2 02/02/2010
When underway (i.e., not docked), the vessel will use most of the generated power for
propulsion, and the remaining power is used for heating and operations. However, while
docked in Skagway, the ships operate in “hotel mode,” in that they continue to provide
power, heat, air conditioning, and hot water for its guests and staff, similar to a floating
hotel. As on-shore power is not available for ships to utilize while docked in Skagway,
the electrical needs for the vessel are generated from the large diesel-fired engines or gas
turbines, located onboard. Additionally, ships operate fossil fuel-fired auxiliary boilers to
provide hot water and steam for heating purposes. However, ship incinerators are not
operated while docked in Skagway, as per most cruise line policies.
The cruise ship emission inventory was developed from the 2008 schedule for the port of
Skagway (ref: Cruise Line Agencies of Alaska, 2008). The 2008 cruise ship season in
Skagway began May 5th
and ended September 27th
. While there is some variation in the
number of cruise ships in port during the season, the week of July 20-28 was selected as a
representative week during the height of the season.
Table 1 presents a list of ships present in Skagway during the week of July 20-28, 2008,
which is considered a typical week in the high season. For each ship, the docking
location and duration while in Skagway is noted. There were 23 different cruise ships
present this week, with only one ship operating on Sundays and as many as five operating
on Monday through Thursday. The Alaska Marine Highway ship - the Malaspina, docks
in Skagway each night from 10 pm until 7 am the next morning.
Table 1 Weekly Cruise Ship Schedule - Week of July 20-26, 2008
Cruise Line Ship Dock Time in Port Sun Mon Tue Wed Thu Fri Sat
Reagent Seven Seas Mariner RRA 07:00 - 15:30 x
Carnival Spirit RRF 07:00 - 17:00 x
Cruise West Spirit of Yorktown F 07:00 - 24:00 x
Spirit of Ninety Eight F 07:00 - 13:00 x x
Majestic America Empress of the North OF 06:00 - 22:00 x
Celebrity Millennium ORE 07:00 - 20:00 x
Royal Caribbean Rhapsody of the Sea RRF 07:00 - 20:30 x
Radiance of the Sea ORE 07:00 - 20:30 x
Serenade of the Sea RRA 07:00 - 20:30 x
Princess Dawn Princess RRA 07:00 - 20:30 x
Sapphire Princess RRF 05:00 - 20:45 x
Golden Princess RRA 05:30 - 20:30 x
Diamond Princess RRF 06:00 - 20:45 x
Island Princess RRF 05:00 - 20:15 x
Star Princess RRA 05:30 - 17:00 x
Coral Princess RRF 07:00 - 20:30 x
Holland America Veendam BRD 08:00 - 21:00 x
Statendam BRD 07:00 - 21:00 x
Zaandam BRD 07:00 - 21:00 x
Ryndam BRD 07:00 - 21:00 x
Norwegian Norwegian Pearl BRD 07:00 - 21:00 x
Norwegian Star ORE 07:00 - 17:00 x
Norwegian Sun ORE 07:00 - 21:00 x

2008 Air Pollution Emission Inventory – Skagway, Alaska
3 02/02/2010
Figure 1 presents the occupant capacity (i.e., passengers and crew) for each ship. Ship
capacity varies considerably, from small ships (100 to 200), to medium size ships (1500
to 2000), and large ships (3000 – 4100).
Figure 1 Ship Capacity (Passengers and Crew)
2.1 NOx Emissions
A questionnaire was developed and sent to the cruise ship companies requesting ship-
specific information associated with electrical generating engines and boilers. Each
company was asked to provide pollutant-specific emission rates, hotel power output,
engine size and rpm, fuel type and consumption rate, stack gas release parameters (e.g.,
exit temperature, stack height, exit velocity, etc) and ship physical dimensions, as needed
for air quality dispersion modeling. Appendix A provides a list of the responses received
from the cruise lines.
For most ships, NOx emission rates were not provided. Instead, most companies
provided NOx emissions factors and hotel power output, from which emissions could be
calculated. An emission factor is defined by the US Environmental Protection Agency,
as follows

2008 Air Pollution Emission Inventory – Skagway, Alaska
4 02/02/2010
“An emissions factor is a representative value that attempts to relate the quantity of a pollutant released to the atmosphere with an activity associated with the release of that pollutant. These factors are usually expressed as the weight of pollutant divided by a unit weight, volume, distance, or duration of the activity emitting the pollutant (e.g., kilograms of particulate emitted per megagram of coal
burned). Such factors facilitate estimation of emissions from various sources of air pollution. In most cases, these factors are simply averages of all available data of acceptable quality, and are generally assumed to be representative of long-term averages for all facilities in the source category (i.e., a population average).
The general equation for emissions estimation is:
E = A x EF x (1-ER/100)
where:
E = emissions;
A = activity rate;
EF = emission factor, and
ER =overall emission reduction efficiency, %”
The NOx emission rates for these ships were calculated by multiplying the NOx emission
factor (g/kw-hr) by the ship-specific hotel power load. No post-combustion control
devices were present on any of the cruise ships.
If a NOx emission factor was not provided but hotel power was known, the NOx
emission factor was assumed to 12.6 g/kw-hr. Thus, the ship’s emission rate of NOx is
limited as a function of its hourly rate of power generation. This value was derived from
regulatory limits established by the International Maritime Organization (IMO),
Amendments to the Annex of the Protocol of 1997 (MARPOL Annex VI), Chapter III,
Regulation 13. The regulation establishes NOx emission limits for maritime engines. It
was assumed that cruise ships are subject to Tier I of these regulations for a medium
speed engine operating at between 450 - 700 rpm. NOx limits under this regulation are
expressed as NOx (g/kw-hr) = 45(rpm)-0.2
.
To verify that this is a reasonable assumption, the emission factor of 12.6 g/kw-hr was
compared with manufacturer specifications. Wartsila, a manufacturer of diesel maritime
engines often used on cruise ships shows a range of 12.1 to 12.9 g/kw-hr NOx emission
factors for marine diesel engines operating at 514 rpm (Wartsila 46), 600 rpm (Wartsila
38), and 720 rpm (Wartsila 32). Refer to Appendix B for the manufacturer emission
factor sheets. Thus, the assumed NOx emission factor of 12.6 g/kw-hr seems reasonable.
Figure 2 illustrates the variation in power generated by each cruise ship and the
Malaspina while in port. While the power generated is largely proportional to cruise ship
capacity, other on-board amenities, which differ amongst ships also result in different
power needs, even for ships of similar occupancy.

2008 Air Pollution Emission Inventory – Skagway, Alaska
5 02/02/2010
Figure 2 Hotel Power of Cruise Ships in Skagway
NOx emissions from the boilers were estimated using the US EPA emission factors for
oil fired boilers (AP-42, section 1.3) with a heat output of less than 100 Million British
Thermal Units per hour (mmBtu/hr). A NOx emission factor of 20 lbs/gal was used
which is applicable for boilers fired with No. 4 or distillate oil. This emission factor was
multiplied by the boiler fuel consumption rate while docked in Skagway, as provided by
the cruise ship companies.
For ships which did not provide emission factors for the engines or for the boilers, or
both, total ship NOx emissions were estimated by assuming linear proportionality to a
ship within the same cruise line and of similar capacity, within known operating
parameters. If a ship within the same cruise ship line did not have available information,
then a cruise ship of similar capacity but different cruise ship Company was used to
proportionally estimate the NOx emissions. For example, for the Holland America ships,
emission factors and boiler fuel consumption was only available for the Zaandam, thus
NOx emission from the other Holland America ships were estimated proportionally to the
ships occupant capacity. Because emission factors and boiler fuel consumption rates for
Carnival cruise ships were not available, NOx emission for the Carnival Spirit were
estimated in proportion to the Norwegian Sun.
Figure 3 illustrates the hourly NOx emissions from each of the 23 cruise ships and the
Alaska Highway Ferry (the Malaspina) while docked in Skagway. NOx emissions varied
from less than 50 lbs/hr for the small cruise ships and the Malaspina to over 300 lbs/hr
for the largest cruise ship. The variation in NOx emissions is primarily associated with
the amount of power generated while in port. The gas-turbine engine used by the
Serenade of the Seas greatly reduced NOx emissions as compared to the diesel-fired
engines.

2008 Air Pollution Emission Inventory – Skagway, Alaska
6 02/02/2010
Figure 3 NOx Emissions
2.2 SO2 Emissions:
Emissions of sulfur dioxide (SO2) were estimated from fuel consumption rates, fuel
density, and fuel sulfur content. Fuel consumption varied with size, ranging from 11
gallons per hour (gal/hr) to 1144 gal/hr for the largest ship. Figure 4 illustrates the fuel
consumption rates for each ship while docked in Skagway. Most ships burned
Intermediate Fuel Oil (IFO) while in dock, but a few ships burned Marine Gasoline Oil
(MGO) and one burned Marine Diesel Oil (MDO). Fuel densities varied from 7.1 to 7.95
lbs/gal.

2008 Air Pollution Emission Inventory – Skagway, Alaska
7 02/02/2010
Figure 4 Cruise Ship Fuel Consumption
Figure 5 illustrates the varying sulfur content of the fuel from each ship. The Serenade of
the Seas used a low sulfur fuel containing only 0.05 % sulfur (S) by weight, whereas
most ships used fuel with 2.5% S by weight.

2008 Air Pollution Emission Inventory – Skagway, Alaska
8 02/02/2010
Figure 5 Sulfur Content of Fuel
Figure 6 illustrates the hourly SO2 emission rates from each cruise ship and the
Malaspina (Alaska Marine Highway ferry) while docked in Skagway. SO2 emissions
varied from less than 1 lbs/hr to 446 lbs/hr. SO2 emission rates are strongly related to the
sulfur content of the fuel and the fuel consumption rate.

2008 Air Pollution Emission Inventory – Skagway, Alaska
9 02/02/2010
Figure 6 Hourly SO2 Emissions from Cruise Ships in Skagway
Figure 7 illustrates the variation in cruise ship emissions as a function of the day of the
week. The amount of pollutants emitted are related to the number of ships in port, the
power demand of each ship while in port, the emission factor applied, and the fuel type.
NOx emissions are greatest during the middle of the week, and tapper off toward the end
of the week and Saturday, as fewer ships are in port during these days. SO2 emissions are
greatest during Monday and Tuesdays due to the number of ships burning diesel fuel.
Although the same numbers of ships are in Skagway on Wednesday, SO2 emissions are
lower due to the ship-specific emission rates provided by the Cruise Ship companies.

2008 Air Pollution Emission Inventory – Skagway, Alaska
10 02/02/2010
Figure 7 Daily Variations in Cruise Ship Emissions
3.0 Buses
Each day tour buses arrive at the docks to take passengers up the scenic highway to
White Pass. The buses are staged overnight in three parking lots. Alaska Coach has two
bus parking lots: one on the north side of town for six buses, and one further south where
seven buses park overnight. Princess Coach has a large bus lot on the north side of town
where 20 buses are parked overnight. Greyline has a parking site for ten buses, and
Holland America has a parking lot for four buses. In total, there are 47 coach buses
which may operate in Skagway on a busy day.
In preparation for each day, the buses are estimated to warm up (idle) for 20 minutes each
morning, prior to passenger pick up and transport up to White Pass. The number of buses
operating each day corresponds to the number of passengers arriving each day.
Each bus is assumed to be 40 feet long, and 8 feet wide and 11 feet high (Motor Coach
Industries, MC9 Coach). All buses have exhaust pipes on the undercarriage,
approximately 1.5 feet above the ground (personal communication with Dave
Schirokauer, June 8, 2009).
Except for the sulfur content of the fuel, bus-specific information was not available in
preparation of this emission inventory. The sulfur content of the fuel was measured at
5.4 mg/kg (ASTM D 5453). Assumption about fuel consumption and NOx emission
rates were made based upon material available from the American Bus Association
(2006). Table 2 presents the average NOx emissions rate and fuel consumption during
idling model and an urban driving cycle for buses while not operating air conditioning
(American Bus Association, 2006). Buses were assumed to be older coaches (built prior
to 2004).

2008 Air Pollution Emission Inventory – Skagway, Alaska
11 02/02/2010
Table 2 Bus Fuel Consumption and NOx Emission Rates
Mode Fuel Use
gal/hr
NOx
g/hr
Idling 0.95 238
Urban Cycle 2.47 444
A single bus emits 0.52 lbs of NOx/hr while idling, and 0.98 lbs/hr while driving. Figure
8 illustrates the maximum hourly NOx emission rates from a total of 47 buses operating
at one time. While idling, NOx is emitted at approximately 25 lbs/hr, and while driving,
NOx is emitted at approximately 45 lbs/hr. Because buses do not remain in Skagway
throughout the day, only the emissions during the first and last hours (total of two hours)
of operation are included in the emission inventory.
Figure 8 NOx Emissions from Buses
NOx Emission from Buses in Skagway, AK 2008
0
5
10
15
20
25
30
35
40
45
50
idle drive
Drive Mode
NO
x E
mis
sio
ns (
lbs/h
r)
A single bus emits 0.00008 lbs of SO2/hr while idling, and 0.00021 lbs/hr while driving.
Figure 9 illustrates the maximum hourly SO2 emission rates from a total of 47 buses
operating at one time. Whether idling, or driving, SO2 is emitted less than one lb/hr. The
low emission rate is due to the very low sulfur content of the fuel.

2008 Air Pollution Emission Inventory – Skagway, Alaska
12 02/02/2010
Figure 9 SO2 Emissions from Buses
Hourly SO2 Emissions from Buses
0.00E+00
1.00E-03
2.00E-03
3.00E-03
4.00E-03
5.00E-03
6.00E-03
7.00E-03
8.00E-03
9.00E-03
1.00E-02
idle drive
Drive Mode
SO
2 E
mis
sio
ns
(lb
s/h
r)
Figure 10 illustrates the variation in bus emissions as a function of the day of the week.
Because the number of buses needed is assumed to be correlated with the number of
cruise ship passengers arriving in Skagway each day, the weekly trend is similar to that of
the cruise ship emissions. The number of buses operating on any given day was
estimated based upon the maximum number of buses operating (i.e., 47) when all five
cruise ships are docked. Thus, if only 3 cruise ships were in port, then only 28 buses
were assumed to be operating (i.e., (3/5) x 47 = 28).
Figure 10 Daily Variations in Bus Emissions
Daily Variation in Bus Emissions
0
10
20
30
40
50
Sun Mon Tues Wed Thurs Fri Sat
lbs/h
r
NOx
SO2

2008 Air Pollution Emission Inventory – Skagway, Alaska
13 02/02/2010
4.0 Trains
The White Pass and Yukon Route Railway operate a scenic railroad to transport cruise
ship passengers from the docks at Skagway up to White Pass and beyond. The trains
frequently make two trips a day. The railroad operates two kinds of trains, diesel-fired
locomotives and one steam locomotive. Except for the steam locomotives, each train is
configured with three diesel-fired locomotives: one GE CC-162 with an ALCO215B
engine rated at 900 hp and two ALCO DL535 with an ALCO 251D engine rats at 1200
hp (www.thedieselshop.us/DataDL535A.html). The engines burn diesel fuel with a
sulfur content of 5.4 ppm. The steam locomotive is fueled with #5 fuel oil (a.k.a. residual
oil). Residual oil is estimated to contain 0.5% to 4% sulfur by weight. A mean value of
2.25% sulfur content was assumed.
Table 3 presents the number of trains operating each day and the number of total trips.
Each train often makes more than one trip each day, except for the steam train. The
greatest number of trips is made during the middle of each week, corresponding to the
number of cruise ships in port.
Table 3 Weekly Train Operation in Skagway
Sun Mon Tues Wed Thu Fri Sat
No. of Trains 3 5 5 5 5 2 2
Total No. of Trips 6 9 11 12 11 4 4
No. of Steam Trains 1 0 0 0 0 1 0
Steam Train Trips 1 0 0 0 0 1 0
The trains idle each day from 5:30 am to 8:00 am, then after returning from White Pass,
idle again from 11:45 am to 12:45 pm and then again from 5: 00 pm to 6:30 pm (personal
communication – Dave Schirkauer, June 8, 2009).
The locomotives were assumed to emit 270 grams of NOx per gallon of fuel (U.S. EPA
1997). Each round-trip of a locomotive consumes approximatley300 gallons of diesel
fuel, (personal communication with Dave Schirkauer). SO2 emissions were calculated
from the sulfur content of the fuel (5.4 mg/kg) and the fuel consumption rate.
Figure 11 illustrates the amount of NOx emitted from the trains as a function of each day
of the week. During operation, the total amount of NOx emitted from the trains is
approximately 180 lbs/hr during Monday through Thursday, with less than half of this on
Saturday.

2008 Air Pollution Emission Inventory – Skagway, Alaska
14 02/02/2010
Figure 11 NOx Emissions from Trains.
NOx Emissions from Trains
0
20
40
60
80
100
120
140
160
180
200
Sun Mon Tues Wed Thurs Fri Sat
NO
x (
lbs/h
r)
Figure 12 illustrates the amount of SO2 emitted from the trains as a function of each day
of the week. Due to the ultra low sulfur content of the diesel fuel, SO2 emissions are very
small from the operation of the diesel locomotives. Because a higher sulfur content fuel
was assumed for the operation of the steam locomotive, SO2 emissions are highest when
this train operates. The maximum hourly SO2 emission rate during these days is
approximately 12 lbs/hr.
Figure 12 SO2 Emissions from Trains
SO2 Emissions from Trains
0
2
4
6
8
10
12
14
Sun Mon Tues Wed Thurs Fri Sat
SO
2 (
lbs/h
r)

2008 Air Pollution Emission Inventory – Skagway, Alaska
15 02/02/2010
5.0 Municipal Waste Incinerator
The Eco Waste municipal incinerator can process up to eight tons per day. The operation of the
unit is adjusted in the spring to accommodate the anticipated five loads per week during peak
tourist season. Each eight ton cycle takes only 24 hours from loading and firing (8-10 hours), to
cooling and emptying. During operation, burning occurs for 6 hours, and cool down occurs
during the remaining portion of a 24-hour cycle (i.e., 18 hours).
The Eco Waste municipal incinerator is a modular, starved-air combustor. It operates in a batch-
mode, two-stage process. In the first stage, waste is ignited in the combustion chamber by means
of a diesel-oil fired burner. Off-gases from the first stage are combusted in the second stage
(afterburner) and then emitted via a stack.
Emission rates are estimated from US EPA guidance for stationary point sources, AP-42,
Chapter 2.1 Refuse Combustion, and Table 2.1-9 Emission Factors for Modular Starved
Air Combustors (10/96). A NOx emission rate of 3.16 lb/ton of waste was used with an
assumed fuel heating value of 4500 Btu/lb. Following the guidance, the NOx emission
factor was adjusted for the higher heating value of the diesel fuel (137,000 Btu/gal),
resulting in a revised NOx emission factor of 96.20 lbs/ton. Multiplying this value by the
amount of water burned each day (8 tons/day), and dividing by the number of hours in a
day, results in a NOx emission rate of 32 lbs/hr.
SO2 emissions were estimated based upon the sulfur content of fuel, multiplied by the
fuel consumption rate. The incinerator uses the same ultra low sulfur diesel as the buses
and trains. The sulfur content of this fuel was measured at 5.4 ppm. The average fuel
consumption rate is 285 gallons/burn (personal communication with Grant Lawson, June
18, 2009). These operating parameters result in a very low SO2 emission rate of 0.0009
lbs/hr. Figure 13 below presents a graphical representation of the NOx and SO2 emission
rates from the Municipal Waster Incinerator. Emissions of other contaminants were not
calculated.
Figure 13 Emissions from the Municipal Waste Combustor
Municipal Incinerator Emissions
0
5
10
15
20
25
30
35
NOx emissions SO2 Emissions
lbs/h
r

2008 Air Pollution Emission Inventory – Skagway, Alaska
16 02/02/2010
6.0 Summary
The combined emissions from the operation of cruise ships, trains, buses, and the municipal
waste incinerator are summarized below. Figure 14 illustrates the fractional contribution to total
weekly NOx emissions from these sources. Cruise ships are the largest source, contribute 73%
of the total NOx emissions. Trains are the next largest contributing source (20%), followed by
buses (4%) and the municipal incinerator (3%).
Figure 14 NOx Emissions
Figure 15 illustrates the fractional contribution to weekly SO2 emissions. Emissions from
cruise ships contribute to 99% of the total SO2 emissions. The buses, trains, and
municipal incinerator have very little contribution due to the low sulfur content of their
fuel.
Figure 15 SO2 Emissions

2008 Air Pollution Emission Inventory – Skagway, Alaska
17 02/02/2010
Figure 16 illustrates the NOx and SO2 emissions, expressed in units of pounds per hour,
are illustrated for each day of the week, while a source is operating. The figure illustrates
that cruise ships are the largest emitters of NOx and SO2, and can emit as much as 800
lbs/hr. Trains are the next largest emitting source and emit approximately 180 lbs/hr of
NOx. Buses emit as much as 46 lbs/hr of NOx, and the incinerator emits slightly lower
amounts – 32 lbs/hr. SO2 emissions from the trains, buses, and incinerator are extremely
small, due to the use of ultra low sulfur fuel.
Figure 16 Emissions Summary
7.0 References
Cruise Line Agencies of Alaska, Cruise Ship Calendar for 2009
American Bus Association. Commercial Emissions Characterization & Idle Reduction –
Idle & Urban Cycle Test Results. June 14, 2006.
U.S. Environmental Protection Agency. Form APR420-F-97-051, Emission Factors for
Locomotives, for 1997 Table 9: Fleet Average Emission Factors for All Locomotives,
(Projected 1999), December 1997
U.S. Environmental Protection Agency. Air Pollutant Emission Factors for Stationary
Sources (AP-42), Chapter 2.1 Refuse Combustion, and Table 2.1-9 Emission Factors for
Modular Starved Air Combustors (10/96).

National Park Service – Southeast Alaska Inventory and Monitoring Program
Airborne Contaminants Study - DRAFT Emission Inventory form 2008
Appendix A
Cruise Ship Survey Responses
Table of Contents A-1 Celebrity Cruise Lines ..........................................................................................................22
A-2 Cruise West ...........................................................................................................................31
A-3 Norwegian Cruise Lines……………………………………………………….…………...33
A-4 Princess Cruise Lines………………………………………………………………………36
A-5 Royal Caribbean Cruise Lines…………………………………………………………….48

National Park Service – Southeast Alaska Inventory and Monitoring Program
Airborne Contaminants Study - DRAFT Emission Inventory form 2008
A-1 Celebrity Cruise Lines
Note:
The Celebrity Millennium is the only Celebrity Line of cruise ship reported to be docked in
Skagway during the 2008 season. Celebrity cruise lines only submitted information on the
Mercury. Thus, this information was assumed to be representative of the Millennium.

National Park Service – Southeast Alaska Inventory and Monitoring Program
Airborne Contaminants Study - DRAFT Emission Inventory form 2008
Ship Name: Celebrity Mercury Capacity PAX 2130 Crew 850
Line Name: Celebrity Cruises
Physical Dimensions:
Lower Tier – outer rim of ship: This is the Promenade or Embarkation Deck.
DECK # 6
Length: 68,5 mtrs
Width: 5,6 mtrs on each side port + stbd
Height above water: 11 mtrs
Upper Tier (mean representation): Pool Deck or the one overlooking the Pool Deck, effectively
the upper boundary of the superstructure. DECK # 11
Length: 46 mtrs
Width: 32 mtrs
Height above Tier 1: 20,6 mtrs
Stack Housing (tier 3): The funnel area or annular spaces.
DECK #14
Length: 88 mtrs
Width: 5,4 mtrs on each side port + stbd
Height above Tier 2: 3 mtrs
Engine parameters: Output & Rpm
Engine: Main Engines
Man Father 2 x 25336 HP (Type: MAN B&W 9L-48/60)
Man Son 2 x 16891 HP (Type: MA B&W 6L-48/60)
Engine output: Father 9450 kW (12668 HP)
Son 6300 kW (8455 HP)
Aux. Engines
4 x MAN B&W 6L 40/54
Engine output: 4320 kW
Displacement: 39982 About

National Park Service – Southeast Alaska Inventory and Monitoring Program
Airborne Contaminants Study - DRAFT Emission Inventory form 2008
Stack Parameters
Stack distance from bow of ship (m): 171.28 m
Stack height above water (m): 61.58 m
Inside stack diameter (meters): Boilers – Ø610 X 2.5, Incinerators – Ø 559 X 2.5, Aux.
Engines – Ø711 X 2.5, M.E Fathers – Ø1016 X 3.0, M.E Sons – Ø864 X 2.5
Stack angle from vertical (°):
Estimated exhaust gas temperature (K): Before Gas Boiler is 380ºC, After Gas Boiler is 200ºC
Actual stack exit velocity (m/sec): Boilers –16.3 m/s, Incinerators – 36.6 m/s,
Aux. Engine# 1 & 3 - 39.1 m/s, Aux. Engine# 2 & 4- 32.7 m/s, M.E Fathers – 35.1 m/s,
M.E Sons – 32.9 m/s
Emission Rates (average emission rate while in Skagway)
(If emission rates are not provided, we can estimate from ship-specific parameters or in the
absence of such information, from published typical values).
NOx: _____ lbs/hr
PM: _____ lbs/hr
SO2: _____ lbs/hr
VOCs: _____ lbs/hr
CO: ______lbs/hr

22
Fuel parameters for operation in Skagway
Fuel type combusted while in Skagway: IFO 380 low sulfur
Fuel sulfur content (maximum) based on percent of fuel weight: 1.44%
Operational parameters while docked in Skagway:
Operation mode while docked: (number of engines, gas-turbine auxiliary, boilers, incinerators).
Always 2 Aux. generators in operation while at port, No Incinerators in operation, and 2 boilers
operating.
Fuel consumption per hour (average): MT/hr = approx. 1.2 MT/hr for the 2 Aux. generators
while at port.
Hotel load: average 4.1 MW (2 Aux. generators engines in operation)
Auxiliary boiler fuel consumption rate (Mtons/hr): 0.04 - 0.05 Mt/hr
Air Pollution Control Device Information - no data available - such device is not installed. Only
opacity meters for the exhaust gas for the Main Engines.
Type: Krystallon Seawater Scrubber
Pollutant Control Efficiency SO2: PM: NOx: (no devices / analyzers
installed to control and measure pollutants)
23

24

25

26

National Park Service – Southeast Alaska Inventory and Monitoring Program
Airborne Contaminants Study - Emission Inventory form 2008

National Park Service – Southeast Alaska Inventory and Monitoring Program
Airborne Contaminants Study - Emission Inventory form 2008
A-2 Cruise West
Vessel
Engine Mfg.
Engine Type
Rated RPM
Fuel Burn
Rated / 100%
load for Aux
Eng
Fuel Burn
1200 RPM / 50%
load for Aux Eng.
SOD Main Eng.
Caterpillar
3508 1600 45.5 gph 21.7gph
SON Main Eng.
Caterpillar 3512 1800 60.3 gph 18.2
SON Aux Eng. Caterpillar 3412 1800 33.7 gph 11.0 gph
SOA Main Eng. Caterpillar 3412 1800 33.7 gph 11.0 gph
SOA Aux Eng. Caterpillar 3304 1800 8.7 gph 100%
load
7.1 gph 50% load
SOD Aux Eng. Caterpillar 3306 1800 13.8 gph
100% load
7.1 gph 50% load
SOC Main Eng.
Detroit 12V71 1800 30 gph 8 gph
SOC Aux Eng. Detroit 671 1800 8 gph 100%
load
N/A
SGB Main Eng.
Detroit 12V71 1800 30 gph 8 gph
SGB Aux Eng. Detroit 671 1800 8 gph 100%
load
N/A

National Park Service – Southeast Alaska Inventory and Monitoring Program
Airborne Contaminants Study - Emission Inventory form 2008
Consumption Parameters SON SOD SOA SOC SGB
Underway 100% load/ crew only 143.8 103.1 74.5 68 68
Underway 100% Load with Pax 159.3 109.8 76.1 68 68
Underway 60% Load Crew Only 52.4-62.4 55.5-65.5 29.1-39.1 24-34 24-34
Underway 60% Load with Pax 75.1-85.1 57.1-67.1 30.7-40.7 24-34 24-34
Pierside, Aux Engine only 100%
Load
38.7 18.8 8.7 8 8
Pierside Aux Engine only 50%
Load
16.0 12.1 7.1 8 8
All Fuel rates are based on Gallons per hour.
Color Green: Fuel consumption pier side 50 % load. No passengers / only crew with
preparation work (FRE)
PVA Member Vessel Information
Vessel Length
(ft)
Vessel Beam
(ft)
Hull Type (disp.,
planning, cat., etc.)
Type of Service
USCG Type (K, T,
H)
Number of
Propulsion Engines
Propulsion Engine Rating
bhp @ rpm
Number of
Genset Engines
SOA 143 28 disp. passenger K 2 2
SOD 166 37 disp. passenger K 2 2
SON 192 40 disp. passenger K 2 2
SOC 143 28 disp. passenger K 2 2
SOE 217 37 disp. passenger K 2 2
SOO 295 50 disp. passenger K 2 2
SNT 257 43 disp. passenger K 2 3
SOY 207 37 disp. passenger K 2 3

National Park Service – Southeast Alaska Inventory and Monitoring Program
Airborne Contaminants Study - Emission Inventory form 2008
A-3 Norwegian Cruise Lines

National Park Service – Southeast Alaska Inventory and Monitoring Program
Airborne Contaminants Study - Emission Inventory form 2008

National Park Service – Southeast Alaska Inventory and Monitoring Program
Airborne Contaminants Study - Emission Inventory form 2008

National Park Service – Southeast Alaska Inventory and Monitoring Program
Airborne Contaminants Study - Emission Inventory form 2008
A-4 Princess Cruise Lines
Star Princess Capacity: 2600 passengers, Crew: 1200
Princess Cruise Lines
Physical Dimensions:
Lower Tier – outer rim of ship:
Length: 290m ( 951 feet )
Width: 36.03m ( 118 feet ) Height above water:
Upper Tier (mean representation): (Assumed to mean superstructure, i.e. Deck 7-
18.)
Length: 252m
Width: 32.6m Height above Tier 1: 31.50m
Stack Housing (tier 3):
Length: 35.9m
Width: 5.6m
Height above Tier 2: 8.76m
Gross Tonnage: 109,000 gross tons.
Engine parameters: Engine: Type is diesel electric powered by Wartsila/Sulzer 4 x ZA40S
V16 and 2 x ZA40S V12
Engine output: Engine power at 100% MCR 4 @11520 KW and 2 @8640
KW
Displacement:
Is the Gasturbine engine used while tied up in Skagway? N/A
Are the other engines shut off while in Skagway? N/A
Stack Parameters Stack distance from bow of ship (m): 216.54m (distance taken from center of stack housing)
Stack height above water (m): 52.36 m
Inside stack diameter (meters): Approx. 1.1m at exhaust
Stack angle from vertical (°): 0
Estimated exhaust gas temperature (K): 250 centigrade
Actual stack exit velocity (m/sec):
Emission Rates (average emission rate while in Skagway)
(If emission rates are not provided, we can estimate from ship-specific parameters or in the absence of
such information, from published typical values).
NOx: .026433 lbs/hr
PM: .037478 lbs/hr
SO2: .155205 lbs/hr
VOCs: _____ lbs/hr
CO: .187798 lbs/hr
Skagway AK - 2008 Schedule: Date Times Dock
5-08 05:30-17:00 RRF
5-15 05:30-17:00 RRF
5-22 05:30-17:00 RRA
5-29 05:30-17:00 RRA
6-05 05:30-17:00 RRA
6-12 05:30-17:00 RRA
6-19 05:30-17:00 RRA
6-26 05:30-17:00 RRA
7-03 05:30-17:00 RRA
7-10 05:30-17:00 RRA
7-17 05:30-17:00 RRA
7-24 05:30-17:00 RRA
7-31 05:30-17:00 RRA
8-07 05:30-17:00 RRA
8-14 05:30-17:00 RRA
8-21 05:30-17:00 RRA
8-28 05:30-17:00 RRA
9-04 05:30-17:00 RRA
9-11 05:30-17:00 RRA
9-18 05:30-17:00 RRA

National Park Service – Southeast Alaska Inventory and Monitoring Program
Airborne Contaminants Study - Emission Inventory form 2008
Fuel parameters for operation in Skagway
Fuel type combusted while in Skagway: IFO
Fuel sulfur content (maximum) based on percent of fuel weight: 2.0%
Operational parameters while docked in Skagway
Operation mode while docked: (number of engines, gas-turbine auxiliary, boilers, incinerators)
2 Main Engine (1 x V16 + 1 x V12) – 1 intermittent oil fired boiler
Fuel consumption per hour (average): 2.3 MT/hour
Hotel load: 10500 KW
Auxiliary boiler fuel consumption rate (tons/hr): 0.3 tons/hour
Air Pollution Control Device Information N/A
Type:
Pollutant Control Efficiency SO2: PM: NOx:

National Park Service – Southeast Alaska Inventory and Monitoring Program
Airborne Contaminants Study - Emission Inventory form 2008
Diamond Princess Capacity: 3,078 PAX, Crew: 1,060
Princess Cruise Lines
Physical Dimensions:
Lower Tier (deck 7) – outer rim of ship:
Length: 288.33 meters
Width: 37.5 meters
Height above water: 12.5 meters
Upper Tier (deck 15):
Length: 250 meters
Width: 36 meters
Height above Tier 1 (deck 7) : 21 meters
Stack Housing (tier 3 – deck 18):
Length: 35 meters
Width: 21 meters
Height above Tier 2 (top of stack to deck 15):
21 meters
Gross Tonnage: 115,875
Engine parameters:
Engine: 2 x 9L46C & 2 x 8L46C Wärtsilä diesel-electric
configuration 1 x LM2500+ Gas Turbine
Engine output: 9 Cyl 9,450 KW, 8 Cyl 8,400 KW & GT
25,000 KW
Displacement: 60,636t
Is the Gas turbine engine used while tied up in Skagway?
No
Are the other engines shut off while in Skagway? 2
Running with 2 Off
Stack Parameters
Stack distance from bow of ship (m): 195 meters
Stack height above water (m) 54 m
Inside stack diameter (meters): D/G’S = 1 meter & GT = 2.2 meters
Stack angle from vertical (°): 0°
Estimated exhaust gas temperature (K): 523 K
Actual stack exit velocity (m/sec):
Emission Rates (average emission rate while in Skagway) PLEASE SEE BELOW FOR FIGURE
CALCULATIONS.
(If emission rates are not provided, we can estimate from ship-specific parameters, or in the absence of
such information, from published typical values).
NOx: _314____ lbs/hr
PM: _____ lbs/hr
SO2: __7___ lbs/hr
VOCs: _____ lbs/hr
CO: 3.75 lbs/hr
Skagway AK - 2008 Schedule: Date Times Dock
5-12 07:00-20:30 RRA
6-1 07:00-20:30 BRD
6-21 07:00-20:30 RRA
7-11 07:00-20:30 RRF
7-21 07:00-20:30 RRA
8-1 07:00-20:30 RRA
8-10 07:00-20:30 BRD
8-30 07:00-20:30 RRF
9-19 07:00-20:30 RRF

National Park Service – Southeast Alaska Inventory and Monitoring Program
Airborne Contaminants Study - DRAFT Emission Inventory form 2008
Fuel parameters for operation in Skagway
Fuel type combusted while in Skagway: IFO
Fuel sulfur content (maximum) based on percent of fuel weight: 2.5
Operational parameters while docked in Skagway
Operation mode while docked: (2 x Diesel Engines, gas-turbine shut down, 1 x boiler, incinerators off)
Fuel consumption per hour (average): 3.7mt/Hr
Hotel load: 11,500 KW
Auxiliary boiler fuel consumption rate (tons/hr): 0.35 mt/Hr
Air Pollution Control Device Information
Type:
Pollutant Control Efficiency SO2: PM: NOx:
Wartsila book of engine parameters for Nox Certification states the following:
NOx produced at 50% = 13 g/KwH = 0.0286 lbs/KwH
With the hotel load in port being approx. 11 MW there would be a total of 314 lbs/hour of Nox being
produced.

National Park Service – Southeast Alaska Inventory and Monitoring Program
Airborne Contaminants Study - DRAFT Emission Inventory form 2008
Ship Name: Golden Princess Capacity PAX 2598 Crew 1060
Line Name Princess Cruise Line
Physical Dimensions:
Lower Tier – outer rim of ship:
Length: 289.5m LOA
Width: 36.03m
Height above water: 12.1m (This is neither Moulded Depth nor Height, but
distance from summer load line to Deck 7 at-side. NB: Deck 7 is not the
freeboard deck.)
Upper Tier (mean representation): (Assumed to mean superstructure, i.e. Deck 7-18.)
Length: 252m
Width: 32.6m
Height above Tier 1: 31.50m
Stack Housing (tier 3):
Length: 35.9m
Width: 5.6m
Height above Tier 2: 8.76m
Engine parameters: Engine: Type is diesel electric powered by 4 Wartsila/Sulzer ZA40S V16 and ZA40S V12
Engine output: Engine power at 100% MCR 4 @11520 KW and 2 @8640 KW
Displacement:
Stack Parameters
Stack distance from bow of ship (m): 216.54m (distance taken from center of stack housing)
Stack height above water (m): 52.36m
Inside stack diameter (meters): Approx. 1.1m at exhaust
Stack angle from vertical (°): 0
Estimated exhaust gas temperature (K): 250 centigrade
Actual stack exit velocity (m/sec):
Emission Rates (average emission rate while in Skagway)
(If emission rates are not provided, we can estimate from ship-specific parameters or in the
absence of such information, from published typical values).
NOx: .026433 lbs/hr
PM: .037478 lbs/hr
SO2: .155205 lbs/hr
VOCs: _____ lbs/hr
CO: .187798 lbs/hr

National Park Service – Southeast Alaska Inventory and Monitoring Program
Airborne Contaminants Study - Emission Inventory form 2008
Fuel parameters for operation in Skagway
Fuel type combusted while in Skagway: IFO,
Fuel sulfur content (maximum) based on percent of fuel weight: 2.0%
Operational parameters while docked in Skagway
Operation mode while docked: (number of engines, gas-turbine auxiliary, boilers, incinerators)
1 main engine, one intermittent oil fired boiler
Fuel consumption per hour (average): 2.2 mt/hr
Hotel load: 10500 KW
Auxiliary boiler fuel consumption rate (tons/hr): approx 0.3 tons/hour
Air Pollution Control Device Information N/A
Type: Krystallon Seawater Scrubber
Pollutant Control Efficiency SO2: PM: NOx:

National Park Service – Southeast Alaska Inventory and Monitoring Program
Airborne Contaminants Study - Emission Inventory form 2008
Ship Name: Golden Princess Capacity PAX 2598 Crew 1060
Line Name Princess Cruise Line
Physical Dimensions:
Lower Tier – outer rim of ship:
Length: 289.5m LOA
Width: 36.03m
Height above water: 12.1m (This is neither Moulded Depth nor Height, but
distance from summer load line to Deck 7 at-side. NB: Deck 7 is not the
freeboard deck.)
Upper Tier (mean representation): (Assumed to mean superstructure, i.e. Deck 7-18.)
Length: 252m
Width: 32.6m
Height above Tier 1: 31.50m
Stack Housing (tier 3):
Length: 35.9m
Width: 5.6m
Height above Tier 2: 8.76m
Engine parameters: Engine: Type is diesel electric powered by 4 Wartsila/Sulzer ZA40S V16 and ZA40S V12
Engine output: Engine power at 100% MCR 4 @11520 KW and 2 @8640 KW
Displacement:
Stack Parameters
Stack distance from bow of ship (m): 216.54m (distance taken from center of stack housing)
Stack height above water (m): 52.36m
Inside stack diameter (meters): Approx. 1.1m at exhaust
Stack angle from vertical (°): 0
Estimated exhaust gas temperature (K): 250 centigrade
Actual stack exit velocity (m/sec):
Emission Rates (average emission rate while in Skagway)
(If emission rates are not provided, we can estimate from ship-specific parameters or in the
absence of such information, from published typical values).
NOx: .026433 lbs/hr
PM: .037478 lbs/hr
SO2: .155205 lbs/hr
VOCs: _____ lbs/hr
CO: .187798 lbs/hr
Fuel parameters for operation in Skagway
Fuel type combusted while in Skagway: IFO,
Fuel sulfur content (maximum) based on percent of fuel weight: 2.0%

National Park Service – Southeast Alaska Inventory and Monitoring Program
Airborne Contaminants Study - Emission Inventory form 2008
Operational parameters while docked in Skagway
Operation mode while docked: (number of engines, gas-turbine auxiliary, boilers, incinerators)
1 main engine, one intermittent oil fired boiler
Fuel consumption per hour (average): 2.2 mt/hr
Hotel load: 10500 KW
Auxiliary boiler fuel consumption rate (tons/hr): approx 0.3 tons/hour
Air Pollution Control Device Information N/A
Type: Krystallon Seawater Scrubber
Pollutant Control Efficiency SO2: PM: NOx:

National Park Service – Southeast Alaska Inventory and Monitoring Program
Airborne Contaminants Study - Emission Inventory form 2008
ISLAND Capacity: PAX: 1,970 , Crew: 905
Princess Cruise Lines
Physical Dimensions:
Lower Tier (Deck 7-Tier 1) – outer rim of ship:
Length: 293 meters
Width: 32.2 molded width
Height above water: 11.90 meters
Upper Tier (Deck 15-tier 2):
Length: 242 meters
Width: 28 meters
Height above Tier 1 (deck 7): 21.3 meters
Stack Housing:
Length: 39.7 meters
Width: 23 meters
Height above Tier 2: 20.75 meters
Gross Tonnage:
Engine parameters: Engines: 2 x 16V46C DWI Wartsila Diesel Electric +1 x LM2500 + GTG
Engine output: 2 x 16.200 kW nominal + 1 x 25000 kW nominal Displacement: 57,400 kW
Is the Gas turbine engine used while tied up in Skagway? No
Are the other engines shut off while in Skagway? 1 running with 1 off
Stack Parameters
Stack distance from bow of ship (m): 203 meters
Stack height above water (m) 53.7 meters
Inside stack diameter (meters): D/G’s = 1.3 meters – GTG = 2.2 meters
Stack angle from vertical (°): 0°
Estimated exhaust gas temperature (K): 600K
Actual stack exit velocity (m/sec):
Emission Rates (average emission rate while in Skagway)
(If emission rates are not provided, we can estimate from ship-specific parameters or in the absence of
such information, from published typical values).
NOx: 208 lbs/hr
PM: _____ lbs/hr
SO2: 7 lbs/hr
VOCs: _____ lbs/hr
CO: 3.75 lbs/hr

National Park Service – Southeast Alaska Inventory and Monitoring Program
Airborne Contaminants Study - Emission Inventory form 2008
Fuel parameters for operation in Skagway
Fuel type combusted while in Skagway: IFO
Fuel sulfur content (maximum) based on percent of fuel weight: 2.5
Operational parameters while docked in Skagway
Operation mode while docked: 1 Diesel Engine/GTG OFF – Incin. OFF – 1 Boiler ON
Fuel consumption per hour (average): 1.95 MT/hour
Hotel load: 7,200 kW
Auxiliary boiler fuel consumption rate (tons/hr): 0.30 MT/Hour
Air Pollution Control Device Information
Type:
Pollutant Control Efficiency SO2: PM: NOx:
Wartsila book of engine parameters emission test:
NOx Produced at 50% = 13.1 g/kWh = 0.0289 lbs/kWh
Hotel Load in port = 7.2 MW = 7,200 kW
7,200 kW x 0.0289 lbs/kWh = 208 lbs/h
208 lbs/h = NOx being produced

National Park Service – Southeast Alaska Inventory and Monitoring Program
Airborne Contaminants Study - Emission Inventory form 2008
Sapphire Princess Capacity: 3,078 passengers, Crew: 1,060
Princess Cruise Lines
Physical Dimensions:
Lower Tier (deck 7) – outer rim of ship:
Length: 288.3-metre (951 ft)
Width: 37.5-metre (121 ft)
Height above water: 12.5 meters
Upper Tier (deck 15):
Length: 250 meters
Width: 36 meters
Height above Tier 1: 21 meters
Stack Housing (tier 3 – deck 18):
Length: 35 meters
Width: 21 meters
Height above Tier 2 (top of stack to deck 15) : 21
meters
Gross Tonnage: 115,875 GRT
Engine parameters:
Engine: 2 x Alstom 20,000kW, 145rpm
Engine output: .60.7 MW
Displacement:
Is the Gasturbine engine used while tied up in Skagway?
No, usually we run with 2 d/gs (motors)
Are the other engines shut off while in Skagway?
Yes,
Stack Parameters
Stack distance from bow of ship (m): 195 meters
Stack height above water (m) 54m
Inside stack diameter (meters): Motors=1 m ---GT = 2.2 m
Stack angle from vertical (°): 0
Estimated exhaust gas temperature (K): 525 K (av. 252 C +273)
Actual stack exit velocity (m/sec):
Emission Rates (average emission rate while in Skagway) PLEASE SEE BELOW FOR FIGURE
CALCULATIONS.
(If emission rates are not provided, we can estimate from ship-specific parameters or in the absence of
such information, from published typical values).
9 Cyl.motors
NOx: 271 lbs/hr
PM: _____ lbs/hr
SO2: 12.12 lbs/hr
VOCs: _____ lbs/hr
CO: 7.71 lbs/hr
Skagway AK - 2008 Schedule: Date Times Dock
5-21 06:00-20:45 RRF
5-27 06:00-20:45 RRF
6-04 06:00-20:45 RRF
6-10 06:00-20:45 RRF
6-18 06:00-20:45 RRF
6-24 06:00-20:45 RRF
7-02 06:00-20:45 RRF
7-08 06:00-20:45 RRF
7-16 06:00-20:45 RRF
7-22 06:00-20:45 RRF
7-30 06:00-20:45 RRF
8-05 06:00-20:45 RRF
8-13 06:00-20:45 RRF
8-19 06:00-20:45 RRF
8-27 06:00-20:45 RRF
9-02 06:00-20:45 RRF
9-10 06:00-20:45 RRF
9-16 06:00-20:45 RRF

National Park Service – Southeast Alaska Inventory and Monitoring Program
Airborne Contaminants Study - DRAFT Emission Inventory form 2008
Fuel parameters for operation in Skagway
Fuel type combusted while in Skagway: (MDO, IFO, HFO)
IFO
Fuel sulfur content (maximum) based on percent of fuel weight:
1.84% (Max 2%)
Operational parameters while docked in Skagway
Operation mode while docked: (number of engines, gas-turbine auxiliary, boilers, incinerators)
2 motors +1 boiler (no incinerators in service)
Gas turbine On (no boiler in service no incinerators in service)
Fuel consumption per hour (average): 2.1 m/tons per hour (2 motors)
Hotel load: 9.6 MW
Auxiliary boiler fuel consumption rate (tons/hr): 0.23 M/Tons per hour
Air Pollution Control Device Information
Type:
Pollutant Control Efficiency SO2: PM: NOx:
Wartsila book of engine parameters for Nox Certification states the following:
NOx produced at 50% = 13 g/KwH = 0.0286 lbs/KwH
With the hotel load in port being approx. 9.5 MW there would be a total of 271 lbs/hour of Nox being
produced.

National Park Service – Southeast Alaska Inventory and Monitoring Program
Airborne Contaminants Study - DRAFT Emission Inventory form 2008
A-5 Royal Caribbean Cruise Lines
Ship Name: M/S Rhapsody of the Seas Capacity PAX: 2435 Crew: 765
Line Name: Royal Caribbean International
Physical Dimensions:
Lower Tier – outer rim of ship: Deck 5
Length: 278 meter
Width: 32 meter
Height above water: 14meter
Upper Tier (mean representation): Deck 10
Length: 219 meter
Width: 36 meter
Height above Tier 1: 16 meter
Stack Housing (tier 3): Top of Stack
Length: 11 meter
Width: 16 meter
Height above Tier 2: 21 meters
Engine parameters: Engine: Wartsila 12V46 (V-12 arrangement with 46 centimeter cylinders)
Engine output: 4 x 12.6 (MW)
Displacement: 1, 1156.8 (L) per cylinder
Stack Parameters
Stack distance from bow of ship (m): 231 meters
Stack height above water (m) 52 meters
Inside stack diameter (meters): There are multiple exhaust pipes inside structure, 4 from Main
Engines 1.2 meters diameter each, 2 from Boilers 0.7 meters diameter each, 2 from incinerators
0.6 meters in diameter each.
Stack angle from vertical (°): 27 degrees
Estimated exhaust gas temperature (K): N/A
Actual stack exit velocity (m/sec): N/A
Emission Rates (average emission rate while in Skagway)
(If emission rates are not provided, we can estimate from ship-specific parameters or in the
absence of such information, from published typical values).
Not measured
NOx: _____ lbs/hr
PM: _____ lbs/hr
SO2: _____ lbs/hr
VOCs: _____ lbs/hr
CO: ______lbs/hr

National Park Service – Southeast Alaska Inventory and Monitoring Program
Airborne Contaminants Study - DRAFT Emission Inventory form 2008
Fuel parameters for operation in Skagway
Fuel type combusted while in Skagway: (MDO, IFO, HFO) HFO 380 cst
Fuel sulfur content (maximum) based on percent of fuel weight: (1.5% - 2.0%)
Operational parameters while docked in Skagway
Operation mode while docked: (number of engines, gas-turbine auxiliary, boilers, incinerators)
Fuel consumption per hour (average): 1x DG 1.0-1.25 mt/hr
Hotel load: 5.3 MW (4.5-6)
Auxiliary boiler fuel consumption rate (tons/hr): 0.3-0.44 mt/hr
Air Pollution Control Device Information
Type: Scandinavian Boiler Service Opacity Monitor on all emitters
Pollutant Control Efficiency SO2: PM: NOx:

National Park Service – Southeast Alaska Inventory and Monitoring Program
Airborne Contaminants Study - DRAFT Emission Inventory form 2008
Ship Name: Serenade of the Seas Capacity PAX 2400 Crew 900
Line Name: Royal Caribbean Cruise Line
Physical Dimensions:
Lower Tier – outer rim of ship: PROMENADE DECK 05
Length: 285 meters
Width: 32 meters
Height above water: 11 meters
Upper Tier (mean representation): DECK OVERLOOKING THE POOL DECK, DK 12
Length: 236 meters
Width: 32 meters
Height above Tier 1: 22,5 meters
Stack Housing (tier 3): TOP OF THE FUNNEL
Length: 11 meters
Width: N/A
Height above Tier 2: 19 meters
Engine parameters: Engine: gas turbine General Electric LM 2500+
Engine output: 25000 kW
Displacement: N/A
Stack Parameters
Stack distance from bow of ship (m): 202 meters
Stack height above water (m): 52,5 meters
Inside stack diameter (meters): apx 3 meters
Stack angle from vertical (°): 0 deg
Estimated exhaust gas temperature (K): apx 200 deg C
Actual stack exit velocity (m/sec): data not available
Emission Rates (average emission rate while in Skagway)
(If emission rates are not provided, we can estimate from ship-specific parameters or in the
absence of such information, from published typical values).
NOx: less than 0.01 lbs/hr
PM: _n/a____ lbs/hr
SO2: n/a__ lbs/hr
VOCs: _n/a____ lbs/hr
CO: n/a lbs/hr

National Park Service – Southeast Alaska Inventory and Monitoring Program
Airborne Contaminants Study - DRAFT Emission Inventory form 2008
Fuel parameters for operation in Skagway
Fuel type combusted while in Skagway: (MDO, IFO, HFO): MGO
Fuel sulfur content (maximum) based on percent of fuel weight: as per analysis less than 0.05
%m/m
Operational parameters while docked in Skagway
Operation mode while docked: if Wartsila diesel stopped for maintenance gas turbine is running
Fuel consumption per hour (average): apx 2.6 tons/ hour
Hotel load: 5.5 MW
Auxiliary boiler fuel consumption rate (tons/hr): if GT is running steam produced by exhaust
boiler
Air Pollution Control Device Information
Type: N/A
Pollutant Control Efficiency SO2: PM: NOx:
Info from the web: “The COGES plant being installed on the Royal Caribbean and Celebrity ships will produce only 5.0 g/kWh NOx at 47 MW without any emission reduction systems. By using GE's Dry Low Emission system for the LM2500 and 2500+, NOx can be reduced to less than 1 g/kWh. The engine controls monitor emissions on-line and adjust fuel burn automatically to maintain preset levels of both NOx and CO.”

National Park Service – Southeast Alaska Inventory and Monitoring Program
Airborne Contaminants Study - DRAFT Emission Inventory form 2008
Ship Name: Serenade of the Seas Capacity PAX 2400 Crew 900
Line Name: Royal Caribbean Cruise Line
Physical Dimensions:
Lower Tier – outer rim of ship: PROMENADE DECK #05
Length: 285 meters
Width: 32 meters
Height above water: 11meters
Upper Tier (mean representation): DECK OVERLOOKING THE POOL DECK, DK #12
Length:236 meters
Width: 32 meters
Height above Tier 1: 22,5 meters
Stack Housing (tier 3): TOP OF THE FUNNEL
Length: 11 meters
Width: n/a
Height above Tier 2: 19 meters
Engine parameters: Engine: Wartsila W38B
Engine output: 11600 kW
Displacement: N/A
Stack Parameters
Stack distance from bow of ship (m): 202 meters
Stack height above water (m): 52,5 meters
Inside stack diameter (meters): stack is not circle / it is oval
Stack angle from vertical (°): 0 deg
Estimated exhaust gas temperature (K): apx 200 deg C
Actual stack exit velocity (m/sec): data not available
Emission Rates (average emission rate while in Skagway)
(If emission rates are not provided, we can estimate from ship-specific parameters or in the
absence of such information, from published typical values).
NOx: apx 80 lbs/hr
PM: _n/a____ lbs/hr
SO2: n/a__ lbs/hr
VOCs: _n/a____ lbs/hr
CO: apx 1.2 lbs/hr

National Park Service – Southeast Alaska Inventory and Monitoring Program
Airborne Contaminants Study - DRAFT Emission Inventory form 2008
Fuel parameters for operation in Skagway
Fuel type combusted while in Skagway: (MDO, IFO, HFO): IFO 380
Fuel sulfur content (maximum) based on percent of fuel weight: as per analysis 1.44 %m/m
Operational parameters while docked in Skagway
Operation mode while docked: Wartsila diesel with oil fired boiler
Fuel consumption per hour (average): apx 1.3 tons/ hour
Hotel load: 5.5 MW
Auxiliary boiler fuel consumption rate (tons/hr): apx 0.1 ton/ hour
Air Pollution Control Device Information
Type: N/A
Pollutant Control Efficiency SO2: PM: NOx:

National Park Service – Southeast Alaska Inventory and Monitoring Program
Airborne Contaminants Study - DRAFT Emission Inventory form 2008
Ship Name: Radiance of the Sea Capacity PAX Crew
Line Name: Royal Caribbean
Physical Dimensions:
Lower Tier – outer rim of ship: dk 6.
Length: 293.2m
Width: 32.2m.
Height above water: 10.9m
Upper Tier (mean representation): dk. 11.
Length:245.7m
Width: 32.2m.
Height above Tier 1:18.75m.
Stack Housing (tier 3): dk 14
Length: 28.21m
Width: 13.65m
Height above Tier 2: 24.350m
Engine parameters: Engine: GE LM 2500+
Engine output: GE LM2500+ Gas turbine 25MW. Wartsila 16V38B – 11.6MW.
Displacement: Wartsila 38 = 53.870,578 cc/cyl.
Stack Parameters
Stack distance from bow of ship (195m):
Stack height above water (52.40m)
Inside stack diameter (2.246 meters):
Stack angle from vertical (90°):
Estimated exhaust gas temperature (K): GE Gas turbine @ ambient temperature 15C, 100% load,
25 MW, 509C @ 21.1 MW.515C. After eco. 255 C.
Actual stack exit velocity (m/sec): 79.69 m/s. (275639kg/hr)
Emission Rates (average emission rate while in Skagway)
(If emission rates are not provided, we can estimate from ship-specific parameters, or in the
absence of such information, from published typical values).
(I only have onboard so far Infinity’s emission test report that was done in Vancouver a few
years back).
National Park Service – Southeast Alaska Inventory and Monitoring Program
Airborne Contaminants Study - DRAFT Emission Inventory form 2008
NOx: _____ lbs/hr
PM: _____ lbs/hr
SO2: _____ lbs/hr
VOCs: _____ lbs/hr
CO: ______lbs/hr
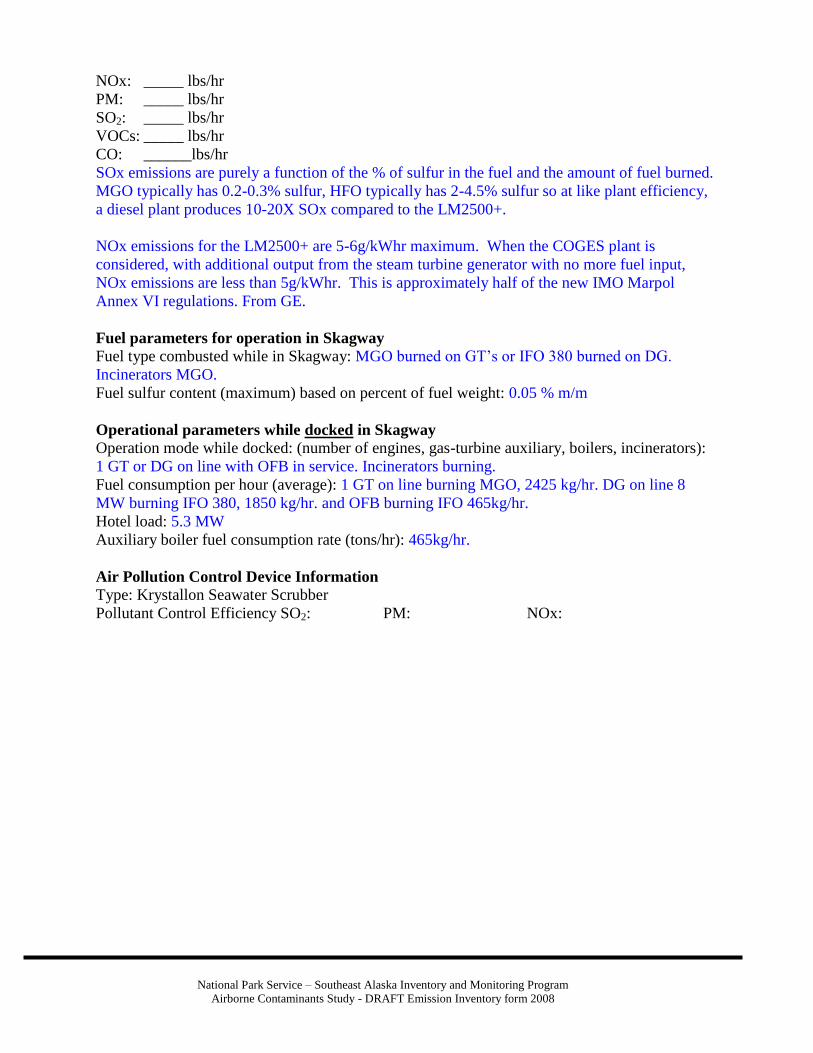
SOx emissions are purely a function of the % of sulfur in the fuel and the amount of fuel burned.
MGO typically has 0.2-0.3% sulfur, HFO typically has 2-4.5% sulfur so at like plant efficiency,
a diesel plant produces 10-20X SOx compared to the LM2500+.
NOx emissions for the LM2500+ are 5-6g/kWhr maximum. When the COGES plant is
considered, with additional output from the steam turbine generator with no more fuel input,
NOx emissions are less than 5g/kWhr. This is approximately half of the new IMO Marpol
Annex VI regulations. From GE.
Fuel parameters for operation in Skagway
Fuel type combusted while in Skagway: MGO burned on GT’s or IFO 380 burned on DG.
Incinerators MGO.
Fuel sulfur content (maximum) based on percent of fuel weight: 0.05 % m/m
Operational parameters while docked in Skagway
Operation mode while docked: (number of engines, gas-turbine auxiliary, boilers, incinerators):
1 GT or DG on line with OFB in service. Incinerators burning.
Fuel consumption per hour (average): 1 GT on line burning MGO, 2425 kg/hr. DG on line 8
MW burning IFO 380, 1850 kg/hr. and OFB burning IFO 465kg/hr.
Hotel load: 5.3 MW
Auxiliary boiler fuel consumption rate (tons/hr): 465kg/hr.
Air Pollution Control Device Information
Type: Krystallon Seawater Scrubber
Pollutant Control Efficiency SO2: PM: NOx:

National Park Service – Southeast Alaska Inventory and Monitoring Program
Airborne Contaminants Study - DRAFT Emission Inventory form 2008
Appendix B Wartsila NOx Emission Factor

National Park Service – Southeast Alaska Inventory and Monitoring Program
Airborne Contaminants Study - DRAFT Emission Inventory form 2008

National Park Service – Southeast Alaska Inventory and Monitoring Program
Airborne Contaminants Study - DRAFT Emission Inventory form 2008

National Park Service – Southeast Alaska Inventory and Monitoring Program
Airborne Contaminants Study - DRAFT Emission Inventory form 2008

National Park Service – Southeast Alaska Inventory and Monitoring Program
Airborne Contaminants Study - DRAFT Emission Inventory form 2008

National Park Service – Southeast Alaska Inventory and Monitoring Program
Airborne Contaminants Study - DRAFT Emission Inventory form 2008
Related Documents