Air pollution Air pollution from World War II production. Smog over Santiago From Wikipedia, the free encyclopedia Air pollution is the introduction of chemicals, particulate matter, or biological materials that cause harm or discomfort to humans or other living organisms, or damages the natural environment, into the atmosphere. The atmosphere is a complex, dynamic natural gaseous system that is essential to support life on planet Earth. Stratospheric ozone depletion due to air pollution has long been recognized as a threat to human health as well as to the Earth's ecosystems. Contents 1 Pollutants 2 Sources 2.1 Emission factors 3 Indoor air quality (IAQ) 4 Health effects 4.1 Effects on cystic fibrosis 4.2 Effects on COPD 4.3 The Great Smog of 1952 4.4 Effects on children 4.5 Health effects in relatively "clean" areas 5 Reduction efforts 5.1 Control devices 6 Legal regulations 6.1 Canada 6.2 European Union 6.2.1 United Kingdom 6.3 United States 7 Statistics 7.1 Most polluted cities 7.2 Carbon dioxide emissions 8 Atmospheric dispersion 9 Environmental impacts of greenhouse gas pollutants 10 See also 11 References 12 External links Pollutants Main articles: Pollutant and Greenhouse gas 1 of 12

Air Pollution
Jan 03, 2016
Air Pullution
Welcome message from author
This document is posted to help you gain knowledge. Please leave a comment to let me know what you think about it! Share it to your friends and learn new things together.
Transcript

Air pollution
Air pollution from World War II production.
Smog over Santiago
From Wikipedia, the free encyclopedia
Air pollution is the introduction of chemicals, particulate matter, or biological
materials that cause harm or discomfort to humans or other living organisms, or
damages the natural environment, into the atmosphere.
The atmosphere is a complex, dynamic natural gaseous system that is essential
to support life on planet Earth. Stratospheric ozone depletion due to air pollution
has long been recognized as a threat to human health as well as to the Earth's
ecosystems.
Contents
1 Pollutants
2 Sources
2.1 Emission factors
3 Indoor air quality (IAQ)
4 Health effects
4.1 Effects on cystic fibrosis
4.2 Effects on COPD
4.3 The Great Smog of 1952
4.4 Effects on children
4.5 Health effects in relatively "clean" areas
5 Reduction efforts
5.1 Control devices
6 Legal regulations
6.1 Canada
6.2 European Union
6.2.1 United Kingdom
6.3 United States
7 Statistics
7.1 Most polluted cities
7.2 Carbon dioxide emissions
8 Atmospheric dispersion
9 Environmental impacts of greenhouse gas pollutants
10 See also
11 References
12 External links
Pollutants
Main articles: Pollutant and Greenhouse gas
1 of 12

Before flue gas desulfurizationwas installed, the emissions
from this power plant in NewMexico contained excessiveamounts of sulfur dioxide.
Schematic drawing, causes and effects of air pollution: (1)greenhouse effect, (2) particulate contamination, (3) increasedUV radiation, (4) acid rain, (5) increased ozone concentration,
(6) increased levels of nitrogen oxides
An air pollutant is known as a substance in the air that can cause harm to humans and the
environment. Pollutants can be in the form of solid particles, liquid droplets, or gases. In addition,
they may be natural or man-made.[1]
Pollutants can be classified as either primary or secondary. Usually, primary pollutants are
substances directly emitted from a process, such as ash from a volcanic eruption, the carbon
monoxide gas from a motor vehicle exhaust or sulfur dioxide released from factories.
Secondary pollutants are not emitted directly. Rather, they form in the air when primary pollutants
react or interact. An important example of a secondary pollutant is ground level ozone — one of
the many secondary pollutants that make up photochemical smog.
Note that some pollutants may be both primary and secondary: that is, they are both emitted
directly and formed from other primary pollutants.
About 4 percent of deaths in the United States can be attributed to air
pollution, according to the Environmental Science Engineering
Program at the Harvard School of Public Health.
Major primary pollutants produced by human activity include:
Sulfur oxides (SOx) - especially sulfur dioxide, a chemical
compound with the formula SO2. SO2 is produced by volcanoes
and in various industrial processes. Since coal and petroleum
often contain sulfur compounds, their combustion generates
sulfur dioxide. Further oxidation of SO2, usually in the presence
of a catalyst such as NO2, forms H2SO4, and thus acid rain.[2]
This is one of the causes for concern over the environmental
impact of the use of these fuels as power sources.
Nitrogen oxides (NOx) - especially nitrogen dioxide are emitted
from high temperature combustion. Can be seen as the brown
haze dome above or plume downwind of cities.Nitrogen dioxide
is the chemical compound with the formula NO2. It is one of the several nitrogen oxides. This reddish-brown toxic gas has a
characteristic sharp, biting odor. NO2 is one of the most prominent air pollutants.
Carbon monoxide - is a colourless, odourless, non-irritating but very poisonous gas. It is a product by incomplete combustion
of fuel such as natural gas, coal or wood. Vehicular exhaust is a major source of carbon monoxide.
Carbon dioxide (CO2) - a greenhouse gas emitted from combustion but is also a gas vital to living organisms. It is a natural gas
in the atmosphere.
Volatile organic compounds - VOCs are an important outdoor air pollutant. In this field they are often divided into the
separate categories of methane (CH4) and non-methane (NMVOCs). Methane is an extremely efficient greenhouse gas which
contributes to enhanced global warming. Other hydrocarbon VOCs are also significant greenhouse gases via their role in
creating ozone and in prolonging the life of methane in the atmosphere, although the effect varies depending on local air
quality. Within the NMVOCs, the aromatic compounds benzene, toluene and xylene are suspected carcinogens and may lead
to leukemia through prolonged exposure. 1,3-butadiene is another dangerous compound which is often associated with
industrial uses.
Particulate matter - Particulates, alternatively referred to as particulate matter (PM) or fine particles, are tiny particles of solid
or liquid suspended in a gas. In contrast, aerosol refers to particles and the gas together. Sources of particulate matter can be
man made or natural. Some particulates occur naturally, originating from volcanoes, dust storms, forest and grassland fires,
living vegetation, and sea spray. Human activities, such as the burning of fossil fuels in vehicles, power plants and various
industrial processes also generate significant amounts of aerosols. Averaged over the globe, anthropogenic aerosols—those
made by human activities—currently account for about 10 percent of the total amount of aerosols in our atmosphere.
Increased levels of fine particles in the air are linked to health hazards such as heart disease, altered lung function and lung
cancer.
Toxic metals, such as lead, cadmium and copper.
Chlorofluorocarbons (CFCs) - harmful to the ozone layer emitted from products currently banned from use.
Ammonia (NH3) - emitted from agricultural processes. Ammonia is a compound with the formula NH3. It is normally
encountered as a gas with a characteristic pungent odor. Ammonia contributes significantly to the nutritional needs of
terrestrial organisms by serving as a precursor to foodstuffs and fertilizers. Ammonia, either directly or indirectly, is also a
building block for the synthesis of many pharmaceuticals. Although in wide use, ammonia is both caustic and hazardous.
Odors — such as from garbage, sewage, and industrial processes
Radioactive pollutants - produced by nuclear explosions, war explosives, and natural processes such as the radioactive decay
of radon.
Secondary pollutants include:
2 of 12

Dust storm approaching Stratford, Texas
Controlled burning of a field outside of Statesboro,Georgia in preparation for spring planting
Particulate matter formed from gaseous primary pollutants and compounds in photochemical smog .Smog is a kind of air
pollution; the word "smog" is a portmanteau of smoke and fog. Classic smog results from large amounts of coal burning in an
area caused by a mixture of smoke and sulfur dioxide. Modern smog does not usually come from coal but from vehicular and
industrial emissions that are acted on in the atmosphere by sunlight to form secondary pollutants that also combine with the
primary emissions to form photochemical smog.
Ground level ozone (O3) formed from NOx and VOCs. Ozone (O3) is a key constituent of the troposphere (it is also an
important constituent of certain regions of the stratosphere commonly known as the Ozone layer). Photochemical and
chemical reactions involving it drive many of the chemical processes that occur in the atmosphere by day and by night. At
abnormally high concentrations brought about by human activities (largely the combustion of fossil fuel), it is a pollutant, and
a constituent of smog.
Peroxyacetyl nitrate (PAN) - similarly formed from NOx and VOCs.
Minor air pollutants include:
A large number of minor hazardous air pollutants. Some of these are regulated in USA under the Clean Air Act and in Europe
under the Air Framework Directive.
A variety of persistent organic pollutants, which can attach to particulate matter.
Persistent organic pollutants (POPs) are organic compounds that are resistant to environmental degradation through chemical,
biological, and photolytic processes. Because of this, they have been observed to persist in the environment, to be capable of
long-range transport, bioaccumulate in human and animal tissue, biomagnify in food chains, and to have potential significant
impacts on human health and the environment.
Sources
Main article: AP 42 Compilation of Air Pollutant Emission Factors
Sources of air pollution refer to the various locations, activities or factors which
are responsible for the releasing of pollutants in the atmosphere. These sources
can be classified into two major categories which are:
Anthropogenic sources (human activity) mostly related to burning different
kinds of fuel
"Stationary Sources" include smoke stacks of power plants,
manufacturing facilities (factories) and waste incinerators, as well as
furnaces and other types of fuel-burning heating devices
"Mobile Sources" include motor vehicles, marine vessels, aircraft and the
effect of sound etc.
Chemicals, dust and controlled burn practices in agriculture and forestry
management. Controlled or prescribed burning is a technique sometimes
used in forest management, farming, prairie restoration or greenhouse gas
abatement. Fire is a natural part of both forest and grassland ecology and
controlled fire can be a tool for foresters. Controlled burning stimulates
the germination of some desirable forest trees, thus renewing the forest.
Fumes from paint, hair spray, varnish, aerosol sprays and other solvents
Waste deposition in landfills, which generate methane.Methane is not
toxic; however, it is highly flammable and may form explosive mixtures
with air. Methane is also an asphyxiant and may displace oxygen in an
enclosed space. Asphyxia or suffocation may result if the oxygen concentration is reduced to below 19.5% by displacement
Military, such as nuclear weapons, toxic gases, germ warfare and rocketry
�atural sources
Dust from natural sources, usually large areas of land with little or no vegetation.
Methane, emitted by the digestion of food by animals, for example cattle.
Radon gas from radioactive decay within the Earth's crust. Radon is a colorless, odorless, naturally occurring, radioactive
noble gas that is formed from the decay of radium. It is considered to be a health hazard. Radon gas from natural sources can
accumulate in buildings, especially in confined areas such as the basement and it is the second most frequent cause of lung
cancer, after cigarette smoking.
Smoke and carbon monoxide from wildfires.
3 of 12

Volcanic activity, which produce sulfur, chlorine, and ash particulates.
Emission factors
Main article: AP 42 Compilation of Air Pollutant Emission Factors
Air pollutant emission factors are representative values that attempt to relate the quantity of a pollutant released to the ambient air
with an activity associated with the release of that pollutant. These factors are usually expressed as the weight of pollutant divided
by a unit weight, volume, distance, or duration of the activity emitting the pollutant (e.g., kilograms of particulate emitted per
megagram of coal burned). Such factors facilitate estimation of emissions from various sources of air pollution. In most cases, these
factors are simply averages of all available data of acceptable quality, and are generally assumed to be representative of long-term
averages.
The United States Environmental Protection Agency has published a compilation of air pollutant emission factors for a multitude of
industrial sources.[2] The United Kingdom, Australia, Canada and many other countries have published similar compilations, as well
as the European Environment Agency.[3][4][5][6][7]
Indoor air quality (IAQ)
Main article: Indoor air quality
A lack of ventilation indoors concentrates air pollution where people often spend the majority of their time. Radon (Rn) gas, a
carcinogen, is exuded from the Earth in certain locations and trapped inside houses. Building materials including carpeting and
plywood emit formaldehyde (H2CO) gas. Paint and solvents give off volatile organic compounds (VOCs) as they dry. Lead paint
can degenerate into dust and be inhaled. Intentional air pollution is introduced with the use of air fresheners, incense, and other
scented items. Controlled wood fires in stoves and fireplaces can add significant amounts of smoke particulates into the air, inside
and out[8]. Indoor pollution fatalities may be caused by using pesticides and other chemical sprays indoors without proper
ventilation.
Carbon monoxide (CO) poisoning and fatalities are often caused by faulty vents and chimneys, or by the burning of charcoal
indoors. Chronic carbon monoxide poisoning can result even from poorly adjusted pilot lights. Traps are built into all domestic
plumbing to keep sewer gas, hydrogen sulfide, out of interiors. Clothing emits tetrachloroethylene, or other dry cleaning fluids, for
days after dry cleaning.
Though its use has now been banned in many countries, the extensive use of asbestos in industrial and domestic environments in the
past has left a potentially very dangerous material in many localities. Asbestosis is a chronic inflammatory medical condition
affecting the tissue of the lungs. It occurs after long-term, heavy exposure to asbestos from asbestos-containing materials in
structures. Sufferers have severe dyspnea (shortness of breath) and are at an increased risk regarding several different types of lung
cancer. As clear explanations are not always stressed in non-technical literature, care should be taken to distinguish between several
forms of relevant diseases. According to the World Health Organisation (WHO) (http://www.euro.who.int/document
/aiq/6_2_asbestos.pdf) , these may defined as; asbestosis, lung cancer, and mesothelioma (generally a very rare form of cancer,
when more widespread it is almost always associated with prolonged exposure to asbestos).
Biological sources of air pollution are also found indoors, as gases and airborne particulates. Pets produce dander, people produce
dust from minute skin flakes and decomposed hair, dust mites in bedding, carpeting and furniture produce enzymes and
micrometre-sized fecal droppings, inhabitants emit methane, mold forms in walls and generates mycotoxins and spores, air
conditioning systems can incubate Legionnaires' disease and mold, and houseplants, soil and surrounding gardens can produce
pollen, dust, and mold. Indoors, the lack of air circulation allows these airborne pollutants to accumulate more than they would
otherwise occur in nature.
Health effects
The World Health Organization states that 2.4 million people die each year from causes directly attributable to air pollution, with 1.5
million of these deaths attributable to indoor air pollution.[9] "Epidemiological studies suggest that more than 500,000 Americans die
each year from cardiopulmonary disease linked to breathing fine particle air pollution. . ."[10] A study by the University of
Birmingham has shown a strong correlation between pneumonia related deaths and air pollution from motor vehicles.[11] Worldwide
more deaths per year are linked to air pollution than to automobile accidents. Published in 2005 suggests that 310,000 Europeans die
from air pollution annually. Direct causes of air pollution related deaths include aggravated asthma, bronchitis, emphysema, lung
and heart diseases, and respiratory allergies. The US EPA estimates that a proposed set of changes in diesel engine technology (Tier
2) could result in 12,000 fewer premature mortalities, 15,000 fewer heart attacks, 6,000 fewer emergency room visits by children
with asthma, and 8,900 fewer respiratory-related hospital admissions each year in the United States.
The worst short term civilian pollution crisis in India was the 1984 Bhopal Disaster.[12] Leaked industrial vapors from the Union
4 of 12
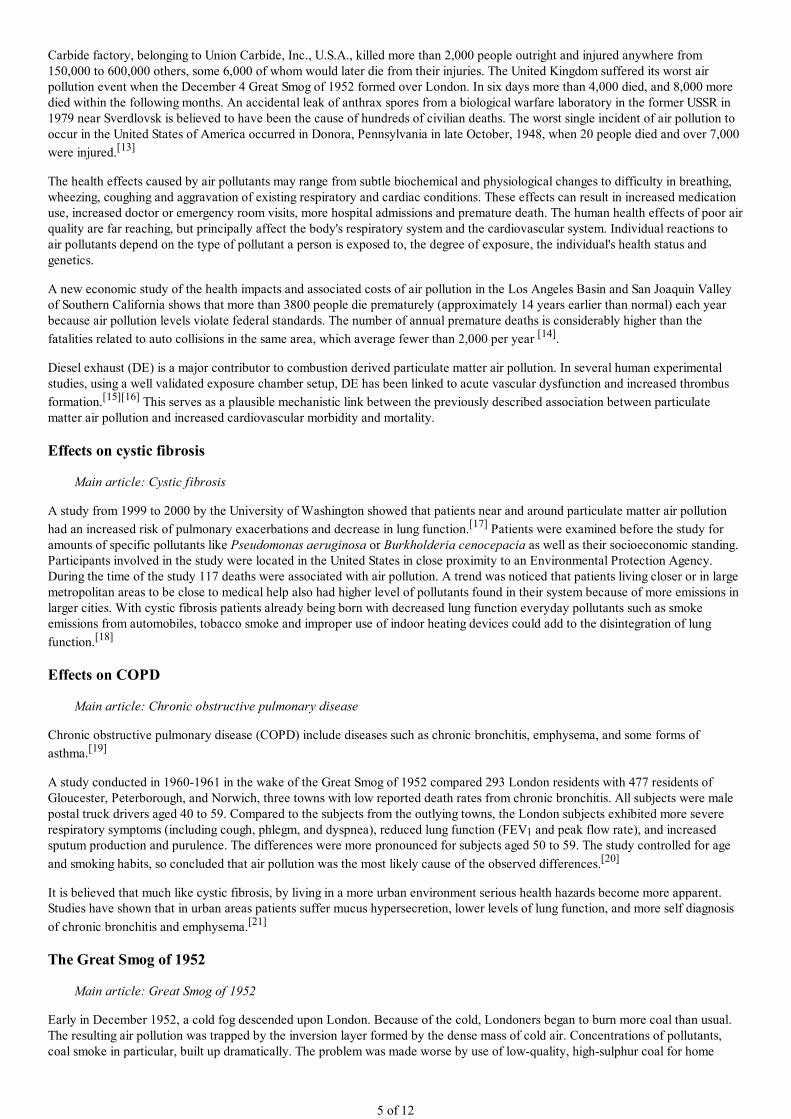
Carbide factory, belonging to Union Carbide, Inc., U.S.A., killed more than 2,000 people outright and injured anywhere from
150,000 to 600,000 others, some 6,000 of whom would later die from their injuries. The United Kingdom suffered its worst air
pollution event when the December 4 Great Smog of 1952 formed over London. In six days more than 4,000 died, and 8,000 more
died within the following months. An accidental leak of anthrax spores from a biological warfare laboratory in the former USSR in
1979 near Sverdlovsk is believed to have been the cause of hundreds of civilian deaths. The worst single incident of air pollution to
occur in the United States of America occurred in Donora, Pennsylvania in late October, 1948, when 20 people died and over 7,000
were injured.[13]
The health effects caused by air pollutants may range from subtle biochemical and physiological changes to difficulty in breathing,
wheezing, coughing and aggravation of existing respiratory and cardiac conditions. These effects can result in increased medication
use, increased doctor or emergency room visits, more hospital admissions and premature death. The human health effects of poor air
quality are far reaching, but principally affect the body's respiratory system and the cardiovascular system. Individual reactions to
air pollutants depend on the type of pollutant a person is exposed to, the degree of exposure, the individual's health status and
genetics.
A new economic study of the health impacts and associated costs of air pollution in the Los Angeles Basin and San Joaquin Valley
of Southern California shows that more than 3800 people die prematurely (approximately 14 years earlier than normal) each year
because air pollution levels violate federal standards. The number of annual premature deaths is considerably higher than the
fatalities related to auto collisions in the same area, which average fewer than 2,000 per year [14].
Diesel exhaust (DE) is a major contributor to combustion derived particulate matter air pollution. In several human experimental
studies, using a well validated exposure chamber setup, DE has been linked to acute vascular dysfunction and increased thrombus
formation.[15][16] This serves as a plausible mechanistic link between the previously described association between particulate
matter air pollution and increased cardiovascular morbidity and mortality.
Effects on cystic fibrosis
Main article: Cystic fibrosis
A study from 1999 to 2000 by the University of Washington showed that patients near and around particulate matter air pollution
had an increased risk of pulmonary exacerbations and decrease in lung function.[17] Patients were examined before the study for
amounts of specific pollutants like Pseudomonas aeruginosa or Burkholderia cenocepacia as well as their socioeconomic standing.
Participants involved in the study were located in the United States in close proximity to an Environmental Protection Agency.
During the time of the study 117 deaths were associated with air pollution. A trend was noticed that patients living closer or in large
metropolitan areas to be close to medical help also had higher level of pollutants found in their system because of more emissions in
larger cities. With cystic fibrosis patients already being born with decreased lung function everyday pollutants such as smoke
emissions from automobiles, tobacco smoke and improper use of indoor heating devices could add to the disintegration of lung
function.[18]
Effects on COPD
Main article: Chronic obstructive pulmonary disease
Chronic obstructive pulmonary disease (COPD) include diseases such as chronic bronchitis, emphysema, and some forms of
asthma.[19]
A study conducted in 1960-1961 in the wake of the Great Smog of 1952 compared 293 London residents with 477 residents of
Gloucester, Peterborough, and Norwich, three towns with low reported death rates from chronic bronchitis. All subjects were male
postal truck drivers aged 40 to 59. Compared to the subjects from the outlying towns, the London subjects exhibited more severe
respiratory symptoms (including cough, phlegm, and dyspnea), reduced lung function (FEV1 and peak flow rate), and increased
sputum production and purulence. The differences were more pronounced for subjects aged 50 to 59. The study controlled for age
and smoking habits, so concluded that air pollution was the most likely cause of the observed differences.[20]
It is believed that much like cystic fibrosis, by living in a more urban environment serious health hazards become more apparent.
Studies have shown that in urban areas patients suffer mucus hypersecretion, lower levels of lung function, and more self diagnosis
of chronic bronchitis and emphysema.[21]
The Great Smog of 1952
Main article: Great Smog of 1952
Early in December 1952, a cold fog descended upon London. Because of the cold, Londoners began to burn more coal than usual.
The resulting air pollution was trapped by the inversion layer formed by the dense mass of cold air. Concentrations of pollutants,
coal smoke in particular, built up dramatically. The problem was made worse by use of low-quality, high-sulphur coal for home
5 of 12

heating in London in order to permit export of higher-quality coal, because of the country's tenuous postwar economic situation.
The "fog", or smog, was so thick that driving became difficult or impossible.[22]. The extreme reduction in visibility was
accompanied by an increase in criminal activity as well as transportation delays and a virtual shut down of the city. During the 4 day
period of fog, at least 4,000 people died as a direct result of the weather.[23]
Effects on children
Cities around the world with high exposure to air pollutants have the possibility of children living within them to develop asthma,
pneumonia and other lower respiratory infections as well as a low initial birth rate. Protective measures to ensure the youths' health
are being taken in cities such as New Delhi, India where buses now use compressed natural gas to help eliminate the “pea-soup”
smog.[24] Research by the World Health Organization shows there is the greatest concentration of particulate matter particles in
countries with low economic world power and high poverty and population rates. Examples of these countries include Egypt, Sudan,
Mongolia, and Indonesia. The Clean Air Act was passed in 1970, however in 2002 at least 146 million Americans were living in
areas that did not meet at least one of the “criteria pollutants” laid out in the 1997 National Ambient Air Quality Standards.[25]
Those pollutants included: ozone, particulate matter, sulfur dioxide, nitrogen dioxide, carbon monoxide, and lead. Because children
are outdoors more and have higher minute ventilation they are more susceptible to the dangers of air pollution.
Health effects in relatively "clean" areas
Even in areas with relatively low levels of air pollution, public health effects can be substantial and costly. This is because effects
can occur at very low levels and a large number of people can potentially breathe in such pollutants. A 2005 scientific study for the
British Columbia Lung Association showed that a 1% improvement in ambient PM2.5 and ozone concentrations will produce a $29
million in annual savings in the region in 2010[26]. This finding is based on health valuation of lethal (mortality) and sub-lethal
(morbidity) effects.
Reduction efforts
There are various air pollution control technologies and land use planning strategies available to reduce air pollution. At its most
basic level land use planning is likely to involve zoning and transport infrastructure planning. In most developed countries, land use
planning is an important part of social policy, ensuring that land is used efficiently for the benefit of the wider economy and
population as well as to protect the environment.
Efforts to reduce pollution from mobile sources includes primary regulation (many developing countries have permissive
regulations), expanding regulation to new sources (such as cruise and transport ships, farm equipment, and small gas-powered
equipment such as lawn trimmers, chainsaws, and snowmobiles), increased fuel efficiency (such as through the use of hybrid
vehicles), conversion to cleaner fuels (such as bioethanol, biodiesel, or conversion to electric vehicles).
Control devices
The following items are commonly used as pollution control devices by industry or transportation devices. They can either destroy
contaminants or remove them from an exhaust stream before it is emitted into the atmosphere.
Particulate control
Mechanical collectors (dust cyclones,
multicyclones)
Electrostatic precipitators An electrostatic
precipitator (ESP), or electrostatic air cleaner is a
particulate collection device that removes particles
from a flowing gas (such as air) using the force of
an induced electrostatic charge. Electrostatic
precipitators are highly efficient filtration devices
that minimally impede the flow of gases through the
device, and can easily remove fine particulate
matter such as dust and smoke from the air stream.
Baghouses Designed to handle heavy dust loads, a
dust collector consists of a blower, dust filter, a
filter-cleaning system, and a dust receptacle or dust
removal system (distinguished from air cleaners
which utilize disposable filters to remove the dust).
Particulate scrubbersWet scrubber is a form of
pollution control technology. The term describes a
variety of devices that use pollutants from a furnace
flue gas or from other gas streams. In a wet
scrubber, the polluted gas stream is brought into
contact with the scrubbing liquid, by spraying it
with the liquid, by forcing it through a pool of
liquid, or by some other contact method, so as to
remove the pollutants.
Scrubbers
Baffle spray scrubber
Cyclonic spray scrubber
Ejector venturi scrubber
Mechanically aided scrubber
Spray tower
Wet scrubber
�Ox control
Low NOx burnersSelective catalytic reduction (SCR)
Selective non-catalytic reduction (SNCR)
NOx scrubbers
Exhaust gas recirculation
Catalytic converter (also for VOC control)
6 of 12

Smog in Cairo
VOC abatement
Adsorption systems, such as activated carbon
Flares
Thermal oxidizers
Catalytic oxidizers
Biofilters
Absorption (scrubbing)
Cryogenic condensersVapor recovery systems
Acid Gas/SO2 control
Wet scrubbers
Dry scrubbers
Flue gas desulfurization
Mercury control
Sorbent Injection Technology
Electro-Catalytic Oxidation (ECO)
K-Fuel
Dioxin and furan control
Miscellaneous associated equipment
Source capturing systems
Continuous emissions monitoring systems (CEMS)
Legal regulations
In general, there are two types of air quality standards. The first class of
standards (such as the U.S. National Ambient Air Quality Standards) set
maximum atmospheric concentrations for specific pollutants. Environmental
agencies enact regulations which are intended to result in attainment of these
target levels. The second class (such as the North American Air Quality Index)
take the form of a scale with various thresholds, which is used to communicate
to the public the relative risk of outdoor activity. The scale may or may not
distinguish between different pollutants.
Canada
In Canada, air quality is typically evaluated against standards set by the
Canadian Council of Ministers of the Environment (CCME), an inter-
governmental body of federal, provincial and territorial Ministers responsible for
the environment. The CCME has set Canada Wide Standards(CWS).[27][28]
These are:
CWS for PM2.5 = 30 µg/m3 (24 hour averaging time, by year 2010, based on 98th percentile ambient measurement annually,
averaged over 3 consecutive years).
CWS for ozone = 65 ppb (8-hour averaging time, by year 2010, achievement is based on the 4th highest measurement
annually, averaged over 3 consecutive years).
Note that there is no consequence in Canada to not achieving these standards. In addition, these only apply to jurisdictions with
populations greater than 100,000. Further, provinces and territories may set more stringent standards than those set by the CCME.
European Union
A report from the European Environment Agency shows that road transport remains Europe’s single largest air polluter [29] .
National Emission Ceilings (NEC) for certain atmospheric pollutants are regulated by Directive 2001/81/EC (NECD).[30] As part of
the preparatory work associated with the revision of the NECD, the European Commission is assisted by the NECPI working group
(National Emission Ceilings – Policy Instruments).[31]
Directive 2008/50/EC of the European Parliament and of the Council of 21 May 2008 on ambient air quality and cleaner air for
Europe (the new Air Quality Directive) has entried into force 2008-06-11 [32].
Individual citizens can force their local councils to tackle air pollution, following an important ruling in July 2009 from the European
Court of Justice (ECJ). The EU’s court was asked to judge the case of a resident of Munich, Dieter Janecek, who said that under the
1996 EU Air Quality Directive (Council Directive 96/62/EC of 27 September 1996 on ambient air quality assessment and
management [33]) the Munich authorities were obliged to take action to stop pollution exceeding specified targets. Janecek then
took his case to the ECJ, whose judges said European citizens are entitled to demand air quality action plans from local authorities
in situations where there is a risk that EU limits will be overshot. [29] .
United Kingdom
Air quality targets set by the UK's Department for Environment, Food and Rural Affairs (DEFRA) are mostly aimed at local
government representatives responsible for the management of air quality in cities, where air quality management is the most urgent.
7 of 12
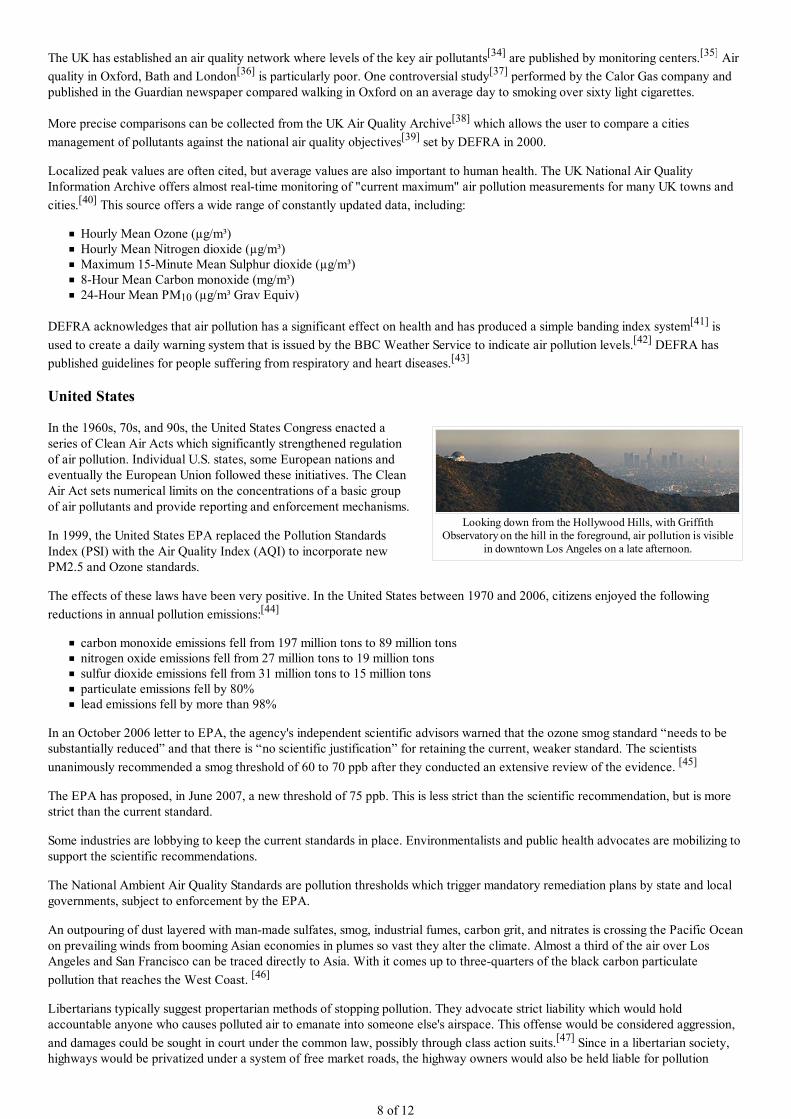
Looking down from the Hollywood Hills, with GriffithObservatory on the hill in the foreground, air pollution is visible
in downtown Los Angeles on a late afternoon.
The UK has established an air quality network where levels of the key air pollutants[34] are published by monitoring centers.[35] Air
quality in Oxford, Bath and London[36] is particularly poor. One controversial study[37] performed by the Calor Gas company and
published in the Guardian newspaper compared walking in Oxford on an average day to smoking over sixty light cigarettes.
More precise comparisons can be collected from the UK Air Quality Archive[38] which allows the user to compare a cities
management of pollutants against the national air quality objectives[39] set by DEFRA in 2000.
Localized peak values are often cited, but average values are also important to human health. The UK National Air Quality
Information Archive offers almost real-time monitoring of "current maximum" air pollution measurements for many UK towns and
cities.[40] This source offers a wide range of constantly updated data, including:
Hourly Mean Ozone (µg/m³)
Hourly Mean Nitrogen dioxide (µg/m³)
Maximum 15-Minute Mean Sulphur dioxide (µg/m³)
8-Hour Mean Carbon monoxide (mg/m³)
24-Hour Mean PM10 (µg/m³ Grav Equiv)
DEFRA acknowledges that air pollution has a significant effect on health and has produced a simple banding index system[41] is
used to create a daily warning system that is issued by the BBC Weather Service to indicate air pollution levels.[42] DEFRA has
published guidelines for people suffering from respiratory and heart diseases.[43]
United States
In the 1960s, 70s, and 90s, the United States Congress enacted a
series of Clean Air Acts which significantly strengthened regulation
of air pollution. Individual U.S. states, some European nations and
eventually the European Union followed these initiatives. The Clean
Air Act sets numerical limits on the concentrations of a basic group
of air pollutants and provide reporting and enforcement mechanisms.
In 1999, the United States EPA replaced the Pollution Standards
Index (PSI) with the Air Quality Index (AQI) to incorporate new
PM2.5 and Ozone standards.
The effects of these laws have been very positive. In the United States between 1970 and 2006, citizens enjoyed the following
reductions in annual pollution emissions:[44]
carbon monoxide emissions fell from 197 million tons to 89 million tons
nitrogen oxide emissions fell from 27 million tons to 19 million tons
sulfur dioxide emissions fell from 31 million tons to 15 million tons
particulate emissions fell by 80%
lead emissions fell by more than 98%
In an October 2006 letter to EPA, the agency's independent scientific advisors warned that the ozone smog standard “needs to be
substantially reduced” and that there is “no scientific justification” for retaining the current, weaker standard. The scientists
unanimously recommended a smog threshold of 60 to 70 ppb after they conducted an extensive review of the evidence. [45]
The EPA has proposed, in June 2007, a new threshold of 75 ppb. This is less strict than the scientific recommendation, but is more
strict than the current standard.
Some industries are lobbying to keep the current standards in place. Environmentalists and public health advocates are mobilizing to
support the scientific recommendations.
The National Ambient Air Quality Standards are pollution thresholds which trigger mandatory remediation plans by state and local
governments, subject to enforcement by the EPA.
An outpouring of dust layered with man-made sulfates, smog, industrial fumes, carbon grit, and nitrates is crossing the Pacific Ocean
on prevailing winds from booming Asian economies in plumes so vast they alter the climate. Almost a third of the air over Los
Angeles and San Francisco can be traced directly to Asia. With it comes up to three-quarters of the black carbon particulate
pollution that reaches the West Coast. [46]
Libertarians typically suggest propertarian methods of stopping pollution. They advocate strict liability which would hold
accountable anyone who causes polluted air to emanate into someone else's airspace. This offense would be considered aggression,
and damages could be sought in court under the common law, possibly through class action suits.[47] Since in a libertarian society,
highways would be privatized under a system of free market roads, the highway owners would also be held liable for pollution
8 of 12

Most Polluted World Cities by PM[48]
Particulate
matter,
µg/m³ (2004)
City
169 Cairo, Egypt
150 Delhi, India
128 Kolkata, India (Calcutta)
125 Tianjin, China
123 Chongqing, China
109 Kanpur, India
109 Lucknow, India
104 Jakarta, Indonesia
101 Shenyang, China
Countries with the highest CO2 emissions
CountryCarbon dioxide emissions per
year (106 Tons) (2006)
Percentage of global total
China 6,103 21.5%
United States 5,752 20.2%
Russia 1,564 5.5%
India 1,510 5.3%
Japan 1293 4.6%
Germany 805 2.8%
United Kingdom 568 2.0%
Canada 544 1.9%
South Korea 475 1.7%
Italy 474 1.7%
Countries with the highest per capita CO2 emissions
CountryCarbon dioxide emissions per year
(Tons per person) (2006)
Qatar 56.2
United Arab Emirates 32.8
Kuwait 31.2
Bahrain 28.8
Trinidad and Tobago 25.3
Luxembourg 24.5
Netherlands Antilles 22.8
Aruba 22.3
United States 19
Australia 18.1
emanating from vehicles traveling along their property. This would give them a financial incentive to keep the worst polluters off of
their roads.
Statistics
Most polluted cities
Air pollution is usually concentrated in densely populated metropolitan areas, especially in developing countries where
environmental regulations are relatively lax or nonexistent. However, even populated areas in developed countries attain unhealthy
levels of pollution.
Carbon dioxide emissions
Total CO2 emissions
Main article: List of countries by carbon dioxide emissions
Per capita CO2 emissions[49]
Main article: List of countries by carbon dioxide emissions per capita
Atmospheric dispersion
Main article: Atmospheric dispersion modeling
9 of 12

Visualization of a buoyant Gaussian air pollutiondispersion plume as used in many atmospheric dispersion
models
The basic technology for analyzing air pollution is through the use of a variety of mathematical models for predicting the transport
of air pollutants in the lower atmosphere. The principal methodologies are:
Point source dispersion, used for industrial sources.
Line source dispersion, used for airport and roadway air dispersion modeling
Area source dispersion, used for forest fires or duststorms
Photochemical models, used to analyze reactive pollutants that form smog
The point source problem is the best understood, since it involves simpler
mathematics and has been studied for a long period of time, dating back to
about the year 1900. It uses a Gaussian dispersion model for buoyant
pollution plumes to forecast the air pollution isopleths, with consideration
given to wind velocity, stack height, emission rate and stability class (a
measure of atmospheric turbulence).[50][51] This model has been
extensively validated and calibrated with experimental data for all sorts of
atmospheric conditions.
The roadway air dispersion model was developed starting in the late 1950s
and early 1960s in response to requirements of the National Environmental
Policy Act and the U.S. Department of Transportation (then known as the
Federal Highway Administration) to understand impacts of proposed new
highways upon air quality, especially in urban areas. Several research
groups were active in this model development, among which were: the
Environmental Research and Technology (ERT) group in Lexington,
Massachusetts, the ESL Inc. group in Sunnyvale, California and the
California Air Resources Board group in Sacramento, California. The
research of the ESL group received a boost with a contract award from the United States Environmental Protection Agency to
validate a line source model using sulfur hexafluoride as a tracer gas. This program was successful in validating the line source
model developed by ESL inc. Some of the earliest uses of the model were in court cases involving highway air pollution, the
Arlington, Virginia portion of Interstate 66 and the New Jersey Turnpike widening project through East Brunswick, New Jersey.
Area source models were developed in 1971 through 1974 by the ERT and ESL groups, but addressed a smaller fraction of total air
pollution emissions, so that their use and need was not as widespread as the line source model, which enjoyed hundreds of different
applications as early as the 1970s. Similarly photochemical models were developed primarily in the 1960s and 1970s, but their use
was more specialized and for regional needs, such as understanding smog formation in Los Angeles, California.
Environmental impacts of greenhouse gas pollutants
Main articles: Ocean acidification and Greenhouse effect
The greenhouse effect is a phenomenon whereby greenhouse gases create a condition in the upper atmosphere causing a trapping of
heat and leading to increased surface and lower tropospheric temperatures. Carbon dioxide from combustion of fossil fuels is the
major problem. Other greenhouse gases include methane, hydrofluorocarbons, perfluorocarbons, chlorofluorocarbons, nitrogen
oxides, and ozone.
This effect has been understood by scientists for about a century, and technological advancements during this period have helped
increase the breadth and depth of data relating to the phenomenon. Currently, scientists are studying the role of changes in
composition of greenhouse gases from natural and anthropogenic sources for the effect on climate change.
A number of studies have also investigated the potential for long-term rising levels of atmospheric carbon dioxide to cause increases
in the acidity of ocean waters and the possible effects of this on marine ecosystems.
See also
Acid rain
Air Hygiene Foundation
Air pollutant concentrations
Air pollution in British Columbia
Air Quality Index
Air stagnation
AP 42 Compilation of Air Pollutant Emission Factors
ASEAN Agreement on Transboundary Haze Pollution
Asian brown cloud
Atmospheric chemistry
Environmentalism
Flue gas desulfurization
Flue gas emissions from fossil fuel combustion
Global Atmosphere Watch
Global dimming
Global warming
Greenhouse effect
Haze
Health Effects Institute (HEI)
Indicator value
10 of 12

Atmospheric dispersion modeling
Beehive burner
Best Available Control Technology
Bibliography of atmospheric dispersion modeling
Building biology
List of atmospheric dispersion models
Critical load
Cruise ship pollutionEmission standard
Emissions & Generation Resource Integrated Database
(eGRID)
Emission-free zone
Environmental agreement
International Agency for Research on Cancer
Kyoto Protocol
Light water reactor sustainability
List of natural disasters by death toll#Smog
Lowest Achievable Emissions Rate
National Ambient Air Quality Standards (USA EPA)
NASA Clean Air Study
ParticulatePolluter pays principle
Ship pollution
Smog and Haze
Spare the Air program (California)
Stench
Tire fire
References
^ EPA: Air Pollutants (http://www.epa.gov/ebtpages
/airairpollutants.html)
1.
^ AP 42, Volume I (http://www.epa.gov/ttn/chief
/ap42/index.html)
2.
^ United Kingdom's emission factor database
(http://www.naei.org.uk/emissions/index.php)
3.
^ European Environment Agency's 2005 Emission Inventory
Guidebook (http://reports.eea.eu.int/EMEPCORINAIR4/en)
4.
^ Revised 1996 IPCC Guidelines for National Greenhouse Gas
Inventories (reference manual) (http://www.ipcc-nggip.iges.or.jp
/public/gl/invs6.htm)
5.
^ Australian National Pollutant Inventory Emissions Estimation
Technique Manuals (http://www.npi.gov.au/handbooks
/approved_handbooks/sector-manuals.html)
6.
^ Canadian GHG Inventory Methodologies
(http://www.ec.gc.ca/pdb/ghg/guidance/calcu_pro_e.cfm)
7.
^ Duflo, E., Greenstone, M., and Hanna, R. (2008) “Indoor air
pollution, health and economic well-being”. S.A.P.I.E-.S. 1 (1)
(http://sapiens.revues.org/index130.html)
8.
^ Estimated deaths & DALYs attributable to selected
environmental risk factors, by WHO Member State, 2002
(http://www.who.int/entity/quantifying_ehimpacts
/countryprofilesebd.xls)
9.
^ "Newly detected air pollutant mimics damaging effects of
cigarette smoke (http://www.eurekalert.org/pub_releases
/2008-08/acs-nda072308.php) ". www.eurekalert.org.
http://www.eurekalert.org/pub_releases/2008-08
/acs-nda072308.php. Retrieved 2008-08-17.
10.
^ "Study links traffic pollution to thousands of deaths
(http://www.guardian.co.uk/society/2008/apr/15/health) " (in
English). The Guardian (London, UK: Guardian Media Group).
2008-04-15. http://www.guardian.co.uk/society/2008/apr
/15/health. Retrieved 2008-04-15.
11.
^ Simi Chakrabarti. "20th anniversary of world's worst
industrial disaster (http://www.abc.net.au/worldtoday/content
/2004/s1257352.htm) ". Australian Broadcasting Corporation.
http://www.abc.net.au/worldtoday/content/2004/s1257352.htm.
12.
^ Davis, Devra (2002). When Smoke Ran Like Water: Tales of
Environmental Deception and the Battle Against Pollution.
Basic Books. ISBN 0-465-01521-2.
13.
^ http://www.sacbee.com/378/story/1393268.html ,
http://www.latimes.com/features/health/la-me-
pollute13-2008nov13,0,5432723.story , http://www.sfgate.com
/cgi-bin/article.cgi?f=/c/a/2008/11/13/MNQP143CPV.DTL
14.
^ Diesel exhaust inhalation increases thrombus formation in
man† Andrew J. Lucking1*, Magnus Lundback2, Nicholas L.
Mills1, Dana Faratian1, Stefan L. Barath2, Jamshid Pourazar2,
Flemming R. Cassee3, Kenneth Donaldson1, Nicholas A.
Boon1, Juan J. Badimon4, Thomas Sandstrom2, Anders
Blomberg2, and David E. Newby1
15.
^ Persistent Endothelial Dysfunction in Humans after Diesel
Exhaust Inhalation Ha°kan To¨rnqvist1*, Nicholas L. Mills2*,
16.
Manuel Gonzalez3, Mark R. Miller2, Simon D. Robinson2, Ian
L. Megson4, William MacNee5, Ken Donaldson5, Stefan
So¨derberg3, David E. Newby2, Thomas Sandstro¨m1, and
Anders Blomberg1
^ Christopher H. Goss, Stacey A. Newsom, Jonathan S.
Schildcrout, Lianne Sheppard and Joel D. Kaufman (2004).
"Effect of Ambient Air Pollution on Pulmonary Exacerbations
and Lung Function in Cystic Fibrosis". American Journal of
Respiratory and Critical Care Medicine 169: 816–821.
doi:10.1164/rccm.200306-779OC (http://dx.doi.org
/10.1164%2Frccm.200306-779OC) . PMID 14718248
(http://www.ncbi.nlm.nih.gov/pubmed/14718248) .
17.
^ Michael Kymisis, Konstantinos Hadjistavrou (2008).
"Short-Term Effects Of Air Pollution Levels On Pulmonary
Function Of Young Adults (http://www.ispub.com/ostia
/index.php?xmlFilePath=journals/ijpm/vol9n2/pollution.xml) ".
The Internet Journal of Pulmonary Medicine 9 (2).
http://www.ispub.com/ostia/index.php?xmlFilePath=journals
/ijpm/vol9n2/pollution.xml.
18.
^ Zoidis, John D. (1999). "The Impact of Air Pollution on
COPD (http://www.rtmagazine.com/issues/articles
/1999-10_06.asp) ". RT: for Decision Makers in Respiratory
Care. http://www.rtmagazine.com/issues/articles
/1999-10_06.asp.
19.
^ Holland WW, Reid DD. The urban factor in chronic
bronchitis. Lancet. 1965;I:445-448.
20.
^ J. Sunyer (2001). "Urban air pollution and Chronic
Obstructive Pulmonary disease: a review
(http://erj.ersjournals.com/cgi/content/abstract/17/5/1024) ".
European Respiratory Journal 17: 1024–1033.
doi:10.1183/09031936.01.17510240 (http://dx.doi.org
/10.1183%2F09031936.01.17510240) . PMID 11488305
(http://www.ncbi.nlm.nih.gov/pubmed/11488305) .
http://erj.ersjournals.com/cgi/content/abstract/17/5/1024.
21.
^ Nielsen, John (2002-12-12). "The Killer Fog of ’52:
Thousands died as Poisonous Air Smothered London
(http://www.npr.org/templates/story/story.php?storyId=873954)
". National Public Radio. http://www.npr.org/templates/story
/story.php?storyId=873954.
22.
^ "On this Day: 1952 London Fog Clears After days of Chaos
(http://news.bbc.co.uk/onthisday/hi/dates/stories/december
/9/newsid_4506000/4506390.stm) ". BBC News. 2005-12-09.
http://news.bbc.co.uk/onthisday/hi/dates/stories/december
/9/newsid_4506000/4506390.stm.
23.
^ "Polluted Cities: The Air Children Breathe
(http://www.who.int/ceh/publications/en/11airpollution.pdf) "
(PDF). World Health Organization. http://www.who.int
/ceh/publications/en/11airpollution.pdf.
24.
^ Committee on Environmental Health (2004). "Ambient Air
Pollution: Health Hazards to Children". Pediatrics 114 (6):
1699–1707. doi:10.1542/peds.2004-2166 (http://dx.doi.org
/10.1542%2Fpeds.2004-2166) . PMID 15574638
25.
11 of 12

This page was last modified on 26 November 2009 at 19:32.
Text is available under the Creative Commons Attribution-ShareAlike License; additional terms may apply. See Terms of Use
for details.
Wikipedia® is a registered trademark of the Wikimedia Foundation, Inc., a non-profit organization.
Contact us
(http://www.ncbi.nlm.nih.gov/pubmed/15574638) .
^ 2005 BC Lung Association report on the valuation of health
impacts from air quality in the Lower Fraser Valley airshed
(http://www.bc.lung.ca/pdf/health_and_air_quality_2005.pdf)
26.
^ Canada-wide Standards (http://www.ec.gc.ca/CEPARegistry
/agreements/cws.cfm)
27.
^ Canada-Wide Standards for Particulate Matter (PM) and
Ozone (http://www.ccme.ca/assets
/pdf/pmozone_standard_e.pdf)
28.
^ a b http://correu.cs.san.gva.es/exchweb
/bin/redir.asp?URL=http://www.transportenvironment.org
/Publications/prep_hand_out/lid:516
29.
^ Directive 2001/81/EC of the European Parliament and of the
Council of 23 October 2001 on national emission ceilings for
certain atmospheric pollutants (http://eur-lex.europa.eu
/LexUriServ/site/en/oj/2001/l_309
/l_30920011127en00220030.pdf)
30.
^ Terms of Reference, Working Group on the Revision of
National Emissions Ceilings and Policy Instruments
(http://ec.europa.eu/environment/air/pdf
/necpi_terms_ref_0505.pdf) PDF (24.4 KiB)
31.
^ http://eur-lex.europa.eu
/JOHtml.do?uri=OJ:L:2008:152:SOM:EN:HTML
32.
^ OJ L 296, 21.11.1996, p. 55. Directive as amended by
Regulation (EC) No 1882/2003 of the European Parliament and
of the Council (OJ L 284, 31.10.2003, p. 1); Directives
96/62/EC, 1999/30/EC, 2000/69/EC and 2002/3/EC shall be
repealed as from 11 June 2010
33.
^ The Department for Environment, Food & Rural Affairs
(DEFRA): Air Pollution (http://www.airquality.co.uk/archive
/what_causes.php)
34.
^ LAQM Air Quality Management Areas
(http://www.airquality.co.uk/archive/laqm/laqm.php)
35.
^ London (http://www.londonair.org.uk/london/asp/default.asp)36.
^ Taking the Oxford air adds up to a 60-a-day habit
(http://www.guardian.co.uk/uk_news/story/0,,1292524,00.html)
37.
(a newspaper article in The Guardian)
^ UK Air Quality Archive (http://www.airquality.co.uk/archive
/index.php)
38.
^ UK National Air Quality Objectives
(http://www.airquality.co.uk/archive
/laqm/information.php?info=objectives)
39.
^ Current Air Pollution Bulletin (http://www.airquality.co.uk
/archive/bulletin.php?type=Current)
40.
^ Air Pollution Bandings and Indexes
(http://www.airquality.co.uk/archive/standards.php#band)
41.
^ BBC Weather Service (http://www.bbc.co.uk/weather
/5day.shtml?world=0008)
42.
^ Air Pollution - What it means for your health
(http://www.defra.gov.uk/environment/airquality/publications
/airpoll/05.htm)
43.
^ Wall Street Journal article, May 23, 2006
(http://www.opinionjournal.com/columnists/pdupont
/?id=110008416)
44.
^ American Lung Association, June 2, 2007
(http://www.lungusa.org/site/apps
/nl/content3.asp?c=dvLUK9O0E&b=40404&ct=3983577)
45.
^ Wall Street Journal article, July 20, 2007
(http://online.wsj.com/public/article/SB118470650996069354-
buQPf_FL_nKirvopk__GzCmNOq8_20070818.html?mod=tff_main_tff_top
46.
^ Rothbard, Murray. "Conservation, Ecology, and Growth". For
a -ew Liberty: The Libertarian Manifesto. pp. 256–257.
47.
^ World Bank Statistics (http://siteresources.worldbank.org
/DATASTATISTICS/Resources/table3_13.pdf)
48.
^ International Carbon Dioxide Emissions and Carbon Intensity
(http://www.eia.doe.gov/emeu/international/carbondioxide.html)
Energy Information Administration
49.
^ Turner, D.B. (1994). Workbook of atmospheric dispersion
estimates: an introduction to dispersion modeling (2nd ed.).
CRC Press. ISBN 1-56670-023-X.
50.
^ Beychok, M.R. (2005). Fundamentals Of Stack Gas
Dispersion (4th ed.). author-published. ISBN 0-9644588-0-2.
www.air-dispersion.com (http://www.air-dispersion.com)
51.
External links
Air quality science and general information
International Conference on Urban Air Quality (http://www.urbanairquality.org/) .UNEP Urban Issues (http://www.unep.org/urban%5Fenvironment/)
European Commission > Environment > Policies > Air >Air Quality (http://ec.europa.eu/environment/air/index.htm) .
UNEP Partnership for Clean Fuels and Vehicles (http://www.unep.org/pcfv/)
Air quality modelling
Stuff in the Air (http://www.stuffintheair.com/airqualitymodeling.html) Standard air quality modelling procedure for industrial
sources.
Wiki on Atmospheric Dispersion Modelling (http://atmosphericdispersion.wikia.com/) . Addresses the international
community of atmospheric dispersion modellers — primarily researchers, but also users of models. Its purpose is to pool
experiences gained by dispersion modellers during their work.
Air Dispersion Modeling Conversions and Formulas (http://www.air-dispersion.com/formulas.html) One of six technical
articles devoted to air quality and air pollution dispersion modeling.
Effects on human health
Air Pollution Triggers Blood Clots (http://www.planetark.com/dailynewsstory.cfm/newsid/44436/story.htm)
American Lung Association of New England on air quality (http://www.ownyourair.org) .
Retrieved from "http://en.wikipedia.org/wiki/Air_pollution"
Categories: Air pollution | Air dispersion modeling | Chemical engineering | Climate forcing agents
12 of 12
Related Documents