Aims: • To be able to find the smallest & largest values along with the median, quartiles and IQR • To be able to draw a box and whisker plot • To be able to interpret such a diagram and look for skewness. Representing data Lesson 2

Aims: To be able to find the smallest & largest values along with the median, quartiles and IQR To be able to draw a box and whisker plot To be able to.
Dec 26, 2015
Welcome message from author
This document is posted to help you gain knowledge. Please leave a comment to let me know what you think about it! Share it to your friends and learn new things together.
Transcript
Aims:• To be able to find the smallest & largest values along with the median, quartiles and IQR• To be able to draw a box and whisker plot• To be able to interpret such a diagram and look for skewness.
Representing data Lesson 2
Quartiles
• When using the median to compare data it makes sense to consider what data values fall at other significant positions through the data.
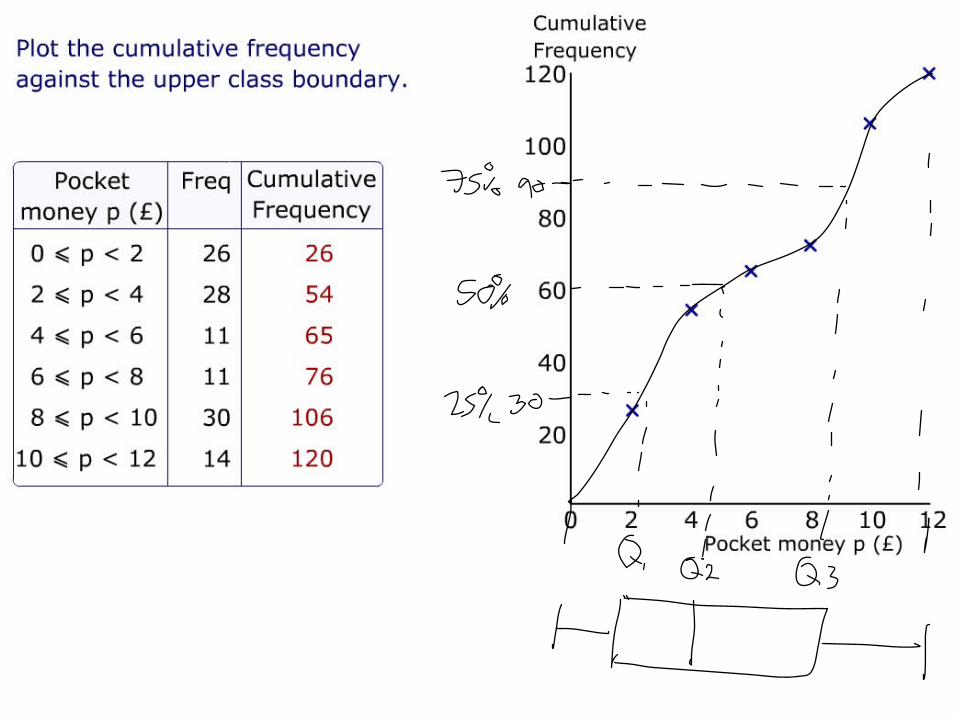
• We often produce a 5 number summary of the data comprising of values at 0% (first); 25% (1/4 way through); 50% (Median); 75% (3/4 way through); 100% (Last) when the data is placed in size order (This can be found on your GDC)
• These 25% and 75% values are called the “Lower Quartile” and “Upper Quartile” respectively.
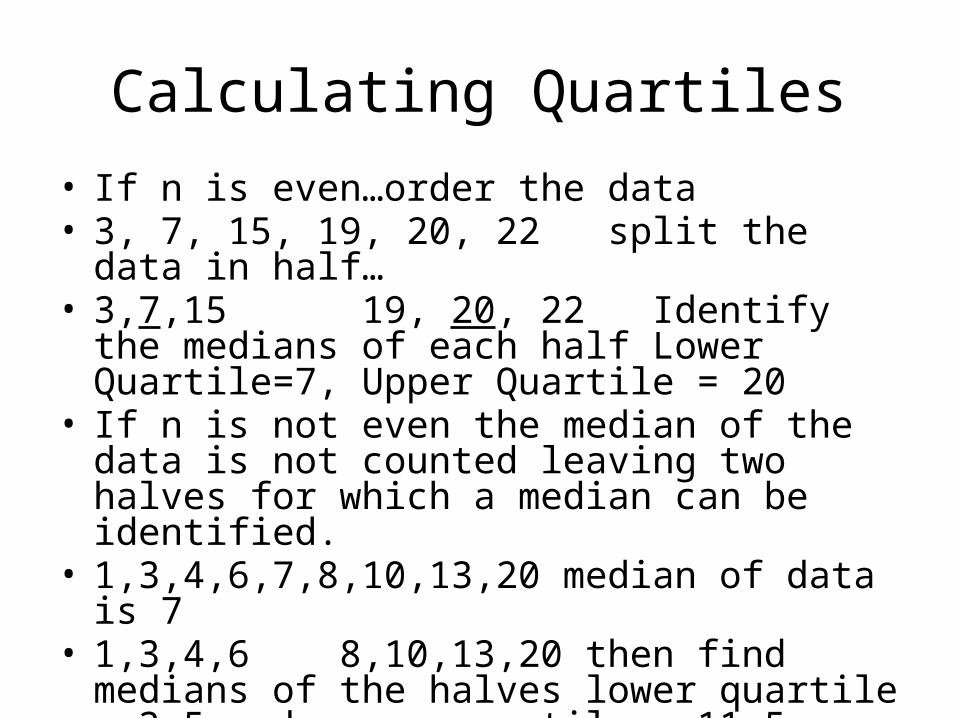
Calculating Quartiles• If n is even…order the data• 3, 7, 15, 19, 20, 22 split the data in half…• 3,7,15 19, 20, 22 Identify the medians of each
half Lower Quartile=7, Upper Quartile = 20• If n is not even the median of the data is not counted
leaving two halves for which a median can be identified.
• 1,3,4,6,7,8,10,13,20 median of data is 7• 1,3,4,6 8,10,13,20 then find medians of the halves
lower quartile = 3.5 and upper quartile = 11.5
Interquartile Range
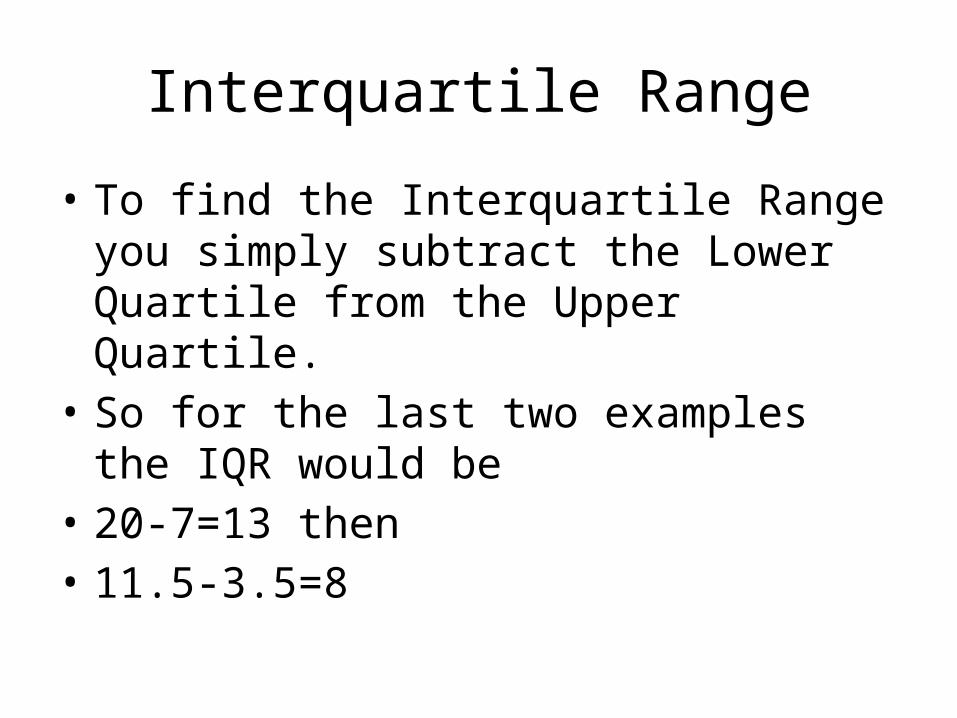
• To find the Interquartile Range you simply subtract the Lower Quartile from the Upper Quartile.
• So for the last two examples the IQR would be• 20-7=13 then• 11.5-3.5=8
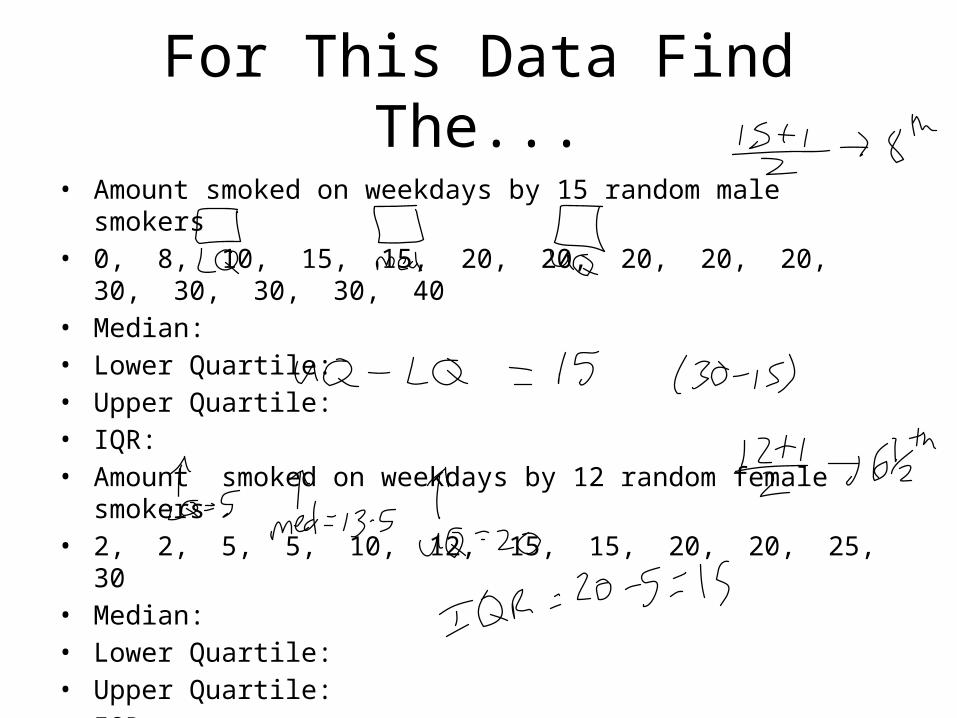
For This Data Find The...• Amount smoked on weekdays by 15 random male smokers• 0, 8, 10, 15, 15, 20, 20, 20, 20, 20, 30, 30, 30, 30, 40• Median:• Lower Quartile:• Upper Quartile:• IQR:• Amount smoked on weekdays by 12 random female smokers• 2, 2, 5, 5, 10, 12, 15, 15, 20, 20, 25, 30• Median:• Lower Quartile:• Upper Quartile:• IQR:
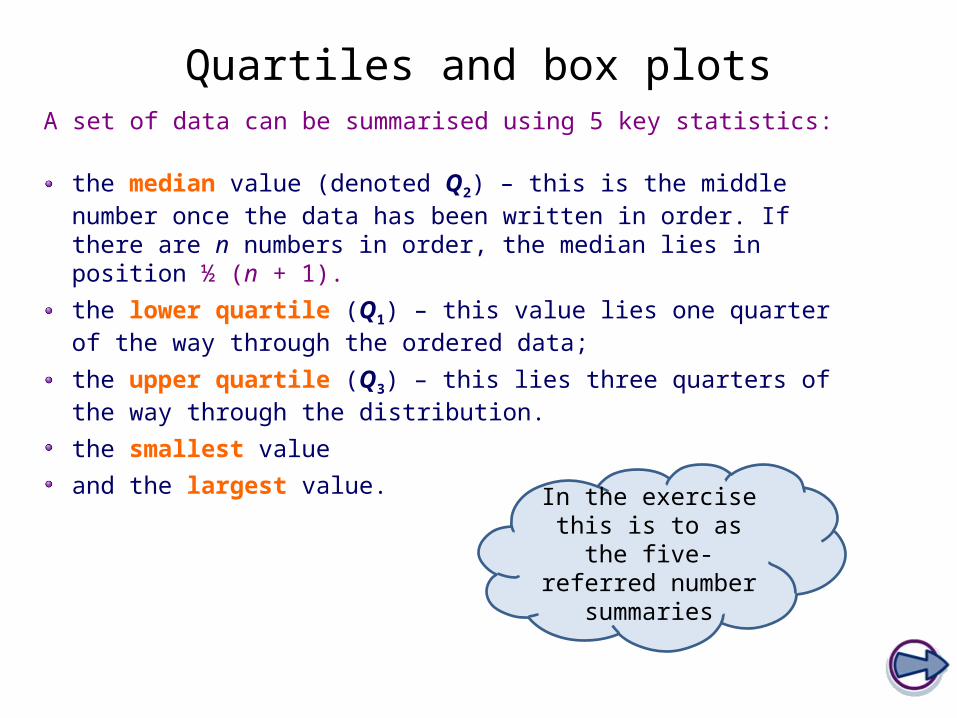
A set of data can be summarised using 5 key statistics:
Quartiles and box plots
the median value (denoted Q2) – this is the middle number once the data has been written in order. If there are n numbers in order, the median lies in position ½ (n + 1).
the lower quartile (Q1) – this value lies one quarter of the way through the ordered data;
the upper quartile (Q3) – this lies three quarters of the way through the distribution.
the smallest value
and the largest value.
In the exercise this is to as the five-referred
number summaries
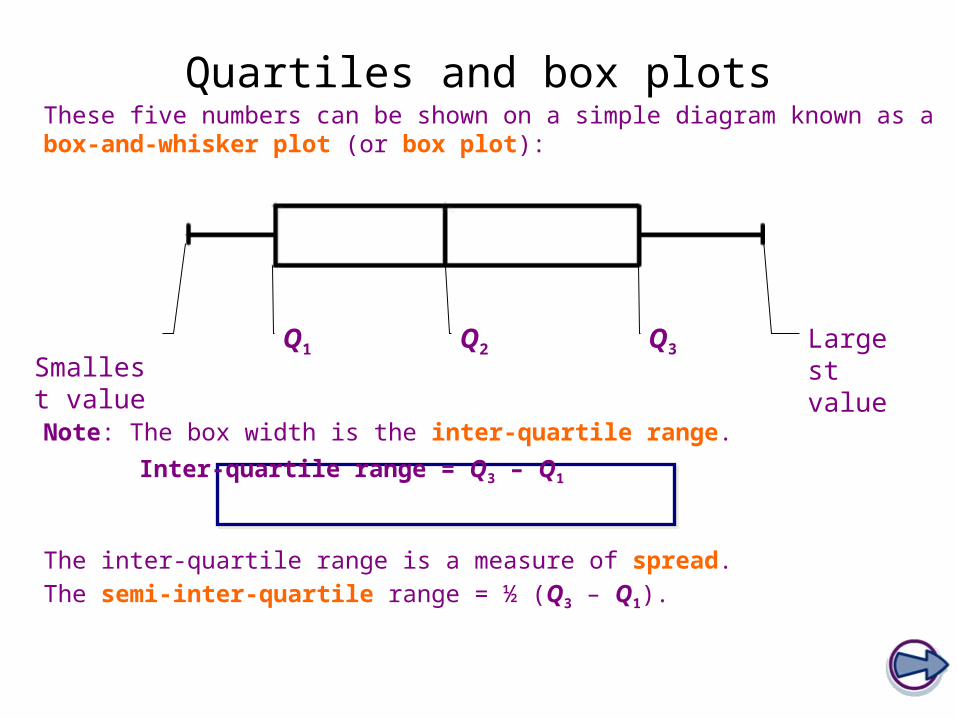
These five numbers can be shown on a simple diagram known as a box-and-whisker plot (or box plot):
Smallest value
Q1 Q2 Q3 Largest value
Note: The box width is the inter-quartile range.
Inter-quartile range = Q3 – Q1
Quartiles and box plots
The inter-quartile range is a measure of spread.The semi-inter-quartile range = ½ (Q3 – Q1).
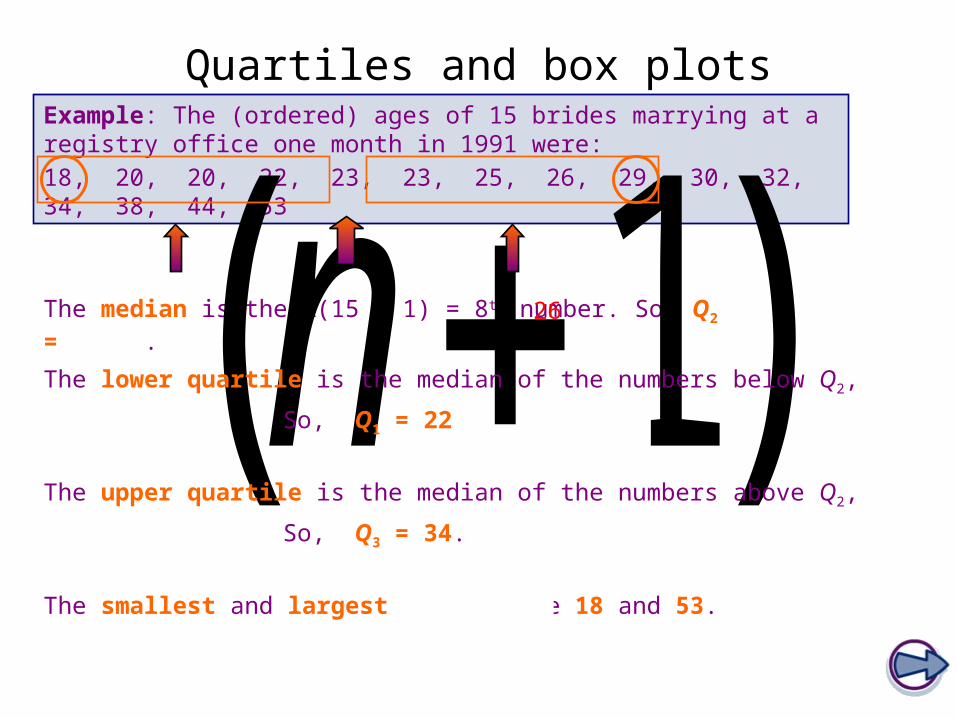
Example: The (ordered) ages of 15 brides marrying at a registry office one month in 1991 were: 18, 20, 20, 22, 23, 23, 25, 26, 29, 30, 32, 34, 38, 44, 53
The median is the ½(15 + 1) = 8th number. So, Q2 = . )1( nThe lower quartile is the median of the numbers below Q2,
So, Q1 = 22
The upper quartile is the median of the numbers above Q2,
So, Q3 = 34.
The smallest and largest numbers are 18 and 53.
Quartiles and box plots
26
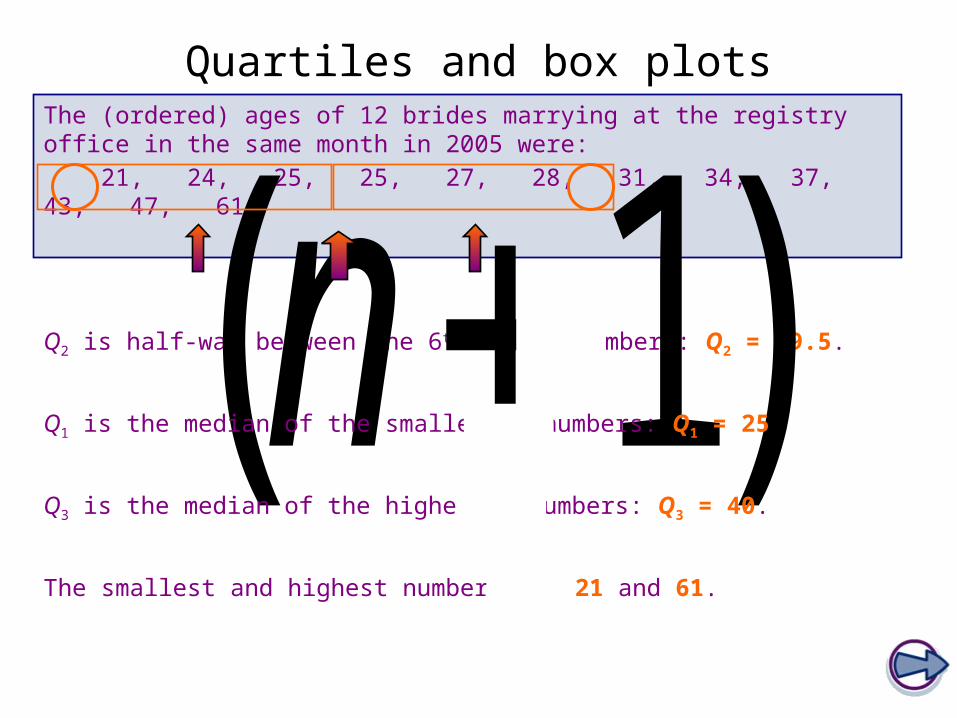
The (ordered) ages of 12 brides marrying at the registry office in the same month in 2005 were: 21, 24, 25, 25, 27, 28, 31, 34, 37, 43, 47, 61
Q2 is half-way between the 6th and 7th numbers: Q2 = 29.5. )1( nQ1 is the median of the smallest 6 numbers: Q1 = 25
Q3 is the median of the highest 6 numbers: Q3 = 40.
The smallest and highest numbers are 21 and 61.
Quartiles and box plots
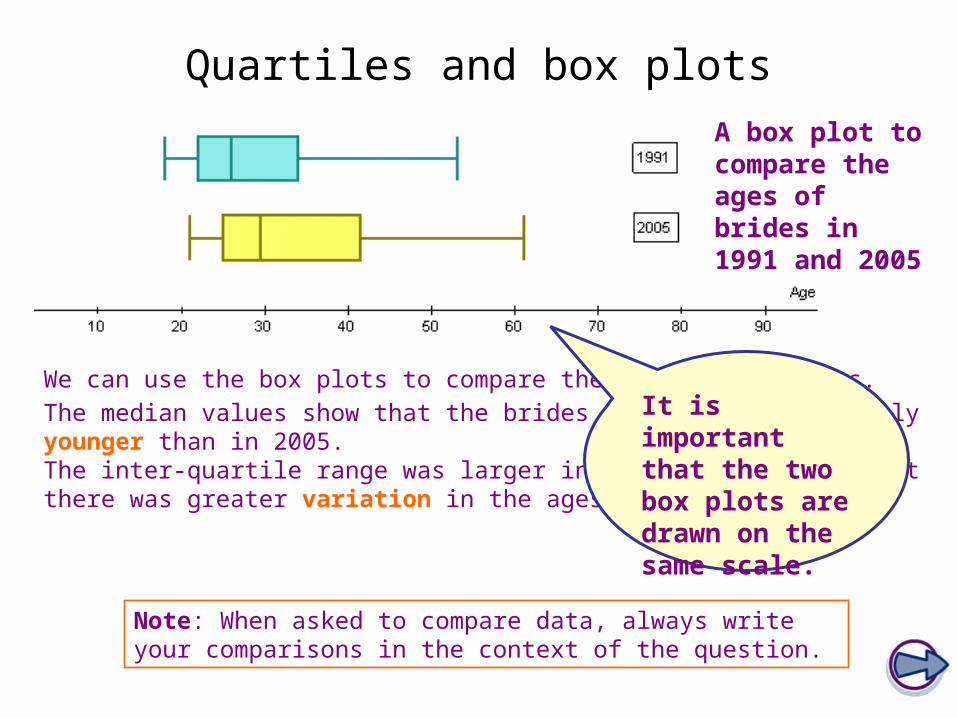
We can use the box plots to compare the two distributions. The median values show that the brides in 1991 were generally younger than in 2005. The inter-quartile range was larger in 2005 meaning that that there was greater variation in the ages of brides in 2005.
Note: When asked to compare data, always write your comparisons in the context of the question.
Quartiles and box plotsA box plot to compare the ages of brides in 1991 and 2005
It is important that the two box plots are drawn on the same scale.
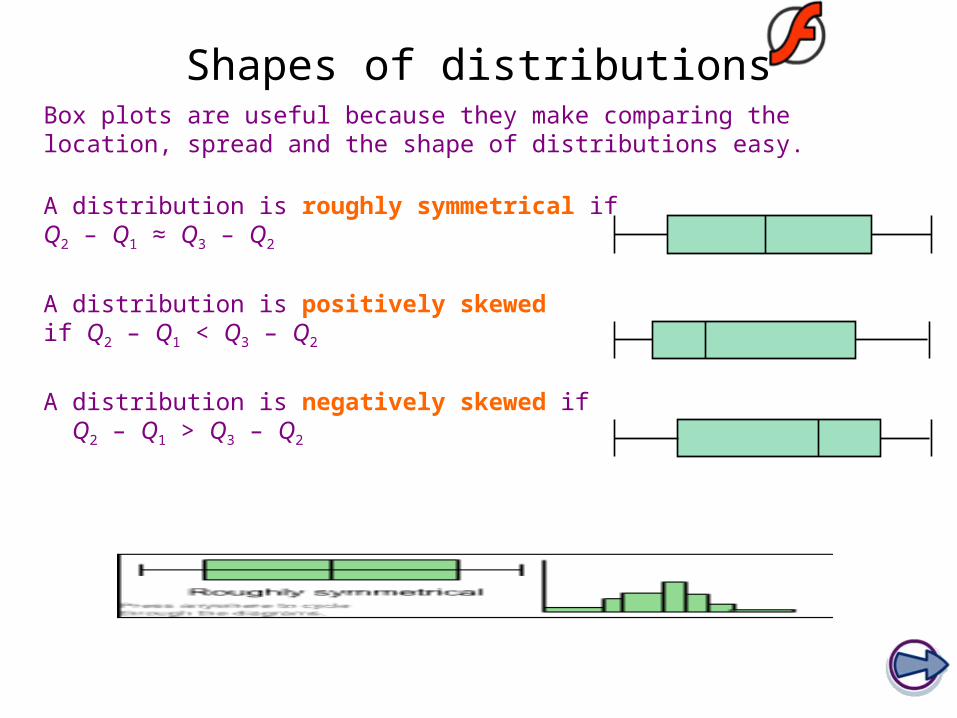
Box plots are useful because they make comparing the location, spread and the shape of distributions easy.
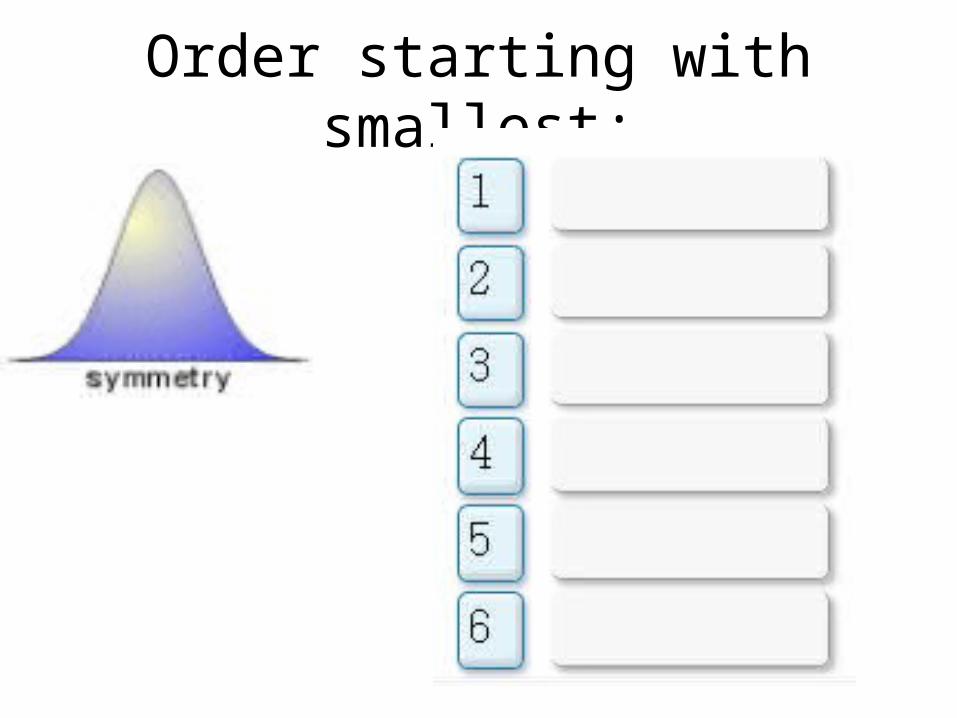
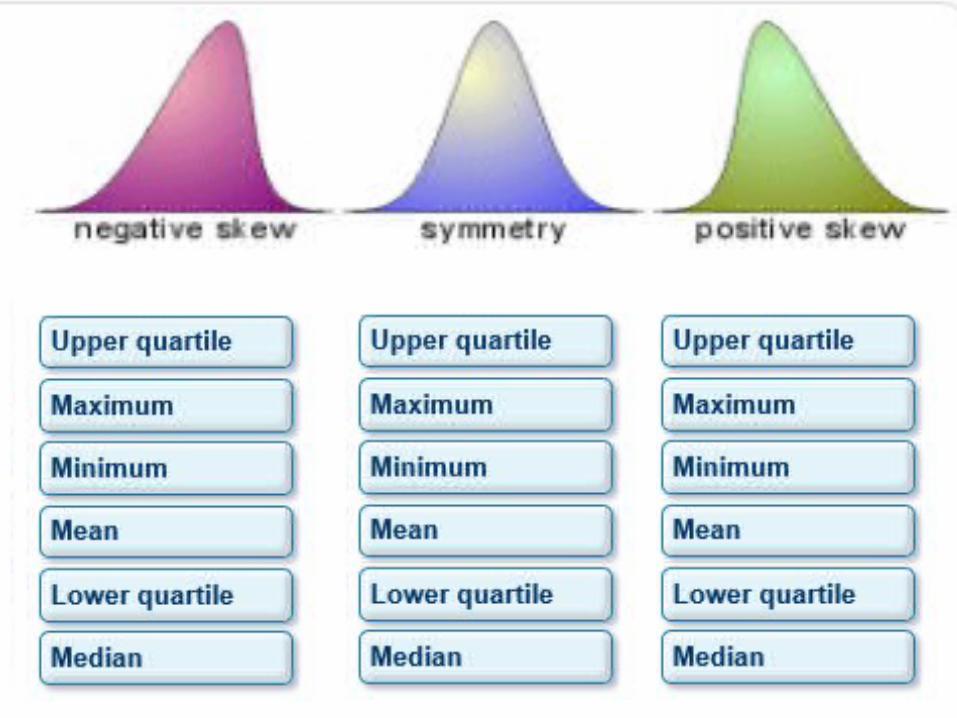
A distribution is roughly symmetrical if Q2 – Q1 ≈ Q3 – Q2
A distribution is positively skewed if Q2 – Q1 < Q3 – Q2
A distribution is negatively skewed if Q2 – Q1 > Q3 – Q2
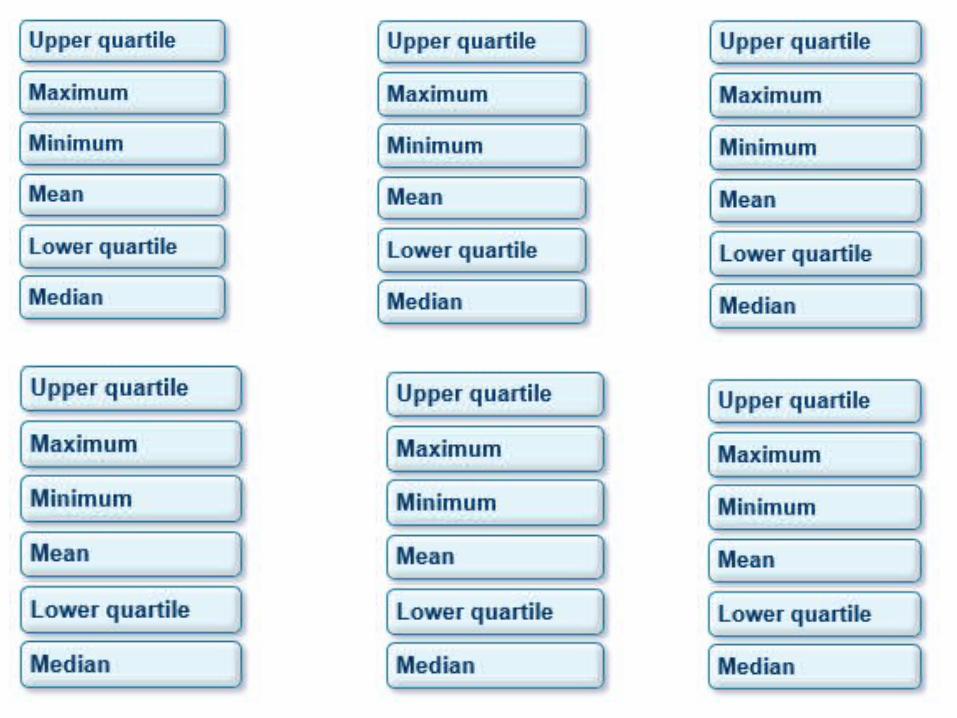
Shapes of distributions
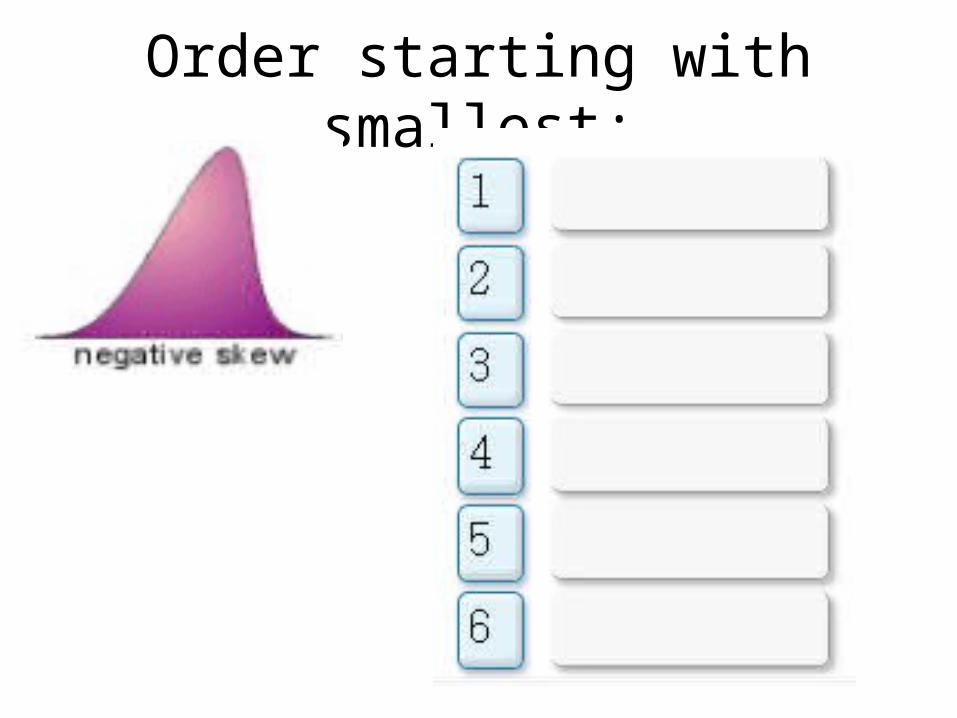
Order starting with smallest:
Order starting with smallest:
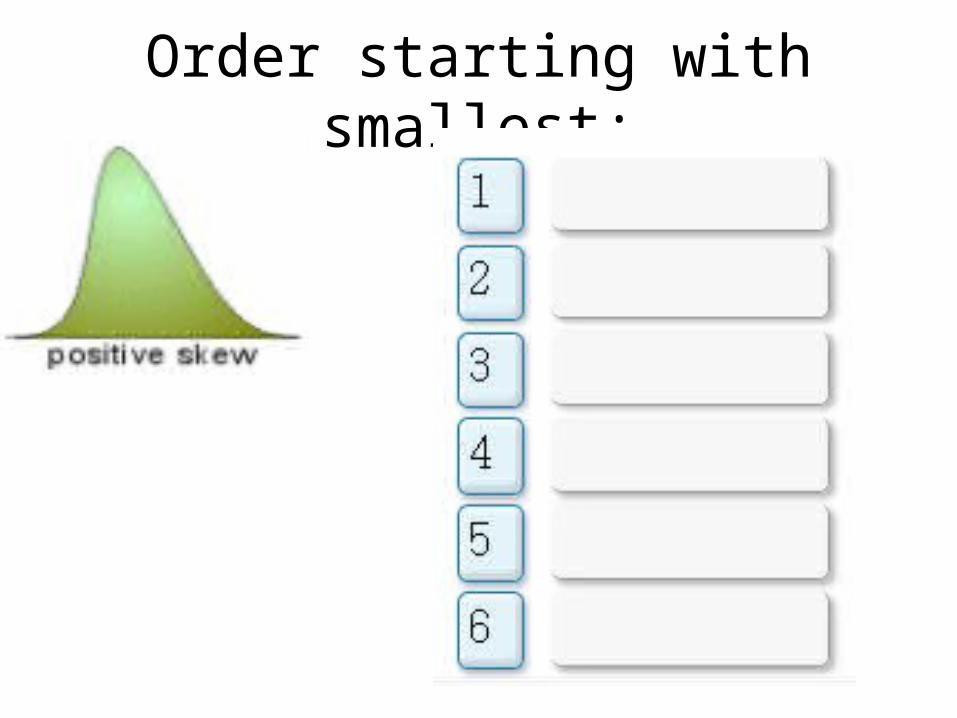
Order starting with smallest:
Card match
Sets of 4
frequency, cumulative frequency, box plot,descriptions
In table groups
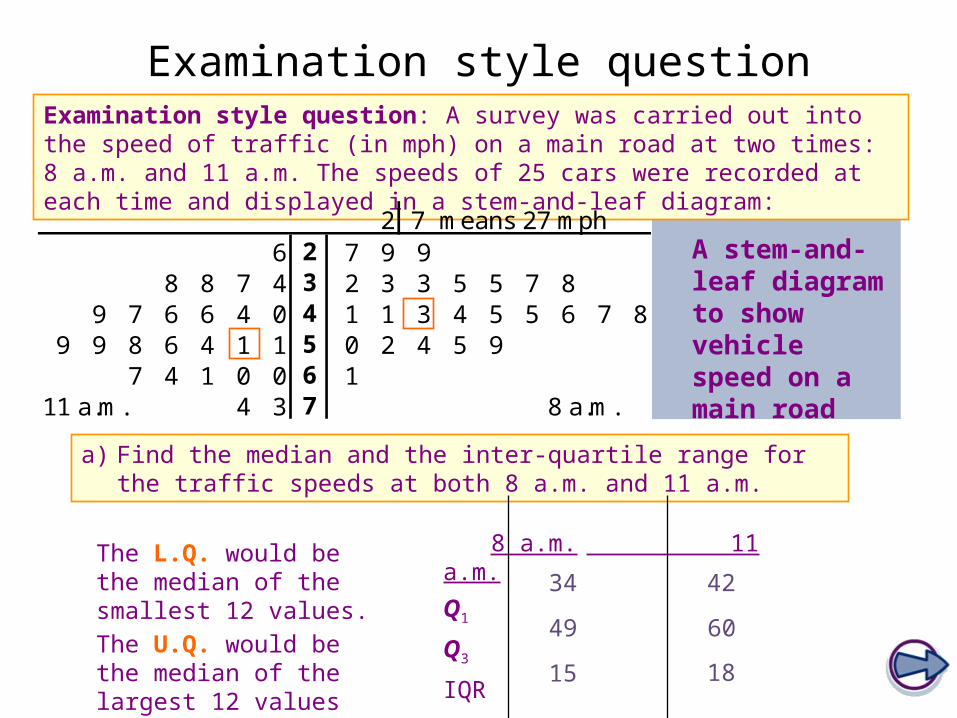
Examination style question: A survey was carried out into the speed of traffic (in mph) on a main road at two times: 8 a.m. and 11 a.m. The speeds of 25 cars were recorded at each time and displayed in a stem-and-leaf diagram:
a) Find the median and the inter-quartile range for the traffic speeds at both 8 a.m. and 11 a.m.
A stem-and-leaf diagram to show vehicle speed on a main road
Examination style question
2 7 means 27 mph6 2 7 9 9
8 8 7 4 3 2 3 3 5 5 7 89 7 6 6 4 0 4 1 1 3 4 5 5 6 7 8
9 9 8 6 4 1 1 5 0 2 4 5 97 4 1 0 0 6 1
11 a.m. 4 3 7 8 a.m.
The L.Q. would be the median of the smallest 12 values.The U.Q. would be the median of the largest 12 values
8 a.m. 11 a.m.
Q1
Q3
IQR
34
15
6049
42
18
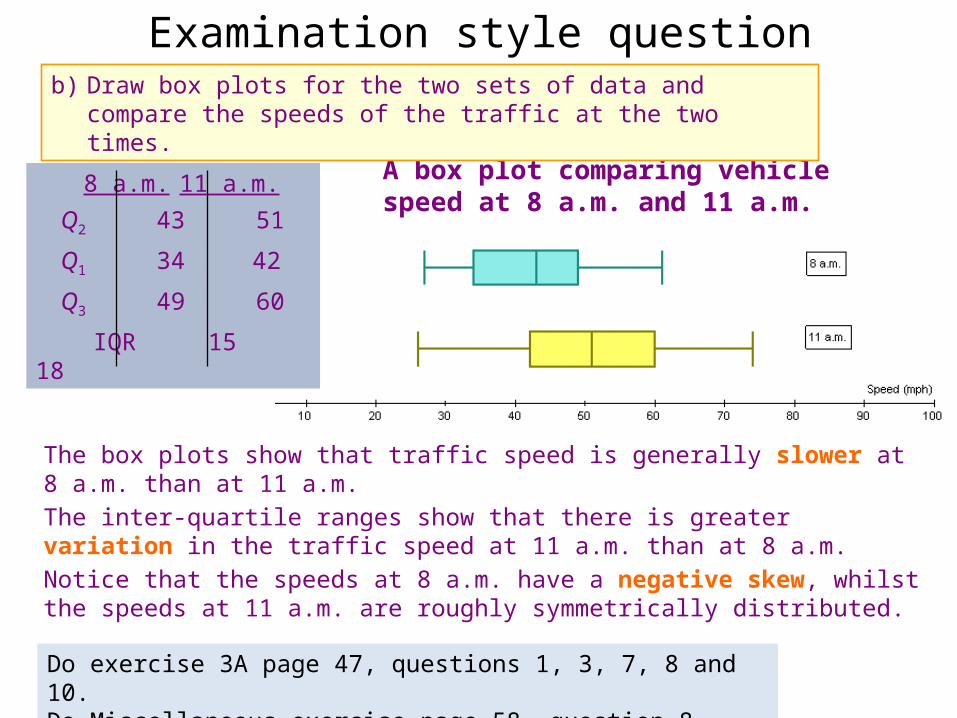
The box plots show that traffic speed is generally slower at 8 a.m. than at 11 a.m. The inter-quartile ranges show that there is greater variation in the traffic speed at 11 a.m. than at 8 a.m.Notice that the speeds at 8 a.m. have a negative skew, whilst the speeds at 11 a.m. are roughly symmetrically distributed.
8 a.m. 11 a.m.
Q2 43 51
Q1 34 42
Q3 49 60
IQR 15 18
Examination style question
A box plot comparing vehicle speed at 8 a.m. and 11 a.m.
Do exercise 3A page 47, questions 1, 3, 7, 8 and 10.Do Miscellaneous exercise page 58, question 8.
b) Draw box plots for the two sets of data and compare the speeds of the traffic at the two times.
Related Documents