Citation: Moran-Rodas, V.E.; Preusse, V.; Wachendorf, C. Agricultural Management Practices and Decision-Making in View of Soil Organic Matter in the Urbanizing Region of Bangalore. Sustainability 2022, 14, 5775. https://doi.org/ 10.3390/su14105775 Academic Editor: Antonio Boggia Received: 24 March 2022 Accepted: 4 May 2022 Published: 10 May 2022 Publisher’s Note: MDPI stays neutral with regard to jurisdictional claims in published maps and institutional affil- iations. Copyright: © 2022 by the authors. Licensee MDPI, Basel, Switzerland. This article is an open access article distributed under the terms and conditions of the Creative Commons Attribution (CC BY) license (https:// creativecommons.org/licenses/by/ 4.0/). sustainability Article Agricultural Management Practices and Decision-Making in View of Soil Organic Matter in the Urbanizing Region of Bangalore Virna Estefania Moran-Rodas 1,2, * , Verena Preusse 3 and Christine Wachendorf 1 1 Soil Biology and Plant Nutrition, University of Kassel, Nordbahnhofstr. 1a, 37213 Witzenhausen, Germany; [email protected] 2 Department of Crop Sciences, Division of Agricultural Entomology, University of Goettingen, Grisebachstraße 6, 37077 Goettingen, Germany 3 Department of Agricultural Economics and Rural Development, University of Goettingen, Platz der Goettinger Sieben 5, 37073 Goettingen, Germany; [email protected] * Correspondence: [email protected] Abstract: Rapid urbanization and agricultural intensification are currently impacting the soils of many tropical countries. Bangalore is a growing megacity experiencing both issues and their derived ecological and socio-economic effects. This paper seeks to understand how the socio-economic effects of urbanization are affecting soil organic carbon (SOC) in Bangalore’s rural–urban interface. We first compiled information on how management practices affect SOC dynamics and specifically evaluated the effects of fertilization practices on SOC levels in major cropping systems. We then used interview data from farmers’ households across an urbanity gradient in Bangalore to test the association between urbanization as well as related socio-economic drivers and farming practices. We found that fertilization increases SOC concentrations, especially when mineral fertilizer is combined with additional farmyard manure. Single mineral fertilizer and a combination of mineral fertilizer and farmyard manure are commonly applied in Bangalore. Conservation practices, such as reduced tillage and mulching, are applied by 48% and 16% of households, respectively. Farm and household characteristics, including market integration, are the most important determinants of management decisions that affect SOC. Our study shows that improving farm and household conditions and opportunities, independently of the degree of urbanity, is necessary for implementing agricultural practices that can benefit SOC in Bangalore. Keywords: rurality; mineral fertilization; irrigation; mulching; tillage; crop choice; rural–urban index; farmers’ welfare; SOM; SOC 1. Introduction Cultivation has led to a decline of soil organic matter (SOM), especially in most weath- ered tropical soils. Reductions in SOM constitute a negative feedback loop, altering the provision of soil functions, such as C sequestration, habitat for soil organisms, biodiversity, and plant productivity [1]. Consequently, a low SOM content makes farmers more vulnera- ble to global change conditions, e.g., climate change and urbanization, which is particularly pronounced in regions of quickly growing megacities [2]. Urban expansion implies a loss of fertile cropland to constructed areas, environmental degradation, competition for natural resources, and it might even result in the displacement of farmers into marginal lands [2]. Generally, farmers in urbanizing areas might have a higher adaptive capacity to changing framework conditions like climate change than remote rural farmers, due to better access to certain infrastructures [3–5]. However, farmer communities from the city periphery may be more vulnerable to climate change than at least a portion of the urban population in the city center, where the economy is more active and physical and social infrastructures Sustainability 2022, 14, 5775. https://doi.org/10.3390/su14105775 https://www.mdpi.com/journal/sustainability

Welcome message from author
This document is posted to help you gain knowledge. Please leave a comment to let me know what you think about it! Share it to your friends and learn new things together.
Transcript
Citation: Moran-Rodas, V.E.; Preusse,
V.; Wachendorf, C. Agricultural
Management Practices and
Decision-Making in View of Soil
Organic Matter in the Urbanizing
Region of Bangalore. Sustainability
2022, 14, 5775. https://doi.org/
10.3390/su14105775
Academic Editor: Antonio Boggia
Received: 24 March 2022
Accepted: 4 May 2022
Published: 10 May 2022
Publisher’s Note: MDPI stays neutral
with regard to jurisdictional claims in
published maps and institutional affil-
iations.
Copyright: © 2022 by the authors.
Licensee MDPI, Basel, Switzerland.
This article is an open access article
distributed under the terms and
conditions of the Creative Commons
Attribution (CC BY) license (https://
creativecommons.org/licenses/by/
4.0/).
sustainability
Article
Agricultural Management Practices and Decision-Making inView of Soil Organic Matter in the Urbanizing Regionof BangaloreVirna Estefania Moran-Rodas 1,2,* , Verena Preusse 3 and Christine Wachendorf 1
1 Soil Biology and Plant Nutrition, University of Kassel, Nordbahnhofstr. 1a, 37213 Witzenhausen, Germany;[email protected]
2 Department of Crop Sciences, Division of Agricultural Entomology, University of Goettingen,Grisebachstraße 6, 37077 Goettingen, Germany
3 Department of Agricultural Economics and Rural Development, University of Goettingen,Platz der Goettinger Sieben 5, 37073 Goettingen, Germany; [email protected]
* Correspondence: [email protected]
Abstract: Rapid urbanization and agricultural intensification are currently impacting the soils ofmany tropical countries. Bangalore is a growing megacity experiencing both issues and their derivedecological and socio-economic effects. This paper seeks to understand how the socio-economic effectsof urbanization are affecting soil organic carbon (SOC) in Bangalore’s rural–urban interface. Wefirst compiled information on how management practices affect SOC dynamics and specificallyevaluated the effects of fertilization practices on SOC levels in major cropping systems. We thenused interview data from farmers’ households across an urbanity gradient in Bangalore to test theassociation between urbanization as well as related socio-economic drivers and farming practices. Wefound that fertilization increases SOC concentrations, especially when mineral fertilizer is combinedwith additional farmyard manure. Single mineral fertilizer and a combination of mineral fertilizerand farmyard manure are commonly applied in Bangalore. Conservation practices, such as reducedtillage and mulching, are applied by 48% and 16% of households, respectively. Farm and householdcharacteristics, including market integration, are the most important determinants of managementdecisions that affect SOC. Our study shows that improving farm and household conditions andopportunities, independently of the degree of urbanity, is necessary for implementing agriculturalpractices that can benefit SOC in Bangalore.
Keywords: rurality; mineral fertilization; irrigation; mulching; tillage; crop choice; rural–urban index;farmers’ welfare; SOM; SOC
1. Introduction
Cultivation has led to a decline of soil organic matter (SOM), especially in most weath-ered tropical soils. Reductions in SOM constitute a negative feedback loop, altering theprovision of soil functions, such as C sequestration, habitat for soil organisms, biodiversity,and plant productivity [1]. Consequently, a low SOM content makes farmers more vulnera-ble to global change conditions, e.g., climate change and urbanization, which is particularlypronounced in regions of quickly growing megacities [2]. Urban expansion implies a loss offertile cropland to constructed areas, environmental degradation, competition for naturalresources, and it might even result in the displacement of farmers into marginal lands [2].Generally, farmers in urbanizing areas might have a higher adaptive capacity to changingframework conditions like climate change than remote rural farmers, due to better accessto certain infrastructures [3–5]. However, farmer communities from the city periphery maybe more vulnerable to climate change than at least a portion of the urban population inthe city center, where the economy is more active and physical and social infrastructures
Sustainability 2022, 14, 5775. https://doi.org/10.3390/su14105775 https://www.mdpi.com/journal/sustainability
Sustainability 2022, 14, 5775 2 of 27
are more developed [6], although such urban facilities may only benefit wealthier urbaninhabitants [7].
In India, the soil organic carbon (SOC) concentration in most cultivated soils is lessthan 5 mg g−1, compared with 15 to 20 g mg g−1 in uncultivated soils [8]. A low SOCconcentration is attributed to frequent tillage, the removal of crop residues, and the miningof soil fertility [8]. In recent years, there has been an increased need for and interest inhow SOC accumulation can be achieved through agricultural management practices, withreviews on best practices and their impacts on SOC [9–11]. Studies suggested that theretention of crop residues mitigates nutrient exports from soils and effectively preservesor even accumulates SOC [11]. Therefore, retaining crop residues on site is an importantmeasure to maintain the chemical, physical, and biological properties of soils [12,13], thusmitigating negative climate change impacts on crop yield [14].
Management practices altering SOC dynamics interact considerably with social-ecological factors that may be changing in the context of rural–urban transformation.For example, crop-choice changes in cultivated soils are increasingly being promoted byurban demand, inducing a switch from traditional rainfed cereal crops to more inten-sively managed irrigated vegetables in the vicinity of city markets [15]. Furthermore, farmhouseholds in urban areas may pursue alternative work outside agriculture, providingan additional income and enabling landowners to invest in innovative agricultural tech-nologies [16]. However, off-farm work may reduce the time and motivation spent onagriculture by directly increasing agriculture’s opportunity cost [17]. Potentially, this mightpromote the selection of less management-intensive agricultural practices that may only bebeneficial in the short term instead of labor-intensive practices often required in sustainableagriculture [18]. The main management factors that affect SOM dynamics are the selectionof crop species, the retention of crop residues by using mulching, the application of mineraland organic fertilizer, water management, and tillage. Different combinations of thesemanagement practices can counteract SOM accumulation, and the practices’ effects maydiffer between agricultural systems, soils, and climate regimes.
This paper aimed at providing an overview of how current management practicesare affecting the SOC dynamics and SOC accumulation in soils in an urbanizing settingin India. To achieve this objective, we first reviewed the literature on the effects of theabovementioned management factors in relevant tropical systems, performing a morein-depth statistical analysis of fertilization-type effects on SOC concentrations with a focuson agriculture in the surrounding areas of the South Indian megacity of Bangalore. Sincesocio-economic factors that are dynamically changing during urbanization are expected toaffect SOC-related management factors, the second aim of this study was to disentangleand analyze the relationship between socio-economic characteristics of farm households inBangalore’s urbanizing area and the use of agricultural management practices that affectSOC. We hypothesized that (1) conservation practices, such as mulching, minimum tillage,and FYM addition, improve SOC levels in the context of Indian agriculture; (2) decisionsfor crop choices are driven by the vicinity of city markets and affect management practices,such as fertilization and irrigation; and (3) decisions for adopting soil conservation practicesare more likely for traditional rainfed cereal crops, and these crops are more frequentlycultivated in rural areas. To test Hypothesis 1, data from the literature were evaluated. Totest Hypotheses 2 and 3, we used survey data from 362 farm households located in the rural–urban interface of Bangalore to examine farmers’ crop choices, the adoption of irrigation, aswell as the adoption of mulching practices, farmyard manure, and minimum or no tillage.We used Bangalore as a case study as it exemplifies many key characteristics of urbanizationand related agricultural transformations [19–21]. Urbanization in Bangalore negativelyaffects the local environment, ecosystems, and biodiversity [22,23]. We addressed theseissues in terms of SOC in our study since SOC is a holistic indicator of soil degradation [24].
Sustainability 2022, 14, 5775 3 of 27
2. Literature Review of Management Practices and Their Effects on SOC Dynamicsduring Rural–Urban Transformations2.1. Crop Choice and Diversification
Crop diversity is a critical factor in food security because having a variety of cropsmeans that at least some crops will yield despite harsh climate conditions, insect outbreaks,and other natural disasters [25]. Patil et al. [15] reported 82 distinct crops in Bangalore.Among the different categories, cereals and pulses are the main crop choice for farmersin Bangalore, finger millet and maize being the major crops. Commercial crops, such asfruits, vegetables, fodder, and horticultural crops, complement the range [15]. Marketproximity supports the production of high-value crops [26]. Proximity to Bangalore cityincreases the likelihood of farmers choosing vegetables, suggesting that the primary marketis a main decision factor [15]. Crop type may interact with fertilization level and watermanagement and may affect the quality of plant residues potentially returned to the soil [27].Nitrogen and lignin contents are major determinants of decomposition rates [28], withN2-fixing plants playing important roles in a substitution of mineral N fertilizer. High-quality residues increase microbial anabolic activity [12,29,30], promoting the productionof microbial residues, thus increasing the C sequestration in soils [31]. Furthermore, cropsdiffering in root traits may impact SOC dynamics via various processes, e.g., finer roots andmore branched root systems as well as mycorrhiza infections increase the aggregate stabilitymainly through the physical enmeshment of soil particles, which increases resistance tosoil erosion [32]. In annual cropping systems, species with high root to shoot ratios, suchas pigeon pea and finger millet, which are traditionally grown in Bangalore, show highercontributions to SOC compared to plants with lower root shoot ratios, such as maize [30,33].Perennial crops generally deposit more C than annual species due to their permanentand deeper root systems, promoting the stabilization of SOC [8,10]. These effects aremainly observed in tree plantations, hedges, and agroforestry systems, such as homegardens and alley cropping systems [9,34–38]. However, studies of Bangalore´s perennialrepresentatives are lacking.
2.2. Application of Crop Residues and Mulching
Residue return and mulching are practices oriented toward enhancing soil qualityand crop yields by increasing SOC inputs, improving a soil’s structure and water holdingcapacity [8,13] while preserving soil moisture [14,39]. Depending on the quality of theresidue and turnover rates, the return of nutrients by mulching may even directly increaseyields [12]. Furthermore, mulched crop residues provide protective litter layers againsterosion [28]. Mulching is practiced not only with harvest residues but also with treepruning from leguminous trees and shrubs that increase C and N inputs into the soil [40].Thus, legume plants are considered four times more often by tropical agricultural studiesanalyzing the effects of substrate quality and nutrient release than non-legume species [41].In India, mulching is preferred for fruit orchards, flowers, and vegetables rather than fortraditional food crops [42]. Despite the potential need for and positive effects of mulch,especially in rainfed systems, its use is not frequent in India [43].
In the tropics, lower C inputs into soil are partly caused by higher demands forcrop residues for alternative uses, such as livestock feeding, fuel, and fiber [11]. This isparticularly true in India where, besides livestock feeding, there is a great demand to useresidues for energy, especially for cooking [8,44,45]. This lack of available crop residuesis a major constraint for mulch applications as it is restricted cultivation during the dryseason that causes increases in bare fallow and erosion [8,44]. Thus, low yields and reducedresidue returns generate negative feedback loops with respect to SOC [8]. In this context, ahigher urban demand for crop products and land may provide motivation to reduce barefallow by using frequent cover crops, increasing crop productivity. In any case, all theabovementioned factors reflect a need to identify viable supplementary sources of nutrients,measures against soil erosion, [28] and viable alternative sources of fuel and fiber.
Sustainability 2022, 14, 5775 4 of 27
2.3. Use of Organic Manures and Fertilizers
Besides mulching, the application of organic manures increases nutrient cycling and Cinputs into soil. Urban cattle in Bangalore are stallfed with purchased or farm-producedconcentrates, while in rural locations, during the daytime, animals are allowed to graze onnearby vacant lands and on agricultural farmland. In both systems, dung collections andapplications in crop production are low, highlighting a need to strengthen crop–livestocklinks by using back transfers of some of the products [45]. There is also a need to moreefficiently manage urban cattle disposals that pollute water [45]. Thus, the recycling of cattlemanure will prevent water pollution and will close C and nutrient cycles in agriculture.Green roughage is produced on a daily basis from the city environment and green spaces,while dry roughage is often purchased weekly and stored. In addition, unused vegetableand food wastes and compounded cattle feed or individually mixed concentrate are fed [45],demonstrating the trade-offs between the crop residues used for mulching and feed. Besidesthe low dung return rate, a low frequency and amount of organic fertilizer applicationas well may be due to utilizations for further purposes, such as energy [46,47]. In placeswhere the availability of farmyard manure (FYM) is a major concern due to a decline inthe livestock population, crop residues, compost, and municipal biosolids are consideredalternative organic material inputs for sustainable crop production [48]. In India, the use ofbyproducts, such as press cake from the alternative biofuel species Jatropha, has increasedplant yields and SOC accumulation [49]. Compost and biochar are potentially more efficientat increasing SOC storage because on top of improvements in soil quality and productivity,they are decomposed more slowly than fresh plant residues [10,13]. However, compost andbiochar are less commonly applied in India, and few studies have included comparisonsbetween compost and other organic amendments in relevant cropping systems [50–52],while none have included biochar. In irrigated rice-based cropping systems, the prominentmeans of maintaining SOM has historically been the incorporation of green manures, animalwaste, and crop residues [12]. Under the specific dryland conditions of Bangalore, furtheranalyses are required to compare the effects of different fertilizers on C sequestration.
Organic fertilizer is progressively supplemented or substituted with mineral fertilizer.An increased availability of mineral fertilizer and subsidized prices are probably importantfactors increasing such applications in many regions of the world [46,53]. The applicationof mineral fertilizers and combinations with organic amendments are recommended tocounteract nutrient exports with harvested crops and nutrient losses during cultivations,while increasing soil aggregations, SOC contents, and water retentions of soils [8,13,54]. AnN fertilization effect on SOC fractions has not been observed in the short term [30,55,56],whereas long-term individual studies demonstrated positive effects of N fertilization onSOC. However, the positive effects may be outweighed by negative effects due to increasedN2O emissions at high fertilization levels [57]. In nutrient-limited soils, fertilization isrecommended for sufficient plant growth with a high potential for increasing C inputsin these soils [10]. Once a soil has improved in quality, yields are maintained by usinga smaller input of fertilizer [1,13] as there is a threshold at which plant yields level off,despite increasing amounts of fertilizer being applied [1].
The potential of using manures and crop residues for short-term N provisions islimited in light of the manures’ and residues’ low N availabilities and N contents, thelatter of which are often lower than 2%, although they can provide long-term benefitsin maintaining SOM [28]. Contrasting results observed in individual studies comparingfarmyard manure (FYM) with mineral fertilizers or combinations of the two were probablydue to differing contents of nutrients in organic manures and biotic as well as abiotic soilproperties. Nonetheless, for tropical croplands, manure applications have been some of themost successful practices for increasing SOC compared to mineral fertilization, conservationtillage, and the application of crop residues alone [11].
Sustainability 2022, 14, 5775 5 of 27
2.4. Water Management
In India, approximately one third of the country’s arable land is irrigated, and in-creases in crop yields have been observed after irrigation [8]. However, access to wateris limited and costly, emphasizing the importance of rainfed agriculture. Irrigation mayinduce contrasting effects on C sequestration. Introducing irrigation in dryland areas canincrease C inputs [10,58] while enhancing decomposition rates. Likewise, the frequency ofirrigation and intensities of wetting and drying cycles affect the soil’s physical propertiesand microbial decomposition [12], thus regulating C sequestration. The rapid mineraliza-tion of crop residues under optimal soil moisture conditions may explain why systemsunder irrigation do not effectively increase soil organic carbon stocks [11]. Furthermore,the effects of irrigation interact with other management measures as irrigated crops oftenreceive higher fertilization rates and other chemical farm inputs with implications for soilhealth and the environment [59]. However, the possible negative effects of irrigation, suchas increased erosion rates and nutrient losses, are often overlooked [58].
Nevertheless, water conservation practices, such as compartmental bunding, imple-menting ridges and furrows, and mulching, all increase plant yields and SOC stocks inBangalore´s agricultural soil [39,60], maintaining the positive effects of improved wateravailability on agriculture. In terms of irrigation, the adoption of efficient irrigation tech-niques, such as drip irrigation, in Bangalore may be linked to crop choice decisions, whilenot all crops can be drip irrigated [15].
The irrigation sources in Bangalore are diverse, ranging from relatively less pollutedrivers and underground sources to city wastewater [61,62]. With wastewater, nutrients andorganic matter are applied [61], but access to water is the most limiting factor, especially forsystems based on natural reservoirs that are constantly depleted [15,62]. Despite water’sprimary importance in most soil processes, published studies regarding water managementand its relation to SOC dynamics are surprisingly scarce compared to studies concerningother practices, such as fertilization and mulching.
2.5. Tillage
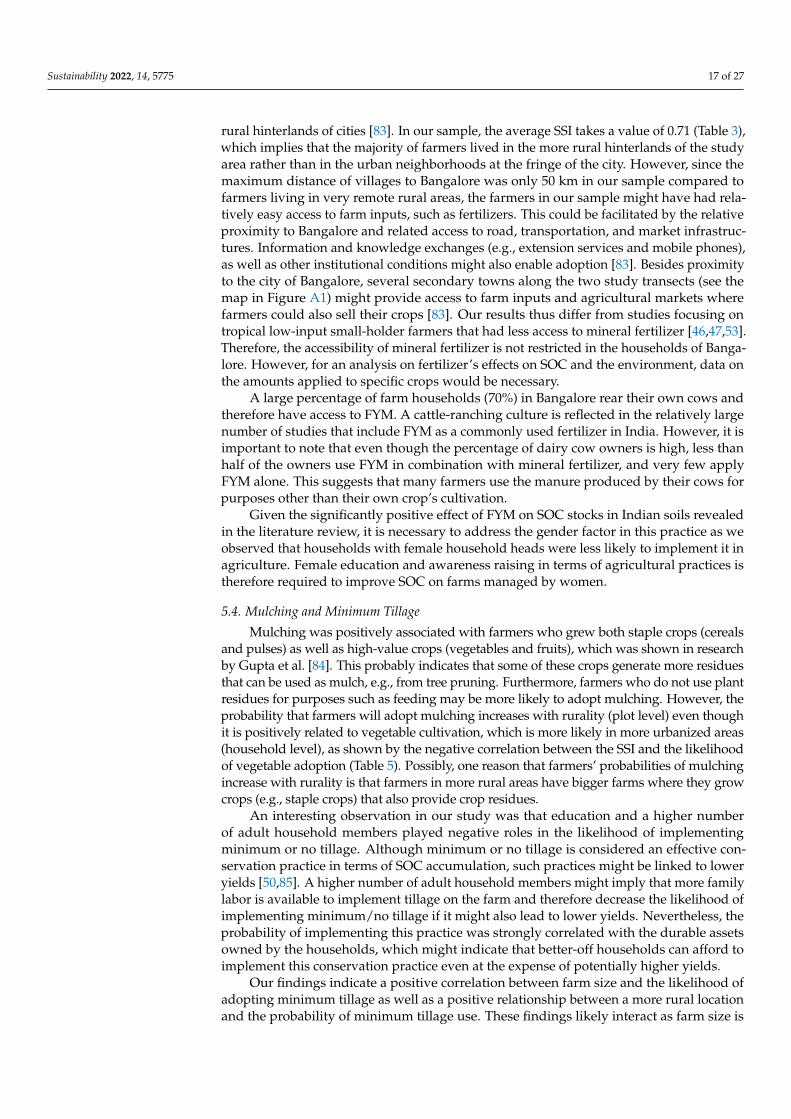
In India and other countries in Southeast Asia, moldboard plow tillage is frequentlyapplied in crop rotations [63]. Soil disruption and intensive tillage practices are classifiedas immediate causes of SOC declines, so reduced and zero tillage are important mitigationpractices to prevent SOC losses [8–10,13]. Tillage alters water interception and infiltration,soil porosity, aeration, aggregate distribution, and microclimates, increasing decomposi-tion rates [8,12]. Conservation tillage, leaving 30% or more of a soil’s surface with cropresidue [64], is a good conservation strategy enhancing soil quality, yields, and thus SOC [8].Zero tillage practices are defined as the complete absence of tillage and have been demon-strated to have great potential in increasing SOC accumulations worldwide [65]. In maizesystems, zero tillage [66,67] and reduced tillage [68] have presented the highest increasesin SOC. Studies about tillage’s effects on SOC in India showed increased SOC levels forreduced tillage and non-tillage practices compared to conventional tillage in 90% of cases(Table A1). Nevertheless, Powlson et al. [13] suggested that increases in SOC from reducedtillage appear to be much smaller than previously claimed and can be overestimated con-sidering differences in the depth, bulk density, and depth distribution of SOC betweentillage treatments.
3. Materials and Methods3.1. Analysis of Published Data on Fertilization’s Effects on SOC Dynamics in India3.1.1. Study Selection
Among the most relevant management factors affecting SOM dynamics, we focusedon the effects of different fertilization practices on SOC under pedoclimatic conditionsof India for analysis. We excluded analysis of tillage practices that were only partiallyaddressed in our survey study, while data on effects of mulching and water managementin India are scarce and therefore were not suitable for statistical evaluation.
Sustainability 2022, 14, 5775 6 of 27
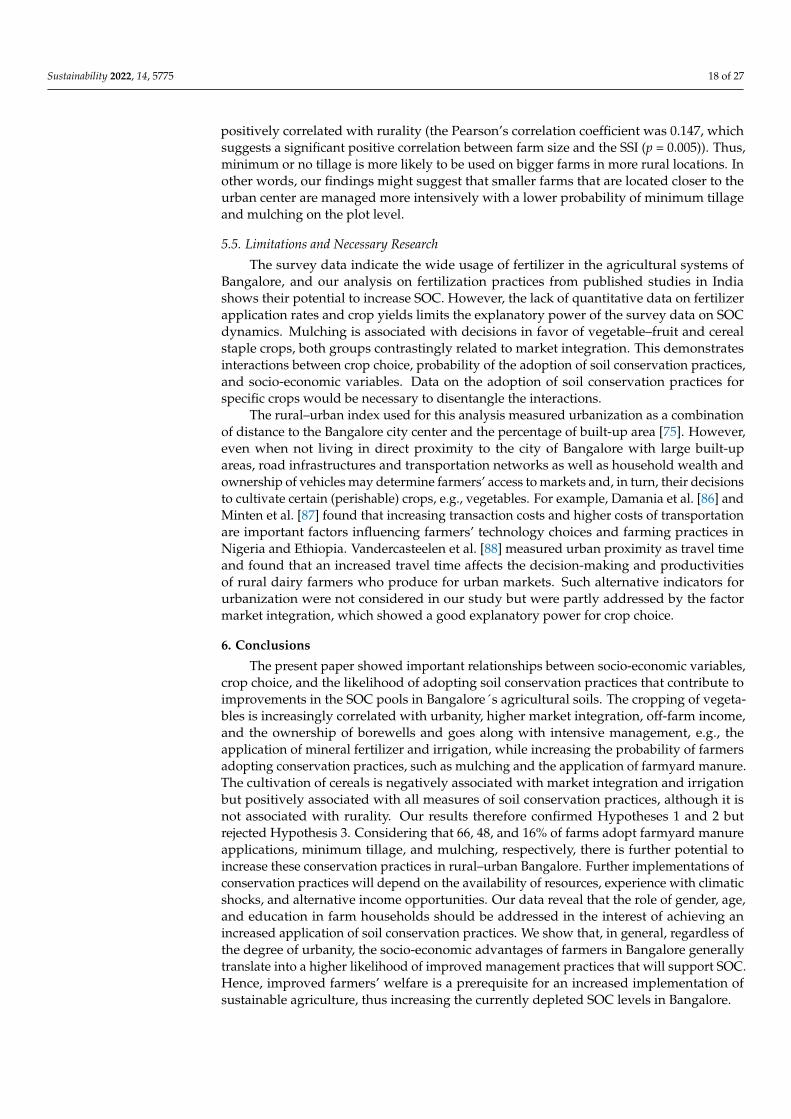
We selected long-term Indian studies that were based on rainfed agriculture and maizeand/or finger millet cropping systems as single crops or in combination with other rotationcrops as maize and millet are the major representatives of food crops in Bangalore withthe largest cultivated area. To prevent pseudo replications, additional studies conductedon the same field experiments under the same treatments, but with variations in samplingtime, were excluded. We collected data on further relevant factors on SOC dynamics,such as number of rotation crops, clay content, pH, rainfall, and study period (Table A2).Nevertheless, due to the fact that soil variables other than SOC were not analyzed in fieldreplicates, it was not possible to include these factors as co-variables in the analysis oftreatment effects in our study.
3.1.2. Data Analysis
In the selected studies, FYM-N was mainly given as % of the recommended N dose.However, when FYM input was given in terms of fresh biomass per hectare, we calculatedthe N input (kg ha−1) from the available information on % N content in FYM (Table 1).When SOC was given not in concentration units (g kg−1) but in SOC stocks (Mg ha−1), weused individual bulk density data (when available) to convert stocks into concentrations. Ifbulk density of different treatments was not available, the calculation was applied to all thetreatments using the initial bulk density of the soil. The increases in SOC presented in ourresults for the different treatments were calculated with the formula
∆SOC= SOCt − SOCc (1)
where SOCt is the SOC concentration (g kg−1) of each treatment and SOCc is the SOCconcentration (g kg−1) of the control treatments, i.e., without any fertilizer application.
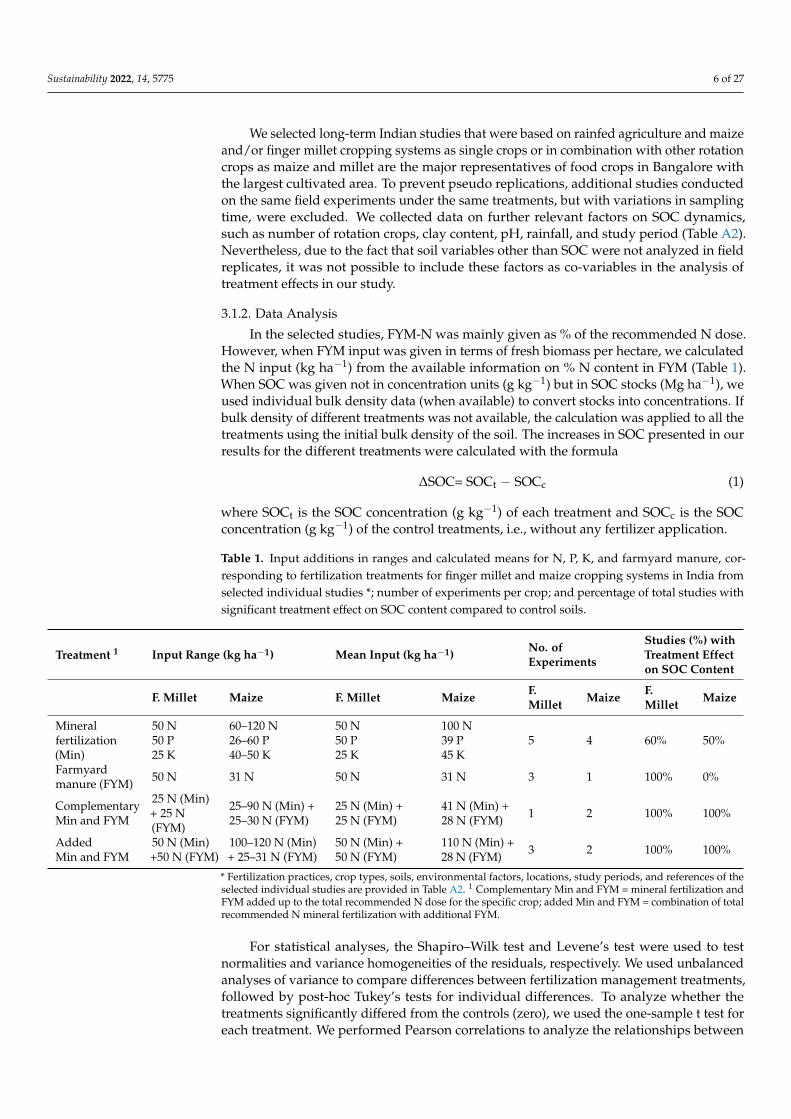
Table 1. Input additions in ranges and calculated means for N, P, K, and farmyard manure, cor-responding to fertilization treatments for finger millet and maize cropping systems in India fromselected individual studies *; number of experiments per crop; and percentage of total studies withsignificant treatment effect on SOC content compared to control soils.
Treatment 1 Input Range (kg ha−1) Mean Input (kg ha−1) No. ofExperiments
Studies (%) withTreatment Effecton SOC Content
F. Millet Maize F. Millet Maize F.Millet Maize F.
Millet Maize
Mineralfertilization(Min)
50 N50 P25 K
60–120 N26–60 P40–50 K
50 N50 P25 K
100 N39 P45 K
5 4 60% 50%
Farmyardmanure (FYM) 50 N 31 N 50 N 31 N 3 1 100% 0%
ComplementaryMin and FYM
25 N (Min)+ 25 N(FYM)
25–90 N (Min) +25–30 N (FYM)
25 N (Min) +25 N (FYM)
41 N (Min) +28 N (FYM) 1 2 100% 100%
AddedMin and FYM
50 N (Min)+50 N (FYM)
100–120 N (Min)+ 25–31 N (FYM)
50 N (Min) +50 N (FYM)
110 N (Min) +28 N (FYM) 3 2 100% 100%
* Fertilization practices, crop types, soils, environmental factors, locations, study periods, and references of theselected individual studies are provided in Table A2. 1 Complementary Min and FYM = mineral fertilization andFYM added up to the total recommended N dose for the specific crop; added Min and FYM = combination of totalrecommended N mineral fertilization with additional FYM.
For statistical analyses, the Shapiro–Wilk test and Levene’s test were used to testnormalities and variance homogeneities of the residuals, respectively. We used unbalancedanalyses of variance to compare differences between fertilization management treatments,followed by post-hoc Tukey’s tests for individual differences. To analyze whether thetreatments significantly differed from the controls (zero), we used the one-sample t test foreach treatment. We performed Pearson correlations to analyze the relationships between
Sustainability 2022, 14, 5775 7 of 27
grain yield and SOC with a selected data set from three experimental fields on finger milletusing all treatment samples, including controls without fertilization. The abovementionedstatistical analyses were performed in the R environment [69].
3.2. Analysis of Survey Data on Farmers’ Agricultural Practices in the Urbanizing Regionof Bangalore3.2.1. Study Site
Bangalore is a rising megacity located in South India. Its population increased from5.8 million people in 2001 to 8.7 million in 2011 [70]. Unofficial projections indicated thatthe population had grown to 12.6 million in 2021 [71]. Beside its population size, the cityis characterized by many key characteristics of urbanization and globalization. The cityis known as India’s ‘Silicon Valley’ [19] and has a diverse off-farm employment sectorthat attracts large numbers of migrants [72]. Despite this, the agricultural sector is still ofimportance as it provides a source of income for 49% of the labor force in the surroundingperi-urban and rural areas [73,74].
3.2.2. Data Collection
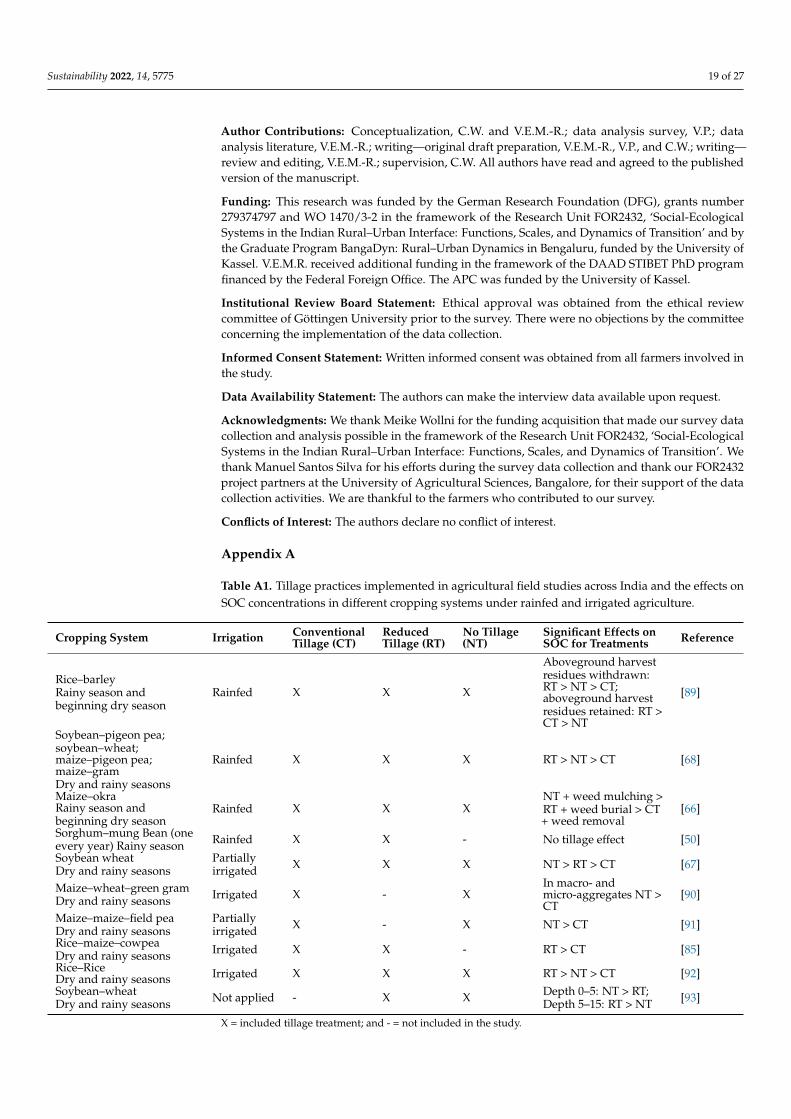
We used survey data that was collected from 388 farm households located in twotransects in the north and south of Bangalore between 2 February and 10 March 2020. Amap of the transects can be found in Figure A1. The sampling of villages and householdswas done in a previous survey phase in 2016/17 using a two-stage stratified samplingapproach [75]. In the sampling process, a Survey Stratification Index (SSI) developed byHoffmann et al. [75] was used as a proxy for urbanization. The SSI was calculated fromthe distance to the city center of Bangalore and the percentage of non-built-up area aroundthe villages. The SSI takes a value between 0 and 1, where 1 stands for most rural and0 indicates most urban. The two transects were classified into six urban, peri-urban, andrural strata based on their degrees of urbanity. Within the strata, villages were randomlysampled proportional to the size of their stratum [75]. Finally, a random sample of farmand non-farm households was drawn proportionate to the size of each village based onhousehold lists obtained from the mother and child care centers of the villages.
Due to the outbreak of the COVID-19 pandemic in India in March 2020, data collec-tion of the second survey had to be suspended on 10 March 2020. 55% of the sampledfarm households were interviewed. A total of 415 farm households in 50 out of 58 vil-lages/neighborhoods with farm households were thus re-interviewed in second survey.Hence, attrition occurred within villages rather than across villages. We used a standard-ized questionnaire to collect data on socio-demographic household characteristics andfarm management decisions (e.g., cropping decisions, fertilizer use, and use of sustainableagricultural practices). For our analysis, we focused only on the 388 crop-cultivating farmhouseholds as the sampled non-farm households and the farm households that were en-gaged in only dairy and livestock activities were not relevant to our study. We focused onlyon the data collected in the second survey in 2020 since data on certain farming practices(i.e., sustainable agricultural practices) that are essential for our analysis were not askedabout in sufficient detail in the first survey.
3.2.3. Data Analysis
We start by providing a descriptive overview of farmers’ crop choices, fertilizer use,and irrigation in the study area. For analysis of the socio-economic correlates of farmers’crop choices and the adoption of irrigation and conservation practices, we employed probitmodels. The linear probability model for each of the respective outcome variables wasspecified as:
Pi (Ai = 1 | xi) = β0 + β1Di + β2Hi + β3Li + β4Fi +εi (2)
The binary outcome Ai represent farmers’ crop choices and the adoption of irrigationand conservation methods. Pi denotes farmer i’s probability of adoption and hence theprobability that Ai = 1 (where Ai = 1 indicates that a farmer has adopted a crop from a
Sustainability 2022, 14, 5775 8 of 27
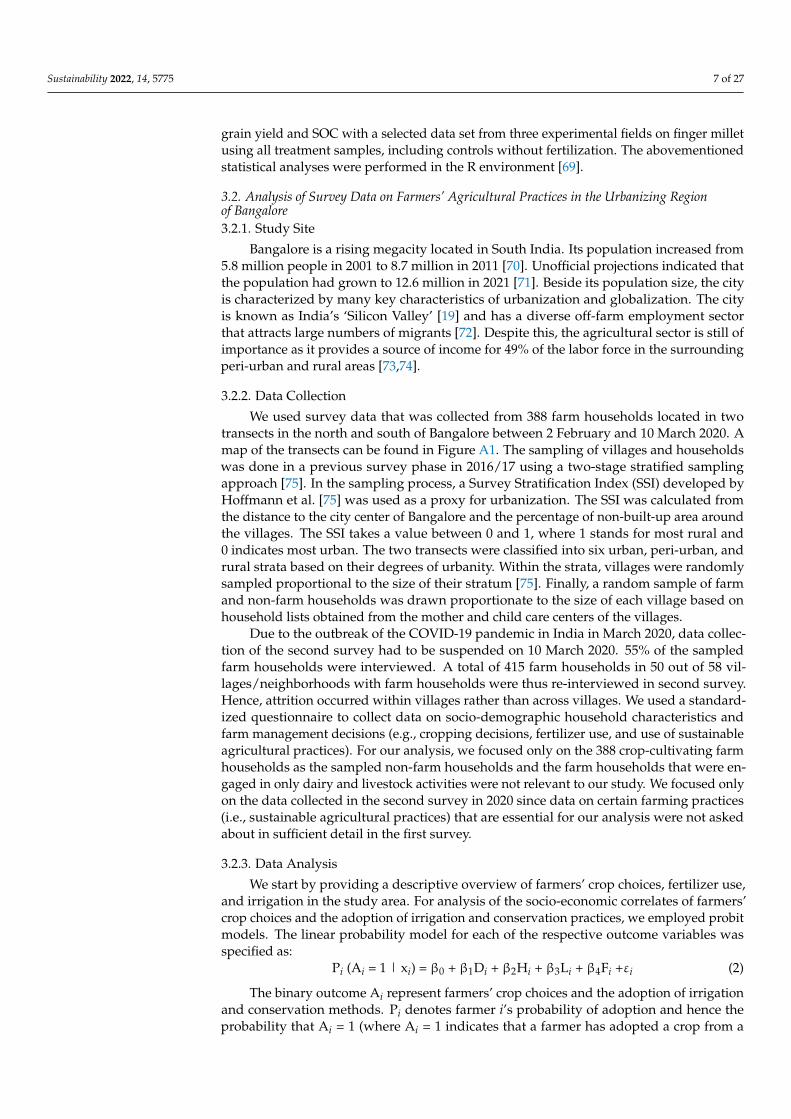
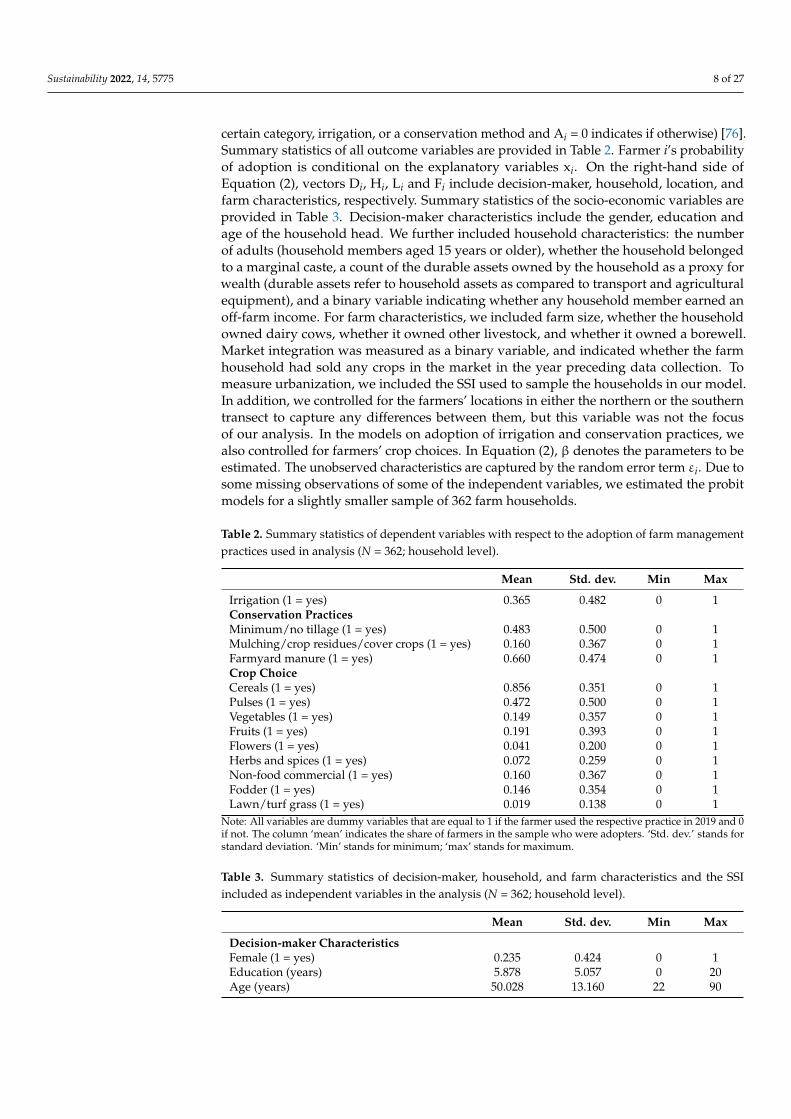
certain category, irrigation, or a conservation method and Ai = 0 indicates if otherwise) [76].Summary statistics of all outcome variables are provided in Table 2. Farmer i’s probabilityof adoption is conditional on the explanatory variables xi. On the right-hand side ofEquation (2), vectors Di, Hi, Li and Fi include decision-maker, household, location, andfarm characteristics, respectively. Summary statistics of the socio-economic variables areprovided in Table 3. Decision-maker characteristics include the gender, education andage of the household head. We further included household characteristics: the numberof adults (household members aged 15 years or older), whether the household belongedto a marginal caste, a count of the durable assets owned by the household as a proxy forwealth (durable assets refer to household assets as compared to transport and agriculturalequipment), and a binary variable indicating whether any household member earned anoff-farm income. For farm characteristics, we included farm size, whether the householdowned dairy cows, whether it owned other livestock, and whether it owned a borewell.Market integration was measured as a binary variable, and indicated whether the farmhousehold had sold any crops in the market in the year preceding data collection. Tomeasure urbanization, we included the SSI used to sample the households in our model.In addition, we controlled for the farmers’ locations in either the northern or the southerntransect to capture any differences between them, but this variable was not the focusof our analysis. In the models on adoption of irrigation and conservation practices, wealso controlled for farmers’ crop choices. In Equation (2), β denotes the parameters to beestimated. The unobserved characteristics are captured by the random error term εi. Due tosome missing observations of some of the independent variables, we estimated the probitmodels for a slightly smaller sample of 362 farm households.
Table 2. Summary statistics of dependent variables with respect to the adoption of farm managementpractices used in analysis (N = 362; household level).
Mean Std. dev. Min Max
Irrigation (1 = yes) 0.365 0.482 0 1Conservation PracticesMinimum/no tillage (1 = yes) 0.483 0.500 0 1Mulching/crop residues/cover crops (1 = yes) 0.160 0.367 0 1Farmyard manure (1 = yes) 0.660 0.474 0 1Crop ChoiceCereals (1 = yes) 0.856 0.351 0 1Pulses (1 = yes) 0.472 0.500 0 1Vegetables (1 = yes) 0.149 0.357 0 1Fruits (1 = yes) 0.191 0.393 0 1Flowers (1 = yes) 0.041 0.200 0 1Herbs and spices (1 = yes) 0.072 0.259 0 1Non-food commercial (1 = yes) 0.160 0.367 0 1Fodder (1 = yes) 0.146 0.354 0 1Lawn/turf grass (1 = yes) 0.019 0.138 0 1
Note: All variables are dummy variables that are equal to 1 if the farmer used the respective practice in 2019 and 0if not. The column ‘mean’ indicates the share of farmers in the sample who were adopters. ‘Std. dev.’ stands forstandard deviation. ‘Min’ stands for minimum; ‘max’ stands for maximum.
Table 3. Summary statistics of decision-maker, household, and farm characteristics and the SSIincluded as independent variables in the analysis (N = 362; household level).
Mean Std. dev. Min Max
Decision-maker CharacteristicsFemale (1 = yes) 0.235 0.424 0 1Education (years) 5.878 5.057 0 20Age (years) 50.028 13.160 22 90
Sustainability 2022, 14, 5775 9 of 27
Table 3. Cont.
Mean Std. dev. Min Max
Household CharacteristicsNo. of adults (HH members ≥ 15 years) 3.854 1.841 1 19Non-marginal caste (1 = yes) 0.790 0.408 0 1Durable assets owned (count) 11.992 6.026 0 48Off-farm income (1 = yes) 0.588 0.493 0 1Farm CharacteristicsFarm size (ha) 0.881 1.293 0 13
Dairy (1 = yes) 0.696 0.461 0 1Livestock (1 = yes) 0.403 0.491 0 1Owned borewell (1 = yes) 0.229 0.421 0 1Market integration (1 = yes) 0.420 0.494 0 1LocationRural–urban index (SSI) 1 0.712 0.148 0 1Northern transect (1 = yes) 0.541 0.499 0 1
Note: The column ‘mean’ indicates the share of farmers in the sample in case of dummy variables. ‘Std. dev.’stands for standard deviation. ‘Min’ stands for minimum; ‘max’ stands for maximum. 1 The SSI takes a valuebetween 0 and 1. The value 1 stands for most rural and 0 indicates most urban.
4. Results4.1. Fertilization Management’s Effects on Soil Organic Carbon (SOC) in Maize and Finger MilletCropping Systems in India
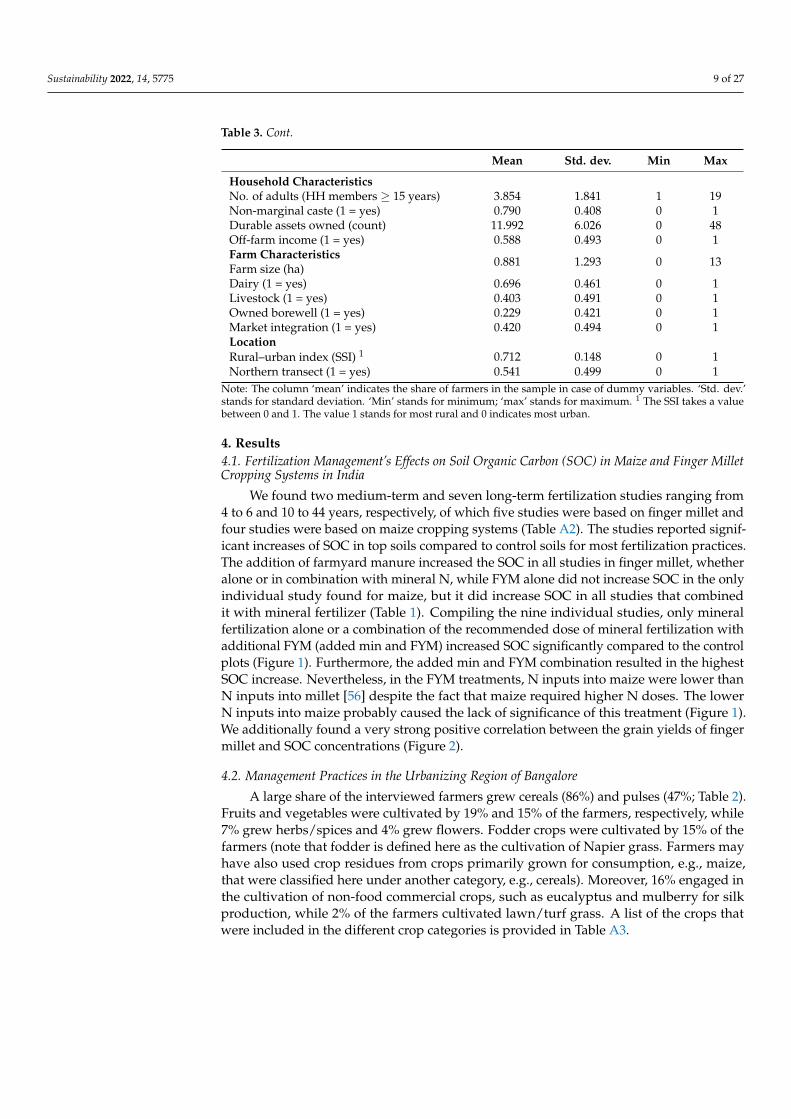
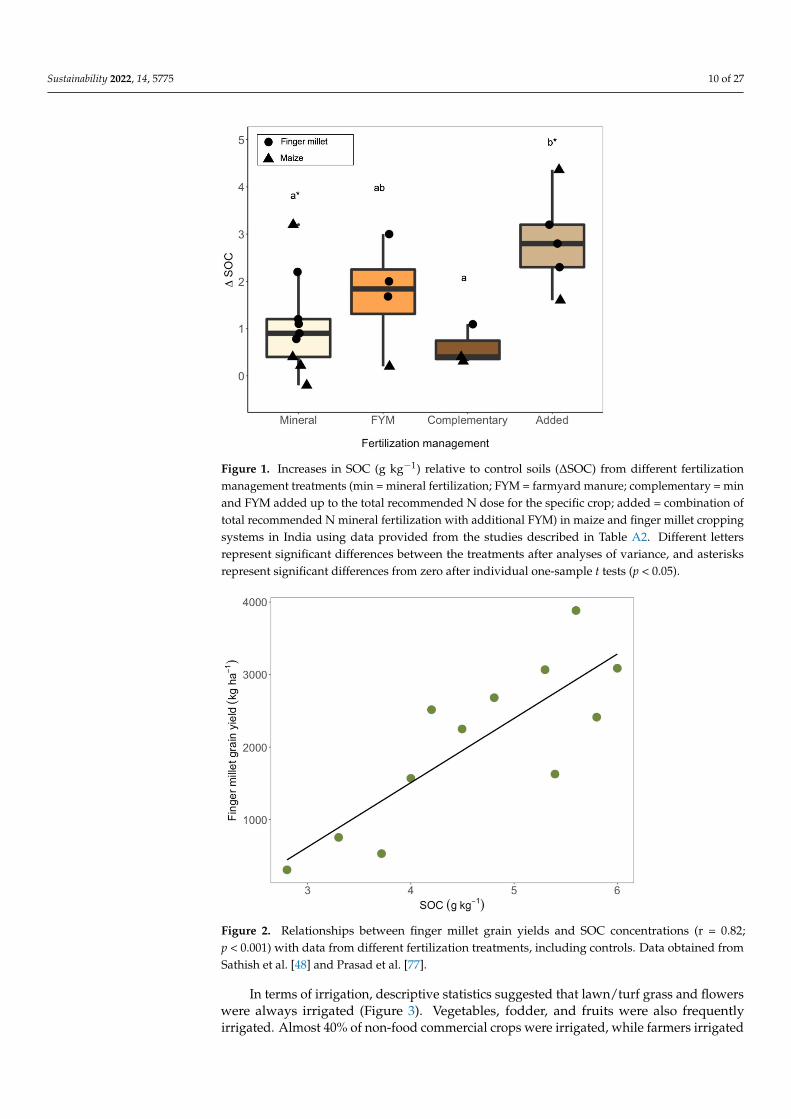
We found two medium-term and seven long-term fertilization studies ranging from4 to 6 and 10 to 44 years, respectively, of which five studies were based on finger millet andfour studies were based on maize cropping systems (Table A2). The studies reported signif-icant increases of SOC in top soils compared to control soils for most fertilization practices.The addition of farmyard manure increased the SOC in all studies in finger millet, whetheralone or in combination with mineral N, while FYM alone did not increase SOC in the onlyindividual study found for maize, but it did increase SOC in all studies that combinedit with mineral fertilizer (Table 1). Compiling the nine individual studies, only mineralfertilization alone or a combination of the recommended dose of mineral fertilization withadditional FYM (added min and FYM) increased SOC significantly compared to the controlplots (Figure 1). Furthermore, the added min and FYM combination resulted in the highestSOC increase. Nevertheless, in the FYM treatments, N inputs into maize were lower thanN inputs into millet [56] despite the fact that maize required higher N doses. The lowerN inputs into maize probably caused the lack of significance of this treatment (Figure 1).We additionally found a very strong positive correlation between the grain yields of fingermillet and SOC concentrations (Figure 2).
4.2. Management Practices in the Urbanizing Region of Bangalore
A large share of the interviewed farmers grew cereals (86%) and pulses (47%; Table 2).Fruits and vegetables were cultivated by 19% and 15% of the farmers, respectively, while7% grew herbs/spices and 4% grew flowers. Fodder crops were cultivated by 15% of thefarmers (note that fodder is defined here as the cultivation of Napier grass. Farmers mayhave also used crop residues from crops primarily grown for consumption, e.g., maize,that were classified here under another category, e.g., cereals). Moreover, 16% engaged inthe cultivation of non-food commercial crops, such as eucalyptus and mulberry for silkproduction, while 2% of the farmers cultivated lawn/turf grass. A list of the crops thatwere included in the different crop categories is provided in Table A3.
Sustainability 2022, 14, 5775 10 of 27Sustainability 2022, 14, x FOR PEER REVIEW 11 of 30
Figure 1. Increases in SOC (g kg−1) relative to control soils (∆SOC) from different fertilization man-agement treatments (min = mineral fertilization; FYM = farmyard manure; complementary = min and FYM added up to the total recommended N dose for the specific crop; added = combination of total recommended N mineral fertilization with additional FYM) in maize and finger millet crop-ping systems in India using data provided from the studies described in Table A2. Different letters represent significant differences between the treatments after analyses of variance, and asterisks represent significant differences from zero after individual one-sample t tests (p < 0.05).
Figure 2. Relationships between finger millet grain yields and SOC concentrations (r = 0.82; p < 0.001) with data from different fertilization treatments, including controls. Data obtained from Sathish et al. [48] and Prasad et al. [77].
4.2. Management Practices in the Urbanizing Region of Bangalore A large share of the interviewed farmers grew cereals (86%) and pulses (47%; Table
2). Fruits and vegetables were cultivated by 19% and 15% of the farmers, respectively,
Figure 1. Increases in SOC (g kg−1) relative to control soils (∆SOC) from different fertilizationmanagement treatments (min = mineral fertilization; FYM = farmyard manure; complementary = minand FYM added up to the total recommended N dose for the specific crop; added = combination oftotal recommended N mineral fertilization with additional FYM) in maize and finger millet croppingsystems in India using data provided from the studies described in Table A2. Different lettersrepresent significant differences between the treatments after analyses of variance, and asterisksrepresent significant differences from zero after individual one-sample t tests (p < 0.05).
Sustainability 2022, 14, x FOR PEER REVIEW 11 of 30
Figure 1. Increases in SOC (g kg−1) relative to control soils (∆SOC) from different fertilization man-agement treatments (min = mineral fertilization; FYM = farmyard manure; complementary = min and FYM added up to the total recommended N dose for the specific crop; added = combination of total recommended N mineral fertilization with additional FYM) in maize and finger millet crop-ping systems in India using data provided from the studies described in Table A2. Different letters represent significant differences between the treatments after analyses of variance, and asterisks represent significant differences from zero after individual one-sample t tests (p < 0.05).
Figure 2. Relationships between finger millet grain yields and SOC concentrations (r = 0.82; p < 0.001) with data from different fertilization treatments, including controls. Data obtained from Sathish et al. [48] and Prasad et al. [77].
4.2. Management Practices in the Urbanizing Region of Bangalore A large share of the interviewed farmers grew cereals (86%) and pulses (47%; Table
2). Fruits and vegetables were cultivated by 19% and 15% of the farmers, respectively,
Figure 2. Relationships between finger millet grain yields and SOC concentrations (r = 0.82;p < 0.001) with data from different fertilization treatments, including controls. Data obtained fromSathish et al. [48] and Prasad et al. [77].
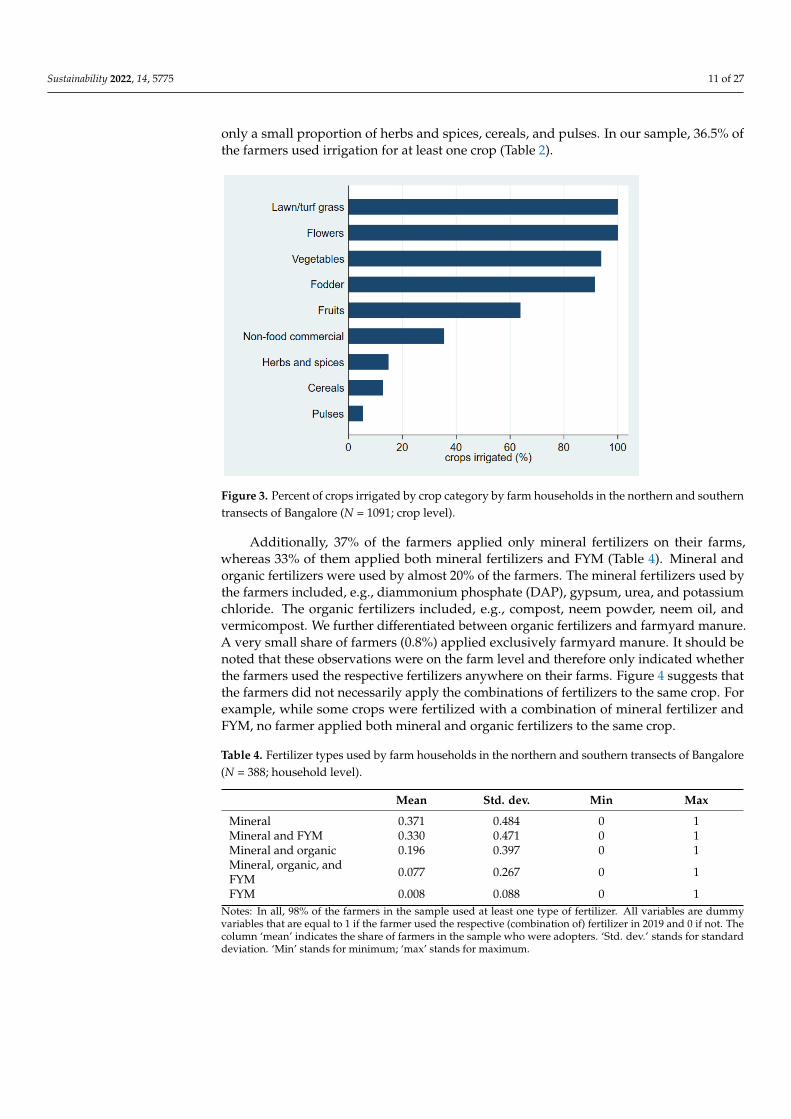
In terms of irrigation, descriptive statistics suggested that lawn/turf grass and flowerswere always irrigated (Figure 3). Vegetables, fodder, and fruits were also frequentlyirrigated. Almost 40% of non-food commercial crops were irrigated, while farmers irrigated
Sustainability 2022, 14, 5775 11 of 27
only a small proportion of herbs and spices, cereals, and pulses. In our sample, 36.5% ofthe farmers used irrigation for at least one crop (Table 2).
Sustainability 2022, 14, x FOR PEER REVIEW 12 of 30
while 7% grew herbs/spices and 4% grew flowers. Fodder crops were cultivated by 15% of the farmers (note that fodder is defined here as the cultivation of Napier grass. Farmers may have also used crop residues from crops primarily grown for consumption, e.g., maize, that were classified here under another category, e.g., cereals). Moreover, 16% en-gaged in the cultivation of non-food commercial crops, such as eucalyptus and mulberry for silk production, while 2% of the farmers cultivated lawn/turf grass. A list of the crops that were included in the different crop categories is provided in Table A3.
In terms of irrigation, descriptive statistics suggested that lawn/turf grass and flowers were always irrigated (Figure 3). Vegetables, fodder, and fruits were also frequently irri-gated. Almost 40% of non-food commercial crops were irrigated, while farmers irrigated only a small proportion of herbs and spices, cereals, and pulses. In our sample, 36.5% of the farmers used irrigation for at least one crop (Table 2).
Additionally, 37% of the farmers applied only mineral fertilizers on their farms, whereas 33% of them applied both mineral fertilizers and FYM (Table 4). Mineral and organic fertilizers were used by almost 20% of the farmers. The mineral fertilizers used by the farmers included, e.g., diammonium phosphate (DAP), gypsum, urea, and potassium chloride. The organic fertilizers included, e.g., compost, neem powder, neem oil, and ver-micompost. We further differentiated between organic fertilizers and farmyard manure. A very small share of farmers (0.8%) applied exclusively farmyard manure. It should be noted that these observations were on the farm level and therefore only indicated whether the farmers used the respective fertilizers anywhere on their farms. Figure 4 suggests that the farmers did not necessarily apply the combinations of fertilizers to the same crop. For example, while some crops were fertilized with a combination of mineral fertilizer and FYM, no farmer applied both mineral and organic fertilizers to the same crop.
Figure 3. Percent of crops irrigated by crop category by farm households in the northern and south-ern transects of Bangalore (N = 1091; crop level).
Table 4. Fertilizer types used by farm households in the northern and southern transects of Banga-lore (N = 388; household level).
Mean Std. dev. Min Max Mineral 0.371 0.484 0 1 Mineral and FYM 0.330 0.471 0 1 Mineral and organic 0.196 0.397 0 1 Mineral, organic, and FYM 0.077 0.267 0 1 FYM 0.008 0.088 0 1
Figure 3. Percent of crops irrigated by crop category by farm households in the northern and southerntransects of Bangalore (N = 1091; crop level).
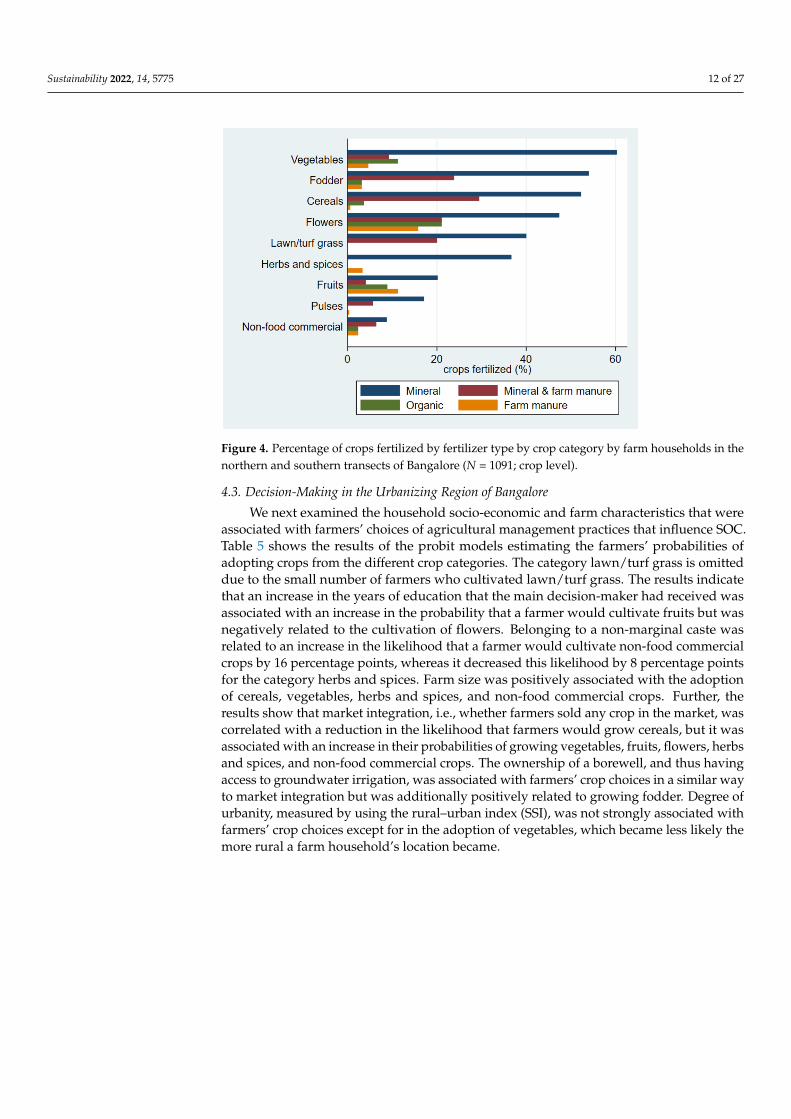
Additionally, 37% of the farmers applied only mineral fertilizers on their farms,whereas 33% of them applied both mineral fertilizers and FYM (Table 4). Mineral andorganic fertilizers were used by almost 20% of the farmers. The mineral fertilizers used bythe farmers included, e.g., diammonium phosphate (DAP), gypsum, urea, and potassiumchloride. The organic fertilizers included, e.g., compost, neem powder, neem oil, andvermicompost. We further differentiated between organic fertilizers and farmyard manure.A very small share of farmers (0.8%) applied exclusively farmyard manure. It should benoted that these observations were on the farm level and therefore only indicated whetherthe farmers used the respective fertilizers anywhere on their farms. Figure 4 suggests thatthe farmers did not necessarily apply the combinations of fertilizers to the same crop. Forexample, while some crops were fertilized with a combination of mineral fertilizer andFYM, no farmer applied both mineral and organic fertilizers to the same crop.
Table 4. Fertilizer types used by farm households in the northern and southern transects of Bangalore(N = 388; household level).
Mean Std. dev. Min Max
Mineral 0.371 0.484 0 1Mineral and FYM 0.330 0.471 0 1Mineral and organic 0.196 0.397 0 1Mineral, organic, andFYM 0.077 0.267 0 1
FYM 0.008 0.088 0 1Notes: In all, 98% of the farmers in the sample used at least one type of fertilizer. All variables are dummyvariables that are equal to 1 if the farmer used the respective (combination of) fertilizer in 2019 and 0 if not. Thecolumn ‘mean’ indicates the share of farmers in the sample who were adopters. ‘Std. dev.’ stands for standarddeviation. ‘Min’ stands for minimum; ‘max’ stands for maximum.
Sustainability 2022, 14, 5775 12 of 27
Sustainability 2022, 14, x FOR PEER REVIEW 13 of 30
Notes: In all, 98% of the farmers in the sample used at least one type of fertilizer. All variables are dummy variables that are equal to 1 if the farmer used the respective (combination of) fertilizer in 2019 and 0 if not. The column ‘mean’ indicates the share of farmers in the sample who were adopters. ‘Std. dev.’ stands for standard deviation. ‘Min’ stands for minimum; ‘max’ stands for maximum.
Figure 4. Percentage of crops fertilized by fertilizer type by crop category by farm households in the northern and southern transects of Bangalore (N = 1091; crop level;).
4.3. Decision-Making in the Urbanizing Region of Bangalore We next examined the household socio-economic and farm characteristics that were
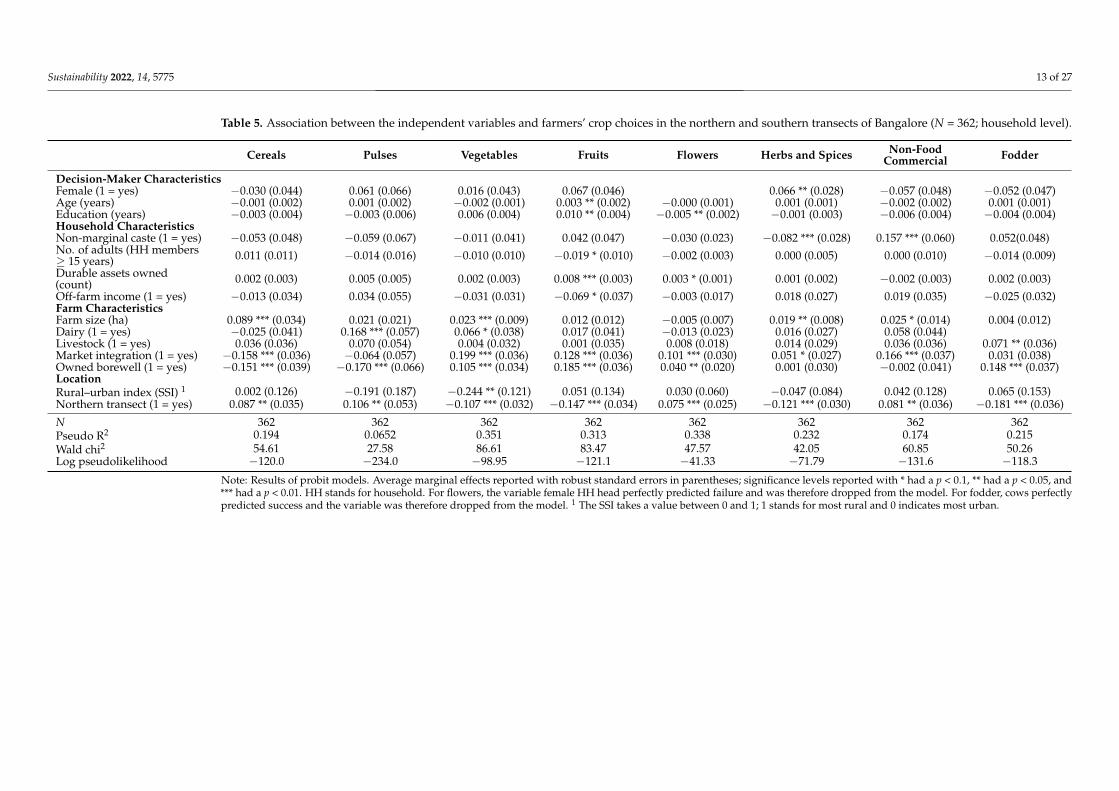
associated with farmers’ choices of agricultural management practices that influence SOC. Table 5 shows the results of the probit models estimating the farmers’ probabilities of adopting crops from the different crop categories. The category lawn/turf grass is omitted due to the small number of farmers who cultivated lawn/turf grass. The results indicate that an increase in the years of education that the main decision-maker had received was associated with an increase in the probability that a farmer would cultivate fruits but was negatively related to the cultivation of flowers. Belonging to a non-marginal caste was related to an increase in the likelihood that a farmer would cultivate non-food commercial crops by 16 percentage points, whereas it decreased this likelihood by 8 percentage points for the category herbs and spices. Farm size was positively associated with the adoption of cereals, vegetables, herbs and spices, and non-food commercial crops. Further, the re-sults show that market integration, i.e., whether farmers sold any crop in the market, was correlated with a reduction in the likelihood that farmers would grow cereals, but it was associated with an increase in their probabilities of growing vegetables, fruits, flowers, herbs and spices, and non-food commercial crops. The ownership of a borewell, and thus having access to groundwater irrigation, was associated with farmers’ crop choices in a similar way to market integration but was additionally positively related to growing fod-der. Degree of urbanity, measured by using the rural–urban index (SSI), was not strongly associated with farmers’ crop choices except for in the adoption of vegetables, which be-came less likely the more rural a farm household’s location became.
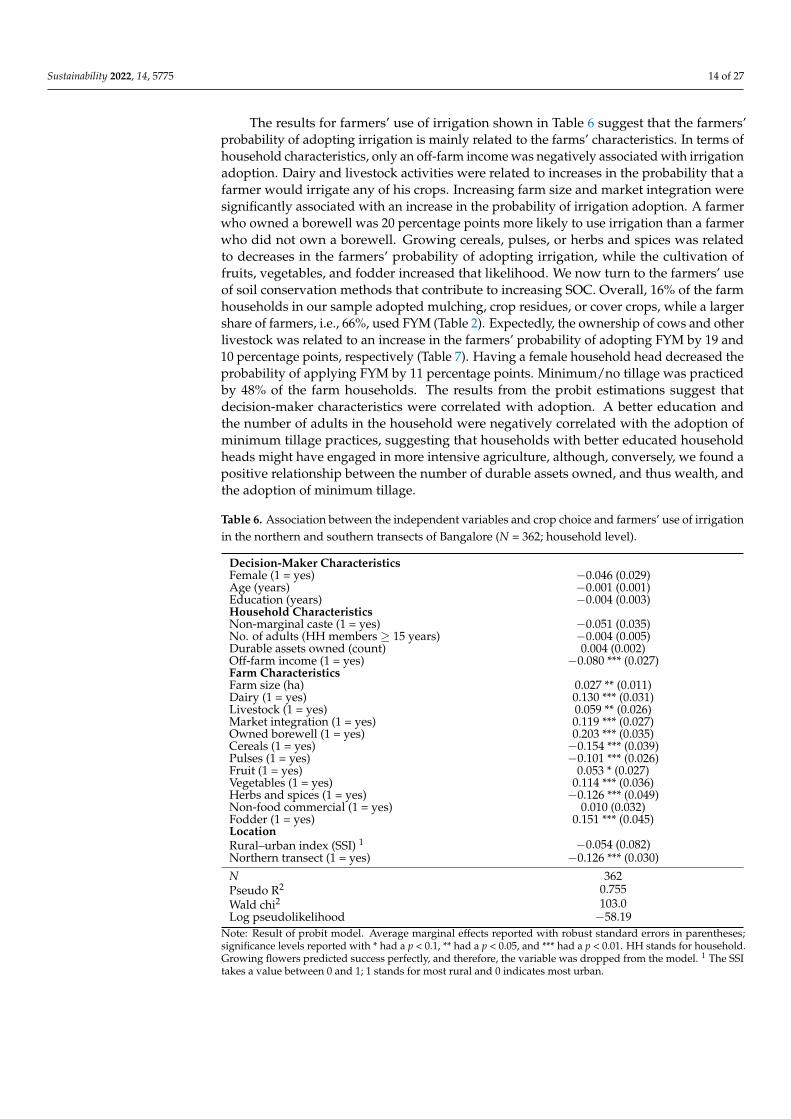
The results for farmers’ use of irrigation shown in Table 6 suggest that the farmers’ probability of adopting irrigation is mainly related to the farms’ characteristics. In terms of household characteristics, only an off-farm income was negatively associated with irri-gation adoption. Dairy and livestock activities were related to increases in the probability that a farmer would irrigate any of his crops. Increasing farm size and market integration were significantly associated with an increase in the probability of irrigation adoption. A
Figure 4. Percentage of crops fertilized by fertilizer type by crop category by farm households in thenorthern and southern transects of Bangalore (N = 1091; crop level).
4.3. Decision-Making in the Urbanizing Region of Bangalore
We next examined the household socio-economic and farm characteristics that wereassociated with farmers’ choices of agricultural management practices that influence SOC.Table 5 shows the results of the probit models estimating the farmers’ probabilities ofadopting crops from the different crop categories. The category lawn/turf grass is omitteddue to the small number of farmers who cultivated lawn/turf grass. The results indicatethat an increase in the years of education that the main decision-maker had received wasassociated with an increase in the probability that a farmer would cultivate fruits but wasnegatively related to the cultivation of flowers. Belonging to a non-marginal caste wasrelated to an increase in the likelihood that a farmer would cultivate non-food commercialcrops by 16 percentage points, whereas it decreased this likelihood by 8 percentage pointsfor the category herbs and spices. Farm size was positively associated with the adoptionof cereals, vegetables, herbs and spices, and non-food commercial crops. Further, theresults show that market integration, i.e., whether farmers sold any crop in the market, wascorrelated with a reduction in the likelihood that farmers would grow cereals, but it wasassociated with an increase in their probabilities of growing vegetables, fruits, flowers, herbsand spices, and non-food commercial crops. The ownership of a borewell, and thus havingaccess to groundwater irrigation, was associated with farmers’ crop choices in a similar wayto market integration but was additionally positively related to growing fodder. Degree ofurbanity, measured by using the rural–urban index (SSI), was not strongly associated withfarmers’ crop choices except for in the adoption of vegetables, which became less likely themore rural a farm household’s location became.
Sustainability 2022, 14, 5775 13 of 27
Table 5. Association between the independent variables and farmers’ crop choices in the northern and southern transects of Bangalore (N = 362; household level).
Cereals Pulses Vegetables Fruits Flowers Herbs and Spices Non-FoodCommercial Fodder
Decision-Maker CharacteristicsFemale (1 = yes) −0.030 (0.044) 0.061 (0.066) 0.016 (0.043) 0.067 (0.046) 0.066 ** (0.028) −0.057 (0.048) −0.052 (0.047)Age (years) −0.001 (0.002) 0.001 (0.002) −0.002 (0.001) 0.003 ** (0.002) −0.000 (0.001) 0.001 (0.001) −0.002 (0.002) 0.001 (0.001)Education (years) −0.003 (0.004) −0.003 (0.006) 0.006 (0.004) 0.010 ** (0.004) −0.005 ** (0.002) −0.001 (0.003) −0.006 (0.004) −0.004 (0.004)Household CharacteristicsNon-marginal caste (1 = yes) −0.053 (0.048) −0.059 (0.067) −0.011 (0.041) 0.042 (0.047) −0.030 (0.023) −0.082 *** (0.028) 0.157 *** (0.060) 0.052(0.048)No. of adults (HH members≥ 15 years) 0.011 (0.011) −0.014 (0.016) −0.010 (0.010) −0.019 * (0.010) −0.002 (0.003) 0.000 (0.005) 0.000 (0.010) −0.014 (0.009)Durable assets owned(count) 0.002 (0.003) 0.005 (0.005) 0.002 (0.003) 0.008 *** (0.003) 0.003 * (0.001) 0.001 (0.002) −0.002 (0.003) 0.002 (0.003)Off-farm income (1 = yes) −0.013 (0.034) 0.034 (0.055) −0.031 (0.031) −0.069 * (0.037) −0.003 (0.017) 0.018 (0.027) 0.019 (0.035) −0.025 (0.032)Farm CharacteristicsFarm size (ha) 0.089 *** (0.034) 0.021 (0.021) 0.023 *** (0.009) 0.012 (0.012) −0.005 (0.007) 0.019 ** (0.008) 0.025 * (0.014) 0.004 (0.012)Dairy (1 = yes) −0.025 (0.041) 0.168 *** (0.057) 0.066 * (0.038) 0.017 (0.041) −0.013 (0.023) 0.016 (0.027) 0.058 (0.044)Livestock (1 = yes) 0.036 (0.036) 0.070 (0.054) 0.004 (0.032) 0.001 (0.035) 0.008 (0.018) 0.014 (0.029) 0.036 (0.036) 0.071 ** (0.036)Market integration (1 = yes) −0.158 *** (0.036) −0.064 (0.057) 0.199 *** (0.036) 0.128 *** (0.036) 0.101 *** (0.030) 0.051 * (0.027) 0.166 *** (0.037) 0.031 (0.038)Owned borewell (1 = yes) −0.151 *** (0.039) −0.170 *** (0.066) 0.105 *** (0.034) 0.185 *** (0.036) 0.040 ** (0.020) 0.001 (0.030) −0.002 (0.041) 0.148 *** (0.037)LocationRural–urban index (SSI) 1 0.002 (0.126) −0.191 (0.187) −0.244 ** (0.121) 0.051 (0.134) 0.030 (0.060) −0.047 (0.084) 0.042 (0.128) 0.065 (0.153)Northern transect (1 = yes) 0.087 ** (0.035) 0.106 ** (0.053) −0.107 *** (0.032) −0.147 *** (0.034) 0.075 *** (0.025) −0.121 *** (0.030) 0.081 ** (0.036) −0.181 *** (0.036)
N 362 362 362 362 362 362 362 362Pseudo R2 0.194 0.0652 0.351 0.313 0.338 0.232 0.174 0.215Wald chi2 54.61 27.58 86.61 83.47 47.57 42.05 60.85 50.26Log pseudolikelihood −120.0 −234.0 −98.95 −121.1 −41.33 −71.79 −131.6 −118.3
Note: Results of probit models. Average marginal effects reported with robust standard errors in parentheses; significance levels reported with * had a p < 0.1, ** had a p < 0.05, and*** had a p < 0.01. HH stands for household. For flowers, the variable female HH head perfectly predicted failure and was therefore dropped from the model. For fodder, cows perfectlypredicted success and the variable was therefore dropped from the model. 1 The SSI takes a value between 0 and 1; 1 stands for most rural and 0 indicates most urban.
Sustainability 2022, 14, 5775 14 of 27
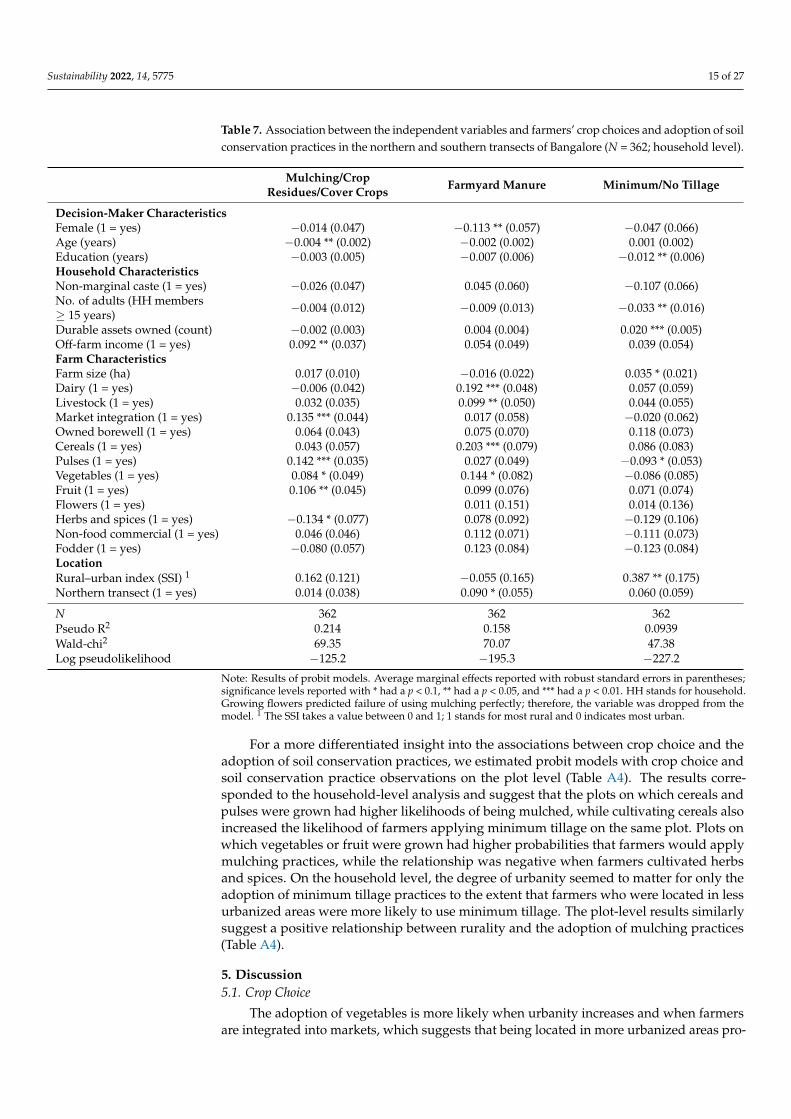
The results for farmers’ use of irrigation shown in Table 6 suggest that the farmers’probability of adopting irrigation is mainly related to the farms’ characteristics. In terms ofhousehold characteristics, only an off-farm income was negatively associated with irrigationadoption. Dairy and livestock activities were related to increases in the probability that afarmer would irrigate any of his crops. Increasing farm size and market integration weresignificantly associated with an increase in the probability of irrigation adoption. A farmerwho owned a borewell was 20 percentage points more likely to use irrigation than a farmerwho did not own a borewell. Growing cereals, pulses, or herbs and spices was relatedto decreases in the farmers’ probability of adopting irrigation, while the cultivation offruits, vegetables, and fodder increased that likelihood. We now turn to the farmers’ useof soil conservation methods that contribute to increasing SOC. Overall, 16% of the farmhouseholds in our sample adopted mulching, crop residues, or cover crops, while a largershare of farmers, i.e., 66%, used FYM (Table 2). Expectedly, the ownership of cows and otherlivestock was related to an increase in the farmers’ probability of adopting FYM by 19 and10 percentage points, respectively (Table 7). Having a female household head decreased theprobability of applying FYM by 11 percentage points. Minimum/no tillage was practicedby 48% of the farm households. The results from the probit estimations suggest thatdecision-maker characteristics were correlated with adoption. A better education andthe number of adults in the household were negatively correlated with the adoption ofminimum tillage practices, suggesting that households with better educated householdheads might have engaged in more intensive agriculture, although, conversely, we found apositive relationship between the number of durable assets owned, and thus wealth, andthe adoption of minimum tillage.
Table 6. Association between the independent variables and crop choice and farmers’ use of irrigationin the northern and southern transects of Bangalore (N = 362; household level).
Decision-Maker CharacteristicsFemale (1 = yes) −0.046 (0.029)Age (years) −0.001 (0.001)Education (years) −0.004 (0.003)Household CharacteristicsNon-marginal caste (1 = yes) −0.051 (0.035)No. of adults (HH members ≥ 15 years) −0.004 (0.005)Durable assets owned (count) 0.004 (0.002)Off-farm income (1 = yes) −0.080 *** (0.027)Farm CharacteristicsFarm size (ha) 0.027 ** (0.011)Dairy (1 = yes) 0.130 *** (0.031)Livestock (1 = yes) 0.059 ** (0.026)Market integration (1 = yes) 0.119 *** (0.027)Owned borewell (1 = yes) 0.203 *** (0.035)Cereals (1 = yes) −0.154 *** (0.039)Pulses (1 = yes) −0.101 *** (0.026)Fruit (1 = yes) 0.053 * (0.027)Vegetables (1 = yes) 0.114 *** (0.036)Herbs and spices (1 = yes) −0.126 *** (0.049)Non-food commercial (1 = yes) 0.010 (0.032)Fodder (1 = yes) 0.151 *** (0.045)LocationRural–urban index (SSI) 1 −0.054 (0.082)Northern transect (1 = yes) −0.126 *** (0.030)
N 362Pseudo R2 0.755Wald chi2 103.0Log pseudolikelihood −58.19
Note: Result of probit model. Average marginal effects reported with robust standard errors in parentheses;significance levels reported with * had a p < 0.1, ** had a p < 0.05, and *** had a p < 0.01. HH stands for household.Growing flowers predicted success perfectly, and therefore, the variable was dropped from the model. 1 The SSItakes a value between 0 and 1; 1 stands for most rural and 0 indicates most urban.
Sustainability 2022, 14, 5775 15 of 27
Table 7. Association between the independent variables and farmers’ crop choices and adoption of soilconservation practices in the northern and southern transects of Bangalore (N = 362; household level).
Mulching/CropResidues/Cover Crops Farmyard Manure Minimum/No Tillage
Decision-Maker CharacteristicsFemale (1 = yes) −0.014 (0.047) −0.113 ** (0.057) −0.047 (0.066)Age (years) −0.004 ** (0.002) −0.002 (0.002) 0.001 (0.002)Education (years) −0.003 (0.005) −0.007 (0.006) −0.012 ** (0.006)Household CharacteristicsNon-marginal caste (1 = yes) −0.026 (0.047) 0.045 (0.060) −0.107 (0.066)No. of adults (HH members≥ 15 years) −0.004 (0.012) −0.009 (0.013) −0.033 ** (0.016)
Durable assets owned (count) −0.002 (0.003) 0.004 (0.004) 0.020 *** (0.005)Off-farm income (1 = yes) 0.092 ** (0.037) 0.054 (0.049) 0.039 (0.054)Farm CharacteristicsFarm size (ha) 0.017 (0.010) −0.016 (0.022) 0.035 * (0.021)Dairy (1 = yes) −0.006 (0.042) 0.192 *** (0.048) 0.057 (0.059)Livestock (1 = yes) 0.032 (0.035) 0.099 ** (0.050) 0.044 (0.055)Market integration (1 = yes) 0.135 *** (0.044) 0.017 (0.058) −0.020 (0.062)Owned borewell (1 = yes) 0.064 (0.043) 0.075 (0.070) 0.118 (0.073)Cereals (1 = yes) 0.043 (0.057) 0.203 *** (0.079) 0.086 (0.083)Pulses (1 = yes) 0.142 *** (0.035) 0.027 (0.049) −0.093 * (0.053)Vegetables (1 = yes) 0.084 * (0.049) 0.144 * (0.082) −0.086 (0.085)Fruit (1 = yes) 0.106 ** (0.045) 0.099 (0.076) 0.071 (0.074)Flowers (1 = yes) 0.011 (0.151) 0.014 (0.136)Herbs and spices (1 = yes) −0.134 * (0.077) 0.078 (0.092) −0.129 (0.106)Non-food commercial (1 = yes) 0.046 (0.046) 0.112 (0.071) −0.111 (0.073)Fodder (1 = yes) −0.080 (0.057) 0.123 (0.084) −0.123 (0.084)LocationRural–urban index (SSI) 1 0.162 (0.121) −0.055 (0.165) 0.387 ** (0.175)Northern transect (1 = yes) 0.014 (0.038) 0.090 * (0.055) 0.060 (0.059)
N 362 362 362Pseudo R2 0.214 0.158 0.0939Wald-chi2 69.35 70.07 47.38Log pseudolikelihood −125.2 −195.3 −227.2
Note: Results of probit models. Average marginal effects reported with robust standard errors in parentheses;significance levels reported with * had a p < 0.1, ** had a p < 0.05, and *** had a p < 0.01. HH stands for household.Growing flowers predicted failure of using mulching perfectly; therefore, the variable was dropped from themodel. 1 The SSI takes a value between 0 and 1; 1 stands for most rural and 0 indicates most urban.
For a more differentiated insight into the associations between crop choice and theadoption of soil conservation practices, we estimated probit models with crop choice andsoil conservation practice observations on the plot level (Table A4). The results corre-sponded to the household-level analysis and suggest that the plots on which cereals andpulses were grown had higher likelihoods of being mulched, while cultivating cereals alsoincreased the likelihood of farmers applying minimum tillage on the same plot. Plots onwhich vegetables or fruit were grown had higher probabilities that farmers would applymulching practices, while the relationship was negative when farmers cultivated herbsand spices. On the household level, the degree of urbanity seemed to matter for only theadoption of minimum tillage practices to the extent that farmers who were located in lessurbanized areas were more likely to use minimum tillage. The plot-level results similarlysuggest a positive relationship between rurality and the adoption of mulching practices(Table A4).
5. Discussion5.1. Crop Choice
The adoption of vegetables is more likely when urbanity increases and when farmersare integrated into markets, which suggests that being located in more urbanized areas pro-
Sustainability 2022, 14, 5775 16 of 27
vides farmers with marketing opportunities for vegetable crops, as shown in Patil et al. [15].Compared with rural areas, farmers located closer to the city might cultivate high-valuecrops without reserving some land for subsistence purposes [78]. Furthermore, farmerswith higher socio-economic statuses are often more specialized and commercialized in theirproduction [79]. However, the SSI did not further explain the probability of crop choice.Yet, market integration highly affects preferences for crop choice. On the household level,the probability of growing vegetables, fruits, flowers, and herbs and spices increases in thevicinity of markets, whereas the probability of cultivating cereals decreases. This demon-strates the great importance of local markets for selling high-value crops in Bangalore.Furthermore, the cultivation of pulses, fruits, and vegetables increases the probability ofmulching, and growing vegetables and cereals increases the likelihood that FYM is applied.Hence, most of the crop categories are related to some type of soil conservation practice,except for flowers, fodder, and non-food commercial crops. The negative correlation ofherbs and spices with mulching may be compensated by using a rotation with other cropsthat are mulched. Furthermore, the possible negative effect on SOC of these two cropcategories may be minor because of the low percentage of farmers growing flowers andherbs and spices. Therefore, the diversification of crop choice is the most relevant practicefor SOC sequestration in the tropics [11].
5.2. Irrigation
Growing high-value crops, such as vegetables and fruits that are often sold in mar-kets, is positively associated with irrigation adoption, while irrigation becomes less likelywhen farmers grow staple crops, in line with research by Patil et al. [15]. This suggeststhat irrigation might be a requirement for growing certain high-value crops but mightalso imply that farmers invest more in crops with higher monetary returns. The nega-tive association between off-farm income and irrigation may be related to the proposedidea of increasing the opportunity cost of agricultural investments when other incomeoptions are available [17]. Based on our literature review, this would imply that off-farmincome activities that prevent farmers from having irrigated systems also prevent potentialincreases in SOC stocks from more productive irrigated systems. This may be true forthe majority of crops in which irrigation increases the production of aboveground andbelowground biomass inputs [58] and thus SOC [10], except for turf as its harvest removesall biomass, including roots, with an additional removal of mineral soil, including soilorganic matter. The positive association between cattle (dairy) and irrigation is probablyrelated to a greater involvement of cattle owners in farm activities and to a higher necessityof adopting such irrigation practices due to the household’s reliance on agriculture andcattle for their livelihood. Napier grass, produced for fodder, is usually irrigated, probablyincreasing SOC, although not all dairy farms produce fodder.
Overall, 57% of the households irrigating at least a share of the crops owned borewells,whereas households that did not own borewells might resort to other water sources, suchas surface water. Sewage irrigation is a common practice in Indian agriculture close to orin cities, but its effects on SOC and nutrient cycling may vary depending on the contentsof organic matter and pollutants. For example, in rice–wheat systems in India, sewageirrigation has increased SOC in the long-term [80]. Furthermore, beside the effects onwater quality and irrigated crop type, the irrigation technique may cause soil erosion andthus SOC depletion [58,81,82]. As one third of the fields in India are irrigated [8], thismanagement effect on SOC should be analyzed in future studies.
5.3. Mineral Fertilizer and FYM
In our survey, 98% of the farm households used some type of fertilizer and mostlyboth mineral and FYM or organic fertilizers on their farms. We found that all but 0.8% ofthe farmers who used fertilizer used mineral fertilizer on their farms, which correspondedto findings by Bon et al. [78]. This widespread adoption of fertilizers might be facilitatedby several ‘enabling conditions’ associated with urbanization that spill over to the more
Sustainability 2022, 14, 5775 17 of 27
rural hinterlands of cities [83]. In our sample, the average SSI takes a value of 0.71 (Table 3),which implies that the majority of farmers lived in the more rural hinterlands of the studyarea rather than in the urban neighborhoods at the fringe of the city. However, since themaximum distance of villages to Bangalore was only 50 km in our sample compared tofarmers living in very remote rural areas, the farmers in our sample might have had rela-tively easy access to farm inputs, such as fertilizers. This could be facilitated by the relativeproximity to Bangalore and related access to road, transportation, and market infrastruc-tures. Information and knowledge exchanges (e.g., extension services and mobile phones),as well as other institutional conditions might also enable adoption [83]. Besides proximityto the city of Bangalore, several secondary towns along the two study transects (see themap in Figure A1) might provide access to farm inputs and agricultural markets wherefarmers could also sell their crops [83]. Our results thus differ from studies focusing ontropical low-input small-holder farmers that had less access to mineral fertilizer [46,47,53].Therefore, the accessibility of mineral fertilizer is not restricted in the households of Banga-lore. However, for an analysis on fertilizer’s effects on SOC and the environment, data onthe amounts applied to specific crops would be necessary.
A large percentage of farm households (70%) in Bangalore rear their own cows andtherefore have access to FYM. A cattle-ranching culture is reflected in the relatively largenumber of studies that include FYM as a commonly used fertilizer in India. However, it isimportant to note that even though the percentage of dairy cow owners is high, less thanhalf of the owners use FYM in combination with mineral fertilizer, and very few applyFYM alone. This suggests that many farmers use the manure produced by their cows forpurposes other than their own crop’s cultivation.
Given the significantly positive effect of FYM on SOC stocks in Indian soils revealedin the literature review, it is necessary to address the gender factor in this practice as weobserved that households with female household heads were less likely to implement it inagriculture. Female education and awareness raising in terms of agricultural practices istherefore required to improve SOC on farms managed by women.
5.4. Mulching and Minimum Tillage
Mulching was positively associated with farmers who grew both staple crops (cerealsand pulses) as well as high-value crops (vegetables and fruits), which was shown in researchby Gupta et al. [84]. This probably indicates that some of these crops generate more residuesthat can be used as mulch, e.g., from tree pruning. Furthermore, farmers who do not use plantresidues for purposes such as feeding may be more likely to adopt mulching. However, theprobability that farmers will adopt mulching increases with rurality (plot level) even thoughit is positively related to vegetable cultivation, which is more likely in more urbanized areas(household level), as shown by the negative correlation between the SSI and the likelihoodof vegetable adoption (Table 5). Possibly, one reason that farmers’ probabilities of mulchingincrease with rurality is that farmers in more rural areas have bigger farms where they growcrops (e.g., staple crops) that also provide crop residues.
An interesting observation in our study was that education and a higher numberof adult household members played negative roles in the likelihood of implementingminimum or no tillage. Although minimum or no tillage is considered an effective con-servation practice in terms of SOC accumulation, such practices might be linked to loweryields [50,85]. A higher number of adult household members might imply that more familylabor is available to implement tillage on the farm and therefore decrease the likelihood ofimplementing minimum/no tillage if it might also lead to lower yields. Nevertheless, theprobability of implementing this practice was strongly correlated with the durable assetsowned by the households, which might indicate that better-off households can afford toimplement this conservation practice even at the expense of potentially higher yields.
Our findings indicate a positive correlation between farm size and the likelihood ofadopting minimum tillage as well as a positive relationship between a more rural locationand the probability of minimum tillage use. These findings likely interact as farm size is
Sustainability 2022, 14, 5775 18 of 27
positively correlated with rurality (the Pearson’s correlation coefficient was 0.147, whichsuggests a significant positive correlation between farm size and the SSI (p = 0.005)). Thus,minimum or no tillage is more likely to be used on bigger farms in more rural locations. Inother words, our findings might suggest that smaller farms that are located closer to theurban center are managed more intensively with a lower probability of minimum tillageand mulching on the plot level.
5.5. Limitations and Necessary Research
The survey data indicate the wide usage of fertilizer in the agricultural systems ofBangalore, and our analysis on fertilization practices from published studies in Indiashows their potential to increase SOC. However, the lack of quantitative data on fertilizerapplication rates and crop yields limits the explanatory power of the survey data on SOCdynamics. Mulching is associated with decisions in favor of vegetable–fruit and cerealstaple crops, both groups contrastingly related to market integration. This demonstratesinteractions between crop choice, probability of the adoption of soil conservation practices,and socio-economic variables. Data on the adoption of soil conservation practices forspecific crops would be necessary to disentangle the interactions.
The rural–urban index used for this analysis measured urbanization as a combinationof distance to the Bangalore city center and the percentage of built-up area [75]. However,even when not living in direct proximity to the city of Bangalore with large built-upareas, road infrastructures and transportation networks as well as household wealth andownership of vehicles may determine farmers’ access to markets and, in turn, their decisionsto cultivate certain (perishable) crops, e.g., vegetables. For example, Damania et al. [86] andMinten et al. [87] found that increasing transaction costs and higher costs of transportationare important factors influencing farmers’ technology choices and farming practices inNigeria and Ethiopia. Vandercasteelen et al. [88] measured urban proximity as travel timeand found that an increased travel time affects the decision-making and productivitiesof rural dairy farmers who produce for urban markets. Such alternative indicators forurbanization were not considered in our study but were partly addressed by the factormarket integration, which showed a good explanatory power for crop choice.
6. Conclusions
The present paper showed important relationships between socio-economic variables,crop choice, and the likelihood of adopting soil conservation practices that contribute toimprovements in the SOC pools in Bangalore´s agricultural soils. The cropping of vegeta-bles is increasingly correlated with urbanity, higher market integration, off-farm income,and the ownership of borewells and goes along with intensive management, e.g., theapplication of mineral fertilizer and irrigation, while increasing the probability of farmersadopting conservation practices, such as mulching and the application of farmyard manure.The cultivation of cereals is negatively associated with market integration and irrigationbut positively associated with all measures of soil conservation practices, although it isnot associated with rurality. Our results therefore confirmed Hypotheses 1 and 2 butrejected Hypothesis 3. Considering that 66, 48, and 16% of farms adopt farmyard manureapplications, minimum tillage, and mulching, respectively, there is further potential toincrease these conservation practices in rural–urban Bangalore. Further implementations ofconservation practices will depend on the availability of resources, experience with climaticshocks, and alternative income opportunities. Our data reveal that the role of gender, age,and education in farm households should be addressed in the interest of achieving anincreased application of soil conservation practices. We show that, in general, regardless ofthe degree of urbanity, the socio-economic advantages of farmers in Bangalore generallytranslate into a higher likelihood of improved management practices that will support SOC.Hence, improved farmers’ welfare is a prerequisite for an increased implementation ofsustainable agriculture, thus increasing the currently depleted SOC levels in Bangalore.
Sustainability 2022, 14, 5775 19 of 27
Author Contributions: Conceptualization, C.W. and V.E.M.-R.; data analysis survey, V.P.; dataanalysis literature, V.E.M.-R.; writing—original draft preparation, V.E.M.-R., V.P., and C.W.; writing—review and editing, V.E.M.-R.; supervision, C.W. All authors have read and agreed to the publishedversion of the manuscript.
Funding: This research was funded by the German Research Foundation (DFG), grants number279374797 and WO 1470/3-2 in the framework of the Research Unit FOR2432, ‘Social-EcologicalSystems in the Indian Rural–Urban Interface: Functions, Scales, and Dynamics of Transition’ and bythe Graduate Program BangaDyn: Rural–Urban Dynamics in Bengaluru, funded by the University ofKassel. V.E.M.R. received additional funding in the framework of the DAAD STIBET PhD programfinanced by the Federal Foreign Office. The APC was funded by the University of Kassel.
Institutional Review Board Statement: Ethical approval was obtained from the ethical reviewcommittee of Göttingen University prior to the survey. There were no objections by the committeeconcerning the implementation of the data collection.
Informed Consent Statement: Written informed consent was obtained from all farmers involved inthe study.
Data Availability Statement: The authors can make the interview data available upon request.
Acknowledgments: We thank Meike Wollni for the funding acquisition that made our survey datacollection and analysis possible in the framework of the Research Unit FOR2432, ‘Social-EcologicalSystems in the Indian Rural–Urban Interface: Functions, Scales, and Dynamics of Transition’. Wethank Manuel Santos Silva for his efforts during the survey data collection and thank our FOR2432project partners at the University of Agricultural Sciences, Bangalore, for their support of the datacollection activities. We are thankful to the farmers who contributed to our survey.
Conflicts of Interest: The authors declare no conflict of interest.
Appendix A
Table A1. Tillage practices implemented in agricultural field studies across India and the effects onSOC concentrations in different cropping systems under rainfed and irrigated agriculture.
Cropping System Irrigation ConventionalTillage (CT)
ReducedTillage (RT)
No Tillage(NT)
Significant Effects onSOC for Treatments Reference
Rice–barleyRainy season andbeginning dry season
Rainfed X X X
Aboveground harvestresidues withdrawn:RT > NT > CT;aboveground harvestresidues retained: RT >CT > NT
[89]
Soybean–pigeon pea;soybean–wheat;maize–pigeon pea;maize–gramDry and rainy seasons
Rainfed X X X RT > NT > CT [68]
Maize–okraRainy season andbeginning dry season
Rainfed X X XNT + weed mulching >RT + weed burial > CT+ weed removal
[66]
Sorghum–mung Bean (oneevery year) Rainy season Rainfed X X - No tillage effect [50]
Soybean wheatDry and rainy seasons
Partiallyirrigated X X X NT > RT > CT [67]
Maize–wheat–green gramDry and rainy seasons Irrigated X - X
In macro- andmicro-aggregates NT >CT
[90]
Maize–maize–field peaDry and rainy seasons
Partiallyirrigated X - X NT > CT [91]
Rice–maize–cowpeaDry and rainy seasons Irrigated X X - RT > CT [85]
Rice–RiceDry and rainy seasons Irrigated X X X RT > NT > CT [92]Soybean–wheatDry and rainy seasons Not applied - X X Depth 0–5: NT > RT;
Depth 5–15: RT > NT [93]
X = included tillage treatment; and - = not included in the study.
Sustainability 2022, 14, 5775 20 of 27
Table A2. Fertilization practices, crop types, soils, environmental factors, locations, and study periodsof the individual studies analyzed.
No.ComparedFertilizationPractices
MainCrop
Number ofCrops in aRotation
InitialSOC(g kg−1)
Clay (%) pHAnnualRainfall(mm)
Location(India)
Duration(Years) Reference
1 Min; added minand FYM F. millet 3 N/A 31 8.5 N/A Coimbatore 29 [56]
2 Min; FYM; addedmin and FYM F. millet 1 3.3 N/A 5 666 Bangalore 20 [48]
3 Min; FYM; addedmin and FYM F. millet 2 3.3 N/A 5 666 Bangalore 20 [48]
4Min; FYM;complementarymin and FYM
F. millet 3 4 N/A 5.2 922.7 Bangalore 10 [77]
5 Min F. millet 3 5.5 N/A N/A N/A Bangalore 10 [44]6 Min; FYM; added
min and FYM Maize 2 N/A 60 9 N/A Bellary 23 [56]
7 Min; added minand FYM Maize 2 4.4 14 8.3 650 New
Dehli 44 [94]
8Min;complementarymin and FYM
Maize 2 4 25 7.7 650 NewDehli 4 [95]
9Min;complementarymin and FYM
Maize 2 4.2 N/A 7.5 658 Rajasthan 6 [52]
Min = mineral fertilization; FYM = farmyard manure; complementary min and FYM = mineral fertilization andFYM added up to the total recommended N dose for the specific crop; and added min and FYM = combination oftotal recommended N mineral fertilization with additional FYM.
Sustainability 2022, 14, x FOR PEER REVIEW 23 of 30
Figure A1. Map of the study transects used for the farmers’ household interviews. Source: Own illustration based on survey data.
Figure A1. Map of the study transects used for the farmers’ household interviews. Source: Ownillustration based on survey data.
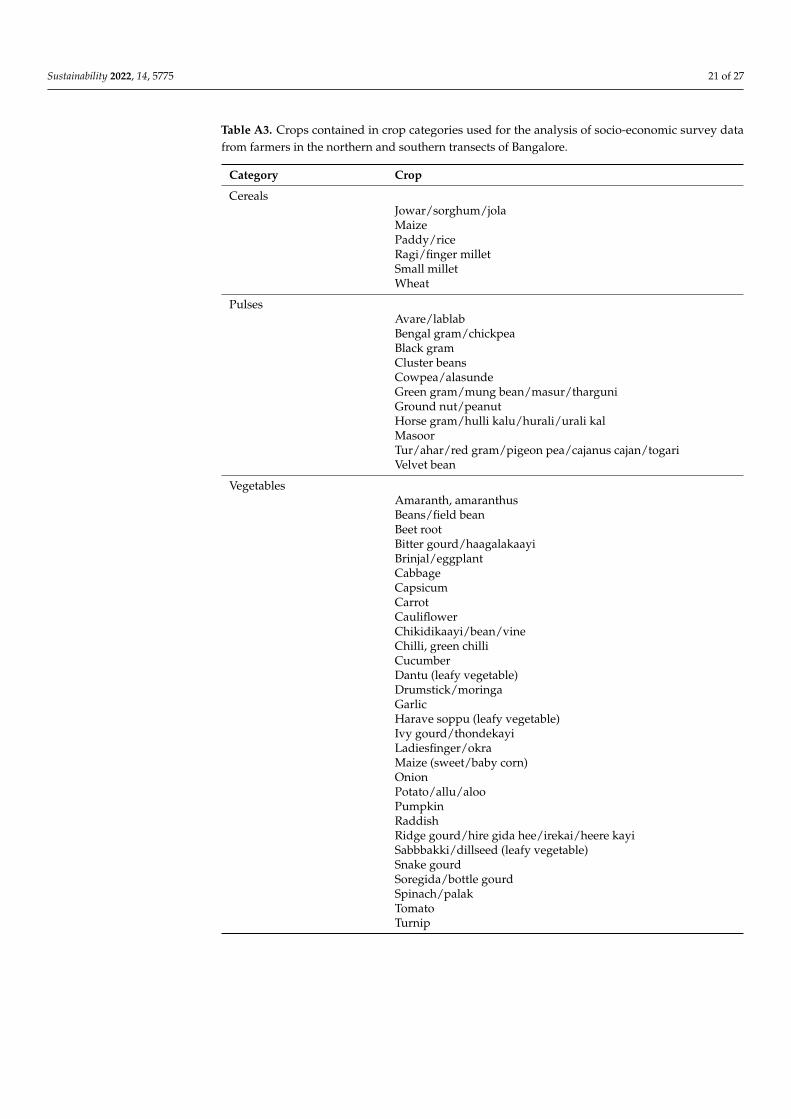
Sustainability 2022, 14, 5775 21 of 27
Table A3. Crops contained in crop categories used for the analysis of socio-economic survey datafrom farmers in the northern and southern transects of Bangalore.
Category Crop
CerealsJowar/sorghum/jolaMaizePaddy/riceRagi/finger milletSmall milletWheat
PulsesAvare/lablabBengal gram/chickpeaBlack gramCluster beansCowpea/alasundeGreen gram/mung bean/masur/tharguniGround nut/peanutHorse gram/hulli kalu/hurali/urali kalMasoorTur/ahar/red gram/pigeon pea/cajanus cajan/togariVelvet bean
VegetablesAmaranth, amaranthusBeans/field beanBeet rootBitter gourd/haagalakaayiBrinjal/eggplantCabbageCapsicumCarrotCauliflowerChikidikaayi/bean/vineChilli, green chilliCucumberDantu (leafy vegetable)Drumstick/moringaGarlicHarave soppu (leafy vegetable)Ivy gourd/thondekayiLadiesfinger/okraMaize (sweet/baby corn)OnionPotato/allu/alooPumpkinRaddishRidge gourd/hire gida hee/irekai/heere kayiSabbbakki/dillseed (leafy vegetable)Snake gourdSoregida/bottle gourdSpinach/palakTomatoTurnip
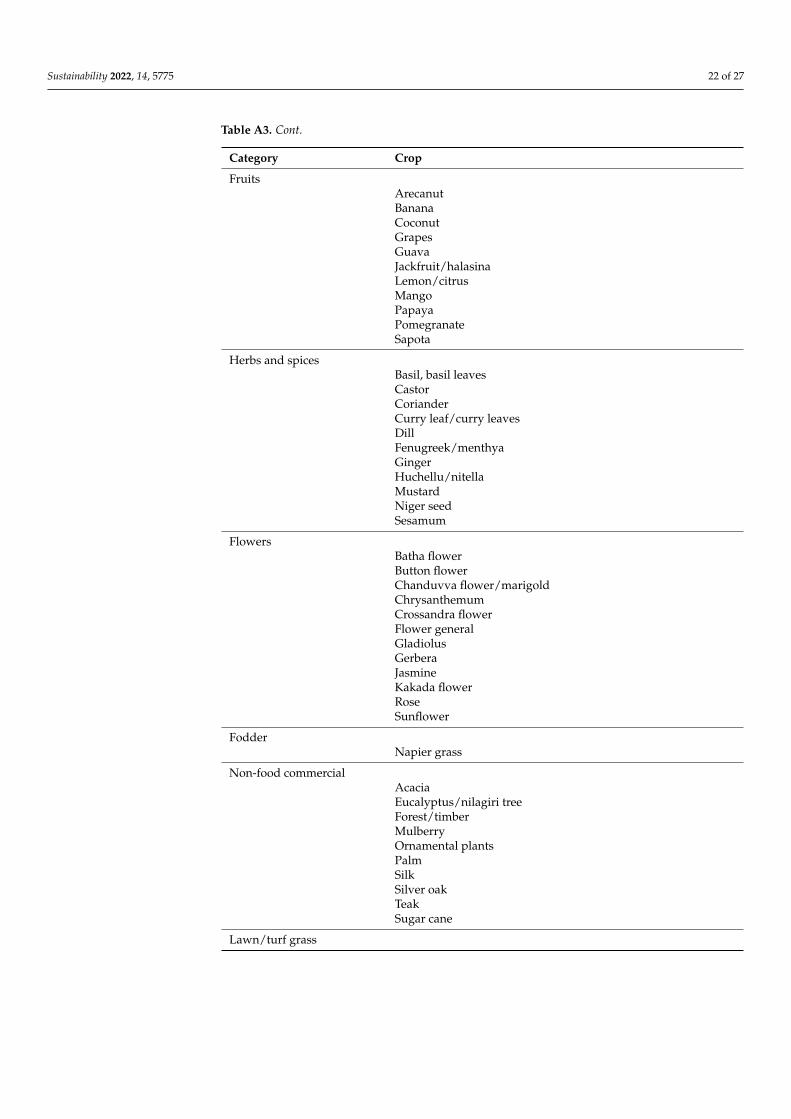
Sustainability 2022, 14, 5775 22 of 27
Table A3. Cont.
Category Crop
FruitsArecanutBananaCoconutGrapesGuavaJackfruit/halasinaLemon/citrusMangoPapayaPomegranateSapota
Herbs and spicesBasil, basil leavesCastorCorianderCurry leaf/curry leavesDillFenugreek/menthyaGingerHuchellu/nitellaMustardNiger seedSesamum
FlowersBatha flowerButton flowerChanduvva flower/marigoldChrysanthemumCrossandra flowerFlower generalGladiolusGerberaJasmineKakada flowerRoseSunflower
FodderNapier grass
Non-food commercialAcaciaEucalyptus/nilagiri treeForest/timberMulberryOrnamental plantsPalmSilkSilver oakTeakSugar cane
Lawn/turf grass
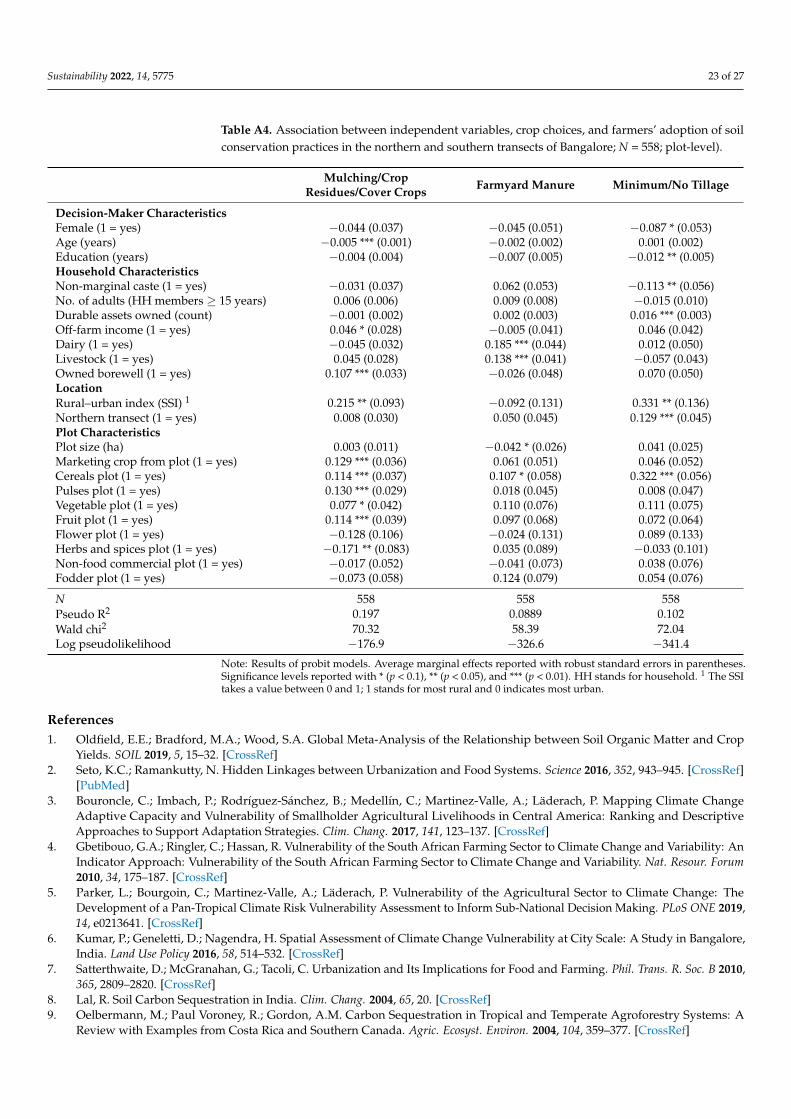
Sustainability 2022, 14, 5775 23 of 27
Table A4. Association between independent variables, crop choices, and farmers’ adoption of soilconservation practices in the northern and southern transects of Bangalore; N = 558; plot-level).
Mulching/CropResidues/Cover Crops Farmyard Manure Minimum/No Tillage
Decision-Maker CharacteristicsFemale (1 = yes) −0.044 (0.037) −0.045 (0.051) −0.087 * (0.053)Age (years) −0.005 *** (0.001) −0.002 (0.002) 0.001 (0.002)Education (years) −0.004 (0.004) −0.007 (0.005) −0.012 ** (0.005)Household CharacteristicsNon-marginal caste (1 = yes) −0.031 (0.037) 0.062 (0.053) −0.113 ** (0.056)No. of adults (HH members ≥ 15 years) 0.006 (0.006) 0.009 (0.008) −0.015 (0.010)Durable assets owned (count) −0.001 (0.002) 0.002 (0.003) 0.016 *** (0.003)Off-farm income (1 = yes) 0.046 * (0.028) −0.005 (0.041) 0.046 (0.042)Dairy (1 = yes) −0.045 (0.032) 0.185 *** (0.044) 0.012 (0.050)Livestock (1 = yes) 0.045 (0.028) 0.138 *** (0.041) −0.057 (0.043)Owned borewell (1 = yes) 0.107 *** (0.033) −0.026 (0.048) 0.070 (0.050)LocationRural–urban index (SSI) 1 0.215 ** (0.093) −0.092 (0.131) 0.331 ** (0.136)Northern transect (1 = yes) 0.008 (0.030) 0.050 (0.045) 0.129 *** (0.045)Plot CharacteristicsPlot size (ha) 0.003 (0.011) −0.042 * (0.026) 0.041 (0.025)Marketing crop from plot (1 = yes) 0.129 *** (0.036) 0.061 (0.051) 0.046 (0.052)Cereals plot (1 = yes) 0.114 *** (0.037) 0.107 * (0.058) 0.322 *** (0.056)Pulses plot (1 = yes) 0.130 *** (0.029) 0.018 (0.045) 0.008 (0.047)Vegetable plot (1 = yes) 0.077 * (0.042) 0.110 (0.076) 0.111 (0.075)Fruit plot (1 = yes) 0.114 *** (0.039) 0.097 (0.068) 0.072 (0.064)Flower plot (1 = yes) −0.128 (0.106) −0.024 (0.131) 0.089 (0.133)Herbs and spices plot (1 = yes) −0.171 ** (0.083) 0.035 (0.089) −0.033 (0.101)Non-food commercial plot (1 = yes) −0.017 (0.052) −0.041 (0.073) 0.038 (0.076)Fodder plot (1 = yes) −0.073 (0.058) 0.124 (0.079) 0.054 (0.076)
N 558 558 558Pseudo R2 0.197 0.0889 0.102Wald chi2 70.32 58.39 72.04Log pseudolikelihood −176.9 −326.6 −341.4
Note: Results of probit models. Average marginal effects reported with robust standard errors in parentheses.Significance levels reported with * (p < 0.1), ** (p < 0.05), and *** (p < 0.01). HH stands for household. 1 The SSItakes a value between 0 and 1; 1 stands for most rural and 0 indicates most urban.
References1. Oldfield, E.E.; Bradford, M.A.; Wood, S.A. Global Meta-Analysis of the Relationship between Soil Organic Matter and Crop
Yields. SOIL 2019, 5, 15–32. [CrossRef]2. Seto, K.C.; Ramankutty, N. Hidden Linkages between Urbanization and Food Systems. Science 2016, 352, 943–945. [CrossRef]
[PubMed]3. Bouroncle, C.; Imbach, P.; Rodríguez-Sánchez, B.; Medellín, C.; Martinez-Valle, A.; Läderach, P. Mapping Climate Change
Adaptive Capacity and Vulnerability of Smallholder Agricultural Livelihoods in Central America: Ranking and DescriptiveApproaches to Support Adaptation Strategies. Clim. Chang. 2017, 141, 123–137. [CrossRef]
4. Gbetibouo, G.A.; Ringler, C.; Hassan, R. Vulnerability of the South African Farming Sector to Climate Change and Variability: AnIndicator Approach: Vulnerability of the South African Farming Sector to Climate Change and Variability. Nat. Resour. Forum2010, 34, 175–187. [CrossRef]
5. Parker, L.; Bourgoin, C.; Martinez-Valle, A.; Läderach, P. Vulnerability of the Agricultural Sector to Climate Change: TheDevelopment of a Pan-Tropical Climate Risk Vulnerability Assessment to Inform Sub-National Decision Making. PLoS ONE 2019,14, e0213641. [CrossRef]
6. Kumar, P.; Geneletti, D.; Nagendra, H. Spatial Assessment of Climate Change Vulnerability at City Scale: A Study in Bangalore,India. Land Use Policy 2016, 58, 514–532. [CrossRef]
7. Satterthwaite, D.; McGranahan, G.; Tacoli, C. Urbanization and Its Implications for Food and Farming. Phil. Trans. R. Soc. B 2010,365, 2809–2820. [CrossRef]
8. Lal, R. Soil Carbon Sequestration in India. Clim. Chang. 2004, 65, 20. [CrossRef]9. Oelbermann, M.; Paul Voroney, R.; Gordon, A.M. Carbon Sequestration in Tropical and Temperate Agroforestry Systems: A
Review with Examples from Costa Rica and Southern Canada. Agric. Ecosyst. Environ. 2004, 104, 359–377. [CrossRef]
Sustainability 2022, 14, 5775 24 of 27
10. Paustian, K.; Lehmann, J.; Ogle, S.; Reay, D.; Robertson, G.P.; Smith, P. Climate-Smart Soils. Nature 2016, 532, 49–57. [CrossRef]11. Fujisaki, K.; Chevallier, T.; Chapuis-Lardy, L.; Albrecht, A.; Razafimbelo, T.; Masse, D.; Ndour, Y.B.; Chotte, J.-L. Soil Carbon Stock
Changes in Tropical Croplands Are Mainly Driven by Carbon Inputs: A Synthesis. Agric. Ecosyst. Environ. 2018, 259, 147–158.[CrossRef]
12. Yadvinder-Singh; Bijay-Singh; Timsina, J. Crop Residue Management for Nutrient Cycling and Improving Soil Productivity inRice-Based Cropping Systems in the Tropics. In Advances in Agronomy; Elsevier: Amsterdam, The Netherlands, 2005; Volume 85,pp. 269–407, ISBN 978-0-12-000783-7.
13. Powlson, D.S.; Whitmore, A.P.; Goulding, K.W.T. Soil Carbon Sequestration to Mitigate Climate Change: A Critical Re-Examination to Identify the True and the False. Eur. J. Soil Sci. 2011, 62, 42–55. [CrossRef]
14. Liu, D.L.; Zeleke, K.T.; Wang, B.; Macadam, I.; Scott, F.; Martin, R.J. Crop Residue Incorporation Can Mitigate Negative ClimateChange Impacts on Crop Yield and Improve Water Use Efficiency in a Semiarid Environment. Eur. J. Agron. 2017, 85, 51–68.[CrossRef]
15. Patil, V.S.; Thomas, B.K.; Lele, S.; Eswar, M.; Srinivasan, V. Adapting or Chasing Water? Crop Choice and Farmers’ Responses toWater Stress in Peri-Urban Bangalore, India: ADAPTING OR CHASING WATER? Irrig. Drain. 2019, 68, 140–151. [CrossRef]
16. Kurgat, B.K.; Ngenoh, E.; Bett, H.K.; Stöber, S.; Mwonga, S.; Lotze-Campen, H.; Rosenstock, T.S. Drivers of SustainableIntensification in Kenyan Rural and Peri-Urban Vegetable Production. Int. J. Agric. Sustain. 2018, 16, 385–398. [CrossRef]
17. Steinhübel, L.; von Cramon-Taubadel, S. Somewhere in between Towns, Markets and Jobs—Agricultural Intensification in theRural–Urban Interface. J. Dev. Stud. 2021, 57, 669–694. [CrossRef]
18. Lee, D.R. Agricultural Sustainability and Technology Adoption: Issues and Policies for Developing Countries. Am. J. Agric. Econ.2005, 87, 1325–1334. [CrossRef]
19. Narayana, M.R. Globalization and Urban Economic Growth: Evidence for Bangalore, India: Debates and Developments. Int. J.Urban Reg. Res. 2011, 35, 1284–1301. [CrossRef]
20. Kraas, F.; Mertins, G. Megacities and Global Change. In Megacities; Kraas, F., Aggarwal, S., Coy, M., Mertins, G., Eds.; SpringerNetherlands: Dordrecht, The Netherlands, 2014; pp. 1–6, ISBN 978-90-481-3416-8.
21. Rao, P.P.; Birthal, P.S.; Joshi, P.K.; Kar, D. Agricultural Diversification towards High-Value Commodities and Role of Urbanisationin India. In Agricultural Diversification and Smallholders in South Asia; Joshi, P.K., Gulati, A., Cummings, R., Jr., Eds.; AcademicFoundation: New Delhi, India, 2007; pp. 243–270.
22. Sudhira, H.S.; Nagendra, H. Local Assessment of Bangalore: Graying and Greening in Bangalore—Impacts of Urbanization onEcosystems, Ecosystem Services and Biodiversity. In Urbanization, Biodiversity and Ecosystem Services: Challenges and Opportunities;Elmqvist, T., Fragkias, M., Goodness, J., Güneralp, B., Marcotullio, P.J., McDonald, R.I., Parnell, S., Schewenius, M., Sendstad, M.,Seto, K.C., et al., Eds.; Springer: Dordrecht, The Netherlands, 2013; pp. 75–91, ISBN 978-94-007-7087-4.
23. Ramachandra, T.V.; Sellers, J.; Bharath, H.A.; Setturu, B. Micro Level Analyses of Environmentally Disastrous Urbanization inBangalore. Environ. Monit Assess 2019, 191, 787. [CrossRef]
24. Obalum, S.E.; Chibuike, G.U.; Peth, S.; Ouyang, Y. Soil Organic Matter as Sole Indicator of Soil Degradation. Environ. Monit Assess2017, 189, 176. [CrossRef]
25. Leff, B.; Ramankutty, N.; Foley, J.A. Geographic Distribution of Major Crops across the World: Global Crop Distribution. Glob.Biogeochem. Cycles 2004, 18, 1–27. [CrossRef]
26. Drechsel, P.; Zimmermann, U. Factors Influencing the Intensification of Farming Systems and Soil-nutrient Management in theRural-urban Continuum of SW Ghana. Z. Pflanzenernähr. Bodenk. 2005, 168, 694–702. [CrossRef]
27. Seneviratne, G.; Van Holm, L.H.J.; Kulasooriya, S.A. Quality of Different Mulch Materials and Their Decomposition and NRelease under Low Moisture Regimes. Biol. Fertil. Soils 1997, 26, 136–140. [CrossRef]
28. Palm, C.A.; Gachengo, C.N.; Delve, R.J.; Cadisch, G.; Giller, K.E. Organic Inputs for Soil Fertility Management in TropicalAgroecosystems: Application of an Organic Resource Database. Agric. Ecosyst. Environ. 2001, 83, 27–42. [CrossRef]
29. Fontaine, S.; Barot, S.; Barré, P.; Bdioui, N.; Mary, B.; Rumpel, C. Stability of Organic Carbon in Deep Soil Layers Controlled byFresh Carbon Supply. Nature 2007, 450, 277–280. [CrossRef]
30. Moran-Rodas, V.E.; Chavannavar, S.V.; Joergensen, R.G.; Wachendorf, C. Microbial Response of Distinct Soil Types to Land-UseIntensification at a South-Indian Rural-Urban Interface. Plant Soil 2022, 473, 389–405. [CrossRef]
31. Liang, C.; Schimel, J.P.; Jastrow, J.D. The Importance of Anabolism in Microbial Control over Soil Carbon Storage. Nat. Microbiol.2017, 2, 17105. [CrossRef]
32. Bardgett, R.D.; Mommer, L.; De Vries, F.T. Going Underground: Root Traits as Drivers of Ecosystem Processes. Trends Ecol. Evol.2014, 29, 692–699. [CrossRef]
33. Manjaiah, K.M.; Voroney, R.P.; Sen, U. Soil Organic Carbon Stocks, Storage Profile and Microbial Biomass under Different CropManagement Systems in a Tropical Agricultural Ecosystem. Biol. Fertil. Soils 2000, 32, 273–278. [CrossRef]
34. Mapa, R.B.; Gunasena, H.P.M. Effect of Alley Cropping on Soil Aggregate Stability of a Tropical Alfisol. Agrofor. Syst. 1995, 32,237–245. [CrossRef]
35. Tian, G.; Kang, B.T.; Kolawole, G.O.; Idinoba, P.; Salako, F.K. Long-Term Effects of Fallow Systems and Lengths on CropProduction and Soil Fertility Maintenance in West Africa. Nutr. Cycl. Agroecosyst. 2005, 71, 139–150. [CrossRef]
36. Follain, S.; Walter, C.; Legout, A.; Lemercier, B.; Dutin, G. Induced Effects of Hedgerow Networks on Soil Organic Carbon Storagewithin an Agricultural Landscape. Geoderma 2007, 142, 80–95. [CrossRef]
Sustainability 2022, 14, 5775 25 of 27
37. Radrizzani, A.; Shelton, H.M.; Dalzell, S.A.; Kirchhof, G. Soil Organic Carbon and Total Nitrogen under Leucaena LeucocephalaPastures in Queensland. Crop Pasture Sci. 2011, 62, 337. [CrossRef]
38. Nath, A.J.; Brahma, B.; Sileshi, G.W.; Das, A.K. Impact of Land Use Changes on the Storage of Soil Organic Carbon in Active andRecalcitrant Pools in a Humid Tropical Region of India. Sci. Total Environ. 2018, 624, 908–917. [CrossRef] [PubMed]
39. Chaudhary, R.S.; Somasundaram, J.; Mandal, K.G.; Hati, K.M. Enhancing Water and Phosphorus Use Efficiency Through MoistureConservation Practices and Optimum Phosphorus Application in Rainfed Maize–Chickpea System in Vertisols of Central India.Agric. Res. 2018, 7, 176–186. [CrossRef]
40. Srinivasarao, C.; Lal, R.; Kundu, S.; Babu, M.B.B.P.; Venkateswarlu, B.; Singh, A.K. Soil Carbon Sequestration in RainfedProduction Systems in the Semiarid Tropics of India. Sci. Total Environ. 2014, 487, 587–603. [CrossRef]
41. Seneviratne, G. Litter Quality and Nitrogen Release in Tropical Agriculture: A Synthesis. Biol. Fertil. Soils 2000, 31, 60–64.[CrossRef]
42. Bhardwaj, R.L. Effect of Mulching on Crop Production under Rainfed Condition—A Review. Agri. Rev. 2013, 34, 188. [CrossRef]43. Lal, R. Managing Soil Water to Improve Rainfed Agriculture in India. J. Sustain. Agric. 2008, 32, 51–75. [CrossRef]44. Manna, M.C.; Ghosh, P.K.; Acharya, C.L. Sustainable Crop Production Through Management of Soil Organic Carbon in Semiarid
and Tropical India. J. Sustain. Agric. 2003, 21, 85–114. [CrossRef]45. Prasad, C.S.; Anandan, S.; Gowda, N.K.S.; Schlecht, E.; Buerkert, A. Managing Nutrient Flows in Indian Urban and Peri-Urban
Livestock Systems. Nutr. Cycl. Agroecosyst. 2019, 115, 159–172. [CrossRef]46. Thilakarathna, M.; Raizada, M. A Review of Nutrient Management Studies Involving Finger Millet in the Semi-Arid Tropics of
Asia and Africa. Agronomy 2015, 5, 262–290. [CrossRef]47. Agegnehu, G.; Amede, T. Integrated Soil Fertility and Plant Nutrient Management in Tropical Agro-Ecosystems: A Review.
Pedosphere 2017, 27, 662–680. [CrossRef]48. Sathish, A.; Ramachandrappa, B.K.; Shankar, M.A.; Srikanth Babu, P.N.; Srinivasarao, C.; Sharma, K.L. Long-Term Effects of
Organic Manure and Manufactured Fertilizer Additions on Soil Quality and Sustainable Productivity of Finger Millet under aFinger Millet-Groundnut Cropping System in Southern India. Soil Use Manag. 2016, 32, 311–321. [CrossRef]
49. Anand, K.G.V.; Kubavat, D.; Trivedi, K.; Agarwal, P.K.; Wheeler, C.; Ghosh, A. Long-Term Application of Jatropha Press CakePromotes Seed Yield by Enhanced Soil Organic Carbon Accumulation, Microbial Biomass and Enzymatic Activities in Soils ofSemi-Arid Tropical Wastelands. Eur. J. Soil Biol. 2015, 69, 57–65. [CrossRef]
50. Sharma, K.L.; Grace, J.K.; Srinivas, K.; Venkateswarlu, B.; Korwar, G.R.; Sankar, G.M.; Mandal, U.K.; Ramesh, V.; Bindu, V.H.;Madhavi, M.; et al. Influence of Tillage and Nutrient Sources on Yield Sustainability and Soil Quality under Sorghum–MungBean System in Rainfed Semi-arid Tropics. Commun. Soil Sci. Plant Anal. 2009, 40, 2579–2602. [CrossRef]
51. Nayak, P.; Patel, D.; Ramakrishnan, B.; Mishra, A.K.; Samantaray, R.N. Long-Term Application Effects of Chemical Fertilizer andCompost on Soil Carbon under Intensive Rice–Rice Cultivation. Nutr. Cycl. Agroecosyst. 2009, 83, 259–269. [CrossRef]
52. Srinivasarao, C.; Kundu, S.; Kumpawat, B.S.; Kothari, A.K.; Sodani, S.N.; Sharma, S.K.; Abrol, V.; Ravindra Chary, G.; Thakur, P.B.;Yashavanth, B.S. Soil Organic Carbon Dynamics and Crop Yields of Maize (Zea Mays)–Black Gram (Vigna Mungo) Rotation-BasedLong Term Manurial Experimental System in Semi-Arid Vertisols of Western India. Trop. Ecol. 2019, 60, 433–446. [CrossRef]
53. Chianu, J.N.; Chianu, J.N.; Mairura, F. Mineral Fertilizers in the Farming Systems of Sub-Saharan Africa. A Review. Agron.Sustain. Dev. 2012, 32, 545–566. [CrossRef]
54. Banger, K.; Toor, G.S.; Biswas, A.; Sidhu, S.S.; Sudhir, K. Soil Organic Carbon Fractions after 16-Years of Applications of Fertilizersand Organic Manure in a Typic Rhodalfs in Semi-Arid Tropics. Nutr. Cycl. Agroecosyst. 2010, 86, 391–399. [CrossRef]
55. Yagi, R.; Ferreira, M.E.; da Cruz, M.C.P.; Barbosa, J.C.; Araújo, L.A.N. de Soil Organic Matter as a Function of Nitrogen Fertilizationin Crop Successions. Sci. Agric. 2005, 62, 374–380. [CrossRef]
56. Vineela, C.; Wani, S.P.; Srinivasarao, C.; Padmaja, B.; Vittal, K.P.R. Microbial Properties of Soils as Affected by Cropping andNutrient Management Practices in Several Long-Term Manurial Experiments in the Semi-Arid Tropics of India. Appl. Soil Ecol.2008, 40, 165–173. [CrossRef]
57. Tian, H.; Lu, C.; Melillo, J.; Ren, W.; Huang, Y.; Xu, X.; Liu, M.; Zhang, C.; Chen, G.; Pan, S.; et al. Food Benefit and ClimateWarming Potential of Nitrogen Fertilizer Uses in China. Environ. Res. Lett. 2012, 7, 44020. [CrossRef]
58. Sojka, R.E.; Bjorneberg, D.L.; Strelkoff, T.S. Irrigation-Induced Erosion. In Agronomy Monographs; Lascano, R.J., Sojka, R.E., Eds.;American Society of Agronomy; Crop Science Society of America; Soil Science Society of America: Madison, WI, USA, 2007;pp. 237–275, ISBN 978-0-89118-264-1.
59. Environmental Management & Policy Research Institute. State of Environment Report Karnataka. 2015. Available online:https://karunadu.karnataka.gov.in/forestsecretariat/Downloads/SoER_2015.pdf (accessed on 8 January 2021).
60. Patil, S.L.; Sheelavantar, M.N. Effect of Cultural Practices on Soil Properties, Moisture Conservation and Grain Yield of WinterSorghum (Sorghum Bicolar L. Moench) in Semi-Arid Tropics of India. Agric. Water Manag. 2004, 64, 49–67. [CrossRef]
61. Patil, S. Urbanisation and New Agroecologies. Econ. Political Wkly. 2018, 53, 71–77.62. Kulkarni, T.; Gassmann, M.; Kulkarni, C.M.; Khed, V.; Buerkert, A. Deep Drilling for Groundwater in Bengaluru, India: A Case
Study on the City’s Over-Exploited Hard-Rock Aquifer System. Sustainability 2021, 13, 12149. [CrossRef]63. Ghimire, R.; Lamichhane, S.; Acharya, B.S.; Bista, P.; Sainju, U.M. Tillage, Crop Residue, and Nutrient Management Effects on Soil
Organic Carbon in Rice-Based Cropping Systems: A Review. J. Integr. Agric. 2017, 16, 1–15. [CrossRef]
Sustainability 2022, 14, 5775 26 of 27
64. Conservation Technology Information Center (CTIC). Tillage Type Definitions. 2002. Available online: https://www.mssoy.org/uploads/files/ctic.pdf (accessed on 1 March 2022).
65. Mehra, P.; Baker, J.; Sojka, R.E.; Bolan, N.; Desbiolles, J.; Kirkham, M.B.; Ross, C.; Gupta, R. A Review of Tillage Practices andTheir Potential to Impact the Soil Carbon Dynamics. In Advances in Agronomy; Elsevier: Amsterdam, The Netherlands, 2018;Volume 150, pp. 185–230, ISBN 978-0-12-815175-4.
66. Pandey, C.B.; Chaudhari, S.K.; Dagar, J.C.; Singh, G.B.; Singh, R.K. Soil N Mineralization and Microbial Biomass Carbon Affectedby Different Tillage Levels in a Hot Humid Tropic. Soil Tillage Res. 2010, 110, 33–41. [CrossRef]
67. Kushwa, V.; Hati, K.M.; Sinha, N.K.; Singh, R.K.; Mohanty, M.; Somasundaram, J.; Jain, R.C.; Chaudhary, R.S.; Biswas, A.K.;Patra, A.K. Long-Term Conservation Tillage Effect on Soil Organic Carbon and Available Phosphorous Content in Vertisols ofCentral India. Agric. Res. 2016, 5, 353–361. [CrossRef]
68. Kumar, A.; Mishra, V.N.; Biswas, A.K.; Somasundaram, J. Soil Organic Carbon, Dehydrogenase Activity and Fluorescein Diacetateas Influenced by Contrasting Tillage and Cropping Systems in Vertisols of Central India. JEB 2018, 39, 1047–1053. [CrossRef]
69. R Core Team. R: A Language and Environment for Statistical Computing; R Foundation for Statistical Computing: Vienna, Austria,2019. Available online: https://www.R-project.org (accessed on 2 March 2022).
70. Directorate of Census Operations Karnataka. District Census Handbook Bangalore. District Census Handbook Bangalore. Villageand Town Directory. (Series 30 PART XII-A). Government of India 2011a. Available online: https://censusindia.gov.in/2011census/dchb/2918_PART_A_DCHB_BANGALORE.pdf (accessed on 6 January 2021).
71. Population Stat. Bangalore, India Population. Available online: https://populationstat.com/india/bangalore (accessed on9 September 2021).
72. Sudhira, H.S.; Ramachandra, T.V.; Subrahmanya, M.H.B. Bangalore. Cities 2007, 24, 379–390. [CrossRef]73. Directorate of Census Operations Karnataka. District Census Handbook Bangalore Rural. Village and Town Directory (Series-30
Part XII-A). Government of India. 2011. Available online: https://censusindia.gov.in/2011census/dchb/2929_PART_A_DCHB_BANGALORE%20RURAL.pdf (accessed on 6 January 2021).
74. Directorate of Census Operations Karnataka. District Census Handbook Ramanagara. Village and Town Directory (Series-30Part XII-A). Government of India. 2011. Available online: https://censusindia.gov.in/2011census/dchb/2930_PART_A_DCHB_RAMANAGARA.pdf (accessed on 6 January 2021).
75. Hoffmann, E.; Jose, M.; Nölke, N.; Möckel, T. Construction and Use of a Simple Index of Urbanisation in the Rural–UrbanInterface of Bangalore, India. Sustainability 2017, 9, 2146. [CrossRef]
76. Wooldridge, J.M. Econometric Analysis of Cross Section and Panel Data; MIT Press: Cambridge, MA, USA, 2010; ISBN 0-262-29679-9.77. Prasad, J.V.N.S.; Rao, C.S.; Srinivas, K.; Jyothi, C.N.; Venkateswarlu, B.; Ramachandrappa, B.K.; Dhanapal, G.N.; Ravichandra, K.;
Mishra, P.K. Effect of Ten Years of Reduced Tillage and Recycling of Organic Matter on Crop Yields, Soil Organic Carbon and ItsFractions in Alfisols of Semi Arid Tropics of Southern India. Soil Tillage Res. 2016, 156, 131–139. [CrossRef]
78. Bon, H.; Parrot, L.; Moustier, P. Sustainable Urban Agriculture in Developing Countries. A Review. Agron. Sustain. Dev. 2010,30, 21–32. [CrossRef]
79. Pingali, P. Westernization of Asian Diets and the Transformation of Food Systems: Implications for Research and Policy. FoodPolicy 2007, 32, 281–298. [CrossRef]
80. Masto, R.E.; Chhonkar, P.K.; Singh, D.; Patra, A.K. Changes in Soil Quality Indicators under Long-Term Sewage Irrigation in aSub-Tropical Environment. Environ. Geol. 2009, 56, 1237–1243. [CrossRef]
81. Koluvek, P.K.; Tanji, K.K.; Trout, T.J. Overview of Soil Erosion from Irrigation. J. Irrig. Drain. Eng. 1993, 119, 929–946. [CrossRef]82. Fernandez-Gomez, R.; Mateos, L.; Giraldez, J.V. Furrow Irrigation Erosion and Management. Irrig. Sci. 2004, 23, 123–131.
[CrossRef]83. de Bruin, S.; Dengerink, J.; van Vliet, J. Urbanisation as Driver of Food System Transformation and Opportunities for Rural
Livelihoods. Food Sec. 2021, 13, 781–798. [CrossRef]84. Pradhan, S.; Niti, G.; Jain, A.; Patel, N. Sustainable Agriculture in India 2021: What We Know and How to Scale up; Council on Energy,
Environment and Water: New Delhi, India, 2021.85. Neogi, S.; Bhattacharyya, P.; Roy, K.S.; Panda, B.B.; Nayak, A.K.; Rao, K.S.; Manna, M.C. Soil Respiration, Labile Carbon Pools,
and Enzyme Activities as Affected by Tillage Practices in a Tropical Rice–Maize–Cowpea Cropping System. Environ. Monit.Assess. 2014, 186, 4223–4236. [CrossRef]
86. Damania, R.; Berg, C.; Russ, J.; Federico Barra, A.; Nash, J.; Ali, R. Agricultural Technology Choice and Transport. Am. J. Agric.Econ. 2017, 99, 265–284. [CrossRef]
87. Minten, B.; Koru, B.; Stifel, D. The Last Mile(s) in Modern Input Distribution: Pricing, Profitability, and Adoption. Agric. Econ.2013, 44, 629–646. [CrossRef]
88. Vandercasteelen, J.; Minten, B.; Tamru, S. Urban Proximity, Access to Value Chains, and Dairy Productivity in Ethiopia. Agric.Econ. 2021, 52, 665–678. [CrossRef]
89. Kushwaha, C.P.; Tripathi, S.K.; Singh, K.P. Soil Organic Matter and Water-Stable Aggregates under Different Tillage and ResidueConditions in a Tropical Dryland Agroecosystem. Appl. Soil Ecol. 2001, 16, 229–241. [CrossRef]
90. Modak, K.; Biswas, D.R.; Ghosh, A.; Pramanik, P.; Das, T.K.; Das, S.; Kumar, S.; Krishnan, P.; Bhattacharyya, R. Zero Tillage andResidue Retention Impact on Soil Aggregation and Carbon Stabilization within Aggregates in Subtropical India. Soil Tillage Res.2020, 202, 104649. [CrossRef]

Sustainability 2022, 14, 5775 27 of 27
91. Yadav, G.S.; Das, A.; Babu, S.; Mohapatra, K.P.; Lal, R.; Rajkhowa, D. Potential of Conservation Tillage and Altered LandConfiguration to Improve Soil Properties, Carbon Sequestration and Productivity of Maize Based Cropping System in EasternHimalayas, India. Int. Soil Water Conserv. Res. 2021, 9, 279–290. [CrossRef]
92. Yadav, G.; Datta, R.; Imran Pathan, S.; Lal, R.; Meena, R.; Babu, S.; Das, A.; Bhowmik, S.; Datta, M.; Saha, P.; et al. Effects ofConservation Tillage and Nutrient Management Practices on Soil Fertility and Productivity of Rice (Oryza Sativa L.)–Rice Systemin North Eastern Region of India. Sustainability 2017, 9, 1816. [CrossRef]
93. Lenka, S.; Lenka, N.K.; Singh, R.C.; Manna, M.C.; Misra, A.K.; Rautaray, S.K. Tillage and Manure Induced Changes in CarbonStorage and Carbon Management Index in Soybean–Wheat Cropping System in the Vertisols of Central India. Natl. Acad. Sci.Lett. 2015, 38, 461–464. [CrossRef]
94. Ghosh, A.; Bhattacharyya, R.; Meena, M.C.; Dwivedi, B.S.; Singh, G.; Agnihotri, R.; Sharma, C. Long-Term Fertilization Effects onSoil Organic Carbon Sequestration in an Inceptisol. Soil Tillage Res. 2018, 177, 134–144. [CrossRef]
95. Verma, B.C.; Datta, S.P.; Rattan, R.K.; Singh, A.K. Monitoring Changes in Soil Organic Carbon Pools, Nitrogen, Phosphorus, andSulfur under Different Agricultural Management Practices in the Tropics. Environ. Monit. Assess. 2010, 171, 579–593. [CrossRef]
Related Documents