TERMS OF USE Agricultural Foreign Trade Development: Annual Report is a publication of the Bureau of Agricultural Statistics (BAS), Department of Agriculture. The BAS reserves exclusive right to reproduce this publication in whatever form. Should any portion of this publication be included in a report/article, the title of the publication and the BAS should be cited as the source of the data. The BAS will not be responsible for any information derived from the processing of data contained in this publication. ISSN-2012-0370 Please direct technical inquiries to the Office of the Director Bureau of Agricultural Statistics Ben-Lor Building, 1184 Quezon Avenue Quezon City 1100, Philippines. Email: [email protected] Website: www.bas.gov.ph

Welcome message from author
This document is posted to help you gain knowledge. Please leave a comment to let me know what you think about it! Share it to your friends and learn new things together.
Transcript

AGRICULTURAL FOREIGN TRADE DEVELOPMENT
2 0 0 7 A N N U A L
Figure 32 WORLD PRICES OF MAIZE
JANUARY - DECEMBER 2006-2007
0.090
0.110
0.130
0.150
0.170
0.190
M o nth
20062007
Figure 31WORLD PRICES OF RICE (35% broken)
JANUARY - DECEMBER 2006-2007
0.255
0.275
0.295
0.315
0.335
0.355
M o nth
20062007
Figure 35WORLD PRICES OF COFFEE, ARABICA
JANUARY - DECEMBER 2006-2007
2.15
2.35
2.55
2.75
2.95
M o nth
20062007
Figure 36WORLD PRICES OF COFFEE, ROBUSTA
JANUARY - DECEMBER 2006-2007
1.20
1.40
1.60
1.80
2.00
M o nth
20062007
Figure 35WORLD PRICES OF BANANA
JANUARY - DECEMBER 2006-2007
0.45
0.55
0.65
0.75
0.85
0.95
M o nth
2006
2007
Figure 36WORLD PRICES OF RUBBER
JANUARY - DECEMBER 2006-2007
1.80
2.10
2.40
2.70
3.00
M o nth
2006
2007
TERMS OF USE Agricultural Foreign Trade Development: Annual Report is a publication of the Bureau of Agricultural Statistics (BAS), Department of Agriculture. The BAS reserves exclusive right to reproduce this publication in whatever form. Should any portion of this publication be included in a report/article, the title of the publication and the BAS should be cited as the source of the data. The BAS will not be responsible for any information derived from the processing of data contained in this publication.
ISSN-2012-0370
Please direct technical inquiries to the Office of the Director Bureau of Agricultural Statistics
Ben-Lor Building, 1184 Quezon Avenue Quezon City 1100, Philippines.
Email: [email protected]
Website: www.bas.gov.ph
53

AGRICULTURAL FOREIGN TRADE DEVELOPMENT
2 0 0 7 A N N U A L
i 52
FOREWORD
This is the 19th edition of the Agricultural Foreign Trade Development Report which is an annual publication of the Bureau of Agricultural Statistics (BAS). This edition presents statistics on the country’s agricultural trade performance in fiscal year 2007. The first part of this report contains the explanatory notes that describe the summary tables on Philippine agricultural trade. The next part presents the overall agricultural trade situation, trade with the country’s trading partners and consolidated tables on the volume and value of top ten agricultural exports and imports. The last part highlights the world prices of selected commodities.
This report is based on the 2004 Philippine Standard Commodity
Classification (PSCC) Code which defines products using 10-digit codes as compared with the 7-digit of the 1999 PSCC Code. For comparability of data, the formats established in the previous issues are maintained.
The agricultural trade statistics were provided by the National
Statistics Office (NSO) while the world price statistics were obtained from Bangko Sentral ng Pilipinas (BSP) and the World Bank.
To help us improve the BAS’ information support service to the client
and stakeholders in the agriculture sector, comments and suggestions from our readers will be greatly appreciated.
ROMEO S. RECIDE Director
Figure 25 WORLD PRICES OF COCONUT OIL JANUARY - DECEMBER 2006-2007
0.50
0.60
0.70
0.80
0.90
1.00
1.10
1.20
M o nth
20062007
Figure 29WORLD PRICES OF RICE (5% broken)
JANUARY - DECEMBER 2006-2007
0.280
0.290
0.300
0.310
0.320
0.330
0.340
0.350
0.360
0.370
M o nth
20062007
Figure 26 WORLD PRICES OF COPRA
JANUARY - DECEMBER 2006-2007
0.30
0.40
0.50
0.60
0.70
0.80
M o nth
20062007
Figure 27 WORLD PRICES OF SUGAR
JANUARY - DECEMBER 2006-2007
0.17
0.20
0.23
0.26
0.29
0.32
0.35
0.38
0.41
M o nth
20062007
Figure 30WORLD PRICES OF RICE (25% broken)
JANUARY - DECEMBER 2006-2007
0.260
0.270
0.280
0.290
0.300
0.310
0.320
0.330
0.340
0.350
M o nth
20062007
Figure 28WORLD PRICES OF SOYBEAN
JANUARY - DECEMBER 2006-2007
0.20
0.25
0.30
0.35
0.40
0.45
0.50
0.55
M o nth
20062007

AGRICULTURAL FOREIGN TRADE DEVELOPMENT
2 0 0 7 A N N U A L
iii 50
TABLE OF CONTENTS
Page
FOREWORD ……………………………………………………………………. i LIST OF TABLES ………………………………………………………………. iv LIST OF FIGURES ……………………………………………………………... vi HIGHLIGHTS ……………………………………………………………………. 1 STATISTICAL TABLES
OVERALL AGRICULTURAL TRADE ………………………………….… 9 EXPORTS …………………………………………………………………… 13 IMPORTS …………………………………………………………………… 22 TRADE WITH MAJOR TRADING PARTNERS ………………………… 30 WORLD PRICES …………………………………………………………... 49
2006
2007
2006
2007
2006
2007
Janu
ary
0.29
1
0.31
37.
450.
266
0.
287
7.62
0.26
3
0.27
96.
440.
103
0.
165
60.4
4Fe
brua
ry0.
302
0.
315
4.48
0.27
5
0.29
26.
090.
272
0.
285
4.95
0.10
7
0.17
765
.59
Mar
ch0.
304
0.
319
5.00
0.27
5
0.29
99.
050.
272
0.
293
7.48
0.10
5
0.17
161
.92
April
0.30
2
0.31
74.
700.
272
0.
296
9.02
0.27
0
0.29
17.
670.
108
0.
153
41.8
3M
ay0.
308
0.
318
3.12
0.27
6
0.29
67.
170.
273
0.
283
3.66
0.11
1
0.16
044
.87
June
0.31
3
0.32
33.
440.
281
0.
301
7.13
0.27
6
0.29
36.
160.
109
0.
165
51.0
5Ju
ly0.
316
0.
329
4.22
0.28
7
0.30
76.
970.
279
0.
297
6.50
0.11
4
0.14
728
.81
Augu
st0.
313
0.
328
4.73
0.28
4
0.30
77.
810.
278
0.
298
7.13
0.11
7
0.15
129
.65
Sept
embe
r0.
309
0.
325
5.11
0.28
3
0.30
68.
290.
276
0.
300
8.70
0.12
2
0.16
434
.83
Oct
ober
0.30
1
0.32
99.
370.
275
0.
313
14.0
50.
269
0.
311
15.6
80.
142
0.
164
15.4
5N
ovem
ber
0.29
6
0.34
215
.42
0.27
3
0.32
819
.92
0.26
4
0.32
623
.58
0.16
5
0.17
14.
10D
ecem
ber
0.30
4
0.36
118
.76
0.27
9
0.34
724
.63
0.27
3
0.34
627
.00
0.16
0
0.18
012
.38
Coc
onut
Oil
- (P
hilip
pine
s/In
done
sia)
, bul
k, c
.I.f R
otte
rdam
Cop
ra -
(Phi
lippi
nes/
Indo
nesi
a), b
ulk,
c.I.
f N.W
. Eur
ope
Suga
r-Int
erna
tiona
l Sug
ar A
gree
men
t (IS
A) F
OB
Car
ibbe
an P
ort.
Soyb
eans
(US)
, c.i.
f. R
otte
rdam
Ric
e (T
hai)
5% b
roke
n, w
hite
rice
(WR
), M
illed
, ind
icat
ive
pric
e ba
sed
on w
eekl
y su
rvey
s of
exp
ort t
rans
actio
ns,
gov
ernm
ent s
tand
ard,
f.o.
b. B
angk
okR
ice
(Tha
i) 25
% b
roke
n, W
R, m
illed,
indi
cativ
e su
rvey
pric
e, g
over
nmen
t sta
ndar
ds, f
.o.b
. Ban
gkok
Ric
e (T
hai)
35%
bro
ken,
WR
, mille
d, f.
o.b.
Ban
gkok
Mai
ze (U
S),
No.
2, y
ello
w, f
.o.b
. US
Gul
f Por
tsC
offe
e In
tern
atio
nal C
offe
e O
rgan
izat
ion
indi
cato
r pric
e, o
ther
mild
Ara
bica
s, a
vera
ge N
ew Y
ork
and
Bre
men
/Ham
burg
mar
kets
, ex-
dock
Cof
fee
Inte
rnat
iona
l Cof
fee
Org
aniz
atio
n in
dica
tor p
rice,
Rob
usta
s, a
vera
ge N
ew Y
ork
and
Le H
avre
/Mar
seill
es m
arke
ts, e
x-do
ckB
anan
a (C
entra
l and
Sou
th A
mer
ican
), m
ajor
bra
nds,
US
impo
rt pr
ice,
free
on tr
uck
US
Gol
f por
tsR
ubbe
r (an
y or
igin
), R
SS n
o. 1
, in
bale
s, R
ubbe
r Tra
ders
Ass
ocia
tion,
spo
t, N
ew Y
ork
Tabl
e 11
. (C
ontin
ued)
Gro
wth
R
ate
Year
/Mon
thG
row
th
Rat
e G
row
th
Rat
e
Ric
eG
row
th
Rat
e
Mai
ze (c
orn)
2007
5% B
roke
n20
0625
% B
roke
n35
% B
roke
n

AGRICULTURAL FOREIGN TRADE DEVELOPMENT
2 0 0 7 A N N U A L
Table No. Pages
1 SUMMARY OF PHILIPPINE AGRICULTURAL TRADE, 2006-2005 …… 9
1a PHILIPPINE AGRICULTURAL TRADE, BY QUARTER, 2006-2005 …… 10
2 AGRICULTURAL TRADE BALANCES WITH MAJOR TRADING PARTNERS OF THE PHILIPPINES, 2006 VS 2005 …………………… 12
3 QUANTITY AND VALUE OF PHILIPPINE AGRICULTURAL EXPORTSBY COMMODITY GROUP 2006-2005 …………………………………… 13
4 TOP TEN PHILIPPINE AGRICULTURAL EXPORTS, 2006 AND 2005 … 16
4a VALUE OF TOP TEN AGRICULTURAL EXPORTS, BY QUARTER 2006 & 2005 ………………………………………………… 17
5 MAJOR MARKETS OF TOP TEN PHILIPPINE AGRICULTURAL EXPORTS, 2006 ……………………………………… 20
6 QUANTITY AND VALUE OF PHILIPPINE AGRICULTURAL IMPORTSBY COMMODITY GROUP 2006 AND 2005 ……………………………… 22
7 TOP TEN AGRICULTURAL IMPORTS, 2006 AND 2005 ………………… 24
7a VALUE OF TOP TEN AGRICULTURAL IMPORTS, BY QUARTER 2006 AND 2005 …………………………………………… 25
8 MAJOR SUPPLIERS OF TOP TEN PHILIPPINE AGRICULTURALIMPORTS, 2006 ……………………………………………………………… 28
9 DISTRIBUTION OF PHILIPPINE AGRICULTURAL EXPORTSTO ASEAN MEMBER COUNTRIES, 2006 ……………………………… 30
49 iv
LIST OF TABLES
Janu
ary
0.56
90.
731
28.4
70.
373
0.48
429
.87
0.34
70.
241
-30.
470.
257
0.30
619
.07
Febr
uary
0.59
10.
763
29.1
00.
393
0.50
328
.15
0.39
80.
233
-41.
410.
257
0.32
526
.46
Mar
ch0.
575
0.76
933
.74
0.38
50.
509
32.2
10.
380
0.23
0-3
9.45
0.25
60.
322
25.7
8Ap
ril0.
578
0.82
843
.17
0.37
20.
553
48.5
20.
386
0.21
4-4
4.46
0.25
90.
320
23.4
6M
ay0.
583
0.89
453
.34
0.39
00.
592
51.7
90.
371
0.20
8-4
3.93
0.26
60.
334
25.5
6Ju
ne0.
575
0.97
970
.26
0.38
70.
653
68.7
30.
340
0.20
5-3
9.67
0.26
70.
361
35.2
1Ju
ly0.
583
0.92
959
.27
0.38
40.
613
59.6
50.
351
0.22
4-3
6.04
0.27
20.
376
38.1
5Au
gust
0.60
60.
910
50.1
70.
404
0.59
547
.28
0.29
80.
216
-27.
430.
262
0.38
546
.95
Sept
embe
r0.
609
0.93
052
.71
0.41
30.
614
48.6
10.
266
0.21
5-1
9.20
0.25
70.
426
65.7
6O
ctob
er0.
626
1.01
061
.34
0.41
10.
658
60.1
70.
257
0.22
0-1
4.08
0.27
30.
450
64.8
4N
ovem
ber
0.65
61.
131
72.4
10.
434
0.74
872
.35
0.26
00.
223
-14.
260.
300
0.48
963
.00
Dec
embe
r0.
732
1.15
357
.58
0.47
70.
765
60.2
80.
265
0.23
5-1
1.10
0.29
50.
515
74.5
1
Coc
onut
Oil
- (P
hilip
pine
s/In
done
sia)
, bul
k, c
.I.f R
otte
rdam
Cop
ra -
(Phi
lippi
nes/
Indo
nesi
a), b
ulk,
c.I.
f N.W
. Eur
ope
Sug
ar-In
tern
atio
nal S
ugar
Agr
eem
ent (
ISA
) FO
B C
arib
bean
Por
t.So
ybea
ns (U
S), c
.i.f.
Rot
terd
amR
ice
(Tha
i) 5%
bro
ken,
whi
te ri
ce (W
R),
Mill
ed, i
ndic
ativ
e pr
ice
base
d on
wee
kly
surv
eys
of e
xpor
t tra
nsac
tions
,
g
over
nmen
t sta
ndar
d, f.
o.b.
Ban
gkok
Ric
e (T
hai)
25%
bro
ken,
WR
, mille
d, in
dica
tive
surv
ey p
rice,
gov
ernm
ent s
tand
ards
, f.o
.b. B
angk
okR
ice
(Tha
i) 35
% b
roke
n, W
R, m
illed,
f.o.
b. B
angk
okM
aize
(US
), N
o. 2
, yel
low
, f.o
.b. U
S G
ulf P
orts
Cof
fee
Inte
rnat
iona
l Cof
fee
Org
aniz
atio
n in
dica
tor p
rice,
oth
er m
ild A
rabi
cas,
ave
rage
New
Yor
k an
d B
rem
en/H
ambu
rg m
arke
ts, e
x-do
ckC
offe
e In
tern
atio
nal C
offe
e O
rgan
izat
ion
indi
cato
r pric
e, R
obus
tas,
ave
rage
New
Yor
k an
d Le
Hav
re/M
arse
illes
mar
kets
, ex-
dock
Ban
ana
(Cen
tral a
nd S
outh
Am
eric
an),
maj
or b
rand
s, U
S im
port
pric
e,fre
e on
truc
k U
S G
olf p
orts
Rub
ber (
any
orig
in),
RS
S n
o. 1
, in
bale
s, R
ubbe
r Tra
ders
Ass
ocia
tion,
spo
t, N
ew Y
ork
Tabl
e 11
. W
OR
LD P
RIC
ES O
F SE
LEC
TED
CO
MM
OD
ITIE
S ( 2
006
- 200
7)($
per
kg.
)
Gro
wth
R
ate
Year
/Mon
thG
row
th
Rat
e G
row
th
Rat
e G
row
th
Rat
e 20
0620
0720
0620
0720
0620
0720
0620
07
Coc
onut
Oil
Cop
raSu
gar
Soyb
eans
AGRICULTURAL FOREIGN TRADE DEVELOPMENT
2 0 0 7 A N N U A L
Tabl
e 10
b. (C
ontin
ued)
IV.
Anim
al a
nd V
eget
able
Oil
and
Fats
0.00
0.00
0.00
0.00
2,08
3.17
150.
7927
1.34
18,3
50.2
8A.
Ani
mal
and
Veg
etab
le O
ils
447.
0324
7.76
9,28
7.00
a
nd F
ats
B. F
ixed
Veg
etab
le O
ils a
nd F
ats
1,63
6.14
150.
7923
.58
9,06
3.28
V. F
ertil
izer
Man
ufac
ture
d60
1.15
47.7
971
.34
2,55
8.36
VI.
Agric
ultu
ral C
hem
ical
s an
d M
ater
ials
17.3
17.
192.
5762
.36
38.3
37,
352.
9251
,751
.81
VII.
Agr
icul
tura
l Mac
hine
ry36
.11
551.
3817
4.11
1,14
4.52
19,5
27.7
5
TOTA
L VA
LUE
OF
AGR
ICU
LTU
RAL
IMPO
RTS
1,88
0.88
242.
2521
7.58
27.7
717
,286
.45
1,37
0.63
21,1
15.7
144
7,27
9.60
TOTA
L VA
LUE
OF
ALL
PHIL
IPPI
NE
IMPO
RTS
Sou
rce
of b
asic
dat
a: N
SO
57,9
95,7
52.4
73,
821.
0413
,142
.74
90,9
98.2
41,
151.
2213
9,33
4.50
150,
341.
1237
6,56
1.30
Port
ugal
Slov
akia
Slov
enia
Swed
en
Tota
l Phi
l. Ag
ricul
tura
l Im
port
s to
EU
EUR
OPE
AN U
NIO
N Spai
nU
K G
reat
B
ritai
n an
d N
. Ire
land
Item
Pola
nd
v 48
LIST OF TABLES (Continued)
Table No. Pages
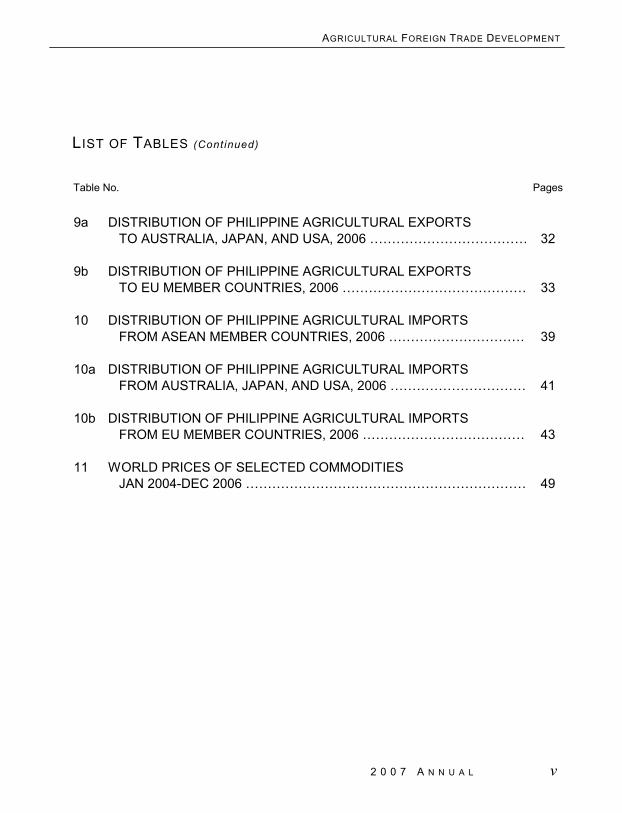
9a DISTRIBUTION OF PHILIPPINE AGRICULTURAL EXPORTSTO AUSTRALIA, JAPAN, AND USA, 2006 ……………………………… 32
9b DISTRIBUTION OF PHILIPPINE AGRICULTURAL EXPORTSTO EU MEMBER COUNTRIES, 2006 …………………………………… 33
10 DISTRIBUTION OF PHILIPPINE AGRICULTURAL IMPORTSFROM ASEAN MEMBER COUNTRIES, 2006 …………………………… 39
10a DISTRIBUTION OF PHILIPPINE AGRICULTURAL IMPORTSFROM AUSTRALIA, JAPAN, AND USA, 2006 …………………………… 41
10b DISTRIBUTION OF PHILIPPINE AGRICULTURAL IMPORTSFROM EU MEMBER COUNTRIES, 2006 ………………………………… 43
11 WORLD PRICES OF SELECTED COMMODITIESJAN 2004-DEC 2006 ………………………………………………………… 49

AGRICULTURAL FOREIGN TRADE DEVELOPMENT
2 0 0 7 A N N U A L
Figure No. Pages
1 SHARE OF AGRICULTURAL AND NON-AGRICULTURAL EXPORTS TO TOTAL PHILIPPINE EXPORTS, 2006 ……………………………… 9
2 SHARE OF AGRICULTURAL AND NON-AGRICULTURAL IMPORTS TO TOTAL PHILIPPINE IMPORTS, 2006 ………………………………… 9
3 PHILIPPINE AGRICULTURAL EXPORTS, BY QUARTER 2006-2005 ………………………………………………… 11
4 PHILIPPINE AGRICULTURAL IMPORTS, BY QUARTER 2006-2005 ………………………………………………… 11
5 VALUE OF COCONUT OIL EXPORTS, BY QUARTER 2006-2005 ………………………………………………… 18
6 VALUE OF BANANA FRESH EXPORTS, BY QUARTER 2006-2005 ………………………………………………… 18
7 VALUE OF PINEAPPLE AND PINEAPPLE PRODUCT EXPORTS, BY QUARTER 2005-2006 ………………………………………………… 18
8 VALUE OF DESICCATED COCONUT EXPORTS, BY QUARTER 2005-2006 ………………………………………………… 18
9 VALUE OF TOBACCO MANUFACTURED EXPORTS, BY QUARTER 2005-2006 ………………………………………………… 18
10 VALUE OF TUNA EXPORTS, BY QUARTER 2005-2006 ………………… 18
11 VALUE OF SHRIMPS AND PRAWNS EXPORTS, BY QUARTER 2005-2006 ………………………………………………… 19
47 vi
LIST OF FIGURES
Tabl
e 10
b. (C
ontin
ued)
I. F
ood
and
Live
Ani
mal
s1,
226.
3123
5.06
217.
5825
.20
14,2
09.9
195
9.61
11,3
93.2
433
7,01
7.34
A. L
ive
Anim
als
257.
522,
834.
84B.
Mea
t and
Mea
t Pre
para
tions
1,51
0.19
222.
8815
,135
.42
C. D
airy
Pro
duct
s &
Bird
's E
ggs
1,10
0.86
25.2
079
3.33
326.
245,
036.
2372
,673
.70
D. F
ish
and
Fish
Pre
para
tions
95.1
654
7.35
4.99
1,12
0.27
E. C
erea
ls a
nd C
erea
l Pre
para
tions
22.0
515
.53
672.
3411
,466
.06
F. V
eget
able
s an
d Fr
uits
108.
0611
7.85
1,22
3.47
333.
6910
,736
.94
G. S
ugar
and
Sug
ar P
repa
ratio
ns82
0.20
179.
3915
,365
.57
H. C
offe
e, T
ea, C
ocoa
Spi
ces
217.
5848
3.10
0.23
425.
923,
836.
82
a
nd M
anuf
actu
res
ther
eof
I. F
eedi
ng S
tuff
for A
nim
als
5,06
1.56
604.
491,
803.
7642
,447
.37
(exc
ludi
ng u
nmille
d C
erea
ls)
J. M
isce
llane
ous
Edi
ble
Prod
ucts
17
.39
3,75
5.18
28.6
52,
456.
5216
1,40
0.35
and
Prep
arat
ions
II. T
obac
co a
nd T
obac
co M
anuf
actu
res
25.2
53,
198.
28
III. C
rude
Mat
eria
ls0.
000.
000.
000.
0037
9.63
0.00
857.
1014
,875
.78
A. O
il Se
eds
and
Ole
agin
ous
Frui
ts40
.75
43.2
5B.
Cru
de R
ubbe
r43
6.56
6,99
7.02
C. C
rude
Fer
tiliz
er45
.41
D. C
rude
Ani
mal
& V
e geta
ble
Mat
eria
ls
379.
6337
9.79
7,79
0.10
(i
nclu
ding
hid
es, s
kins
and
furk
ins,
raw
)
Tota
l Phi
l. Ag
ricul
tura
l Ex
port
s to
EU
EUR
OPE
AN U
NIO
N Spai
nU
K G
reat
B
ritai
n an
d N
. Ire
land
Item
Pola
ndPo
rtug
alSl
ovak
iaSl
oven
iaSw
eden
Tota
l Phi
l. Ag
ricul
tura
l Im
ports
to E
U

AGRICULTURAL FOREIGN TRADE DEVELOPMENT
2 0 0 7 A N N U A L
Tabl
e 10
b. (C
ontin
ued)
IV.
Ani
mal
and
Veg
etab
le O
il an
d Fa
ts58
.51
963.
2488
5.65
A. A
nim
al a
nd V
eget
able
Oils
and
Fat
s58
.51
8.45
816.
00
B. F
ixed
Veg
etab
le O
ils a
nd F
ats
954.
7969
.65
V. F
ertil
izer
Man
ufac
ture
d0.
844.
34
VI.
Agr
icul
tura
l Che
mic
als
and
Mat
eria
ls29
3.79
2,51
7.89
6,00
0.83
VII.
Agr
icul
tura
l Mac
hine
ry0.
255,
279.
274,
517.
94
TOTA
L VA
LUE
OF
AGR
ICU
LTU
RAL
IMPO
RTS
147.
920.
0697
,167
.73
14,3
65.7
762
.35
1,66
6.11
23.0
987
,696
.49
TOTA
L VA
LUE
OF
ALL
PHIL
IPPI
NE
IMPO
RTS
Sou
rce
of b
asic
dat
a: N
SO
EUR
OPE
AN U
NIO
NN
ethe
rland
s
2,20
8.75
10,7
42.6
51,
434,
988.
3621
9,84
4.17
110.
342,
351.
9130
7.78
481.
956.
30
Item
Gre
ece
Hun
gary
Irela
ndIta
lyLi
thun
iaLu
xem
bour
gM
alta
12 VALUE OF FERTILIZER MANUFACTURED EXPORTS,BY QUARTER 2005-2006 ………………………………………………… 19
13 VALUE OF MILK AND CREAM AND PRODUCTS EXPORTS, BY QUARTER 2005-2006 ………………………………………………… 19
14 VALUE OF SEAWEEDS AND CARAGEENAN EXPORTS, BY QUARTER 2005-2006 ………………………………………………… 19
15 VALUE OF RICE IMPORTS, BY QUARTER 2005-2006 ………………… 26
16 VALUE OF SOYABEAN OIL/CAKE MEAL IMPORTS, BY QUARTER 2005-2006 ………………………………………………… 26
17 VALUE OF WHEAT IMPORTS, BY QUARTER 2005-2006 ……………… 26
18 VALUE OF MILK AND CREAM AND PRODUCTS IMPORTS, BY QUARTER 2005-2006 ………………………………………………… 26
19 VALUE OF UNMANUFACTURED TOBACCO IMPORTS, BY QUARTER 2005-2006 ………………………………………………… 26
20 VALUE OF MEAT OF BOVINE ANIMALS IMPORTS, BY QUARTER 2005-2006 ………………………………………………… 26
21 VALUE OF UREA IMPORTS, BY QUARTER 2005-2006 ………………… 27
22 VALUE OF FOOD PREPARATIONS FOR INFANT USE IMPORTS, BY QUARTER 2005-2006 ………………………………………………… 27
23 VALUE OF NON-ALCOHOLIC CONCENTRATES IMPORTS, BY QUARTER 2005-2006 ………………………………………………… 27
LIST OF FIGURES (Continued) Figure No. Pages
vii 46

AGRICULTURAL FOREIGN TRADE DEVELOPMENT
2 0 0 7 A N N U A L
45 viii
LIST OF FIGURES (Continued) Figure No. Pages
24 VALUE OF PALM OIL IMPORTS, BY QUARTER 2005-2006 …………… 27
25 WORLD PRICES OF COCONUT OIL, JANUARY - DECEMBER 2005-2006 ……………………………………… 52
26 WORLD PRICES OF COPRA, JANUARY - DECEMBER 2005-2006 ……………………………………… 52
27 WORLD PRICES OF SUGAR, JANUARY - DECEMBER 2005-2006 ……………………………………… 52
28 WORLD PRICES OF SOYBEANS, JANUARY - DECEMBER 2005-2006 ……………………………………… 52
29 WORLD PRICES OF RICE (5% BROKEN), JANUARY 2005-DECEMBER 2006 ……………………………………… 52
30 WORLD PRICES OF RICE (25% BROKEN), JANUARY 2005-DECEMBER 2006 ……………………………………… 52
31 WORLD PRICES OF RICE (35% BROKEN), JANUARY 2005-DECEMBER 2006 ……………………………………… 53
32 WORLD PRICES OF MAIZE, JANUARY 2005-DECEMBER 2006 ……………………………………… 53
33 WORLD PRICES OF COFFEE, ARABICA, JANUARY- DECEMBER 2005-2006 ……………………………………… 53
34 WORLD PRICES OF COFFEE, ROBUSTA, JANUARY- DECEMBER 2005-2006 ……………………………………… 53
62.3
51,
666.
1111
.58
75,1
13.7
9
912.
3887
6.71
62.3
520
,127
.72
165.
6656
5.01
11.5
852
8.32
3,73
9.29
419.
93
16,2
45.4
6
1,66
6.11
31,5
33.3
1
11.7
0
0.00
0.00
11.5
11,
155.
24
11.5
141
5.83
739.
41
Luxe
mbo
urg
Mal
taN
ethe
rland
s
N U
NIO
NLi
thua
nia
I. F
ood
and
Live
Ani
mal
s72
.13
0.06
96,5
18.3
85,
377.
60
A. L
ive
Anim
als
0.06
B. M
eat a
nd M
eat P
repa
ratio
ns29
2.04
14.4
5C
. Dai
ry P
rodu
cts
& B
ird's
Egg
s4,
839.
5711
8.32
D. F
ish
and
Fish
Pre
para
tions
18.1
5E
. Cer
eals
and
Cer
eal P
repa
ratio
ns27
2.71
626.
14F.
Veg
etab
les
and
Frui
ts72
.13
45.4
11,
432.
55G
. Sug
ar a
nd S
ugar
Pre
para
tions
20.8
436
5.93
H. C
offe
e, T
ea, C
ocoa
Spi
ces
129.
9410
3.86
and
Man
ufac
ture
s th
ereo
f I.
Fee
ding
Stu
ff fo
r Ani
mal
s1,
224.
67
(e
xclu
ding
unm
illed
Cer
eals
)J.
Mis
cella
neou
s E
dibl
e P
rodu
cts
90,9
17.8
71,
473.
53
an
d P
repa
ratio
ns
II. T
obac
co a
nd T
obac
co M
anuf
actu
res
75.5
429
7.05
III. C
rude
Mat
eria
ls0.
000.
000.
0022
6.93
A. O
il S
eeds
and
Ole
agin
ous
Frui
tsB
. Cru
de R
ubbe
r12
9.98
C. C
rude
Fer
tiliz
erD
. Cru
de A
nim
al &
Veg
etab
le M
ater
ials
96
.95
(i
nclu
ding
hid
es, s
kins
and
furk
ins,
raw
)
Tabl
e 10
b. (C
ontin
ued)
EUR
Item
Gre
ece
Hun
gary
Irela
ndIta
lyEU
RO
PEAN
UN
ION
AGRICULTURAL FOREIGN TRADE DEVELOPMENT
2 0 0 7 A N N U A L
Tabl
e 10
b. (C
ontin
ued)
IV.
Anim
al a
nd V
eget
able
Oil
and
Fats
1,27
7.24
8,63
4.21
983.
053,
043.
08
A. A
nim
al a
nd V
eget
able
Oils
and
Fat
s66
8.32
3,21
5.69
979.
692,
845.
55
B. F
ixed
Veg
etab
le O
ils a
nd F
ats
608.
925,
418.
523.
3619
7.53
V. F
ertil
izer
Man
ufac
ture
d19
3.45
23.8
71,
615.
58
VI.
Agric
ultu
ral C
hem
ical
s an
d M
ater
ials
68.5
23,
337.
3610
.72
1,35
6.32
170.
9313
,251
.54
17,2
56.2
3
VII.
Agr
icul
tura
l Mac
hine
ry24
.96
778.
3041
0.86
9.27
1,48
9.83
5,11
0.95
TOTA
L VA
LUE
OF
AGR
ICU
LTU
RAL
IMPO
RTS
1,95
4.01
36,6
22.4
138
3.48
554.
2638
,430
.86
101.
072,
091.
5759
,083
.93
64,7
87.2
2
TOTA
L VA
LUE
OF
ALL
PHIL
IPPI
NE
IMPO
RTS
Sou
rce
of b
asic
dat
a: N
SO
1,29
1,94
1.12
Fran
ceG
erm
any
30,2
48.9
232
0,43
0.14
880.
4999
,442
.45
68,7
40.6
514
7.93
164,
633.
7062
6,82
5.78
Item
Aust
riaB
elgi
umC
ypru
sC
zech
R
epub
licD
enm
ark
Esto
nia
Finl
and
EUR
OPE
AN U
NIO
N
ix 44
LIST OF FIGURES (Continued)) Figure No. Pages
35 WORLD PRICES OF BANANA, JANUARY- DECEMBER 2005-2006 ……………………………………… 53
36 WORLD PRICES OF RUBBER, JANUARY- DECEMBER 2005-2006 ……………………………………… 53

AGRICULTURAL FOREIGN TRADE DEVELOPMENT
2 0 0 7 A N N U A L
C. C
rude
Fer
tiliz
er6,
736.
36
21.9
8
360.
56
D
. Cru
de A
nim
al &
Ve g
etab
le M
ater
ials
(inc
ludi
ng h
ides
, ski
ns a
nd
fu
rkin
s, ra
w)
65,6
90.8
8
71
2.39
2,
343.
39
18,5
34.3
3
IV.
Anim
al a
nd V
eget
able
Oil
and
Fats
178,
698.
75
4,
117.
99
30
9.71
3,52
9.12
A.
Ani
mal
and
Veg
etab
le O
ils a
nd F
ats
126,
923.
52
4,
045.
11
19
2.67
2,75
3.63
B.
Fix
ed V
eget
able
Oils
and
Fat
s51
,775
.23
72.8
8
11
7.04
775.
49
V. F
ertil
izer
Man
ufac
ture
d28
9,63
2.41
183.
41
32,7
36.9
3
1,33
1.24
VI.
Agric
ultu
ral C
hem
ical
s an
d M
ater
ials
231,
967.
06
3,
661.
94
24
,717
.84
14
,860
.31
VII.
Agr
icul
tura
l Mac
hine
ry59
,917
.74
312.
39
3,87
4.20
11
,441
.51
TOTA
L VA
LUE
OF
AGR
ICU
LTU
RAL
IMPO
RTS
TOTA
L VA
LUE
OF
ALL
93,0
63,6
48.5
8
76
0,58
3.16
7,
219,
100.
51
8,10
6,24
0.92
PH
ILIP
PIN
ES IM
POR
TS
Sou
rce
of b
asic
dat
a: N
SO
833,
126.
36
10
9,77
7.64
189,
163.
96
4,91
8,29
1.14
USA
Tabl
e 10
a. (C
ontin
ued) Ite
mTo
tal P
hilip
pine
Ag
ricul
tura
l Im
port
sAu
stra
liaJa
pan
HIGHLIGHTS
42

AGRICULTURAL FOREIGN TRADE DEVELOPMENT
2 0 0 7 A N N U A L
IV. A
nim
al a
nd V
eget
able
Oil
a
nd F
ats
0.00
40,8
69.1
685
,446
.37
0.00
0.00
8,41
8.83
1,43
9.05
203.
9213
6,37
7.33
A. A
nim
al a
nd V
eget
able
Oils
and
Fat
s25
,783
.39
65,8
28.4
23,
541.
751,
181.
9420
3.92
96,5
39.4
2B
. Fix
ed V
eget
able
Oils
and
Fat
s15
,085
.77
19,6
17.9
54,
877.
0825
7.11
39,8
37.9
1
V.
Ferti
lizer
Man
ufac
ture
d21
,832
.18
14,1
97.5
10.
113,
936.
8972
9.43
1,46
9.03
42,1
65.1
5
VI.
Agric
ultu
ral C
hem
ical
s an
d M
ater
ials
16,7
91.0
37,
691.
435,
728.
1018
,805
.90
7,36
0.51
56,3
76.9
7
VII.
Agr
icul
tura
l Mac
hine
ry67
8.88
2,16
5.18
3,34
0.61
2,29
9.60
151.
218,
635.
48
TOTA
L VA
LUE
OF
AG
RIC
ULT
UR
AL IM
POR
TS9.
3922
1,56
3.38
183,
581.
972,
198.
0412
0.67
94,2
95.6
836
3,83
9.21
553,
210.
791,
418,
819.
13
TOTA
L VA
LUE
OF
ALL
PHIL
IPPI
NE
IMPO
RTS
no im
port
data
from
Lao
s, B
rune
i and
Sar
awak
Sou
rce
of b
asic
dat
a: N
SO
13,4
50,8
59.9
2
3,
023.
296,
411,
299.
832,
402,
510.
6790
6,45
8.07
Indo
nesi
aVi
etna
m
547.
011,
357,
153.
732,
318,
501.
862,
827.
88
Thai
land
Sing
apor
e
Tota
l Phi
lippi
ne
Agric
ultu
ral
Impo
rts
to
ASEA
N
Tabl
e 10
. (C
ontin
ued)
ITEM
Cam
bodi
a
A S
E A
N
Saba
hM
yanm
arM
alay
sia
1 40
OVERALL AGRICULTURAL TRADE SITUATION 1. A relatively weaker performance characterized the country’s 2007
agricultural foreign trade. Growth rate of imports (8.25%) was higher than that of exports (3.35%) and this widened trade deficit by 18.51% or US$1,750.22 million.
• The total Philippine exports in 2007 reached US$50,465.72 million.
The share of agricultural exports to total Philippine exports increased by 6.30% from the previous year’s record.
• The country realized earnings amounting to US$3,168.07 million from
agricultural exports . This marked a 13.90% growth compared with the last year’s level. The fourth quarter of 2007 recorded the highest level of exportation at US$913.10 million and this indicated a 33.74% increase over the 2006 level.
• Agricultural import expenditures amounted to US$4,918.29 million or
14.28% higher than in 2006. Agricultural imports contributed 8.48% to the country’s total import expenditures. This represented an increase of 6.54% from the 2006 record.
2. Trade surpluses with Japan and European Union (EU) countries
were maintained in an increasing rate, whereas deficits were noted with the rest of the country’s trading partners.
• The country’s trade with European Union posed a surplus of
US$172.53 million in 2007. There was a significant increase of 42.23% from last year’s US$121.30 million. During the period, agricultural exports (US$ 619.81 million) outpaced imports (US$447.18 million) .
• Agricultural trade with Japan posted the largest surplus of US$334.62
million with 3.66% increase over last year’s value. Japan was the leading market for Philippine fresh banana and shrimps and prawns which comprised 44.39% and 45.28%, respectively of the country’s agricultural exports. It was also the top supplier of rubber, accounting for 21.94% of the country’s total rubber import data.

AGRICULTURAL FOREIGN TRADE DEVELOPMENT
2 0 0 7 A N N U A L
39 2
• There was still a wide imbalance in the Philippine agricultural trade with the ASEAN countries. This year’s trade deficit of US$915.39 million was 30.84% higher than last year’s deficit of US$699.64.
• The country’s exchange of commodities with USA and Australia
recorded decreases in trade deficits by 10.24% and 75.64%, respectively. Trade with the rest of the world was characterized by higher import expenses which negated the increase in export receipts. The net effect was a wider gap in agricultural trade balance at 25.75%.
3. Agricultural Exports
Most of the top 10 export commodities registered gains in export earnings compared with last year’s proceeds.
• Milk and cream and their by-products and tuna led the major gainers
among agricultural exports with 48.98% and 47.18% increases, respectively. These effected the rise of milk and cream and their by-products from 8th placer in the previous year to 6th placer this year. Tuna maintained its position in the fourth rank. Indonesia remained to be the country’s top destination of milk and cream and their by-products with 48.95% share in the total value of the country’s exports for this product. On the other hand, 32.79% of the Philippine tuna export went to USA.
• Crude and refined coconut oil continued as the country’s top
agricultural exports. There was a 26.79% increase in its exports value, a turn-around from the last year’s negative growth of 11.94%. The highest volume of exportation was recorded during the last quarter of the year. The major markets were Netherlands with 41.71% share and USA with 36.79%.
• Export earnings from seaweeds and carageenan increased by
28.02%, that is, from US$ 71.59 million in 2006 to US$ 91.65 million in 2007. This brought the item to the 8th place which displaced fertilizer, manufactured in the top 10 list of agricultural imports. The major destination countries included USA (17.49%), Denmark (8.91%), France (8.60%), Belgium (5.46%) and Thailand (5.25%).
Tabl
e 10
. DIS
TRIB
UTI
ON
OF
PHIL
IPPI
NE
AGR
ICU
LTU
RAL
IMPO
RTS
FR
OM
ASE
AN M
EMB
ER C
OU
NTR
IES,
200
7(C
.I.F.
Val
ue in
'000
US$
)
108
428
380
448
116
504
0.00
0.00
112,
520.
5571
,727
.90
2,19
5.00
110.
7125
.67
0.45
ratio
ns10
3.93
20.5
1s
Egg
s3,
412.
708,
885.
62at
ions
1,89
9.94
98.2
06.
93re
para
tions
2,78
9.41
4,87
5.69
110.
715,
043.
3934
3.32
2,15
4.79
para
tions
14,8
73.7
11,
823.
21pi
ces
32,4
24.8
020
,743
.18
5.46
reof
mal
s9,
984.
216,
135.
6427
.82
erea
ls)
Prod
ucts
41
,962
.79
28,8
02.0
8
Man
ufac
ture
s9,
632.
831,
611.
24
0.00
9.39
19,2
38.7
574
2.34
3.04
9.85
nous
Fru
its6,
302.
973.
044,
281.
1950
2.32
1.16
127.
76
tabl
e 9.
398,
653.
4311
2.26
9.85
and
Cam
bodi
aB
rune
i
A S
E A
N
Saba
hM
yanm
arM
alay
sia
Indo
nesi
aS
I. F
ood
and
Live
Ani
mal
sA
. Liv
e A
nim
als
B. M
eat a
nd M
eat P
repa
ratio
nsC
. Dai
ry P
rodu
cts
& B
ird's
Egg
sD
. Fis
h an
d Fi
sh P
repa
ratio
nsE
. Cer
eals
and
Cer
eal P
repa
ratio
nsF.
Veg
etab
les
and
Frui
tsG
. Sug
ar a
nd S
ugar
Pre
para
tions
H. C
offe
e, T
ea, C
ocoa
Spi
ces
and
Man
ufac
ture
s th
ereo
f I.
Fee
ding
Stu
ff fo
r Ani
mal
s
(e
xclu
ding
unm
illed
Cer
eals
)J.
Mis
cella
neou
s E
dibl
e P
rodu
cts
and
Pre
para
tions
II. T
obac
co a
nd T
obac
co M
anuf
actu
res
III. C
rude
Mat
eria
lsA
. Oil
See
ds a
nd O
leag
inou
s Fr
uits
B. C
rude
Rub
ber
C. C
rude
Fer
tiliz
erD
. Cru
de A
nim
al &
Ve g
etab
le
(incl
udin
g hi
des,
ski
ns a
nd
furk
ins,
raw
)
BIT
EM
720
780
892
58,3
80.9
331
3,81
9.69
538,
115.
551,
096,
870.
3326
.12
283.
5518
8.38
278.
9887
5.35
8,68
5.56
29,6
70.9
93,
506.
3154
,161
.18
1,07
6.14
905.
571,
953.
265,
940.
042,
897.
1316
1,00
9.90
496,
346.
7966
8,02
9.63
1,45
1.54
7,96
3.09
1,31
8.64
18,2
74.7
794
1.03
13,9
92.8
02,
224.
1133
,854
.86
12,5
12.5
51,
724.
7829
,297
.09
96,7
07.8
6
8,49
7.92
16,1
13.4
01,
261.
9042
,020
.89
22,0
35.5
182
,250
.78
1,92
8.47
176,
979.
63
2,90
7.11
6,62
1.16
5,05
7.08
25,8
29.4
2
11,5
83.2
120
,124
.38
853.
4952
,564
.45
137.
9230
9.33
428.
587,
181.
847,
493.
2418
,056
.80
151.
5830
,485
.13
1.06
0.71
73.7
6
204.
453,
950.
991,
757.
5419
9.57
14,6
93.0
3
Viet
nam
Thai
land
Sing
apor
e
Tota
l Phi
lippi
ne
Agric
ultu
ral
Expo
rts
to
ASEA
N
Tota
l Phi
lippi
ne
Agr
icul
tura
l Im
port
s to
A
SE
AN
Thai
land
Sing
apor
eCa
mbo
dia
Saba
hM
yanm
arM
alay
sia
Indo
nesi
aVi
etna
m

AGRICULTURAL FOREIGN TRADE DEVELOPMENT
2 0 0 7 A N N U A L
Tabl
e 9b
. (Con
tinue
d)
IV.
Anim
al a
nd V
eget
able
Oil
and
Fats
19.5
819
,907
.48
2.28
5,70
0.80
336,
258.
24
A. A
nim
al a
nd V
eget
able
Oils
and
Fat
s19
.58
2,94
9.61
11,9
17.9
5
B. F
ixed
Veg
etab
le O
ils a
nd F
ats
16,9
57.8
72.
285,
700.
8032
4,34
0.31
V. F
ertil
izer
Man
ufac
ture
d15
.40
15.4
0
VI. A
gric
ultu
ral C
hem
ical
s an
d M
ater
ials
5.00
3.91
108.
7016
9.85
VII.
Agr
icul
tura
l Mac
hine
ry13
1.07
46.2
721
9.96
TOTA
L VA
LUE
OF
AGR
ICU
LTU
RAL
EXP
OR
TS3,
634.
122,
744.
741,
152.
6142
,193
.09
5,94
5.20
55,4
39.3
261
9,78
3.06
TOTA
L VA
LUE
OF
ALL
PHIL
IPPI
NE
EXPO
RTS
Sou
rce
of b
asic
dat
a: N
SOIte
mEU
RO
PEAN
UN
ION
Pola
ndPo
rtug
alSl
oven
iaSp
ain
Swed
enU
K G
reat
Brit
ain
and
N. I
rela
ndTo
tal P
hil.
Agric
ultu
ral
Expo
rts
to E
U
18,3
18.5
2
17,7
10.3
2
2,72
5.61
143,
382.
98
26,2
11.0
7
478,
986.
56
8,
570,
499.
46
3 38
Income from four (4) major export commodities declined in 2007. Reductions ranged from 1.13% (Banana Fresh) to 13.89% (Shrimps and Prawns).
• Export earnings from fresh banana declined by 1.13%. From
US$405.44 million in 2006, export revenues decreased to US$400.85 million in 2007. The three (3) major markets which registered reductions in export transactions with the Philippines included United Arab Emirates by 31.97%, Taiwan by 21.21% and Iran by 18.15%.
• Exportation of manufactured tobacco slid from US$102.06 million
during the previous year to US$97.89 million in 2007. Major markets were Thailand (64.77%), Korea (7.36%), Vietnam (7.35%), Singapore (4.12%) and Hongkong (3.44%).
• Export receipts from shrimps and prawns which amounted to
US$84.85 million were down by 13.89% from last year’s receipts of US$98.54 million. The highest volume of exports was registered during the 1st quarter while the lowest was in the 4th quarter of the year. Destination points were Japan, Korea, USA, Canada and Guam.
• Export earnings from centrifugal sugar which amounted to US$77.49
million, declined by 5.88% from last year’s income of US$82.33 Foreign markets were USA, Indonesia, Japan, United Arab Emirates and France.
4. Agricultural Imports
Increased import expenditures were registered for most of the top 10 import commodities.
• For this year, rice was the top agricultural import displacing wheat. The
country spent US$653.51 million for rice and registered a 27.31% increase from the 2006 level. The bulk or 75.75% of the Philippine rice imports were again sourced from Vietnam. The highest value of importation for 2007 was registered on the second quarter.

AGRICULTURAL FOREIGN TRADE DEVELOPMENT
2 0 0 7 A N N U A L
Tabl
e 9b
. (Con
tinue
d)
I. F
ood
and
Live
Ani
mal
s2,
481.
732,
702.
541,
152.
6117
,574
.05
5,14
1.06
38,4
89.1
123
1,28
8.00
A. L
ive
Ani
mal
s 0.
0311
2.05
300.
28B.
Mea
t and
Mea
t Pre
para
tions
5.72
3.95
108.
41C
. Dai
ry P
rodu
cts
& Bi
rd's
Egg
s77
.62
225.
34D
. Fis
h an
d Fi
sh P
repa
ratio
ns37
1.55
2,64
0.09
1,08
6.78
10,8
79.2
72,
784.
406,
517.
4670
,821
.41
E. C
erea
ls a
nd C
erea
l Pre
para
tions
2.06
67.9
28.
4653
4.70
3,16
8.62
F. V
eget
able
s an
d Fr
uits
2,06
6.16
35.3
030
.45
6,15
2.12
2,14
3.20
28,3
21.1
314
2,95
0.10
G. S
ugar
and
Sug
ar P
repa
ratio
ns36
.34
61.0
11,
356.
713,
778.
95H
. Cof
fee,
Tea
, Coc
oa S
pice
s 0.
370.
0845
.83
292.
08
a
nd M
anuf
actu
res
ther
eof
I. F
eedi
ng S
tuff
for A
nim
als
44.0
235
.38
202.
6931
5.00
1,70
4.18
(exc
ludi
ng u
nmille
d C
erea
ls)
J. M
isce
llane
ous
Edib
le P
rodu
cts
25.0
922
9.58
143.
911,
204.
687,
938.
70
an
d Pr
epar
atio
ns
II. T
obac
co a
nd T
obac
co M
anuf
actu
res
178.
1866
9.59
97.0
23,
193.
57
III. C
rude
Mat
eria
ls1,
132.
8137
.20
4,51
4.07
1.20
10,9
97.4
246
,603
.08
A. O
il Se
eds
and
Ole
agin
ous
Frui
ts0.
46B.
Cru
de R
ubbe
r83
2.74
C. C
rude
Fer
tiliz
er0.
00D
. Cru
de A
nim
al &
Ve g
etab
le M
ater
ials
(inc
ludi
ng h
ides
, ski
ns a
nd
fu
rkin
s, ra
w)
1,13
2.81
37.2
04,
514.
07
1.20
10,9
97.4
2
45,7
69.8
7
Swed
enU
K G
reat
Brit
ain
and
N. I
rela
ndIte
mEU
RO
PEAN
UN
ION
Tota
l Phi
l. Ag
ricul
tura
l Ex
port
s to
EU
Pola
ndPo
rtug
alSl
oven
iaSp
ain
37 4
• Importation of milk and cream and products increased by 42.24%. From US$413.41 million in 2006, it went up to US$588.02 million with the biggest importation recorded during the 4th quarter. The major sources were New Zealand, Australia, United States of America, Thailand and Netherlands
• The increase in the foreign disbursement for meat of bovine animals
displaced urea in the 6th place in the major agricultural imports. In 2007, importation of meat of bovine animals reached US$138.35 million, an increase of 19.38% from 2006. India, Brazil, Australia, USA and New Zealand were the major sources of imports.
The country realized a remarkable increase in importation of rubber and coffee displacing maize and palm oil from the list of top 10 imports.
• Coffee which was not formerly included in the top ten agricultural
imports landed on the 10th place in 2007. The country spent US$69.47 million for this commodity, about 90% higher than in the previous year. Vietnam supplied about 41.10% and Indonesia brought in 35.34%.
• Importation of rubber reached US$87.57 million in 2007; it increased
by 17.96% compared to previous year’s level. The country’s major suppliers were Japan, Thailand, USA, Korea and Singapore.
• Despite the decrease in the import expenses for wheat by 19.30%, this
commodity remained in the list of top imports. The biggest importation was registered in the fourth quarter of the year. Wheat imports were mostly coming from the USA with 71.88% of the total importation. Other suppliers were Canada, China, Australia and Pakistan.
5. World Price Trends
• Coconut oil and Copra. World prices of coconut oil and copra
showed similar patterns. World prices were going-up during the first half of the year. These started to go down in July but recovered in September until the end of the year. The lowest and highest prices were registered in January and December, respectively.

AGRICULTURAL FOREIGN TRADE DEVELOPMENT
2 0 0 7 A N N U A L
Tabl
e 9b
. (Con
tinue
d)
IV.
Ani
mal
and
Veg
etab
le O
il an
d Fa
ts31
,435
.06
40.5
727
2,57
1.82
A. A
nim
al a
nd V
eget
able
Oils
and
Fat
s11
9.77
2,61
4.47
B. F
ixed
Veg
etab
le O
ils a
nd F
ats
31,3
15.3
040
.57
269,
957.
35
V. F
ertil
izer
Man
ufac
ture
d
VI. A
gric
ultu
ral C
hem
ical
s an
d M
ater
ials
0.80
31.2
02.
16
VII.
Agr
icul
tura
l Mac
hine
ry29
6.29
3.96
TOTA
L VA
LUE
OF
AGR
ICU
LTU
RAL
EXP
OR
TS2,
628.
2499
7.01
1,97
8.38
46,5
28.5
844
4.90
614.
851.
8044
7.27
311,
595.
56
TOTA
L VA
LUE
OF
ALL
PHIL
IPPI
NE
EXPO
RTS
Sou
rce
of b
asic
dat
a: N
SOItem
EUR
OPE
AN U
NIO
NG
reec
eH
unga
ryIre
land
Italy
Latv
iaLi
thun
iaLu
xem
bour
gM
alta
Net
herla
nds
16,4
80.7
2
78,1
28.7
6
69,8
11.4
8
202,
842.
77
660.
81
1,37
0.15
3,
013.
66
22,1
46.1
2
4,14
9,52
2.31
5 36
• Sugar. A downtrend in international sugar prices was exhibited in the first half of 2007 and it registered its lowest level in June at US$0.205/kg. Prices recovered in the second half with the highest price posted at US$ 0.235/kg in December.
• Soybean. Better world prices were accorded to soybean throughout
the year. The highest quotation was registered at US$0.515/kg in December.
• Rice. For this year, similar trend was noted for the international prices of rice regardless of the percentage broken. Prices were higher than in the previous year. Surges were more pronounced towards the end of the year with the highest quotation noted in December.
• Maize. International price of maize fluctuated during the first nine months of 2007. The highest price was recorded in December at US$0.180/kg while the lowest at US$0.147/kg was noted in July. Rising prices were sustained from October until the end of the year.
• Coffee Arabica. Prices of coffee, Arabica in the world market
generally increased in 2007 and the highest quotation was registered at US$21.39/kg in October.
• Coffee Robusta. In 2007, monthly prices of coffee, robusta were
higher compared with last year’s quotations. These ranged from US$1.698/kg in March to US$ 2.043/kg in June.
• Banana. World prices of banana dropped in the first five (5) months of
the year compared with the previous year’s quotation. Prices recovered in June until the end of the year at a decreasing rate. Lowest prices were noted in March, April and December.
• Rubber. Generally, prices were higher compared with 2006. Surges of
about 40% were noted in the last two (2) months of the year.
AGRICULTURAL FOREIGN TRADE DEVELOPMENT
2 0 0 7 A N N U A L
Tabl
e 9b
. (C
ontin
ued)
IV.
Ani
mal
and
Veg
etab
le O
il an
d Fa
ts2,
299.
4110
2.10
2.30
26.6
04,
150.
24
A. A
nim
al a
nd V
eget
able
Oils
and
Fat
s2,
299.
4126
.53
3,88
8.58
B. F
ixed
Veg
etab
le O
ils a
nd F
ats
V.
Ferti
lizer
Man
ufac
ture
d10
2.10
2.30
0.07
261.
67
VI.
Agr
icul
tura
l Che
mic
als
and
Mat
eria
ls5.
846.
250.
035.
96
VII.
Agr
icul
tura
l Mac
hine
ry0.
518.
86
TOTA
L VA
LUE
OF
AGR
ICU
LTU
RAL
EXP
OR
TS1,
090.
5028
,632
.53
400.
113,
216.
3210
,551
.54
120.
684,
425.
5129
,738
.91
65,1
74.8
0
TOTA
L VA
LUE
OF
ALL
PHIL
IPPI
NE
EXPO
RTS
Sou
rce
of b
asic
dat
a: N
SO
Ger
man
y
69,1
87.9
1
666,
284.
79
1,82
9.40
72
,497
.80
32
,598
.05
2,
312.
77
79,7
31.3
8
265,
398.
84
2,14
9,34
6.68
Item
EUR
OPE
AN U
NIO
N
Aust
riaB
elgi
umC
ypru
sC
zech
R
epub
licD
enm
ark
Esto
nia
Finl
and
Fran
ce
7 34
STATISTICALTable

2 0 0 7 A N N U A L
I. Food and Live Animals 2,021,344.83 27,223.28 383,656.11 446,087.87 A. Live Animals 3,390.96 1,024.62 855.03 B. Meat and Meat Preparations 19,720.83 142.09 13,321.69 210.97 C. Dairy Products & Bird's Eggs 140,709.58 162.89 249.47 1,546.98
D. Fish and Fish Preparations 470,076.58 2,278.59 68,210.16 137,603.84 E. Cereals and Cereal Preparations 70,464.15 4,808.35 3,584.66 9,704.09 F. Vegetables and Fruits 1,025,838.09 15,604.46 274,174.77 209,539.46 G. Sugar and Sugar Preparations 132,359.44 742.83 10,422.19 65,520.92 H. Coffee, Tea, Cocoa Spices 14,270.43 515.25 4,022.19 2,425.37
and Manufactures thereof I. Feeding Stuff for Animals 49,634.14 68.77 4,117.98 255.00
(excluding unmilled Cereals)J. Miscellaneous Edible Products 94,880.83 2,900.05 4,528.38 18,426.21
and PreparationsII. Tobacco and Tobacco Manufactures 140,871.97 1,505.25 451.82 6,842.63 III. Crude Materials 165,652.92 2,495.49 8,057.57 17,816.11
A. Oil Seeds and Oleaginous Fruits 131.86 56.83 B. Crude Rubber 42,093.38 307.28 150.18 C. Crude Fertilizer 509.75 3.20 9.06 D. Crude Animal & Vegetable Materials (including hides, skins and furkins, raw) 122,909.62 2,495.49 7,690.26 17,656.87
IV. Animal and Vegetable Oil and Fats 769,159.41 34.74 50,957.43 314,657.80 A. Animal and Vegetable Oils and Fats 3,505.76 3.37 583.18 8,583.78 B. Fixed Vegetable Oils and Fats 734,108.64 31.37 50,374.25 306,074.02
V. Fertilizer Manufactured 53,640.66 588.50 22.79 VI. Agricultural Chemicals and Materials 9,885.67 745.41 73.55 584.98 VII. Agricultural Machinery 7,509.95 31.85 1,173.03 1,948.43
TOTAL VALUE OF AGRICULTURAL EXPORTS
TOTAL VALUE OF ALLPHILIPPINE EXPORTS
Source of basic data: NSO
JAPAN AND USA, 2007 (F.O.B. Value in '000 US$)
Item
Table 9a. DISTRIBUTION OF PHILIPPINE AGRICULTURAL EXPORTS TO AUSTRALIA,
Total Philippine
Agricultural Australia Japan USA
3,168,065.41 32,624.52 444,392.30 787,937.82
32,981,329.35 528,414.46 7,304,148.30 8,546,805.06
9 32
OVERALL AGRICULTURAL TRADE S
2007/2006 2006/2005
Agricultural Exports 3,168.07 2,781.36 2,691.19 13.90 3.35
Total Exports 50,465.72 47,410.12 41,254.68 6.45 14.92
Percent of Agricultural Exports Total Exports 6.30 5.87 6.52 7.33 -9.97
Agricultural Imports 4,918.29 4,303.57 3,975.62 14.28 8.25
Total Imports 57,995.75 54,077.99 49,487.42 7.24 9.28
Percent of Agricultural Imports 8.48 7.96 8.03 6.54 -0.87 to Total Imports
Agricultural Trade Surplus/Deficit -1,750.22 -1,522.21 -1,284.43 14.98 18.51
P- preliminarySource of Basic Data: National Statistics Office (NSO)
Table 1. SUMMARY OF PHILIPPINE AGRICULTURAL TRADE, 2005 - 2007(Export Value in F.O.B. M US$; Import Value in C.I.F. M US$)
Growth Rate 2006 2005Item 2007P
F igure 1 SH A R E OF A GR IC ULT UR A L A N D N ON -A GR IC ULT UR A L EXP OR T S T O T OT A L
P H ILIP P IN E EXP OR T S, 2006
Non-Agricultural
94%
Agricultural6%
F igure 2 SH A R E OF A GR IC ULT UR A L A N D N ON -A GR IC ULT UR A L IM P OR T S T O T OT A L
P H ILIP P IN E IM P OR T S, 2006
Agricultural8%
Non-Agricultural
92%
Figure 1SHARE OF AGRICULTURAL AND
NON-AGRICULTURAL EXPORTS TO TOTAL PHILIPPINE IMPORTS, 2007
Figure 2 SHARE OF AGRICULTURAL AND
NON-AGRICULTURAL IMPORTS TO TOTAL PHILIPPINE IMPORTS, 2007

AGRICULTURAL FOREIGN TRADE DEVELOPMENT
2 0 0 7 A N N U A L
31 10
1st Qtr 2nd Qtr 3rd Qtr 4th Qtr TOTAL
Agricultural Exports 606.07 806.93 841.97 913.10 3,168.07
Percent to Annual Agricultural Exports 19.13 25.47 26.58 28.82
Agricultural Imports 973.06 1,267.06 1,282.88 1,395.29 4,918.29
Percent to Annual Agricultural Imports 19.78 25.76 26.08 28.37
Agricultural Trade Surplus/Deficit
1st Qtr 2nd Qtr 3rd Qtr 4th Qtr TOTAL
Agricultural Exports 621.49 760.40 716.73 682.74 2,781.36
Percent to Annual Agricultural Exports 22.34 27.34 25.77 24.55
Agricultural Imports 1,087.76 1,173.04 1,095.33 947.33 4,303.46
Percent to Annual Agricultural Imports 25.28 27.26 25.45 22.01
Agricultural Trade Surplus/Deficit
Source of Basic Data: National Statistics Office (NSO)
Table 1a. PHILIPPINE AGRICULTURAL TRADE, BY QUARTER 2006 - 2007 (Export Value in F.O.B. M US$; Import Value in C.I.F. M US$)
Item
2006
2007
Item
(366.99) (460.13) (440.91) (482.19)
(466.27) (412.64) (264.59) (378.60)
Bru
nei
Cam
bodi
aIn
done
sia
Mal
aysi
aM
yanm
arSa
bah
Sara
wak
Sing
apor
eTh
aila
ndVi
etna
m
IFo
odan
dLi
veA
nim
als
158
258
231
047
9539
060
5486
999
104
4227
424
1278
5308
838
4280
938
4599
667
296
439
51IV
. Ani
mal
and
Veg
etab
le O
il
Oils
and
Fat
s0.
693,
879.
2025
,263
.41
351.
8976
2.18
197.
250.
2630
,454
.88
A. A
nim
al a
nd V
eget
able
a
nd F
ats
0.16
362.
581,
098.
6135
1.89
436.
1219
7.25
0.26
2,44
6.87
B. F
ixed
Veg
etab
le O
ils
a
nd F
ats
0.54
3,51
6.62
24,1
64.7
932
6.06
28,0
08.0
1
V. F
ertil
izer
Man
ufac
ture
d9,
338.
6396
3.34
2,29
1.59
27,4
03.4
939
,997
.05
VI.
Agric
ultu
ral C
hem
ical
s
and
Mat
eria
ls1.
291.
8261
3.39
1,21
5.43
20.8
910
8.89
333.
062,
719.
2323
7.17
5,25
1.17
VII.
Agr
icul
tura
l Mac
hine
ry (N
o.)
0.98
99.6
497
.14
0.50
1.02
375.
4321
5.10
1,39
6.65
2,18
6.46
TOTA
L VA
LUE
OF
AGR
ICU
LTU
RA
L EX
POR
TS1,
600.
112,
441.
8711
7,32
1.71
106,
185.
201,
060.
9040
0.92
31.5
870
,127
.82
117,
981.
3586
,278
.55
503,
430.
01
TOTA
L VA
LUE
OF
ALL
PHIL
IPPI
NE
EXPO
RTS
no e
xpor
t dat
a to
Lao
s
Sour
ce o
f bas
ic d
ata:
NSO
Tabl
e 9.
(C
ontin
ued)
1,40
3.02
8.76
Tota
l Ph
ilipp
ine
Agric
ultu
ral
Expo
rts
to
ASEA
N
ITEM
A S
E A
N
436,
169.
008,
031,
462.
075,
854.
398,
531.
8152
4,46
9.88
2,49
7,50
1.36
8,01
0.74
6,64
1.16
2,56
1.13
3,13
8,69
3.84
1,40
3,02
8.76

AGRICULTURAL FOREIGN TRADE DEVELOPMENT
2 0 0 7 A N N U A L
11 30
Bru
nei
Cam
bodi
aIn
done
sia
Mal
aysi
aM
yanm
arSa
bah
Sara
wak
Sing
apor
eTh
aila
ndVi
etna
m
I. F
ood
and
Live
Ani
mal
s1,
582.
582,
310.
4795
,390
.60
54,8
69.9
910
4.42
274.
2412
.78
53,0
88.3
842
,809
.38
45,9
96.6
729
6,43
9.51
A. L
ive
Anim
als
(No.
)20
9.02
2.00
568.
239.
061.
6813
.85
1.77
805.
61B.
Mea
t and
Mea
t
Pre
para
tions
109.
305.
370.
7244
.71
609.
1871
7.12
1,48
6.40
C. D
airy
Pro
duct
s an
d
Bird
's E
ggs
15.1
468
,884
.28
34,9
36.6
170
.57
595.
247,
456.
064,
189.
2811
6,14
7.18
D. F
ish
& Fi
sh P
repa
ratio
ns85
.99
0.45
1,16
5.81
2,77
5.80
223.
5515
,178
.03
13,3
23.4
62,
541.
0035
,294
.09
E. C
erea
ls a
nd C
erea
l
Pre
para
tions
185.
033.
805,
872.
806,
759.
080.
5341
.36
1,58
1.73
10,0
48.6
937
6.58
24,8
69.6
0F.
Veg
etab
les
and
Frui
ts43
2.88
2.14
5,66
1.92
1,66
4.79
4.41
7.36
30,4
26.3
42,
538.
276,
487.
1747
,225
.28
G. S
ugar
and
Sug
ar
P
repa
ratio
ns93
.41
2,29
2.81
9,14
9.83
2,91
5.39
2.20
594.
134,
749.
3922
,585
.10
42,3
82.2
6H
. Cof
fee,
Tea
, Coc
oa,
Spi
ces
and
Man
ufac
ture
s
th
ereo
f47
.85
819.
3832
2.84
387.
101,
019.
2222
.36
2,61
8.75
I. Fe
edin
g St
uff f
or A
nim
als
(exc
ludi
ng u
nmill
ed C
erea
ls)
28.3
521
9.06
26.4
10.
5493
2.51
335.
458,
298.
340.
00J.
Mis
cella
neou
s E
dibl
e 40
3.96
9.27
3,23
4.63
5,26
6.64
2.50
5.45
4.88
3,33
4.74
2,72
7.89
779.
7215
,769
.68
Prod
ucts
and
Pre
para
tions
II. T
obac
co a
nd T
obac
co
M
anuf
actu
res
14.5
712
1.13
3,60
2.87
3,46
4.54
583.
208,
107.
2963
,422
.58
5,67
2.50
84,9
88.6
8
III. C
rude
Mat
eria
ls8.
454,
397.
3820
,311
.35
17.7
917
.78
7,46
1.48
6,32
6.22
5,57
1.81
44,1
12.2
6
A. O
il Se
eds
& O
leag
inou
s
Fru
its55
.32
11.0
266
.34
B. C
rude
Rub
ber
119.
2017
,847
.89
6,72
7.23
71.2
34,
339.
4729
,105
.02
C. C
rude
Fer
tiliz
er16
2.00
162.
00D
. Cru
de A
nim
al &
Veg
etab
le
Mat
eria
ls (i
nclu
ding
hid
es,
sk
ins
and
furk
ins,
raw
)8.
454,
222.
872,
301.
4617
.79
17.7
872
3.23
6,25
4.99
1,23
2.34
0.00
Tota
l Ph
ilipp
ine
Agric
ultu
ral
Expo
rts
to
ASEA
N
ITEM
A S
E A
N
Tabl
e 9.
DIS
TRIB
UTI
ON
OF
PHIL
IPPI
NE
AGR
ICU
LTU
RAL
EXP
OR
TS T
O A
SEAN
MEM
BER
CO
UN
TRIE
S, 2
007
(F.O
.B. V
alue
in '0
00 U
S$)
TRADE WITH MAJOR TRADING PARTNERS
Figure 3. PHILIPPINE AGRICULTURAL EXPORTS,
BY QUARTER 2005-2006
550
600
650
700
750
800
850
900
950
1st 2nd 3rd 4thQuarter
20062007
Figure 4. PHILIPPINE AGRICULTURAL IMPORTS,
BY QUARTER 2006-2007
870
945
1020
1095
1170
1245
1320
1395
1st 2nd 3rd 4thQuarter
20062007
Figure 3 PHILIPPINE AGRICULTURAL EXPORTS,
BY QUARTER 2006-2007
Figure 4 PHILIPPINE AGRICULTURAL IMPORTS,
BY QUARTER 2006-2007
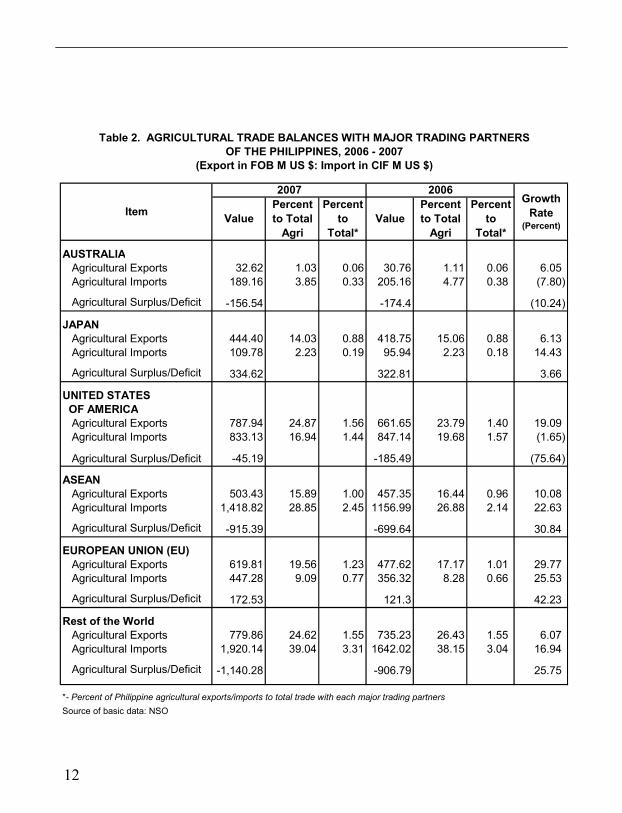
AGRICULTURAL FOREIGN TRADE DEVELOPMENT
2 0 0 7 A N N U A L
29 12
AUSTRALIAAgricultural Exports 32.62 1.03 0.06 30.76 1.11 0.06 6.05 Agricultural Imports 189.16 3.85 0.33 205.16 4.77 0.38 (7.80)
Agricultural Surplus/Deficit -156.54 -174.4 (10.24)
JAPANAgricultural Exports 444.40 14.03 0.88 418.75 15.06 0.88 6.13 Agricultural Imports 109.78 2.23 0.19 95.94 2.23 0.18 14.43
Agricultural Surplus/Deficit 334.62 322.81 3.66
UNITED STATES OF AMERICA
Agricultural Exports 787.94 24.87 1.56 661.65 23.79 1.40 19.09 Agricultural Imports 833.13 16.94 1.44 847.14 19.68 1.57 (1.65)
Agricultural Surplus/Deficit -45.19 -185.49 (75.64)
ASEANAgricultural Exports 503.43 15.89 1.00 457.35 16.44 0.96 10.08 Agricultural Imports 1,418.82 28.85 2.45 1156.99 26.88 2.14 22.63
Agricultural Surplus/Deficit -915.39 -699.64 30.84
EUROPEAN UNION (EU)Agricultural Exports 619.81 19.56 1.23 477.62 17.17 1.01 29.77 Agricultural Imports 447.28 9.09 0.77 356.32 8.28 0.66 25.53
Agricultural Surplus/Deficit 172.53 121.3 42.23
Rest of the WorldAgricultural Exports 779.86 24.62 1.55 735.23 26.43 1.55 6.07 Agricultural Imports 1,920.14 39.04 3.31 1642.02 38.15 3.04 16.94
Agricultural Surplus/Deficit -1,140.28 -906.79 25.75
*- Percent of Philippine agricultural exports/imports to total trade with each major trading partnersSource of basic data: NSO
Percent to Total
AgriValue
Percent to
Total*
Table 2. AGRICULTURAL TRADE BALANCES WITH MAJOR TRADING PARTNERS OF THE PHILIPPINES, 2006 - 2007
(Export in FOB M US $: Import in CIF M US $)
ItemGrowth
Rate (Percent)
2007 2006
ValuePercent
to Total*
Percent to Total
Agri
Quantity C.I.F. Value
Meat of Bovine Animals 104.53 138.35 100.00 100.00India 62.11 80.95 59.42 28.63Brazil 34.75 44.98 33.24 19.33Australia 3.39 6.42 3.24 18.10United States of America 1.21 2.69 1.16 11.35New Zealand 2.21 2.39 2.11 8.24Others 0.86 0.92 0.82 14.35
Urea 505.54 124.72 483.63 100.00Saudi Arabia 173.06 42.56 165.56 34.12China 118.94 32.29 113.79 25.89Indonesia 94.02 21.60 89.95 17.32Malaysia 49.67 13.45 47.52 10.78Qatar 31.20 8.46 29.85 6.78Others 38.65 6.36 36.98 5.10
Food Preparations for Infant Use 17.32 97.25 3.43 100.00Ireland 8.99 51.05 1.78 52.49Netherlands 1.86 14.33 0.37 14.74Denmark 0.99 9.01 0.20 9.26Malaysia 2.29 6.81 0.45 7.00Germany 1.01 6.72 0.20 6.91Others 2.18 9.33 0.43 9.59
Rubber 48.60 87.57 280.60 100.00Japan 8.15 21.34 47.06 24.37Thailand 9.24 18.06 53.35 20.62United States of America 4.49 10.17 25.92 11.61Korea 5.88 9.38 33.95 10.71Singapore 3.53 7.49 20.38 8.55Others 17.31 21.13 99.94 24.13
Coffee 30.80 69.47 63.37 100.00Vietnam 16.68 28.55 34.32 41.10Indonesia 9.15 24.55 18.83 35.34Malaysia 1.88 7.96 3.87 11.46Singapore 2.47 5.99 5.08 8.62Thailand 0.32 1.60 0.66 2.30Others 0.30 0.82 2.46 1.18
Source of basic data: NSO
Table 8. (Continued)
QuantityCommodity/Country of Origin Share (Percent)C.I.F. Value

AGRICULTURAL FOREIGN TRADE DEVELOPMENT
2 0 0 7 A N N U A L
13 28
E X P O R T S
Qua
ntity
Valu
eQ
uant
ityVa
lue
Qua
ntity
Valu
e
I. F
ood
and
Live
Ani
mal
s2,
021.
341,
786.
7713
.13
A. L
ive
Anim
als
(No.
)1.
453.
391,
203,
856
2.33
-100
.00
45.5
3B.
Mea
t and
Mea
t Pre
para
tions
6.73
19.7
24.
406.
2652
.91
215.
03C
. D
airy
Pro
duct
s an
d Bi
rd's
Egg
s36
.59
140.
7134
.25
93.6
86.
8450
.21
D.
Fish
and
Fis
h Pr
epar
atio
ns13
6.94
470.
0812
0.68
386.
2813
.47
21.6
9E.
Cer
eals
and
Cer
eal P
repa
ratio
ns39
.91
70.4
642
.15
61.5
6-5
.31
14.4
6F.
Veg
etab
les
and
Frui
ts3,
132.
211,
025.
843,
219.
4096
1.85
-2.7
16.
65
1. C
ocon
ut P
rodu
cts
138.
0616
0.43
144.
9614
9.16
-4.7
67.
55a.
Fre
sh, y
oung
0.82
0.18
2.10
0.63
-60.
94-7
0.67
b. F
resh
, mat
ured
0.01
0.00
0.04
0.02
-65.
00-8
6.31
c. D
esic
cate
d 13
1.96
159.
3613
6.08
138.
55-3
.03
15.0
2d.
Oth
ers
5.27
0.88
6.73
9.96
-21.
76-9
1.20
2. P
inea
pple
Pro
duct
s58
9.21
247.
8056
6.36
221.
664.
0311
.79
a. F
resh
276.
4057
.70
262.
1354
.55
5.44
5.78
b. D
ried
0.53
1.15
0.08
0.24
563.
4837
7.95
c. P
repa
red/
pres
erve
d19
6.38
122.
4218
5.53
107.
555.
8513
.83
d. J
uice
con
cent
rate
s42
.02
35.3
047
.73
36.9
2-1
1.96
-4.3
8e.
Jui
ce o
ther
than
73
.87
31.2
370
.89
22.4
04.
2139
.40
c
once
ntra
tes
3. B
anan
a2,
251.
0442
2.17
2,34
9.50
442.
20-4
.19
-4.5
3a.
Fre
sh2,
217.
7440
0.85
2,31
1.54
405.
45-4
.06
-1.1
4b.
Cra
cker
s/ch
ips
0.31
0.00
37.9
636
.75
-99.
18-1
00.0
0
4. M
ango
42.9
354
.55
39.2
744
.30
9.32
23.1
2a.
Fre
sh26
.34
23.2
826
.17
24.0
50.
64-3
.17
b. D
ried
2.59
15.2
71.
196.
2811
7.76
143.
22c.
Pur
ee7.
909.
017.
628.
993.
650.
24d.
Jui
ce5.
054.
163.
753.
6034
.56
15.6
9e.
Oth
ers
1.06
2.83
0.54
1.40
95.7
210
2.42
Tabl
e 3.
QU
ANTI
TY A
ND
VAL
UE
OF
PHIL
IPPI
NE
AGR
ICU
LTU
RAL
EXP
OR
TS,
(Qua
ntity
in '0
00 M
.T.,
F.O
.B. V
alue
in M
illio
n U
S $)
Gro
wth
Rat
e (P
erce
nt)
Item
2007
2006
BY
CO
MM
OD
ITY
GR
OU
P, 2
006
- 200
7
Quantity C.I.F. ValueRice 1,805.86 653.51 100.00 100.00
Vietnam 1,377.67 495.06 76.29 75.75Thailand 403.94 149.89 22.37 22.94Pakistan 17.71 6.07 0.98 0.93India 0.64 1.06 0.04 0.16Malaysia 4.14 0.98 0.23 0.15Others 1.76 0.45 0.10 0.07
Milk and Cream and Products 263.80 588.02 100.00 100.00New Zealand 95.13 255.60 36.06 43.47United States of America 41.82 106.58 15.85 18.13Australia 32.99 78.03 12.51 13.27Thailand 26.86 29.60 10.18 5.03Netherlands 6.73 18.98 2.55 3.23Others 60.27 99.23 22.85 16.88
Wheat (including spelt & meslin) 1,795.87 436.86 100.00 100.00United States of America 1,216.36 314.01 67.73 71.88
Canada 361.88 77.97 20.15 17.85China 203.58 41.29 11.34 9.45Australia 9.03 2.31 0.50 0.53Pakistan 4.63 1.11 0.26 0.25Others 0.39 0.17 0.02 0.04
Soyabean Oil/Cake Meal 1,323.48 390.30 100.00 100.00Argentina 912.01 259.09 68.91 66.38United States of America 304.55 100.44 23.01 25.73India 96.93 28.76 7.32 7.37Taiwan 1.72 0.75 0.13 0.19China 1.27 0.42 0.10 0.11Others 7.00 0.84 0.53 0.22
Tobacco, Unmanufactured 58.81 181.34 100.00 100.00Brazil 15.62 50.89 26.56 28.06India 9.75 27.04 16.58 14.91Switzerland 3.71 19.06 6.31 10.51China 5.96 15.49 10.13 8.54Argentina 3.34 11.88 5.68 6.55Others 20.43 56.98 34.74 31.42
Table 8. MAJOR SUPPLIERS OF TOP TEN PHILIPPINE AGRICULTURAL IMPORTS, 2007(Quantity in '000 M.T.; C.I.F. Values in Million US$)
QuantityCommodity/Country of Origin Share (Percent)C.I.F. Value

AGRICULTURAL FOREIGN TRADE DEVELOPMENT
2 0 0 7 A N N U A L
Q
uant
ityVa
lue
Qua
ntity
Valu
eQ
uant
ityVa
lue
5. A
ll O
ther
Fru
its a
nd
110.
9712
0.89
119.
3110
4.53
-6.9
915
.66
V
eget
able
s
G.
Suga
r and
Sug
ar P
repa
ratio
ns32
0.10
132.
3635
1.09
135.
69-8
.83
-2.4
6
1. C
entri
fuga
l Sug
ar12
9.45
49.7
1-1
00.0
0-1
00.0
02.
Mol
asse
s62
.60
5.43
115.
9511
.82
-46.
01-5
4.05
3. O
ther
s10
5.69
74.1
6-1
00.0
0-1
00.0
0
H.
Cof
fee,
Tea
, Coc
oa, S
pice
s
and
Man
ufac
ture
s th
ereo
f4.
7014
.27
4.90
13.2
1-4
.14
8.06
1. C
offe
e1.
006.
031.
136.
15-1
1.47
-1.9
52.
Coc
oa1.
163.
312.
015.
16-4
2.15
-35.
913.
Oth
ers
2.53
4.93
1.76
1.90
43.9
615
9.96
I. F
eedi
ng S
tuff
for A
nim
als
442.
8149
.63
456.
7337
.64
-3.0
531
.85
(e
xclu
ding
unm
illed
Cer
eals
)
J. M
isce
llane
ous
Edib
le P
rodu
cts
47.5
094
.88
48.9
488
.27
-2.9
47.
49
and
Pre
para
tions
II. T
obac
co a
nd T
obac
co
36.5
514
0.87
36.3
213
5.04
0.63
4.32
M
anuf
actu
res
III. C
rude
Mat
eria
ls84
.62
165.
6484
.514
6.19
0.14
13.3
1
A. O
il Se
eds
and
Ole
agin
ous
Frui
ts0.
310.
130.
530.
10-4
1.53
31.8
6B.
Cru
de R
ubbe
r32
.93
42.0
934
.90
46.7
2-5
.65
-9.9
1
1. N
atur
al R
ubbe
r (ot
her t
han
late
x)30
.90
41.1
533
.91
46.5
4-8
.87
-11.
592.
Syn
thet
ic R
ubbe
r; re
clai
med
2.02
0.94
0.99
0.18
104.
5243
3.09
ru
bber
C.
Cru
de F
ertil
izer
0.49
0.51
0.35
0.16
39.5
822
0.60
D.
Cru
de A
nim
al &
Ve g
etab
le
50.8
912
2.91
48.7
299
.21
4.46
23.8
9
Mat
eria
ls (i
nclu
ding
hid
es, s
kins
and
furk
ins,
raw
)
Tabl
e 3.
(C
ontin
ued)
Gro
wth
Rat
e (P
erce
nt)
Item
2007
2006
27 14
Figure 23 VALUE OF RUBBER IMPORTS,
BY QUARTER 2006-2007
5
10
15
20
25
30
1st 2nd 3rd 4th
Quarter
20062007
Figure 22VALUE OF FOOD PREPARATIONS FOR INFANT USE
IMPORTS, BY QUARTER 2006-2007
10
15
20
25
30
35
1st 2nd 3rd 4thQuarter
20062007
Figure 21 VALUE OF UREA IMPORTS,
BY QUARTER 2006-2007
0
7
14
21
28
35
42
1st 2nd 3rd 4th
Quarter
20062007
Figure 24 VALUE OF COFFEE IMPORTS,
BY QUARTER 2006-2007
0
8
16
24
32
1st 2nd 3rd 4th
Quarter
20062007

AGRICULTURAL FOREIGN TRADE DEVELOPMENT
2 0 0 7 A N N U A L
Qua
ntity
Valu
eQ
uant
ityVa
lue
Qua
ntity
Valu
e
IV. A
nim
al a
nd V
eget
able
Oil
and
Fats
931.
8776
9.16
1,12
1.91
614.
95-1
6.94
25.0
8
A. A
nim
al a
nd V
eget
able
Oils
41
.80
35.0
553
.66
35.1
1-2
2.10
-0.1
6
and
Fat
sB.
Fix
ed V
eget
able
Oils
and
Fat
s89
0.06
734.
111,
068.
2657
9.85
-16.
6826
.60
V. F
ertil
izer
Man
ufac
ture
d25
5.85
53.6
435
6.43
83.5
1-2
8.22
-35.
77
VI. A
gric
ultu
ral C
hem
ical
s an
d M
ater
ials
3.33
9.89
2.49
7.76
33.7
827
.36
VII.
Agr
icul
tura
l Mac
hine
ry (N
o.)
793,
456
7.51
507,
082
7.14
56.4
75.
23
A. A
gric
ultu
ral M
achi
nery
134,
726
0.61
108,
021
0.66
24.7
2-7
.05
(exc
ludi
ng tr
acto
rs)
B. T
ract
ors
140.
165
0.00
180.
003,
812.
50C
. Fo
od P
roce
ssin
g M
achi
nery
606,
035
6.39
358,
065
6.17
69.2
53.
61
D.
Agric
ultu
ral S
pray
ers
and
52,6
810.
3540
,991
0.31
28.5
214
.37
Dus
ters
**
TO
TAL
VALU
E O
F A
GR
ICU
LTU
RAL
EXP
OR
TS
** In
clud
es d
rip ir
rigat
ion,
oth
er a
gric
ultu
ral h
ortic
ultu
ral a
pplia
nces
Sou
rce
of b
asic
dat
a: N
SO
3,16
8.07
2,78
1.36
13.9
0
Tabl
e 3.
(C
ontin
ued)
Gro
wth
Rat
e (P
erce
nt)
Item
2007
2006
15 26
Figure 19 VALUE OF TOBACCO UNMANUFACTURED IMPORTS,
BY QUARTER 2006-2007
20
30
40
50
60
70
1st 2nd 3rd 4th
Quarter
20062007
Figure 20 VALUE OF MEAT OF BOVINE ANIMALS IMPORTS,
BY QUARTER 2006-2007
20
25
30
35
40
1st 2nd 3rd 4thQuarter
Valu
e in
M U
SD
20062007
Figure 17 VALUE OF WHEAT IMPORTS,
BY QUARTER 2006-2007
70
90
110
130
150
1st 2nd 3rd 4th
Quarter
20062007
Figure 16 VALUE OF MILK AND CREAM AND PRODUCTS IMPORTS,
BY QUARTER 2006-2007
50
70
90
110
130
150
170
1st 2nd 3rd 4th
Quarter
20062007
Figure 18 VALUE OF SOYABEAN OIL/CAKE MEAL IMPORTS,
BY QUARTER 2006-2007
50
70
90
110
130
1st 2nd 3rd 4th
Quarter
20062007
Figure 15VALUE OF RICE IMPORTS, BY QUARTER
2006-2007
0
40
80
120
160
200
240
1st 2nd 3rd 4th
Quarter
20062007
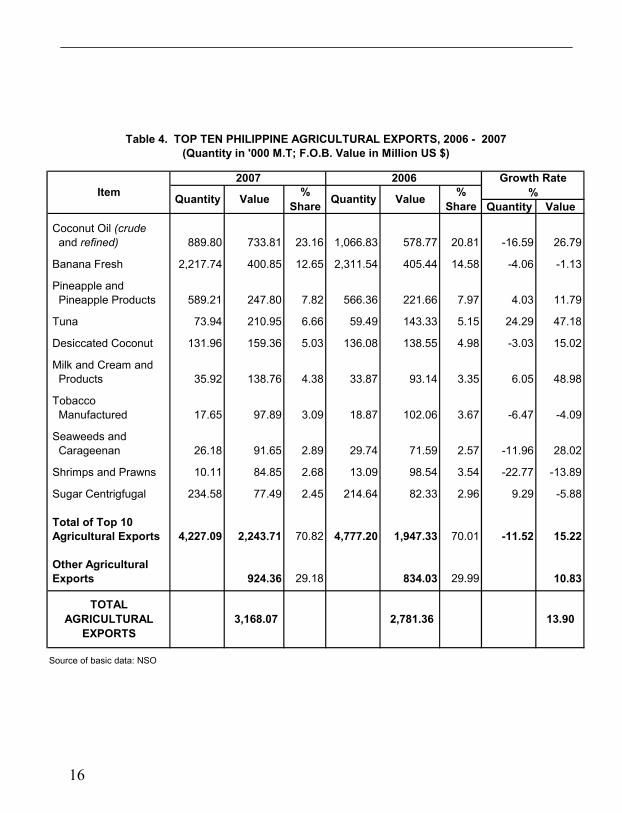
AGRICULTURAL FOREIGN TRADE DEVELOPMENT
2 0 0 7 A N N U A L
25 16
Quantity Value
Coconut Oil (crude and refined) 889.80 733.81 23.16 1,066.83 578.77 20.81 -16.59 26.79
Banana Fresh 2,217.74 400.85 12.65 2,311.54 405.44 14.58 -4.06 -1.13
Pineapple and Pineapple Products 589.21 247.80 7.82 566.36 221.66 7.97 4.03 11.79
Tuna 73.94 210.95 6.66 59.49 143.33 5.15 24.29 47.18
Desiccated Coconut 131.96 159.36 5.03 136.08 138.55 4.98 -3.03 15.02
Milk and Cream and Products 35.92 138.76 4.38 33.87 93.14 3.35 6.05 48.98
Tobacco Manufactured 17.65 97.89 3.09 18.87 102.06 3.67 -6.47 -4.09
Seaweeds and Carageenan 26.18 91.65 2.89 29.74 71.59 2.57 -11.96 28.02
Shrimps and Prawns 10.11 84.85 2.68 13.09 98.54 3.54 -22.77 -13.89
Sugar Centrigfugal 234.58 77.49 2.45 214.64 82.33 2.96 9.29 -5.88
Total of Top 10 Agricultural Exports 4,227.09 2,243.71 70.82 4,777.20 1,947.33 70.01 -11.52 15.22
Other Agricultural Exports 924.36 29.18 834.03 29.99 10.83
Source of basic data: NSO
13.90TOTAL
AGRICULTURAL EXPORTS
2007 2006
3,168.07 2,781.36
Table 4. TOP TEN PHILIPPINE AGRICULTURAL EXPORTS, 2006 - 2007(Quantity in '000 M.T; F.O.B. Value in Million US $)
Growth Rate %Item %
Share%
ShareQuantity Value Quantity Value
1st Q
tr2n
d Q
tr3r
d Q
tr4t
h Q
trTo
tal
1st Q
tr2n
d Q
tr3r
d Q
tr4t
h Q
trTo
tal
Ric
e27
.25
214.
0922
6.30
185.
8765
3.51
189.
6822
9.82
178.
102.
2059
9.80
Milk
and
Cre
am a
nd P
rodu
cts
115.
0115
5.96
149.
0516
7.99
588.
0110
4.77
110.
0997
.36
100.
8241
3.04
Whe
at10
0.70
117.
0397
.98
121.
1543
6.86
104.
7615
9.53
115.
3411
6.16
495.
79
Soy
a Be
an O
il C
ake/
Mea
l10
9.67
73.2
879
.81
127.
5439
0.30
84.6
182
.16
54.3
796
.78
317.
92
Tob
acco
, Una
man
ufac
ture
d50
.03
44.9
737
.38
48.9
618
1.34
26.6
233
.64
60.3
248
.82
169.
40
Mea
t of B
ovin
e An
imal
s33
.34
33.0
339
.76
32.2
213
8.35
28.9
125
.94
29.4
333
.41
117.
69
Ure
a21
.51
41.8
931
.68
29.6
412
4.72
25.6
724
.47
2.95
5.79
58.8
8
Foo
d Pr
epar
atio
ns fo
r Inf
ant
us
e, P
ut u
p fo
r Ret
ail S
ale,
17
.22
33.0
919
.35
27.5
997
.25
19.2
423
.28
23.2
516
.35
82.1
2
of F
lour
, Mea
l, St
arch
or
M
alt E
xtra
ct
Rub
ber
18.6
724
.87
21.9
022
.13
87.5
714
.42
20.3
534
.77
Cof
fee
10.4
213
.36
30.8
914
.80
69.4
76.
637.
0612
.04
25.7
3
Sour
ce o
f bas
ic d
ata:
NS
O
ITEM
2007
2006
Tabl
e 7a
. VA
LUE
OF
TOP
TEN
AG
RIC
ULT
UR
AL IM
POR
TS, B
Y Q
UAR
TER
200
6 - 2
007
(C.I.
F. V
alue
in M
illio
n U
S $)
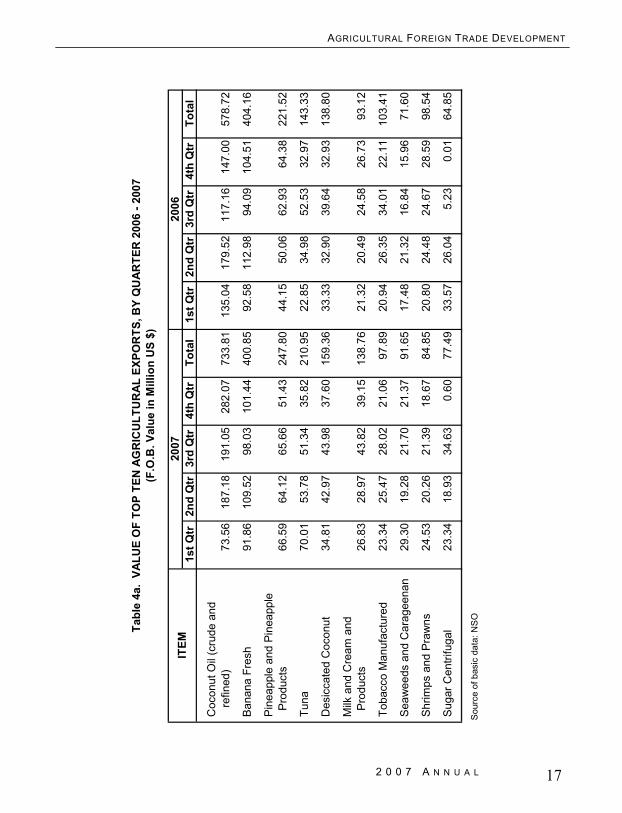
AGRICULTURAL FOREIGN TRADE DEVELOPMENT
2 0 0 7 A N N U A L
Qua
ntity
C.I.
F.
Valu
e
Ric
e1,
805.
8665
3.51
12.6
31,
716.
9451
3.33
11.9
35.
1827
.31
Milk
and
Cre
am a
nd P
rodu
cts
263.
8058
8.02
11.3
627
2.45
413.
419.
61-3
.17
42.2
4
Whe
at (in
clud
ing
spel
t) a
nd1,
795.
8743
6.86
8.44
2,75
5.62
541.
3712
.58
-34.
83-1
9.30
M
eslin
, Unm
illed
Soy
a B
ean
Oil
Cak
e/M
eal
1,32
3.48
390.
37.
541,
356.
2331
4.29
7.30
-2.4
124
.18
Tob
acco
, Unm
anuf
actu
red
58.8
118
1.34
3.50
60.3
216
6.29
3.86
-2.5
09.
05
Mea
t of B
ovin
e A
nim
als
110
4.53
138.
352.
6792
.01
115.
892.
6913
.61
19.3
8
Ure
a50
5.54
124.
722.
4152
5.80
119.
112.
77-3
.85
4.71
Foo
d P
repa
ratio
ns fo
r Inf
ant
us
e, P
ut u
p fo
r Rea
til S
ale,
of
Flo
ur, M
eal,
Sta
rch
or
Mal
t Ext
ract
17.3
297
.25
1.88
16.9
981
.02
1.88
1.94
20.0
3
Rub
ber
48.6
087
.57
1.69
39.9
174
.24
1.73
21.7
717
.96
Cof
fee
30.8
069
.47
1.34
17.1
636
.51
0.85
79.4
990
.28
Tot
al o
f Top
10
Agr
icul
tura
l Im
ports
5,95
4.61
2,76
7.39
53.4
85,
136.
492,
411.
0956
.03
15.9
314
.78
Oth
er A
gric
ultu
ral I
mpo
rts2,
407.
0646
.52
1892
.48
43.9
727
.19
TOTA
L AG
RIC
ULT
UR
ALIM
POR
TS
1/ f
resh
/chi
lled/
froxz
enS
ourc
e of
bas
ic d
ata:
NS
O
4,30
3.57
20
.24
Qua
ntity
C.I.
F.
Valu
e
5,17
4.45
C.I.
F.
Valu
e%
Sh
are
Tabl
e 7.
TO
P TE
N A
GR
ICU
LTU
RAL
IMPO
RTS
, 200
6 - 2
007
(Qua
ntity
in '0
00 M
.T.;
C.I.
F. V
alue
in M
illio
n U
S$)
Item
Gro
wth
Rat
e (P
erce
nt)
2006
Qua
ntity
%
Sh
are
2007
17 24
1st Q
tr2n
d Q
tr3r
d Q
tr4t
h Q
trTo
tal
1st Q
tr2n
d Q
tr3r
d Q
tr4t
h Q
trTo
tal
Coc
onut
Oil
(cru
de a
nd
re
fined
)73
.56
187.
1819
1.05
282.
0773
3.81
135.
0417
9.52
117.
1614
7.00
578.
72
Ban
ana
Fres
h91
.86
109.
5298
.03
101.
4440
0.85
92.5
811
2.98
94.0
910
4.51
404.
16
Pin
eapp
le a
nd P
inea
pple
P
rodu
cts
66.5
964
.12
65.6
651
.43
247.
8044
.15
50.0
662
.93
64.3
822
1.52
Tun
a70
.01
53.7
851
.34
35.8
221
0.95
22.8
534
.98
52.5
332
.97
143.
33
Des
icca
ted
Coc
onut
34.8
142
.97
43.9
837
.60
159.
3633
.33
32.9
039
.64
32.9
313
8.80
Milk
and
Cre
am a
nd
P
rodu
cts
26.8
328
.97
43.8
239
.15
138.
7621
.32
20.4
924
.58
26.7
393
.12
Tob
acco
Man
ufac
ture
d23
.34
25.4
728
.02
21.0
697
.89
20.9
426
.35
34.0
122
.11
103.
41
Sea
wee
ds a
nd C
arag
eena
n29
.30
19.2
821
.70
21.3
791
.65
17.4
821
.32
16.8
415
.96
71.6
0
Shr
imps
and
Pra
wns
24.5
320
.26
21.3
918
.67
84.8
520
.80
24.4
824
.67
28.5
998
.54
Sug
ar C
entri
fuga
l23
.34
18.9
334
.63
0.60
77.4
933
.57
26.0
45.
230.
0164
.85
Sou
rce
of b
asic
dat
a: N
SO
ITEM
2007
2006
Tabl
e 4a
. VA
LUE
OF
TOP
TEN
AG
RIC
ULT
UR
AL E
XPO
RTS
, BY
QU
ARTE
R 2
006
- 200
7(F
.O.B
. Val
ue in
Mill
ion
US
$)

AGRICULTURAL FOREIGN TRADE DEVELOPMENT
2 0 0 7 A N N U A L
23 18 Q
uant
ityC
.I.F.
Val
ueQ
uant
it yC
.I.F.
Val
ueQ
uant
ityC
.I.F.
Val
ue
IV. A
nim
al a
nd V
eget
able
Oil
253.
98
178.
70
324.
7316
3.48
-21.
799.
31
and
Fat
s
A. A
nim
al a
nd V
eget
able
Oils
18
8.46
12
6.92
75
.75
46.5
514
8.79
172.
66
and
Fat
sB.
Fix
ed V
eget
able
Oils
and
Fat
s65
.52
51
.78
248.
9911
6.93
-73.
68-5
5.72
V. F
ertil
izer
Man
ufac
ture
d13
,301
.54
28
9.63
1,
463.
3427
5.00
808.
995.
32
VI. A
gric
ultu
ral C
hem
ical
s an
d 24
9.23
23
1.97
20
5.56
219.
8021
.24
5.54
M
ater
ials
VII.
Agr
icul
tura
l Mac
hine
ry (N
o.)
4.11
59.9
3
5,
727,
900
67.4
7-1
00.0
0-1
1.18
A. A
gric
ultu
ral M
achi
nery
1.
87
16
.54
1,81
6,10
413
.81
-100
.00
19.7
8
(exc
ludi
ng tr
acto
rs)
B. T
ract
ors
0.00
8.23
2,
931
5.67
-100
.00
45.1
8C
. Foo
d Pr
oces
sing
Mac
hine
s1.
82
31
.50
3,14
0,76
544
.88
-100
.00
-29.
82D
. Agr
icul
tura
l Spr
ayer
s 0.
42
3.
67
768,
100
3.11
-100
.00
17.9
3
Dus
ters
*
TOTA
L VA
LUE
OF
AGR
ICU
LTU
RAL
IMPO
RTS
*- In
clud
es d
rip ir
rigat
ion,
oth
er a
gric
ultu
ral o
r hor
ticul
tura
l app
lianc
esS
ourc
e of
bas
ic d
ata:
NS
O
4,91
8.29
4,30
3.57
14.2
8
Tabl
e 6.
(C
ontin
ued) Ite
m20
0720
06G
row
th R
ate
(Per
cent
)
Figure 5VALUE OF COCONUT OIL EXPORTS,
BY QUARTER 2006-2007
60
110
160
210
260
1st 2nd 3rd 4thQuarter
20072006
Figure 6VALUE OF BANANA FRESH EXPORTS,
BY QUARTER 2006-2007
85
95
105
115
1st 2nd 3rd 4thQuarter
20072006
Figure 7VALUE OF PINEAPPLE AND PINEAPPLE PRODUCT EXPORTS,
BY QUARTER 2006-2007
40
45
50
55
60
65
70
1st 2nd 3rd 4thQuarter
20072006
Figure 8VALUE OF TUNA EXPORTS,
BY QUARTER 2006-2007
20
30
40
50
60
70
1st 2nd 3rd 4thQuarter
20072006
Figure 9VALUE OF DESICCATED COCONUT EXPORTS,
BY QUARTER 2006-2007
30
33
36
39
42
45
1st 2nd 3rd 4thQuarter
20072006
Figure 10VALUE OF MILK AND CREAM AND PRODUCTS EXPORT,
BY QUARTER 2006-2007
18
23
28
33
38
43
1st 2nd 3rd 4thQuarter
20072006

AGRICULTURAL FOREIGN TRADE DEVELOPMENT
2 0 0 7 A N N U A L
19 22
I M P O R T S
Qua
ntity
C.I.
F. V
alue
Qua
ntity
C.I.
F. V
alue
Qua
ntity
C.I.
F. V
alue
I. F
ood
and
Live
Ani
mal
s3,
715.
073,
171.
84
17
.13
A. L
ive
Anim
als
(No.
)16
.09
807,
146
19.8
8
-1
00.0
0-1
9.05
B. M
eat a
nd M
eat P
repa
ratio
ns21
5.81
202.
7918
4.63
167.
30
16.8
921
.22
C. D
airy
Pro
duct
s &
Bird
's E
ggs
288.
4265
5.92
295.
6546
6.57
-2
.44
40.5
8D
. Fis
h an
d Fi
sh P
repa
ratio
ns15
6.27
103.
7612
3.34
70.9
5
26
.70
46.2
5E.
Cer
eals
and
Cer
eal P
repa
ratio
ns4,
058.
841,
260.
895,
044.
041,
210.
10
-1
9.53
4.20
F. V
eget
able
s an
d Fr
uits
481.
0119
7.74
532.
9918
9.78
-9
.75
4.19
G. S
ugar
and
Sug
ar P
repa
ratio
ns18
2.27
97.0
821
9.65
111.
31
-17.
02-1
2.79
H. C
offe
e, T
ea, C
ocoa
, Spi
ces
69.2
012
3.85
57.0
497
.62
21.3
226
.87
and
Man
ufac
ture
s th
ereo
fI.
Feed
ing
Stuf
f for
Ani
mal
s1,
725.
8056
3.43
1,70
9.63
461.
14
0.95
22.1
8
(ex
clud
ing
unm
illed
Cer
eals
)J.
Mis
cella
neou
s E
dibl
e Pr
oduc
ts
245.
5449
3.52
221.
3737
7.20
10
.92
30.8
4
an
d Pr
epar
atio
ns
II. T
obac
co a
nd T
obac
co M
anuf
actu
res
59.9
718
8.37
62.0
517
4.42
-3
.35
8.00
III. C
rude
Mat
eria
ls43
7.26
25
4.63
89
4.84
231.
56-5
1.14
9.96
A. O
il S
eeds
and
Ole
agin
ous
Frui
ts28
0.40
94
.63
201.
0157
.49
39.4
964
.60
B. C
rude
Rub
ber
48.6
0
87
.57
40.1
574
.62
21.0
417
.36
C. C
rude
Fer
tiliz
er66
.53
6.74
60
3.57
29.9
3-8
8.98
-77.
49D
. Cru
de A
nim
al &
Veg
etab
le
41.7
3
65
.69
50.1
169
.52
-16.
73-5
.51
Mat
eria
ls (i
nclu
ding
hid
es, s
kins
and
furk
ins,
raw
)
Tabl
e 6.
QU
ANTI
TY A
ND
VAL
UE
OF
PHIL
IPPI
NE
AGR
ICU
LTU
RAL
IMPO
RTS
, B
Y C
OM
MO
DIT
Y G
RO
UP
2006
- 20
07(Q
uant
ity in
'000
M.T
.; C
.I.F
Valu
e in
Mill
ion
US
$)
Item
2007
2006
Gro
wth
Rat
e (P
erce
nt)
Figure 13VALUE OF SHRIMPS AND PRAWNS EXPORTS,
BY QUARTER 2006-2007
18
21
24
27
30
1st 2nd 3rd 4thQuarter
20072006
Figure 12VALUE OF SEAWEEDS AND CARAGEENAN EXPORTS,
BY QUARTER 2006-2007
0
5
10
15
20
25
30
35
40
1st 2nd 3rd 4thQuarter
20072006
Figure 11VALUE OF TOBACCO MANUFACTURED EXPORTS,
BY QUARTER 2006-2007
18
23
28
33
38
1st 2nd 3rd 4thQuarter
20072006
Figure 14VALUE OF CENTRIFUGAL SUGAR EXPORTS ,
BY QUARTER 2006-2007
0
5
10
15
20
25
30
35
40
1st 2nd 3rd 4thQuarter
20072006

AGRICULTURAL FOREIGN TRADE DEVELOPMENT
2 0 0 7 A N N U A L
.
21 20
Quantity Value
Coconut Oil (crude and refined) 888.85 733.81 100.00 100.00 United States of America 376.95 306.07 42.41 41.71 Netherlands 321.32 269.96 36.15 36.79 Japan (excludes Okinawa) 66.25 50.37 7.45 6.86 Malaysia (Federation of Malaysia) 38.98 31.32 4.39 4.27 Korea, Rep of (South) 29.53 24.16 3.32 3.29 Others 55.83 51.92 6.28 7.08
Banana Fresh 2,199.32 396.28 100.00 100.00 Japan (excludes Okinawa) 914.22 175.92 41.57 44.39 Iran 428.74 74.03 19.49 18.68 Korea 275.61 53.10 12.53 13.40 Taiwan 167.16 26.17 7.60 6.60 United Arab Emirates 140.28 22.32 6.38 5.63 Others 273.31 44.74 12.43 11.29
Pineapple and Pineapple Products 589.20 247.80 100.00 100.00 United States of America 199.81 115.99 33.91 46.81 Japan 180.50 42.74 30.63 17.25 Korea 78.21 20.90 13.27 8.43 Netherlands 18.95 14.73 3.22 5.95 Australia 14.30 8.28 2.43 3.34 Others 97.43 45.16 16.54 18.22
Tuna 73.94 210.95 100.00 100.00 United States of America 18.13 69.17 24.53 32.79 Germany 12.49 31.69 16.90 15.02 Japan 7.50 11.79 10.15 5.59 Thailand 1.73 11.23 2.35 5.33 Singapore 4.49 10.57 6.08 5.01 Others 29.58 76.50 40.00 36.26
Desiccated Coconut 131.96 157.43 100.00 100.00 United States of America 34.34 44.55 26.02 28.30 UK Great Britain and N. Ireland 17.49 19.45 13.26 12.35 Canada 8.29 10.24 6.28 6.51 Belgium 8.80 10.17 6.67 6.46 Netherlands 7.91 9.73 5.99 6.18 Others 55.12 63.29 41.77 40.20
Table 5. MAJOR MARKETS OF TOP TEN PHILIPPINE AGRICULTURAL EXPORTS, 2007(Quantity in '000 M.T.; F.O.B. Value in Million US $)
Share (Percent)Commodity/Country of Destination Quantity Value Quantity Value
Milk and Cream and Products 35.92 138.76 100.00 100.00 Indonesia 18.03 67.92 50.19 48.95 Malaysia 9.29 34.94 25.86 25.18 Thailand 4.05 17.28 11.28 12.45 Vietnam 1.63 7.45 4.54 5.37 United States of America 0.89 4.19 2.49 3.02 Others 2.03 6.98 5.64 5.03
Manufactured Tobacco 17.74 97.92 100.00 100.00 Thailand 10.45 63.42 58.91 64.77 Korea 1.64 7.21 9.25 7.36 Vietnam 1.10 7.20 6.20 7.35 Singapore 0.74 4.04 4.19 4.12 Hongkong 0.64 3.37 3.59 3.44 Others 3.17 83.35 17.86 85.12
Seaweeds and Carageenan 26.18 91.65 100.00 100.00 United States Of America 4.47 16.03 17.07 17.49 Denmark 1.56 8.16 5.96 8.91 France 4.12 7.88 15.74 8.60 Belgium 1.28 5.01 4.88 5.46 Thailand 0.91 4.81 3.49 5.25 Others 13.84 79.31 52.86 86.53
Shrimps and Prawns 10.11 84.85 100.00 100.00 Japan 4.52 41.51 44.67 48.92 Korea 2.75 21.03 27.22 24.79 United States of America 1.06 7.75 10.48 9.13 Canada 0.21 2.60 2.05 3.07 Guam 0.36 2.38 3.57 2.80 Others 1.21 9.58 12.00 11.29
Sugar Centrifugal 234.58 77.49 100.00 100.00 United States Of America 176.23 64.18 75.12 82.82 Indonesia (Includes (West Irian) 34.77 7.80 14.82 10.07 Japan (Excludes Okinawa) 22.01 4.90 9.38 6.32 United Arab Emirates 1.57 0.60 0.67 0.77 France 0.01 0.02 0.00 0.02
Source of basic data: NSO
Table 5. (Continued)
Share (Percent)Commodity/Country of Destination Quantity Value

AGRICULTURAL FOREIGN TRADE DEVELOPMENT
2 0 0 7 A N N U A L
19 22
I M P O R T S
Qua
ntity
C.I.
F. V
alue
Qua
ntity
C.I.
F. V
alue
Qua
ntity
C.I.
F. V
alue
I. F
ood
and
Live
Ani
mal
s3,
715.
073,
171.
84
17
.13
A. L
ive
Anim
als
(No.
)16
.09
807,
146
19.8
8
-1
00.0
0-1
9.05
B. M
eat a
nd M
eat P
repa
ratio
ns21
5.81
202.
7918
4.63
167.
30
16.8
921
.22
C. D
airy
Pro
duct
s &
Bird
's E
ggs
288.
4265
5.92
295.
6546
6.57
-2
.44
40.5
8D
. Fis
h an
d Fi
sh P
repa
ratio
ns15
6.27
103.
7612
3.34
70.9
5
26
.70
46.2
5E.
Cer
eals
and
Cer
eal P
repa
ratio
ns4,
058.
841,
260.
895,
044.
041,
210.
10
-1
9.53
4.20
F. V
eget
able
s an
d Fr
uits
481.
0119
7.74
532.
9918
9.78
-9
.75
4.19
G. S
ugar
and
Sug
ar P
repa
ratio
ns18
2.27
97.0
821
9.65
111.
31
-17.
02-1
2.79
H. C
offe
e, T
ea, C
ocoa
, Spi
ces
69.2
012
3.85
57.0
497
.62
21.3
226
.87
and
Man
ufac
ture
s th
ereo
fI.
Feed
ing
Stuf
f for
Ani
mal
s1,
725.
8056
3.43
1,70
9.63
461.
14
0.95
22.1
8
(ex
clud
ing
unm
illed
Cer
eals
)J.
Mis
cella
neou
s E
dibl
e Pr
oduc
ts
245.
5449
3.52
221.
3737
7.20
10
.92
30.8
4
an
d Pr
epar
atio
ns
II. T
obac
co a
nd T
obac
co M
anuf
actu
res
59.9
718
8.37
62.0
517
4.42
-3
.35
8.00
III. C
rude
Mat
eria
ls43
7.26
25
4.63
89
4.84
231.
56-5
1.14
9.96
A. O
il S
eeds
and
Ole
agin
ous
Frui
ts28
0.40
94
.63
201.
0157
.49
39.4
964
.60
B. C
rude
Rub
ber
48.6
0
87
.57
40.1
574
.62
21.0
417
.36
C. C
rude
Fer
tiliz
er66
.53
6.74
60
3.57
29.9
3-8
8.98
-77.
49D
. Cru
de A
nim
al &
Veg
etab
le
41.7
3
65
.69
50.1
169
.52
-16.
73-5
.51
Mat
eria
ls (i
nclu
ding
hid
es, s
kins
and
furk
ins,
raw
)
Tabl
e 6.
QU
ANTI
TY A
ND
VAL
UE
OF
PHIL
IPPI
NE
AGR
ICU
LTU
RAL
IMPO
RTS
, B
Y C
OM
MO
DIT
Y G
RO
UP
2006
- 20
07(Q
uant
ity in
'000
M.T
.; C
.I.F
Valu
e in
Mill
ion
US
$)
Item
2007
2006
Gro
wth
Rat
e (P
erce
nt)
Figure 13VALUE OF SHRIMPS AND PRAWNS EXPORTS,
BY QUARTER 2006-2007
18
21
24
27
30
1st 2nd 3rd 4thQuarter
20072006
Figure 12VALUE OF SEAWEEDS AND CARAGEENAN EXPORTS,
BY QUARTER 2006-2007
0
5
10
15
20
25
30
35
40
1st 2nd 3rd 4thQuarter
20072006
Figure 11VALUE OF TOBACCO MANUFACTURED EXPORTS,
BY QUARTER 2006-2007
18
23
28
33
38
1st 2nd 3rd 4thQuarter
20072006
Figure 14VALUE OF CENTRIFUGAL SUGAR EXPORTS ,
BY QUARTER 2006-2007
0
5
10
15
20
25
30
35
40
1st 2nd 3rd 4thQuarter
20072006
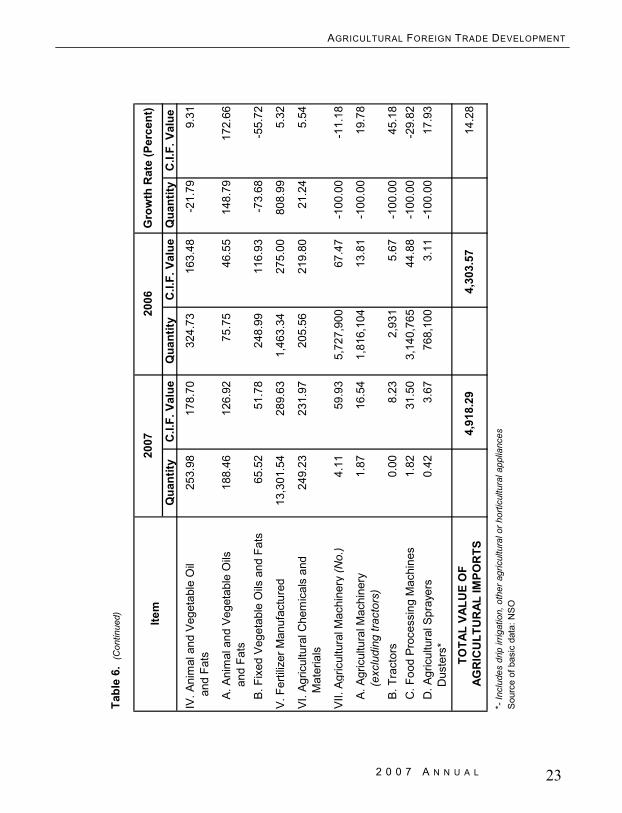
AGRICULTURAL FOREIGN TRADE DEVELOPMENT
2 0 0 7 A N N U A L
23 18
Qua
ntity
C.I.
F. V
alue
Qua
ntity
C.I.
F. V
alue
Qua
ntity
C.I.
F. V
alue
IV. A
nim
al a
nd V
eget
able
Oil
253.
98
178.
70
324.
7316
3.48
-21.
799.
31
and
Fat
s
A. A
nim
al a
nd V
eget
able
Oils
18
8.46
12
6.92
75
.75
46.5
514
8.79
172.
66
and
Fat
sB.
Fix
ed V
eget
able
Oils
and
Fat
s65
.52
51
.78
248.
9911
6.93
-73.
68-5
5.72
V. F
ertil
izer
Man
ufac
ture
d13
,301
.54
28
9.63
1,
463.
3427
5.00
808.
995.
32
VI. A
gric
ultu
ral C
hem
ical
s an
d 24
9.23
23
1.97
20
5.56
219.
8021
.24
5.54
M
ater
ials
VII.
Agr
icul
tura
l Mac
hine
ry (N
o.)
4.11
59.9
3
5,
727,
900
67.4
7-1
00.0
0-1
1.18
A. A
gric
ultu
ral M
achi
nery
1.
87
16
.54
1,81
6,10
413
.81
-100
.00
19.7
8
(exc
ludi
ng tr
acto
rs)
B. T
ract
ors
0.00
8.23
2,
931
5.67
-100
.00
45.1
8C
. Foo
d Pr
oces
sing
Mac
hine
s1.
82
31
.50
3,14
0,76
544
.88
-100
.00
-29.
82D
. Agr
icul
tura
l Spr
ayer
s 0.
42
3.
67
768,
100
3.11
-100
.00
17.9
3
Dus
ters
*
TOTA
L VA
LUE
OF
AGR
ICU
LTU
RAL
IMPO
RTS
*- In
clud
es d
rip ir
rigat
ion,
oth
er a
gric
ultu
ral o
r hor
ticul
tura
l app
lianc
esS
ourc
e of
bas
ic d
ata:
NS
O
4,91
8.29
4,30
3.57
14.2
8
Tabl
e 6.
(C
ontin
ued) Ite
m20
0720
06G
row
th R
ate
(Per
cent
)Figure 5
VALUE OF COCONUT OIL EXPORTS, BY QUARTER 2006-2007
60
110
160
210
260
1st 2nd 3rd 4thQuarter
20072006
Figure 6VALUE OF BANANA FRESH EXPORTS,
BY QUARTER 2006-2007
85
95
105
115
1st 2nd 3rd 4thQuarter
20072006
Figure 7VALUE OF PINEAPPLE AND PINEAPPLE PRODUCT EXPORTS,
BY QUARTER 2006-2007
40
45
50
55
60
65
70
1st 2nd 3rd 4thQuarter
20072006
Figure 8VALUE OF TUNA EXPORTS,
BY QUARTER 2006-2007
20
30
40
50
60
70
1st 2nd 3rd 4thQuarter
20072006
Figure 9VALUE OF DESICCATED COCONUT EXPORTS,
BY QUARTER 2006-2007
30
33
36
39
42
45
1st 2nd 3rd 4thQuarter
20072006
Figure 10VALUE OF MILK AND CREAM AND PRODUCTS EXPORT,
BY QUARTER 2006-2007
18
23
28
33
38
43
1st 2nd 3rd 4thQuarter
20072006

AGRICULTURAL FOREIGN TRADE DEVELOPMENT
2 0 0 7 A N N U A L
Qua
ntity
C.I.
F.
Valu
e
Ric
e1,
805.
8665
3.51
12.6
31,
716.
9451
3.33
11.9
35.
1827
.31
Milk
and
Cre
am a
nd P
rodu
cts
263.
8058
8.02
11.3
627
2.45
413.
419.
61-3
.17
42.2
4
Whe
at (i
nclu
ding
spe
lt) a
nd1,
795.
8743
6.86
8.44
2,75
5.62
541.
3712
.58
-34.
83-1
9.30
M
eslin
, Unm
illed
Soy
a B
ean
Oil
Cak
e/M
eal
1,32
3.48
390.
37.
541,
356.
2331
4.29
7.30
-2.4
124
.18
Tob
acco
, Unm
anuf
actu
red
58.8
118
1.34
3.50
60.3
216
6.29
3.86
-2.5
09.
05
Mea
t of B
ovin
e A
nim
als
110
4.53
138.
352.
6792
.01
115.
892.
6913
.61
19.3
8
Ure
a50
5.54
124.
722.
4152
5.80
119.
112.
77-3
.85
4.71
Foo
d P
repa
ratio
ns fo
r Inf
ant
us
e, P
ut u
p fo
r Rea
til S
ale,
of
Flo
ur, M
eal,
Sta
rch
or
Mal
t Ext
ract
17.3
297
.25
1.88
16.9
981
.02
1.88
1.94
20.0
3
Rub
ber
48.6
087
.57
1.69
39.9
174
.24
1.73
21.7
717
.96
Cof
fee
30.8
069
.47
1.34
17.1
636
.51
0.85
79.4
990
.28
Tot
al o
f Top
10
Agr
icul
tura
l Im
ports
5,95
4.61
2,76
7.39
53.4
85,
136.
492,
411.
0956
.03
15.9
314
.78
Oth
er A
gric
ultu
ral I
mpo
rts2,
407.
0646
.52
1892
.48
43.9
727
.19
TOTA
L AG
RIC
ULT
UR
ALIM
POR
TS
1/ f
resh
/chi
lled/
froxz
enS
ourc
e of
bas
ic d
ata:
NS
O
4,30
3.57
20
.24
Qua
ntity
C.I.
F.
Valu
e
5,17
4.45
C.I.
F.
Valu
e%
Sh
are
Tabl
e 7.
TO
P TE
N A
GR
ICU
LTU
RAL
IMPO
RTS
, 200
6 - 2
007
(Qua
ntity
in '0
00 M
.T.;
C.I.
F. V
alue
in M
illio
n U
S$)
Item
Gro
wth
Rat
e (P
erce
nt)
2006
Qua
ntity
%
Sh
are
2007
17 24 1s
t Qtr
2nd
Qtr
3rd
Qtr
4th
Qt r
Tota
l1s
t Qtr
2nd
Qtr
3rd
Qtr
4th
Qtr
Tota
l
Coc
onut
Oil
(cru
de a
nd
re
fined
)73
.56
187.
1819
1.05
282.
0773
3.81
135.
0417
9.52
117.
1614
7.00
578.
72
Ban
ana
Fres
h91
.86
109.
5298
.03
101.
4440
0.85
92.5
811
2.98
94.0
910
4.51
404.
16
Pin
eapp
le a
nd P
inea
pple
P
rodu
cts
66.5
964
.12
65.6
651
.43
247.
8044
.15
50.0
662
.93
64.3
822
1.52
Tun
a70
.01
53.7
851
.34
35.8
221
0.95
22.8
534
.98
52.5
332
.97
143.
33
Des
icca
ted
Coc
onut
34.8
142
.97
43.9
837
.60
159.
3633
.33
32.9
039
.64
32.9
313
8.80
Milk
and
Cre
am a
nd
P
rodu
cts
26.8
328
.97
43.8
239
.15
138.
7621
.32
20.4
924
.58
26.7
393
.12
Tob
acco
Man
ufac
ture
d23
.34
25.4
728
.02
21.0
697
.89
20.9
426
.35
34.0
122
.11
103.
41
Sea
wee
ds a
nd C
arag
eena
n29
.30
19.2
821
.70
21.3
791
.65
17.4
821
.32
16.8
415
.96
71.6
0
Shr
imps
and
Pra
wns
24.5
320
.26
21.3
918
.67
84.8
520
.80
24.4
824
.67
28.5
998
.54
Sug
ar C
entri
fuga
l23
.34
18.9
334
.63
0.60
77.4
933
.57
26.0
45.
230.
0164
.85
Sou
rce
of b
asic
dat
a: N
SO
ITEM
2007
2006
Tabl
e 4a
. VA
LUE
OF
TOP
TEN
AG
RIC
ULT
UR
AL E
XPO
RTS
, BY
QU
ARTE
R 2
006
- 200
7(F
.O.B
. Val
ue in
Mill
ion
US
$)

AGRICULTURAL FOREIGN TRADE DEVELOPMENT
2 0 0 7 A N N U A L
25 16
Quantity Value
Coconut Oil (crude and refined) 889.80 733.81 23.16 1,066.83 578.77 20.81 -16.59 26.79
Banana Fresh 2,217.74 400.85 12.65 2,311.54 405.44 14.58 -4.06 -1.13
Pineapple and Pineapple Products 589.21 247.80 7.82 566.36 221.66 7.97 4.03 11.79
Tuna 73.94 210.95 6.66 59.49 143.33 5.15 24.29 47.18
Desiccated Coconut 131.96 159.36 5.03 136.08 138.55 4.98 -3.03 15.02
Milk and Cream and Products 35.92 138.76 4.38 33.87 93.14 3.35 6.05 48.98
Tobacco Manufactured 17.65 97.89 3.09 18.87 102.06 3.67 -6.47 -4.09
Seaweeds and Carageenan 26.18 91.65 2.89 29.74 71.59 2.57 -11.96 28.02
Shrimps and Prawns 10.11 84.85 2.68 13.09 98.54 3.54 -22.77 -13.89
Sugar Centrigfugal 234.58 77.49 2.45 214.64 82.33 2.96 9.29 -5.88
Total of Top 10 Agricultural Exports 4,227.09 2,243.71 70.82 4,777.20 1,947.33 70.01 -11.52 15.22
Other Agricultural Exports 924.36 29.18 834.03 29.99 10.83
Source of basic data: NSO
13.90TOTAL
AGRICULTURAL EXPORTS
2007 2006
3,168.07 2,781.36
Table 4. TOP TEN PHILIPPINE AGRICULTURAL EXPORTS, 2006 - 2007(Quantity in '000 M.T; F.O.B. Value in Million US $)
Growth Rate %Item %
Share%
ShareQuantity Value Quantity Value1s
t Qtr
2nd
Qtr
3rd
Qtr
4th
Qtr
Tota
l1s
t Qtr
2nd
Qtr
3rd
Qtr
4th
Qtr
Tota
l
Ric
e27
.25
214.
0922
6.30
185.
8765
3.51
189.
6822
9.82
178.
102.
2059
9.80
Milk
and
Cre
am a
nd P
rodu
cts
115.
0115
5.96
149.
0516
7.99
588.
0110
4.77
110.
0997
.36
100.
8241
3.04
Whe
at10
0.70
117.
0397
.98
121.
1543
6.86
104.
7615
9.53
115.
3411
6.16
495.
79
Soy
a Be
an O
il C
ake/
Mea
l10
9.67
73.2
879
.81
127.
5439
0.30
84.6
182
.16
54.3
796
.78
317.
92
Tob
acco
, Una
man
ufac
ture
d50
.03
44.9
737
.38
48.9
618
1.34
26.6
233
.64
60.3
248
.82
169.
40
Mea
t of B
ovin
e An
imal
s33
.34
33.0
339
.76
32.2
213
8.35
28.9
125
.94
29.4
333
.41
117.
69
Ure
a21
.51
41.8
931
.68
29.6
412
4.72
25.6
724
.47
2.95
5.79
58.8
8
Foo
d Pr
epar
atio
ns fo
r Inf
ant
us
e, P
ut u
p fo
r Ret
ail S
ale,
17
.22
33.0
919
.35
27.5
997
.25
19.2
423
.28
23.2
516
.35
82.1
2
of F
lour
, Mea
l, St
arch
or
M
alt E
xtra
ct
Rub
ber
18.6
724
.87
21.9
022
.13
87.5
714
.42
20.3
534
.77
Cof
fee
10.4
213
.36
30.8
914
.80
69.4
76.
637.
0612
.04
25.7
3
Sour
ce o
f bas
ic d
ata:
NS
O
ITEM
2007
2006
Tabl
e 7a
. VA
LUE
OF
TOP
TEN
AG
RIC
ULT
UR
AL IM
POR
TS, B
Y Q
UAR
TER
200
6 - 2
007
(C.I.
F. V
alue
in M
illio
n U
S $)

AGRICULTURAL FOREIGN TRADE DEVELOPMENT
2 0 0 7 A N N U A L
Qua
ntity
Valu
eQ
uant
ityVa
lue
Qua
ntity
Valu
e
IV. A
nim
al a
nd V
eget
able
Oil
and
Fats
931.
8776
9.16
1,12
1.91
614.
95-1
6.94
25.0
8
A. A
nim
al a
nd V
eget
able
Oils
41
.80
35.0
553
.66
35.1
1-2
2.10
-0.1
6
and
Fat
sB.
Fix
ed V
eget
able
Oils
and
Fat
s89
0.06
734.
111,
068.
2657
9.85
-16.
6826
.60
V. F
ertil
izer
Man
ufac
ture
d25
5.85
53.6
435
6.43
83.5
1-2
8.22
-35.
77
VI. A
gric
ultu
ral C
hem
ical
s an
d M
ater
ials
3.33
9.89
2.49
7.76
33.7
827
.36
VII.
A
gric
ultu
ral M
achi
nery
(No.
)79
3,45
67.
5150
7,08
27.
1456
.47
5.23
A. A
gric
ultu
ral M
achi
nery
134,
726
0.61
108,
021
0.66
24.7
2-7
.05
(exc
ludi
ng tr
acto
rs)
B. T
ract
ors
140.
165
0.00
180.
003,
812.
50C
. Fo
od P
roce
ssin
g M
achi
nery
606,
035
6.39
358,
065
6.17
69.2
53.
61
D.
Agric
ultu
ral S
pray
ers
and
52,6
810.
3540
,991
0.31
28.5
214
.37
Dus
ters
**
TO
TAL
VALU
E O
F A
GR
ICU
LTU
RAL
EXP
OR
TS
** In
clud
es d
rip ir
rigat
ion,
oth
er a
gric
ultu
ral h
ortic
ultu
ral a
pplia
nces
Sou
rce
of b
asic
dat
a: N
SO
3,16
8.07
2,78
1.36
13.9
0
Tabl
e 3.
(C
ontin
ued)
Gro
wth
Rat
e (P
erce
nt)
Item
2007
2006
15 26
Figure 19 VALUE OF TOBACCO UNMANUFACTURED IMPORTS,
BY QUARTER 2006-2007
20
30
40
50
60
70
1st 2nd 3rd 4th
Quarter
20062007
Figure 20 VALUE OF MEAT OF BOVINE ANIMALS IMPORTS,
BY QUARTER 2006-2007
20
25
30
35
40
1st 2nd 3rd 4thQuarter
Valu
e in
M U
SD
20062007
Figure 17 VALUE OF WHEAT IMPORTS,
BY QUARTER 2006-2007
70
90
110
130
150
1st 2nd 3rd 4th
Quarter
20062007
Figure 16 VALUE OF MILK AND CREAM AND PRODUCTS IMPORTS,
BY QUARTER 2006-2007
50
70
90
110
130
150
170
1st 2nd 3rd 4th
Quarter
20062007
Figure 18 VALUE OF SOYABEAN OIL/CAKE MEAL IMPORTS,
BY QUARTER 2006-2007
50
70
90
110
130
1st 2nd 3rd 4th
Quarter
20062007
Figure 15VALUE OF RICE IMPORTS, BY QUARTER
2006-2007
0
40
80
120
160
200
240
1st 2nd 3rd 4th
Quarter
20062007
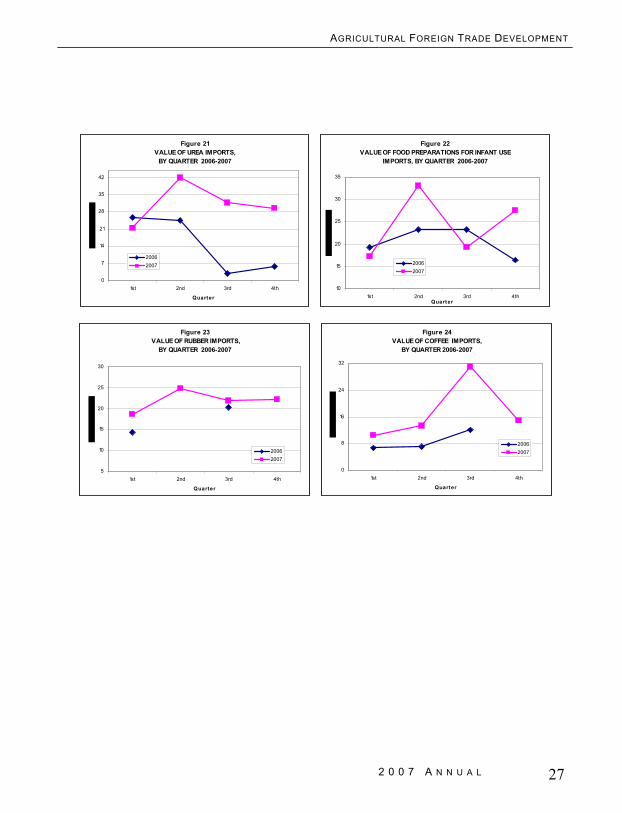
AGRICULTURAL FOREIGN TRADE DEVELOPMENT
2 0 0 7 A N N U A L
Qua
ntity
Valu
eQ
uant
ityVa
lue
Qua
ntity
Valu
e
5. A
ll O
ther
Fru
its a
nd
110.
9712
0.89
119.
3110
4.53
-6.9
915
.66
V
eget
able
s
G.
Suga
r and
Sug
ar P
repa
ratio
ns32
0.10
132.
3635
1.09
135.
69-8
.83
-2.4
6
1. C
entri
fuga
l Sug
ar12
9.45
49.7
1-1
00.0
0-1
00.0
02.
Mol
asse
s62
.60
5.43
115.
9511
.82
-46.
01-5
4.05
3. O
ther
s10
5.69
74.1
6-1
00.0
0-1
00.0
0
H.
Cof
fee,
Tea
, Coc
oa, S
pice
s
and
Man
ufac
ture
s th
ereo
f4.
7014
.27
4.90
13.2
1-4
.14
8.06
1. C
offe
e1.
006.
031.
136.
15-1
1.47
-1.9
52.
Coc
oa1.
163.
312.
015.
16-4
2.15
-35.
913.
Oth
ers
2.53
4.93
1.76
1.90
43.9
615
9.96
I. F
eedi
ng S
tuff
for A
nim
als
442.
8149
.63
456.
7337
.64
-3.0
531
.85
(e
xclu
ding
unm
illed
Cer
eals
)
J. M
isce
llane
ous
Edib
le P
rodu
cts
47.5
094
.88
48.9
488
.27
-2.9
47.
49
and
Pre
para
tions
II. T
obac
co a
nd T
obac
co
36.5
514
0.87
36.3
213
5.04
0.63
4.32
M
anuf
actu
res
III. C
rude
Mat
eria
ls84
.62
165.
6484
.514
6.19
0.14
13.3
1
A. O
il Se
eds
and
Ole
agin
ous
Frui
ts0.
310.
130.
530.
10-4
1.53
31.8
6B.
Cru
de R
ubbe
r32
.93
42.0
934
.90
46.7
2-5
.65
-9.9
1
1. N
atur
al R
ubbe
r (oth
er th
an la
tex)
30.9
041
.15
33.9
146
.54
-8.8
7-1
1.59
2. S
ynth
etic
Rub
ber;
recl
aim
ed2.
020.
940.
990.
1810
4.52
433.
09
rubb
er
C.
Cru
de F
ertil
izer
0.49
0.51
0.35
0.16
39.5
822
0.60
D.
Cru
de A
nim
al &
Ve g
etab
le
50.8
912
2.91
48.7
299
.21
4.46
23.8
9
Mat
eria
ls (i
nclu
ding
hid
es, s
kins
and
furk
ins,
raw
)
Tabl
e 3.
(C
ontin
ued)
Gro
wth
Rat
e (P
erce
nt)
Item
2007
2006
27 14
Figure 23 VALUE OF RUBBER IMPORTS,
BY QUARTER 2006-2007
5
10
15
20
25
30
1st 2nd 3rd 4th
Quarter
20062007
Figure 22VALUE OF FOOD PREPARATIONS FOR INFANT USE
IMPORTS, BY QUARTER 2006-2007
10
15
20
25
30
35
1st 2nd 3rd 4thQuarter
20062007
Figure 21 VALUE OF UREA IMPORTS,
BY QUARTER 2006-2007
0
7
14
21
28
35
42
1st 2nd 3rd 4th
Quarter
20062007
Figure 24 VALUE OF COFFEE IMPORTS,
BY QUARTER 2006-2007
0
8
16
24
32
1st 2nd 3rd 4th
Quarter
20062007

AGRICULTURAL FOREIGN TRADE DEVELOPMENT
2 0 0 7 A N N U A L
13 28
Qua
ntity
Valu
eQ
uant
ityVa
lue
Qua
ntity
Valu
e
I. F
ood
and
Live
Ani
mal
s2,
021.
341,
786.
7713
.13
A. L
ive
Anim
als
(No.
)1.
453.
391,
203,
856
2.33
-100
.00
45.5
3B.
Mea
t and
Mea
t Pre
para
tions
6.73
19.7
24.
406.
2652
.91
215.
03C
. D
airy
Pro
duct
s an
d Bi
rd's
Egg
s36
.59
140.
7134
.25
93.6
86.
8450
.21
D.
Fish
and
Fis
h Pr
epar
atio
ns13
6.94
470.
0812
0.68
386.
2813
.47
21.6
9E.
Cer
eals
and
Cer
eal P
repa
ratio
ns39
.91
70.4
642
.15
61.5
6-5
.31
14.4
6F.
Veg
etab
les
and
Frui
ts3,
132.
211,
025.
843,
219.
4096
1.85
-2.7
16.
65
1. C
ocon
ut P
rodu
cts
138.
0616
0.43
144.
9614
9.16
-4.7
67.
55a.
Fre
sh, y
oung
0.82
0.18
2.10
0.63
-60.
94-7
0.67
b. F
resh
, mat
ured
0.01
0.00
0.04
0.02
-65.
00-8
6.31
c. D
esic
cate
d 13
1.96
159.
3613
6.08
138.
55-3
.03
15.0
2d.
Oth
ers
5.27
0.88
6.73
9.96
-21.
76-9
1.20
2. P
inea
pple
Pro
duct
s58
9.21
247.
8056
6.36
221.
664.
0311
.79
a. F
resh
276.
4057
.70
262.
1354
.55
5.44
5.78
b. D
ried
0.53
1.15
0.08
0.24
563.
4837
7.95
c. P
repa
red/
pres
erve
d19
6.38
122.
4218
5.53
107.
555.
8513
.83
d. J
uice
con
cent
rate
s42
.02
35.3
047
.73
36.9
2-1
1.96
-4.3
8e.
Jui
ce o
ther
than
73
.87
31.2
370
.89
22.4
04.
2139
.40
c
once
ntra
tes
3. B
anan
a2,
251.
0442
2.17
2,34
9.50
442.
20-4
.19
-4.5
3a.
Fre
sh2,
217.
7440
0.85
2,31
1.54
405.
45-4
.06
-1.1
4b.
Cra
cker
s/ch
ips
0.31
0.00
37.9
636
.75
-99.
18-1
00.0
0
4. M
ango
42.9
354
.55
39.2
744
.30
9.32
23.1
2a.
Fre
sh26
.34
23.2
826
.17
24.0
50.
64-3
.17
b. D
ried
2.59
15.2
71.
196.
2811
7.76
143.
22c.
Pur
ee7.
909.
017.
628.
993.
650.
24d.
Jui
ce5.
054.
163.
753.
6034
.56
15.6
9e.
Oth
ers
1.06
2.83
0.54
1.40
95.7
210
2.42
Tabl
e 3.
QU
ANTI
TY A
ND
VAL
UE
OF
PHIL
IPPI
NE
AGR
ICU
LTU
RAL
EXP
OR
TS,
(Qua
ntity
in '0
00 M
.T.,
F.O
.B. V
alue
in M
illio
n U
S $)
Gro
wth
Rat
e (P
erce
nt)
Item
2007
2006
BY
CO
MM
OD
ITY
GR
OU
P, 2
006
- 200
7
Quantity C.I.F. ValueRice 1,805.86 653.51 100.00 100.00
Vietnam 1,377.67 495.06 76.29 75.75Thailand 403.94 149.89 22.37 22.94Pakistan 17.71 6.07 0.98 0.93India 0.64 1.06 0.04 0.16Malaysia 4.14 0.98 0.23 0.15Others 1.76 0.45 0.10 0.07
Milk and Cream and Products 263.80 588.02 100.00 100.00New Zealand 95.13 255.60 36.06 43.47United States of America 41.82 106.58 15.85 18.13Australia 32.99 78.03 12.51 13.27Thailand 26.86 29.60 10.18 5.03Netherlands 6.73 18.98 2.55 3.23Others 60.27 99.23 22.85 16.88
Wheat (including spelt & meslin) 1,795.87 436.86 100.00 100.00United States of America 1,216.36 314.01 67.73 71.88
Canada 361.88 77.97 20.15 17.85China 203.58 41.29 11.34 9.45Australia 9.03 2.31 0.50 0.53Pakistan 4.63 1.11 0.26 0.25Others 0.39 0.17 0.02 0.04
Soyabean Oil/Cake Meal 1,323.48 390.30 100.00 100.00Argentina 912.01 259.09 68.91 66.38United States of America 304.55 100.44 23.01 25.73India 96.93 28.76 7.32 7.37Taiwan 1.72 0.75 0.13 0.19China 1.27 0.42 0.10 0.11Others 7.00 0.84 0.53 0.22
Tobacco, Unmanufactured 58.81 181.34 100.00 100.00Brazil 15.62 50.89 26.56 28.06India 9.75 27.04 16.58 14.91Switzerland 3.71 19.06 6.31 10.51China 5.96 15.49 10.13 8.54Argentina 3.34 11.88 5.68 6.55Others 20.43 56.98 34.74 31.42
Table 8. MAJOR SUPPLIERS OF TOP TEN PHILIPPINE AGRICULTURAL IMPORTS, 2007(Quantity in '000 M.T.; C.I.F. Values in Million US$)
QuantityCommodity/Country of Origin Share (Percent)C.I.F. Value

AGRICULTURAL FOREIGN TRADE DEVELOPMENT
2 0 0 7 A N N U A L
29 12
AUSTRALIAAgricultural Exports 32.62 1.03 0.06 30.76 1.11 0.06 6.05 Agricultural Imports 189.16 3.85 0.33 205.16 4.77 0.38 (7.80)
Agricultural Surplus/Deficit -156.54 -174.4 (10.24)
JAPANAgricultural Exports 444.40 14.03 0.88 418.75 15.06 0.88 6.13 Agricultural Imports 109.78 2.23 0.19 95.94 2.23 0.18 14.43
Agricultural Surplus/Deficit 334.62 322.81 3.66
UNITED STATES OF AMERICA
Agricultural Exports 787.94 24.87 1.56 661.65 23.79 1.40 19.09 Agricultural Imports 833.13 16.94 1.44 847.14 19.68 1.57 (1.65)
Agricultural Surplus/Deficit -45.19 -185.49 (75.64)
ASEANAgricultural Exports 503.43 15.89 1.00 457.35 16.44 0.96 10.08 Agricultural Imports 1,418.82 28.85 2.45 1156.99 26.88 2.14 22.63
Agricultural Surplus/Deficit -915.39 -699.64 30.84
EUROPEAN UNION (EU)Agricultural Exports 619.81 19.56 1.23 477.62 17.17 1.01 29.77 Agricultural Imports 447.28 9.09 0.77 356.32 8.28 0.66 25.53
Agricultural Surplus/Deficit 172.53 121.3 42.23
Rest of the WorldAgricultural Exports 779.86 24.62 1.55 735.23 26.43 1.55 6.07 Agricultural Imports 1,920.14 39.04 3.31 1642.02 38.15 3.04 16.94
Agricultural Surplus/Deficit -1,140.28 -906.79 25.75
*- Percent of Philippine agricultural exports/imports to total trade with each major trading partnersSource of basic data: NSO
Percent to Total
AgriValue
Percent to
Total*
Table 2. AGRICULTURAL TRADE BALANCES WITH MAJOR TRADING PARTNERS OF THE PHILIPPINES, 2006 - 2007
(Export in FOB M US $: Import in CIF M US $)
ItemGrowth
Rate (Percent)
2007 2006
ValuePercent
to Total*
Percent to Total
Agri
Quantity C.I.F. Value
Meat of Bovine Animals 104.53 138.35 100.00 100.00India 62.11 80.95 59.42 28.63Brazil 34.75 44.98 33.24 19.33Australia 3.39 6.42 3.24 18.10United States of America 1.21 2.69 1.16 11.35New Zealand 2.21 2.39 2.11 8.24Others 0.86 0.92 0.82 14.35
Urea 505.54 124.72 483.63 100.00Saudi Arabia 173.06 42.56 165.56 34.12China 118.94 32.29 113.79 25.89Indonesia 94.02 21.60 89.95 17.32Malaysia 49.67 13.45 47.52 10.78Qatar 31.20 8.46 29.85 6.78Others 38.65 6.36 36.98 5.10
Food Preparations for Infant Use 17.32 97.25 3.43 100.00Ireland 8.99 51.05 1.78 52.49Netherlands 1.86 14.33 0.37 14.74Denmark 0.99 9.01 0.20 9.26Malaysia 2.29 6.81 0.45 7.00Germany 1.01 6.72 0.20 6.91Others 2.18 9.33 0.43 9.59
Rubber 48.60 87.57 280.60 100.00Japan 8.15 21.34 47.06 24.37Thailand 9.24 18.06 53.35 20.62United States of America 4.49 10.17 25.92 11.61Korea 5.88 9.38 33.95 10.71Singapore 3.53 7.49 20.38 8.55Others 17.31 21.13 99.94 24.13
Coffee 30.80 69.47 63.37 100.00Vietnam 16.68 28.55 34.32 41.10Indonesia 9.15 24.55 18.83 35.34Malaysia 1.88 7.96 3.87 11.46Singapore 2.47 5.99 5.08 8.62Thailand 0.32 1.60 0.66 2.30Others 0.30 0.82 2.46 1.18
Source of basic data: NSO
Table 8. (Continued)
QuantityCommodity/Country of Origin Share (Percent)C.I.F. Value

AGRICULTURAL FOREIGN TRADE DEVELOPMENT
2 0 0 7 A N N U A L
11 30
Bru
nei
Cam
bodi
aIn
done
sia
Mal
aysi
aM
yanm
arSa
bah
Sara
wak
Sing
apor
eTh
aila
ndVi
etna
m
I. F
ood
and
Live
Ani
mal
s1,
582.
582,
310.
4795
,390
.60
54,8
69.9
910
4.42
274.
2412
.78
53,0
88.3
842
,809
.38
45,9
96.6
729
6,43
9.51
A. L
ive
Anim
als
(No.
)20
9.02
2.00
568.
239.
061.
6813
.85
1.77
805.
61B.
Mea
t and
Mea
t
Pre
para
tions
109.
305.
370.
7244
.71
609.
1871
7.12
1,48
6.40
C. D
airy
Pro
duct
s an
d
Bird
's E
ggs
15.1
468
,884
.28
34,9
36.6
170
.57
595.
247,
456.
064,
189.
2811
6,14
7.18
D. F
ish
& Fi
sh P
repa
ratio
ns85
.99
0.45
1,16
5.81
2,77
5.80
223.
5515
,178
.03
13,3
23.4
62,
541.
0035
,294
.09
E. C
erea
ls a
nd C
erea
l
Pre
para
tions
185.
033.
805,
872.
806,
759.
080.
5341
.36
1,58
1.73
10,0
48.6
937
6.58
24,8
69.6
0F.
Veg
etab
les
and
Frui
ts43
2.88
2.14
5,66
1.92
1,66
4.79
4.41
7.36
30,4
26.3
42,
538.
276,
487.
1747
,225
.28
G. S
ugar
and
Sug
ar
P
repa
ratio
ns93
.41
2,29
2.81
9,14
9.83
2,91
5.39
2.20
594.
134,
749.
3922
,585
.10
42,3
82.2
6H
. Cof
fee,
Tea
, Coc
oa,
Spi
ces
and
Man
ufac
ture
s
th
ereo
f47
.85
819.
3832
2.84
387.
101,
019.
2222
.36
2,61
8.75
I. Fe
edin
g St
uff f
or A
nim
als
(exc
ludi
ng u
nmill
ed C
erea
ls)
28.3
521
9.06
26.4
10.
5493
2.51
335.
458,
298.
340.
00J.
Mis
cella
neou
s E
dibl
e 40
3.96
9.27
3,23
4.63
5,26
6.64
2.50
5.45
4.88
3,33
4.74
2,72
7.89
779.
7215
,769
.68
Prod
ucts
and
Pre
para
tions
II. T
obac
co a
nd T
obac
co
M
anuf
actu
res
14.5
712
1.13
3,60
2.87
3,46
4.54
583.
208,
107.
2963
,422
.58
5,67
2.50
84,9
88.6
8
III. C
rude
Mat
eria
ls8.
454,
397.
3820
,311
.35
17.7
917
.78
7,46
1.48
6,32
6.22
5,57
1.81
44,1
12.2
6
A. O
il Se
eds
& O
leag
inou
s
Fru
its55
.32
11.0
266
.34
B. C
rude
Rub
ber
119.
2017
,847
.89
6,72
7.23
71.2
34,
339.
4729
,105
.02
C. C
rude
Fer
tiliz
er16
2.00
162.
00D
. Cru
de A
nim
al &
Veg
etab
le
Mat
eria
ls (i
nclu
ding
hid
es,
sk
ins
and
furk
ins,
raw
)8.
454,
222.
872,
301.
4617
.79
17.7
872
3.23
6,25
4.99
1,23
2.34
0.00
Tota
l Ph
ilipp
ine
Agric
ultu
ral
Expo
rts
to
ASEA
N
ITEM
A S
E A
N
Tabl
e 9.
DIS
TRIB
UTI
ON
OF
PHIL
IPPI
NE
AGR
ICU
LTU
RAL
EXP
OR
TS T
O A
SEAN
MEM
BER
CO
UN
TRIE
S, 2
007
(F.O
.B. V
alue
in '0
00 U
S$)
TRADE WITH MAJOR TRADING P
Figure 3. PHILIPPINE AGRICULTURAL EXPORTS,
BY QUARTER 2005-2006
550
600
650
700
750
800
850
900
950
1st 2nd 3rd 4thQuarter
20062007
Figure 4. PHILIPPINE AGRICULTURAL IMPORTS,
BY QUARTER 2006-2007
870
945
1020
1095
1170
1245
1320
1395
1st 2nd 3rd 4thQuarter
20062007
Figure 3 PHILIPPINE AGRICULTURAL EXPORTS,
BY QUARTER 2006-2007
Figure 4 PHILIPPINE AGRICULTURAL IMPORTS,
BY QUARTER 2006-2007
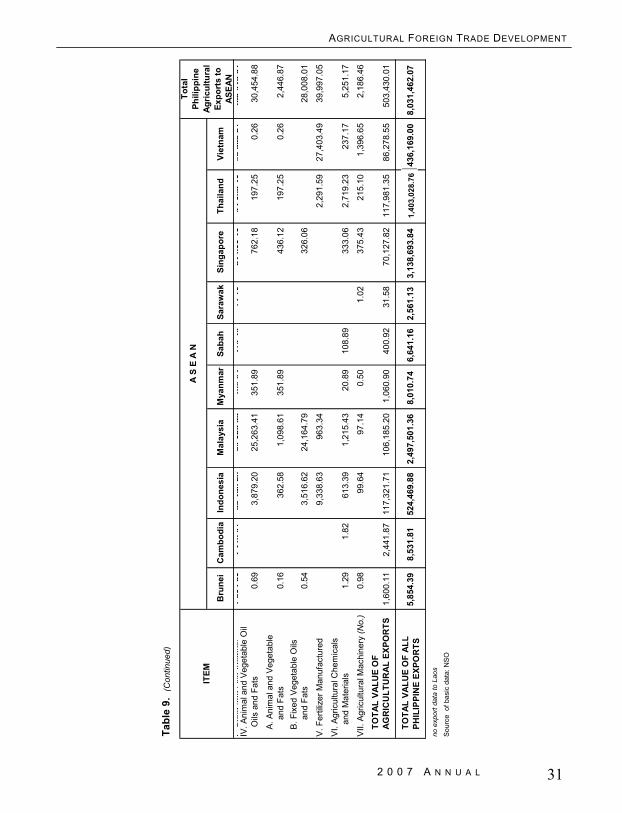
AGRICULTURAL FOREIGN TRADE DEVELOPMENT
2 0 0 7 A N N U A L
31 10
1st Qtr 2nd Qtr 3rd Qtr 4th Qtr TOTAL
Agricultural Exports 606.07 806.93 841.97 913.10 3,168.07
Percent to Annual Agricultural Exports 19.13 25.47 26.58 28.82
Agricultural Imports 973.06 1,267.06 1,282.88 1,395.29 4,918.29
Percent to Annual Agricultural Imports 19.78 25.76 26.08 28.37
Agricultural Trade Surplus/Deficit
1st Qtr 2nd Qtr 3rd Qtr 4th Qtr TOTAL
Agricultural Exports 621.49 760.40 716.73 682.74 2,781.36
Percent to Annual Agricultural Exports 22.34 27.34 25.77 24.55
Agricultural Imports 1,087.76 1,173.04 1,095.33 947.33 4,303.46
Percent to Annual Agricultural Imports 25.28 27.26 25.45 22.01
Agricultural Trade Surplus/Deficit
Source of Basic Data: National Statistics Office (NSO)
Table 1a. PHILIPPINE AGRICULTURAL TRADE, BY QUARTER 2006 - 2007 (Export Value in F.O.B. M US$; Import Value in C.I.F. M US$)
Item
2006
2007
Item
(366.99) (460.13) (440.91) (482.19)
(466.27) (412.64) (264.59) (378.60)
Bru
nei
Cam
bodi
aIn
done
sia
Mal
aysi
aM
yanm
arSa
bah
Sara
wak
Sing
apor
eTh
aila
ndVi
etna
m
IFo
odan
dLi
veA
nim
als
158
258
231
047
9539
060
5486
999
104
4227
424
1278
5308
838
4280
938
4599
667
296
439
51IV
. Ani
mal
and
Veg
etab
le O
il
Oils
and
Fat
s0.
693,
879.
2025
,263
.41
351.
8976
2.18
197.
250.
2630
,454
.88
A. A
nim
al a
nd V
eget
able
a
nd F
ats
0.16
362.
581,
098.
6135
1.89
436.
1219
7.25
0.26
2,44
6.87
B. F
ixed
Veg
etab
le O
ils
a
nd F
ats
0.54
3,51
6.62
24,1
64.7
932
6.06
28,0
08.0
1
V. F
ertil
izer
Man
ufac
ture
d9,
338.
6396
3.34
2,29
1.59
27,4
03.4
939
,997
.05
VI.
Agric
ultu
ral C
hem
ical
s
and
Mat
eria
ls1.
291.
8261
3.39
1,21
5.43
20.8
910
8.89
333.
062,
719.
2323
7.17
5,25
1.17
VII.
Agr
icul
tura
l Mac
hine
ry (N
o.)
0.98
99.6
497
.14
0.50
1.02
375.
4321
5.10
1,39
6.65
2,18
6.46
TOTA
L VA
LUE
OF
AGR
ICU
LTU
RA
L EX
POR
TS1,
600.
112,
441.
8711
7,32
1.71
106,
185.
201,
060.
9040
0.92
31.5
870
,127
.82
117,
981.
3586
,278
.55
503,
430.
01
TOTA
L VA
LUE
OF
ALL
PHIL
IPPI
NE
EXPO
RTS
no e
xpor
t dat
a to
Lao
s
Sour
ce o
f bas
ic d
ata:
NSO
Tabl
e 9.
(C
ontin
ued)
1,40
3.02
8.76
Tota
l Ph
ilipp
ine
Agric
ultu
ral
Expo
rts
to
ASEA
N
ITEM
A S
E A
N
436,
169.
008,
031,
462.
075,
854.
398,
531.
8152
4,46
9.88
2,49
7,50
1.36
8,01
0.74
6,64
1.16
2,56
1.13
3,13
8,69
3.84
1,40
3,02
8.76

AGRICULTURAL FOREIGN TRADE DEVELOPMENT
2 0 0 7 A N N U A L
I. Food and Live Animals 2,021,344.83 27,223.28 383,656.11 446,087.87 A. Live Animals 3,390.96 1,024.62 855.03 B. Meat and Meat Preparations 19,720.83 142.09 13,321.69 210.97 C. Dairy Products & Bird's Eggs 140,709.58 162.89 249.47 1,546.98 D. Fish and Fish Preparations 470,076.58 2,278.59 68,210.16 137,603.84 E. Cereals and Cereal Preparations 70,464.15 4,808.35 3,584.66 9,704.09 F. Vegetables and Fruits 1,025,838.09 15,604.46 274,174.77 209,539.46 G. Sugar and Sugar Preparations 132,359.44 742.83 10,422.19 65,520.92 H. Coffee, Tea, Cocoa Spices 14,270.43 515.25 4,022.19 2,425.37
and Manufactures thereof I. Feeding Stuff for Animals 49,634.14 68.77 4,117.98 255.00
(excluding unmilled Cereals)J. Miscellaneous Edible Products 94,880.83 2,900.05 4,528.38 18,426.21
and PreparationsII. Tobacco and Tobacco Manufactures 140,871.97 1,505.25 451.82 6,842.63 III. Crude Materials 165,652.92 2,495.49 8,057.57 17,816.11
A. Oil Seeds and Oleaginous Fruits 131.86 56.83 B. Crude Rubber 42,093.38 307.28 150.18 C. Crude Fertilizer 509.75 3.20 9.06 D. Crude Animal & Vegetable Materials (including hides, skins and furkins, raw) 122,909.62 2,495.49 7,690.26 17,656.87
IV. Animal and Vegetable Oil and Fats 769,159.41 34.74 50,957.43 314,657.80 A. Animal and Vegetable Oils and Fats 3,505.76 3.37 583.18 8,583.78 B. Fixed Vegetable Oils and Fats 734,108.64 31.37 50,374.25 306,074.02
V. Fertilizer Manufactured 53,640.66 588.50 22.79 VI. Agricultural Chemicals and Materials 9,885.67 745.41 73.55 584.98 VII. Agricultural Machinery 7,509.95 31.85 1,173.03 1,948.43
TOTAL VALUE OF AGRICULTURAL EXPORTS
TOTAL VALUE OF ALLPHILIPPINE EXPORTS
Source of basic data: NSO
JAPAN AND USA, 2007 (F.O.B. Value in '000 US$)
Item
Table 9a. DISTRIBUTION OF PHILIPPINE AGRICULTURAL EXPORTS TO AUSTRALIA,
Total Philippine
Agricultural Australia Japan USA
3,168,065.41 32,624.52 444,392.30 787,937.82
32,981,329.35 528,414.46 7,304,148.30 8,546,805.06
9 32
2007/2006 2006/2005
Agricultural Exports 3,168.07 2,781.36 2,691.19 13.90 3.35
Total Exports 50,465.72 47,410.12 41,254.68 6.45 14.92
Percent of Agricultural Exports Total Exports 6.30 5.87 6.52 7.33 -9.97
Agricultural Imports 4,918.29 4,303.57 3,975.62 14.28 8.25
Total Imports 57,995.75 54,077.99 49,487.42 7.24 9.28
Percent of Agricultural Imports 8.48 7.96 8.03 6.54 -0.87 to Total Imports
Agricultural Trade Surplus/Deficit -1,750.22 -1,522.21 -1,284.43 14.98 18.51
P- preliminarySource of Basic Data: National Statistics Office (NSO)
Table 1. SUMMARY OF PHILIPPINE AGRICULTURAL TRADE, 2005 - 2007(Export Value in F.O.B. M US$; Import Value in C.I.F. M US$)
Growth Rate 2006 2005Item 2007P
F igure 1 SH A R E OF A GR IC ULT UR A L A N D N ON -A GR IC ULT UR A L EXP OR T S T O T OT A L
P H ILIP P IN E EXP OR T S, 2006
Non-Agricultural
94%
Agricultural6%
F igure 2 SH A R E OF A GR IC ULT UR A L A N D N ON -A GR IC ULT UR A L IM P OR T S T O T OT A L
P H ILIP P IN E IM P OR T S, 2006
Agricultural8%
Non-Agricultural
92%
Figure 1SHARE OF AGRICULTURAL AND
NON-AGRICULTURAL EXPORTS TO TOTAL PHILIPPINE IMPORTS, 2007
Figure 2 SHARE OF AGRICULTURAL AND
NON-AGRICULTURAL IMPORTS TO TOTAL PHILIPPINE IMPORTS, 2007
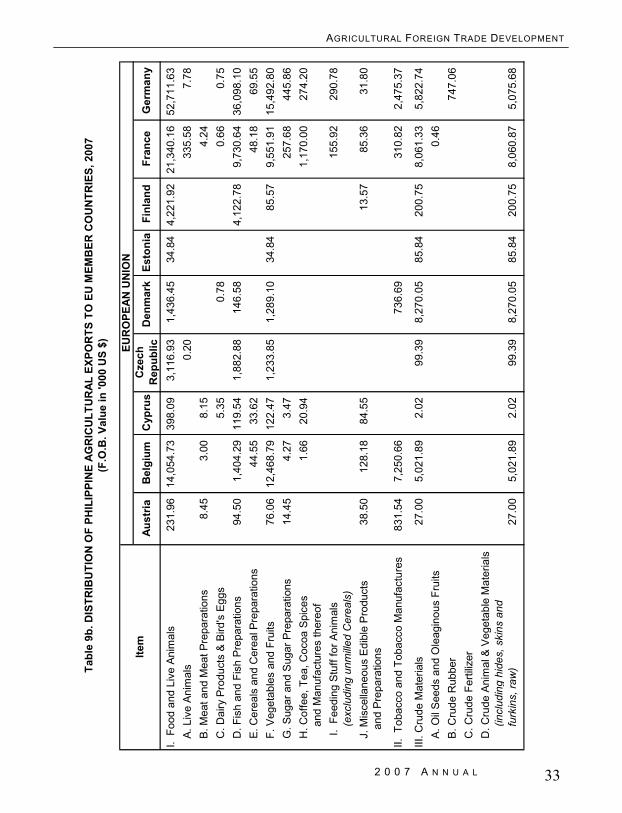
AGRICULTURAL FOREIGN TRADE DEVELOPMENT
2 0 0 7 A N N U A L
33 8
I. F
ood
and
Live
Ani
mal
s23
1.96
14,0
54.7
339
8.09
3,11
6.93
1,43
6.45
34.8
44,
221.
9221
,340
.16
52,7
11.6
3A
. Liv
e A
nim
als
0.20
335.
587.
78B
. Mea
t and
Mea
t Pre
para
tions
8.45
3.00
8.15
4.24
C. D
airy
Pro
duct
s &
Bird
's E
ggs
5.35
0.78
0.66
0.75
D. F
ish
and
Fish
Pre
para
tions
94.5
01,
404.
2911
9.54
1,88
2.88
146.
584,
122.
789,
730.
6436
,098
.10
E. C
erea
ls a
nd C
erea
l Pre
para
tions
44.5
533
.62
48.1
869
.55
F. V
eget
able
s an
d Fr
uits
76.0
612
,468
.79
122.
471,
233.
851,
289.
1034
.84
85.5
79,
551.
9115
,492
.80
G. S
ugar
and
Sug
ar P
repa
ratio
ns14
.45
4.27
3.47
257.
6844
5.86
H. C
offe
e, T
ea, C
ocoa
Spi
ces
1.66
20.9
41,
170.
0027
4.20
and
Man
ufac
ture
s th
ereo
f I.
Fee
ding
Stu
ff fo
r Ani
mal
s15
5.92
290.
78
(e
xclu
ding
unm
illed
Cer
eals
)J.
Mis
cella
neou
s E
dibl
e P
rodu
cts
38.5
012
8.18
84.5
513
.57
85.3
631
.80
and
Pre
para
tions
II. T
obac
co a
nd T
obac
co M
anuf
actu
res
831.
547,
250.
6673
6.69
310.
822,
475.
37
III. C
rude
Mat
eria
ls27
.00
5,02
1.89
2.02
99.3
98,
270.
0585
.84
200.
758,
061.
335,
822.
74A
. Oil
See
ds a
nd O
leag
inou
s Fr
uits
0.46
B. C
rude
Rub
ber
747.
06C
. Cru
de F
ertil
izer
D. C
rude
Ani
mal
& V
eget
able
Mat
eria
ls
(i
nclu
ding
hid
es, s
kins
and
furk
ins,
raw
)27
.00
5,02
1.89
2.02
99.3
98,
270.
0585
.84
200.
758,
060.
875,
075.
68
(F.O
.B. V
alue
in '0
00 U
S $)
Den
mar
kFi
nlan
dFr
ance
Ger
man
y
Tabl
e 9b
. DIS
TRIB
UTI
ON
OF
PHIL
IPPI
NE
AGR
ICU
LTU
RAL
EXP
OR
TS T
O E
U M
EMB
ER C
OU
NTR
IES,
200
7
EUR
OPE
AN U
NIO
NIte
mAu
stria
Bel
gium
Cyp
rus
Cze
ch
Rep
ublic
Esto
nia

AGRICULTURAL FOREIGN TRADE DEVELOPMENT
2 0 0 7 A N N U A L
Tabl
e 9b
. (C
ontin
ued)
IV.
Ani
mal
and
Veg
etab
le O
il an
d Fa
ts2,
299.
4110
2.10
2.30
26.6
04,
150.
24
A. A
nim
al a
nd V
eget
able
Oils
and
Fat
s2,
299.
4126
.53
3,88
8.58
B. F
ixed
Veg
etab
le O
ils a
nd F
ats
V.
Ferti
lizer
Man
ufac
ture
d10
2.10
2.30
0.07
261.
67
VI.
Agr
icul
tura
l Che
mic
als
and
Mat
eria
ls5.
846.
250.
035.
96
VII.
Agr
icul
tura
l Mac
hine
ry0.
518.
86
TOTA
L VA
LUE
OF
AGR
ICU
LTU
RAL
EXP
OR
TS1,
090.
5028
,632
.53
400.
113,
216.
3210
,551
.54
120.
684,
425.
5129
,738
.91
65,1
74.8
0
TOTA
L VA
LUE
OF
ALL
PHIL
IPPI
NE
EXPO
RTS
Sou
rce
of b
asic
dat
a: N
SO
Ger
man
y
69,1
87.9
1
666,
284.
79
1,82
9.40
72
,497
.80
32
,598
.05
2,
312.
77
79,7
31.3
8
265,
398.
84
2,14
9,34
6.68
Item
EUR
OPE
AN U
NIO
N
Aust
riaB
elgi
umC
ypru
sC
zech
R
epub
licD
enm
ark
Esto
nia
Finl
and
Fran
ce
7 34
STATISTICALTable

AGRICULTURAL FOREIGN TRADE DEVELOPMENT
2 0 0 7 A N N U A L
35 6
I. F
ood
and
Live
Ani
mal
s2,
570.
0093
7.61
1,76
9.23
13,7
02.6
636
5.90
574.
281.
8044
1.11
37,7
01.0
5A.
Liv
e An
imal
s 0.
380.
0637
.84
B. M
eat a
nd M
eat P
repa
ratio
ns4.
8816
.70
22.4
522
.52
C. D
airy
Pro
duct
s &
Bird
's E
ggs
57.0
60.
2012
.62
0.11
D. F
ish
and
Fish
Pre
para
tions
1,61
1.10
78.7
386
6.19
8,43
1.88
98.8
523
7.18
414.
565,
054.
63E.
Cer
eals
and
Cer
eal P
repa
ratio
ns45
.62
32.6
542
4.73
719.
67F.
Veg
etab
les
and
Frui
ts63
3.13
850.
4863
9.57
2,68
4.08
267.
0629
6.10
23.6
930
,017
.79
G. S
ugar
and
Sug
ar P
repa
ratio
ns2.
6416
.31
440.
262.
8620
2.95
H. C
offe
e, T
ea, C
ocoa
Spi
ces
107.
7813
.56
15.3
241
.00
10.9
3
a
nd M
anuf
actu
res
ther
eof
I. F
eedi
ng S
tuff
for A
nim
als
255.
00
(e
xclu
ding
unm
illed
Cer
eals
)J.
Mis
cella
neou
s Ed
ible
Pro
duct
s 10
7.81
8.40
183.
671,
671.
261.
801,
379.
62
an
d Pr
epar
atio
ns
II. T
obac
co a
nd T
obac
co M
anuf
actu
res
59.4
011
9.56
68.4
779
.00
488.
78
III. C
rude
Mat
eria
ls58
.24
60.3
01,
291.
196.
1682
7.79
A. O
il Se
eds
and
Ole
agin
ous
Frui
tsB.
Cru
de R
ubbe
r85
.68
C. C
rude
Fer
tiliz
erD
. Cru
de A
nim
al &
Veg
etab
le M
ater
ials
58
.24
60.3
01,
291.
196.
1682
7.79
(i
nclu
ding
hid
es, s
kins
and
furk
ins,
raw
)
Irela
ndIta
lyLi
thua
nia
Tabl
e 9b
. (C
ontin
ued)
EUR
OPE
AN U
NIO
NIte
mLa
tvia
Luxe
mbo
urg
Mal
taN
ethe
rland
sG
reec
eH
unga
ry

AGRICULTURAL FOREIGN TRADE DEVELOPMENT
2 0 0 7 A N N U A L
Tabl
e 9b
. (C
ontin
ued)
IV.
Ani
mal
and
Veg
etab
le O
il an
d Fa
ts31
,435
.06
40.5
727
2,57
1.82
A. A
nim
al a
nd V
eget
able
Oils
and
Fat
s11
9.77
2,61
4.47
B. F
ixed
Veg
etab
le O
ils a
nd F
ats
31,3
15.3
040
.57
269,
957.
35
V. F
ertil
izer
Man
ufac
ture
d
VI. A
gric
ultu
ral C
hem
ical
s an
d M
ater
ials
0.80
31.2
02.
16
VII.
Agr
icul
tura
l Mac
hine
ry29
6.29
3.96
TOTA
L VA
LUE
OF
AGR
ICU
LTU
RAL
EXP
OR
TS2,
628.
2499
7.01
1,97
8.38
46,5
28.5
844
4.90
614.
851.
8044
7.27
311,
595.
56
TOTA
L VA
LUE
OF
ALL
PHIL
IPPI
NE
EXPO
RTS
Sou
rce
of b
asic
dat
a: N
SOItem
EUR
OPE
AN U
NIO
NG
reec
eH
unga
ryIre
land
Italy
Latv
iaLi
thun
iaLu
xem
bour
gM
alta
Net
herla
nds
16,4
80.7
2
78,1
28.7
6
69,8
11.4
8
202,
842.
77
660.
81
1,37
0.15
3,
013.
66
22,1
46.1
2
4,14
9,52
2.31
5 36
• Sugar. A downtrend in international sugar prices was exhibited in the first half of 2007 and it registered its lowest level in June at US$0.205/kg. Prices recovered in the second half with the highest price posted at US$ 0.235/kg in December.
• Soybean. Better world prices were accorded to soybean throughout
the year. The highest quotation was registered at US$0.515/kg in December.
• Rice. For this year, similar trend was noted for the international prices of rice regardless of the percentage broken. Prices were higher than in the previous year. Surges were more pronounced towards the end of the year with the highest quotation noted in December.
• Maize. International price of maize fluctuated during the first nine months of 2007. The highest price was recorded in December at US$0.180/kg while the lowest at US$0.147/kg was noted in July. Rising prices were sustained from October until the end of the year.
• Coffee Arabica. Prices of coffee, Arabica in the world market
generally increased in 2007 and the highest quotation was registered at US$21.39/kg in October.
• Coffee Robusta. In 2007, monthly prices of coffee, robusta were
higher compared with last year’s quotations. These ranged from US$1.698/kg in March to US$ 2.043/kg in June.
• Banana. World prices of banana dropped in the first five (5) months of
the year compared with the previous year’s quotation. Prices recovered in June until the end of the year at a decreasing rate. Lowest prices were noted in March, April and December.
• Rubber. Generally, prices were higher compared with 2006. Surges of
about 40% were noted in the last two (2) months of the year.

AGRICULTURAL FOREIGN TRADE DEVELOPMENT
2 0 0 7 A N N U A L
Ta
ble
9b. (
Con
tinue
d)
I. F
ood
and
Live
Ani
mal
s2,
481.
732,
702.
541,
152.
6117
,574
.05
5,14
1.06
38,4
89.1
123
1,28
8.00
A. L
ive
Ani
mal
s 0.
0311
2.05
300.
28B.
Mea
t and
Mea
t Pre
para
tions
5.72
3.95
108.
41C
. Dai
ry P
rodu
cts
& Bi
rd's
Egg
s77
.62
225.
34D
. Fis
h an
d Fi
sh P
repa
ratio
ns37
1.55
2,64
0.09
1,08
6.78
10,8
79.2
72,
784.
406,
517.
4670
,821
.41
E. C
erea
ls a
nd C
erea
l Pre
para
tions
2.06
67.9
28.
4653
4.70
3,16
8.62
F. V
eget
able
s an
d Fr
uits
2,06
6.16
35.3
030
.45
6,15
2.12
2,14
3.20
28,3
21.1
314
2,95
0.10
G. S
ugar
and
Sug
ar P
repa
ratio
ns36
.34
61.0
11,
356.
713,
778.
95H
. Cof
fee,
Tea
, Coc
oa S
pice
s 0.
370.
0845
.83
292.
08
a
nd M
anuf
actu
res
ther
eof
I. F
eedi
ng S
tuff
for A
nim
als
44.0
235
.38
202.
6931
5.00
1,70
4.18
(exc
ludi
ng u
nmille
d C
erea
ls)
J. M
isce
llane
ous
Edib
le P
rodu
cts
25.0
922
9.58
143.
911,
204.
687,
938.
70
an
d Pr
epar
atio
ns
II. T
obac
co a
nd T
obac
co M
anuf
actu
res
178.
1866
9.59
97.0
23,
193.
57
III. C
rude
Mat
eria
ls1,
132.
8137
.20
4,51
4.07
1.20
10,9
97.4
246
,603
.08
A. O
il Se
eds
and
Ole
agin
ous
Frui
ts0.
46B.
Cru
de R
ubbe
r83
2.74
C. C
rude
Fer
tiliz
er0.
00D
. Cru
de A
nim
al &
Ve g
etab
le M
ater
ials
(inc
ludi
ng h
ides
, ski
ns a
nd
fu
rkin
s, ra
w)
1,13
2.81
37.2
04,
514.
07
1.20
10,9
97.4
2
45,7
69.8
7
Swed
enU
K G
reat
Brit
ain
and
N. I
rela
ndIte
mEU
RO
PEAN
UN
ION
Tota
l Phi
l. Ag
ricul
tura
l Ex
port
s to
EU
Pola
ndPo
rtug
alSl
oven
iaSp
ain
37 4
• Importation of milk and cream and products increased by 42.24%. From US$413.41 million in 2006, it went up to US$588.02 million with the biggest importation recorded during the 4th quarter. The major sources were New Zealand, Australia, United States of America, Thailand and Netherlands
• The increase in the foreign disbursement for meat of bovine animals
displaced urea in the 6th place in the major agricultural imports. In 2007, importation of meat of bovine animals reached US$138.35 million, an increase of 19.38% from 2006. India, Brazil, Australia, USA and New Zealand were the major sources of imports.
The country realized a remarkable increase in importation of rubber and coffee displacing maize and palm oil from the list of top 10 imports.
• Coffee which was not formerly included in the top ten agricultural
imports landed on the 10th place in 2007. The country spent US$69.47 million for this commodity, about 90% higher than in the previous year. Vietnam supplied about 41.10% and Indonesia brought in 35.34%.
• Importation of rubber reached US$87.57 million in 2007; it increased
by 17.96% compared to previous year’s level. The country’s major suppliers were Japan, Thailand, USA, Korea and Singapore.
• Despite the decrease in the import expenses for wheat by 19.30%, this
commodity remained in the list of top imports. The biggest importation was registered in the fourth quarter of the year. Wheat imports were mostly coming from the USA with 71.88% of the total importation. Other suppliers were Canada, China, Australia and Pakistan.
5. World Price Trends
• Coconut oil and Copra. World prices of coconut oil and copra
showed similar patterns. World prices were going-up during the first half of the year. These started to go down in July but recovered in September until the end of the year. The lowest and highest prices were registered in January and December, respectively.
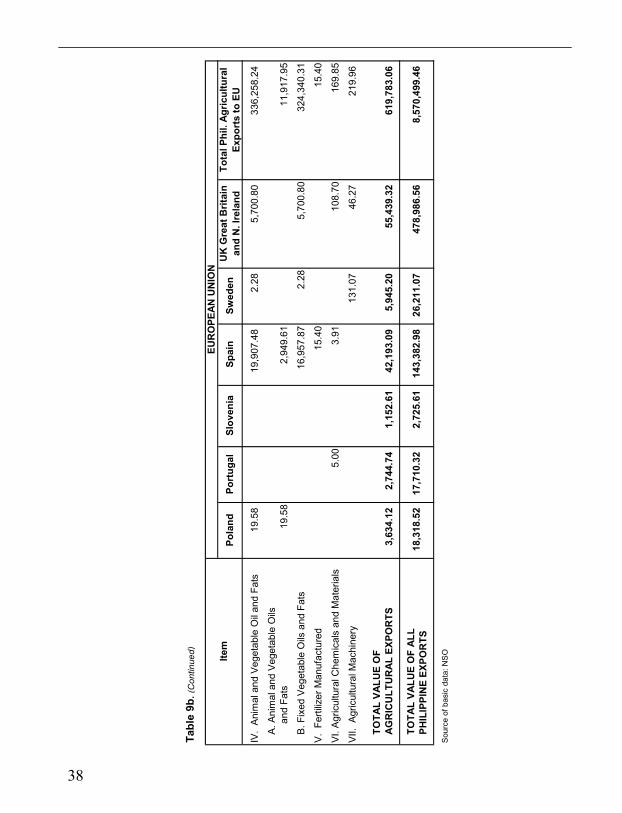
AGRICULTURAL FOREIGN TRADE DEVELOPMENT
2 0 0 7 A N N U A L
Tabl
e 9b
. (C
ontin
ued)
IV.
Anim
al a
nd V
eget
able
Oil
and
Fats
19.5
819
,907
.48
2.28
5,70
0.80
336,
258.
24
A. A
nim
al a
nd V
eget
able
Oils
and
Fat
s19
.58
2,94
9.61
11,9
17.9
5
B. F
ixed
Veg
etab
le O
ils a
nd F
ats
16,9
57.8
72.
285,
700.
8032
4,34
0.31
V. F
ertil
izer
Man
ufac
ture
d15
.40
15.4
0
VI. A
gric
ultu
ral C
hem
ical
s an
d M
ater
ials
5.00
3.91
108.
7016
9.85
VII.
Agr
icul
tura
l Mac
hine
ry13
1.07
46.2
721
9.96
TOTA
L VA
LUE
OF
AGR
ICU
LTU
RAL
EXP
OR
TS3,
634.
122,
744.
741,
152.
6142
,193
.09
5,94
5.20
55,4
39.3
261
9,78
3.06
TOTA
L VA
LUE
OF
ALL
PHIL
IPPI
NE
EXPO
RTS
Sou
rce
of b
asic
dat
a: N
SOIte
mEU
RO
PEAN
UN
ION
Pola
ndPo
rtug
alSl
oven
iaSp
ain
Swed
enU
K G
reat
Brit
ain
and
N. I
rela
ndTo
tal P
hil.
Agric
ultu
ral
Expo
rts
to E
U
18,3
18.5
2
17,7
10.3
2
2,72
5.61
143,
382.
98
26,2
11.0
7
478,
986.
56
8,
570,
499.
46
3 38
Income from four (4) major export commodities declined in 2007. Reductions ranged from 1.13% (Banana Fresh) to 13.89% (Shrimps and Prawns).
• Export earnings from fresh banana declined by 1.13%. From
US$405.44 million in 2006, export revenues decreased to US$400.85 million in 2007. The three (3) major markets which registered reductions in export transactions with the Philippines included United Arab Emirates by 31.97%, Taiwan by 21.21% and Iran by 18.15%.
• Exportation of manufactured tobacco slid from US$102.06 million
during the previous year to US$97.89 million in 2007. Major markets were Thailand (64.77%), Korea (7.36%), Vietnam (7.35%), Singapore (4.12%) and Hongkong (3.44%).
• Export receipts from shrimps and prawns which amounted to
US$84.85 million were down by 13.89% from last year’s receipts of US$98.54 million. The highest volume of exports was registered during the 1st quarter while the lowest was in the 4th quarter of the year. Destination points were Japan, Korea, USA, Canada and Guam.
• Export earnings from centrifugal sugar which amounted to US$77.49
million, declined by 5.88% from last year’s income of US$82.33 Foreign markets were USA, Indonesia, Japan, United Arab Emirates and France.
4. Agricultural Imports
Increased import expenditures were registered for most of the top 10 import commodities.
• For this year, rice was the top agricultural import displacing wheat. The
country spent US$653.51 million for rice and registered a 27.31% increase from the 2006 level. The bulk or 75.75% of the Philippine rice imports were again sourced from Vietnam. The highest value of importation for 2007 was registered on the second quarter.
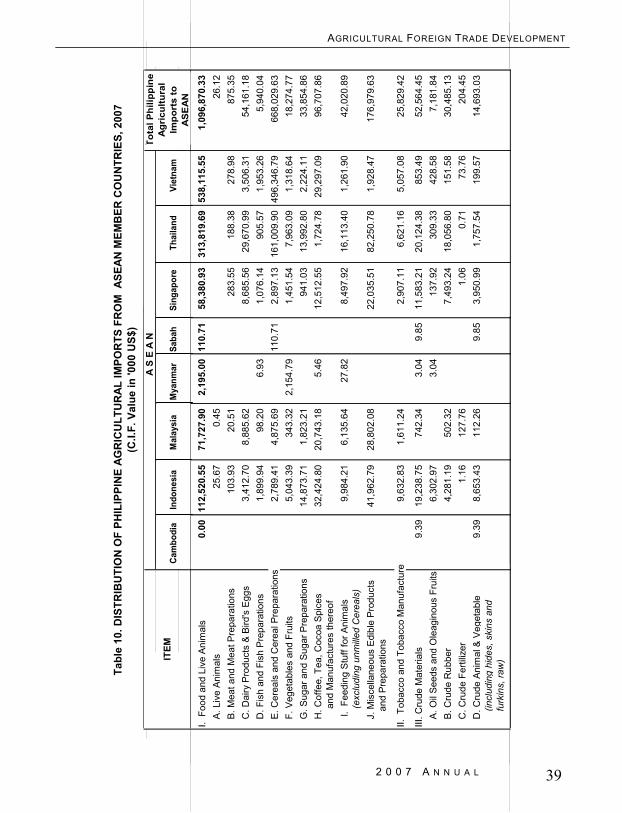
AGRICULTURAL FOREIGN TRADE DEVELOPMENT
2 0 0 7 A N N U A L
39 2
• There was still a wide imbalance in the Philippine agricultural trade with the ASEAN countries. This year’s trade deficit of US$915.39 million was 30.84% higher than last year’s deficit of US$699.64.
• The country’s exchange of commodities with USA and Australia
recorded decreases in trade deficits by 10.24% and 75.64%, respectively. Trade with the rest of the world was characterized by higher import expenses which negated the increase in export receipts. The net effect was a wider gap in agricultural trade balance at 25.75%.
3. Agricultural Exports
Most of the top 10 export commodities registered gains in export earnings compared with last year’s proceeds.
• Milk and cream and their by-products and tuna led the major gainers
among agricultural exports with 48.98% and 47.18% increases, respectively. These effected the rise of milk and cream and their by-products from 8th placer in the previous year to 6th placer this year. Tuna maintained its position in the fourth rank. Indonesia remained to be the country’s top destination of milk and cream and their by-products with 48.95% share in the total value of the country’s exports for this product. On the other hand, 32.79% of the Philippine tuna export went to USA.
• Crude and refined coconut oil continued as the country’s top
agricultural exports. There was a 26.79% increase in its exports value, a turn-around from the last year’s negative growth of 11.94%. The highest volume of exportation was recorded during the last quarter of the year. The major markets were Netherlands with 41.71% share and USA with 36.79%.
• Export earnings from seaweeds and carageenan increased by
28.02%, that is, from US$ 71.59 million in 2006 to US$ 91.65 million in 2007. This brought the item to the 8th place which displaced fertilizer, manufactured in the top 10 list of agricultural imports. The major destination countries included USA (17.49%), Denmark (8.91%), France (8.60%), Belgium (5.46%) and Thailand (5.25%).
Tabl
e 10
. DIS
TRIB
UTI
ON
OF
PHIL
IPPI
NE
AGR
ICU
LTU
RAL
IMPO
RTS
FR
OM
ASE
AN M
EMB
ER C
OU
NTR
IES,
200
7(C
.I.F.
Val
ue in
'000
US$
)
108
428
380
448
116
504
0.00
0.00
112,
520.
5571
,727
.90
2,19
5.00
110.
7125
.67
0.45
ratio
ns10
3.93
20.5
1s
Egg
s3,
412.
708,
885.
62at
ions
1,89
9.94
98.2
06.
93re
para
tions
2,78
9.41
4,87
5.69
110.
715,
043.
3934
3.32
2,15
4.79
para
tions
14,8
73.7
11,
823.
21pi
ces
32,4
24.8
020
,743
.18
5.46
reof
mal
s9,
984.
216,
135.
6427
.82
erea
ls)
Prod
ucts
41
,962
.79
28,8
02.0
8
Man
ufac
ture
s9,
632.
831,
611.
24
0.00
9.39
19,2
38.7
574
2.34
3.04
9.85
nous
Fru
its6,
302.
973.
044,
281.
1950
2.32
1.16
127.
76
tabl
e 9.
398,
653.
4311
2.26
9.85
and
Cam
bodi
aB
rune
i
A S
E A
N
Saba
hM
yanm
arM
alay
sia
Indo
nesi
aS
I. F
ood
and
Live
Ani
mal
sA
. Liv
e A
nim
als
B. M
eat a
nd M
eat P
repa
ratio
nsC
. Dai
ry P
rodu
cts
& B
ird's
Egg
sD
. Fis
h an
d Fi
sh P
repa
ratio
nsE
. Cer
eals
and
Cer
eal P
repa
ratio
nsF.
Veg
etab
les
and
Frui
tsG
. Sug
ar a
nd S
ugar
Pre
para
tions
H. C
offe
e, T
ea, C
ocoa
Spi
ces
and
Man
ufac
ture
s th
ereo
f I.
Fee
ding
Stu
ff fo
r Ani
mal
s
(e
xclu
ding
unm
illed
Cer
eals
)J.
Mis
cella
neou
s E
dibl
e P
rodu
cts
and
Pre
para
tions
II. T
obac
co a
nd T
obac
co M
anuf
actu
res
III. C
rude
Mat
eria
lsA
. Oil
See
ds a
nd O
leag
inou
s Fr
uits
B. C
rude
Rub
ber
C. C
rude
Fer
tiliz
erD
. Cru
de A
nim
al &
Ve g
etab
le
(incl
udin
g hi
des,
ski
ns a
nd
furk
ins,
raw
)
BIT
EM
720
780
892
58,3
80.9
331
3,81
9.69
538,
115.
551,
096,
870.
3326
.12
283.
5518
8.38
278.
9887
5.35
8,68
5.56
29,6
70.9
93,
506.
3154
,161
.18
1,07
6.14
905.
571,
953.
265,
940.
042,
897.
1316
1,00
9.90
496,
346.
7966
8,02
9.63
1,45
1.54
7,96
3.09
1,31
8.64
18,2
74.7
794
1.03
13,9
92.8
02,
224.
1133
,854
.86
12,5
12.5
51,
724.
7829
,297
.09
96,7
07.8
6
8,49
7.92
16,1
13.4
01,
261.
9042
,020
.89
22,0
35.5
182
,250
.78
1,92
8.47
176,
979.
63
2,90
7.11
6,62
1.16
5,05
7.08
25,8
29.4
2
11,5
83.2
120
,124
.38
853.
4952
,564
.45
137.
9230
9.33
428.
587,
181.
847,
493.
2418
,056
.80
151.
5830
,485
.13
1.06
0.71
73.7
6
204.
453,
950.
991,
757.
5419
9.57
14,6
93.0
3
Viet
nam
Thai
land
Sing
apor
e
Tota
l Phi
lippi
ne
Agric
ultu
ral
Expo
rts
to
ASEA
N
Tota
l Phi
lippi
ne
Agr
icul
tura
l Im
port
s to
A
SE
AN
Thai
land
Sing
apor
eCa
mbo
dia
Saba
hM
yanm
arM
alay
sia
Indo
nesi
aVi
etna
m

AGRICULTURAL FOREIGN TRADE DEVELOPMENT
2 0 0 7 A N N U A L
IV. A
nim
al a
nd V
eget
able
Oil
a
nd F
ats
0.00
40,8
69.1
685
,446
.37
0.00
0.00
8,41
8.83
1,43
9.05
203.
9213
6,37
7.33
A. A
nim
al a
nd V
eget
able
Oils
and
Fat
s25
,783
.39
65,8
28.4
23,
541.
751,
181.
9420
3.92
96,5
39.4
2B
. Fix
ed V
eget
able
Oils
and
Fat
s15
,085
.77
19,6
17.9
54,
877.
0825
7.11
39,8
37.9
1
V.
Ferti
lizer
Man
ufac
ture
d21
,832
.18
14,1
97.5
10.
113,
936.
8972
9.43
1,46
9.03
42,1
65.1
5
VI.
Agric
ultu
ral C
hem
ical
s an
d M
ater
ials
16,7
91.0
37,
691.
435,
728.
1018
,805
.90
7,36
0.51
56,3
76.9
7
VII.
Agr
icul
tura
l Mac
hine
ry67
8.88
2,16
5.18
3,34
0.61
2,29
9.60
151.
218,
635.
48
TOTA
L VA
LUE
OF
AG
RIC
ULT
UR
AL IM
POR
TS9.
3922
1,56
3.38
183,
581.
972,
198.
0412
0.67
94,2
95.6
836
3,83
9.21
553,
210.
791,
418,
819.
13
TOTA
L VA
LUE
OF
ALL
PHIL
IPPI
NE
IMPO
RTS
no im
port
data
from
Lao
s, B
rune
i and
Sar
awak
Sou
rce
of b
asic
dat
a: N
SO
13,4
50,8
59.9
2
3,
023.
296,
411,
299.
832,
402,
510.
6790
6,45
8.07
Indo
nesi
aVi
etna
m
547.
011,
357,
153.
732,
318,
501.
862,
827.
88
Thai
land
Sing
apor
e
Tota
l Phi
lippi
ne
Agric
ultu
ral
Impo
rts
to
ASEA
N
Tabl
e 10
. (C
ontin
ued)
ITEM
Cam
bodi
a
A S
E A
N
Saba
hM
yanm
arM
alay
sia
1 40
OVERALL AGRICULTURAL TRADE SITUATION 1. A relatively weaker performance characterized the country’s 2007
agricultural foreign trade. Growth rate of imports (8.25%) was higher than that of exports (3.35%) and this widened trade deficit by 18.51% or US$1,750.22 million.
• The total Philippine exports in 2007 reached US$50,465.72 million.
The share of agricultural exports to total Philippine exports increased by 6.30% from the previous year’s record.
• The country realized earnings amounting to US$3,168.07 million from
agricultural exports . This marked a 13.90% growth compared with the last year’s level. The fourth quarter of 2007 recorded the highest level of exportation at US$913.10 million and this indicated a 33.74% increase over the 2006 level.
• Agricultural import expenditures amounted to US$4,918.29 million or
14.28% higher than in 2006. Agricultural imports contributed 8.48% to the country’s total import expenditures. This represented an increase of 6.54% from the 2006 record.
2. Trade surpluses with Japan and European Union (EU) countries
were maintained in an increasing rate, whereas deficits were noted with the rest of the country’s trading partners.
• The country’s trade with European Union posed a surplus of
US$172.53 million in 2007. There was a significant increase of 42.23% from last year’s US$121.30 million. During the period, agricultural exports (US$ 619.81 million) outpaced imports (US$447.18 million) .
• Agricultural trade with Japan posted the largest surplus of US$334.62
million with 3.66% increase over last year’s value. Japan was the leading market for Philippine fresh banana and shrimps and prawns which comprised 44.39% and 45.28%, respectively of the country’s agricultural exports. It was also the top supplier of rubber, accounting for 21.94% of the country’s total rubber import data.

AGRICULTURAL FOREIGN TRADE DEVELOPMENT
2 0 0 7 A N N U A L
41
I. F
ood
and
Live
Ani
mal
s3,
715,
080.
23
176,
971.
34
23,7
28.0
2
742,
968.
77
A. L
ive
Anim
als
16,0
92.1
8
6,
311.
50
1,
161.
35
5,
118.
18
B.
Mea
t and
Mea
t Pre
para
tions
202,
794.
13
10
,731
.49
20.0
8
24
,371
.53
C. D
airy
Pro
duct
s &
Bird
's E
ggs
655,
917.
15
89
,236
.82
244.
67
109,
800.
00
D. F
ish
and
Fish
Pre
para
tions
103,
761.
22
21
5.19
16
,665
.20
3,
287.
52
E.
Cer
eals
and
Cer
eal P
repa
ratio
ns1,
260,
893.
81
46,7
24.5
9
22
4.16
32
0,62
2.02
F.
Veg
etab
les
and
Frui
ts19
7,74
2.27
4,44
7.84
183.
77
53,0
60.7
9
G
. Sug
ar a
nd S
ugar
Pre
para
tions
97,0
77.6
3
81
5.63
19
1.80
19
,213
.01
H. C
offe
e, T
ea, C
ocoa
Spi
ces
123,
846.
80
2,
127.
12
1,
515.
13
10
,199
.47
and
Man
ufac
ture
s th
ereo
f I.
Fee
ding
Stu
ff fo
r Ani
mal
s56
3,42
6.00
7,25
8.62
636.
54
148,
323.
07
(exc
ludi
ng u
nmille
d C
erea
ls)
J. M
isce
llane
ous
Edib
le P
rodu
cts
493,
529.
04
9,
102.
54
2,
885.
32
48
,973
.18
and
Prep
arat
ions
II. T
obac
co a
nd T
obac
co M
anuf
actu
res
188,
367.
49
47
5.75
68
9.63
2,
517.
95
III. C
rude
Mat
eria
ls25
4,62
7.46
3,44
1.14
23,7
21.3
1
56,4
77.4
6
A.
Oil
Seed
s an
d O
leag
inou
s Fr
uits
94,6
26.8
7
2,
670.
73
14
.61
27,4
07.9
4
B.
Cru
de R
ubbe
r87
,573
.35
58.0
2
21
,341
.33
10
,174
.63
Item
Tota
l Phi
lippi
ne
Agric
ultu
ral I
mpo
rts
Aust
ralia
Japa
nU
SA
Tabl
e 10
a. D
ISTR
IBU
TIO
N O
F PH
ILIP
PIN
E AG
RIC
ULT
UR
AL IM
POR
TS F
RO
M A
UST
RAL
IA,
(C.I.
F. V
alue
in '0
00 U
S$)
JAPA
N A
ND
USA
, 200
7
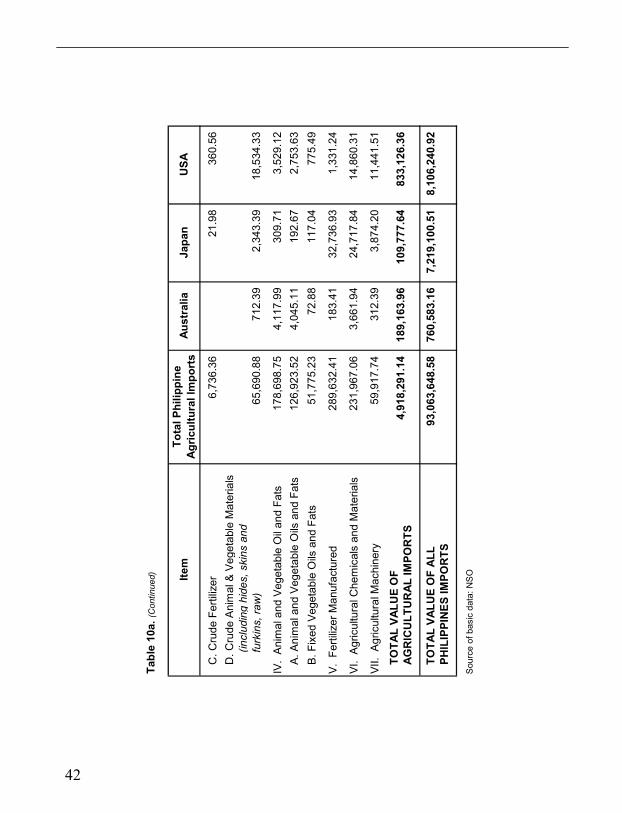
AGRICULTURAL FOREIGN TRADE DEVELOPMENT
2 0 0 7 A N N U A L
C. C
rude
Fer
tiliz
er6,
736.
36
21.9
8
360.
56
D
. Cru
de A
nim
al &
Ve g
etab
le M
ater
ials
(inc
ludi
ng h
ides
, ski
ns a
nd
fu
rkin
s, ra
w)
65,6
90.8
8
71
2.39
2,
343.
39
18,5
34.3
3
IV.
Anim
al a
nd V
eget
able
Oil
and
Fats
178,
698.
75
4,
117.
99
30
9.71
3,52
9.12
A.
Ani
mal
and
Veg
etab
le O
ils a
nd F
ats
126,
923.
52
4,
045.
11
19
2.67
2,75
3.63
B.
Fix
ed V
eget
able
Oils
and
Fat
s51
,775
.23
72.8
8
11
7.04
775.
49
V. F
ertil
izer
Man
ufac
ture
d28
9,63
2.41
183.
41
32,7
36.9
3
1,33
1.24
VI.
Agric
ultu
ral C
hem
ical
s an
d M
ater
ials
231,
967.
06
3,
661.
94
24
,717
.84
14
,860
.31
VII.
Agr
icul
tura
l Mac
hine
ry59
,917
.74
312.
39
3,87
4.20
11
,441
.51
TOTA
L VA
LUE
OF
AGR
ICU
LTU
RAL
IMPO
RTS
TOTA
L VA
LUE
OF
ALL
93,0
63,6
48.5
8
76
0,58
3.16
7,
219,
100.
51
8,10
6,24
0.92
PH
ILIP
PIN
ES IM
POR
TS
Sou
rce
of b
asic
dat
a: N
SO
833,
126.
36
10
9,77
7.64
189,
163.
96
4,91
8,29
1.14
USA
Tabl
e 10
a. (C
ontin
ued) Ite
mTo
tal P
hilip
pine
Ag
ricul
tura
l Im
port
sAu
stra
liaJa
pan
HIGHLIGHTS
42

AGRICULTURAL FOREIGN TRADE DEVELOPMENT
2 0 0 7 A N N U A L
43
I. F
ood
and
Live
Ani
mal
s1,
858.
8527
,315
.82
383.
4854
3.54
24,9
51.7
90.
001,
911.
3740
,391
.04
32,5
72.5
4
A. L
ive
Anim
als
182.
071,
067.
1241
5.69
B. M
eat a
nd M
eat P
repa
ratio
ns19
.01
2,38
1.12
1,49
0.56
29.1
64,
971.
833,
327.
47C
. Dai
ry P
rodu
cts
& B
ird's
Egg
s60
.36
8,84
6.00
430.
588,
868.
001,
626.
0814
,406
.20
6,00
6.66
D. F
ish
and
Fish
Pre
para
tions
0.64
1.33
78.4
211
.15
140.
6156
.81
E. C
erea
ls a
nd C
erea
l Pre
para
tions
3,94
2.75
7.35
48.5
15,
179.
6111
4.06
F. V
eget
able
s an
d Fr
uits
185.
101,
541.
1134
2.22
59.4
766
8.24
174.
483,
893.
26G
. Sug
ar a
nd S
ugar
Pre
para
tions
9.53
3,33
8.50
44.8
12.
674,
928.
931,
915.
48H
. Cof
fee,
Tea
, Coc
oa S
pice
s 23
.66
427.
6267
0.61
934.
37
a
nd M
anuf
actu
res
ther
eof
I. F
eedi
ng S
tuff
for A
nim
als
1,53
6.78
5,08
2.80
3,57
7.40
176.
675,
337.
511,
796.
27
(e
xclu
ding
unm
illed
Cer
eals
)J.
Mis
cella
neou
s E
dibl
e P
rodu
cts
24.4
11,
755.
2841
.26
10,0
38.5
965
.64
3,51
4.14
14,1
12.4
7
an
d Pr
epar
atio
ns
II. T
obac
co a
nd T
obac
co M
anuf
actu
res
2,11
5.33
4.12
569.
4199
.88
III. C
rude
Mat
eria
ls1.
681,
604.
910.
000.
003,
073.
5610
1.07
0.00
2,37
5.19
5,08
8.96
A. O
il S
eeds
and
Ole
agin
ous
Frui
ts2.
50B.
Cru
de R
ubbe
r1.
681,
500.
6010
1.07
652.
613,
747.
18C
. Cru
de F
ertil
izer
40.2
55.
16D
. Cru
de A
nim
al &
Ve g
etab
le M
ater
ials
64
.06
3,07
3.56
1,72
2.58
1,33
4.12
(i
nclu
ding
hid
es, s
kins
and
furk
ins,
raw
)
Cyp
rus
Cze
ch
Rep
ublic
Esto
nia
Tabl
e 10
b. D
ISTR
IBU
TIO
N O
F PH
ILIP
PIN
E AG
RIC
ULT
UR
AL IM
POR
TS F
RO
M E
U M
EMB
ER C
OU
NTR
IES,
200
7
EUR
OPE
AN U
NIO
NIte
mAu
stria
Bel
gium
(C.I.
F. V
alue
in '0
00 U
S$)
Den
mar
kFi
nlan
dFr
ance
Ger
man
y

AGRICULTURAL FOREIGN TRADE DEVELOPMENT
2 0 0 7 A N N U A L
Tabl
e 10
b. (C
ontin
ued)
IV.
Anim
al a
nd V
eget
able
Oil
and
Fats
1,27
7.24
8,63
4.21
983.
053,
043.
08
A. A
nim
al a
nd V
eget
able
Oils
and
Fat
s66
8.32
3,21
5.69
979.
692,
845.
55
B. F
ixed
Veg
etab
le O
ils a
nd F
ats
608.
925,
418.
523.
3619
7.53
V. F
ertil
izer
Man
ufac
ture
d19
3.45
23.8
71,
615.
58
VI.
Agric
ultu
ral C
hem
ical
s an
d M
ater
ials
68.5
23,
337.
3610
.72
1,35
6.32
170.
9313
,251
.54
17,2
56.2
3
VII.
Agr
icul
tura
l Mac
hine
ry24
.96
778.
3041
0.86
9.27
1,48
9.83
5,11
0.95
TOTA
L VA
LUE
OF
AGR
ICU
LTU
RAL
IMPO
RTS
1,95
4.01
36,6
22.4
138
3.48
554.
2638
,430
.86
101.
072,
091.
5759
,083
.93
64,7
87.2
2
TOTA
L VA
LUE
OF
ALL
PHIL
IPPI
NE
IMPO
RTS
Sou
rce
of b
asic
dat
a: N
SO
1,29
1,94
1.12
Fran
ceG
erm
any
30,2
48.9
232
0,43
0.14
880.
4999
,442
.45
68,7
40.6
514
7.93
164,
633.
7062
6,82
5.78
Item
Aust
riaB
elgi
umC
ypru
sC
zech
R
epub
licD
enm
ark
Esto
nia
Finl
and
EUR
OPE
AN U
NIO
N
ix 44
LIST OF FIGURES (Continued)) Figure No. Pages
35 WORLD PRICES OF BANANA, JANUARY- DECEMBER 2005-2006 ……………………………………… 53
36 WORLD PRICES OF RUBBER, JANUARY- DECEMBER 2005-2006 ……………………………………… 53

AGRICULTURAL FOREIGN TRADE DEVELOPMENT
2 0 0 7 A N N U A L
45 viii
LIST OF FIGURES (Continued) Figure No. Pages
24 VALUE OF PALM OIL IMPORTS, BY QUARTER 2005-2006 …………… 27
25 WORLD PRICES OF COCONUT OIL, JANUARY - DECEMBER 2005-2006 ……………………………………… 52
26 WORLD PRICES OF COPRA, JANUARY - DECEMBER 2005-2006 ……………………………………… 52
27 WORLD PRICES OF SUGAR, JANUARY - DECEMBER 2005-2006 ……………………………………… 52
28 WORLD PRICES OF SOYBEANS, JANUARY - DECEMBER 2005-2006 ……………………………………… 52
29 WORLD PRICES OF RICE (5% BROKEN), JANUARY 2005-DECEMBER 2006 ……………………………………… 52
30 WORLD PRICES OF RICE (25% BROKEN), JANUARY 2005-DECEMBER 2006 ……………………………………… 52
31 WORLD PRICES OF RICE (35% BROKEN), JANUARY 2005-DECEMBER 2006 ……………………………………… 53
32 WORLD PRICES OF MAIZE, JANUARY 2005-DECEMBER 2006 ……………………………………… 53
33 WORLD PRICES OF COFFEE, ARABICA, JANUARY- DECEMBER 2005-2006 ……………………………………… 53
34 WORLD PRICES OF COFFEE, ROBUSTA, JANUARY- DECEMBER 2005-2006 ……………………………………… 53
62.3
51,
666.
1111
.58
75,1
13.7
9
912.
3887
6.71
62.3
520
,127
.72
165.
6656
5.01
11.5
852
8.32
3,73
9.29
419.
93
16,2
45.4
6
1,66
6.11
31,5
33.3
1
11.7
0
0.00
0.00
11.5
11,
155.
24
11.5
141
5.83
739.
41
Luxe
mbo
urg
Mal
taN
ethe
rland
sN
UN
ION
Lith
uani
a
I. F
ood
and
Live
Ani
mal
s72
.13
0.06
96,5
18.3
85,
377.
60
A. L
ive
Anim
als
0.06
B. M
eat a
nd M
eat P
repa
ratio
ns29
2.04
14.4
5C
. Dai
ry P
rodu
cts
& B
ird's
Egg
s4,
839.
5711
8.32
D. F
ish
and
Fish
Pre
para
tions
18.1
5E
. Cer
eals
and
Cer
eal P
repa
ratio
ns27
2.71
626.
14F.
Veg
etab
les
and
Frui
ts72
.13
45.4
11,
432.
55G
. Sug
ar a
nd S
ugar
Pre
para
tions
20.8
436
5.93
H. C
offe
e, T
ea, C
ocoa
Spi
ces
129.
9410
3.86
and
Man
ufac
ture
s th
ereo
f I.
Fee
ding
Stu
ff fo
r Ani
mal
s1,
224.
67
(e
xclu
ding
unm
illed
Cer
eals
)J.
Mis
cella
neou
s E
dibl
e P
rodu
cts
90,9
17.8
71,
473.
53
an
d P
repa
ratio
ns
II. T
obac
co a
nd T
obac
co M
anuf
actu
res
75.5
429
7.05
III. C
rude
Mat
eria
ls0.
000.
000.
0022
6.93
A. O
il S
eeds
and
Ole
agin
ous
Frui
tsB
. Cru
de R
ubbe
r12
9.98
C. C
rude
Fer
tiliz
erD
. Cru
de A
nim
al &
Veg
etab
le M
ater
ials
96
.95
(i
nclu
ding
hid
es, s
kins
and
furk
ins,
raw
)
Tabl
e 10
b. (C
ontin
ued)
EUR
Item
Gre
ece
Hun
gary
Irela
ndIta
lyEU
RO
PEAN
UN
ION

AGRICULTURAL FOREIGN TRADE DEVELOPMENT
2 0 0 7 A N N U A L
Tabl
e 10
b. (C
ontin
ued)
IV.
Ani
mal
and
Veg
etab
le O
il an
d Fa
ts58
.51
963.
2488
5.65
A. A
nim
al a
nd V
eget
able
Oils
and
Fat
s58
.51
8.45
816.
00
B. F
ixed
Veg
etab
le O
ils a
nd F
ats
954.
7969
.65
V. F
ertil
izer
Man
ufac
ture
d0.
844.
34
VI.
Agr
icul
tura
l Che
mic
als
and
Mat
eria
ls29
3.79
2,51
7.89
6,00
0.83
VII.
Agr
icul
tura
l Mac
hine
ry0.
255,
279.
274,
517.
94
TOTA
L VA
LUE
OF
AGR
ICU
LTU
RAL
IMPO
RTS
147.
920.
0697
,167
.73
14,3
65.7
762
.35
1,66
6.11
23.0
987
,696
.49
TOTA
L VA
LUE
OF
ALL
PHIL
IPPI
NE
IMPO
RTS
Sou
rce
of b
asic
dat
a: N
SO
EUR
OPE
AN U
NIO
NN
ethe
rland
s
2,20
8.75
10,7
42.6
51,
434,
988.
3621
9,84
4.17
110.
342,
351.
9130
7.78
481.
956.
30
Item
Gre
ece
Hun
gary
Irela
ndIta
lyLi
thun
iaLu
xem
bour
gM
alta
12 VALUE OF FERTILIZER MANUFACTURED EXPORTS,BY QUARTER 2005-2006 ………………………………………………… 19
13 VALUE OF MILK AND CREAM AND PRODUCTS EXPORTS, BY QUARTER 2005-2006 ………………………………………………… 19
14 VALUE OF SEAWEEDS AND CARAGEENAN EXPORTS, BY QUARTER 2005-2006 ………………………………………………… 19
15 VALUE OF RICE IMPORTS, BY QUARTER 2005-2006 ………………… 26
16 VALUE OF SOYABEAN OIL/CAKE MEAL IMPORTS, BY QUARTER 2005-2006 ………………………………………………… 26
17 VALUE OF WHEAT IMPORTS, BY QUARTER 2005-2006 ……………… 26
18 VALUE OF MILK AND CREAM AND PRODUCTS IMPORTS, BY QUARTER 2005-2006 ………………………………………………… 26
19 VALUE OF UNMANUFACTURED TOBACCO IMPORTS, BY QUARTER 2005-2006 ………………………………………………… 26
20 VALUE OF MEAT OF BOVINE ANIMALS IMPORTS, BY QUARTER 2005-2006 ………………………………………………… 26
21 VALUE OF UREA IMPORTS, BY QUARTER 2005-2006 …………………27
22 VALUE OF FOOD PREPARATIONS FOR INFANT USE IMPORTS, BY QUARTER 2005-2006 ………………………………………………… 27
23 VALUE OF NON-ALCOHOLIC CONCENTRATES IMPORTS, BY QUARTER 2005-2006 ………………………………………………… 27
LIST OF FIGURES (Continued) Figure No. Pages
vii 46

AGRICULTURAL FOREIGN TRADE DEVELOPMENT
2 0 0 7 A N N U A L
Figure No. Pages
1 SHARE OF AGRICULTURAL AND NON-AGRICULTURAL EXPORTS TO TOTAL PHILIPPINE EXPORTS, 2006 ……………………………… 9
2 SHARE OF AGRICULTURAL AND NON-AGRICULTURAL IMPORTS TO TOTAL PHILIPPINE IMPORTS, 2006 ………………………………… 9
3 PHILIPPINE AGRICULTURAL EXPORTS, BY QUARTER 2006-2005 ………………………………………………… 11
4 PHILIPPINE AGRICULTURAL IMPORTS, BY QUARTER 2006-2005 ………………………………………………… 11
5 VALUE OF COCONUT OIL EXPORTS, BY QUARTER 2006-2005 ………………………………………………… 18
6 VALUE OF BANANA FRESH EXPORTS, BY QUARTER 2006-2005 ………………………………………………… 18
7 VALUE OF PINEAPPLE AND PINEAPPLE PRODUCT EXPORTS, BY QUARTER 2005-2006 ………………………………………………… 18
8 VALUE OF DESICCATED COCONUT EXPORTS, BY QUARTER 2005-2006 ………………………………………………… 18
9 VALUE OF TOBACCO MANUFACTURED EXPORTS, BY QUARTER 2005-2006 ………………………………………………… 18
10 VALUE OF TUNA EXPORTS, BY QUARTER 2005-2006 ………………… 18
11 VALUE OF SHRIMPS AND PRAWNS EXPORTS, BY QUARTER 2005-2006 ………………………………………………… 19
47 vi
LIST OF FIGURES
Tabl
e 10
b. (C
ontin
ued)
I. F
ood
and
Live
Ani
mal
s1,
226.
3123
5.06
217.
5825
.20
14,2
09.9
195
9.61
11,3
93.2
433
7,01
7.34
A. L
ive
Anim
als
257.
522,
834.
84B.
Mea
t and
Mea
t Pre
para
tions
1,51
0.19
222.
8815
,135
.42
C. D
airy
Pro
duct
s &
Bird
's E
ggs
1,10
0.86
25.2
079
3.33
326.
245,
036.
2372
,673
.70
D. F
ish
and
Fish
Pre
para
tions
95.1
654
7.35
4.99
1,12
0.27
E. C
erea
ls a
nd C
erea
l Pre
para
tions
22.0
515
.53
672.
3411
,466
.06
F. V
eget
able
s an
d Fr
uits
108.
0611
7.85
1,22
3.47
333.
6910
,736
.94
G. S
ugar
and
Sug
ar P
repa
ratio
ns82
0.20
179.
3915
,365
.57
H. C
offe
e, T
ea, C
ocoa
Spi
ces
217.
5848
3.10
0.23
425.
923,
836.
82
a
nd M
anuf
actu
res
ther
eof
I. F
eedi
ng S
tuff
for A
nim
als
5,06
1.56
604.
491,
803.
7642
,447
.37
(exc
ludi
ng u
nmille
d C
erea
ls)
J. M
isce
llane
ous
Edi
ble
Prod
ucts
17
.39
3,75
5.18
28.6
52,
456.
5216
1,40
0.35
and
Prep
arat
ions
II. T
obac
co a
nd T
obac
co M
anuf
actu
res
25.2
53,
198.
28
III. C
rude
Mat
eria
ls0.
000.
000.
000.
0037
9.63
0.00
857.
1014
,875
.78
A. O
il Se
eds
and
Ole
agin
ous
Frui
ts40
.75
43.2
5B.
Cru
de R
ubbe
r43
6.56
6,99
7.02
C. C
rude
Fer
tiliz
er45
.41
D. C
rude
Ani
mal
& V
e get
able
Mat
eria
ls
379.
6337
9.79
7,79
0.10
(i
nclu
ding
hid
es, s
kins
and
furk
ins,
raw
)
Tota
l Phi
l. Ag
ricul
tura
l Ex
port
s to
EU
EUR
OPE
AN U
NIO
N Spai
nU
K G
reat
B
ritai
n an
d N
. Ire
land
Item
Pola
ndPo
rtug
alSl
ovak
iaSl
oven
iaSw
eden
Tota
l Phi
l. Ag
ricul
tura
l Im
ports
to E
U

AGRICULTURAL FOREIGN TRADE DEVELOPMENT
2 0 0 7 A N N U A L
Tabl
e 10
b. (C
ontin
ued)
IV.
Anim
al a
nd V
eget
able
Oil
and
Fats
0.00
0.00
0.00
0.00
2,08
3.17
150.
7927
1.34
18,3
50.2
8A.
Ani
mal
and
Veg
etab
le O
ils
447.
0324
7.76
9,28
7.00
a
nd F
ats
B. F
ixed
Veg
etab
le O
ils a
nd F
ats
1,63
6.14
150.
7923
.58
9,06
3.28
V. F
ertil
izer
Man
ufac
ture
d60
1.15
47.7
971
.34
2,55
8.36
VI.
Agric
ultu
ral C
hem
ical
s an
d M
ater
ials
17.3
17.
192.
5762
.36
38.3
37,
352.
9251
,751
.81
VII.
Agr
icul
tura
l Mac
hine
ry36
.11
551.
3817
4.11
1,14
4.52
19,5
27.7
5
TOTA
L VA
LUE
OF
AGR
ICU
LTU
RAL
IMPO
RTS
1,88
0.88
242.
2521
7.58
27.7
717
,286
.45
1,37
0.63
21,1
15.7
144
7,27
9.60
TOTA
L VA
LUE
OF
ALL
PHIL
IPPI
NE
IMPO
RTS
Sou
rce
of b
asic
dat
a: N
SO
57,9
95,7
52.4
73,
821.
0413
,142
.74
90,9
98.2
41,
151.
2213
9,33
4.50
150,
341.
1237
6,56
1.30
Port
ugal
Slov
akia
Slov
enia
Swed
en
Tota
l Phi
l. Ag
ricul
tura
l Im
port
s to
EU
EUR
OPE
AN U
NIO
N Spai
nU
K G
reat
B
ritai
n an
d N
. Ire
land
Item
Pola
nd
v 48
LIST OF TABLES (Continued)
Table No. Pages
9a DISTRIBUTION OF PHILIPPINE AGRICULTURAL EXPORTSTO AUSTRALIA, JAPAN, AND USA, 2006 ……………………………… 32
9b DISTRIBUTION OF PHILIPPINE AGRICULTURAL EXPORTSTO EU MEMBER COUNTRIES, 2006 …………………………………… 33
10 DISTRIBUTION OF PHILIPPINE AGRICULTURAL IMPORTSFROM ASEAN MEMBER COUNTRIES, 2006 …………………………… 39
10a DISTRIBUTION OF PHILIPPINE AGRICULTURAL IMPORTSFROM AUSTRALIA, JAPAN, AND USA, 2006 …………………………… 41
10b DISTRIBUTION OF PHILIPPINE AGRICULTURAL IMPORTSFROM EU MEMBER COUNTRIES, 2006 ………………………………… 43
11 WORLD PRICES OF SELECTED COMMODITIESJAN 2004-DEC 2006 ………………………………………………………… 49

2 0 0 7 A N N U A L
Table No. Pages
1 SUMMARY OF PHILIPPINE AGRICULTURAL TRADE, 2006-2005 …… 9
1a PHILIPPINE AGRICULTURAL TRADE, BY QUARTER, 2006-2005 …… 10
2 AGRICULTURAL TRADE BALANCES WITH MAJOR TRADING PARTNERS OF THE PHILIPPINES, 2006 VS 2005 …………………… 12
3 QUANTITY AND VALUE OF PHILIPPINE AGRICULTURAL EXPORTSBY COMMODITY GROUP 2006-2005 …………………………………… 13
4 TOP TEN PHILIPPINE AGRICULTURAL EXPORTS, 2006 AND 2005 … 16
4a VALUE OF TOP TEN AGRICULTURAL EXPORTS, BY QUARTER 2006 & 2005 ………………………………………………… 17
5 MAJOR MARKETS OF TOP TEN PHILIPPINE AGRICULTURAL EXPORTS, 2006 ……………………………………… 20
6 QUANTITY AND VALUE OF PHILIPPINE AGRICULTURAL IMPORTSBY COMMODITY GROUP 2006 AND 2005 ……………………………… 22
7 TOP TEN AGRICULTURAL IMPORTS, 2006 AND 2005 ………………… 24
7a VALUE OF TOP TEN AGRICULTURAL IMPORTS, BY QUARTER 2006 AND 2005 …………………………………………… 25
8 MAJOR SUPPLIERS OF TOP TEN PHILIPPINE AGRICULTURALIMPORTS, 2006 ……………………………………………………………… 28
9 DISTRIBUTION OF PHILIPPINE AGRICULTURAL EXPORTSTO ASEAN MEMBER COUNTRIES, 2006 ……………………………… 30
49 iv
LIST OF TABLES
WORLD PRICES
Janu
ary
0.56
90.
731
28.4
70.
373
0.48
429
.87
0.34
70.
241
-30.
470.
257
0.30
619
.07
Febr
uary
0.59
10.
763
29.1
00.
393
0.50
328
.15
0.39
80.
233
-41.
410.
257
0.32
526
.46
Mar
ch0.
575
0.76
933
.74
0.38
50.
509
32.2
10.
380
0.23
0-3
9.45
0.25
60.
322
25.7
8Ap
ril0.
578
0.82
843
.17
0.37
20.
553
48.5
20.
386
0.21
4-4
4.46
0.25
90.
320
23.4
6M
ay0.
583
0.89
453
.34
0.39
00.
592
51.7
90.
371
0.20
8-4
3.93
0.26
60.
334
25.5
6Ju
ne0.
575
0.97
970
.26
0.38
70.
653
68.7
30.
340
0.20
5-3
9.67
0.26
70.
361
35.2
1Ju
ly0.
583
0.92
959
.27
0.38
40.
613
59.6
50.
351
0.22
4-3
6.04
0.27
20.
376
38.1
5Au
gust
0.60
60.
910
50.1
70.
404
0.59
547
.28
0.29
80.
216
-27.
430.
262
0.38
546
.95
Sept
embe
r0.
609
0.93
052
.71
0.41
30.
614
48.6
10.
266
0.21
5-1
9.20
0.25
70.
426
65.7
6O
ctob
er0.
626
1.01
061
.34
0.41
10.
658
60.1
70.
257
0.22
0-1
4.08
0.27
30.
450
64.8
4N
ovem
ber
0.65
61.
131
72.4
10.
434
0.74
872
.35
0.26
00.
223
-14.
260.
300
0.48
963
.00
Dec
embe
r0.
732
1.15
357
.58
0.47
70.
765
60.2
80.
265
0.23
5-1
1.10
0.29
50.
515
74.5
1
Coc
onut
Oil
- (P
hilip
pine
s/In
done
sia)
, bul
k, c
.I.f R
otte
rdam
Cop
ra -
(Phi
lippi
nes/
Indo
nesi
a), b
ulk,
c.I.
f N.W
. Eur
ope
Sug
ar-In
tern
atio
nal S
ugar
Agr
eem
ent (
ISA
) FO
B C
arib
bean
Por
t.So
ybea
ns (U
S), c
.i.f.
Rot
terd
amR
ice
(Tha
i) 5%
bro
ken,
whi
te ri
ce (W
R),
Mill
ed, i
ndic
ativ
e pr
ice
base
d on
wee
kly
surv
eys
of e
xpor
t tra
nsac
tions
,
g
over
nmen
t sta
ndar
d, f.
o.b.
Ban
gkok
Ric
e (T
hai)
25%
bro
ken,
WR
, mille
d, in
dica
tive
surv
ey p
rice,
gov
ernm
ent s
tand
ards
, f.o
.b. B
angk
okR
ice
(Tha
i) 35
% b
roke
n, W
R, m
illed,
f.o.
b. B
angk
okM
aize
(US
), N
o. 2
, yel
low
, f.o
.b. U
S G
ulf P
orts
Cof
fee
Inte
rnat
iona
l Cof
fee
Org
aniz
atio
n in
dica
tor p
rice,
oth
er m
ild A
rabi
cas,
ave
rage
New
Yor
k an
d B
rem
en/H
ambu
rg m
arke
ts, e
x-do
ckC
offe
e In
tern
atio
nal C
offe
e O
rgan
izat
ion
indi
cato
r pric
e, R
obus
tas,
ave
rage
New
Yor
k an
d Le
Hav
re/M
arse
illes
mar
kets
, ex-
dock
Ban
ana
(Cen
tral a
nd S
outh
Am
eric
an),
maj
or b
rand
s, U
S im
port
pric
e,fre
e on
truc
k U
S G
olf p
orts
Rub
ber (
any
orig
in),
RS
S n
o. 1
, in
bale
s, R
ubbe
r Tra
ders
Ass
ocia
tion,
spo
t, N
ew Y
ork
Tabl
e 11
. W
OR
LD P
RIC
ES O
F SE
LEC
TED
CO
MM
OD
ITIE
S ( 2
006
- 200
7)($
per
kg.
)
Gro
wth
R
ate
Year
/Mon
thG
row
th
Rat
e G
row
th
Rat
e G
row
th
Rat
e 20
0620
0720
0620
0720
0620
0720
0620
07
Coc
onut
Oil
Cop
raSu
gar
Soyb
eans

AGRICULTURAL FOREIGN TRADE DEVELOPMENT
2 0 0 7 A N N U A L
iii 50
TABLE OF CONTENTS
Page
FOREWORD ……………………………………………………………………. i LIST OF TABLES ………………………………………………………………. iv LIST OF FIGURES ……………………………………………………………... vi HIGHLIGHTS ……………………………………………………………………. 1 STATISTICAL TABLES
OVERALL AGRICULTURAL TRADE ………………………………….… 9 EXPORTS …………………………………………………………………… 13 IMPORTS …………………………………………………………………… 22 TRADE WITH MAJOR TRADING PARTNERS ………………………… 30 WORLD PRICES …………………………………………………………... 49
2006
2007
2006
2007
2006
2007
Janu
ary
0.29
1
0.31
37.
450.
266
0.
287
7.62
0.26
3
0.27
96.
440.
103
0.
165
60.4
4Fe
brua
ry0.
302
0.
315
4.48
0.27
5
0.29
26.
090.
272
0.
285
4.95
0.10
7
0.17
765
.59
Mar
ch0.
304
0.
319
5.00
0.27
5
0.29
99.
050.
272
0.
293
7.48
0.10
5
0.17
161
.92
April
0.30
2
0.31
74.
700.
272
0.
296
9.02
0.27
0
0.29
17.
670.
108
0.
153
41.8
3M
ay0.
308
0.
318
3.12
0.27
6
0.29
67.
170.
273
0.
283
3.66
0.11
1
0.16
044
.87
June
0.31
3
0.32
33.
440.
281
0.
301
7.13
0.27
6
0.29
36.
160.
109
0.
165
51.0
5Ju
ly0.
316
0.
329
4.22
0.28
7
0.30
76.
970.
279
0.
297
6.50
0.11
4
0.14
728
.81
Augu
st0.
313
0.
328
4.73
0.28
4
0.30
77.
810.
278
0.
298
7.13
0.11
7
0.15
129
.65
Sept
embe
r0.
309
0.
325
5.11
0.28
3
0.30
68.
290.
276
0.
300
8.70
0.12
2
0.16
434
.83
Oct
ober
0.30
1
0.32
99.
370.
275
0.
313
14.0
50.
269
0.
311
15.6
80.
142
0.
164
15.4
5N
ovem
ber
0.29
6
0.34
215
.42
0.27
3
0.32
819
.92
0.26
4
0.32
623
.58
0.16
5
0.17
14.
10D
ecem
ber
0.30
4
0.36
118
.76
0.27
9
0.34
724
.63
0.27
3
0.34
627
.00
0.16
0
0.18
012
.38
Coc
onut
Oil
- (P
hilip
pine
s/In
done
sia)
, bul
k, c
.I.f R
otte
rdam
Cop
ra -
(Phi
lippi
nes/
Indo
nesi
a), b
ulk,
c.I.
f N.W
. Eur
ope
Suga
r-Int
erna
tiona
l Sug
ar A
gree
men
t (IS
A) F
OB
Car
ibbe
an P
ort.
Soyb
eans
(US)
, c.i.
f. R
otte
rdam
Ric
e (T
hai)
5% b
roke
n, w
hite
rice
(WR
), M
illed
, ind
icat
ive
pric
e ba
sed
on w
eekl
y su
rvey
s of
exp
ort t
rans
actio
ns,
gov
ernm
ent s
tand
ard,
f.o.
b. B
angk
okR
ice
(Tha
i) 25
% b
roke
n, W
R, m
illed,
indi
cativ
e su
rvey
pric
e, g
over
nmen
t sta
ndar
ds, f
.o.b
. Ban
gkok
Ric
e (T
hai)
35%
bro
ken,
WR
, mille
d, f.
o.b.
Ban
gkok
Mai
ze (U
S),
No.
2, y
ello
w, f
.o.b
. US
Gul
f Por
tsC
offe
e In
tern
atio
nal C
offe
e O
rgan
izat
ion
indi
cato
r pric
e, o
ther
mild
Ara
bica
s, a
vera
ge N
ew Y
ork
and
Bre
men
/Ham
burg
mar
kets
, ex-
dock
Cof
fee
Inte
rnat
iona
l Cof
fee
Org
aniz
atio
n in
dica
tor p
rice,
Rob
usta
s, a
vera
ge N
ew Y
ork
and
Le H
avre
/Mar
seill
es m
arke
ts, e
x-do
ckB
anan
a (C
entra
l and
Sou
th A
mer
ican
), m
ajor
bra
nds,
US
impo
rt pr
ice,
free
on tr
uck
US
Gol
f por
tsR
ubbe
r (an
y or
igin
), R
SS n
o. 1
, in
bale
s, R
ubbe
r Tra
ders
Ass
ocia
tion,
spo
t, N
ew Y
ork
Tabl
e 11
. (C
ontin
ued)
Gro
wth
R
ate
Year
/Mon
thG
row
th
Rat
e G
row
th
Rat
e
Ric
eG
row
th
Rat
e
Mai
ze (c
orn)
2007
5% B
roke
n20
0625
% B
roke
n35
% B
roke
n

AGRICULTURAL FOREIGN TRADE DEVELOPMENT
2 0 0 7 A N N U A L 51
Janu
ary
2.73
8
2.74
50.
271.
398
1.
745
24.7
90.
686
0.
639
-6.7
32.
051
2.
313
12.7
6Fe
brua
ry2.
628
2.
690
2.37
1.38
8
1.74
325
.61
0.85
4
0.65
5-2
3.39
2.29
2
2.51
19.
56M
arch
2.50
6
2.58
13.
001.
314
1.
698
29.1
90.
825
0.
648
-21.
542.
304
2.
423
5.16
April
2.54
5
2.52
6-0
.73
1.33
5
1.75
431
.42
0.73
0
0.64
8-1
1.32
2.31
9
2.48
77.
24M
ay2.
411
2.
497
3.55
1.32
6
1.85
039
.51
0.92
6
0.68
9-2
5.60
2.53
6
2.53
1-0
.20
June
2.27
4
2.64
016
.11
1.32
8
2.04
353
.86
0.65
5
0.77
918
.95
2.90
4
2.53
0-1
2.89
July
2.31
5
2.59
312
.02
1.42
2
2.03
943
.42
0.56
5
0.73
429
.89
2.70
0
2.32
2-1
4.00
Augu
st2.
463
2.
716
10.2
71.
622
1.
928
18.8
50.
542
0.
697
28.7
62.
534
2.
357
-7.0
0Se
ptem
ber
2.42
1
2.82
316
.60
1.70
0
2.04
520
.32
0.54
4
0.66
522
.15
2.09
8
2.34
811
.91
Oct
ober
2.43
9
2.96
121
.39
1.65
7
2.00
821
.21
0.54
9
0.65
919
.89
2.08
9
2.49
819
.57
Nov
embe
r2.
696
2.
888
7.12
1.68
3
2.04
121
.29
0.59
8
0.65
18.
881.
939
2.
714
39.9
6D
ecem
ber
2.83
2
3.03
37.
101.
697
2.
015
18.7
30.
658
0.
648
-1.5
81.
953
2.
732
39.8
6
Coc
onut
Oil
- (P
hilip
pine
s/In
done
sia)
, bul
k, c
.I.f R
otte
rdam
Cop
ra -
(Phi
lippi
nes/
Indo
nesi
a), b
ulk,
c.I.
f N.W
. Eur
ope
Sug
ar-In
tern
atio
nal S
ugar
Agr
eem
ent (
ISA
) FO
B C
arib
bean
Por
t.S
oybe
ans
(US
), c.
i.f. R
otte
rdam
Ric
e (T
hai)
5% b
roke
n, w
hite
rice
(WR
), M
illed,
indi
cativ
e pr
ice
base
d on
wee
kly
surv
eys
of e
xpor
t tra
nsac
tions
,
g
over
nmen
t sta
ndar
d, f.
o.b.
Ban
gkok
Ric
e (T
hai)
25%
bro
ken,
WR
, mille
d, in
dica
tive
surv
ey p
rice,
gov
ernm
ent s
tand
ards
, f.o
.b. B
angk
okR
ice
(Tha
i) 35
% b
roke
n, W
R, m
illed,
f.o.
b. B
angk
okM
aize
(US
), N
o. 2
, yel
low
, f.o
.b. U
S G
ulf P
orts
Cof
fee
Inte
rnat
iona
l Cof
fee
Org
aniz
atio
n in
dica
tor p
rice,
oth
er m
ild A
rabi
cas,
ave
rage
New
Yor
k an
d B
rem
en/H
ambu
rg m
arke
ts, e
x-do
ckC
offe
e In
tern
atio
nal C
offe
e O
rgan
izat
ion
indi
cato
r pric
e, R
obus
tas,
ave
rage
New
Yor
k an
d Le
Hav
re/M
arse
illes
mar
kets
, ex-
dock
Ban
ana
(Cen
tral a
nd S
outh
Am
eric
an),
maj
or b
rand
s, U
S im
port
pric
e,fre
e on
truc
k U
S G
olf p
orts
Rub
ber (
any
orig
in),
RS
S n
o. 1
, in
bale
s, R
ubbe
r Tra
ders
Ass
ocia
tion,
spo
t, N
ew Y
ork
Sou
rce:
Ban
gko
Sen
tral n
g P
ilipi
nas
Com
mod
ity P
rice
Dat
a, W
orld
Ban
k
Gro
wth
R
ate
2007
Gro
wth
R
ate
2006
2007
2006
2007
Gro
wth
R
ate
2006
Tabl
e 11
. (C
ontin
ued)
Year
/Mon
thC
offe
e, A
rabi
caC
offe
e, R
obus
taB
anan
aR
ubbe
r
2006
2007
Gro
wth
R
ate

AGRICULTURAL FOREIGN TRADE DEVELOPMENT
2 0 0 7 A N N U A L
i 52
FOREWORD
This is the 19th edition of the Agricultural Foreign Trade Development Report which is an annual publication of the Bureau of Agricultural Statistics (BAS). This edition presents statistics on the country’s agricultural trade performance in fiscal year 2007. The first part of this report contains the explanatory notes that describe the summary tables on Philippine agricultural trade. The next part presents the overall agricultural trade situation, trade with the country’s trading partners and consolidated tables on the volume and value of top ten agricultural exports and imports. The last part highlights the world prices of selected commodities.
This report is based on the 2004 Philippine Standard Commodity
Classification (PSCC) Code which defines products using 10-digit codes as compared with the 7-digit of the 1999 PSCC Code. For comparability of data, the formats established in the previous issues are maintained.
The agricultural trade statistics were provided by the National
Statistics Office (NSO) while the world price statistics were obtained from Bangko Sentral ng Pilipinas (BSP) and the World Bank.
To help us improve the BAS’ information support service to the client
and stakeholders in the agriculture sector, comments and suggestions from our readers will be greatly appreciated.
ROMEO S. RECIDE Director
Figure 25 WORLD PRICES OF COCONUT OIL JANUARY - DECEMBER 2006-2007
0.50
0.60
0.70
0.80
0.90
1.00
1.10
1.20
M o nth
20062007
Figure 29WORLD PRICES OF RICE (5% broken)
JANUARY - DECEMBER 2006-2007
0.280
0.290
0.300
0.310
0.320
0.330
0.340
0.350
0.360
0.370
M o nth
20062007
Figure 26 WORLD PRICES OF COPRA
JANUARY - DECEMBER 2006-2007
0.30
0.40
0.50
0.60
0.70
0.80
M o nth
20062007
Figure 27 WORLD PRICES OF SUGAR
JANUARY - DECEMBER 2006-2007
0.17
0.20
0.23
0.26
0.29
0.32
0.35
0.38
0.41
M o nth
20062007
Figure 30WORLD PRICES OF RICE (25% broken)
JANUARY - DECEMBER 2006-2007
0.260
0.270
0.280
0.290
0.300
0.310
0.320
0.330
0.340
0.350
M o nth
20062007
Figure 28WORLD PRICES OF SOYBEAN
JANUARY - DECEMBER 2006-2007
0.20
0.25
0.30
0.35
0.40
0.45
0.50
0.55
M o nth
20062007

AGRICULTURAL FOREIGN TRADE DEVELOPMENT
2 0 0 7 A N N U A L
Figure 32 WORLD PRICES OF MAIZE
JANUARY - DECEMBER 2006-2007
0.090
0.110
0.130
0.150
0.170
0.190
M o nth
20062007
Figure 31WORLD PRICES OF RICE (35% broken)
JANUARY - DECEMBER 2006-2007
0.255
0.275
0.295
0.315
0.335
0.355
M o nth
20062007
Figure 35WORLD PRICES OF COFFEE, ARABICA
JANUARY - DECEMBER 2006-2007
2.15
2.35
2.55
2.75
2.95
M o nth
20062007
Figure 36WORLD PRICES OF COFFEE, ROBUSTA
JANUARY - DECEMBER 2006-2007
1.20
1.40
1.60
1.80
2.00
M o nth
20062007
Figure 35WORLD PRICES OF BANANA
JANUARY - DECEMBER 2006-2007
0.45
0.55
0.65
0.75
0.85
0.95
M o nth
2006
2007
Figure 36WORLD PRICES OF RUBBER
JANUARY - DECEMBER 2006-2007
1.80
2.10
2.40
2.70
3.00
M o nth
2006
2007
TERMS OF USE Agricultural Foreign Trade Development: Annual Report is a publication of the Bureau of Agricultural Statistics (BAS), Department of Agriculture. The BAS reserves exclusive right to reproduce this publication in whatever form. Should any portion of this publication be included in a report/article, the title of the publication and the BAS should be cited as the source of the data. The BAS will not be responsible for any information derived from the processing of data contained in this publication.
ISSN-2012-0370
Please direct technical inquiries to the Office of the Director Bureau of Agricultural Statistics
Ben-Lor Building, 1184 Quezon Avenue Quezon City 1100, Philippines.
Email: [email protected] Website: www.bas.gov.ph
53
AGRICULTURAL FOREIGN TRADE DEVELOPMENT
2 0 0 7 A N N U A L
Department of Agriculture BUREAU OF AGRICULTURAL STATISTICS
1184 Ben-Lor Bldg., Quezon Avenue, Quezon City
Price and Trade Statistics Section, Agricultural Marketing Statistics Analysis Division Telefax: 371-2079
[email protected] URL: http://bas.gov.ph
ISSN-2012-0370
DEPARTMENT OF AGRICULTURE BUREAU OF AGRICULTURAL STATISTICS PHILIPPINES
Related Documents