Welcome message from author
This document is posted to help you gain knowledge. Please leave a comment to let me know what you think about it! Share it to your friends and learn new things together.
Transcript
Aging in Autism:
Symptomatology, co-occurring psychopathology, and
cognitive functioning across the adult lifespan
Anne Geeke Lever
The work reported in this doctoral thesis was financially supported by a Vidi grant of the
Netherlands Organization for Scientific Research Social Sciences (NWO MagW) awarded to
Hilde M. Geurts (grant number 452-10-003).
ISBN: 978-94-028-0133-0
Cover design: Nikki Ritmeijer
Printing: Ipskamp Drukkers B.V., Enschede
© Anne Geeke Lever, Amsterdam, 2016
All rights reserved. No part of this publication may be reproduced or transmitted in any form
by any means without permission in writing of the author.
Aging in Autism:
Symptomatology, co-occurring psychopathology, and
cognitive functioning across the adult lifespan
ACADEMISCH PROEFSCHRIFT
ter verkrijging van de graad van doctor
aan de Universiteit van Amsterdam
op gezag van de Rector Magnificus
prof. dr. D.C. van den Boom
ten overstaan van een door het College voor Promoties ingestelde commissie,
in het openbaar te verdedigen in de Agnietenkapel
op donderdag 19 mei 2016, te 14:00 uur
door
Anne Geeke Lever
geboren te Apeldoorn

Promotiecommissie
Promotor: Prof. dr. H.M. Geurts Universiteit van Amsterdam
Copromotor: Prof. dr. K.R. Ridderinkhof Universiteit van Amsterdam
Overige leden: Prof. dr. S.P.J. van Alphen Vrije Universiteit Brussel
Prof. dr. I.A. van Berckelaer-Onnes Universiteit Leiden
Prof. dr. F.G.E. Happé King’s College London
Prof. dr. B.A. Schmand Universiteit van Amsterdam
Prof. dr. R.W.H.J. Wiers Universiteit van Amsterdam
Faculteit der Maatschappij- en Gedragswetenschappen
TABLE OF CONTENTS
Chapter 1 General introduction 7
Chapter 2 Lifelong lasting? Self- and other-reported ASD symptoms
across adulthood
19
Chapter 3 Co-occurring psychopathology in young, middle-aged, and older
adults with autism spectrum disorder
43
Chapter 4 Age-related differences in cognition across the adult lifespan in
autism spectrum disorder
65
Chapter 5 Atypical working memory decline across the adult lifespan in
autism spectrum disorder?
85
Chapter 6 Reactive and proactive interference control in adults with autism
spectrum disorder across the lifespan
109
Chapter 7 Summary and general discussion 139
Dutch summary (Nederlandse samenvatting) 155
References 165
List of abbrevations 187
Acknowledgements (Dankwoord) 191
Curriculum Vitae, publications, and author contributions 195


Chapter 1
General introduction
8 | Chapter 1
In the 1940s, Leo Kanner described several cases of children suffering from “inborn autistic
disturbances of affective contact” or “early infantile autism”. The behavior of these children was
mainly characterized by an inability to relate to people, but also included an unusual desire for
aloneness, an insistence on sameness, echolalia, and disturbance by loud noises and moving
objects (Kanner, 1943; Kanner, 1944). In the same period, Hans Asperger noticed analogous
peculiarities in children labeled as “autistic psychopaths” (Asperger, 1944). In addition to the
observed commonalities, both Kanner and Asperger mentioned considerable differences
between children in the severity and quality of manifested symptoms. Although the concept of
autism has been subject to several changes throughout the years, both authors described features
that are still considered at the core of the disorder. Currently, we use the term “autism spectrum
disorder” (ASD) to refer to lifelong, heterogeneous, neurobiological developmental disorders
characterized by persistent deficits in social communication and social interaction, and restricted,
repetitive patterns of behavior, interests, or activities, which cause clinically significant
impairments in daily functioning (American Psychiatric Association, 2000; American Psychiatric
Association, 2013; Volkmar, Lord, Bailey, Schultz, & Klin, 2004).
Although it was initially described as a childhood disorder (Kanner, 1943; Kanner,
1944) and research has mainly focused on ASD in children (Mukaetova‐Ladinska, Perry, Baron,
& Povey, 2012), the persistence of autistic behavior into adulthood has been recognized
(Gillberg & Steffenburg, 1987; Kanner, 1971; Rumsey, Rapoport, & Sceery, 1985) and evidence
exists for the lifelong nature of the condition. For example, the prevalence rate found in an adult
population is similar to the estimates reported in children and adolescents, namely approximately
1% (Brugha et al., 2011), and the diagnostic status of ASD has been proven to be relatively stable
(see Magiati, Tay, & Howlin, 2014, for an overview; Billstedt, Gillberg, & Gillberg, 2011;
Cederlund, 2008; Howlin, Moss, Savage, & Rutter, 2013; Piven, Harper, Palmer, & Arndt, 1996).
Even when diagnostic criteria are no longer met, ASD-like behavior and significant difficulties
often continue to be present (Piven et al., 1996). Being a relatively ‘modern’ diagnosis (Happé &
Charlton, 2012), those children described in the 1940s are now approaching an advanced age.
For example, Donald T., the first case described by Leo Kanner (1943), is currently 82 years old.
However, knowledge on ASD in late adulthood is limited and, yet, needed (Happé & Charlton,
2012; Perkins & Berkman, 2012; Piven & Rabins, 2011; Wright, Brooks, D'Astous, & Grandin,
2013).
Research into aging and ASD is warranted for various reasons. Firstly, aging adults with
ASD are likely to face challenges associated with their own condition, but also with those related
to the aging process (Mukaetova‐Ladinska et al., 2012), possibly leading to increased difficulties,
lower well-being, and a greater reliance on health services. Secondly, the aging population is
General introduction | 9
rising. According to the World Health organization (WHO), in 2050, more than 1 in 5 individuals
will be 60 years or older. This would also translate to an increased number of older adults with
ASD. Furthermore, independently from the growing aging population, the number of ASD
diagnoses is increasing. Although it is unclear whether the incidence of ASD has augmented, at
least diagnostic criteria have been broadened, awareness of the condition has increased, and
ascertainment has improved (Fombonne, 2009; Rutter, 2005). Thirdly, lifetime incremental
societal costs for individuals with ASD are extremely high and mainly due to lost productivity
and adult care (Ganz, 2007), but those costs necessary for the care or treatment of individuals
with ASD in the sixth decade of life or older are not yet estimated. As these costs are expecting
to rise, the need to adopt a life course perspective and to identify and anticipate older adults’
requirements for support and service in order to alleviate the societal burden of ASD becomes
evident (see Perkins & Berkman, 2012; Totsika, Felce, Kerr, & Hastings, 2010; Wright et al.,
2013). These potential implications on an individual and clinical, as well as societal level indicate
that it is worthwhile to study a developmental process such as aging in a developmental disorder
such as ASD.
Aging is a dynamic process associated with several changes. While some of these
changes are related to growth, such as a gain of knowledge and wisdom, other changes involve
losses, such as a decline in physical and cognitive functioning (Baltes, Staudinger, &
Lindenberger, 1999). As ASD in late adulthood is largely under-examined, it seems reasonable
to focus on basic issues. Therefore, we will first investigate ASD symptomatology and its cross-
sectional developmental trajectory. Given that psychiatric disorders such as depression and
anxiety are commonly associated with ASD, the second emphasis is on co-occurring
psychopathology. Thirdly, as typical aging is associated with an age-related decline in several
cognitive domains, we will examine cognitive functioning in ASD. We do not only consider late
adulthood, but also young and middle adulthood. Development is a continuous process of
acquisition, maintenance, transformation, and attrition that encompasses the entire life course
(Baltes et al., 1999). Examining ASD over the adult lifespan should allow us to identify more
subtle age-related differences. Within this chapter, we provide an overview of the described three
main themes (i.e., ASD symptomatology, co-occurring psychopathology, and cognitive
functioning) and conclude with an outline of this dissertation.
Symptomatology of ASD
Given that the diagnosis of ASD is based on the presentation of certain behavioral symptoms
and the developmental trajectory of these symptoms over the adult lifespan is largely unknown,
this will be the first focus of this dissertation. While at the start of the studies described in the
10 | Chapter 1
following chapters the fourth edition of the Diagnostic and Statistical Manual of Mental
Disorders (DSM-IV) (American Psychiatric Association, 2000) was in use, clinicians and
researchers currently refer to the fifth edition (DSM-5) (American Psychiatric Association, 2013).
Important changes of this revision include the abolition of various subtypes (i.e., autistic
disorder, Asperger’s syndrome, pervasive disorder not otherwise specified) and the formation of
one overall autism spectrum diagnosis (i.e., ASD), the shift from a triad of impairments (i.e.,
social deficits, communication deficits, and restricted, repetitive behaviors and interests [RRBIs])
to a dyad (i.e., social-communication impairments and RRBIs), and the addition of atypical
sensory behavior as a RRBI subdomain. In line with the former edition, we refer to the three
diagnostic subtypes of the DSM-IV in the next chapters (i.e., participants were diagnosed
according to DSM-IV criteria). However, in order to also meet the amendments of the diagnostic
criteria, we mainly describe ASD symptomatology as currently defined by the DSM-5 and we
also investigate a newly relevant subdomain in the DSM-5 (i.e., sensory sensitivity).
As aforementioned, core symptoms of ASD include qualitative impairments in social
communication and social interaction, and restricted, repetitive patterns of behavior, interests,
or activities (American Psychiatric Association, 2000; American Psychiatric Association, 2013).
More specifically, atypicalities in social-emotional reciprocity, nonverbal communication,
establishing and maintaining relationships, and sensory sensitivity are observed. The severity and
quality of the symptoms varies across individuals (American Psychiatric Association, 2013).
Some individuals with ASD are non-verbal, have an intellectual disability (ID), and require
substantial support. Others possess good language and intellectual abilities, are able to live
independently, have a partner, and maintain a job. Although milder ASD symptoms, early
language development, and higher intellectual abilities predict better outcomes (Howlin & Moss,
2012), outcome of the majority of individuals with ASD is rather poor (see Henninger & Taylor,
2013; Howlin & Moss, 2012; Levy & Perry, 2011; Magiati et al., 2014, for reviews).
The onset of ASD lies within childhood, but symptoms may not become fully manifest
until the requirements of the environment exceed an individual’s ability (American Psychiatric
Association, 2013). For instance, an adult may run into difficulties when starting a romantic
relationship in which emotional reciprocity is required or when retiring from work after which
daily structure falls away. Among adolescents and adults with ASD there is much more variability
in the presentation of ASD symptoms and functional impairments when compared to children
with ASD (Lai & Baron-Cohen, 2015). Furthermore, throughout the years, individuals may
develop coping or camouflaging strategies to mask specific social difficulties (Lai et al., 2011).
Hence, in addition to behavioral heterogeneity across individuals, symptoms may also change
over the lifespan (Geurts & Jansen, 2012; Howlin et al., 2013; Piven et al., 1996).
General introduction | 11
An increasing number of studies focused on severity of ASD symptomatology and its
changes over time. There is evidence that some ASD symptoms abate over time (Howlin et al.,
2013; Piven et al., 1996; see Magiati et al., 2014; Seltzer, Shattuck, Abbeduto, & Greenberg, 2004,
for reviews). For example, repetitive behavior seems to improve with increasing age (Esbensen,
Seltzer, Lam, & Bodfish, 2009; Howlin et al., 2013; Shattuck et al., 2007) as well as social
functioning (Bastiaansen, Thioux et al., 2011). Nevertheless, the oldest individuals included were
64 years old. Knowledge of ASD symptomatology in (middle and) late adulthood is, thus, still
limited, even though crucial in elucidating the magnitude and specificity of age-related challenges
(Piven & Rabins, 2011). There are, however, several diagnostic pitfalls when studying older
individuals with ASD. For example, assessing and diagnosing ASD in older adults is challenging
because the developmental history that is needed for the diagnosis is difficult to obtain
(Fombonne, 2012; Happé & Charlton, 2012), there is unawareness about ASD in those working
with older adults (van Niekerk et al., 2011), and individuals may have acquired strategies to
camouflage ASD symptoms (Lai et al., 2011). In the current thesis, we will investigate ASD
symptomatology across the adult lifespan and age-related differences herein (Chapter 2).
Co-occurring psychopathology in ASD
ASD is associated with high rates of co-occurring psychiatric disorders. Approximately 70% of
the ASD population has to deal with psychiatric problems at least once in their lives (e.g., Buck
et al., 2014; Hofvander et al., 2009; Simonoff et al., 2008), even though rates are lower among
individuals with ASD and an ID (Matson & Cervantes, 2014). Not only is psychopathology a
common phenomenon, many individuals who contact mental health services with associated
psychopathology are later diagnosed with ASD (Geurts & Jansen, 2012). Furthermore, older
adults with mood disorders may have high ASD traits and suffer from undiagnosed ASD
(Geurts, Stek, & Comijs, 2016). The presence of psychiatric disorders has a great impact on
quality of life and emotional well-being, future outcome, and demands for professional help
(Lainhart, 1999; Matson & Cervantes, 2014; Seltzer et al., 2004; Vannucchi et al., 2014; Wood &
Gadow, 2010).
The study of psychopathology in adults with ASD has recently received more attention
and a substantial number of studies indicated high rates of co-occurring psychiatric disorders
not only in childhood (de Bruin, Ferdinand, Meester, de Nijs, & Verheij, 2007; Leyfer et al., 2006;
Lundström et al., 2015; Mattila et al., 2010; Mukaddes, Hergüner, & Tanidir, 2010; Simonoff et
al., 2008; Sinzig, Walter, & Doepfner, 2009; van Steensel, Bögels, & de Bruin, 2013) but also in
adulthood (Buck et al., 2014; Croen et al., 2015; Ghaziuddin & Zafar, 2008; Hofvander et al.,
2009; Joshi et al., 2013; Lugnegård, Hallerbäck, & Gillberg, 2011; Roy, Prox-Vagedes, Ohlmeier,
12 | Chapter 1
& Dillo, 2015). Nevertheless, the majority of these studies focused on young adulthood and
knowledge of middle and late adulthood is still scarce. In the general population,
psychopathology rates are lower in older adults (Bijl, Ravelli, & Van Zessen, 1998; Kessler et al.,
2005) and while there is some evidence that this pattern is also present in adults with ASD
(Totsika et al., 2010), this might be related to the inclusion of adults with ASD combined with
an ID. A small study including adults with ASD without ID described, however, more psychiatric
cases in older than in younger adults (Roy et al., 2015). We will compare psychopathological
symptoms and disorders in a large sample of cognitively able young, middle, and older adults
with and without ASD and explore several risk factors that may affect psychopathology (Chapter
3).
Cognition functioning in ASD
In addition to behavioral symptoms and frequently co-occurring psychopathology is ASD
associated with cognitive difficulties. Three main cognitive theories have been proposed to
explain the challenges that individuals with ASD encounter (e.g., see Brunsdon & Happé, 2014;
Frith, 2012, for an overview). The theory of mind (ToM) deficit hypothesis originally stated that
a core problem in ASD is the limited ability to identify, attribute and manipulate mental states in
self and others in order to predict and explain behavior (Baron-Cohen, Leslie, & Frith, 1985).
More recently, this idea have been refined and studies have suggested intact explicit knowledge
of mental states in cognitively able adults with ASD, but specific problems in spontaneous,
implicit ToM (Senju, Southgate, White, & Frith, 2009). The weak central coherence account
originally postulated that individuals with ASD present a deficit in global information processing
(Frith & Happé, 1994; Frith, 1989; Happé, 1999). However, in a more recent version of this
theory, a different processing style characterized by superior local processing rather than a deficit
in extracting global information is proposed (Happé & Frith, 2006; Happé & Booth, 2008).
Individuals with ASD would prefer to process incoming information in a fractionated and local
way, but are able to perceive global coherence when instructed to do so (Happé & Frith, 2006)
or when receiving sufficient time (Van der Hallen, Evers, Brewaeys, Van den Noortgate, &
Wagemans, 2015). Finally, the executive dysfunction theory originally claimed an underlying
deficit in executive functions (EF) (Pennington & Ozonoff, 1996; Russell, 1997), but the primacy
of EF problems in ASD is currently not assumed anymore (Hill, 2004). In this thesis, although
we also assess ToM, the main focus is on EF.
EF is an umbrella term referring to various cognitive functions involved in control and
coordination that are necessary for complex, goal-directed behavior. An alternative term used to
indicate a similar concept is cognitive control (Solomon, Ozonoff, Cummings, & Carter, 2008).
General introduction | 13
Cognitive control refers to those processes that allow for monitoring and regulating goal-directed
behavior in order to flexibly adapt behavior to environmental requirements (Botvinick, Braver,
Barch, Carter, & Cohen, 2001). These functions are essential for our daily life functioning. Both
terms are interchangeably used in the current dissertation.
Individuals with ASD demonstrate deficits in various EF domains, including working
memory and inhibition (Geurts, van den Bergh, & Ruzzano, 2014; Hill, 2004; O'Hearn, Asato,
Ordaz, & Luna, 2008; Russell, 1997). However, not only EF has been found to be deficient.
Children and adolescents with ASD also present difficulties in other cognitive domains, such as
episodic memory (Boucher, Mayes, & Bigham, 2012) and ToM (Yirmiya, Erel, Shaked, &
Solomonica-Levi, 1998). Cognitive challenges encountered by young individuals with ASD how
large overlap with those faced by typically developing older individuals. For example, typical
aging is associated with decline in various cognitive domains, such as EFs (Borella, Carretti, &
De Beni, 2008; Friedman, Nessler, Cycowicz, & Horton, 2009; Hasher & Zacks, 1988; Nyberg,
Lövdén, Riklund, Lindenberger, & Bäckman, 2012; Park et al., 2002; Park & Reuter-Lorenz,
2009; Salthouse & Meinz, 1995; Salthouse, 1996; Verhaeghen & Cerella, 2002), episodic memory
(Goh, An, & Resnick, 2012; Hultsch, 1998; Nyberg et al., 2012; Park et al., 2002), and advanced
ToM (Charlton, Barrick, Markus, & Morris, 2009; Duval, Piolino, Bejanin, Eustache, &
Desgranges, 2011; Kemp, Després, Sellal, & Dufour, 2012; Maylor, Moulson, Muncer, & Taylor,
2002; Moran, 2013; Wang & Su, 2013). Given the overlap between cognitive difficulties at
younger ages in ASD and in typical senescence, the question is what will happen to cognition
when individuals with ASD grow old: Will the cognitive difficulties in ASD become worse during
aging, will they remain stable, or will they diminish?
In the ASD literature only a few studies investigated cognition in older adults.
Persistence of cognitive difficulties has been reported (Geurts & Vissers, 2012; James,
Mukaetova‐Ladinska, Reichelt, Briel, & Scully, 2006), but the developmental trajectories of
individuals with ASD compared to typically developing older adults did differ across cognitive
domains (Geurts & Vissers, 2012; Ring, Gaigg, & Bowler, 2016). In some domains (e.g., verbal
episodic memory), older adults with ASD showed a similar age-related pattern compared to
typical older adults, whereas in other domains they demonstrated an aggravated pattern (e.g.,
visual episodic memory) or an attenuated pattern (e.g., generativity). Therefore, based on the
first, exploratory ASD group study in older adults (Geurts & Vissers, 2012), we will examine
three possible cross-sectional developmental trajectories in this thesis. First, individuals with
ASD could present similar or parallel age-related differences compared to individuals without
ASD, most likely characterized by an age-related decline in cognitive functioning. Second,
individuals with ASD could demonstrate a divergent or aggravated pattern in which age-related
14 | Chapter 1
differences are increased compared to controls. In this hypothetical situation, ASD and aging
could be two factors that jeopardize cognitive functioning (i.e., double jeopardy). Third,
individuals with ASD could show a convergent or attenuated pattern, characterized by reduced
age-related differences compared to controls. ASD would then represent a ‘safeguard’ against
age-related decline. Thus, we aim to elucidate whether the developmental trajectory of adults
with ASD follow a different age-related pattern compared to those without ASD, in addition to
a comparison of cognitive performance between adults with and without ASD (Chapter 4, 5, 6).
In Chapter 4, we investigate whether we can replicate and extend the previous findings
in a much larger sample by means of frequently used neuropsychological measures. While general
neuropsychological studies are helpful for translating the findings into clinical practice, they may
not capture more fine-grained aspects of cognitive functioning. Therefore, we also use
experimental paradigms to examine two EFs more in-depth: working memory (WM; Chapter 5)
and inhibition (Chapter 6). These two domains are both associated with the temporal integration
of information, essential for goal-directed action, served by the prefrontal cortex and are,
therefore, often considered two sides of the same coin (Fuster, 2002).
Working memory
WM is the ability to maintain and manipulate information online in the absence of actual sensory
information in order to guide goal-directed behavior (e.g., Baddeley, 2003; Cowan, 2014).
Individuals with ASD generally show WM impairments in the visual-spatial domain (Steele,
Minshew, Luna, & Sweeney, 2007; Williams, Goldstein, Carpenter, & Minshew, 2005; Williams,
Goldstein, & Minshew, 2006; but see Ozonoff & Strayer, 2001), and in complex WM tasks
(Koshino et al., 2008; Steele et al., 2007; Williams et al., 2006), but not on verbal WM tasks
(Koshino et al., 2005; Williams et al., 2005). Results are, however, rather inconsistent (see
Barendse et al., 2013, for an overview). These inconsistencies have been explained by the age
range studied (Happé, Booth, Charlton, & Hughes, 2006; Luna, Doll, Hegedus, Minshew, &
Sweeney, 2007; but see Rosenthal et al., 2013), by the type of task used (Steele et al., 2007), or
by differences between individuals. Considerable inter-individual differences have not only been
found within the ASD population (de Vries & Geurts, 2014; Geurts, Sinzig, Booth, & Happé,
2014; Towgood, Meuwese, Gilbert, Turner, & Burgess, 2009), but also within the healthy aging
population (Eenshuistra, Ridderinkhof, & van der Molen, 2004; Vogel & Awh, 2008; Werkle-
Bergner, Freunberger, Sander, Lindenberger, & Klimesch, 2012). Therefore, we investigate age-
related differences in WM performance and inter-individual differences herein in order to
identify possible factors accounting for inconsistencies within the literature (Chapter 5).
General introduction | 15
Inhibition
Inhibition refers to the mechanism or set of processes that result in the containment of prepotent
behavioral responses when such responses are reflex-like, premature, inappropriate or incorrect
(Ridderinkhof, van den Wildenberg, Segalowitz, & Carter, 2004). A lack of inhibitory control is
thought to underlie some of the core symptoms observed in ASD (Lopez, Lincoln, Ozonoff, &
Lai, 2005). A specific aspect of inhibition is interference control, or resistance to distractor
interference (Friedman & Miyake, 2004; Nigg, 2000). It refers to the ability to suppress irrelevant
information. The existing literature on interference control in ASD is rather inconsistent, with
some studies demonstrating impairments among individuals with ASD (Adams & Jarrold, 2012;
Christ, Holt, White, & Green, 2007; Christ, Kester, Bodner, & Miles, 2011; Henderson et al.,
2006), and others showing no differences between individuals with ASD and typically developing
controls (Geurts, Luman, & Van Meel, 2008; Larson, South, Clayson, & Clawson, 2012; Schmitz
et al., 2006; Solomon et al., 2008; Solomon et al., 2009). A recent meta-analysis indicated that
individuals with ASD were moderately impaired in inhibitory control, but substantial
heterogeneity across studies was also observed (Geurts et al., 2014). The use of rather crude
measures, such as mean reaction times, was suggested to be one of the major reasons for this
heterogeneity. More fine-grained models of specific aspects of cognitive control are needed to
better understand whether and when individuals with ASD encounter difficulties. Therefore, we
adopt the theoretical framework of the dual-route model (Kornblum, Hasbroucq, & Osman,
1990) and its extension, the activation-suppression hypothesis (Ridderinkhof, 2002), to examine
whether individuals with ASD have difficulties in the underlying mechanisms of interference
control and to explore how age affects interference control processes (Chapter 6).
Aim and outline of the dissertation
The literature so far demonstrates a paucity when it comes to the investigation of ASD after
young adulthood. The current dissertation aims at advancing knowledge of what happens to
individuals with ASD when they grow old and focuses on age-related differences in
symptomatology, co-occurring psychopathology, and cognitive functioning in order to,
ultimately, provide guidelines for the development of appropriate treatment and support for
adults with ASD across the lifespan, including older adulthood.
Data of this cross-sectional study was collected between March 2012 and July 2014.
The sample described in the current dissertation (with exception of Study 1 in Chapter 6)
consisted of 241 adults with a formal clinical diagnosis within the autism spectrum, diagnosed
prior to participating in the current study, and a comparison group comprising 199 adults
without ASD. All individuals were between 19 and 79 years of age and had an estimated IQ
16 | Chapter 1
above 80. The ASD group was recruited through several mental health institutions across the
Netherlands, and by means of advertisements on client organizations’ websites. We obtained
additional diagnostic information from all participants based on subjective reports of ASD
characteristics (Autism-spectrum Quotient; n = 237) and/or standardized observations of the
participants’ behavior (Autism Diagnostic Observation Schedule; n = 142). The comparison
group was recruited via advertisements on the university website and social media, and through
the social environment of the researchers. All participants filled out a series of questionnaires on
ASD symptomatology, co-occurring psychopathology, and cognitive functioning, providing data
for mainly chapters 2 and 3. A subsample was selected and underwent an extensive
(neuro)psychological assessment described in chapters 4, 5, and 6. The final sample size
described in each chapter varies according to the measures of interest involved and the research
aims (ASD group: n = 118-237; COM group: n = 118-198).
In Chapter 2, we investigate ASD symptoms. It has been suggested that symptoms
may abate with age, but examination of symptoms in late adulthood is largely missing.
Furthermore, we compare self-report with proxy-report as it has been suggested that individuals
with ASD lack self-awareness and have difficulties reflecting on their own functioning. In
addition to ASD symptomatology, individuals with ASD suffer from co-occurring psychiatric
symptomatology such as depression and anxiety. Therefore, Chapter 3 elucidates whether co-
occurring psychopathology is as prevalent in older adults with ASD as it is in younger adults
with ASD. Furthermore, we explore several risk factors that may be associated with
psychopathology. Given that cognition is highly sensitive to aging and ASD is already associated
with cognitive deficits at younger ages, the remaining chapters focus on cognitive functioning in
adults with ASD. The exploratory analyses from the pioneering study on older individuals with
ASD (Geurts & Vissers, 2012) preceding the current studies, suggested that these older
individuals with ASD may show accelerated cognitive decline in late adulthood, even though
some cognitive functions are spared and not subject to an aggravated trajectory. We aim to
replicate these findings in a much larger and better defined sample in Chapter 4. In this chapter,
a neuropsychological assessment of visual and verbal episodic memory, generativity, and ToM
is described. To further and more specifically investigate cognitive functioning, we study two
EFs that are often found to be impaired in ASD by means of two experimental paradigms. In
Chapter 5, we focus on working memory and explore whether inter-individual differences may
explain age-related differences in working memory decline. Chapter 6 describes a study on
interference control in which we examine processes underlying reactive and proactive control.
In addition to conventional statistical analyses, we apply Bayesian hypothesis testing in order to

General introduction | 17
substantiate the evidential strength for our findings in Chapter 5 and 6. Finally, in Chapter 7 we
summarize and discuss the main findings and elaborate on clinical implications.

Chapter 2
Lifelong lasting? Self- and other-reported
ASD symptoms across adulthood
Based on: Lever, A. G. & Geurts, H. M. (2016). Lifelong lasting? Self- and other-reported ASD
symptoms across adulthood. Manuscript submitted.
20 | Chapter 2
ABSTRACT
Autism spectrum disorder is a lifelong neurodevelopmental disorder and the diagnosis is based
on behavioral symptoms. There is some evidence that ASD symptomatology might abate over
time. However, whether this amelioration protracts until late adulthood is largely unknown.
Therefore, we investigated general ASD symptoms, and also social-emotional reciprocity and
sensory sensitivity, in a cross-sectional study of a large group of adults with and without ASD
(N = 435, age range 19-79 years) by means of self- and other-reported questionnaires. Self-report
was poorly concordant to other-report, suggesting that both measures reveal different aspects
of symptomatology. Moreover, although age-related differences in social-emotional reciprocity
were not observed, general and sensory symptoms increased in middle adulthood and decreased
in late adulthood. The high number of self-reported ASD symptoms and the persistence of these
symptoms across the adult lifespan, underline the lifelong nature of this neuropsychiatric
condition.
Keywords: autism spectrum disorder, symptomatology, self- and other-report, AQ, aging
Age-related differences in ASD symptomatology | 21
INTRODUCTION
ASD symptomatology
In (1943), Leo Kanner described the first case series of children suffering from “inborn autistic
disturbances of affective contact”. These children demonstrated an inability to relate themselves
to people and situations and an unusual desire of aloneness. Moreover, among other features, the
children’s behavior was governed by an obsessive eager to sameness and by atypical reactions to
sounds and movements. In the same period, independently of Kanner, Hans Asperger (1944)
noticed similar peculiarities in children labeled as “autistic psychopaths”. Albeit both authors
recognized and even examined the developmental character of the condition and the
heterogeneity in symptom manifestation, it took many years until researchers and clinicians
structurally studied its development beyond childhood.
Nowadays, “autism spectrum disorder” (ASD) refers to a broad range of
neurodevelopmental disorders that are characterized by persistent deficits in social
communication and social interaction, and restricted, repetitive patterns of behavior, interests,
or activities that cause clinically significant impairments in daily functioning (American
Psychiatric Association, 2013). Symptoms of ASD include atypicalities in social-emotional
reciprocity, nonverbal communication, establishing and maintaining relationships, and sensory
sensitivity. ASD is considered a lifelong condition, which is also observed in the prevalence
estimations of approximately 100 per 10.000 individuals meeting criteria for an ASD,
independent of age (Brugha et al., 2011). Furthermore, it is acknowledged that, despite its
generally early onset, symptoms can be masked until available capacities are no longer sufficient
to meet environmental requirements (American Psychiatric Association, 2013). Symptoms may
also change over the lifespan (Geurts & Jansen, 2012; Howlin et al., 2013; Piven et al., 1996).
Knowledge on ASD symptomatology in middle and late adulthood is, however, still limited, even
though critical in elucidating the magnitude and specificity of age-related changes and for
recognizing ASD in adulthood (Piven & Rabins, 2011). The current study aims at investigating
whether ASD symptoms abate, remain stable, or become more severe over the entire adult
lifespan.
Age-related changes in ASD symptoms
Several outcome studies have indicated that adolescents and adults with ASD have rather poor
outcomes, with a minority living independently, being employed or attained education, and
having close reciprocal relationships (see Henninger & Taylor, 2013; Howlin & Moss, 2012; Levy
& Perry, 2011; Magiati et al., 2014, for reviews). Early language development, higher intellectual
22 | Chapter 2
abilities, and milder ASD symptoms are predictors of a more favorable future (Howlin & Moss,
2012). Despite poor outcome, there is evidence that ASD symptoms abate over time (see Magiati
et al., 2014; Seltzer et al., 2004, for reviews). For example, Shattuck and colleagues (2007)
examined changes in ASD symptoms over a 4.5 years period among individuals with ASD aged
10-52 years. Overall, while nonverbal communication impairments remained stable and
symptoms of verbal communication and social reciprocity ameliorated, improvement was
especially observed in the repetitive behavior domain. Similarly, ASD severity decreased over an
approximately 37 years period (range at follow-up 29-64 years), with, again, significant
improvement on the restricted, repetitive behavior domain (Howlin et al., 2013), and older
individuals with ASD (until 62 years) displayed fewer and less severe repetitive behaviors than
younger individuals (Esbensen et al., 2009). With regard to social behaviors, age (range 18-54
years) was not associated with attenuation of social symptoms, even though social functioning
improved (Bastiaansen et al., 2011). This latest finding is in line with anecdotal accounts stating
that rather than an improvement of social symptoms, people learn how to cope with them.
Learning from experiences would explain why social functioning ameliorates, while social
symptoms remain stable. In sum, there is consistency in repetitive behavior improving with
increasing age, whereas changes in social communication and interaction symptoms are less
clear. Moreover, the oldest individuals examined were 64 years old and it is unknown whether
and how in ASD symptoms change in late(r) adulthood.
Like in previous studies, we focus on general symptoms of ASD. However, we will also
zoom in on the two major domains of (1) social interaction and social communication, and (2)
restricted, repetitive behavior, interests, or activities. We will concentrate on one subdomain of
each: (1) an important aspect of socio-emotional reciprocity, namely empathy, and (2) sensory
sensitivity. Social interactions and relationships rely on the fundamental ability to empathize with
others (De Waal, 2008). Empathy can be defined as the capacity to understand another person’s
thoughts and feelings and has a complex and multidimensional nature, including both cognitive
and emotional processes (Davis, 1983). Cognitive empathy refers to the ability to understand the
thoughts and emotions of others by adopting their perspective. Affective empathy refers to the
ability to experience feelings elicited by the emotional experiences of others. Individuals with
ASD are thought to have impaired cognitive empathy, but intact affective empathy (Jones,
Happé, Gilbert, Burnett, & Viding, 2010). The effect of age in adulthood is, however, unclear.
When examining the effect of age on empathy in the general population, the pattern of findings
is mixed. In cross-sectional studies, there seems to be a negative effect (e.g., Bailey, Henry, &
Von Hippel, 2008; Grühn, Rebucal, Diehl, Lumley, & Labouvie-Vief, 2008) or no effect (e.g.,
Eysenck, Pearson, Easting, & Allsopp, 1985) of age. The lack of an age effect is also revealed in
Age-related differences in ASD symptomatology | 23
longitudinal studies (e.g., Grühn et al., 2008). However, recently, it has been demonstrated in a
cross-sectional sample that both cognitive and affective components of empathy increased from
young to middle adulthood and declined in late adulthood, revealing an inverted U-shape form
(O'Brien, Konrath, Gruhn, & Hagen, 2013). This pattern is explained by the dynamic integration
theory proposing that emotional representations become increasingly more complex through
cognitive development and accumulating life experiences, and peak in middle adulthood.
Thereafter, in late adulthood, these representations are challenged by age-related biological and
cognitive decline (Labouvie-Vief, 2009). We will test whether an inverted U-shape is also
observed in individuals with ASD, whose starting point may already be lower.
Sensory sensitivity, newly relevant in the DSM-5 (American Psychiatric Association,
2013), involves both hypo- and hyperreactivity to sensorial information, including auditory,
olfactory, gustatory, tactual, visual, proprioceptive, and vestibular stimuli. Anecdotal accounts
on sensory sensitivity in ASD revealed that these symptoms do not seem to abate, although one
might be better able to cope with them (Grandin, 2011). In line with these accounts, self-reported
sensory symptoms did not decline in the broad general population (range 16-65 years)
(Robertson & Simmons, 2013) or in adults with ASD (18-65 years) (Crane, Goddard, & Pring,
2009), whereas parents reported improvements with age (Kern et al., 2006; Shattuck et al., 2007).
This reveals a discrepancy between what people with ASD experience themselves and how other
persons perceive it.
Current study
In the current cross-sectional study, we examine age-related differences in self-reported ASD
symptoms, including social-emotional reciprocity and sensory sensitivity, in a large sample of
adults with and without ASD, and we compare self-report and other-report.
We investigate general ASD symptoms with the Autism-Spectrum Quotient (Baron-
Cohen, Wheelwright, Skinner, Martin, & Clubley, 2001) and hypothesize ASD symptoms to
abate over age in adults with ASD (Seltzer et al., 2004), even though we do not expect such a
relationship in adults without ASD (Hoekstra, Bartels, Cath, & Boomsma, 2008). Empathy is
examined with the Interpersonal Reactivity Index (Davis, 1980), a widely used and well
established instrument for the multidimensional investigation of empathy. We expect adults with
ASD to report reduced cognitive aspects of empathy (i.e., perspective taking and fantasy), but
comparable (i.e., empathic concern) or increased (i.e., personal distress) affective components
(Rogers, Dziobek, Hassenstab, Wolf, & Convit, 2007). Due to contrasting evidence, we can,
however, only speculate about the effect of age in adults with ASD. For example, age negatively
affected face-emotion recognition from childhood to adulthood (Lozier, Vanmeter, & Marsh,
24 | Chapter 2
2014), whereas age did not influence cognitive reasoning on other persons’ mental states and
eyes-emotion recognition (Chung, Barch, & Strube, 2014). Sensory sensitivity is examined with
the Sensory Sensitivity Questionnaire (SSQ) (Minshew & Hobson, 2008) and we hypothesize
the role of age to be negligible (Crane et al., 2009; Minshew & Hobson, 2008; Robertson &
Simmons, 2013). With regard to the self-other relationship, there is discussion whether
individuals with ASD are able to provide reliable information about their behavior, feelings,
thoughts, and functioning. Recently, however, it has been shown that participants and proxies
provide moderate agreement on social responsiveness, with non-significant differences between
adults with and without ASD, but the ASD sample was rather small (n = 24, age range 18-62
years) (De la Marche et al., 2015). Therefore, we will evaluate self- and other-report in a much
larger sample. The combination of both indices can reveal unique information about
symptomatology, seen from both the inside and outside perspective.
METHODS
Participants
Individuals with ASD aged 19-79 years were recruited through several mental health institutions
across the Netherlands and by means of advertisement on client organization websites.
Requirement upon study participation was to have a clinical ASD diagnosis based on DSM-IV
criteria (autism, Asperger’s syndrome, and Pervasive Developmental Disorder Not Otherwise
Specified) (American Psychiatric Association, 2000), which was generally established by a
multidisciplinary team including a psychiatrist and/or psychologist. Individuals without ASD
(comparison group [COM]) were recruited by means of advertisement on the university website
and social media and within the social environment of the experimenters. Controls were eligible
for participation when a clinical diagnosis of ASD or attention deficit hyperactivity disorder
(ADHD) and close relatives suffering from ASD or schizophrenia were absent. Based on these
criteria we excluded four individuals with ASD and nine individuals without ASD, resulting in a
sample of 440 participants (241 ASD, 199 COM).
Thereafter, 435 participants completed the AQ (98.9%; n = 237 ASD, n = 198 COM).
Of this group, 352 (n = 174 ASD, n = 178 COM) participants returned also the IRI and SSQ.
These questionnaires were completed by respectively 349 (99.1%; n = 172 ASD, n = 177 COM)
and 336 (95.5%; n = 163 ASD, n = 173 COM) participants. A proxy (e.g., partner, family
member, or friend) of the participants was asked to fill out the AQ, IRI, and SSQ. Of the 435
participants, 285 participants returned other-questionnaire data (65.5%; 136 ASD [57.4%], 149
COM [75.3%]), including 270 completed AQs (n = 125 ASD, n = 145 COM), 278 completed
Age-related differences in ASD symptomatology | 25
IRIs (n = 130 ASD, n = 148 COM), and 141 completed SSQs (n = 65 ASD, n = 76 COM). The
amount of other-SSQs is smaller than the AQs and IRIs due to its later addition to the set of
questionnaires.
Measures
Autism-Spectrum Quotient (AQ). The Dutch version of the AQ (Baron-Cohen et al., 2001;
Hoekstra et al., 2008) was administered to identify the degree to which an intellectually able adult
shows ASD traits. This self-report questionnaire comprises 50 statements about core ASD-
related features and assesses five different areas: social skills, attention switching, attention to
detail, communication, and imagination. Each statement is rated with 1 “definitely agree”, 2
“slightly agree”, 3 “slightly disagree”, and 4 “definitely disagree”. On half of the items,
endorsement of “definitely agree/slightly agree” is indicative of ASD-like behavior, whereas on
the other half “definitely disagree/slightly disagree” reveals ASD traits. These latest scores are
reversed. The item scores are summed, to a maximum score of 10 per subscale and a maximum
total score of 50. The other-version omits 10 items as these were labeled by the developers as
being too subjective to be answered by another person (Baron-Cohen et al., 2001). Higher scores
indicate more severe ASD traits. The Dutch version of the AQ has good internal consistency,
test-retest reliability, and good discriminative validity (Hoekstra et al., 2008). Missing data points
(maximum one per subscale) were substituted with the mean subscale score. The dependent
variables are the total and subscale scores (self-report) and 40-item total score (self- and other-
report).
Interpersonal Reactivity Index (IRI). The Dutch version of the IRI (Davis, 1980; de Corte
et al., 2007) was administered to examine individual differences in cognitive and emotional
attitude towards interpersonal situations. This self-report questionnaire consists of 28 items and
four subscales assessing different aspects of empathy, which is crucial of normal social
functioning, including the maintenance of social relationships and favoring pro-social behavior
(de Corte et al., 2007): (a) perspective taking, the tendency to adopt another person’s point of
view, (b) fantasy, the tendency to identify with the feelings and actions of fictitious characters,
(c) empathic concern, the tendency to experience feelings of sympathy and concern towards
others, and (d) personal distress, the tendency to feel anxious and uneasy in reaction to the
emotions of others (Davis, 1983). The first two subscales examine other-oriented behavior
(cognitive component), whereas the latter two subscales examine self-oriented behavior
(affective component). Each item is rated on a five-point Likert scale, ranging from 0 “does not
describe me well” to 4 “describes me very well”. The item scores are summed to a maximum of
28 per subscale. While higher perspective-taking scores and lower personal distress scores are
26 | Chapter 2
associated with better social functioning, correlations between social functioning and fantasy are
low. Empathic concern is not consistently related to social competence, although associated with
social success characteristics, such as selflessness and agreeableness. The Dutch version of the
IRI has adequate psychometric properties (de Corte et al., 2007). Missing data points (maximum
one per subscale) were substituted with the mean subscale score. The dependent variables are
the subscale scores (self-report) and total score (self- and other-report).
Sensory Sensitivity Questionnaire (SSQ). The SSQ (Minshew & Hobson, 2008) is, after
permission of the authors, translated from English into Dutch (Lever & Geurts, 2012) and back-
transformed into English by an independent native English speaker. The SSQ consists of 13
statements about sensory hyper- or hyposensitivity that can be endorsed or denied, and assess
low pain/temperature (2 items), high pain/temperature (2 items), tactile sensitivity (3 items), and
other sensitivities (6 items). Endorsed items are summed per subscale and to a total score of
maximum 13. Inter-rater reliability is good (Minshew & Hobson, 2008), but other psychometric
properties of the SSQ are yet unknown. Missing data points for SSQ were not allowed due to
the small number of questionnaire items. The dependent variables is the total score (self- and
other-report).
Procedure
After explanation of study purposes and procedure, written informed consent was obtained for
all participants. The AQ, IRI, and SSQ questionnaires were filled out. Additional measures were
administered in two sessions in a selection of this sample, but will be described elsewhere (Lever
& Geurts, 2015; Lever, Werkle-Bergner, Brandmaier, Ridderinkhof, & Geurts, 2015). The study
was approved by the local institutional ethical review board (2011-PN-1952), and complied with
all relevant laws and institutional guidelines.
Statistical analyses
First, we described our ASD group in terms of educational attainment, residential status,
occupation, and relationships. The COM group was only included for comparison purposes with
regard to the role of age and the self-other relationship. Second, we ran two MANCOVAs for
AQ and IRI (sub)scales and an ANCOVA for the SSQ total scorei, each with group and gender
as between-subject factor and (centered) age and (centered) age2 as covariate in a model with
main effects and interactions, to investigate age-related differences in ASD symptomatology
across groups. We added gender as between-subject factor to these analyses, given the
i Data of the AQ subscales and SSQ total score were not normally distributed. However, as (M)ANOVA is thought to be robust against skewed data (Stevens, 2012), we ran parametric tests.
Age-related differences in ASD symptomatology | 27
symptomatic differences between males and females (Lai et al., 2011; Van Wijngaarden-Cremers
et al., 2014). Separate ANCOVAs on the single (sub)scales (Bonferroni correction: α = .05/6 =
.0083 for AQ; α = .05/4 = .0125 for IRI) were used to follow-up on the omnibus MANOVA
effects. When observing significant interactions, we ran planned follow-up regressions analyses
(Bonferroni correction: α = .05/number of significant interactions) per group. Third, to examine
the relation between participant and proxy report, intra-class correlations coefficients (ICCs)
were calculated with a two-way mixed, absolute agreement, single-measures effect model
(Hallgren, 2012; McGraw & Wong, 1996; Shrout & Fleiss, 1979), overall and per group, for total
scores of AQ (40 items), IRI (all items), and SSQ (all items). Levels of agreement were interpreted
as poor (ICC = <0.40), fair (ICC = 0.40–0.59), good (ICC = 0.60–0.74), and excellent (ICC =
0.75–1.00) (Cicchetti, 1994). To further examine the self-other relationship, we computed three
ANOVAs with Group (ASD, COM) as between-subject factors and Rater (self, other) as within-
subject factor. Furthermore, to examine whether age-related differences were also observed by
proxies (i.e., other-report), we ran ANCOVAs for each questionnaire’s total score, with group
and gender as between-subject factors and (centered) age and (centered) age2 as covariate.
Finally, we explored whether the type of proxy influenced the reported symptoms (see
Supplementary material Chapter 2). Fourth, although all ASD participants had a prior ASD
diagnosis, we verified these diagnoses in a subgroup of participants who were eligible to
participate in a study aimed at investigating age-related differences in cognition (Lever & Geurts,
2015) by administering the Autism Diagnostic Observation Schedule module 4 (de Bildt & de
Jonge, 2008; Lord et al., 2000). Therefore, we compared ASD participants who scored above the
ADOS threshold for ASD (ADOS+) or autism (ADOS++) with those scoring below the
threshold for ASD (ADOS-) or without ADOS (non-ADOS). All analyses were run with SPSS
22.0 (IBM Corp., 2013).
RESULTS
The descriptives of both groups (i.e., gender, age, social characteristics, years of diagnosis) are
depicted in Table 2.1ii. The groups did not differ in mean age, but the ASD group was composed
of relatively more males than females as compared to the COM group. Moreover, the
participants with ASD were not as highly educated as the controls, more participants with ASD
lived in a residential home, and less were in a romantic relationship. Occupation was coded
according to the International Standard Classification of Occupations (ISCO-08). Of the ASD
ii We cross-checked whether the whole sample differed from the IRI or SSQ subsample on age, gender, and educational level. The groups did not significantly differ (all ps > .5).
28 | Chapter 2
participants, 8 had an elementary occupation, 2 were plant or machine operators or assemblers,
9 were craft workers, 1 was a skilled agricultural worker, 14 were service and sales workers, 15
were clerical support workers, 16 were technicians and associate professionals (i.e., people
performing tasks related to research and the application of conceptual and operational methods,
including community health workers, opticians, photographers), 62 were professionals (i.e.,
people providing conceptual and theoretical contributions to knowledge accumulation, including
scientists, teachers, practitioners, nurses, lawyers), and 9 were managers. Moreover, there were
14 students, 3 entrepreneurs, 3 did not indicate their occupation, and 81 (34.2%) were
unemployed, including 15 (18.5%) retired individuals.
ASD symptomatology
Self-reported questionnaire scores of the ASD and COM group and subscale comparisons are
presented in Table 2.2. Follow-up regressions on significant interactions between age(2) and
group are presented in Table 2.3.
AQ
There was a significant main effect of group (Wilks’ Lambda (Λ) = 0.40, F(5, 423) = 125.60, p
< .001, ηp2 = .60) and significant interactions between group and gender (Λ = 0.97, F(5, 423) =
3.07, p = .010, ηp2 = .04), between group and age (Λ = 0.97, F(5, 423) = 3.02, p = .011, ηp
2 =
.04), and between group and age2 (Λ = 0.96, F(5, 423) = 3.21, p = .007, ηp2 = .04). Separate
univariate ANCOVAs revealed, as expected, that adults with ASD reported higher AQ scores
than the COM group on all (sub)scales. Significant univariate interactions were followed-up with
planned regressions per group. These revealed that neither age nor age2 was a significant
predictor of AQ scores in the COM group. In the ASD group, age and age2 were significantly
associated with the total score and the attention to detail subscale score, but not with the other
subscales after Bonferroni correction. The estimated coefficients of age and age2 indicated that
age had a positive effect and age2 had a negative effect on AQ score (Figure 2.1). Furthermore,
age was significantly associated with the social skills subscale, with increasing age being related
to higher scores, but age2 did not survive Bonferroni correction. With regard to the role of
gender, females with ASD reported significantly more ASD traits than ASD males on the total
score (β = .19, p = .004) and attention switching subscale (β = .19, p = .004), whereas females
without ASD reported lower scores than non-ASD males on the total score (β = -.20, p = .006)
and communication subscale (β = -.23, p = .001).
Age-related differences in ASD symptomatology | 29
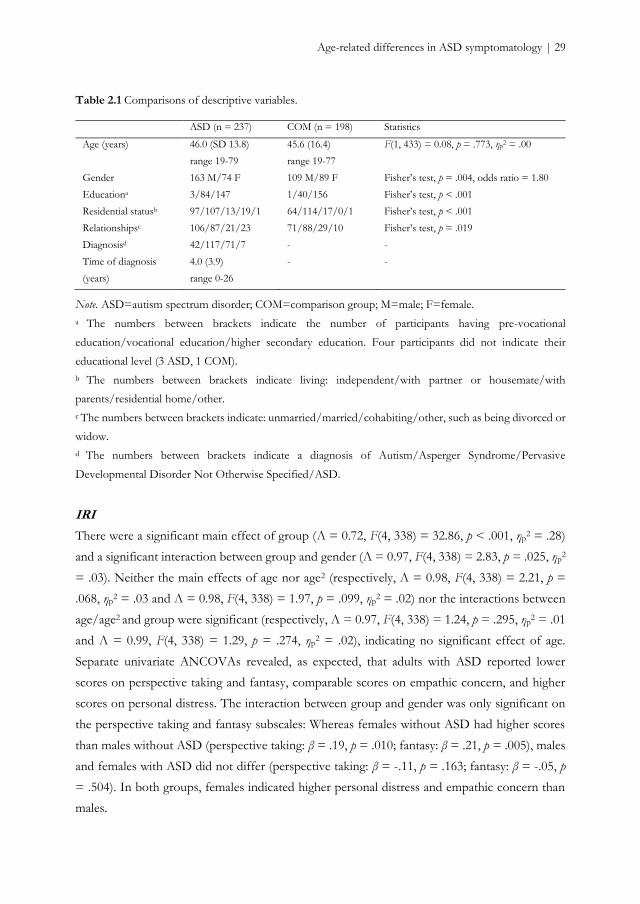
Table 2.1 Comparisons of descriptive variables.
ASD (n = 237) COM (n = 198) Statistics
Age (years) 46.0 (SD 13.8)
range 19-79
45.6 (16.4)
range 19-77
F(1, 433) = 0.08, p = .773, ηp2 = .00
Gender 163 M/74 F 109 M/89 F Fisher’s test, p = .004, odds ratio = 1.80
Educationa 3/84/147 1/40/156 Fisher’s test, p < .001
Residential statusb 97/107/13/19/1 64/114/17/0/1 Fisher’s test, p < .001
Relationshipsc 106/87/21/23 71/88/29/10 Fisher’s test, p = .019
Diagnosisd 42/117/71/7 - -
Time of diagnosis
(years)
4.0 (3.9)
range 0-26
- -
Note. ASD=autism spectrum disorder; COM=comparison group; M=male; F=female.
a The numbers between brackets indicate the number of participants having pre-vocational
education/vocational education/higher secondary education. Four participants did not indicate their
educational level (3 ASD, 1 COM).
b The numbers between brackets indicate living: independent/with partner or housemate/with
parents/residential home/other.
c The numbers between brackets indicate: unmarried/married/cohabiting/other, such as being divorced or
widow.
d The numbers between brackets indicate a diagnosis of Autism/Asperger Syndrome/Pervasive
Developmental Disorder Not Otherwise Specified/ASD.
IRI
There were a significant main effect of group (Λ = 0.72, F(4, 338) = 32.86, p < .001, ηp2 = .28)
and a significant interaction between group and gender (Λ = 0.97, F(4, 338) = 2.83, p = .025, ηp2
= .03). Neither the main effects of age nor age2 (respectively, Λ = 0.98, F(4, 338) = 2.21, p =
.068, ηp2 = .03 and Λ = 0.98, F(4, 338) = 1.97, p = .099, ηp
2 = .02) nor the interactions between
age/age2 and group were significant (respectively, Λ = 0.97, F(4, 338) = 1.24, p = .295, ηp2 = .01
and Λ = 0.99, F(4, 338) = 1.29, p = .274, ηp2 = .02), indicating no significant effect of age.
Separate univariate ANCOVAs revealed, as expected, that adults with ASD reported lower
scores on perspective taking and fantasy, comparable scores on empathic concern, and higher
scores on personal distress. The interaction between group and gender was only significant on
the perspective taking and fantasy subscales: Whereas females without ASD had higher scores
than males without ASD (perspective taking: β = .19, p = .010; fantasy: β = .21, p = .005), males
and females with ASD did not differ (perspective taking: β = -.11, p = .163; fantasy: β = -.05, p
= .504). In both groups, females indicated higher personal distress and empathic concern than
males.
30 | Chapter 2
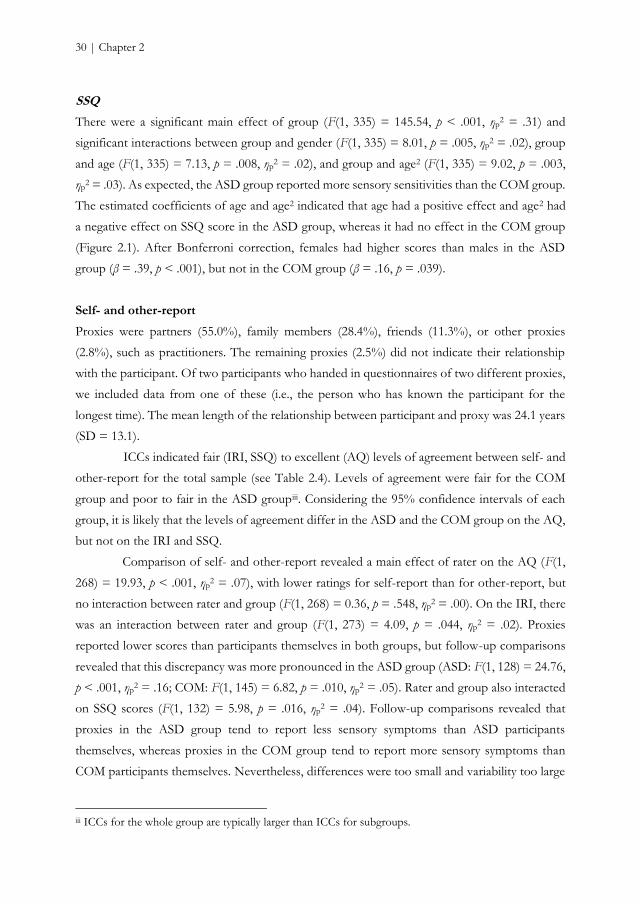
SSQ
There were a significant main effect of group (F(1, 335) = 145.54, p < .001, ηp2 = .31) and
significant interactions between group and gender (F(1, 335) = 8.01, p = .005, ηp2 = .02), group
and age (F(1, 335) = 7.13, p = .008, ηp2 = .02), and group and age2 (F(1, 335) = 9.02, p = .003,
ηp2 = .03). As expected, the ASD group reported more sensory sensitivities than the COM group.
The estimated coefficients of age and age2 indicated that age had a positive effect and age2 had
a negative effect on SSQ score in the ASD group, whereas it had no effect in the COM group
(Figure 2.1). After Bonferroni correction, females had higher scores than males in the ASD
group (β = .39, p < .001), but not in the COM group (β = .16, p = .039).
Self- and other-report
Proxies were partners (55.0%), family members (28.4%), friends (11.3%), or other proxies
(2.8%), such as practitioners. The remaining proxies (2.5%) did not indicate their relationship
with the participant. Of two participants who handed in questionnaires of two different proxies,
we included data from one of these (i.e., the person who has known the participant for the
longest time). The mean length of the relationship between participant and proxy was 24.1 years
(SD = 13.1).
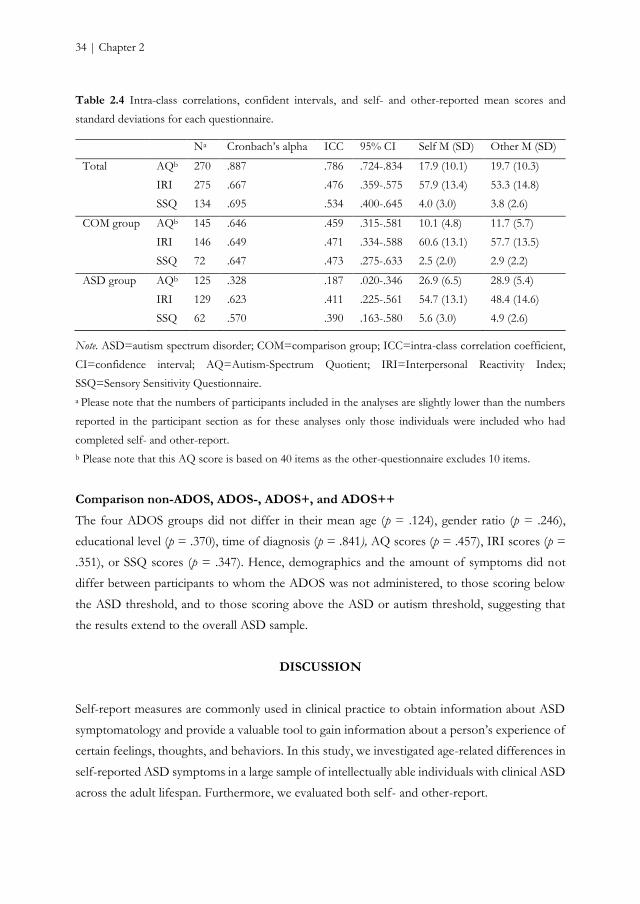
ICCs indicated fair (IRI, SSQ) to excellent (AQ) levels of agreement between self- and
other-report for the total sample (see Table 2.4). Levels of agreement were fair for the COM
group and poor to fair in the ASD groupiii. Considering the 95% confidence intervals of each
group, it is likely that the levels of agreement differ in the ASD and the COM group on the AQ,
but not on the IRI and SSQ.
Comparison of self- and other-report revealed a main effect of rater on the AQ (F(1,
268) = 19.93, p < .001, ηp2 = .07), with lower ratings for self-report than for other-report, but
no interaction between rater and group (F(1, 268) = 0.36, p = .548, ηp2 = .00). On the IRI, there
was an interaction between rater and group (F(1, 273) = 4.09, p = .044, ηp2 = .02). Proxies
reported lower scores than participants themselves in both groups, but follow-up comparisons
revealed that this discrepancy was more pronounced in the ASD group (ASD: F(1, 128) = 24.76,
p < .001, ηp2 = .16; COM: F(1, 145) = 6.82, p = .010, ηp
2 = .05). Rater and group also interacted
on SSQ scores (F(1, 132) = 5.98, p = .016, ηp2 = .04). Follow-up comparisons revealed that
proxies in the ASD group tend to report less sensory symptoms than ASD participants
themselves, whereas proxies in the COM group tend to report more sensory symptoms than
COM participants themselves. Nevertheless, differences were too small and variability too large
iii ICCs for the whole group are typically larger than ICCs for subgroups.
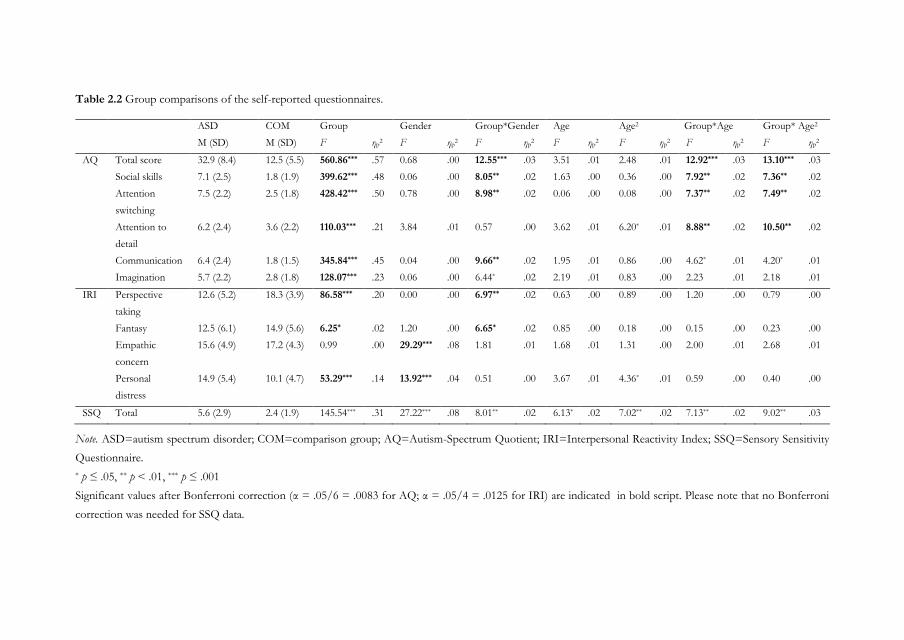
Table 2.2 Group comparisons of the self-reported questionnaires.
ASD COM Group Gender Group*Gender Age Age2 Group*Age Group* Age2
M (SD) M (SD) F ηp2 F ηp
2 F ηp2 F ηp
2 F ηp2 F ηp
2 F ηp2
AQ Total score 32.9 (8.4) 12.5 (5.5) 560.86*** .57 0.68 .00 12.55*** .03 3.51 .01 2.48 .01 12.92*** .03 13.10*** .03
Social skills 7.1 (2.5) 1.8 (1.9) 399.62*** .48 0.06 .00 8.05** .02 1.63 .00 0.36 .00 7.92** .02 7.36** .02
Attention
switching
7.5 (2.2) 2.5 (1.8) 428.42*** .50 0.78 .00 8.98** .02 0.06 .00 0.08 .00 7.37** .02 7.49** .02
Attention to
detail
6.2 (2.4) 3.6 (2.2) 110.03*** .21 3.84 .01 0.57 .00 3.62 .01 6.20* .01 8.88** .02 10.50** .02
Communication 6.4 (2.4) 1.8 (1.5) 345.84*** .45 0.04 .00 9.66** .02 1.95 .01 0.86 .00 4.62* .01 4.20* .01
Imagination 5.7 (2.2) 2.8 (1.8) 128.07*** .23 0.06 .00 6.44* .02 2.19 .01 0.83 .00 2.23 .01 2.18 .01
IRI Perspective
taking
12.6 (5.2) 18.3 (3.9) 86.58*** .20 0.00 .00 6.97** .02 0.63 .00 0.89 .00 1.20 .00 0.79 .00
Fantasy 12.5 (6.1) 14.9 (5.6) 6.25* .02 1.20 .00 6.65* .02 0.85 .00 0.18 .00 0.15 .00 0.23 .00
Empathic
concern
15.6 (4.9) 17.2 (4.3) 0.99 .00 29.29*** .08 1.81 .01 1.68 .01 1.31 .00 2.00 .01 2.68 .01
Personal
distress
14.9 (5.4) 10.1 (4.7) 53.29*** .14 13.92*** .04 0.51 .00 3.67 .01 4.36* .01 0.59 .00 0.40 .00
SSQ Total 5.6 (2.9) 2.4 (1.9) 145.54*** .31 27.22*** .08 8.01** .02 6.13* .02 7.02** .02 7.13** .02 9.02** .03
Note. ASD=autism spectrum disorder; COM=comparison group; AQ=Autism-Spectrum Quotient; IRI=Interpersonal Reactivity Index; SSQ=Sensory Sensitivity
Questionnaire.
* p ≤ .05, ** p < .01, *** p ≤ .001
Significant values after Bonferroni correction (α = .05/6 = .0083 for AQ; α = .05/4 = .0125 for IRI) are indicated in bold script. Please note that no Bonferroni
correction was needed for SSQ data.
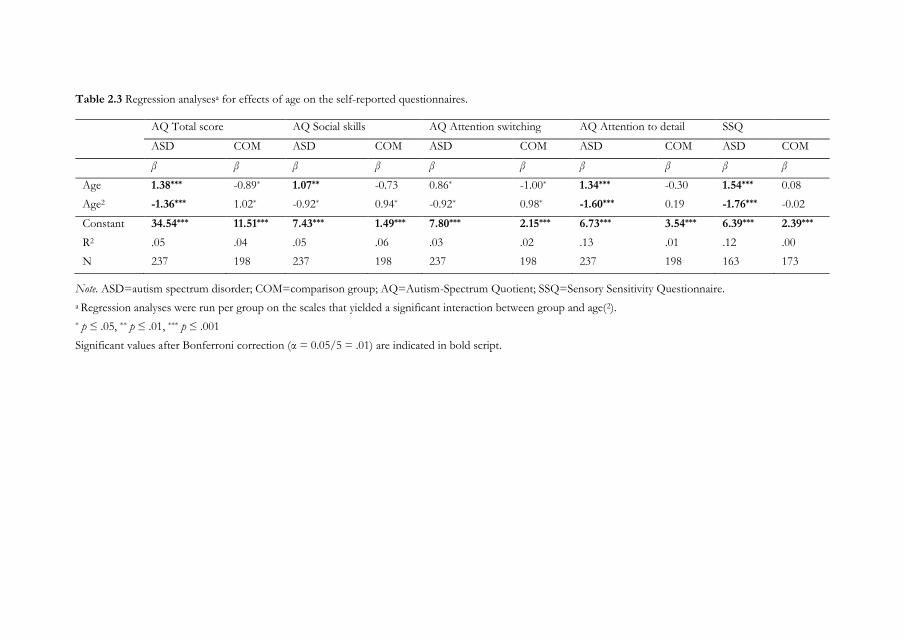
Table 2.3 Regression analysesa for effects of age on the self-reported questionnaires.
AQ Total score AQ Social skills AQ Attention switching AQ Attention to detail SSQ
ASD COM ASD COM ASD COM ASD COM ASD COM
β β β β β β β β β β
Age 1.38*** -0.89* 1.07** -0.73 0.86* -1.00* 1.34*** -0.30 1.54*** 0.08
Age2 -1.36*** 1.02* -0.92* 0.94* -0.92* 0.98* -1.60*** 0.19 -1.76*** -0.02
Constant 34.54*** 11.51*** 7.43*** 1.49*** 7.80*** 2.15*** 6.73*** 3.54*** 6.39*** 2.39***
R2 .05 .04 .05 .06 .03 .02 .13 .01 .12 .00
N 237 198 237 198 237 198 237 198 163 173
Note. ASD=autism spectrum disorder; COM=comparison group; AQ=Autism-Spectrum Quotient; SSQ=Sensory Sensitivity Questionnaire.
a Regression analyses were run per group on the scales that yielded a significant interaction between group and age(2).
* p ≤ .05, ** p ≤ .01, *** p ≤ .001
Significant values after Bonferroni correction (α = 0.05/5 = .01) are indicated in bold script.
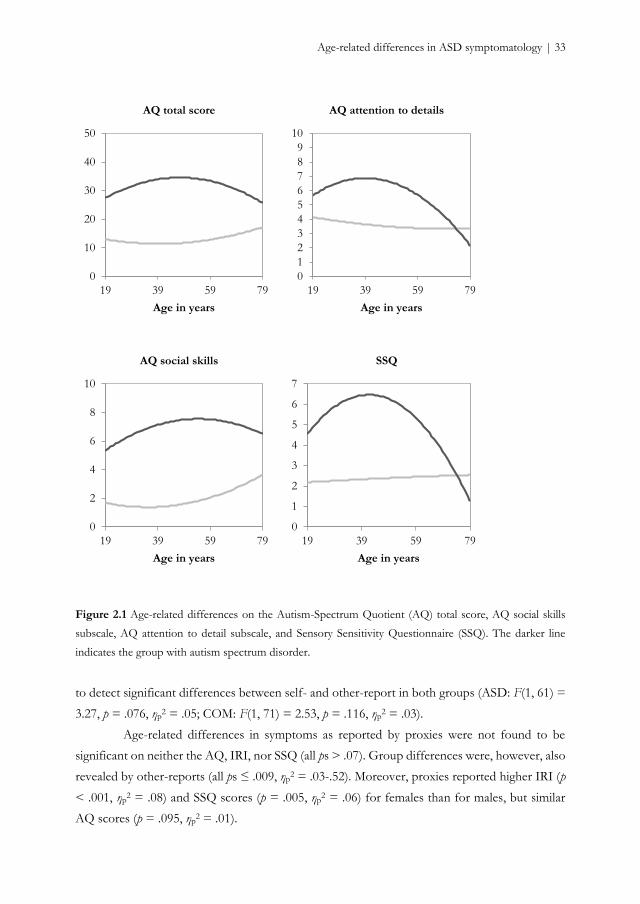
Age-related differences in ASD symptomatology | 33
Figure 2.1 Age-related differences on the Autism-Spectrum Quotient (AQ) total score, AQ social skills
subscale, AQ attention to detail subscale, and Sensory Sensitivity Questionnaire (SSQ). The darker line
indicates the group with autism spectrum disorder.
to detect significant differences between self- and other-report in both groups (ASD: F(1, 61) =
3.27, p = .076, ηp2 = .05; COM: F(1, 71) = 2.53, p = .116, ηp
2 = .03).
Age-related differences in symptoms as reported by proxies were not found to be
significant on neither the AQ, IRI, nor SSQ (all ps > .07). Group differences were, however, also
revealed by other-reports (all ps ≤ .009, ηp2 = .03-.52). Moreover, proxies reported higher IRI (p
< .001, ηp2 = .08) and SSQ scores (p = .005, ηp
2 = .06) for females than for males, but similar
AQ scores (p = .095, ηp2 = .01).
0
10
20
30
40
50
19 39 59 79
Age in years
AQ total score
0
1
2
3
4
5
6
7
8
9
10
19 39 59 79
Age in years
AQ attention to details
0
2
4
6
8
10
19 39 59 79
Age in years
AQ social skills
0
1
2
3
4
5
6
7
19 39 59 79
Age in years
SSQ
34 | Chapter 2
Table 2.4 Intra-class correlations, confident intervals, and self- and other-reported mean scores and
standard deviations for each questionnaire.
Na Cronbach’s alpha ICC 95% CI Self M (SD) Other M (SD)
Total AQb 270 .887 .786 .724-.834 17.9 (10.1) 19.7 (10.3)
IRI 275 .667 .476 .359-.575 57.9 (13.4) 53.3 (14.8)
SSQ 134 .695 .534 .400-.645 4.0 (3.0) 3.8 (2.6)
COM group AQb 145 .646 .459 .315-.581 10.1 (4.8) 11.7 (5.7)
IRI 146 .649 .471 .334-.588 60.6 (13.1) 57.7 (13.5)
SSQ 72 .647 .473 .275-.633 2.5 (2.0) 2.9 (2.2)
ASD group AQb 125 .328 .187 .020-.346 26.9 (6.5) 28.9 (5.4)
IRI 129 .623 .411 .225-.561 54.7 (13.1) 48.4 (14.6)
SSQ 62 .570 .390 .163-.580 5.6 (3.0) 4.9 (2.6)
Note. ASD=autism spectrum disorder; COM=comparison group; ICC=intra-class correlation coefficient,
CI=confidence interval; AQ=Autism-Spectrum Quotient; IRI=Interpersonal Reactivity Index;
SSQ=Sensory Sensitivity Questionnaire.
a Please note that the numbers of participants included in the analyses are slightly lower than the numbers
reported in the participant section as for these analyses only those individuals were included who had
completed self- and other-report.
b Please note that this AQ score is based on 40 items as the other-questionnaire excludes 10 items.
Comparison non-ADOS, ADOS-, ADOS+, and ADOS++
The four ADOS groups did not differ in their mean age (p = .124), gender ratio (p = .246),
educational level (p = .370), time of diagnosis (p = .841), AQ scores (p = .457), IRI scores (p =
.351), or SSQ scores (p = .347). Hence, demographics and the amount of symptoms did not
differ between participants to whom the ADOS was not administered, to those scoring below
the ASD threshold, and to those scoring above the ASD or autism threshold, suggesting that
the results extend to the overall ASD sample.
DISCUSSION
Self-report measures are commonly used in clinical practice to obtain information about ASD
symptomatology and provide a valuable tool to gain information about a person’s experience of
certain feelings, thoughts, and behaviors. In this study, we investigated age-related differences in
self-reported ASD symptoms in a large sample of intellectually able individuals with clinical ASD
across the adult lifespan. Furthermore, we evaluated both self- and other-report.
Age-related differences in ASD symptomatology | 35
Age-related differences in ASD symptoms
Our main finding was that age-related differences are observed in self-reported general
ASD symptoms and sensory sensitivity, but not in cognitive and affective empathy. With regard
to general ASD symptoms, as measured with the AQ, the age-related pattern of adults with ASD
was characterized by an increase in self-reported symptoms followed by a decrease. Older adults
reported more symptoms than younger adults and middle-aged adults reported more symptoms
than younger and older adults. Similar patterns were observed for attention to details and sensory
sensitivity. Older age was associated with reduced social skills. We will discuss these findings in
more detail below.
Although the diagnostic status of ASD is relatively stable over time (Billstedt, Gillberg,
& Gillberg, 2007; Magiati et al., 2014; Piven et al., 1996), longitudinal studies showed that, despite
some stable or even worsening individual change trajectories, the overall pattern was one of
improvement with ASD symptoms abating over time (e.g., Howlin et al., 2013; Piven et al., 1996;
Woodman, Smith, Greenberg, & Mailick, 2015). However, cross-sectional studies using self-
report to assess ASD symptoms in adulthood did not find any association with age (Bastiaansen
et al., 2011; Bishop & Seltzer, 2012). In the current cross-sectional study, the reduction of
symptoms was not observed, but we did find an age-related effect. An initial increase in self-
reported ASD symptoms, especially interests in details and patterns, was followed by a reduction
in late adulthood. In earlier studies, only a linear age-related pattern was considered, whereas we
allowed for a non-linear pattern. When we reran our analyses with only linear age, we also did
not find a relation between age and symptomatology. Hence, the current results suggest that self-
reported symptoms may vary over the adult lifespan in individuals with ASD, but they need
replication in a longitudinal design.
Also sensory sensitivity increased from young to middle adulthood and decreased from
middle to late adulthood in ASD. Reduced sensory functioning (Fozard, 1990) or better coping
mechanisms (Grandin, 2011) in older adulthood may provide a suggestion for why this pattern
is observed. Nevertheless, our findings are in contrast to earlier ASD studies that did not find
an association between age and self-reported sensory sensitivity (Crane et al., 2009; Minshew &
Hobson, 2008). Although we used the same instrument as Minshew and Hobson (2008), they
included individuals between 8 and 54 years of age with a mean age of 17. Adults reported more
symptoms than children, but the role of age across adulthood was not examined. The age range
and mean age of the Crane study (2009) was more comparable to ours, but another instrument
was used and the sample size was rather small. Our results, hence, are not necessarily discordant
and future research should further investigate age-related differences or changes in sensory
functioning in ASD.
36 | Chapter 2
Finally, empathy, an aspect of social-emotional reciprocity, was not sensitive to age-
related differences (e.g., Eysenck et al., 1985) in adults with and without ASD. It has previously
been demonstrated that age-related differences in perspective taking and empathic concern may
follow an inverted U-shape (O'Brien et al., 2013). However, this pattern was found in a very
large sample of more than 75000 individuals drawn from the general population. Our failure to
replicate this finding is plausibly a power issue as the directions of estimated coefficients in the
current study were comparable, even though our results fit ASD-related findings indicating that
age did not affect cognitive reasoning on other persons’ mental states (Chung et al., 2014).
The group and gender comparisons and age-related differences in the comparison
group were in line with the literature. As expected, adults with ASD reported more ASD
symptoms (e.g., Baron-Cohen et al., 2001; Ruzich et al., 2015), higher sensory sensitivity (Crane
et al., 2009; Minshew & Hobson, 2008), and lower perspective taking and fantasy tendencies,
similar empathic concern, and higher personal distress in reaction to the emotions of others
(Rogers et al., 2007) than individuals without ASD. Moreover, we replicated earlier findings that
females with ASD had more sensory issues and reported more ASD characteristics than males
(Lai et al., 2011), whereas females without ASD manifested fewer ASD traits than non-ASD
males (see Ruzich et al., 2015, for an overview). Finally, as in previous reports about the general
population, age was not associated with general ASD symptoms (Hoekstra et al., 2008; but see
J. Broadbent, Galic, & Stokes, 2013) or sensory sensitivity (Crane et al., 2009; Robertson &
Simmons, 2013) in the comparison group. The high number of self-reported general ASD
symptoms and sensory sensitivities and the persistence of these symptoms across the adult
lifespan, underline the lifelong nature of this neuropsychiatric condition.
Self- and other-report
Contrary to self-report, age-related differences in symptomatology were not perceived
by the proxies. In line with this result, agreement between self- and other-report was rather poor.
Although the amount of reported sensory symptoms was comparable between self- and other-
report in ASD and non-ASD, participants of both groups tended to report less general ASD
symptoms and more empathic tendencies than their proxies. Moreover, proxies did not indicate
gender differences on general ASD features, whereas they reported more empathy and sensory
sensitives for females than for males.
Albeit the agreement of the overall group was similar to those previously reported for
social responsiveness (De la Marche et al., 2015), we found the agreement in both the ASD and
comparison group to be rather poor. Low values are often found when there is low consensus,
low consistency, or both (LeBreton & Senter, 2007). Given that Cronbach’s alpha was acceptable
Age-related differences in ASD symptomatology | 37
for all measures, except for the AQ in the ASD group, low consistency may only partially explain
discrepancies between self-report and other-report. These discrepancies rather indicate a
different experience of ASD-related symptoms by individuals themselves and by their proxies.
Several explanations may apply.
First, it has been questioned whether individuals with ASD are able to provide reliable
self-reported information as ASD has been associated with reduced introspection (Frith, 2004).
Limited self-awareness of children and adolescents with ASD have indeed been demonstrated
(Johnson, Filliter, & Murphy, 2009; Kievit & Geurts, 2011), but recently, it was suggested that
adults with ASD are able to provide reliable information about their symptomatology (De la
Marche et al., 2015). Given that either individuals with and without ASD demonstrated
discrepancies in AQ scores, interpreting our findings within this framework does not hold.
Furthermore, the mean difference between self and other (i.e., 1.8) was smaller than in the
original Baron-Cohen sample (i.e., 2.8; 2001), which has been described as good, even though
statistical analyses were lacking.
Second, in line with the previous argument, it can be argued that one of the raters is
biased. A person may enhance one’s own characteristics (John & Robins, 1993) or experience
his or her pathological traits as more acceptable or desirable than a proxy (Hirschfeld, 1993) and,
hence, underestimate the degree of behavioral symptoms, or proxies may focus more on
pathological traits than on normal traits (Leising, Erbs, & Fritz, 2010) and, hence, overestimate
certain symptoms.
Third, low agreement not necessarily means that there is a bias or an error in one of
the raters. The self and a proxy may have different perceptions about related traits and, therefore,
provide different types of information (Carlson, Vazire, & Oltmanns, 2013). The self would be
more accurate about traits that describe unobservable thoughts and feelings due to privileged
access, whereas a proxy would be more accurate about observable behavior (Vazire, 2010). Our
findings seem to be in line with this reasoning. While discrepancies were comparable to controls
on general ASD symptoms, discrepancies on empathy were larger in individuals with ASD than
in controls, and discrepancies on sensory sensitivity were negative in individuals with ASD (i.e.,
proxies reported less symptoms than participants themselves) and positive in non-ASD (i.e.,
proxies reported more symptoms than participants themselves). General ASD symptoms are
mostly based on behavior, whereas empathy and sensory sensitivity deal more with feelings and
thoughts that are sometimes difficult to evaluate from an outside perspective.
Based on our study, we cannot disentangle these different factors. Further research is
needed to examine why self- and other-report by proxies who have known the participants for
a long time, provide discrepancies in ASD-related symptomatology.
38 | Chapter 2
Clinical implications
We believe that the current findings have several clinical implications. First, when an
adult person is referred to clinical practice in order to be screened for an ASD diagnosis, often
the partner initiates this process (National Institute for Health and Clinical Excellence, 2012).
Moreover, during the diagnostic process, a family member is, where possible, involved to
provide information about developmental history. Hence, a proxy has a crucial role. Whether
the proxy is a partner, family member, or friend does not largely affect the report of ASD-related
symptoms (see Table S.2.1, Supplementary material Chapter 2), despite subtle differences.
Nevertheless, the disagreement between self- and other-report about symptoms is puzzling.
Although we have discussed several factors that may influence this discrepancy, we cannot
provide definite conclusions. Our results do suggest that it is not necessarily the case that
individuals with ASD have poor introspection into their symptoms. The possibility remains that
proxies and individuals with ASD provide complementary information. Observed discrepancies
may provide an interesting idiosyncrasy for discussion during assessment.
Second, females with ASD reported more ASD symptoms as measured with the AQ
than males with ASD, but this gender difference was not revealed by proxies. On the one hand,
females with ASD might be better at masking their symptoms as they may be more motivated
and more effortful to develop social skills and may present better self-referential abilities (Lai et
al., 2011), resulting in high self-reported symptoms, but lower other-reported symptoms. On the
other hand, albeit highly speculative, females may feel the need to report more ASD symptoms
in order to be recognized as having ASD, getting access to the mental health system and receiving
appropriate treatment, as ASD in girls and women is still underdiagnosed (see Halladay et al.,
2015, for an overview). Even though this latest suggestion seems unlikely given that the female
participants in our study already had a clinical diagnosis, clinical professionals should be aware
of symptomatic differences between males and females.
Third, since the introduction of the DSM-5 (American Psychiatric Association, 2013),
sensory sensitivity has acquired importance for the diagnostic assessment of ASD. Although not
all individuals with ASD experience sensory hypo- or hyperreactivity to sensory stimuli (Baranek,
Parham, & Bodfish, 2005), it is an aspect that often causes extreme discomfort. As the current
cross-sectional study revealed that sensory symptoms are subject to age-related differences, it
would be meaningful to inquire regularly about the experience of sensory symptoms in clinical
settings. This regular assessment is also relevant for general ASD symptomatology given the
observed role of age in self-perceived ASD traits.
Age-related differences in ASD symptomatology | 39
Limitations
The main limitation of the current study was its cross-sectional nature, in which age-related
differences between-persons were taken into account. Therefore, we cannot draw conclusions on
how self-reported ASD symptoms change over the years within-persons. Our results need a
longitudinal follow-up to investigate whether age-related changes in ASD symptoms, generally
examined with measures relying on other information (i.e., a parent or caregiver), such as the
Autism Diagnostic Interview-Revisited or the Vineland, are also detected by individuals with
ASD themselves and whether this change trajectory is one of improvement.
The convenience of self-report is also its drawback. The self has privileged access to
certain feelings, and thoughts, and behaviors, but it is the interpretation and evaluation that
determines how one reports about these aspects. Therefore, when examining age-related
differences or age-related changes by means of self-report, a relevant aspect to evaluate is
whether they indicate a change in the experience or perception of symptoms, or an observable
behavioral change of symptoms. For example, the age-related differences in sensory symptoms
do not necessarily indicate that older adults exhibit less symptoms than middle aged adults, as
they may also indicate that older adults experience less symptoms and are better able to deal with
them. Furthermore, it does not preclude that the present ones cause many discomfort, even
though they experience less symptoms.
ASD is a very heterogeneous condition that affects individuals in different ways. Some
individuals present symptoms that severely affect their daily functioning to such an extent that
they need very substantial support. Others, mostly those with good verbal and intellectual
abilities, present less severe ASD, but still encounter considerable difficulties. Our sample
consisted of those latest individuals as they were intellectually high-functioning, with many
having a paid job (some even high profile) and living with a partner. They were diagnosed with
ASD relatively late in life and one might argue that they presented relatively mild ASD. However,
they and their proxies reported many ASD symptoms (comparable to the original sample of
Baron-Cohen et al., 2001 and to the clustered sample mentioned in the recent review of Ruzich
et al., 2015) and many empathy difficulties, which have an impact on social functioning and are
likely to be highly disabling. This shows how important it is to study this intellectually high
functioning group of individuals as well.
Conclusions
In this large cross-sectional study of adults with clinical diagnoses of ASD, we demonstrated that
individuals with ASD experience a significant degree of general ASD symptoms, as measured
with the AQ, and empathic difficulties, as measured with the IRI, and sensory sensitivities, as

40 | Chapter 2
measured with the SSQ, across the adult lifespan. Self-reported general ASD symptoms and
sensory sensitivities seem to increase from young to middle adulthood and diminish from middle
to late adulthood, but these age-related differences were not reported by proxies who have
known the participants for a long time. Indeed, the perception of ASD-related symptoms differs
among self-report and other-report, with discrepancies being pronounced, suggesting that self
and proxies grasp distinct aspects of symptomatology. Longitudinal follow-up studies should
reveal whether self-reported ASD symptoms are experienced to change over time.
Age-related differences in ASD symptomatology | 41
SUPPLEMENTARY MATERIAL CHAPTER 2
Effect of proxy type on symptomatology
Statistical analysis
To explore whether the type of proxy influenced the number of reported symptoms, we ran
three exploratory ANOVAs with group (autism spectrum disorder [ASD], comparison [COM])
and type of proxy (partner, family, friend, or other [due to only a few cases, we clustered other
proxies and unknown proxies together]) as between-subject factors for the total scores of the
Autism-Spectrum Quotient (AQ), Interpersonal Reactivity Index (IRI), and Sensory Sensitivity
Questionnaire (SSQ). The analyses were run with SPSS 22.0 (IBM Corp., 2013).
Results
Explorations on whether the type of proxy affected the amount of reported symptoms, indicated
a main effect on AQ and IRI (see Table A.1). Friends reported lower AQ scores than partners
(p < = .001), and others (p = .010), but not of family members (p = .084). On a similar note,
friends reported higher IRI scores than partners (p = .003), even though the comparison with
family members (p =.065) and others was not significant (p = 1.000). The other comparisons
were also not significant. Hence, AQ and IRI proxy scores were influenced by who filled out the
questionnaire. We explored which group of proxies diverged the most from the participants. In
absence of an interaction between other-type and group, we combined the ASD and COM
group. The discrepancies between self- and other-report were the smallest for partners on the
AQ, for friends on the IRI, and for family members on the SSQ.
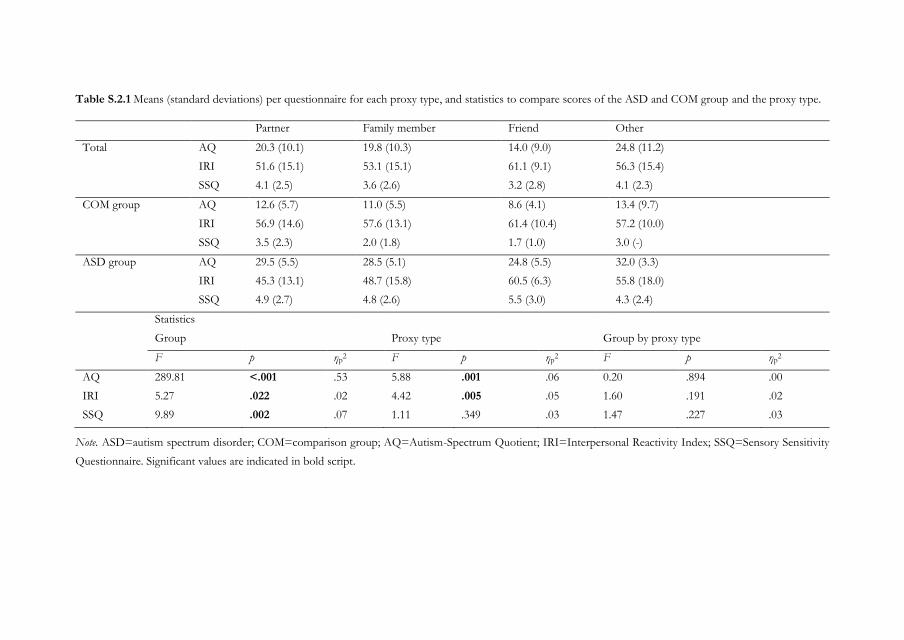
Table S.2.1 Means (standard deviations) per questionnaire for each proxy type, and statistics to compare scores of the ASD and COM group and the proxy type.
Partner Family member Friend Other
Total AQ 20.3 (10.1) 19.8 (10.3) 14.0 (9.0) 24.8 (11.2)
IRI 51.6 (15.1) 53.1 (15.1) 61.1 (9.1) 56.3 (15.4)
SSQ 4.1 (2.5) 3.6 (2.6) 3.2 (2.8) 4.1 (2.3)
COM group AQ 12.6 (5.7) 11.0 (5.5) 8.6 (4.1) 13.4 (9.7)
IRI 56.9 (14.6) 57.6 (13.1) 61.4 (10.4) 57.2 (10.0)
SSQ 3.5 (2.3) 2.0 (1.8) 1.7 (1.0) 3.0 (-)
ASD group AQ 29.5 (5.5) 28.5 (5.1) 24.8 (5.5) 32.0 (3.3)
IRI 45.3 (13.1) 48.7 (15.8) 60.5 (6.3) 55.8 (18.0)
SSQ 4.9 (2.7) 4.8 (2.6) 5.5 (3.0) 4.3 (2.4)
Statistics
Group Proxy type Group by proxy type
F p ηp2 F p ηp
2 F p ηp2
AQ 289.81 <.001 .53 5.88 .001 .06 0.20 .894 .00
IRI 5.27 .022 .02 4.42 .005 .05 1.60 .191 .02
SSQ 9.89 .002 .07 1.11 .349 .03 1.47 .227 .03
Note. ASD=autism spectrum disorder; COM=comparison group; AQ=Autism-Spectrum Quotient; IRI=Interpersonal Reactivity Index; SSQ=Sensory Sensitivity
Questionnaire. Significant values are indicated in bold script.
Chapter 3
Co-occurring psychopathology in young, middle-aged,
and older adults with autism spectrum disorder
Based on: Lever, A. G. & Geurts, H. M. (2016). Psychiatric co-occurring symptoms and
disorders in young, middle-aged, and older adults with autism spectrum disorder. Journal of Autism
and Developmental Disorders. Advanced online publication, doi:10.1007/s10803-016-2722-8.
44 | Chapter 3
ABSTRACT
Although psychiatric problems are less prevalent in old age within the general population, it is
largely unknown whether this extends to individuals with autism spectrum disorders (ASD). We
examined psychiatric symptoms and disorders in young, middle-aged, and older adults with and
without ASD (Nmax=344, age 19-79 years, IQ>80). Albeit comparable to other psychiatric
patients, levels of symptoms and psychological distress were high over the adult lifespan; 79%
met criteria for a psychiatric disorder at least once in their lives. Depression and anxiety were
most common. However, older adults less often met criteria for any psychiatric diagnosis and,
specifically, social phobia than younger adults. Hence, despite marked psychological distress,
psychiatric problems are also less prevalent in older aged individuals with ASD.
Keywords: autism spectrum disorder, psychiatric comorbidity, aging, adults, depression, anxiety
Co-occurring psychopathology in adults with ASD | 45
INTRODUCTION
Psychopathology is a frequently occurring phenomenon. In the general population,
approximately 40% meets criteria for a psychiatric disorder at least once in their lives (Bijl et al.,
1998; Kessler et al., 2005). This rate is much higher in individuals with an autism spectrum
disorder (ASD), a heterogeneous neurodevelopmental disorder characterized by atypicalities in
social communication and interaction and repetitive stereotyped behavior (American Psychiatric
Association, 2013). In this population, at least 69% is thought to suffer from co-occurring
psychiatric disorders and symptoms (Buck et al., 2014), even though rates are lower in individuals
with ASD and intellectual disability (ID) (Howlin & Moss, 2012; Matson & Cervantes, 2014).
The presence of co-occurring disorders is associated with lower quality of life, greater demands
for professional help, poorer prognosis, greater interference with everyday life, and worse
outcome (Lainhart, 1999; Matson & Cervantes, 2014; Seltzer et al., 2004; Vannucchi et al., 2014;
Wood & Gadow, 2010). Furthermore, specifically the co-occurring symptoms and disorders
often constitute a target for treatment, leading to an amelioration of problems. For example,
various psychotropic medications are frequently prescribed to individuals with ASD to treat
associated symptoms (Aman, Lam, & Van Bourgondien, 2005; Buck et al., 2014; Esbensen et
al., 2009; Logan et al., 2015; Seltzer et al., 2004). As ASD is considered a lifelong disorder (Piven
et al., 1996; Seltzer et al., 2004) and symptoms of psychopathology are likely to wax and wane
across the adult lifespan, knowledge regarding associated psychopathology in older adulthood is
needed (Matson & Cervantes, 2014; Perkins & Berkman, 2012) to be able to provide adequate
support for these older individuals. This will be the focus of the current study.
In the general population, age is a relevant factor for psychopathology. The prevalence
of psychiatric disorders and their nature is different in older adulthood than in middle or young
adulthood (Bijl et al., 1998; Kessler et al., 2005). While the general prevalence of psychiatric
disorders is lower, the prevalence of, for example, alcohol or substance related disorders
decreases sharply with increasing age, whereas depression and anxiety are still highly prevalent
(Beekman et al., 1998; Wolitzky‐Taylor, Castriotta, Lenze, Stanley, & Craske, 2010).
While traditionally many ASD studies mainly focused on co-occurring symptoms and
disorders in childhood (de Bruin et al., 2007; Leyfer et al., 2006; Lundström et al., 2015; Mattila
et al., 2010; Mukaddes et al., 2010; Simonoff et al., 2008; Sinzig et al., 2009; van Steensel et al.,
2013), recently a steadily increasing number of studies have taken into account co-occurring
symptoms and disorders in adulthood (Buck et al., 2014; Croen et al., 2015; Ghaziuddin & Zafar,
2008; Hofvander et al., 2009; Joshi et al., 2013; Lugnegård et al., 2011; Roy et al., 2015). These
findings seem to suggest that also in the ASD population age is an important factor. In
46 | Chapter 3
childhood, Attention Deficit Hyperactivity Disorder (ADHD), behavioral disorder, and anxiety
disorders are the most prevalent comorbid disorders (de Bruin et al., 2007; Leyfer et al., 2006;
Simonoff et al., 2008; Sinzig et al., 2009), whereas in adulthood, next to ADHD and anxiety
disorders, mood disorders are common (Croen et al., 2015; Ghaziuddin, Ghaziuddin, & Greden,
2002; Ghaziuddin & Zafar, 2008; Hofvander et al., 2009; Joshi et al., 2013; Roy et al., 2015;
Sterling, Dawson, Estes, & Greenson, 2008). In various adult studies, older adults with ASD
have been included but only a few directly compared older adults with younger individuals (Roy
et al., 2015; Totsika et al., 2010). In an intellectually challenged sample, psychiatric disorders were
less frequent in older adults with ASD and ID compared to younger adults with ASD and ID
(Totsika et al., 2010). In contrast, in older adults with ASD without ID, co-occurring psychiatric
disorders were more common than in younger adults (Roy et al., 2015). Unfortunately, the “older
group” in this latest study was relatively young (age range 40-62 years), the sample was small,
and a statistical comparison was lacking. A few studies focused on specific psychiatric disorders
such as anxiety (Davis et al., 2011) and depression (Ghaziuddin et al., 2002). Whereas anxiety
seemed to reduce from childhood to young adulthood (Davis et al., 2011), the risk for depression
seemed to increase with increasing age (Ghaziuddin et al., 2002). A small study in older adults
(53 to 83 years) with ASD reported high levels of psychological and somatic complaints and of
psychological distress (van Heijst & Geurts, 2014). However, it has not been tested whether
these participants encountered a sufficient number of psychiatric symptoms to meet diagnostic
criteria, although also associated symptoms in itself may cause clinically relevant distress and
impairment that may interfere with quality of life and daily functioning. Thus, the nature and
prevalence of comorbid psychopathological symptoms and disorders in older adults with ASD
is largely unknown. In the current study, we will, therefore, determine both the occurrence of
non-ASD symptomatology and co-occurring psychiatric disorders across the adult lifespan in
ASD by comparing young, middle-aged, and older adults clinically diagnosed with ASD without
ID. We hypothesize psychiatric co-occurring symptoms and disorders to be substantially higher
in individuals with ASD than in controls over the whole adult lifespan, but comparable to a
normative group of policlinic psychiatric patients (Joshi et al., 2013). Given the mixed findings
so far (Davis et al., 2011; Roy et al., 2015; Totsika et al., 2010), we will explore whether there will
be differences in this co-occurrence of other psychiatric symptoms and disorders between the
three age groups.
In addition to age, several other factors might affect the prevalence of comorbid
psychiatric disorders in individuals with ASD, including ASD severity, gender, social economic
status (i.e., education and work), living situation, and both intellectual and more general cognitive
functioning. We will explore their role with respect to the co-occurring psychopathology in
Co-occurring psychopathology in adults with ASD | 47
adults with ASD. For example, in the general population vulnerability factors for developing
anxiety or depression are, among others, cognitive decline, being female, having a lower social
economic status, or not having a partner (Beekman et al., 1998). In the ASD literature the focus
has been mainly on ASD severity, gender, and intellectual functioning but whether these factors
are indeed risk factors for comorbid psychopathology in ASD is a topic of debate as results are
rather inconsistent (Cederlund, Hagberg, & Gillberg, 2010; García‐Villamisar & Rojahn, 2015;
Gotham, Unruh, & Lord, 2015; Holtmann, Bölte, & Poustka, 2007; Jang & Matson, 2015; Lai et
al., 2011; Lugnegård et al., 2011; Moss, Howlin, Savage, Bolton, & Rutter, 2015; Simonoff et al.,
2008; Simonoff et al., 2013; Sterling et al., 2008; Tureck, Matson, Cervantes, & Konst, 2014; van
Steensel, Bögels, & Dirksen, 2012). To restrict the number of analyses we will solely explore
whether these aforementioned factors are indeed risk factors predictive of the most commonly
co-occurring disorders in adults with ASD, which we expect to be mood and anxiety disorders
(see for a similar approach in children Simonoff et al., 2008; Simonoff et al., 2013).
METHODS
Participants
Two-hundred-forty-seven adults with ASD between 19 and 79 years were recruited through
several mental health institutions across the Netherlands and by means of advertisements on
client organization websites. Individuals with ASD traits, but without a prior clinical diagnosis
of ASD based on DSM-IV criteria (autism, Asperger’s syndrome, and Pervasive Developmental
Disorder Not Otherwise Specified) (American Psychiatric Association, 2000), which was
generally diagnosed by a multidisciplinary team involving a psychologist and/or psychiatrist,
were not eligible to participate in the study.
Two-hundred-eight adults without ASD (comparison [COM] group) were recruited by
means of advertisements on the university website and on social media, and within the
researchers’ social environment. Individuals with a considerable amount of autistic traits, as
measured with the Autism-spectrum Quotient (AQ>32) (Baron-Cohen et al., 2001), or with
close family members having ASD or schizophrenia, were excluded. For both groups, additional
requirement upon participation was an absent history of neurological disorders (e.g., epilepsy,
stroke, cerebral contusion) or schizophrenia. Four-hundred-five individuals met these
prerequisites (216 ASD, 189 COM). The study consisted of two parts. Part I included the
administration of a questionnaire on psychological symptoms and distress and medication usage,
which was completed by 344 individuals (172 ASD, 172 COM) who constituted the final sample
of Part I. Part II included the administration of a neuropsychiatric interview to examine
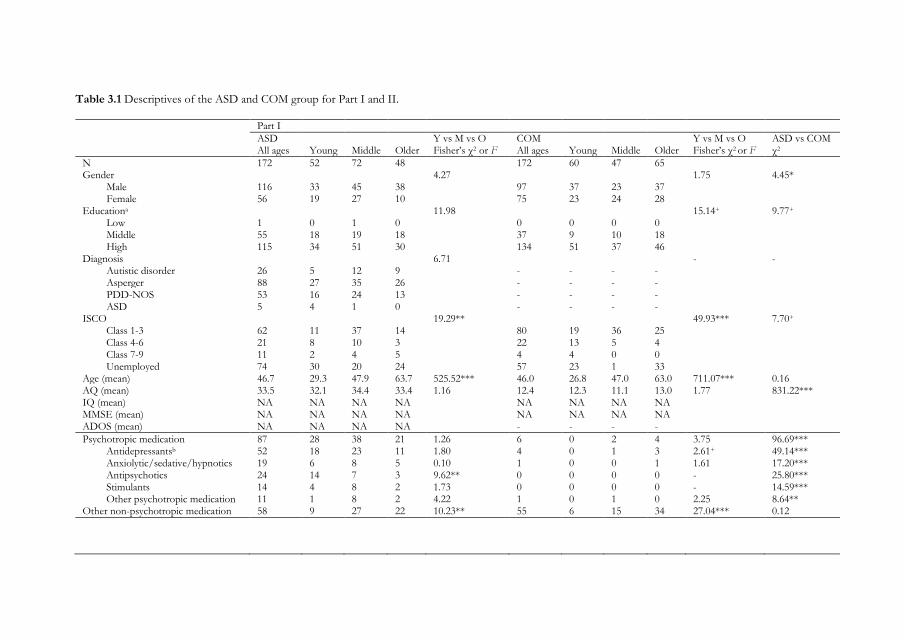
Table 3.1 Descriptives of the ASD and COM group for Part I and II.
Part I
ASD Y vs M vs O COM Y vs M vs O ASD vs COM All ages Young Middle Older Fisher’s χ2 or F All ages Young Middle Older Fisher’s χ2 or F χ2
N 172 52 72 48 172 60 47 65 Gender 4.27 1.75 4.45*
Male 116 33 45 38 97 37 23 37 Female 56 19 27 10 75 23 24 28
Educationa 11.98 15.14+ 9.77+ Low 1 0 1 0 0 0 0 0 Middle 55 18 19 18 37 9 10 18 High 115 34 51 30 134 51 37 46
Diagnosis 6.71 - - Autistic disorder 26 5 12 9 - - - - Asperger 88 27 35 26 - - - - PDD-NOS 53 16 24 13 - - - - ASD 5 4 1 0 - - - -
ISCO 19.29** 49.93*** 7.70+ Class 1-3 62 11 37 14 80 19 36 25 Class 4-6 21 8 10 3 22 13 5 4 Class 7-9 11 2 4 5 4 4 0 0 Unemployed 74 30 20 24 57 23 1 33
Age (mean) 46.7 29.3 47.9 63.7 525.52*** 46.0 26.8 47.0 63.0 711.07*** 0.16 AQ (mean) 33.5 32.1 34.4 33.4 1.16 12.4 12.3 11.1 13.0 1.77 831.22*** IQ (mean) NA NA NA NA NA NA NA NA MMSE (mean) NA NA NA NA NA NA NA NA ADOS (mean) NA NA NA NA - - - -
Psychotropic medication 87 28 38 21 1.26 6 0 2 4 3.75 96.69*** Antidepressantsb 52 18 23 11 1.80 4 0 1 3 2.61+ 49.14*** Anxiolytic/sedative/hypnotics 19 6 8 5 0.10 1 0 0 1 1.61 17.20*** Antipsychotics 24 14 7 3 9.62** 0 0 0 0 - 25.80*** Stimulants 14 4 8 2 1.73 0 0 0 0 - 14.59*** Other psychotropic medication 11 1 8 2 4.22 1 0 1 0 2.25 8.64**
Other non-psychotropic medication 58 9 27 22 10.23** 55 6 15 34 27.04*** 0.12
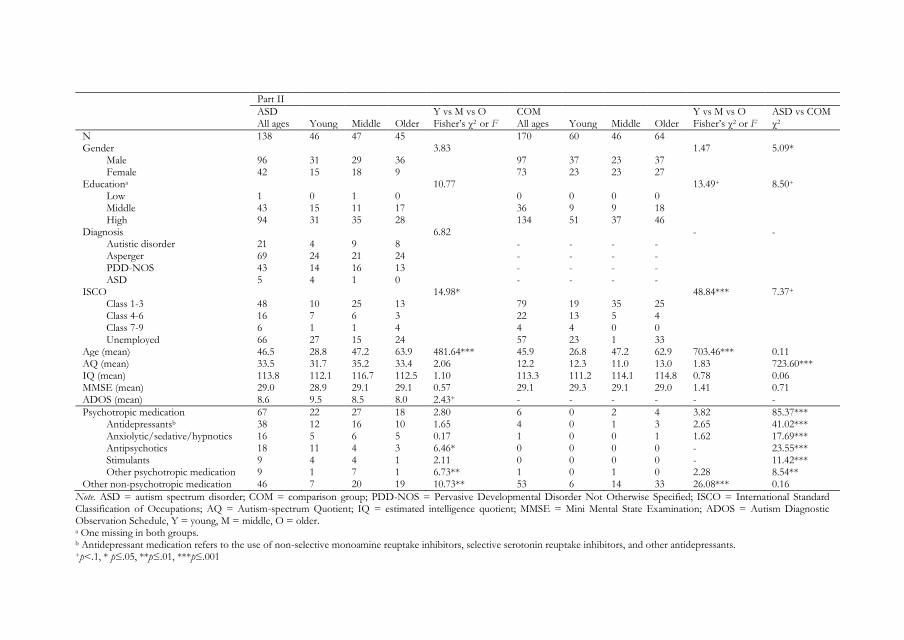
Part II
ASD Y vs M vs O COM Y vs M vs O ASD vs COM All ages Young Middle Older Fisher’s χ2 or F All ages Young Middle Older Fisher’s χ2 or F χ2
N 138 46 47 45 170 60 46 64 Gender 3.83 1.47 5.09*
Male 96 31 29 36 97 37 23 37 Female 42 15 18 9 73 23 23 27
Educationa 10.77 13.49+ 8.50+ Low 1 0 1 0 0 0 0 0 Middle 43 15 11 17 36 9 9 18 High 94 31 35 28 134 51 37 46
Diagnosis 6.82 - - Autistic disorder 21 4 9 8 - - - - Asperger 69 24 21 24 - - - - PDD-NOS 43 14 16 13 - - - - ASD 5 4 1 0 - - - -
ISCO 14.98* 48.84*** 7.37+ Class 1-3 48 10 25 13 79 19 35 25 Class 4-6 16 7 6 3 22 13 5 4 Class 7-9 6 1 1 4 4 4 0 0 Unemployed 66 27 15 24 57 23 1 33
Age (mean) 46.5 28.8 47.2 63.9 481.64*** 45.9 26.8 47.2 62.9 703.46*** 0.11 AQ (mean) 33.5 31.7 35.2 33.4 2.06 12.2 12.3 11.0 13.0 1.83 723.60*** IQ (mean) 113.8 112.1 116.7 112.5 1.10 113.3 111.2 114.1 114.8 0.78 0.06 MMSE (mean) 29.0 28.9 29.1 29.1 0.57 29.1 29.3 29.1 29.0 1.41 0.71 ADOS (mean) 8.6 9.5 8.5 8.0 2.43+ - - - - - -
Psychotropic medication 67 22 27 18 2.80 6 0 2 4 3.82 85.37*** Antidepressantsb 38 12 16 10 1.65 4 0 1 3 2.65 41.02*** Anxiolytic/sedative/hypnotics 16 5 6 5 0.17 1 0 0 1 1.62 17.69*** Antipsychotics 18 11 4 3 6.46* 0 0 0 0 - 23.55*** Stimulants 9 4 4 1 2.11 0 0 0 0 - 11.42*** Other psychotropic medication 9 1 7 1 6.73** 1 0 1 0 2.28 8.54**
Other non-psychotropic medication 46 7 20 19 10.73** 53 6 14 33 26.08*** 0.16
Note. ASD = autism spectrum disorder; COM = comparison group; PDD-NOS = Pervasive Developmental Disorder Not Otherwise Specified; ISCO = International Standard Classification of Occupations; AQ = Autism-spectrum Quotient; IQ = estimated intelligence quotient; MMSE = Mini Mental State Examination; ADOS = Autism Diagnostic Observation Schedule, Y = young, M = middle, O = older. a One missing in both groups. b Antidepressant medication refers to the use of non-selective monoamine reuptake inhibitors, selective serotonin reuptake inhibitors, and other antidepressants. +p<.1, * p≤.05, **p≤.01, ***p≤.001
50 | Chapter 3
psychiatric disorders and an analysis of potential risk factors, and was part of a larger study
assessing age-related differences in cognition (Lever & Geurts, 2015). Eligible ASD individuals
were selected based on age to ascertain that participants were evenly distributed across ages. IQ
was estimated with two subtests of the Dutch Wechsler Adult Intelligence Scale third edition
(WAIS-III) (Uterwijk, 2000; Wechsler, 1997a) and the diagnoses of the ASD participants were
verified by administering the Autism Diagnostic Observation Schedule module 4 (ADOS) (de
Bildt & de Jonge, 2008; Lord et al., 2000). Four individuals (2 ASD, 2 COM) had an estimated
IQ below 80 and were excluded from the sample of Part II. Of the remaining 138 ASD
participants, 37 scored below the ADOS cut-off for ASD (<7), 49 below the autism threshold
(<10), and 52 above the autism threshold (≥10). As all these individuals had a clinical diagnosis
within the autism spectrum, diagnosed independently from the present study by mental health
professionals, and the sensitivity of the ADOS is poor when administered to intellectually able
adults (Bastiaansen, Meffert et al., 2011), we included all these ASD participants in the current
study. Furthermore, 80% scored above the threshold of 26 on the AQ (Woodbury-Smith,
Robinson, Wheelwright, & Baron-Cohen, 2005). All individuals had a Mini Mental State
Examination score above 26 (Folstein, Folstein, & McHugh, 1975). Hence, with respect to Part
II, the final sample for the examination of co-occurring disorders was composed of 138 ASD
participants and 170 COM participants.
Based on a tertile split of this ASD group, the participants were assigned to a young
(19-38 years), middle-aged (39-54 years), and older (55-79 years) adult group (Table 3.1).
Measures
Psychiatric co-occurring symptoms
Symptom Checklist-90 Revised (SCL-90-R). The SCL-90-R (Arrindell & Ettema, 2005; Derogatis,
1977) is a widely used multidimensional self-report inventory consisting of 90 items to assess the
presence of current psychopathological symptoms and psychological distress. Each item is rated
on a five-point Likert scale ranging from 0 “not at all” to 4 “very much” and indicates how much
distress was caused during the last week comprising today. The original SCL-90-R includes nine
primary symptom dimensions and three global indices that cover clinically relevant psychiatric
and psychosomatic symptoms. The Dutch version (Arrindell & Ettema, 2005), however,
measures eight dimensions: anxiety, agoraphobia, depression, somatization, cognitive-
performance deficits, interpersonal sensitivity and mistrust, hostility, and sleep difficulties. The
total score, psychoneuroticism, provides a general measure of psychological distress. Higher
scores indicate more symptoms and distress. The psychometric properties of the SCL-90-R,
Co-occurring psychopathology in adults with ASD | 51
including internal consistency, test-retest reliability, and convergent and divergent validity, are
good to very good (Arrindell & Ettema, 2005).
Psychiatric co-occurring disorders
Mini International Neuropsychiatric Interview Plus (MINI-Plus). The MINI-Plus (Sheehan et al., 1998;
van Vliet, Leroy, & van Megen, 2000) is a structured diagnostic interview that explores several
psychiatric disorders according to DSM-IV criteria. First, two to four screenings questions are
asked for each disorder. Second, if any of these is answered positively, additional questions
further inquire about the presence of a disorder. We inquired about mood, anxiety, substance-
related, eating, somatoform, and conduct disorders. The MINI has good inter-rater and test-
retest reliability (Lecrubier et al., 1997; Sheehan et al., 1997). For the current study, we adjusted
wording of a small number of questions, for example by splitting extended questions into sub
questions, to make them more comprehensible to individuals with ASD and to be able of
examining lifetime adherence for all disorders. Although we did not change the purport of the
items, the validity of the MINI may have been reduced due to these adjustments.
ADHD rating scale. The ADHD rating scale (Kooij et al., 2005) is a 23-item self-report
questionnaire to assess ADHD symptoms based on DSM-IV criteria. Using the adult scale, an
individual rates the extent to which each statement illustrates his or her behavior over the past
six months on a four-point Likert scale, ranging from 0 “rarely or never” to 3 “very often”. Items
rated with “often” or “very often” met diagnostic criteria for either inattentive or hyperactive-
impulsive subtype symptoms. Following the DSM-IV (American Psychiatric Association, 2000),
we considered the presence of at least six out of nine symptoms per subtype as indicative of an
AD(H)D diagnosis. The validity of the ADHD rating scale is reasonable (Kooij et al., 2008).
Risk factors
ASD severity as measured with the AQ and ADOS, intellectual functioning (IQ) as estimated
with a short version of the WAIS-III, general cognitive functioning as measured with the MMSE,
and information on education, work situation (coded according to the International Standard
Classification of Occupations [ISCO]), living situation, gender, and age as indicated by self-
report constituted the risk factors.
Procedure
Informed consent was obtained from all individual participants included in the study, after which
they filled out the AQ and SCL-90, among other questionnaires (Part I). Participants selected
for Part II were tested in two sessions during which (1) the ADOS, shortened WAIS-III, MMSE,
and MINI were administered, and (2) neuropsychological and experimental testing took place
(these are described elsewhere) (e.g., Lever & Geurts, 2015). Participants who were tested in at
52 | Chapter 3
least one test session received compensation for their travel expenses; most COM participants
also received additional compensation (max €20). The study was approved by the institutional
review board of the University of Amsterdam and was in accordance with the 1964 Helsinki
declaration and its later amendments or comparable ethical standards.
Statistical analyses
Psychiatric co-occurring symptoms. SCL-90-R variables were highly skewed and neither log,
square root, nor inverse transformation lead to normality. However, as MANOVA is thought
be robust against this type of violation (Stevens, 2012), we ran a MANOVA with Diagnostic
group (ASD, COM) and Age (young, middle-aged, older) as between-subject factors and the
total score and SCL-90-R subscales as dependent variables. Raw scores were then compared with
normative data available for the general population and a policlinic psychiatric patient group
(Arrindell & Ettema, 2005). Analyses were run with and without outliers (data points more than
3 SD from group mean). When the pattern of results changed by removing outliers, we report
both analyses.
Psychiatric co-occurring disorders. Chi-square tests were used to compare frequencies of
psychiatric disorders, as measured with the MINI-Plus and ADHD list, between the ASD and
COM group. We clustered the inquired disorders into six major disorders: mood, anxiety,
substance-related, eating, somatoform, and attentional and behavioral disorders and Bonferroni
corrected for multiple comparisons (i.e., significance level was set on 0.05/6=0.0083).
Thereafter, chi-square tests were ran per non-clustered disorder to compare the ASD and COM
group and Fisher’s exact test was used to compare frequencies between young, middle-aged and
older adults per diagnostic group. No further correction was applied to these analyses. Results
per distinct disorder are presented when group differences were significant after Bonferroni
correction. Otherwise, they are presented in the supplementary material of Chapter 3.
Risk factors. Binomial logistic regressions and linear regressions were run to assess the
association between risk factors and any mood or anxiety disorder and depression and anxiety
symptoms, respectively. Please note that we computed these risk factor analyses on the sample
of Part II (due to the inclusion of IQ and ADOS) and that we excluded the COM group from
these analyses (as our focus was on the risk factors involved in the ASD group). All analyses
were conducted in SPSS 22.0 (IBM Corp., 2013).
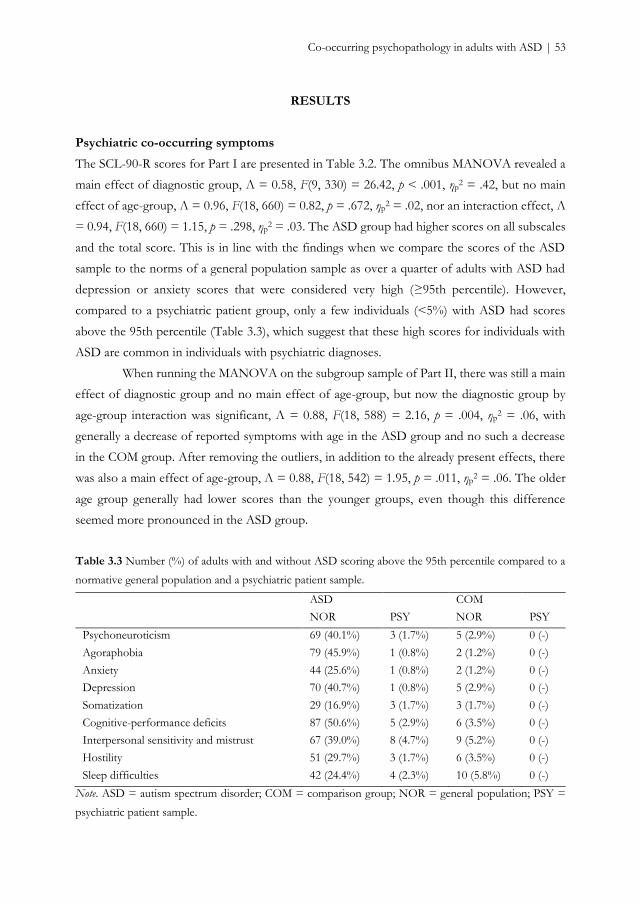
Co-occurring psychopathology in adults with ASD | 53
RESULTS
Psychiatric co-occurring symptoms
The SCL-90-R scores for Part I are presented in Table 3.2. The omnibus MANOVA revealed a
main effect of diagnostic group, Λ = 0.58, F(9, 330) = 26.42, p < .001, ηp2 = .42, but no main
effect of age-group, Λ = 0.96, F(18, 660) = 0.82, p = .672, ηp2 = .02, nor an interaction effect, Λ
= 0.94, F(18, 660) = 1.15, p = .298, ηp2 = .03. The ASD group had higher scores on all subscales
and the total score. This is in line with the findings when we compare the scores of the ASD
sample to the norms of a general population sample as over a quarter of adults with ASD had
depression or anxiety scores that were considered very high (≥95th percentile). However,
compared to a psychiatric patient group, only a few individuals (<5%) with ASD had scores
above the 95th percentile (Table 3.3), which suggest that these high scores for individuals with
ASD are common in individuals with psychiatric diagnoses.
When running the MANOVA on the subgroup sample of Part II, there was still a main
effect of diagnostic group and no main effect of age-group, but now the diagnostic group by
age-group interaction was significant, Λ = 0.88, F(18, 588) = 2.16, p = .004, ηp2 = .06, with
generally a decrease of reported symptoms with age in the ASD group and no such a decrease
in the COM group. After removing the outliers, in addition to the already present effects, there
was also a main effect of age-group, Λ = 0.88, F(18, 542) = 1.95, p = .011, ηp2 = .06. The older
age group generally had lower scores than the younger groups, even though this difference
seemed more pronounced in the ASD group.
Table 3.3 Number (%) of adults with and without ASD scoring above the 95th percentile compared to a
normative general population and a psychiatric patient sample.
ASD COM
NOR PSY NOR PSY
Psychoneuroticism 69 (40.1%) 3 (1.7%) 5 (2.9%) 0 (-)
Agoraphobia 79 (45.9%) 1 (0.8%) 2 (1.2%) 0 (-)
Anxiety 44 (25.6%) 1 (0.8%) 2 (1.2%) 0 (-)
Depression 70 (40.7%) 1 (0.8%) 5 (2.9%) 0 (-)
Somatization 29 (16.9%) 3 (1.7%) 3 (1.7%) 0 (-)
Cognitive-performance deficits 87 (50.6%) 5 (2.9%) 6 (3.5%) 0 (-)
Interpersonal sensitivity and mistrust 67 (39.0%) 8 (4.7%) 9 (5.2%) 0 (-)
Hostility 51 (29.7%) 3 (1.7%) 6 (3.5%) 0 (-)
Sleep difficulties 42 (24.4%) 4 (2.3%) 10 (5.8%) 0 (-)
Note. ASD = autism spectrum disorder; COM = comparison group; NOR = general population; PSY =
psychiatric patient sample.
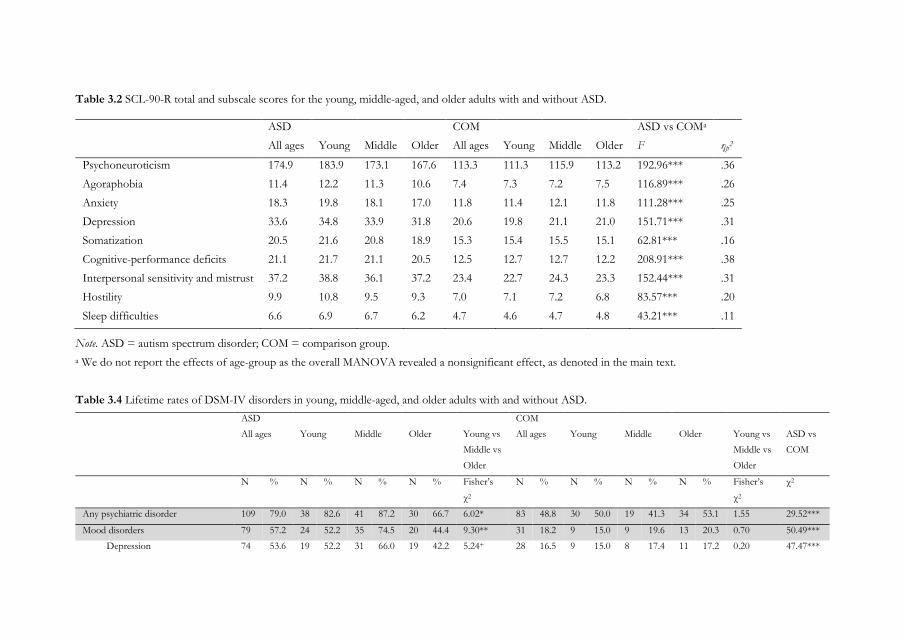
Table 3.2 SCL-90-R total and subscale scores for the young, middle-aged, and older adults with and without ASD.
ASD COM ASD vs COMa
All ages Young Middle Older All ages Young Middle Older F ηp2
Psychoneuroticism 174.9 183.9 173.1 167.6 113.3 111.3 115.9 113.2 192.96*** .36
Agoraphobia 11.4 12.2 11.3 10.6 7.4 7.3 7.2 7.5 116.89*** .26
Anxiety 18.3 19.8 18.1 17.0 11.8 11.4 12.1 11.8 111.28*** .25
Depression 33.6 34.8 33.9 31.8 20.6 19.8 21.1 21.0 151.71*** .31
Somatization 20.5 21.6 20.8 18.9 15.3 15.4 15.5 15.1 62.81*** .16
Cognitive-performance deficits 21.1 21.7 21.1 20.5 12.5 12.7 12.7 12.2 208.91*** .38
Interpersonal sensitivity and mistrust 37.2 38.8 36.1 37.2 23.4 22.7 24.3 23.3 152.44*** .31
Hostility 9.9 10.8 9.5 9.3 7.0 7.1 7.2 6.8 83.57*** .20
Sleep difficulties 6.6 6.9 6.7 6.2 4.7 4.6 4.7 4.8 43.21*** .11
Note. ASD = autism spectrum disorder; COM = comparison group.
a We do not report the effects of age-group as the overall MANOVA revealed a nonsignificant effect, as denoted in the main text.
Table 3.4 Lifetime rates of DSM-IV disorders in young, middle-aged, and older adults with and without ASD.
ASD COM
All ages Young Middle Older Young vs
Middle vs
Older
All ages Young Middle Older Young vs
Middle vs
Older
ASD vs
COM
N % N % N % N % Fisher’s
χ2
N % N % N % N % Fisher’s
χ2
χ2
Any psychiatric disorder 109 79.0 38 82.6 41 87.2 30 66.7 6.02* 83 48.8 30 50.0 19 41.3 34 53.1 1.55 29.52***
Mood disorders 79 57.2 24 52.2 35 74.5 20 44.4 9.30** 31 18.2 9 15.0 9 19.6 13 20.3 0.70 50.49***
Depression 74 53.6 19 52.2 31 66.0 19 42.2 5.24+ 28 16.5 9 15.0 8 17.4 11 17.2 0.20 47.47***
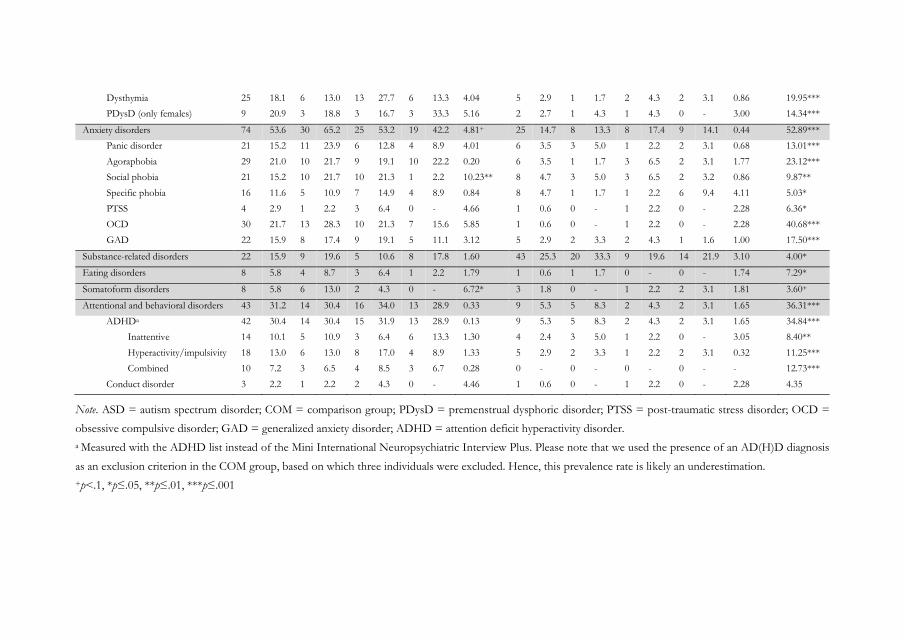
Dysthymia 25 18.1 6 13.0 13 27.7 6 13.3 4.04 5 2.9 1 1.7 2 4.3 2 3.1 0.86 19.95***
PDysD (only females) 9 20.9 3 18.8 3 16.7 3 33.3 5.16 2 2.7 1 4.3 1 4.3 0 - 3.00 14.34***
Anxiety disorders 74 53.6 30 65.2 25 53.2 19 42.2 4.81+ 25 14.7 8 13.3 8 17.4 9 14.1 0.44 52.89***
Panic disorder 21 15.2 11 23.9 6 12.8 4 8.9 4.01 6 3.5 3 5.0 1 2.2 2 3.1 0.68 13.01***
Agoraphobia 29 21.0 10 21.7 9 19.1 10 22.2 0.20 6 3.5 1 1.7 3 6.5 2 3.1 1.77 23.12***
Social phobia 21 15.2 10 21.7 10 21.3 1 2.2 10.23** 8 4.7 3 5.0 3 6.5 2 3.2 0.86 9.87**
Specific phobia 16 11.6 5 10.9 7 14.9 4 8.9 0.84 8 4.7 1 1.7 1 2.2 6 9.4 4.11 5.03*
PTSS 4 2.9 1 2.2 3 6.4 0 - 4.66 1 0.6 0 - 1 2.2 0 - 2.28 6.36*
OCD 30 21.7 13 28.3 10 21.3 7 15.6 5.85 1 0.6 0 - 1 2.2 0 - 2.28 40.68***
GAD 22 15.9 8 17.4 9 19.1 5 11.1 3.12 5 2.9 2 3.3 2 4.3 1 1.6 1.00 17.50***
Substance-related disorders 22 15.9 9 19.6 5 10.6 8 17.8 1.60 43 25.3 20 33.3 9 19.6 14 21.9 3.10 4.00*
Eating disorders 8 5.8 4 8.7 3 6.4 1 2.2 1.79 1 0.6 1 1.7 0 - 0 - 1.74 7.29*
Somatoform disorders 8 5.8 6 13.0 2 4.3 0 - 6.72* 3 1.8 0 - 1 2.2 2 3.1 1.81 3.60+
Attentional and behavioral disorders 43 31.2 14 30.4 16 34.0 13 28.9 0.33 9 5.3 5 8.3 2 4.3 2 3.1 1.65 36.31***
ADHDa 42 30.4 14 30.4 15 31.9 13 28.9 0.13 9 5.3 5 8.3 2 4.3 2 3.1 1.65 34.84***
Inattentive 14 10.1 5 10.9 3 6.4 6 13.3 1.30 4 2.4 3 5.0 1 2.2 0 - 3.05 8.40**
Hyperactivity/impulsivity 18 13.0 6 13.0 8 17.0 4 8.9 1.33 5 2.9 2 3.3 1 2.2 2 3.1 0.32 11.25***
Combined 10 7.2 3 6.5 4 8.5 3 6.7 0.28 0 - 0 - 0 - 0 - - 12.73***
Conduct disorder 3 2.2 1 2.2 2 4.3 0 - 4.46 1 0.6 0 - 1 2.2 0 - 2.28 4.35
Note. ASD = autism spectrum disorder; COM = comparison group; PDysD = premenstrual dysphoric disorder; PTSS = post-traumatic stress disorder; OCD =
obsessive compulsive disorder; GAD = generalized anxiety disorder; ADHD = attention deficit hyperactivity disorder.
a Measured with the ADHD list instead of the Mini International Neuropsychiatric Interview Plus. Please note that we used the presence of an AD(H)D diagnosis
as an exclusion criterion in the COM group, based on which three individuals were excluded. Hence, this prevalence rate is likely an underestimation.
+p<.1, *p≤.05, **p≤.01, ***p≤.001
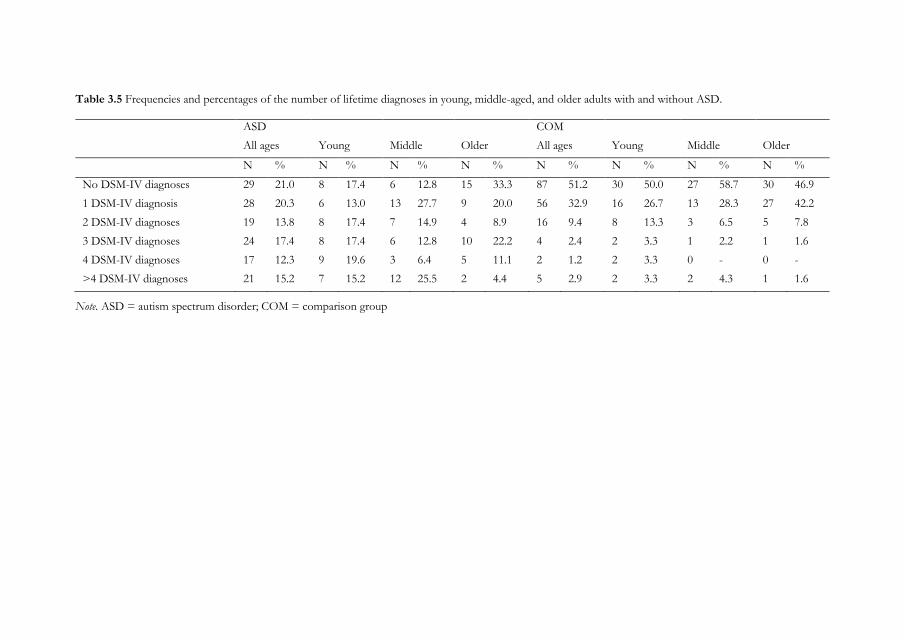
Table 3.5 Frequencies and percentages of the number of lifetime diagnoses in young, middle-aged, and older adults with and without ASD.
ASD COM
All ages Young Middle Older All ages Young Middle Older
N % N % N % N % N % N % N % N %
No DSM-IV diagnoses 29 21.0 8 17.4 6 12.8 15 33.3 87 51.2 30 50.0 27 58.7 30 46.9
1 DSM-IV diagnosis 28 20.3 6 13.0 13 27.7 9 20.0 56 32.9 16 26.7 13 28.3 27 42.2
2 DSM-IV diagnoses 19 13.8 8 17.4 7 14.9 4 8.9 16 9.4 8 13.3 3 6.5 5 7.8
3 DSM-IV diagnoses 24 17.4 8 17.4 6 12.8 10 22.2 4 2.4 2 3.3 1 2.2 1 1.6
4 DSM-IV diagnoses 17 12.3 9 19.6 3 6.4 5 11.1 2 1.2 2 3.3 0 - 0 -
>4 DSM-IV diagnoses 21 15.2 7 15.2 12 25.5 2 4.4 5 2.9 2 3.3 2 4.3 1 1.6
Note. ASD = autism spectrum disorder; COM = comparison group
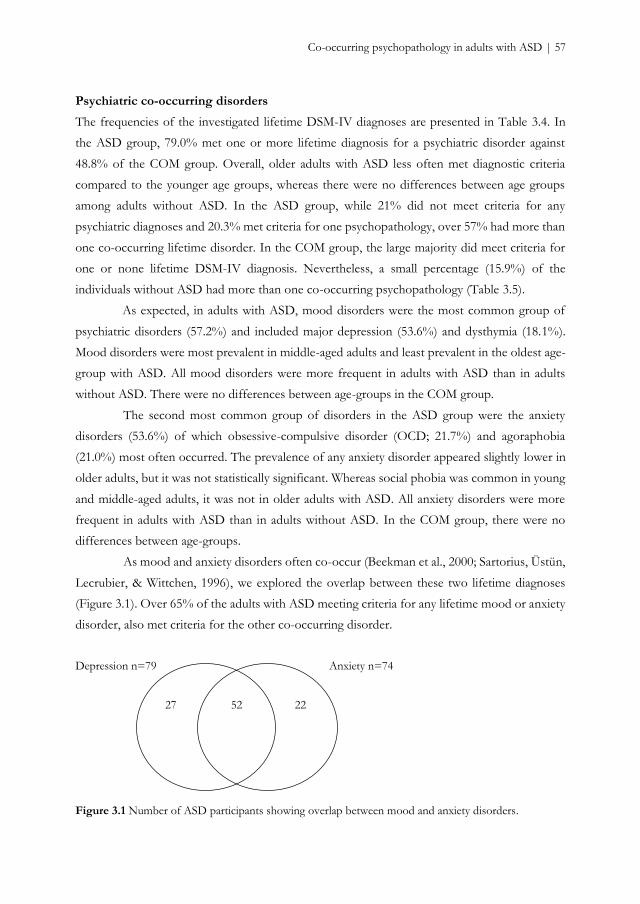
Co-occurring psychopathology in adults with ASD | 57
Psychiatric co-occurring disorders
The frequencies of the investigated lifetime DSM-IV diagnoses are presented in Table 3.4. In
the ASD group, 79.0% met one or more lifetime diagnosis for a psychiatric disorder against
48.8% of the COM group. Overall, older adults with ASD less often met diagnostic criteria
compared to the younger age groups, whereas there were no differences between age groups
among adults without ASD. In the ASD group, while 21% did not meet criteria for any
psychiatric diagnoses and 20.3% met criteria for one psychopathology, over 57% had more than
one co-occurring lifetime disorder. In the COM group, the large majority did meet criteria for
one or none lifetime DSM-IV diagnosis. Nevertheless, a small percentage (15.9%) of the
individuals without ASD had more than one co-occurring psychopathology (Table 3.5).
As expected, in adults with ASD, mood disorders were the most common group of
psychiatric disorders (57.2%) and included major depression (53.6%) and dysthymia (18.1%).
Mood disorders were most prevalent in middle-aged adults and least prevalent in the oldest age-
group with ASD. All mood disorders were more frequent in adults with ASD than in adults
without ASD. There were no differences between age-groups in the COM group.
The second most common group of disorders in the ASD group were the anxiety
disorders (53.6%) of which obsessive-compulsive disorder (OCD; 21.7%) and agoraphobia
(21.0%) most often occurred. The prevalence of any anxiety disorder appeared slightly lower in
older adults, but it was not statistically significant. Whereas social phobia was common in young
and middle-aged adults, it was not in older adults with ASD. All anxiety disorders were more
frequent in adults with ASD than in adults without ASD. In the COM group, there were no
differences between age-groups.
As mood and anxiety disorders often co-occur (Beekman et al., 2000; Sartorius, Üstün,
Lecrubier, & Wittchen, 1996), we explored the overlap between these two lifetime diagnoses
(Figure 3.1). Over 65% of the adults with ASD meeting criteria for any lifetime mood or anxiety
disorder, also met criteria for the other co-occurring disorder.
Depression n=79 Anxiety n=74
Figure 3.1 Number of ASD participants showing overlap between mood and anxiety disorders.
52 27 22
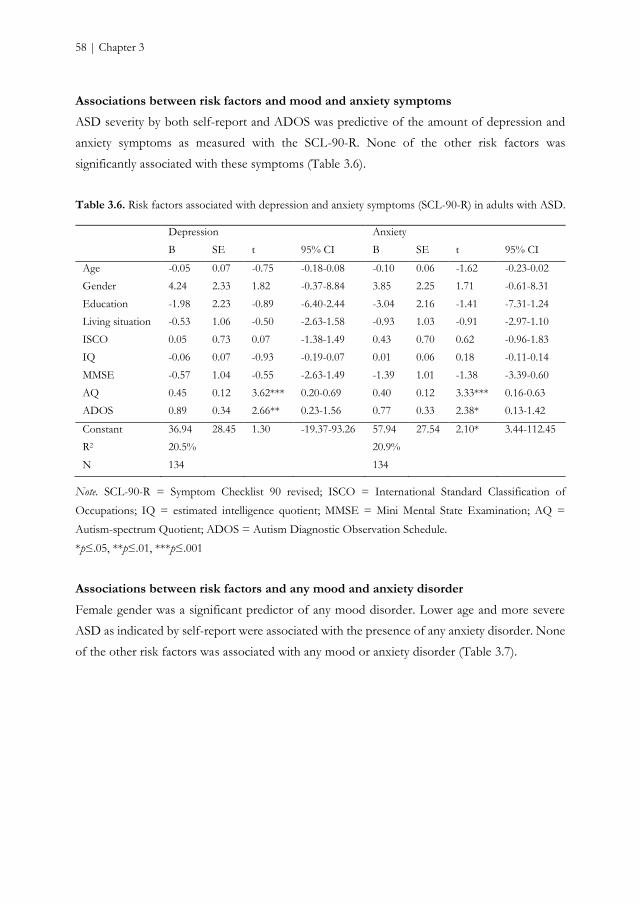
58 | Chapter 3
Associations between risk factors and mood and anxiety symptoms
ASD severity by both self-report and ADOS was predictive of the amount of depression and
anxiety symptoms as measured with the SCL-90-R. None of the other risk factors was
significantly associated with these symptoms (Table 3.6).
Table 3.6. Risk factors associated with depression and anxiety symptoms (SCL-90-R) in adults with ASD.
Depression Anxiety
B SE t 95% CI B SE t 95% CI
Age -0.05 0.07 -0.75 -0.18-0.08 -0.10 0.06 -1.62 -0.23-0.02
Gender 4.24 2.33 1.82 -0.37-8.84 3.85 2.25 1.71 -0.61-8.31
Education -1.98 2.23 -0.89 -6.40-2.44 -3.04 2.16 -1.41 -7.31-1.24
Living situation -0.53 1.06 -0.50 -2.63-1.58 -0.93 1.03 -0.91 -2.97-1.10
ISCO 0.05 0.73 0.07 -1.38-1.49 0.43 0.70 0.62 -0.96-1.83
IQ -0.06 0.07 -0.93 -0.19-0.07 0.01 0.06 0.18 -0.11-0.14
MMSE -0.57 1.04 -0.55 -2.63-1.49 -1.39 1.01 -1.38 -3.39-0.60
AQ 0.45 0.12 3.62*** 0.20-0.69 0.40 0.12 3.33*** 0.16-0.63
ADOS 0.89 0.34 2.66** 0.23-1.56 0.77 0.33 2.38* 0.13-1.42
Constant 36.94 28.45 1.30 -19.37-93.26 57.94 27.54 2.10* 3.44-112.45
R2 20.5% 20.9%
N 134 134
Note. SCL-90-R = Symptom Checklist 90 revised; ISCO = International Standard Classification of
Occupations; IQ = estimated intelligence quotient; MMSE = Mini Mental State Examination; AQ =
Autism-spectrum Quotient; ADOS = Autism Diagnostic Observation Schedule.
*p≤.05, **p≤.01, ***p≤.001
Associations between risk factors and any mood and anxiety disorder
Female gender was a significant predictor of any mood disorder. Lower age and more severe
ASD as indicated by self-report were associated with the presence of any anxiety disorder. None
of the other risk factors was associated with any mood or anxiety disorder (Table 3.7).
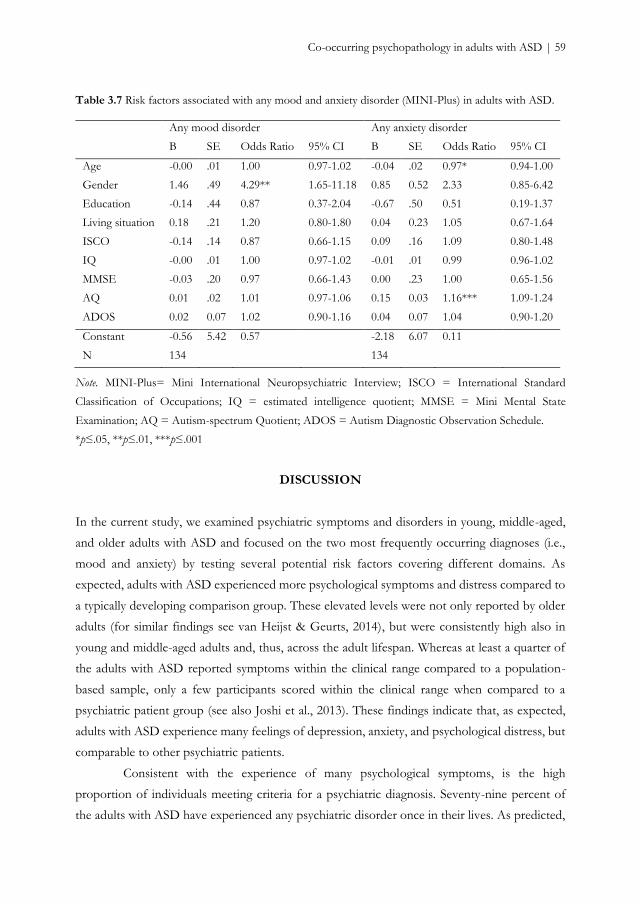
Co-occurring psychopathology in adults with ASD | 59
Table 3.7 Risk factors associated with any mood and anxiety disorder (MINI-Plus) in adults with ASD.
Any mood disorder Any anxiety disorder
B SE Odds Ratio 95% CI B SE Odds Ratio 95% CI
Age -0.00 .01 1.00 0.97-1.02 -0.04 .02 0.97* 0.94-1.00
Gender 1.46 .49 4.29** 1.65-11.18 0.85 0.52 2.33 0.85-6.42
Education -0.14 .44 0.87 0.37-2.04 -0.67 .50 0.51 0.19-1.37
Living situation 0.18 .21 1.20 0.80-1.80 0.04 0.23 1.05 0.67-1.64
ISCO -0.14 .14 0.87 0.66-1.15 0.09 .16 1.09 0.80-1.48
IQ -0.00 .01 1.00 0.97-1.02 -0.01 .01 0.99 0.96-1.02
MMSE -0.03 .20 0.97 0.66-1.43 0.00 .23 1.00 0.65-1.56
AQ 0.01 .02 1.01 0.97-1.06 0.15 0.03 1.16*** 1.09-1.24
ADOS 0.02 0.07 1.02 0.90-1.16 0.04 0.07 1.04 0.90-1.20
Constant -0.56 5.42 0.57 -2.18 6.07 0.11
N 134 134
Note. MINI-Plus= Mini International Neuropsychiatric Interview; ISCO = International Standard
Classification of Occupations; IQ = estimated intelligence quotient; MMSE = Mini Mental State
Examination; AQ = Autism-spectrum Quotient; ADOS = Autism Diagnostic Observation Schedule.
*p≤.05, **p≤.01, ***p≤.001
DISCUSSION
In the current study, we examined psychiatric symptoms and disorders in young, middle-aged,
and older adults with ASD and focused on the two most frequently occurring diagnoses (i.e.,
mood and anxiety) by testing several potential risk factors covering different domains. As
expected, adults with ASD experienced more psychological symptoms and distress compared to
a typically developing comparison group. These elevated levels were not only reported by older
adults (for similar findings see van Heijst & Geurts, 2014), but were consistently high also in
young and middle-aged adults and, thus, across the adult lifespan. Whereas at least a quarter of
the adults with ASD reported symptoms within the clinical range compared to a population-
based sample, only a few participants scored within the clinical range when compared to a
psychiatric patient group (see also Joshi et al., 2013). These findings indicate that, as expected,
adults with ASD experience many feelings of depression, anxiety, and psychological distress, but
comparable to other psychiatric patients.
Consistent with the experience of many psychological symptoms, is the high
proportion of individuals meeting criteria for a psychiatric diagnosis. Seventy-nine percent of
the adults with ASD have experienced any psychiatric disorder once in their lives. As predicted,
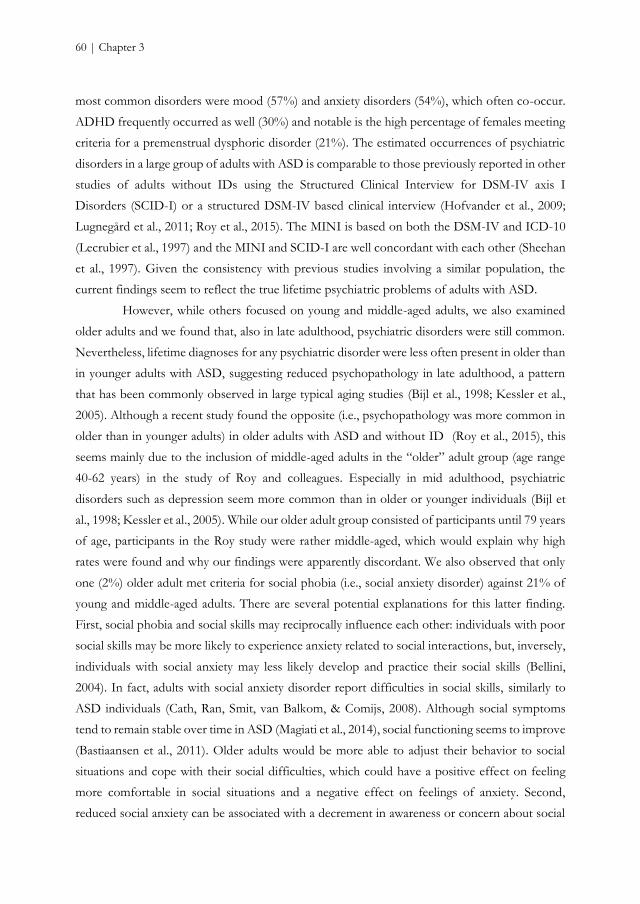
60 | Chapter 3
most common disorders were mood (57%) and anxiety disorders (54%), which often co-occur.
ADHD frequently occurred as well (30%) and notable is the high percentage of females meeting
criteria for a premenstrual dysphoric disorder (21%). The estimated occurrences of psychiatric
disorders in a large group of adults with ASD is comparable to those previously reported in other
studies of adults without IDs using the Structured Clinical Interview for DSM-IV axis I
Disorders (SCID-I) or a structured DSM-IV based clinical interview (Hofvander et al., 2009;
Lugnegård et al., 2011; Roy et al., 2015). The MINI is based on both the DSM-IV and ICD-10
(Lecrubier et al., 1997) and the MINI and SCID-I are well concordant with each other (Sheehan
et al., 1997). Given the consistency with previous studies involving a similar population, the
current findings seem to reflect the true lifetime psychiatric problems of adults with ASD.
However, while others focused on young and middle-aged adults, we also examined
older adults and we found that, also in late adulthood, psychiatric disorders were still common.
Nevertheless, lifetime diagnoses for any psychiatric disorder were less often present in older than
in younger adults with ASD, suggesting reduced psychopathology in late adulthood, a pattern
that has been commonly observed in large typical aging studies (Bijl et al., 1998; Kessler et al.,
2005). Although a recent study found the opposite (i.e., psychopathology was more common in
older than in younger adults) in older adults with ASD and without ID (Roy et al., 2015), this
seems mainly due to the inclusion of middle-aged adults in the “older” adult group (age range
40-62 years) in the study of Roy and colleagues. Especially in mid adulthood, psychiatric
disorders such as depression seem more common than in older or younger individuals (Bijl et
al., 1998; Kessler et al., 2005). While our older adult group consisted of participants until 79 years
of age, participants in the Roy study were rather middle-aged, which would explain why high
rates were found and why our findings were apparently discordant. We also observed that only
one (2%) older adult met criteria for social phobia (i.e., social anxiety disorder) against 21% of
young and middle-aged adults. There are several potential explanations for this latter finding.
First, social phobia and social skills may reciprocally influence each other: individuals with poor
social skills may be more likely to experience anxiety related to social interactions, but, inversely,
individuals with social anxiety may less likely develop and practice their social skills (Bellini,
2004). In fact, adults with social anxiety disorder report difficulties in social skills, similarly to
ASD individuals (Cath, Ran, Smit, van Balkom, & Comijs, 2008). Although social symptoms
tend to remain stable over time in ASD (Magiati et al., 2014), social functioning seems to improve
(Bastiaansen et al., 2011). Older adults would be more able to adjust their behavior to social
situations and cope with their social difficulties, which could have a positive effect on feeling
more comfortable in social situations and a negative effect on feelings of anxiety. Second,
reduced social anxiety can be associated with a decrement in awareness or concern about social
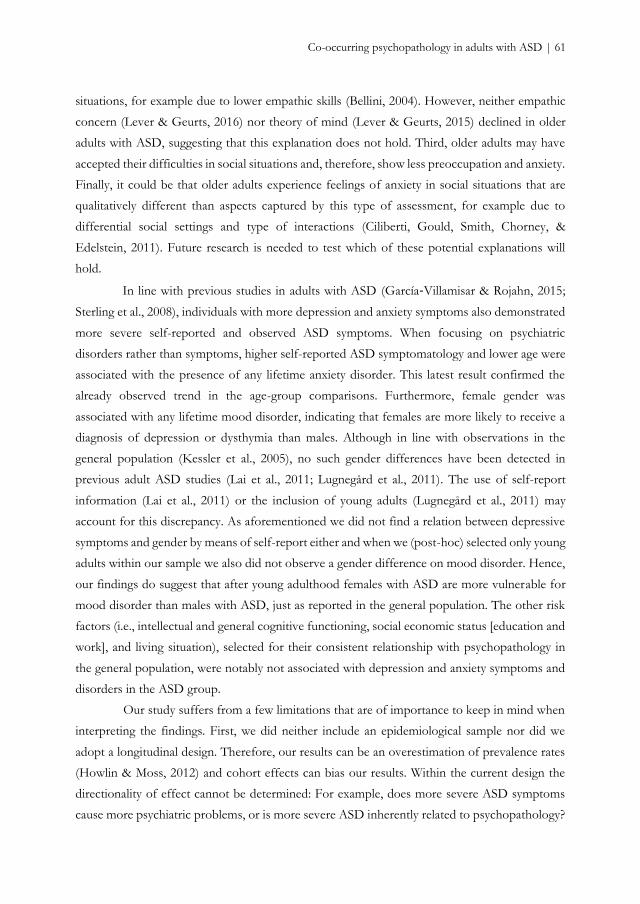
Co-occurring psychopathology in adults with ASD | 61
situations, for example due to lower empathic skills (Bellini, 2004). However, neither empathic
concern (Lever & Geurts, 2016) nor theory of mind (Lever & Geurts, 2015) declined in older
adults with ASD, suggesting that this explanation does not hold. Third, older adults may have
accepted their difficulties in social situations and, therefore, show less preoccupation and anxiety.
Finally, it could be that older adults experience feelings of anxiety in social situations that are
qualitatively different than aspects captured by this type of assessment, for example due to
differential social settings and type of interactions (Ciliberti, Gould, Smith, Chorney, &
Edelstein, 2011). Future research is needed to test which of these potential explanations will
hold.
In line with previous studies in adults with ASD (García‐Villamisar & Rojahn, 2015;
Sterling et al., 2008), individuals with more depression and anxiety symptoms also demonstrated
more severe self-reported and observed ASD symptoms. When focusing on psychiatric
disorders rather than symptoms, higher self-reported ASD symptomatology and lower age were
associated with the presence of any lifetime anxiety disorder. This latest result confirmed the
already observed trend in the age-group comparisons. Furthermore, female gender was
associated with any lifetime mood disorder, indicating that females are more likely to receive a
diagnosis of depression or dysthymia than males. Although in line with observations in the
general population (Kessler et al., 2005), no such gender differences have been detected in
previous adult ASD studies (Lai et al., 2011; Lugnegård et al., 2011). The use of self-report
information (Lai et al., 2011) or the inclusion of young adults (Lugnegård et al., 2011) may
account for this discrepancy. As aforementioned we did not find a relation between depressive
symptoms and gender by means of self-report either and when we (post-hoc) selected only young
adults within our sample we also did not observe a gender difference on mood disorder. Hence,
our findings do suggest that after young adulthood females with ASD are more vulnerable for
mood disorder than males with ASD, just as reported in the general population. The other risk
factors (i.e., intellectual and general cognitive functioning, social economic status [education and
work], and living situation), selected for their consistent relationship with psychopathology in
the general population, were notably not associated with depression and anxiety symptoms and
disorders in the ASD group.
Our study suffers from a few limitations that are of importance to keep in mind when
interpreting the findings. First, we did neither include an epidemiological sample nor did we
adopt a longitudinal design. Therefore, our results can be an overestimation of prevalence rates
(Howlin & Moss, 2012) and cohort effects can bias our results. Within the current design the
directionality of effect cannot be determined: For example, does more severe ASD symptoms
cause more psychiatric problems, or is more severe ASD inherently related to psychopathology?
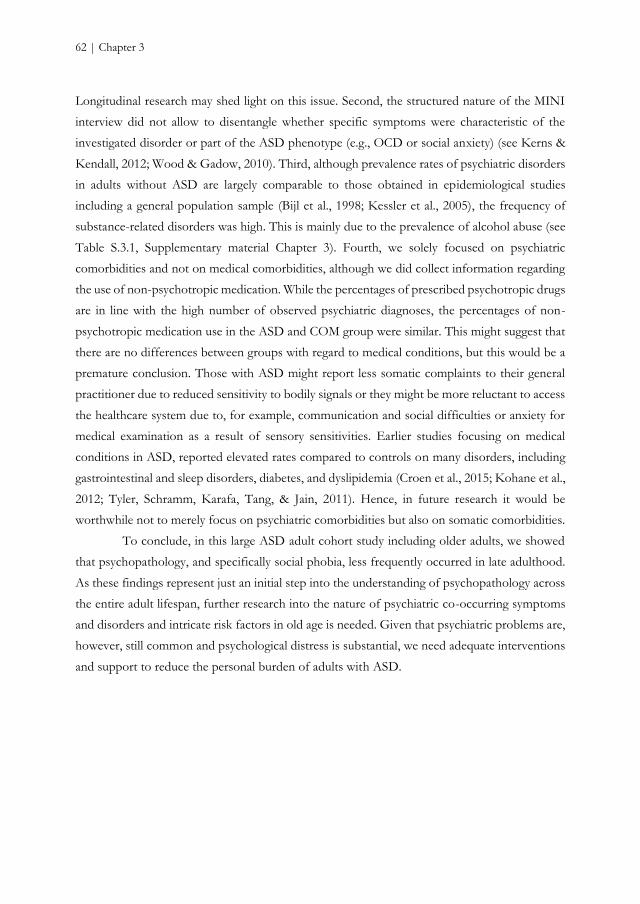
62 | Chapter 3
Longitudinal research may shed light on this issue. Second, the structured nature of the MINI
interview did not allow to disentangle whether specific symptoms were characteristic of the
investigated disorder or part of the ASD phenotype (e.g., OCD or social anxiety) (see Kerns &
Kendall, 2012; Wood & Gadow, 2010). Third, although prevalence rates of psychiatric disorders
in adults without ASD are largely comparable to those obtained in epidemiological studies
including a general population sample (Bijl et al., 1998; Kessler et al., 2005), the frequency of
substance-related disorders was high. This is mainly due to the prevalence of alcohol abuse (see
Table S.3.1, Supplementary material Chapter 3). Fourth, we solely focused on psychiatric
comorbidities and not on medical comorbidities, although we did collect information regarding
the use of non-psychotropic medication. While the percentages of prescribed psychotropic drugs
are in line with the high number of observed psychiatric diagnoses, the percentages of non-
psychotropic medication use in the ASD and COM group were similar. This might suggest that
there are no differences between groups with regard to medical conditions, but this would be a
premature conclusion. Those with ASD might report less somatic complaints to their general
practitioner due to reduced sensitivity to bodily signals or they might be more reluctant to access
the healthcare system due to, for example, communication and social difficulties or anxiety for
medical examination as a result of sensory sensitivities. Earlier studies focusing on medical
conditions in ASD, reported elevated rates compared to controls on many disorders, including
gastrointestinal and sleep disorders, diabetes, and dyslipidemia (Croen et al., 2015; Kohane et al.,
2012; Tyler, Schramm, Karafa, Tang, & Jain, 2011). Hence, in future research it would be
worthwhile not to merely focus on psychiatric comorbidities but also on somatic comorbidities.
To conclude, in this large ASD adult cohort study including older adults, we showed
that psychopathology, and specifically social phobia, less frequently occurred in late adulthood.
As these findings represent just an initial step into the understanding of psychopathology across
the entire adult lifespan, further research into the nature of psychiatric co-occurring symptoms
and disorders and intricate risk factors in old age is needed. Given that psychiatric problems are,
however, still common and psychological distress is substantial, we need adequate interventions
and support to reduce the personal burden of adults with ASD.
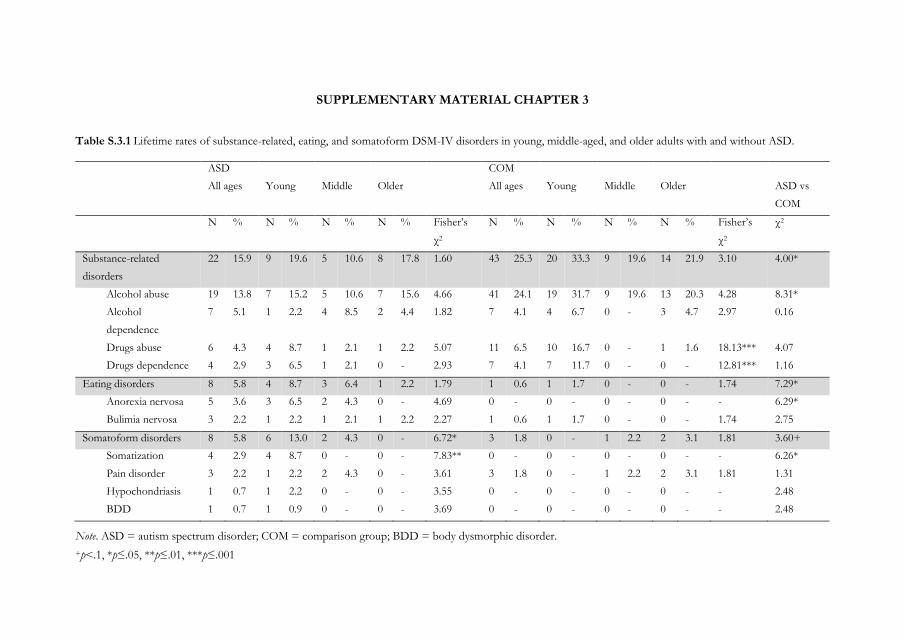
SUPPLEMENTARY MATERIAL CHAPTER 3
Table S.3.1 Lifetime rates of substance-related, eating, and somatoform DSM-IV disorders in young, middle-aged, and older adults with and without ASD.
ASD COM
All ages Young Middle Older All ages Young Middle Older ASD vs
COM
N % N % N % N % Fisher’s
χ2
N % N % N % N % Fisher’s
χ2
χ2
Substance-related
disorders
22 15.9 9 19.6 5 10.6 8 17.8 1.60 43 25.3 20 33.3 9 19.6 14 21.9 3.10 4.00*
Alcohol abuse 19 13.8 7 15.2 5 10.6 7 15.6 4.66 41 24.1 19 31.7 9 19.6 13 20.3 4.28 8.31*
Alcohol
dependence
7 5.1 1 2.2 4 8.5 2 4.4 1.82 7 4.1 4 6.7 0 - 3 4.7 2.97 0.16
Drugs abuse 6 4.3 4 8.7 1 2.1 1 2.2 5.07 11 6.5 10 16.7 0 - 1 1.6 18.13*** 4.07
Drugs dependence 4 2.9 3 6.5 1 2.1 0 - 2.93 7 4.1 7 11.7 0 - 0 - 12.81*** 1.16
Eating disorders 8 5.8 4 8.7 3 6.4 1 2.2 1.79 1 0.6 1 1.7 0 - 0 - 1.74 7.29*
Anorexia nervosa 5 3.6 3 6.5 2 4.3 0 - 4.69 0 - 0 - 0 - 0 - - 6.29*
Bulimia nervosa 3 2.2 1 2.2 1 2.1 1 2.2 2.27 1 0.6 1 1.7 0 - 0 - 1.74 2.75
Somatoform disorders 8 5.8 6 13.0 2 4.3 0 - 6.72* 3 1.8 0 - 1 2.2 2 3.1 1.81 3.60+
Somatization 4 2.9 4 8.7 0 - 0 - 7.83** 0 - 0 - 0 - 0 - - 6.26*
Pain disorder 3 2.2 1 2.2 2 4.3 0 - 3.61 3 1.8 0 - 1 2.2 2 3.1 1.81 1.31
Hypochondriasis 1 0.7 1 2.2 0 - 0 - 3.55 0 - 0 - 0 - 0 - - 2.48
BDD 1 0.7 1 0.9 0 - 0 - 3.69 0 - 0 - 0 - 0 - - 2.48
Note. ASD = autism spectrum disorder; COM = comparison group; BDD = body dysmorphic disorder.
+p<.1, *p≤.05, **p≤.01, ***p≤.001

Chapter 4
Age-related differences in cognition
across the adult lifespan in autism spectrum disorder
Based on: Lever, A. G. & Geurts, H. M. (2015). Age-related differences in cognition across the
adult lifespan in autism spectrum disorder. Autism Research. Advanced online publication, doi:
10.1002/aur.1545.
66 | Chapter 4
ABSTRACT
It is largely unknown how age impacts cognition in autism spectrum disorder (ASD). We
investigated whether age-related cognitive differences are similar, reduced or increased across
the adult lifespan, examined cognitive strengths and weaknesses, and explored whether objective
test performance is related to subjective cognitive challenges. Neuropsychological tests assessing
visual and verbal memory, generativity, and theory of mind (ToM), and a self-report measure
assessing cognitive failures were administered to 236 matched participants with and without
ASD, aged 20-79 years (IQ>80). Group comparisons revealed that individuals with ASD had
higher scores on visual memory, lower scores on generativity and ToM, and similar performance
on verbal memory. However, ToM impairments were no longer present in older (50+ years)
adults with ASD. Across adulthood, individuals with ASD demonstrated similar age-related
effects on verbal memory, generativity, and ToM, while age-related differences were reduced on
visual memory. Although adults with ASD reported many cognitive failures, those were not
associated with neuropsychological test performance. Hence, while some cognitive abilities
(visual and verbal memory) and difficulties (generativity and semantic memory) persist across
adulthood in ASD, others become less apparent in old age (ToM). Age-related differences
characteristic of typical aging are reduced or parallel, but not increased in individuals with ASD,
suggesting that ASD may partially protect against an age-related decrease in cognitive
functioning. Despite these findings, adults with ASD experience many cognitive daily challenges,
which highlights the need for adequate social support and the importance of further research
into this topic, including longitudinal studies.
Keywords: autism spectrum disorder, aging, older adults, cognition, neuropsychology, memory,
theory of mind, generativity
Age-related differences in cognition in ASD | 67
INTRODUCTION
Typical aging is associated with age-related decline in various cognitive domains, such as episodic
memory (e.g., Goh et al., 2012; Nyberg et al., 2012), executive functions (EF) (e.g., Hasher &
Zacks, 1988; Verhaeghen & Cerella, 2002), and advanced theory of mind (ToM) (e.g., Charlton
et al., 2009; Maylor et al., 2002). Cognitive challenges encountered by typically aging individuals
show large overlap with those faced by individuals with autism spectrum disorder (ASD) at
younger ages. For example, children and adolescents with ASD, a neurodevelopmental disorder
characterized by qualitative impairments in social communication and interaction and restricted,
repetitive behavior (American Psychiatric Association, 2013), display difficulties in aspects of
episodic memory (Boucher et al., 2012), EF (Brunsdon & Happé, 2014; Hill, 2004), and ToM
(Yirmiya et al., 1998). While ASD is a lifelong condition, it is unknown (Happé & Charlton, 2012;
Mukaetova‐Ladinska et al., 2012) what happens to individuals with ASD when aging processes
start to kick in.
Even though some are arguing that having ASD might protect against developing
dementia (Oberman & Pascual-Leone, 2014), to our knowledge only two studies actually focused
on cognition in older adults. A series of case-studies (67-84 years, N = 5) indicated that older
adults with ASD still encounter cognitive deficits, although only three were assessed with actual
memory and EF tests (James et al., 2006). In the first ASD group study on age-related cognitive
differences among older adults (51-83 years, N = 46), the effect of age was not homogenous
across domains (Geurts & Vissers, 2012; Goh et al., 2012). The authors postulated three
hypotheses regarding age-related patterns. First, age may have a similar effect in individuals with
and without ASD (parallel development hypothesis), which was observed for verbal memory.
Second, ASD may have a detrimental effect (double jeopardy hypothesis), resulting in a steeper
age-related decrease in cognitive functioning, as was observed for visual memory. Third, ASD
may ‘protect’ against age-related differences (safeguard hypothesis), as a reduced pattern was
observed for generativity. The relatively small sample size of the study, and lack of using a
standardized diagnostic instrument to verify already existing ASD diagnoses, warrants replication
(Geurts & Vissers, 2012).
The current study was designed to test the three hypotheses by determining whether
these earlier findings for episodic memory (visual and verbal) and generativity (fluency) can be
replicated, but also by focusing on ToM. ToM is a highly relevant cognitive domain for ASD,
which was ignored in the previous study. Besides using standardized assessment and including a
much larger, independent, age-comparable group (50-79 years, n = 113), we extended the age
range (20-79 years, N = 236) to study cognition not only in old age, but also across the adult
68 | Chapter 4
lifespan. Please note that recently, in another ASD group study exploring age-related differences
over the adult lifespan (20-61 years) in relational memory, a safeguard pattern on a specific
aspect of relational memory was found (Ring, Gaigg, & Bowler, 2015). Finally, as elderly with
ASD experienced more cognitive challenges in everyday life than typical older individuals (van
Heijst & Geurts, 2014), we explored whether subjective cognitive failures are related to objective
test performance.
We expected decreased performance in the ASD group compared to age-, gender-, and
IQ-matched controls on phonemic (e.g., Bramham et al., 2009; Geurts & Vissers, 2012; Rumsey
& Hamburger, 1988) and semantic (Spek, Schatorjé, Scholte, & van Berckelaer-Onnes, 2009)
fluency, and advanced ToM (Chung et al., 2014), but not on visual and verbal memory (Boucher
et al., 2012; Geurts & Vissers, 2012). We hypothesized age-related effects in ASD to be (a)
increased on visual memory, (b) parallel on verbal memory, (c) reduced on phonemic and
semantic fluency, and (d) reduced on ToM, given that ToM abilities decline in typical aging (e.g.,
Duval et al., 2011) and social abilities seem to improve with age in adults with ASD (Bastiaansen
et al., 2011).
METHODS
Participants
Individuals with ASD between 20 and 79 years were recruited through several mental health
institutions across the Netherlands, and by means of advertisements on client organization
websites. We applied the following exclusion criteria: (a) no prior clinical ASD diagnosis
according to DSM-IV (American Psychiatric Association, 2000) criteria; (b) history of
neurological disorders (e.g., epilepsy, stroke, cerebral contusion) or schizophrenia, or having
experienced more than one psychosis; (c) Autism Diagnostic Observation Schedule < 7 (ADOS)
(Lord et al., 2000) and Autism-spectrum Quotient < 26 (AQ) (Baron-Cohen et al., 2001); (d) IQ
< 80 or Mini Mental State Examination < 26 (MMSE) (Folstein et al., 1975); (e) current alcohol
or drugs dependency. Based on these criteria, we excluded 50 of the initial 168 individuals with
ASD (see Figure 4.1) and included the remaining 118 participants.
Individuals without ASD (i.e., comparison group [COM]) were recruited by means of
advertisements on the university website and on social media, and within the researchers’ social
environment. The following exclusion criteria were applied: (a) clinical diagnosis of ASD or
Attention Deficit Hyperactivity disorder (ADHD); (b) history of neurological disorders or
schizophrenia, or having ever experienced a psychosis; (c) ASD or schizophrenia in close family
members (i.e., parents, children, brothers, and sisters); (d) AQ > 32; (e) IQ < 80 or MMSE <
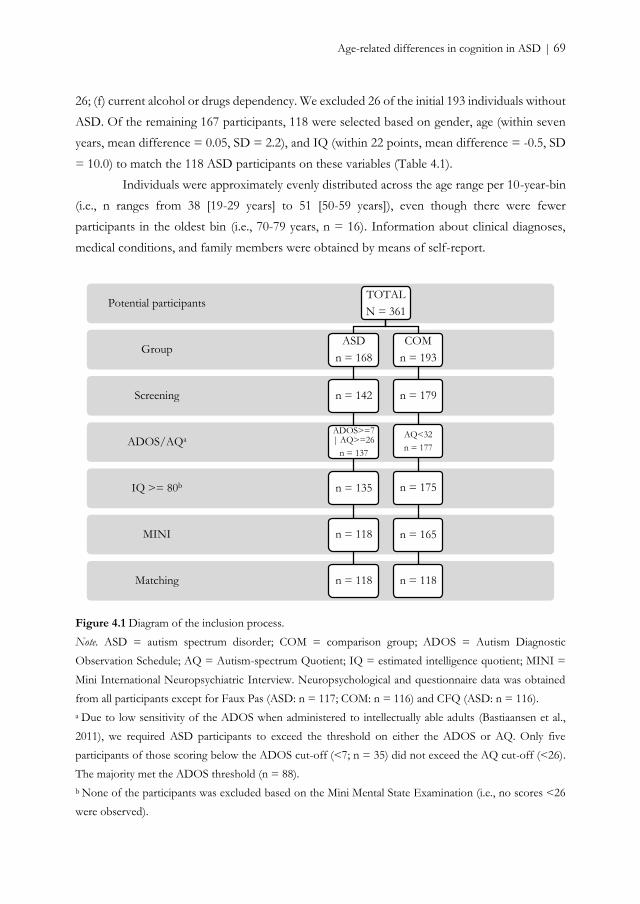
Age-related differences in cognition in ASD | 69
26; (f) current alcohol or drugs dependency. We excluded 26 of the initial 193 individuals without
ASD. Of the remaining 167 participants, 118 were selected based on gender, age (within seven
years, mean difference = 0.05, SD = 2.2), and IQ (within 22 points, mean difference = -0.5, SD
= 10.0) to match the 118 ASD participants on these variables (Table 4.1).
Individuals were approximately evenly distributed across the age range per 10-year-bin
(i.e., n ranges from 38 [19-29 years] to 51 [50-59 years]), even though there were fewer
participants in the oldest bin (i.e., 70-79 years, n = 16). Information about clinical diagnoses,
medical conditions, and family members were obtained by means of self-report.
Figure 4.1 Diagram of the inclusion process.
Note. ASD = autism spectrum disorder; COM = comparison group; ADOS = Autism Diagnostic
Observation Schedule; AQ = Autism-spectrum Quotient; IQ = estimated intelligence quotient; MINI =
Mini International Neuropsychiatric Interview. Neuropsychological and questionnaire data was obtained
from all participants except for Faux Pas (ASD: n = 117; COM: n = 116) and CFQ (ASD: n = 116).
a Due to low sensitivity of the ADOS when administered to intellectually able adults (Bastiaansen et al.,
2011), we required ASD participants to exceed the threshold on either the ADOS or AQ. Only five
participants of those scoring below the ADOS cut-off (<7; n = 35) did not exceed the AQ cut-off (<26).
The majority met the ADOS threshold (n = 88).
b None of the participants was excluded based on the Mini Mental State Examination (i.e., no scores <26
were observed).
Matching
MINI
IQ >= 80b
ADOS/AQa
Screening
Group
Potential participantsTOTAL
N = 361
ASD
n = 168
n = 142
ADOS>=7 | AQ>=26
n = 137
n = 135
n = 118
n = 118
COM
n = 193
n = 179
AQ<32
n = 177
n = 175
n = 165
n = 118
70 | Chapter 4
Materials
ASD assessment
The ADOS module 4 (de Bildt & de Jonge, 2008; Lord et al., 2000) is the most commonly used,
instrument to assess the current presence of ASD symptoms within the domains of
communication, reciprocal social interaction, imagination, and restricted and repetitive behavior,
during a standardized, semi-structured observation. Exceeding a specific cut-off (i.e., 7) on the
combined communication/social interaction domain, is indicative of an ASD (Bastiaansen et al.,
2011). The AQ (Baron-Cohen et al., 2001; Hoekstra et al., 2008) is a valid and reliable self-
reported questionnaire for the assessment of autistic traits consisting of 50 items. We employed
a threshold of 26 for the ASD group and a threshold of 32 for the COM group, as suggested
for, respectively a referred clinical sample and the general population (Baron-Cohen et al., 2001;
Woodbury-Smith et al., 2005). Due to low sensitivity of the ADOS when administered to
intellectually able adults (Bastiaansen et al., 2011), we required ASD participants to exceed the
threshold on either the ADOS or AQ, but the majority did meet the ADOS criterion (n = 88;
74.6%).
Screening instruments
We administered the Vocabulary and Matrix Reasoning subtests of the Wechsler Adult
Intelligence Scale third edition (WAIS-III) (Uterwijk, 2000; Wechsler, 1997a) to estimate IQ; the
MMSE (Folstein et al., 1975; Kok & Verhey, 2002; Molloy, Alemayehu, & Roberts, 1991) to
screen individuals for pathological cognitive impairment; the Mini International
Neuropsychiatric Interview Plus (MINI-Plus) (Sheehan et al., 1998; van Vliet et al., 2000) to
assess the presence or absence of alcohol dependence, substance dependence, and psychoses.
Neuropsychological tests
Visual memory. Visual Reproduction is a valid and reliable subtest of the Wechsler Memory Scale
third edition (WMS-III) (Wechsler, 1997b), used to assess visual memory. In five consecutive
trials, participants had 10 seconds to memorize a geometrical figure and reproduce it immediately
thereafter and after a 30-minute delay period. Moreover, participants had to recognize the
originally learned figures among 48 geometrical figures. Dependent variables are the sum of
correctly recalled elements during immediate and delayed recall, and the sum of correctly
recognized learned and rejected new figures (i.e., recognition).
Verbal memory. The Rey Auditory Verbal Learning Task (RAVLT) (Rey, 1964; van den Burg,
Saan, & Deelman, 1985) is a commonly used, valid, and reliable instrument (Saan & Deelman,
1986) to assess verbal memory. Participants learned and recalled a list of 15 unrelated words in
five consecutive trials and, after a 20-minute interval, recalled the list again and recognized the
words among a list of 15 old and 15 new words. Dependent variables are the sum of correctly
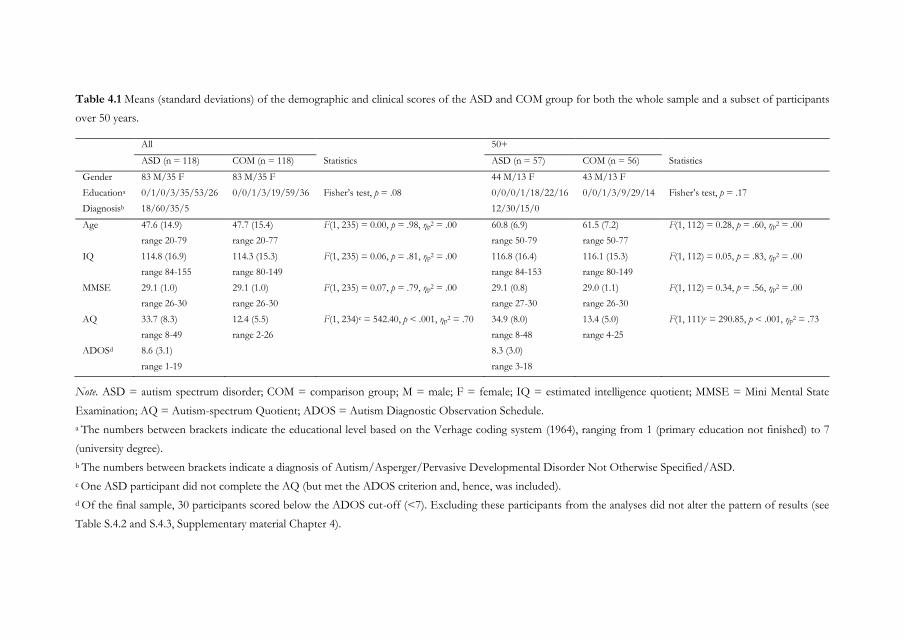
Table 4.1 Means (standard deviations) of the demographic and clinical scores of the ASD and COM group for both the whole sample and a subset of participants
over 50 years.
All 50+
ASD (n = 118) COM (n = 118) Statistics ASD (n = 57) COM (n = 56) Statistics
Gender 83 M/35 F 83 M/35 F 44 M/13 F 43 M/13 F
Educationa 0/1/0/3/35/53/26 0/0/1/3/19/59/36 Fisher’s test, p = .08 0/0/0/1/18/22/16 0/0/1/3/9/29/14 Fisher’s test, p = .17
Diagnosisb 18/60/35/5 12/30/15/0
Age 47.6 (14.9)
range 20-79
47.7 (15.4)
range 20-77
F(1, 235) = 0.00, p = .98, ηp2 = .00 60.8 (6.9)
range 50-79
61.5 (7.2)
range 50-77
F(1, 112) = 0.28, p = .60, ηp2 = .00
IQ 114.8 (16.9)
range 84-155
114.3 (15.3)
range 80-149
F(1, 235) = 0.06, p = .81, ηp2 = .00 116.8 (16.4)
range 84-153
116.1 (15.3)
range 80-149
F(1, 112) = 0.05, p = .83, ηp2 = .00
MMSE 29.1 (1.0)
range 26-30
29.1 (1.0)
range 26-30
F(1, 235) = 0.07, p = .79, ηp2 = .00 29.1 (0.8)
range 27-30
29.0 (1.1)
range 26-30
F(1, 112) = 0.34, p = .56, ηp2 = .00
AQ 33.7 (8.3)
range 8-49
12.4 (5.5)
range 2-26
F(1, 234)c = 542.40, p < .001, ηp2 = .70 34.9 (8.0)
range 8-48
13.4 (5.0)
range 4-25
F(1, 111)c = 290.85, p < .001, ηp2 = .73
ADOSd 8.6 (3.1)
range 1-19
8.3 (3.0)
range 3-18
Note. ASD = autism spectrum disorder; COM = comparison group; M = male; F = female; IQ = estimated intelligence quotient; MMSE = Mini Mental State
Examination; AQ = Autism-spectrum Quotient; ADOS = Autism Diagnostic Observation Schedule.
a The numbers between brackets indicate the educational level based on the Verhage coding system (1964), ranging from 1 (primary education not finished) to 7
(university degree).
b The numbers between brackets indicate a diagnosis of Autism/Asperger/Pervasive Developmental Disorder Not Otherwise Specified/ASD.
c One ASD participant did not complete the AQ (but met the ADOS criterion and, hence, was included).
d Of the final sample, 30 participants scored below the ADOS cut-off (<7). Excluding these participants from the analyses did not alter the pattern of results (see
Table S.4.2 and S.4.3, Supplementary material Chapter 4).
72 | Chapter 4
recalled words during the five learning trials (i.e., immediate recall) and after 20 minutes (i.e.,
delayed recall), and sum of correctly recognized old and rejected new words (i.e., recognition).
Generativity and semantic memory. In verbal fluency measures phonological and/or semantic cues
are given to recall information from semantic memory (Goh et al., 2012). Therefore, fluency
measures are often used to assess both generativity (as EF measure) and semantic memory
(Schmand, Groenink, & Van den Dungen, 2008). Phonemic fluency was evaluated with the
Controlled Oral Word Association Test (COWAT) (Benton & Hamsher, 1989; Schmand et al.,
2008), which has good internal consistency (Schmand et al., 2008). Participants named as many
words as possible starting with a provided letter in three trials of one minute each (D,A,T), but
were not allowed to name proper nouns, numbers, and serial words starting with the same prefix.
Semantic fluency was assessed with the Word Naming subtest of the Groninger Intelligence Test
(GIT) (Luteijn & Barelds, 2004), which has good reliability and sufficient internal consistency
(Mulder, Dekker, & Dekker, 2006). Participants named as many words as possible belonging to
a specific category in two trials of one minute each (animals, professions). Dependent variables
are the total number of correctly named words.
ToM. An abbreviated version of the Faux Pas test (Spek, Scholte, & Van Berckelaer-Onnes,
2010; Stone, Baron-Cohen, & Knight, 1998) was used to assess advanced ToM. Five stories
containing a faux pas, which is a socially unintended inappropriate response (Baron-Cohen,
O'Riordan, Stone, Jones, & Plaisted, 1999), and four stories without faux pas were read with the
participants and questions about the faux pas were asked, together with two control questions
to assure the stories were properly understood. Dependent variable is the sum of correctly
answered questions on all stories minus the control questions.
Data collected through WMS-III and Faux Pas were coded by two raters (see
Supplementary material Chapter 4).
Self-report cognitive failures
The Cognitive Failures Questionnaire (CFQ) (D. E. Broadbent, Cooper, FitzGerald, & Parkes,
1982; Merckelbach, Muris, Nijman, & de Jong, 1996) is a valid and reliable (Vom Hofe,
Mainemarre, & Vannier, 1998) 25-item self-report questionnaire used to assess the experience
of memory errors, committing blunders, and distractibility in everyday situations. CFQ total
score is the dependent variable.
Procedure
Participants were informed about the study purposes and procedure and written informed
consent was obtained. They filled out the AQ and CFQ and were tested in two sessions, in which
(a) ASD assessment and screening took place; (b) neuropsychological tests were administered in
Age-related differences in cognition in ASD | 73
counterbalanced order (additional experimental tests and questionnaires were administered, but
will be discussed elsewhere). Participants received compensation for their travel expenses; most
COM participants also received additional compensation (max. €20). Data was collected between
March 2012 and July 2014. The study was approved by the institutional review board of the
University of Amsterdam (2011-PN-1952).
Statistical analyses
First, to compare the two groups on several cognitive domains, we ran three MANOVAs for
visual memory, verbal memory, and generativity and semantic memory, and two ANOVAs for
ToM and CFQ, each with Group (ASD, COM) as between-subject factor. Second, to investigate
the effect of age, we ran linear multiple regression analyses for each domain with (centered) Age,
Group, and Age×Group as predictors. If there was an Age×Group interaction, we ran follow-
up regression analyses for each group separately. Third, to determine whether our results are
comparable to Geurts and Vissers (2012), we reran the above mentioned analyses on a subgroup
of participants, including individuals of 50 years or older. Fourth, to explore whether cognitive
performance was associated with self-reported cognitive failures, we ran, per group, Spearman
correlations between CFQ and each dependent measure.
As normality assumptions were violated for almost all dependent variables and
transformation did not normalize the data, data were analyzed with both parametric and
nonparametric tests. As both analyses yielded analogous results, we only report parametric tests.
Unless removing outliers (i.e., data points more than three SD from each group mean) changed
the pattern of results, analyses are reported including outliers. To reduce the probability of Type
I errors, alpha was set at 0.01 for the group comparisons and regression analyses. An alpha level
of 0.05 was employed for the exploratory analyses.
RESULTS
Group comparisons
The ASD group reported many more cognitive failures on the CFQ than the COM group, but
group differences were absent on most neuropsychological tests (Table 4.2). However, groups
differed significantly on ToM, and, after removing outliersiv, on visual memory immediate recall,
and generativity. These findings are discussed below.
iv There were 5 outliers on the visual memory test (3 ASD, 2 COM), 5 on verbal memory (3 ASD, 2 COM), 2 on phonemic and semantic fluency (ASD), 2 on ToM (COM).
74 | Chapter 4
Visual memory
ASD participants yielded higher scores on immediate recall of the WMS-III Visual Reproduction
subtest than COM participants, suggesting that visual memory is a cognitive strength of adults
with ASD.
Generativity and semantic memory
COM participants named more correct words starting with a given letter (phonemic fluency) and
words belonging to a given category (semantic fluency) than ASD participants, indicating
difficulties for adults with ASD in this domain.
ToM
COM participants had better Faux Pas performance than ASD participants. Hence, adults with
ASD showed ToM problems.
Age-related differences
Age had a significant effect on all domains, except generativity. As most regression analyses did
not reveal any Age×Group interaction (Table 4.3), age seemed to have a similar effect in the
ASD and COM group. Yet, we observed an interaction for visual memory recognition and a
borderline significant interaction for visual memory immediate recall. These findings are
discussed below.
Visual memory
While age did not explain a relevant proportion of variance in the ASD group, F(1, 116) = 2.58,
p = .11, R2 = .02, it did in the COM group, F(1, 116) = 39.76, p < .001, R2 = .26. Inspection of
the beta coefficients revealed a steeper decrease in performance in the COM group (β = -.51)
compared to the ASD group (β = -.15). These results indicate that recognition in adults with
ASD did not significantly differ over age, whereas performance of adults without ASD
deteriorated with increasing age. Similar results were found for immediate recall. Age explained
a small amount of variance in the ASD group, F(1, 116) = 3.90, p = .05, R2 = .03, but a
considerable amount in the COM group, F(1, 116) = 36.19, p < .001, R2 = .24. Again, inspection
of the beta coefficients revealed a steeper decrease in performance in the COM group (β = -.49)
compared to the ASD group (β = -.18).
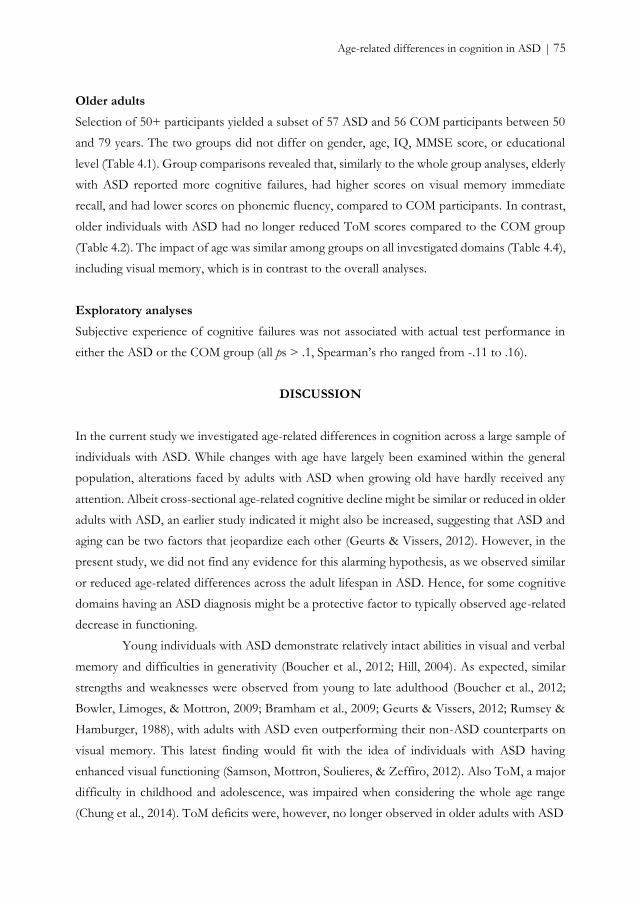
Age-related differences in cognition in ASD | 75
Older adults
Selection of 50+ participants yielded a subset of 57 ASD and 56 COM participants between 50
and 79 years. The two groups did not differ on gender, age, IQ, MMSE score, or educational
level (Table 4.1). Group comparisons revealed that, similarly to the whole group analyses, elderly
with ASD reported more cognitive failures, had higher scores on visual memory immediate
recall, and had lower scores on phonemic fluency, compared to COM participants. In contrast,
older individuals with ASD had no longer reduced ToM scores compared to the COM group
(Table 4.2). The impact of age was similar among groups on all investigated domains (Table 4.4),
including visual memory, which is in contrast to the overall analyses.
Exploratory analyses
Subjective experience of cognitive failures was not associated with actual test performance in
either the ASD or the COM group (all ps > .1, Spearman’s rho ranged from -.11 to .16).
DISCUSSION
In the current study we investigated age-related differences in cognition across a large sample of
individuals with ASD. While changes with age have largely been examined within the general
population, alterations faced by adults with ASD when growing old have hardly received any
attention. Albeit cross-sectional age-related cognitive decline might be similar or reduced in older
adults with ASD, an earlier study indicated it might also be increased, suggesting that ASD and
aging can be two factors that jeopardize each other (Geurts & Vissers, 2012). However, in the
present study, we did not find any evidence for this alarming hypothesis, as we observed similar
or reduced age-related differences across the adult lifespan in ASD. Hence, for some cognitive
domains having an ASD diagnosis might be a protective factor to typically observed age-related
decrease in functioning.
Young individuals with ASD demonstrate relatively intact abilities in visual and verbal
memory and difficulties in generativity (Boucher et al., 2012; Hill, 2004). As expected, similar
strengths and weaknesses were observed from young to late adulthood (Boucher et al., 2012;
Bowler, Limoges, & Mottron, 2009; Bramham et al., 2009; Geurts & Vissers, 2012; Rumsey &
Hamburger, 1988), with adults with ASD even outperforming their non-ASD counterparts on
visual memory. This latest finding would fit with the idea of individuals with ASD having
enhanced visual functioning (Samson, Mottron, Soulieres, & Zeffiro, 2012). Also ToM, a major
difficulty in childhood and adolescence, was impaired when considering the whole age range
(Chung et al., 2014). ToM deficits were, however, no longer observed in older adults with ASD
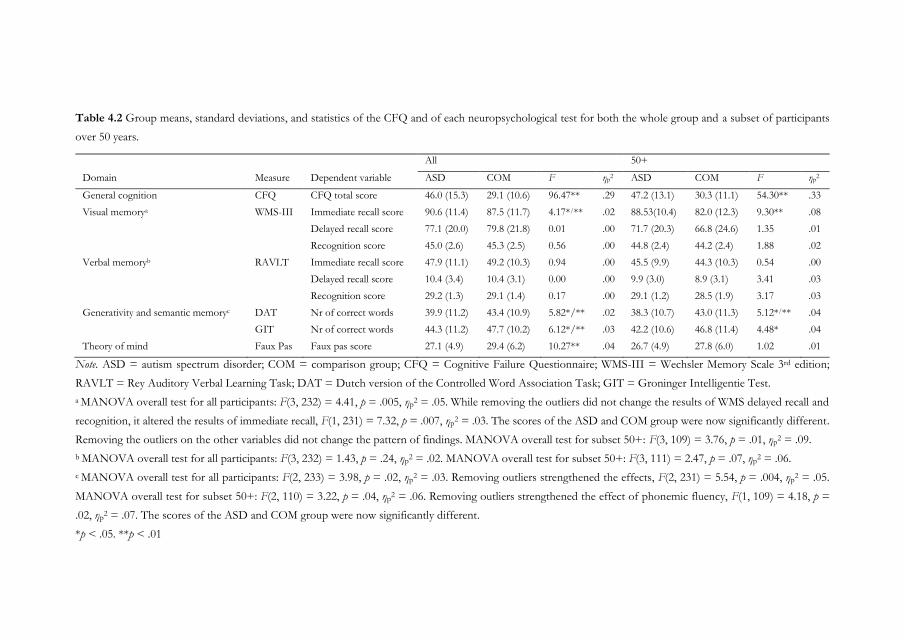
Table 4.2 Group means, standard deviations, and statistics of the CFQ and of each neuropsychological test for both the whole group and a subset of participants
over 50 years.
Note. ASD = autism spectrum disorder; COM = comparison group; CFQ = Cognitive Failure Questionnaire; WMS-III = Wechsler Memory Scale 3rd edition;
RAVLT = Rey Auditory Verbal Learning Task; DAT = Dutch version of the Controlled Word Association Task; GIT = Groninger Intelligentie Test.
a MANOVA overall test for all participants: F(3, 232) = 4.41, p = .005, ηp2 = .05. While removing the outliers did not change the results of WMS delayed recall and
recognition, it altered the results of immediate recall, F(1, 231) = 7.32, p = .007, ηp2 = .03. The scores of the ASD and COM group were now significantly different.
Removing the outliers on the other variables did not change the pattern of findings. MANOVA overall test for subset 50+: F(3, 109) = 3.76, p = .01, ηp2 = .09.
b MANOVA overall test for all participants: F(3, 232) = 1.43, p = .24, ηp2 = .02. MANOVA overall test for subset 50+: F(3, 111) = 2.47, p = .07, ηp
2 = .06.
c MANOVA overall test for all participants: F(2, 233) = 3.98, p = .02, ηp2 = .03. Removing outliers strengthened the effects, F(2, 231) = 5.54, p = .004, ηp
2 = .05.
MANOVA overall test for subset 50+: F(2, 110) = 3.22, p = .04, ηp2 = .06. Removing outliers strengthened the effect of phonemic fluency, F(1, 109) = 4.18, p =
.02, ηp2 = .07. The scores of the ASD and COM group were now significantly different.
*p < .05. **p < .01
All 50+
Domain Measure Dependent variable ASD COM F ηp2 ASD COM F ηp
2
General cognition CFQ CFQ total score 46.0 (15.3) 29.1 (10.6) 96.47** .29 47.2 (13.1) 30.3 (11.1) 54.30** .33
Visual memorya WMS-III Immediate recall score 90.6 (11.4) 87.5 (11.7) 4.17*/** .02 88.53(10.4) 82.0 (12.3) 9.30** .08
Delayed recall score 77.1 (20.0) 79.8 (21.8) 0.01 .00 71.7 (20.3) 66.8 (24.6) 1.35 .01
Recognition score 45.0 (2.6) 45.3 (2.5) 0.56 .00 44.8 (2.4) 44.2 (2.4) 1.88 .02
Verbal memoryb RAVLT Immediate recall score 47.9 (11.1) 49.2 (10.3) 0.94 .00 45.5 (9.9) 44.3 (10.3) 0.54 .00
Delayed recall score 10.4 (3.4) 10.4 (3.1) 0.00 .00 9.9 (3.0) 8.9 (3.1) 3.41 .03
Recognition score 29.2 (1.3) 29.1 (1.4) 0.17 .00 29.1 (1.2) 28.5 (1.9) 3.17 .03
Generativity and semantic memoryc DAT Nr of correct words 39.9 (11.2) 43.4 (10.9) 5.82*/** .02 38.3 (10.7) 43.0 (11.3) 5.12*/** .04
GIT Nr of correct words 44.3 (11.2) 47.7 (10.2) 6.12*/** .03 42.2 (10.6) 46.8 (11.4) 4.48* .04
Theory of mind Faux Pas Faux pas score 27.1 (4.9) 29.4 (6.2) 10.27** .04 26.7 (4.9) 27.8 (6.0) 1.02 .01
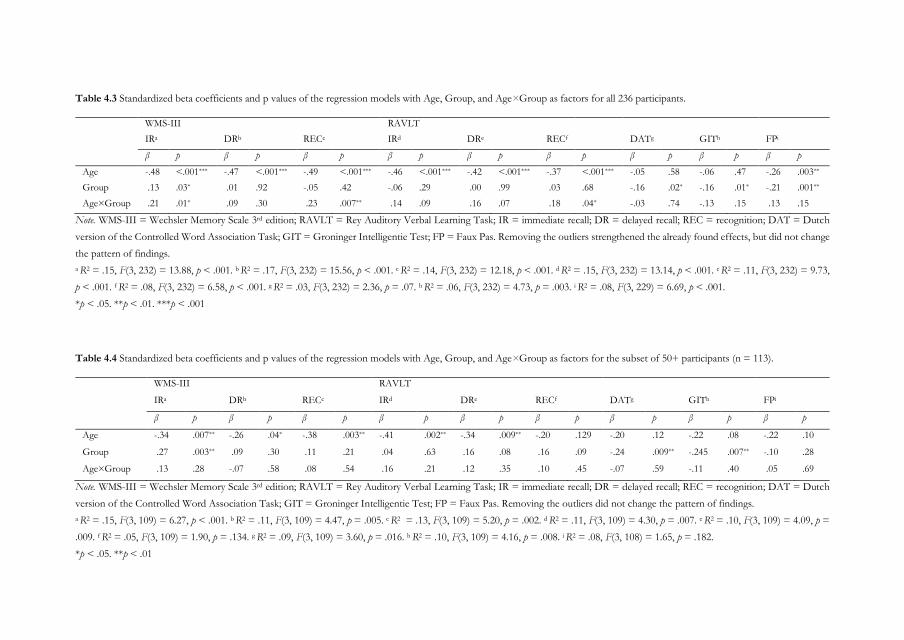
Table 4.3 Standardized beta coefficients and p values of the regression models with Age, Group, and Age×Group as factors for all 236 participants.
WMS-III RAVLT
IRa DRb RECc IRd DRe RECf DATg GITh FPi
β p β p β p β p β p β p β p β p β p
Age -.48 <.001*** -.47 <.001*** -.49 <.001*** -.46 <.001*** -.42 <.001*** -.37 <.001*** -.05 .58 -.06 .47 -.26 .003**
Group .13 .03* .01 .92 -.05 .42 -.06 .29 .00 .99 .03 .68 -.16 .02* -.16 .01* -.21 .001**
Age×Group .21 .01* .09 .30 .23 .007** .14 .09 .16 .07 .18 .04* -.03 .74 -.13 .15 .13 .15
Note. WMS-III = Wechsler Memory Scale 3rd edition; RAVLT = Rey Auditory Verbal Learning Task; IR = immediate recall; DR = delayed recall; REC = recognition; DAT = Dutch
version of the Controlled Word Association Task; GIT = Groninger Intelligentie Test; FP = Faux Pas. Removing the outliers strengthened the already found effects, but did not change
the pattern of findings.
a R2 = .15, F(3, 232) = 13.88, p < .001. b R2 = .17, F(3, 232) = 15.56, p < .001. c R2 = .14, F(3, 232) = 12.18, p < .001. d R2 = .15, F(3, 232) = 13.14, p < .001. e R2 = .11, F(3, 232) = 9.73,
p < .001. f R2 = .08, F(3, 232) = 6.58, p < .001. g R2 = .03, F(3, 232) = 2.36, p = .07. h R2 = .06, F(3, 232) = 4.73, p = .003. i R2 = .08, F(3, 229) = 6.69, p < .001.
*p < .05. **p < .01. ***p < .001
Table 4.4 Standardized beta coefficients and p values of the regression models with Age, Group, and Age×Group as factors for the subset of 50+ participants (n = 113).
WMS-III RAVLT
IRa DRb RECc IRd DRe RECf DATg GITh FPi
β p β p β p β p β p β p β p β p β p
Age -.34 .007** -.26 .04* -.38 .003** -.41 .002** -.34 .009** -.20 .129 -.20 .12 -.22 .08 -.22 .10
Group .27 .003** .09 .30 .11 .21 .04 .63 .16 .08 .16 .09 -.24 .009** -.245 .007** -.10 .28
Age×Group .13 .28 -.07 .58 .08 .54 .16 .21 .12 .35 .10 .45 -.07 .59 -.11 .40 .05 .69
Note. WMS-III = Wechsler Memory Scale 3rd edition; RAVLT = Rey Auditory Verbal Learning Task; IR = immediate recall; DR = delayed recall; REC = recognition; DAT = Dutch
version of the Controlled Word Association Task; GIT = Groninger Intelligentie Test; FP = Faux Pas. Removing the outliers did not change the pattern of findings.
a R2 = .15, F(3, 109) = 6.27, p < .001. b R2 = .11, F(3, 109) = 4.47, p = .005. c R2 = .13, F(3, 109) = 5.20, p = .002. d R2 = .11, F(3, 109) = 4.30, p = .007. e R2 = .10, F(3, 109) = 4.09, p =
.009. f R2 = .05, F(3, 109) = 1.90, p = .134. g R2 = .09, F(3, 109) = 3.60, p = .016. h R2 = .10, F(3, 109) = 4.16, p = .008. i R2 = .08, F(3, 108) = 1.65, p = .182.
*p < .05. **p < .01
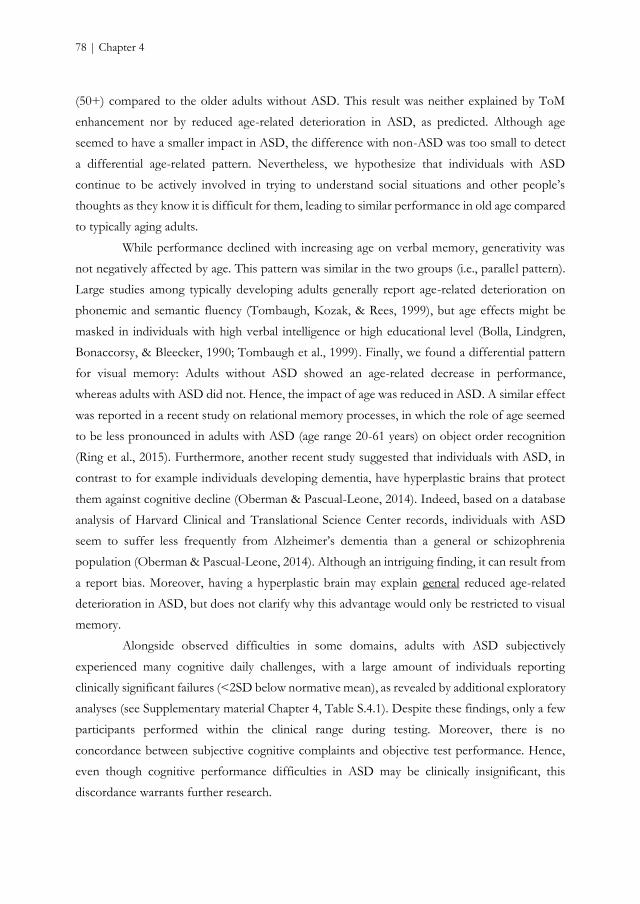
78 | Chapter 4
(50+) compared to the older adults without ASD. This result was neither explained by ToM
enhancement nor by reduced age-related deterioration in ASD, as predicted. Although age
seemed to have a smaller impact in ASD, the difference with non-ASD was too small to detect
a differential age-related pattern. Nevertheless, we hypothesize that individuals with ASD
continue to be actively involved in trying to understand social situations and other people’s
thoughts as they know it is difficult for them, leading to similar performance in old age compared
to typically aging adults.
While performance declined with increasing age on verbal memory, generativity was
not negatively affected by age. This pattern was similar in the two groups (i.e., parallel pattern).
Large studies among typically developing adults generally report age-related deterioration on
phonemic and semantic fluency (Tombaugh, Kozak, & Rees, 1999), but age effects might be
masked in individuals with high verbal intelligence or high educational level (Bolla, Lindgren,
Bonaccorsy, & Bleecker, 1990; Tombaugh et al., 1999). Finally, we found a differential pattern
for visual memory: Adults without ASD showed an age-related decrease in performance,
whereas adults with ASD did not. Hence, the impact of age was reduced in ASD. A similar effect
was reported in a recent study on relational memory processes, in which the role of age seemed
to be less pronounced in adults with ASD (age range 20-61 years) on object order recognition
(Ring et al., 2015). Furthermore, another recent study suggested that individuals with ASD, in
contrast to for example individuals developing dementia, have hyperplastic brains that protect
them against cognitive decline (Oberman & Pascual-Leone, 2014). Indeed, based on a database
analysis of Harvard Clinical and Translational Science Center records, individuals with ASD
seem to suffer less frequently from Alzheimer’s dementia than a general or schizophrenia
population (Oberman & Pascual-Leone, 2014). Although an intriguing finding, it can result from
a report bias. Moreover, having a hyperplastic brain may explain general reduced age-related
deterioration in ASD, but does not clarify why this advantage would only be restricted to visual
memory.
Alongside observed difficulties in some domains, adults with ASD subjectively
experienced many cognitive daily challenges, with a large amount of individuals reporting
clinically significant failures (<2SD below normative mean), as revealed by additional exploratory
analyses (see Supplementary material Chapter 4, Table S.4.1). Despite these findings, only a few
participants performed within the clinical range during testing. Moreover, there is no
concordance between subjective cognitive complaints and objective test performance. Hence,
even though cognitive performance difficulties in ASD may be clinically insignificant, this
discordance warrants further research.
Age-related differences in cognition in ASD | 79
79
Some may argue that our study suffers from some limitations affecting the
interpretation of our findings. First, as the current study was cross-sectional in nature, rather
than longitudinal, we cannot yet draw conclusions on how changes in cognition actually develop
over time among individuals with ASD. Therefore, conclusions about cross-sectional age-related
decline should be interpreted with caution. Second, it can be argued that our sample was
intellectually high-functioning with relatively mild ASD characteristics. Most participants were
diagnosed in adulthood, which has been associated with relatively mild symptomatology and
sufficient cognitive abilities to compensate for ASD-related difficulties (Heijnen-Kohl & van
Alphen, 2009). Nevertheless, all ASD participants already had a formal, clinical diagnosis and
before an ASD diagnosis is given, individuals go through thorough assessment by a
multidisciplinary team during which developmental history is commonly assessed. Moreover, the
majority of participants met ADOS criteria for ASD. Exploratory analyses on only those
individuals who exceeded the ADOS threshold, yielded similar results and did not alter the
interpretation of our major findings (see Table S.4.2 and S.4.3, Supplementary material Chapter
4). The inclusion of intellectually normal-to-high-functioning individuals was of importance to
test whether age-related patterns were comparable to typical developing adults. However, many
individuals with ASD have an intellectual disability (Matson & Shoemaker, 2009) and our results
may not apply to them. Third, the majority of our ASD participants suffered from a comorbid
psychiatric condition, such as depression or anxiety. Although inclusion of those individuals
increases the representativeness of the sample, it also may have influenced our findings. Yet,
recently, it was shown that comorbidity was not correlated with neuropsychological performance
in ASD males (Wilson et al., 2014). Fourth, although we included a large age range, some age-
related differences or changes become apparent only in very old age. As a result, further research
including even older individuals may provide more knowledge on the effect of age in ASD. Fifth,
we did not replicate some findings of our earlier study (Geurts & Vissers, 2012). Nevertheless,
post-hoc correction for multiple comparisons of the results previously obtained with exploratory
regression analyses did reveal similar age-related patterns as found in the current 50+ group.
This discrepancy underlines the importance of confirmatory replication studies.
Conclusions
Age-related deterioration in cognitive functioning is characteristic of typical aging. In the current
cross-sectional study, we demonstrated that this pattern is parallel or less pronounced in
individuals with ASD. We did not find evidence for the hypothesis that age-related differences
in cognition are increased in ASD. Cognitive strengths and weaknesses occurring in adulthood
are still present in old age, although ToM impairments seem to be less apparent in late adulthood.
80 | Chapter 4
Taken together, the findings of this cross-sectional study suggest that ASD may indeed be a
safeguard for age-related cognitive decline, but also reveal the crucial role of replication studies.
Moreover, the subjectively experienced daily challenges and poor quality of life of older adults
with ASD (van Heijst & Geurts, 2014) highlight the importance of research into older adulthood
in ASD and the need for more knowledge in order to provide better social and environmental
support to improve the life of individuals with ASD across the lifespan. The investigation of
cognitive aging in ASD is a completely new and exciting area of research and our study represents
a logical initial step providing unique insights into this direction. However, as longitudinal and
cross-sectional studies do not always reveal the same age-related patterns (Nyberg et al., 2012),
follow-up studies are needed to determine the applicability of these findings on the long term.
Age-related differences in cognition in ASD | 81
SUPPLEMENTARY MATERIAL CHAPTER 4
Inter-rater concordance
Figures reproduced by 62 participants (26.3%; 31 ASD, 31 COM) during the Visual
Reproduction subtest of the WMS-III (Wechsler, 1997b) were scored by a second rater.
Discrepancies were resolved through discussion between raters. Mean concordance rates were
93.2% and 92.3% for immediate and delayed recall respectively.
Responses of all 236 participants (118 ASD, 118 COM) given on the Faux Pas test
(Stone et al., 1998) were coded by two raters. Discrepancies were again resolved through
discussion. Overall concordance rate was 97.5%.
Inter-individual differences
As large inter-individual differences in cognitive challenges among individuals with ASD are
observed (Gonzalez-Gadea et al., 2013; Towgood et al., 2009), we not only compared groups,
but also evaluated the performance of each participant against a normative sample to determine
the clinical relevance of potential problems.
For this purpose, raw scores of the dependent variables of visual memory, verbal
memory, generativity and semantic memory, theory of mind, and Cognitive Failures
Questionnaire (CFQ) (D. E. Broadbent et al., 1982), were converted to z-scores (ie, mean of 0
and standard deviation of 1) based on performance of the COM group. The performance of
each participant was compared with this normative sample (Table C.1). A standard deviation of
2 was used to determine whether individuals performed at a sub-normal (<2SD) or supra-normal
level (>2SD).
The groups did not differ in the amount of participants scoring below or above 2SD
from the mean in none of the comparisons (all ps>.06, Fisher’s Exact Test, two-tailed), except
for CFQ (p<.001), with 40.7% of the ASD group scoring above the 98th percentile. In the ASD
group, 12 participants were impaired (<2SD) on one domain, six on two domains, two on three
domains, and three on four domains. In the COM group, 13 participants were impaired (<2SD)
on one domain, four on two domains, two on three domains, and one on four domains. In the
ASD group, three participants supra-normally performed (>2SD) on one domain, and one
participant on two domains. In the COM group, seven participants supra-normally performed
(>2SD) on one domain. The number of participants showing sub-normal or supra-normal
performance on one or more domains did not differ between groups (Fisher’s Exact Test, two-
tailed: p=.94 and p=.36, respectively).
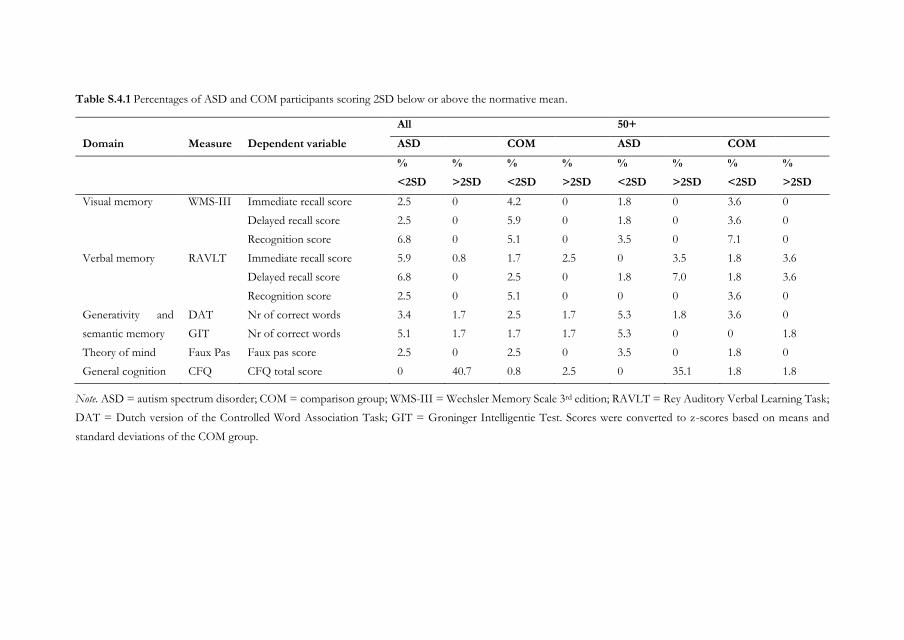
Table S.4.1 Percentages of ASD and COM participants scoring 2SD below or above the normative mean.
Note. ASD = autism spectrum disorder; COM = comparison group; WMS-III = Wechsler Memory Scale 3rd edition; RAVLT = Rey Auditory Verbal Learning Task;
DAT = Dutch version of the Controlled Word Association Task; GIT = Groninger Intelligentie Test. Scores were converted to z-scores based on means and
standard deviations of the COM group.
All 50+
Domain Measure Dependent variable ASD COM ASD COM
%
<2SD
%
>2SD
%
<2SD
%
>2SD
%
<2SD
%
>2SD
%
<2SD
%
>2SD
Visual memory WMS-III Immediate recall score 2.5 0 4.2 0 1.8 0 3.6 0
Delayed recall score 2.5 0 5.9 0 1.8 0 3.6 0
Recognition score 6.8 0 5.1 0 3.5 0 7.1 0
Verbal memory RAVLT Immediate recall score 5.9 0.8 1.7 2.5 0 3.5 1.8 3.6
Delayed recall score 6.8 0 2.5 0 1.8 7.0 1.8 3.6
Recognition score 2.5 0 5.1 0 0 0 3.6 0
Generativity and
semantic memory
DAT Nr of correct words 3.4 1.7 2.5 1.7 5.3 1.8 3.6 0
GIT Nr of correct words 5.1 1.7 1.7 1.7 5.3 0 0 1.8
Theory of mind Faux Pas Faux pas score 2.5 0 2.5 0 3.5 0 1.8 0
General cognition CFQ CFQ total score 0 40.7 0.8 2.5 0 35.1 1.8 1.8
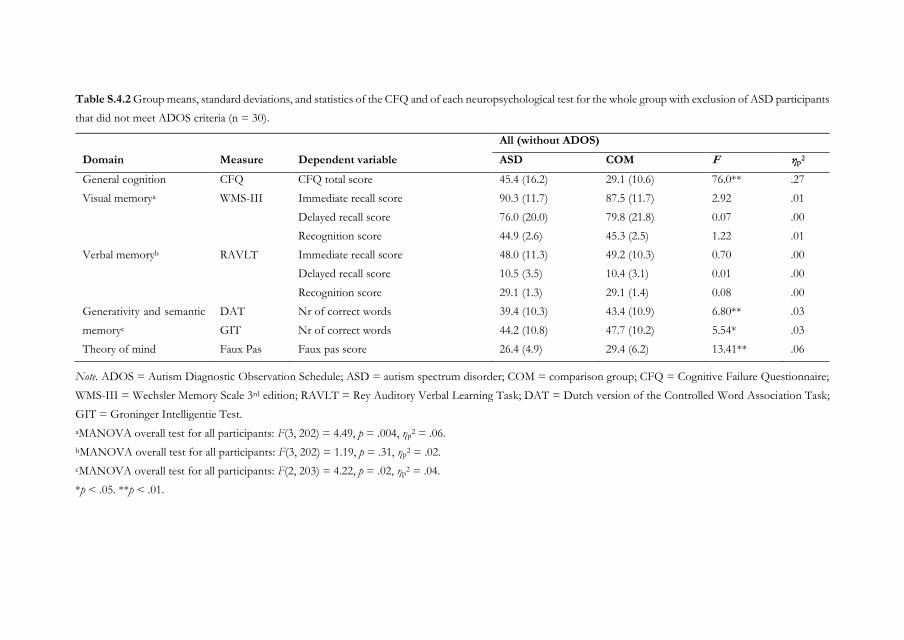
Table S.4.2 Group means, standard deviations, and statistics of the CFQ and of each neuropsychological test for the whole group with exclusion of ASD participants
that did not meet ADOS criteria (n = 30).
Note. ADOS = Autism Diagnostic Observation Schedule; ASD = autism spectrum disorder; COM = comparison group; CFQ = Cognitive Failure Questionnaire;
WMS-III = Wechsler Memory Scale 3rd edition; RAVLT = Rey Auditory Verbal Learning Task; DAT = Dutch version of the Controlled Word Association Task;
GIT = Groninger Intelligentie Test.
aMANOVA overall test for all participants: F(3, 202) = 4.49, p = .004, ηp2 = .06.
bMANOVA overall test for all participants: F(3, 202) = 1.19, p = .31, ηp2 = .02.
cMANOVA overall test for all participants: F(2, 203) = 4.22, p = .02, ηp2 = .04.
*p < .05. **p < .01.
All (without ADOS)
Domain Measure Dependent variable ASD COM F ηp2
General cognition CFQ CFQ total score 45.4 (16.2) 29.1 (10.6) 76.0** .27
Visual memorya WMS-III Immediate recall score 90.3 (11.7) 87.5 (11.7) 2.92 .01
Delayed recall score 76.0 (20.0) 79.8 (21.8) 0.07 .00
Recognition score 44.9 (2.6) 45.3 (2.5) 1.22 .01
Verbal memoryb RAVLT Immediate recall score 48.0 (11.3) 49.2 (10.3) 0.70 .00
Delayed recall score 10.5 (3.5) 10.4 (3.1) 0.01 .00
Recognition score 29.1 (1.3) 29.1 (1.4) 0.08 .00
Generativity and semantic
memoryc
DAT Nr of correct words 39.4 (10.3) 43.4 (10.9) 6.80** .03
GIT Nr of correct words 44.2 (10.8) 47.7 (10.2) 5.54* .03
Theory of mind Faux Pas Faux pas score 26.4 (4.9) 29.4 (6.2) 13.41** .06
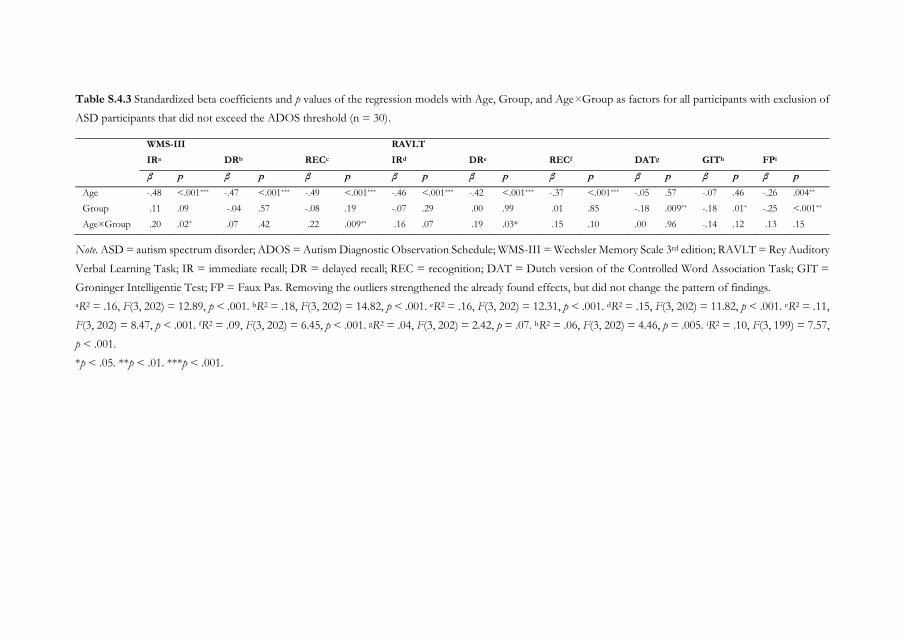
Table S.4.3 Standardized beta coefficients and p values of the regression models with Age, Group, and Age×Group as factors for all participants with exclusion of
ASD participants that did not exceed the ADOS threshold (n = 30).
WMS-III RAVLT
IRa DRb RECc IRd DRe RECf DATg GITh FPi
β p β p β p β p β p β p β p β p β p
Age -.48 <.001*** -.47 <.001*** -.49 <.001*** -.46 <.001*** -.42 <.001*** -.37 <.001*** -.05 .57 -.07 .46 -.26 .004**
Group .11 .09 -.04 .57 -.08 .19 -.07 .29 .00 .99 .01 .85 -.18 .009** -.18 .01* -.25 <.001**
Age×Group .20 .02* .07 .42 .22 .009** .16 .07 .19 .03* .15 .10 .00 .96 -.14 .12 .13 .15
Note. ASD = autism spectrum disorder; ADOS = Autism Diagnostic Observation Schedule; WMS-III = Wechsler Memory Scale 3rd edition; RAVLT = Rey Auditory
Verbal Learning Task; IR = immediate recall; DR = delayed recall; REC = recognition; DAT = Dutch version of the Controlled Word Association Task; GIT =
Groninger Intelligentie Test; FP = Faux Pas. Removing the outliers strengthened the already found effects, but did not change the pattern of findings.
aR2 = .16, F(3, 202) = 12.89, p < .001. bR2 = .18, F(3, 202) = 14.82, p < .001. cR2 = .16, F(3, 202) = 12.31, p < .001. dR2 = .15, F(3, 202) = 11.82, p < .001. eR2 = .11,
F(3, 202) = 8.47, p < .001. fR2 = .09, F(3, 202) = 6.45, p < .001. gR2 = .04, F(3, 202) = 2.42, p = .07. hR2 = .06, F(3, 202) = 4.46, p = .005. iR2 = .10, F(3, 199) = 7.57,
p < .001.
*p < .05. **p < .01. ***p < .001.
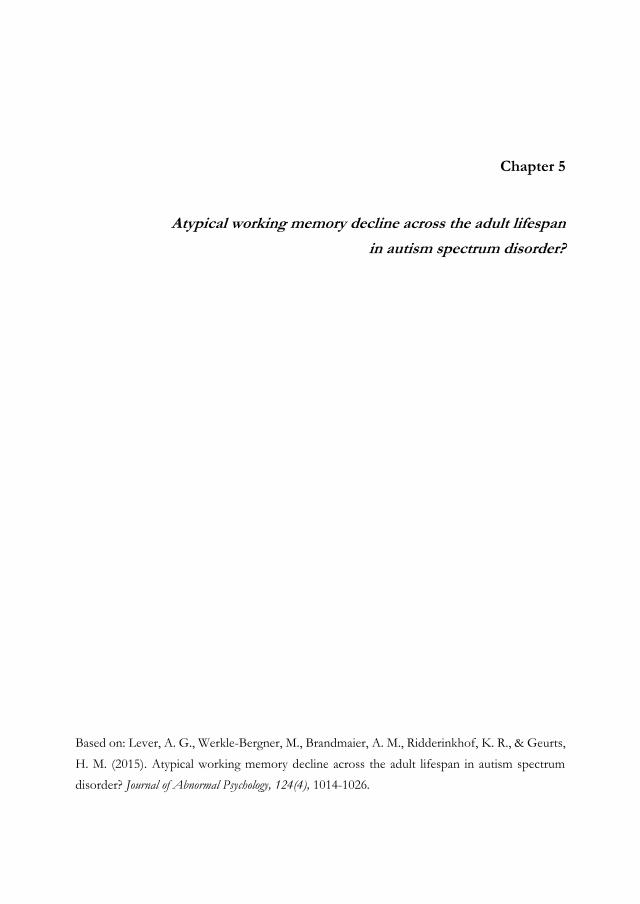
Chapter 5
Atypical working memory decline across the adult lifespan
in autism spectrum disorder?
Based on: Lever, A. G., Werkle-Bergner, M., Brandmaier, A. M., Ridderinkhof, K. R., & Geurts,
H. M. (2015). Atypical working memory decline across the adult lifespan in autism spectrum
disorder? Journal of Abnormal Psychology, 124(4), 1014-1026.
86 | Chapter 5
ABSTRACT
Whereas working memory (WM) performance in typical development increases across
childhood and adolescence, and decreases during adulthood, WM development seems to be
delayed in young individuals with autism spectrum disorder (ASD). How WM changes when
individuals with ASD grow old is largely unknown. We bridge this gap with a cross-sectional
study comparing age-related patterns in WM performance (n-back task: three load levels) among
a large sample of individuals with and without ASD (N = 275) over the entire adult lifespan (19–
79 years) as well as inter-individual differences therein. Results demonstrated that, despite longer
RTs, adults with ASD showed similar WM performance to adults without ASD. Age-related
differences appeared to be different among adults with and without ASD as adults without ASD
showed an age-related decline in WM performance, which was not so evident in adults with
ASD. Moreover, only IQ scores reliably dissociated inter-individual differences in age-gradients,
but no evidence was found for a role of basic demographics, comorbidities, and executive
functions. These findings provide initial insights into how ASD modulates cognitive aging, but
also underline the need for further WM research into late adulthood in ASD and for analyzing
individual change trajectories in longitudinal studies.
Keywords: autism spectrum disorder (ASD), working memory, aging, regression trees, executive
functions
Atypical WM decline in ASD? | 87
INTRODUCTION
Autism Spectrum Disorder (ASD) is a heterogeneous neurodevelopmental disorder
characterized by qualitative impairments in social interaction and communication, and restricted,
repetitive behavior (American Psychiatric Association, 2013), and is associated with impairments
in executive functions (EF) (Hill, 2004; Pennington & Ozonoff, 1996). EF is an umbrella term
referring to various cognitive functions involved in control and coordination that are necessary
for complex, goal-directed behavior. At the same time, EF deficits are observed during typical
aging (e.g., Friedman et al., 2009; Salthouse & Miles, 2002; Verhaeghen & Cerella, 2002). While
ASD is a lifelong condition, surprisingly little is known about alterations in cognitive functioning
in individuals with ASD when they grow old. Hence, the current study addresses the question
whether cross-sectional age-gradients in a core EF function, namely working memory (WM),
deviate in ASD clients in comparison to a typically developing control sample.
WM is the ability to maintain and manipulate information online in the absence of
actual sensory information in order to guide goal-directed behavior (e.g., Baddeley, 2003; Cowan,
2014). As such, it is important for daily life functioning. In typical development, WM
performance increases throughout childhood into adolescence (Conklin, Luciana, Hooper, &
Yarger, 2007; Gathercole, Pickering, Ambridge, & Wearing, 2004; Tamnes et al., 2013) and
decreases during adulthood (Borella et al., 2008; Hasher & Zacks, 1988; Park et al., 2002; see
Sander, Lindenberger, & Werkle-Bergner, 2012 for an overview). While those observations
derive mainly from cross-sectional studies, longitudinal evidence suggests non-linear change-
patterns with accelerated decline in older adulthood (Nyberg et al., 2012; for further elaborations,
see Lindenberger, Von Oertzen, Ghisletta, & Hertzog, 2011; Raz & Lindenberger, 2011).
Although the developmental trajectory of WM in ASD is not well charted, there is
preliminary evidence for it being deviant from typical development (see O'Hearn et al., 2008).
Cross-sectional studies demonstrated that WM improved from childhood to adolescence in both
ASD and typically developing individuals (Happé et al., 2006; Luna et al., 2007; but see Rosenthal
et al., 2013), but that WM development from adolescence to young adulthood was delayed in
ASD (i.e., maturity was reached at a later age) (Luna et al., 2007). A recent longitudinal study
over a two-year period pointed out that WM development among children and adolescents might
be arrested (Andersen et al., 2014). These findings suggest a delayed development of WM in
individuals with ASD that protracts into young adulthood (O'Hearn et al., 2008). So far, the
trajectory of WM development in middle adulthood is unknown. In late adulthood, an initial
small cross-sectional study suggests comparable age-related decline in older individuals with
88 | Chapter 5
ASD compared to typically developing elderly, but WM abilities in those with ASD still seem to
be reduced in old age (Geurts & Vissers, 2012).
Whether WM is indeed impaired in individuals with ASD is, however, still a topic of
debate: Studies comparing individuals with and without ASD of the same age on a group level
show inconsistent results (e.g., Koshino et al., 2008; Ozonoff & Strayer, 2001; Williams et al.,
2005; see Barendse et al., 2013 for a review). WM impairments are mainly found when individuals
with ASD are compared to typically developing individuals rather than to other pathological
groups (Russo et al., 2007); when spatial WM rather than verbal WM is examined (Steele et al.,
2007; Williams et al., 2005; but see Ozonoff & Strayer, 2001); and when there are increased
demands on WM, for example when the complexity of the task is high or when item
manipulation is required instead of maintenance only (Koshino et al., 2008; Steele et al., 2007;
Williams et al., 2005).
Whereas WM is sensitive to age-related decline, considerable inter-individual
differences exist between individuals of the same age (Eenshuistra et al., 2004; Vogel & Awh,
2008) that tend to increase with advancing adulthood (e.g., Nagel et al., 2008; Werkle-Bergner et
al., 2012). Similarly, among individuals with ASD, individual differences may partially explain the
inconsistent WM findings. For example, de Vries and Geurts (2014) found that a relatively small
subgroup of children with ASD that demonstrated WM deficits accounted for the WM
impairment found on a group level when comparing children with and without ASD. These
findings underscore that both ASD and aging are characterized by broad heterogeneity.
Several factors have been proposed to drive age-related cognitive decline and WM
performance, such as slowing speed of processing (Salthouse, 1996), worsening suppression of
irrelevant information (i.e., interference control) (Hasher & Zacks, 1988) degrading sensory
functioning (Baltes & Lindenberger, 1997), changes in global intelligence (Hockey & Geffen,
2004), social participation status (Lövdén, Ghisletta, & Lindenberger, 2005), depressive
symptoms (Paterniti, Verdier-Taillefer, Dufouil, & Alperovitch, 2002), and Attention Deficit
Hyper Activity disorder (ADHD) (Engelhardt, Nigg, Carr, & Ferreira, 2008). Some of these
factors are also known to be critical in ASD. For example, comorbid conditions are common in
ASD (Hofvander et al., 2009), individuals with ASD show interference control difficulties
(Geurts et al., 2014) and response slowing (Travers et al., 2014), and societal participation, such
as having a job and being satisfied with received environmental support, is generally low (Howlin
et al., 2013; Magiati et al., 2014; van Heijst & Geurts, 2014). Given the substantial inter-individual
differences in typical aging as well as in ASD, and the overlap in factors contributing to both
conditions, the present study addresses the additional question whether differential age-related
Atypical WM decline in ASD? | 89
patterns in WM performance could be observed in specific subgroups among adults with and
without ASD.
In summary, the current cross-sectional study investigates WM in ASD over the entire
adult lifespan (i.e., including middle and late adulthood) by means of an n-back task. In an n-
back task, a continuous stream of stimuli is presented and the objective is to indicate whether
the current stimulus matches a stimulus shown n trials previously. Stimuli used in the current
study consisted of simple pictures (Severens, Lommel, Ratinckx, & Hartsuiker, 2005). An n-back
task taps into core WM-processes such as maintenance of items in memory, updating of task
relevant information, binding of items into a serial order, and resolution of proactive interference
(Chatham et al., 2011). Hence, it is often used in cognitive neuroscience research to investigate
WM (Jarrold & Towse, 2006; Smith & Jonides, 1997) by experimentally manipulating load
parametrically (Jaeggi, Buschkuehl, Perrig, & Meier, 2010). The aims of the current study are
threefold. First, we investigate WM performance across different load levels comparing adults
with and without ASD. We hypothesize that, if there is WM impairment in ASD, this should
become apparent in the cognitively more demanding condition (i.e., 2-back condition). Second,
we study the effect of age on WM performance over the adult lifespan in ASD and non-ASD to
examine developmental patterns. In typical development, age-related changes in WM
performance are independent of modality (verbal or visuospatial) or span/non-span (Conklin et
al., 2007; Park et al., 2002). Therefore, given that age-related differences of spatial WM span were
found to be similar among older adults with and without ASD (Geurts & Vissers, 2012) before,
we hypothesize similar age-related differences in WM performance across groups in our study
as well (that is, a parallel pattern of age-gradients across groups). Third, we explore whether we
can find predictors of inter-individual differences in age-related patterns of WM performance
using regression trees.
METHODS
Participants
ASD group. Our sample consisted of 168 individuals with an ASD who were recruited through
different mental health institutions across the Netherlands, and by means of advertisement on
client organization websites. They were screened, based on self-reported information, for the
following exclusion criteria: (1) no clinical ASD diagnosis according to Diagnostic and Statistical
Manual of Mental Disorders fourth edition (DSM-IV) (American Psychiatric Association, 2000)
criteria; (2) history of neurological disorders (e.g. epilepsy, stroke, cerebral contusion); (3)
diagnosed with schizophrenia, or having experienced more than one psychosis. Based on these
90 | Chapter 5
criteria, 26 individuals were excluded, and the ASD diagnoses of the remaining 142 participants
were verified by administering the Autism Diagnostic Observation Schedule module 4 (ADOS)
(Lord et al., 2000) and the Autism-spectrum Quotient (AQ) (Baron-Cohen et al., 2001). If
participants did not score above the cut-off of 7 on the ADOS, a score above the AQ cut-off of
26 was required (Woodbury-Smith et al., 2005). Of the 39 participants who did not meet the
ADOS criterion, only five did also not meet the AQ criterion and were excluded from further
analysis. Of the remaining 138 participants, two were excluded as their IQ, estimated with two
subtests of the Wechsler Adult Intelligence Scale third edition (WAIS-III) (Wechsler, 1997a) was
below 80; none of the participants was excluded based on a Mini Mental State Exam score below
26 (MMSE) (Folstein et al., 1975). Moreover, we excluded two participants due to a current
alcohol- or drugs dependency and 14 participants due to having experienced more than one
psychosis or not remembering how many psychoses were experienced during lifetime, revealed
by administration of the Mini International Neuropsychiatric Interview (MINI) (Sheehan et al.,
1998), which were previously not indicated by self-report. Finally, we excluded one individual
who could not be evaluated for screening due to non-compliance to answering MINI questions.
The eligible ASD group consisted of 118 participants.
Comparison group. The comparison group (COM) consisted of 193 individuals without ASD
who were recruited by means of advertisements on the university website and on social media,
and within the social environment of the researchers. They were screened, based on self-reported
information, for the following exclusion criteria: (1) clinical diagnosis of ASD or ADHD; (2) a
history of neurological disorders; (3) diagnosed with schizophrenia, or having ever experienced
a psychotic episode; (4) ASD or schizophrenia in close family members (i.e. parents, children,
brothers and sisters). Fourteen individuals were excluded and the remaining 179 participants
filled out the AQ. If participants scored above the suggested AQ cut-off for the general
population of 32 or higher (Baron-Cohen et al., 2001) they were excluded. One participant did
exceed the AQ cut-off and one participant had too many missing AQ responses (10.0%). Of the
remaining 177 participants, two were excluded as their estimated IQ was below 80; none of the
participants was excluded based on a MMSE score below 26. Finally, after administering the
MINI, we excluded: (1) six participants due to a current alcohol- or drugs dependency; (2) two
participants who could not be evaluated for screening due to non-compliance to answering
questions. The eligible COM group consisted of 167 participants.
N-back data of six ASD participants were lost due to technical problems, two COM
participants withdrew after the first session, and two participants (one ASD, one COM) did not
complete the n-back task. Hence, 111 participants with ASD and 164 participants without ASD
were included (see Figure 5.1 for an illustration of the inclusion process). The groups were
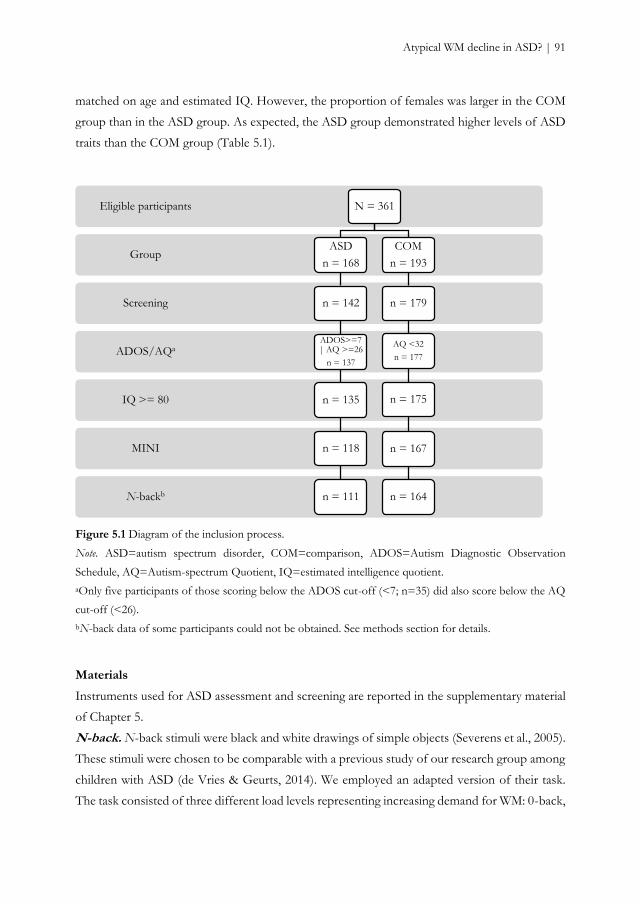
Atypical WM decline in ASD? | 91
matched on age and estimated IQ. However, the proportion of females was larger in the COM
group than in the ASD group. As expected, the ASD group demonstrated higher levels of ASD
traits than the COM group (Table 5.1).
Figure 5.1 Diagram of the inclusion process.
Note. ASD=autism spectrum disorder, COM=comparison, ADOS=Autism Diagnostic Observation
Schedule, AQ=Autism-spectrum Quotient, IQ=estimated intelligence quotient.
aOnly five participants of those scoring below the ADOS cut-off (<7; n=35) did also score below the AQ
cut-off (<26).
bN-back data of some participants could not be obtained. See methods section for details.
Materials
Instruments used for ASD assessment and screening are reported in the supplementary material
of Chapter 5.
N-back. N-back stimuli were black and white drawings of simple objects (Severens et al., 2005).
These stimuli were chosen to be comparable with a previous study of our research group among
children with ASD (de Vries & Geurts, 2014). We employed an adapted version of their task.
The task consisted of three different load levels representing increasing demand for WM: 0-back,
N-backb
MINI
IQ >= 80
ADOS/AQa
Screening
Group
Eligible participants N = 361
ASD
n = 168
n = 142
ADOS>=7 | AQ >=26
n = 137
n = 135
n = 118
n = 111
COM
n = 193
n = 179
AQ <32
n = 177
n = 175
n = 167
n = 164
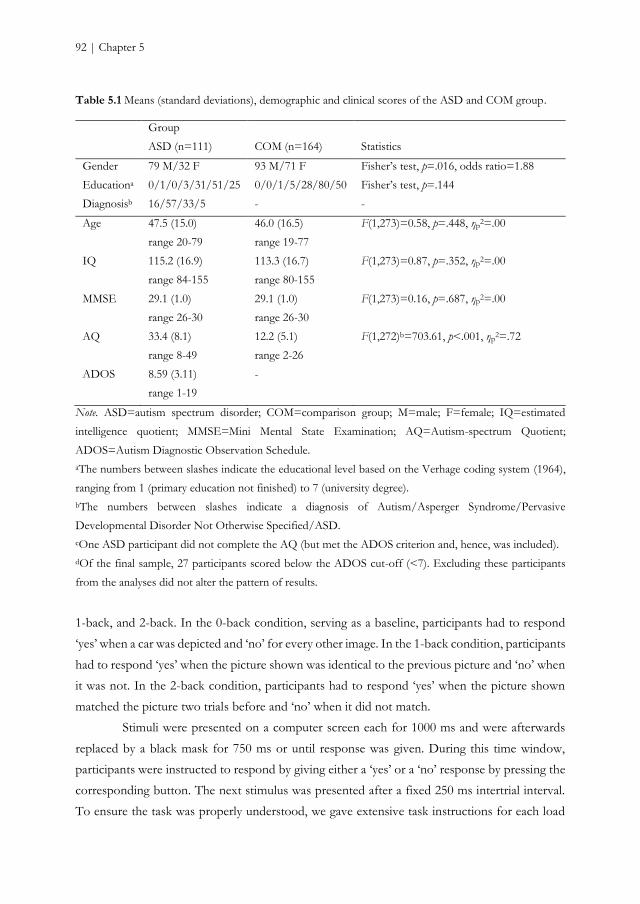
92 | Chapter 5
Table 5.1 Means (standard deviations), demographic and clinical scores of the ASD and COM group.
Group
ASD (n=111) COM (n=164) Statistics
Gender 79 M/32 F 93 M/71 F Fisher’s test, p=.016, odds ratio=1.88
Educationa 0/1/0/3/31/51/25 0/0/1/5/28/80/50 Fisher’s test, p=.144
Diagnosisb 16/57/33/5 - -
Age 47.5 (15.0)
range 20-79
46.0 (16.5)
range 19-77
F(1,273)=0.58, p=.448, ηp2=.00
IQ 115.2 (16.9)
range 84-155
113.3 (16.7)
range 80-155
F(1,273)=0.87, p=.352, ηp2=.00
MMSE 29.1 (1.0)
range 26-30
29.1 (1.0)
range 26-30
F(1,273)=0.16, p=.687, ηp2=.00
AQ 33.4 (8.1)
range 8-49
12.2 (5.1)
range 2-26
F(1,272)b=703.61, p<.001, ηp2=.72
ADOS 8.59 (3.11)
range 1-19
-
Note. ASD=autism spectrum disorder; COM=comparison group; M=male; F=female; IQ=estimated
intelligence quotient; MMSE=Mini Mental State Examination; AQ=Autism-spectrum Quotient;
ADOS=Autism Diagnostic Observation Schedule.
aThe numbers between slashes indicate the educational level based on the Verhage coding system (1964),
ranging from 1 (primary education not finished) to 7 (university degree).
bThe numbers between slashes indicate a diagnosis of Autism/Asperger Syndrome/Pervasive
Developmental Disorder Not Otherwise Specified/ASD.
cOne ASD participant did not complete the AQ (but met the ADOS criterion and, hence, was included).
dOf the final sample, 27 participants scored below the ADOS cut-off (<7). Excluding these participants
from the analyses did not alter the pattern of results.
1-back, and 2-back. In the 0-back condition, serving as a baseline, participants had to respond
‘yes’ when a car was depicted and ‘no’ for every other image. In the 1-back condition, participants
had to respond ‘yes’ when the picture shown was identical to the previous picture and ‘no’ when
it was not. In the 2-back condition, participants had to respond ‘yes’ when the picture shown
matched the picture two trials before and ‘no’ when it did not match.
Stimuli were presented on a computer screen each for 1000 ms and were afterwards
replaced by a black mask for 750 ms or until response was given. During this time window,
participants were instructed to respond by giving either a ‘yes’ or a ‘no’ response by pressing the
corresponding button. The next stimulus was presented after a fixed 250 ms intertrial interval.
To ensure the task was properly understood, we gave extensive task instructions for each load
Atypical WM decline in ASD? | 93
level. First, the task was orally explained and instructions were displayed on screen. Second, a
paper-version practice block (15 trials) was administered in order to give participants time to
familiarize themselves with the task and allow the experimenter to give additional instructions as
needed. Third, participants performed a computerized practice block (24 trials). Moreover, task
instructions were repeated before each experimental block. The task consisted of four
experimental blocks per load level (24 trials each). Blocks consistently switched between load
levels, i.e. 0-back was followed by 1-back, which was followed by 2-back, which was followed
by 0-back, etcetera. Stimuli were presented in a pseudo-randomized order. To rule out the effect
of interfering response mapping memory processes, two cues were provided: a ‘yes’ card was
presented in accordance of the associated ‘yes’ key, and a ‘no’ card in accordance of the
associated ‘no’ key. Participants were instructed to respond as fast and as accurately as possible.
The task yielded two dependent variables: accuracy (proportion of correct responses), and mean
reaction time (RT) on correct responses.
Predictor variables. To explore whether we could predict age-related differences in WM
performance, we selected a series of potential predictor variables based on (1) a known
relationship with WM decline in typical aging; and (2) being critical in individuals with ASD.
Therefore, we included, in addition to demographic and clinical variables (estimated IQ,
diagnosis [ASD, no ASD], gender, education, AQ traits) measures of (a) processing speed
(measured as mean RT on correct trials during a choice response task (Donders, 1869); see
Supplementary material Chapter 5); (b) interference control (measured as mean RT difference
between compatible and incompatible trials during a Simon task [i.e. Simon effect; (Simon,
1969)]; see Supplementary material Chapter 5); (c) comorbidity, by choosing the three most
common comorbid conditions in ASD (Hofvander et al., 2009), that is depression, anxiety
(measured with depression and anxiety subscales of the Symptom Checklist-90 [(Arrindell &
Ettema, 2005; Derogatis, 1977)]), and ADHD (using the attention and hyperactivity, and
inattention subscales of the ADHD list [(Kooij et al., 2004)]); (d) participation status,
operationalized as satisfaction with and need for environmental support and professional
employment (measured with the environmental subscale of the abbreviated World Health
Organization Quality of Life questionnaire [(Herrman et al., 1998; Trompenaars, Masthoff, Van
Heck, Hodiamont, & De Vries, 2005)]; professional employment was encoded according to the
International Standard Classification of Occupations-08).
Procedure
Participants were informed about the study purposes and its procedure and written informed
consent was obtained. Thereafter, participants filled out a series of questionnaires and were
94 | Chapter 5
tested in two sessions. In the first session, the ADOS (only ASD group), two subtests of the
WAIS, MMSE and MINI were administered. In the second session, the n-back, choice response
task, and Simon task, among seven other tasks, were administered in counterbalanced order. Not
all administered questionnaires and tests are of relevance for the current study, so these will be
discussed elsewhere (e.g., Lever & Geurts, 2015). Participants received compensation for their
travel expenses; most COM participants also received a small amount of additional
compensation (max. €20). The study was approved by the ethical review board of the
Department of Psychology at the University of Amsterdam (2011-PN-1952); all procedures
complied to relevant laws and institutional guidelines.
Statistical analyses
Prior to n-back analyses, we removed RT outliers. At an individual level, trials with RTs deviating
more than 3 standard deviations from the mean and RTs faster than 100 milliseconds were
removed. This procedure resulted in the exclusion of less than 3.1% of all trials in each group
(i.e., the maximum percentage of removed outliers was 3.1% for the ASD group [M = 1.6%, SD
= 0.5%] and 3.1% for the COM group [M = 1.6%, SD = 0.5%] and did not differ between
groups, F(1,273)=0.52, p=.472).
At a group level, mean RTs were calculated over the remaining responses on correct
trials. RTs were normally distributed and, therefore, not transformed. Accuracy was calculated
as the proportion of correct responses (correct number of trials per total number); Arcsine-
square-root transformation was applied to increase normality, but, to ease interpretation,
accuracy rates are reported in raw score units.
To test whether the groups differed in their WM performance across load levels, we performed
two mixed-design Analyses of Variance (ANOVAs) with repeated measures of load (0-back, 1-
back, 2-back) as within-subject factor and group (ASD, COM) as between-subject factor. As the
ASD and COM group differed in their male to female ratio (p=.016 by Fisher’s Exact Test), and
gender may influence WM performance in either ASD or aging (e.g., Lejbak, Crossley, &
Vrbancic, 2011), gender (male, female) was added as a between-subject factor in the overall
group analyses. Accuracy and RTs on correct trials constituted the dependent variables.
To investigate whether age-related differences in WM performance varied across
groups, we composed a difference score by subtracting untransformed accuracy on the 0-back
condition from untransformed accuracy on the 2-back conditionv. Arcsine-square-root
transformation was applied to the difference score to increase normality. The resulting
v This procedure was chosen to account for unspecific variance and to obtain the largest possible contrast in WM ability.
Atypical WM decline in ASD? | 95
transformed difference score constituted the dependent variable for our regression analysis with
(centered) age, group, and age×group interaction as predictors. As age-related WM decline might
accelerate with increasing age, we explored whether there were differential effects of a quadratic
component of age on WM in the ASD and COM group. To this end, we tested an additional
model including a quadratic age term as main effect (age2) and its interaction with group
(age2×group).
All group-level analyses were run both with and without outlier correction (i.e., data
points more than three times the interquartile range above or below the first quartile). We report
results with outlier correction and state results without outlier correction only if the pattern of
results changed. To reduce the probability of Type I errors, alpha level was set at .01 for the
group comparisons and the age-related regression analyses. Whenever the assumption of
sphericity was violated, we used the Greenhouse-Geisser correction (but we report uncorrected
degrees of freedom).
With Bayesian statistics, we explored the robustness of the group comparisons and age-
related differences. Bayesian hypothesis testing allows assessing the strength of evidence for a
hypothesis Ha over an alternative hypothesis Hb based on the observed data (Rouder, Speckman,
Sun, Morey, & Iverson, 2009). Typically, hypothesis Ha is the hypothesis of interest (i.e., H1) and
Hb is the null hypothesis stating that there is no effect (i.e., H0). We can calculate a Bayes factor
to quantify the evidence in favor of the data supporting H1 rather than H0, which is denoted as
BF10. We can also use the Bayes factor to express evidence in favor of H0, by using the relation
BF01 = 1/ BF10. For example, BF10 = 5 indicates that it is 5 times more likely that the data derived
from H1 than from H0, whereas BF10 = 1/5 indicates that it is 5 times more likely that the data
derived from H0 than from H1. A BF10 between 1 and 3 indicates anecdotal evidence, between
3 and 10 substantial evidence, between 10 and 30 strong evidence, between 30 and 100 very
strong evidence, and above 100 extreme evidence in favor of H1 (Jeffreys, 1961; Wagenmakers,
Wetzels, Borsboom, & van der Maas, 2011). When BF10 = 1, there is no evidence in the data for
either H1 or H0 and when BF10 < 1 there is evidence in favor of H0.
To explore whether we could predict inter-individual differences in age-related trends,
we used regression trees (also see Brandmaier, von Oertzen, McArdle, & Lindenberger, 2013;
see Strobl, Malley, & Tutz, 2009 for an overview). Regression trees are a nonparametric
regression approach based on model-based recursive partitioning: in a hierarchical fashion,
predictors are selected that partition the sample best into homogeneous subgroups with different
parameter estimates of an initially specified regression model. Membership to the resulting
subgroups is determined by predictors in the form of a hierarchy of decisions forming a tree:
Inner nodes of the tree represent decision nodes, terminal nodes (or leaves) represent regression
96 | Chapter 5
models. A tree is created by recursively selecting the predictor that best explains heterogeneity
in the sample. In other words, at each level of growing a tree, the predictor that predicts maximal
differences in the regression model is selected as a splitting variable. The exact splitting point is
selected by maximizing the difference of the fit between the current node (i.e., parent node) and
its two daughter nodes. The parent node is split into two daughter nodes if they represent better
fit of the model to the data than the parent node. This process is repeated until a stopping
criterion (e.g., a specified minimal number of observations or a specified threshold for the
minimum improvement of a split’s model fit) is met. The result is a tree with a set of leaves, each
containing a subset of observations associated with different parameters of the initially specified
regression models.
To build our regression tree, we (1) set up the initial regression model regressing the
accuracy difference score on age as baseline model, and (2) determined potential predictors as
candidates for the decision nodes in a tree. These candidates included a set of demographic
variables (group, gender, education, profession, IQ, environmental support), comorbidities
(depression, ADHD, anxiety, ASD), and EFs (interference control, processing speed). The tree
was grown using the ‘party’ package (Hothorn, Hornik, & Zeileis, 2006) in R. We set our
stopping criterion to a minimum number of cases per terminal node of 20 and used Bonferroni
correction for multiple comparisons at each node of the tree.
The baseline model was specified as a linear regression model with arcsine-square-root
accuracy difference score regressed on age. Thus, the tree was geared up for exploring subgroups
with differential age-gradients in WM performance. While the regression tree was run with R
3.0.2 (R Core Team, 2012), the Bayes factors were calculated with JASP 0.7.0, an open source
statistical package (Love, Selker, Verhagen et al., 2015a). The other analyses were run with SPSS
22.0 (IBM Corp., 2013).
RESULTS
Group differences
As expected, there was a main effect of load level on the proportion of correct responses. Post-
hoc tests using Bonferroni correction revealed that accuracy decreased with increasing WM load.
Accuracy was higher on 0-back (97.3%) than on 1-back (95.4%; p<.001) condition and higher
on 1-back than on 2-back (88.9%; p<.001) condition. The main effects of group and gender were
not significant. Also, none of the interactions were significant (see Table 5.2). These results
showed that decline in performance due to increasing WM load was similar for individuals with
and without ASD.
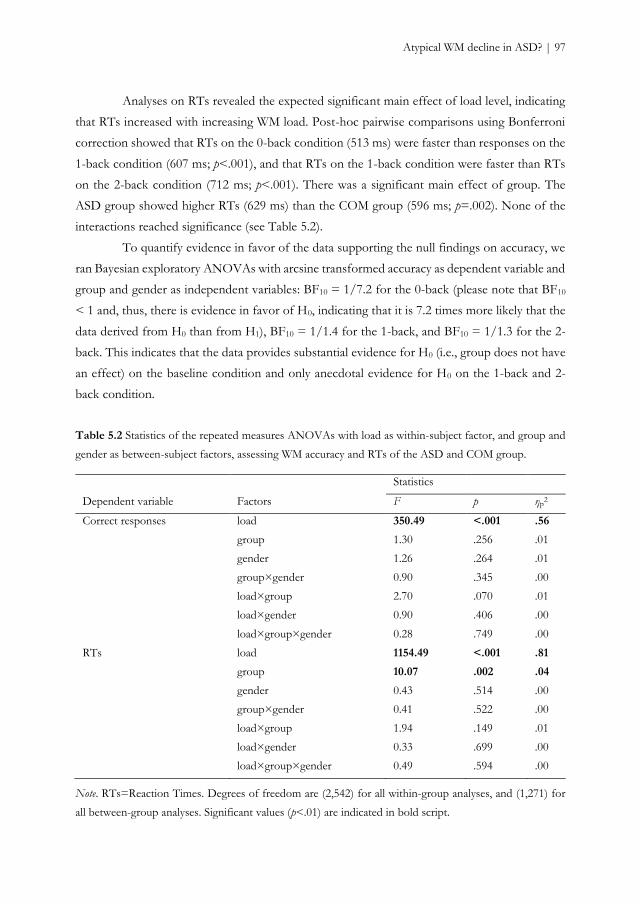
Atypical WM decline in ASD? | 97
Analyses on RTs revealed the expected significant main effect of load level, indicating
that RTs increased with increasing WM load. Post-hoc pairwise comparisons using Bonferroni
correction showed that RTs on the 0-back condition (513 ms) were faster than responses on the
1-back condition (607 ms; p<.001), and that RTs on the 1-back condition were faster than RTs
on the 2-back condition (712 ms; p<.001). There was a significant main effect of group. The
ASD group showed higher RTs (629 ms) than the COM group (596 ms; p=.002). None of the
interactions reached significance (see Table 5.2).
To quantify evidence in favor of the data supporting the null findings on accuracy, we
ran Bayesian exploratory ANOVAs with arcsine transformed accuracy as dependent variable and
group and gender as independent variables: BF10 = 1/7.2 for the 0-back (please note that BF10
< 1 and, thus, there is evidence in favor of H0, indicating that it is 7.2 times more likely that the
data derived from H0 than from H1), BF10 = 1/1.4 for the 1-back, and BF10 = 1/1.3 for the 2-
back. This indicates that the data provides substantial evidence for H0 (i.e., group does not have
an effect) on the baseline condition and only anecdotal evidence for H0 on the 1-back and 2-
back condition.
Table 5.2 Statistics of the repeated measures ANOVAs with load as within-subject factor, and group and
gender as between-subject factors, assessing WM accuracy and RTs of the ASD and COM group.
Statistics
Dependent variable Factors F p ηp2
Correct responses load 350.49 <.001 .56
group 1.30 .256 .01
gender 1.26 .264 .01
group×gender 0.90 .345 .00
load×group 2.70 .070 .01
load×gender 0.90 .406 .00
load×group×gender 0.28 .749 .00
RTs load 1154.49 <.001 .81
group 10.07 .002 .04
gender 0.43 .514 .00
group×gender 0.41 .522 .00
load×group 1.94 .149 .01
load×gender 0.33 .699 .00
load×group×gender 0.49 .594 .00
Note. RTs=Reaction Times. Degrees of freedom are (2,542) for all within-group analyses, and (1,271) for
all between-group analyses. Significant values (p<.01) are indicated in bold script.
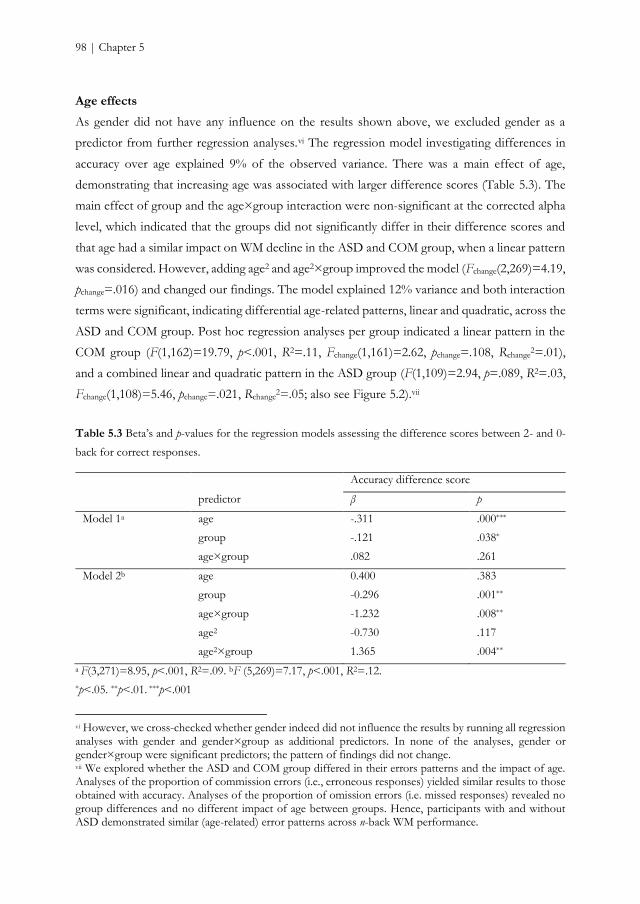
98 | Chapter 5
Age effects
As gender did not have any influence on the results shown above, we excluded gender as a
predictor from further regression analyses.vi The regression model investigating differences in
accuracy over age explained 9% of the observed variance. There was a main effect of age,
demonstrating that increasing age was associated with larger difference scores (Table 5.3). The
main effect of group and the age×group interaction were non-significant at the corrected alpha
level, which indicated that the groups did not significantly differ in their difference scores and
that age had a similar impact on WM decline in the ASD and COM group, when a linear pattern
was considered. However, adding age2 and age2×group improved the model (Fchange(2,269)=4.19,
pchange=.016) and changed our findings. The model explained 12% variance and both interaction
terms were significant, indicating differential age-related patterns, linear and quadratic, across the
ASD and COM group. Post hoc regression analyses per group indicated a linear pattern in the
COM group (F(1,162)=19.79, p<.001, R2=.11, Fchange(1,161)=2.62, pchange=.108, Rchange2=.01),
and a combined linear and quadratic pattern in the ASD group (F(1,109)=2.94, p=.089, R2=.03,
Fchange(1,108)=5.46, pchange=.021, Rchange2=.05; also see Figure 5.2).vii
Table 5.3 Beta’s and p-values for the regression models assessing the difference scores between 2- and 0-
back for correct responses.
Accuracy difference score
predictor β p
Model 1a age -.311 .000***
group -.121 .038*
age×group .082 .261
Model 2b age 0.400 .383
group -0.296 .001**
age×group -1.232 .008**
age2 -0.730 .117
age2×group 1.365 .004**
a F(3,271)=8.95, p<.001, R2=.09. bF (5,269)=7.17, p<.001, R2=.12.
*p<.05. **p<.01. ***p<.001
vi However, we cross-checked whether gender indeed did not influence the results by running all regression analyses with gender and gender×group as additional predictors. In none of the analyses, gender or gender×group were significant predictors; the pattern of findings did not change. vii We explored whether the ASD and COM group differed in their errors patterns and the impact of age. Analyses of the proportion of commission errors (i.e., erroneous responses) yielded similar results to those obtained with accuracy. Analyses of the proportion of omission errors (i.e. missed responses) revealed no group differences and no different impact of age between groups. Hence, participants with and without ASD demonstrated similar (age-related) error patterns across n-back WM performance.
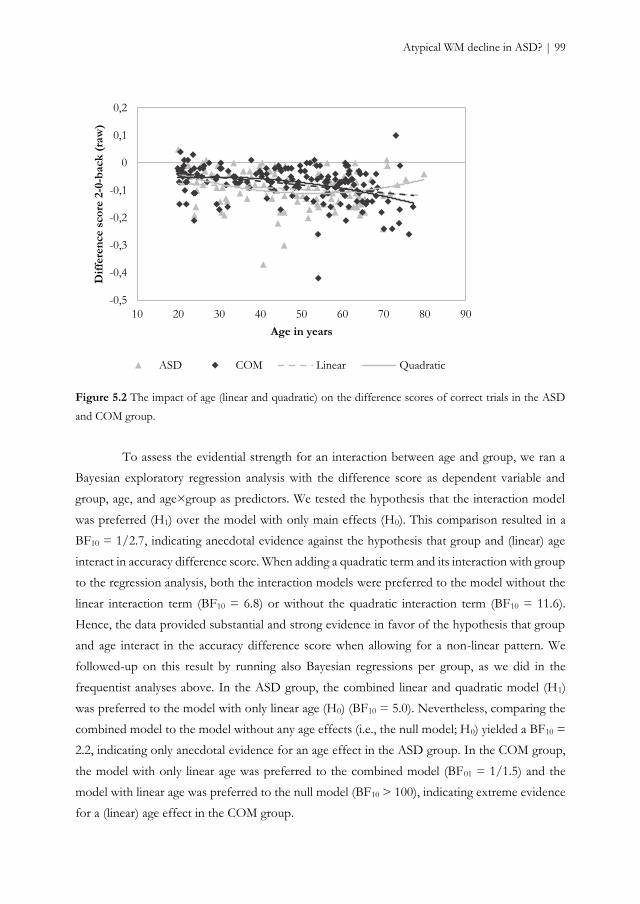
Atypical WM decline in ASD? | 99
Figure 5.2 The impact of age (linear and quadratic) on the difference scores of correct trials in the ASD
and COM group.
To assess the evidential strength for an interaction between age and group, we ran a
Bayesian exploratory regression analysis with the difference score as dependent variable and
group, age, and age×group as predictors. We tested the hypothesis that the interaction model
was preferred (H1) over the model with only main effects (H0). This comparison resulted in a
BF10 = 1/2.7, indicating anecdotal evidence against the hypothesis that group and (linear) age
interact in accuracy difference score. When adding a quadratic term and its interaction with group
to the regression analysis, both the interaction models were preferred to the model without the
linear interaction term (BF10 = 6.8) or without the quadratic interaction term (BF10 = 11.6).
Hence, the data provided substantial and strong evidence in favor of the hypothesis that group
and age interact in the accuracy difference score when allowing for a non-linear pattern. We
followed-up on this result by running also Bayesian regressions per group, as we did in the
frequentist analyses above. In the ASD group, the combined linear and quadratic model (H1)
was preferred to the model with only linear age (H0) (BF10 = 5.0). Nevertheless, comparing the
combined model to the model without any age effects (i.e., the null model; H0) yielded a BF10 =
2.2, indicating only anecdotal evidence for an age effect in the ASD group. In the COM group,
the model with only linear age was preferred to the combined model (BF01 = 1/1.5) and the
model with linear age was preferred to the null model (BF10 > 100), indicating extreme evidence
for a (linear) age effect in the COM group.
-0,5
-0,4
-0,3
-0,2
-0,1
0
0,1
0,2
10 20 30 40 50 60 70 80 90
Dif
fere
nce s
co
re 2
-0-b
ack
(ra
w)
Age in years
ASD COM Linear Quadratic
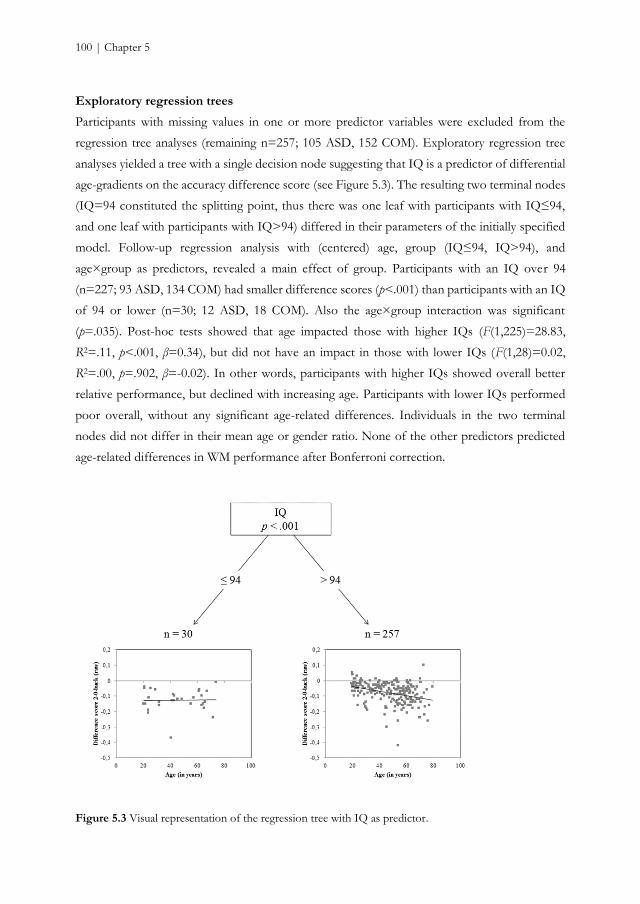
100 | Chapter 5
Exploratory regression trees
Participants with missing values in one or more predictor variables were excluded from the
regression tree analyses (remaining n=257; 105 ASD, 152 COM). Exploratory regression tree
analyses yielded a tree with a single decision node suggesting that IQ is a predictor of differential
age-gradients on the accuracy difference score (see Figure 5.3). The resulting two terminal nodes
(IQ=94 constituted the splitting point, thus there was one leaf with participants with IQ≤94,
and one leaf with participants with IQ>94) differed in their parameters of the initially specified
model. Follow-up regression analysis with (centered) age, group (IQ≤94, IQ>94), and
age×group as predictors, revealed a main effect of group. Participants with an IQ over 94
(n=227; 93 ASD, 134 COM) had smaller difference scores (p<.001) than participants with an IQ
of 94 or lower (n=30; 12 ASD, 18 COM). Also the age×group interaction was significant
(p=.035). Post-hoc tests showed that age impacted those with higher IQs (F(1,225)=28.83,
R2=.11, p<.001, β=0.34), but did not have an impact in those with lower IQs (F(1,28)=0.02,
R2=.00, p=.902, β=-0.02). In other words, participants with higher IQs showed overall better
relative performance, but declined with increasing age. Participants with lower IQs performed
poor overall, without any significant age-related differences. Individuals in the two terminal
nodes did not differ in their mean age or gender ratio. None of the other predictors predicted
age-related differences in WM performance after Bonferroni correction.
Figure 5.3 Visual representation of the regression tree with IQ as predictor.
Atypical WM decline in ASD? | 101
DISCUSSION
In the current study, we investigated age-related patterns of cognitive functioning in ASD in one
essential executive function, namely WM. EFs are known as a major challenge in ASD and
deteriorate in typical aging. So far, the question whether age-related cognitive decline follows a
different pattern in ASD has been highly under-investigated. The present cross-sectional findings
suggest, despite longer RTs, similar WM performance, but a differential age-related WM pattern
in ASD clients compared to individuals without ASD.
The n-back task results revealed the typical decrease in performance with increasing
WM load (e.g., Smith & Jonides, 1997). N-back performance did not significantly differ between
adults with and without ASD on neither load level, as revealed by both conventional frequentists
and Bayesian analyses. There are three possible explanations for this unpredicted result. First,
the version of our task may not have been as challenging for adults with ASD as we expected.
Even though a 2-back task involves manipulation and updating of information (Chatham et al.,
2011), a further increment of n might have been necessary to sufficiently challenge all individuals
and to eventually detect subtle WM difficulties in ASD. Second, the used stimuli were simple
pictures, but as they were easy to name, verbal WM might have been invoked. Adults with ASD
perform generally well on n-back tasks using obvious verbal stimuli, such as letters, and our
findings are in line with these studies (Koshino et al., 2005; Williams et al., 2005). Third,
individuals with ASD present a heterogeneous group and also their WM performance reveals
large inter-individual differences. Although the overall group may perform similarly to
individuals without ASD, it does not preclude that a small subgroup of adults with ASD does
have WM difficulties, as previously found in children (de Vries & Geurts, 2014).
Despite comparable WM accuracy rates, adults with ASD needed more time to
respond. Although in previous studies using an n-back task no RT differences were found (e.g.,
Williams et al., 2005), diminished processing speed is often observed in individuals with ASD
(Travers et al., 2014). Furthermore, response slowing in ASD occurred independent of WM load,
and seems, hence, a general feature rather than specific for WM. Nonetheless, WM accuracy
apparently comes with a speed penalty that is greater for individuals with than without ASD.
Whether these longer RTs are a result of a different strategy, which favors accuracy over speed
(speed-accuracy trade-off), or part of a differential processing style and unrelated to accuracy,
should be tested in a future study in which speed/accuracy instructions are experimentally
manipulated.
Consistent with previous cross-sectional studies in typical aging, WM performance
gradually declines with increasing age in adults without ASD (see Sander et al., 2012). This age-
102 | Chapter 5
related pattern seemed, however, differentially expressed in individuals with ASD: The pattern
was both linear and quadratic, with increasing age being associated with better performance,
revealed by smaller difference scores. The difference score takes baseline performance (i.e., 0-
back) into account and aims at filtering out unspecific variance. Smaller (compared to larger)
difference scores indicated that increased load had a smaller detrimental effect on performance
and, thus, designate better (relative) performance. Alternatively, one may argue that smaller
differences scores are due to relatively poor baseline performance. We explored this possibility,
but did not find any evidence in favor of this alternative. Individuals with ASD had similar
baseline performance compared to those without ASD (F(1,273)=.13, p=.723, ηp2=.00) and age
had a comparable effect in both groups on baseline (p=.400, β=-0.06). Hence, adults with ASD
had relatively good performance at increased load, rather than relatively poor performance at
baseline, irrespective of age. More specifically, closer inspection of the age-related differences in
WM performance among adults with ASD (Figure 5.2) revealed that especially the oldest
individuals with ASD demonstrated relatively small difference scores and, thus, exhibited
relativity good WM performance at increased load. Nevertheless, there are two reasons why this
pattern should be interpreted with caution. First, the inverted U-shape, suggesting improvement
in old age, seems to be mainly driven by the oldest adults. Fjell and colleagues (2010) warn against
over-interpreting outcomes that are driven by extremes of the age-range as they could be
misleading about the true shape of the distribution. Second, although the Bayesian explorations
indicated that there is substantial and strong evidence for differential age-related patterns, there
is only anecdotal evidence that the data support an age effect when allowing for a non-linear
pattern in the ASD group. Hence, although the pattern could fit with the idea of ASD being a
‘safeguard’ for typical age-related decline in WM performance (Geurts & Vissers, 2012; Lever &
Geurts, 2015; Oberman & Pascual-Leone, 2014), careful interpretation about the pattern among
older adults with ASD is warranted and further research is needed.
In children with ASD, WM development from childhood to young adulthood seems
to be delayed (see O'Hearn et al., 2008), and preliminary evidence suggests that WM difficulties
persist into older adulthood (Geurts & Vissers, 2012). Our current results depart from these
previous findings by demonstrating that WM development in middle and late adulthood does
not necessarily continue to be deviant. There was no evidence for a WM deficit across adulthood
in ASD, as measured by an n-back task, and no evidence for a pattern of increased age-related
difficulties, which would result in an even larger difference between individuals with and without
ASD in old age. Although speculative, this would suggest that some WM capacities, such as the
ability of updating, matures after adolescence into adulthood, at a later stage than typically
developing individuals (Andersen et al., 2014; Luna et al., 2007), and finally catch-up across
Atypical WM decline in ASD? | 103
adulthood. Nevertheless, there are two important distinctions to be made with the previous study
on WM in late adulthood. First, in contrast to us, Geurts and Vissers (2012) used a spatial span
task. Span tasks and n-back tasks both rely on WM related functions, such as the online
maintenance of information, but they might tap into different processes (Redick & Lindsey,
2013). While (simple or complex) span tasks involve the brief retention of stimuli (simple) and
additional processing tests (complex), n-back tasks also involve the updating of information.
Second, their task relied on spatial WM and individuals with ASD present more difficulties with
spatial WM than with verbal WM (Steele et al., 2007; Williams et al., 2005). Whether our task
taps into verbal or more visual WM processes remains a topic of debate. Hence, despite the fact
that both studies found a parallel age-related pattern (when allowing for only linear age-related
differences), it is unclear if the discrepancy on group comparisons is due to different WM
modality or to different underlying WM processes. Therefore, whether deficient span
performance protracts into late adulthood in ASD whereas non-span performance does not, or
spatial WM difficulties protract into late adulthood, whereas verbal WM capacities do not,
remains a question to be answered – ideally with longitudinal designs (e.g., Lindenberger et al.,
2011; Raz & Lindenberger, 2011).
With regression trees, we explored whether we could distinguish subgroups of
participants with different age-gradients indicating increased or reduced differences in WM
performance with age. This exploratory method revealed that IQ constitutes a predictor of
separate subgroups with different WM performances and/or differential age effects. Participants
with lower IQs (IQ≤94) performed worse than participants with higher IQs (IQ>94); the former
did not show age-related WM decline, while the performance of the latter participants decreased
with increasing age. An explanation for these non-intuitive results can be found in the data
distribution, rather than in a floor effect, which one might expect: Visual exploration revealed
that those with lower IQs show large heterogeneity, with participants of approximately the same
ages ranging widely in difference scores. Hence, this could be a non-systematic relationship
rather than the absence of linear age-related change (see Thomas et al., 2009). With regard to the
exact splitting point, Brandmaier and colleagues (Brandmaier, von Oertzen, McArdle, &
Lindenberger, 2014) warned against the reification of splits of continuous variables; the reported
IQ cutoff of 94 is of course subject to sampling error and, rather than reifying two distinct
groups, we recommend to interpret it is as a change point estimate, which might approximate a
smooth underlying function.
104 | Chapter 5
Strengths, limitations, and future directions
Given the large inter-individual differences among individuals with ASD on the one hand (e.g.,
Towgood et al., 2009) and among older adults on the other (e.g., Werkle-Bergner et al., 2012), it
seems crucial to study individual age-related processes over time (e.g., Lindenberger et al., 2011;
Raz & Lindenberger, 2011). Even though this large cross-sectional study represents a significant
initial attempt in the understanding of aging processes involved in individuals with ASD and
provides, therefore, unique insights, it does not take into account how an individual ages.
Therefore, longitudinal studies will be an important next step to examine the nature of age-
related changes in WM performance among individuals with ASD.
The aim of our study was to understand age-related differences in adults with and
without ASD. Arguably, to investigate typical aging, samples should involve individuals with
normal-to-high intelligence. One could claim that, therefore, our sample was not representative
of the general ASD population, which includes also individuals with intellectual disabilities
(American Psychiatric Association, 2013). In fact, our results may not apply to individuals with
ASD and co-occurring intellectual disability. However, in contrast to many studies, other
psychiatric comorbid conditions did not constitute an exclusion criterion. This is crucial, as a
large proportion of individuals with ASD suffer from at least one comorbid condition
(Hofvander et al., 2009). Although comorbidities, such as depression or ADHD, may influence
WM performance (Engelhardt et al., 2008; Paterniti et al., 2002), this is unlikely in our study,
given our main findings and the fact that these conditions did not constitute predictors in the
regression trees. Instead of compromising our findings, we believe it represents a strength of our
study by augmenting the validity of our findings.
Although our ASD participants had a prior ASD diagnosis based on extensive
diagnostic assessment in which, generally, developmental history is inquired, not all diagnoses
could be verified by the ADOS (Lord et al., 2000), which is a recurrent problem when
administering the ADOS to intellectually able adults with ASD (see Bastiaansen et al., 2011). To
make sure that those who did not met ADOS criteria did not influence our findings, we reran
the group comparison and age-related regression analyses without those individuals. The pattern
of results did not change. Furthermore, we did not administer the ADOS to the comparison
group and cannot, thus, ensure that none of these participants had an undiagnosed ASD.
Nevertheless, we inquired about ASD in participants themselves and in close family members
and screened for ASD traits with the AQ. Therefore, the presence of ASD in the comparison
group seems unlikely.
Atypical WM decline in ASD? | 105
Conclusions
In sum, the present study provides unique cross-sectional evidence about age-related differences
in WM performance among a large group of adults with and without ASD. Individuals with
ASD, despite longer RTs, showed comparable WM performance across adulthood. The age-
related gradual decline observed in typical individuals was differentially expressed in ASD when
allowing for a non-linear pattern. Albeit old age in ASD seemed to be associated with better WM
performance, we argued that this finding should be interpreted with caution. Furthermore,
additional exploratory Bayesian analyses suggested that age-related differences in WM
performance among adults with ASD were barely worth mentioning. These findings provide
initial insights into how ASD modulates cognitive aging, but also underlie the need for further
WM research into late adulthood in ASD and for analyzing individual change trajectories in
longitudinal studies.
106 | Chapter 5
SUPPLEMENTARY MATERIAL CHAPTER 5
ASD assessment and screening
Diagnostic instruments. The Dutch version of the Autism Diagnostic Observation Schedule
module 4 (de Bildt & de Jonge, 2008; Lord et al., 2000) was used to assess the presence of autism
spectrum disorder (ASD) symptoms. It is a standardized, semi-structured observation
instrument and consists of a variety of structured activities and questions to elicit social behavior.
Observed behavior is rated on 31 items within the domains of communication, reciprocal social
interaction, imagination and restricted and repetitive behavior. A subset of items is used to
generate the diagnostic algorithm. We used a total score of 7 or higher on the combined social-
communication domain as a threshold for the classification of ASD (Bastiaansen et al., 2011).
To further confirm the presence of ASD symptoms in the ASD group and, conversely,
to ensure the comparison (COM) group did not contain individuals with distinct ASD traits, the
Dutch version of the Autism-spectrum Quotient (AQ) (Baron-Cohen et al., 2001; Hoekstra et
al., 2008) was administered. The AQ is a self-report screening questionnaire developed for
individuals without intellectual disabilities, consisting of 50 items that assess five different
domains: social skill, attention switching, attention to detail, communication, and imagination.
Participants have to indicate to which extent they agree with each item on a four-point Likert
scale, ranging from (1) “completely agree” to (4) “completely disagree”. Total scores can vary
between 0 and 50, with higher scores indicating more pronounced autism traits. The AQ is a
valid and reliable instrument (Baron-Cohen et al., 2001; Hoekstra et al., 2008) showing good
specificity and sensitivity (Woodbury-Smith et al., 2005).
Cognitive functioning. Intellectual functioning as measured by intelligence quotient (IQ) was
estimated with two subtests of the Dutch Wechsler Adult Intelligence Scale third edition
(Uterwijk, 2000; Wechsler, 1997a): Vocabulary and Matrix Reasoning. Both subtests have high
correlations with full scale IQ (Wechsler, 1997a) and provide in combination a reliable estimate
of full scale IQ (e.g., Ringe, Saine, Lacritz, Hynan, & Cullum, 2002). Estimated scores can vary
between 45 and 155, but in the current study only participants with an IQ above 80 were
included.
The Mini Mental State Exam score (MMSE) (Folstein et al., 1975; Kok & Verhey, 2002;
Molloy et al., 1991) is a valid, reliable (Folstein et al., 1975) and widely used instrument for the
screening of cognitive impairment in elderly individuals. The MMSE consists of 11 questions
assessing basic aspects of cognitive functioning, including orientation in time and space,
immediate and delayed recall, calculus and language. A score over 25 is considered within the
range of normal cognitive functioning.
Atypical WM decline in ASD? | 107
Comorbidity. The presence or absence of alcohol dependence, substance dependence, and
psychoses was assessed with the Mini International Neuropsychiatric Interview Plus (MINI-
Plus) (Sheehan et al., 1998; van Vliet et al., 2000). The MINI(-Plus) is standardized diagnostic
psychiatric interview that explores several psychiatric disorders according to DSM criteria. For
each disorder, two to four screenings questions were used. The diagnosis was rejected when the
answers were negative. When the answers were positive, additional questions were used to
further investigate the diagnostic criteria. The MINI is a valid and reliable instrument (Lecrubier
et al., 1997; Sheehan et al., 1997).
Simon task and choice reaction time task
Simon task
Participants performed a standard visual Simon task, adapted from Broeders and colleagues (in
prep), which was presented at a 15.6 inch laptop screen. A fixation cross (0.90 centimeters) was
presented at the center of the screen for a variable inter-trial interval ranging from 1250 to 1750
milliseconds. Next, a circle appeared on either the right or the left side (4.23 centimeters) of
fixation until response was made for a maximum of 1500 milliseconds. The circle had a diameter
of 2.11 centimeters and was either green or blue. Each color was associated with a left or right
response key. When the color of the circle was presented on the same side as the associated
response button (e.g., the green circle that required a left response appeared on the left side of
the fixation cross), the trial was considered compatible. When the color of the circle was
presented on the non-associated side (e.g., the green circle that required a left response appeared
on the right side of the fixation cross), the trial was considered incompatible. Four experimental
blocks of 60 trials each were preceded by two practice blocks during which participants could
familiarize with the task. The first practice block consisted of 30 only compatible trials. The
second practice block consisted of a mixture of 60 compatible and incompatible trials. As
participants had difficulties to memorize the color-response association, two colored cues were
provided in concordance with the color-response mapping. Color and response side were
counterbalanced across trials resulting in an equal probability of compatible and incompatible
trials. Hence, each participant was presented with 120 compatible and 120 incompatible trials.
Also, the color-response mappings were counterbalanced across participants (i.e. half of the
participants associated the green circle with the left response button and the blue circle with the
right response button; the other half associated the blue circle with the left response button and
the green circle with the right response button). Mean difference in reaction time between
compatible and incompatible trials constituted the dependent variable.

108 | Chapter 5
Choice reaction time (CRT) task
Participants performed a simple CRT task which was an adapted version of the employed Simon
task. A fixation cross (0.90 centimeters) was presented at the center of the screen for a variable
inter-trial interval ranging from 1250 to 1750 milliseconds. Next, a circle appeared in the middle
of the screen, on fixation, until response was made for a maximum of 1000 milliseconds. The
circle had a diameter of 2.11 centimeters and was either green or blue. Each color was associated
with a left or right response key. Color-response associations were counterbalanced; two colored
cues were again provided to facilitate color-response mapping. One experimental block of 60
trials was preceded by a short practice block of 20 trials. Mean reaction time on correct responses
constituted the dependent variable.
Chapter 6
Reactive and proactive interference control in adults with
autism spectrum disorder across the lifespan
Lever, A. G., Ridderinkhof, K. R., Marsman, M., & Geurts, H. M. (2016). Reactive and proactive
interference control in adults with autism spectrum disorder across the lifespan. Manuscript under
review.
110 | Chapter 6
ABSTRACT
As a large heterogeneity is observed across studies on interference control in autism spectrum
disorder (ASD), research may benefit from the use of a cognitive framework that models specific
processes underlying reactive and proactive control of interference. We administered a Simon
conflict task in two independent adult samples and applied distributional analyses to examine
temporal dynamics of interference control in ASD. Along comparable interference effects in
both reactive and proactive control, young adult males (n=23, 18-36 years) diagnosed with ASD
made as many fast errors on conflict trials as neurotypical controls (n=19) and showed similar
suppression on slow responses (Study 1). However, over the adult lifespan (19-79 years),
individuals with ASD (n=118) made fewer fast errors on conflict trials, and had overall slower
and more accurate responses than controls (n=160) (Study 2). These results converge to the idea
that individuals with ASD adopt a more cautious response bias over the adult lifespan, which is
not yet observed among young adults. Our findings suggest that it is fruitful to distinguish
different processes involved in interference control and contribute to an increased understanding
of interference control mechanisms in adults with ASD.
Keywords: autism spectrum disorder, response inhibition, aging, reactive and proactive
interference control, conflict adaptation
Reactive and proactive control in ASD | 111
INTRODUCTION
Autism spectrum disorder (ASD) is a heterogeneous, neurodevelopmental disorder that is
thought to last a lifetime (American Psychiatric Association, 2000; American Psychiatric
Association, 2013). Core symptoms of ASD include qualitative impairments in social
communication and social interaction, and restricted, repetitive patterns of behavior, interests,
or activities. ASD is also associated with difficulties in cognitive control (Solomon et al., 2008).
Cognitive control refers to those processes that allow for monitoring and regulating goal-directed
behavior in order to flexibly adapt behavior to environmental requirements (Botvinick et al.,
2001). Inhibition is such a cognitive control process. It refers to the mechanism or set of
processes that result in the containment of prepotent behavioral responses when such responses
are reflex-like, premature, inappropriate or incorrect (Ridderinkhof, van den Wildenberg,
Segalowitz, & Carter, 2004). A lack of inhibitory control is thought to underlie some of the core
symptoms observed in ASD (Lopez et al., 2005). A recent meta-analysis indicated that
individuals with ASD were moderately impaired on inhibitory control, but substantial
heterogeneity across studies was observed (Geurts et al., 2014). The use of rather crude measures,
such as mean reaction time, common in the ASD cognitive control literature, was suggested to
be one of the major reasons for this heterogeneity. Therefore, more fine grained models of
specific aspects of cognitive control are needed to better understand the stages in which
difficulties are or are not encountered by individuals with ASD. In this study, we will use the
theoretical framework of the dual-route model (Kornblum et al., 1990) and its extension, the
activation-suppression hypothesis (Ridderinkhof, 2002), to test whether individuals with ASD
have difficulties in the underlying mechanisms of interference control.
Interference control, or resistance to distractor interference, is a specific aspect of the
multifaceted nature of inhibition (Friedman & Miyake, 2004; Nigg, 2000). It refers to the ability
to suppress irrelevant information and is often measured with conflict tasks, such as the Eriksen
flanker task (Eriksen & Eriksen, 1974) or the Simon task (Simon, 1969). In these tasks, a conflict
is induced between two types of responses: an automatically activated response, which is driven
by a task-irrelevant stimulus feature (e.g., spatial location in the Simon task), and a deliberate
response, which is driven by a task-relevant stimulus feature (e.g., color in the Simon task). The
source triggering interference may vary across conflict tasks. For example, the Eriksen flanker
task elicits interference at the both level of stimulus and response dimension, while interference
in the Simon task is induced by only response conflict (Egner, 2007; van den Wildenberg et al.,
2010).
112 | Chapter 6
Interference control in ASD
The existing literature on interference control in ASD is rather inconsistent, with some studies
demonstrating impairments among individuals with ASD (Adams & Jarrold, 2012; Christ et al.,
2007; Christ et al., 2011; Henderson et al., 2006), and others showing no differences between
individuals with ASD and typically developing controls (Geurts et al., 2008; Larson et al., 2012;
Schmitz et al., 2006; Solomon et al., 2008; Solomon et al., 2009). The adherence of findings in a
recent meta-analysis point to the idea of interference difficulties in ASD (Geurts et al., 2014).
However, the question whether or not individuals with ASD present interference control
difficulties is based on the assumption that interference control is a coherent, unified process,
while we know from the cognitive control literature that it is not (Ridderinkhof, Forstmann,
Wylie, Burle, & van den Wildenberg, 2011). According to Geurts et al. (2014), more elaborate
models of cognitive control should, therefore, be applied in order to attempt to disentangle
which underlying processes contribute to an overall decrease in performance (see also Solomon
et al., 2008; Solomon et al., 2009; Solomon et al., 2014, for such an application). In this study,
we will entertain one such more elaborate model, a variety of dual-process models, and the
specific techniques associated with each component process, as detailed below.
Proactive and reactive control
Dual-process models provide an account to explain interference control in conflict tasks (De
Jong, Liang, & Lauber, 1994; Kornblum et al., 1990; Ridderinkhof, van der Molen, & Bashore,
1995) by assuming that stimulus information is processed along two separate pathways: a direct
reflex-like route and a more deliberate route. While along the first route, information is rapidly
and semi-automatically processed and directly activates a response, the second route involves
deliberate decision processes and takes more time to build up. In case of the Simon task, the
spatial location of the stimulus, although irrelevant, directly activates the corresponding spatial
response via the direct reflex-like route. The relevant stimulus feature (e.g., color) is processed
along the deliberate route to correctly translate the stimulus-response mapping based on task
instructions. On congruent trials, the irrelevant stimulus feature (i.e., spatial location), activating
the direct route, and relevant stimulus feature (i.e., color), activating the deliberate route,
converge at the level of response activation, leading to fast and accurate responses. On
incongruent trials, the irrelevant and relevant stimulus features do not correspond and cause
interference, leading to slower and less accurate responses.
Although the mean interference or congruency or Simon effect (i.e., the difference in
reaction time and accuracy between congruent and incongruent trials) is a useful measure to
reflect the additional time and demands required to solve interference, it does not capture the
Reactive and proactive control in ASD | 113
temporal dynamics of information processing that are involved in conflict situations (see van
den Wildenberg et al., 2010). The activation-suppression hypothesis provides an explicit account
to explain these temporal aspects. According to this hypothesis, the activation of the response
associated with the irrelevant stimulus feature via the direct route can be selectively inhibited by
the deliberate route, but this process needs time to build up and is, therefore, only efficient after
some time (Ridderinkhof, 2002). Several predictions follow from these assumptions. First, fast
responses on incongruent trials do not benefit from the selective inhibition process as there is
not enough time to build it up, resulting in a large number of fast errors. Second, as slow
responses on incongruent trials do have this advantage, these are associated with more accurate
responses. Third, even though congruent trials have faster and more accurate responses than
incongruent trials, these responses become slower and more error-prone when intervals are
longer, due to the activation of the suppression process that tends to inhibit the correct response.
Congruent trials will, thus, benefit from faster responses, whereas their facilitation is reduced on
slower responses. In contrast, incongruent trials are facilitated on slower responses. As a result,
the interference effect is more affected by selective response inhibition on slow trials than on
fast trials (van den Wildenberg et al., 2010).
These predictions can be examined with a related analytical technique that, thus, allows
to study the temporal dynamics underlying the manifestation of fast, impulsive errors and its
subsequent build-up of selective response suppression (Ridderinkhof, 2002). We focus on two
types of these distributional analyses: conditional accuracy functions (CAFs) and delta plots.
CAFs provide a way to study automatic response capture by plotting accuracy data as a function
of the entire RT distribution. Typically, CAFs reveal a high number of errors on fast RTs on
incongruent trails, indicating strong automatic response capture in conflicting situations. Delta
plots provide a graphical representation of response suppression by plotting RT differences
between congruent and incongruent trials (i.e., the Simon effect) as a function of the entire RT
distribution. Typically, delta plots reveal a reduction of the Simon effect on slower RTs,
eventually even becoming negative, indicating efficient response suppression as an act of top-
down control.
The function of detecting and solving interference after the occurrence of a conflict
situation within the same trial, including the mechanisms of selective response suppression, is
often designated as within-trial or reactive control. It relies upon the transient activation of the
lateral prefrontal cortex, in combination with a more extensive network of other brain regions
(Braver, 2012; Ridderinkhof et al., 2011). After such a conflict situation, one can also decide to
adjust behavioral settings before the next trial in order to anticipate and prevent interference
before it occurs. This mechanism is called between-trial or proactive control and involves the use
114 | Chapter 6
of goal-relevant information to bias attention, perception, and action systems. It relies upon
sustained activation of the lateral prefrontal cortex (Braver, 2012). As a result of this proactive
control mechanism, interference effects on RT and accuracy are typically reduced when current
trials are preceded by conflict (i.e., incongruent) trials. More specifically, when a congruent trial
is followed by another congruent trial, responses are typically fast and accurate, whereas when a
congruent trial is followed by an incongruent trial, responses are slower and error prone due to
a low level of control. After an incongruent trial, however, control is enhanced, resulting in a
smaller difference in RTs or errors between current congruent or incongruent trials, and, hence,
a smaller interference effect. This effect is called the Gratton effect (Gratton, Coles, & Donchin,
1992), conflict adjustment effect (Botvinick et al., 2001), or congruency sequence effect (CSE)
(Egner, 2007). We will refer to the CSE effect since this is a theory-neutral, operational term.
Reactive and proactive control in ASD
Although reactive and proactive control, as described above, have been investigated among
clinical groups, such as Attention Deficit Hyperactivity Disorder (ADHD) (Ridderinkhof,
Scheres, Oosterlaan, & Sergeant, 2005), mild cognitive impairment (Wylie, Ridderinkhof,
Eckerle, & Manning, 2007), and Parkinson’s disease (e.g., Wylie, Ridderinkhof, Bashore, & van
den Wildenberg, 2010), only a handful of studies examined these mechanisms among individuals
with ASD. For example, Solomon and colleagues (2014) investigated the neural substrates
underlying reactive and proactive control. Given that adolescents with ASD recruited brain
regions associated with reactive control – anterior cingulate cortex and ventrolateral prefrontal
cortex – rather than with proactive control – lateral prefrontal cortex – during a prepotent
response task, they concluded that individuals with ASD prefer to rely on reactive rather than
proactive control (Solomon et al., 2014). Nevertheless, at a behavior level, the authors only used
a measure of reactive control and it is thus unclear whether these individuals with ASD showed
intact or deficient congruency sequence effects. In an adapted version of the Eriksen flanker
task, children and adolescents with ASD did not seem to show behaviorally deviant conflict
monitoring and adaptation effects (i.e., CSE), even though the neural processes underlying the
detection and resolution of conflict were altered (Larson et al., 2012). Similar CSEs among
individuals with and without ASD were also found when using social-emotional stimuli to induce
conflict (Worsham, Gray, Larson, & South, 2015). Yet, despite these interesting findings, studies
on temporal dynamics of interference control processes among individuals with ASD are lacking.
Reactive and proactive control in ASD | 115
Present study
In sum, in the current paper, we rely on the above-described accounts in order to have a
conceptual and more fine-grained model of cognitive control that may capture and explain the
ASD-related heterogeneity observed in interference control. We present two studies in which
we investigate reactive and proactive control and the temporal dynamics of interference control
processes among individuals with ASD. Automatic response capture and deliberate response
suppression during reactive control are compared between individuals with and without ASD.
In the first study, we examine these underlying cognitive control mechanisms in a group of adults
between 18 and 36 years old. Based on previous findings, we expect to observe deviant
interference control during reactive control processes (Geurts et al., 2014), but an intact CSE
(Larson et al., 2012; Worsham et al., 2015). In absence of literature on response capture and
selective response suppression in ASD, we do not have a specific prediction on this regard. In
the second study, we aim to validate the results of Study 1 in an independent sample composed
of adults between 20 and 79 years in which we additionally examine the effect of age on
interference control in ASD.
STUDY 1
METHODS STUDY 1
Participants
Twenty-four males aged 18-36 years with a clinical ASD diagnosis according to DSM-IV-TR
criteria (American Psychiatric Association, 2000) determined by a multidisciplinary team, were
recruited through the Dr. Leo Kannerhuis, a specialized autism clinic in the Netherlands, and by
advertisements on the website of the Dutch Autism Association. Twenty age-matched males
without an ASD were recruited among acquaintances of Dr. Leo Kannerhuis employees and
formed the comparison group (COM). All non-ASD participants scored below 26 on the
Autism-spectrum Quotient (AQ) (Baron-Cohen et al., 2001). Individuals with an estimated IQ
below 80 were excluded, which resulted in the exclusion of one COM participant. Due to a stress
reaction, one ASD participant was not able to finalize the Simon task and was, therefore,
excluded from further analyses.
As these adults participated in a study assessing autonomic and endocrine activity
(Smeekens, Didden, & Verhoeven, 2013), the following exclusion criteria were also applied:
cardiac disease and complaints, respiratory problems, liver- and/or kidney failure, use of beta-
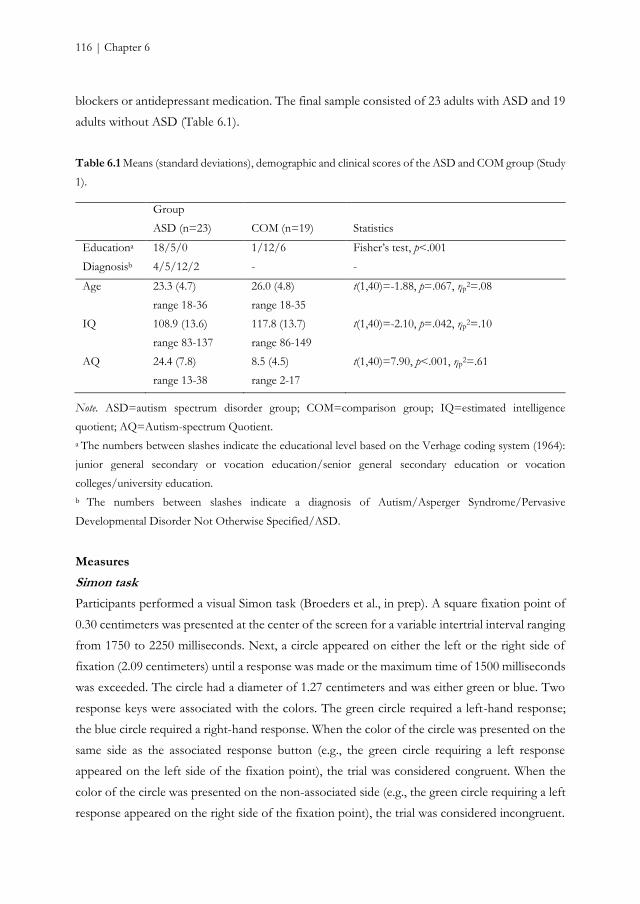
116 | Chapter 6
blockers or antidepressant medication. The final sample consisted of 23 adults with ASD and 19
adults without ASD (Table 6.1).
Table 6.1 Means (standard deviations), demographic and clinical scores of the ASD and COM group (Study
1).
Group
ASD (n=23) COM (n=19) Statistics
Educationa 18/5/0 1/12/6 Fisher’s test, p<.001
Diagnosisb 4/5/12/2 - -
Age 23.3 (4.7)
range 18-36
26.0 (4.8)
range 18-35
t(1,40)=-1.88, p=.067, ηp2=.08
IQ 108.9 (13.6)
range 83-137
117.8 (13.7)
range 86-149
t(1,40)=-2.10, p=.042, ηp2=.10
AQ 24.4 (7.8)
range 13-38
8.5 (4.5)
range 2-17
t(1,40)=7.90, p<.001, ηp2=.61
Note. ASD=autism spectrum disorder group; COM=comparison group; IQ=estimated intelligence
quotient; AQ=Autism-spectrum Quotient.
a The numbers between slashes indicate the educational level based on the Verhage coding system (1964):
junior general secondary or vocation education/senior general secondary education or vocation
colleges/university education.
b The numbers between slashes indicate a diagnosis of Autism/Asperger Syndrome/Pervasive
Developmental Disorder Not Otherwise Specified/ASD.
Measures
Simon task
Participants performed a visual Simon task (Broeders et al., in prep). A square fixation point of
0.30 centimeters was presented at the center of the screen for a variable intertrial interval ranging
from 1750 to 2250 milliseconds. Next, a circle appeared on either the left or the right side of
fixation (2.09 centimeters) until a response was made or the maximum time of 1500 milliseconds
was exceeded. The circle had a diameter of 1.27 centimeters and was either green or blue. Two
response keys were associated with the colors. The green circle required a left-hand response;
the blue circle required a right-hand response. When the color of the circle was presented on the
same side as the associated response button (e.g., the green circle requiring a left response
appeared on the left side of the fixation point), the trial was considered congruent. When the
color of the circle was presented on the non-associated side (e.g., the green circle requiring a left
response appeared on the right side of the fixation point), the trial was considered incongruent.
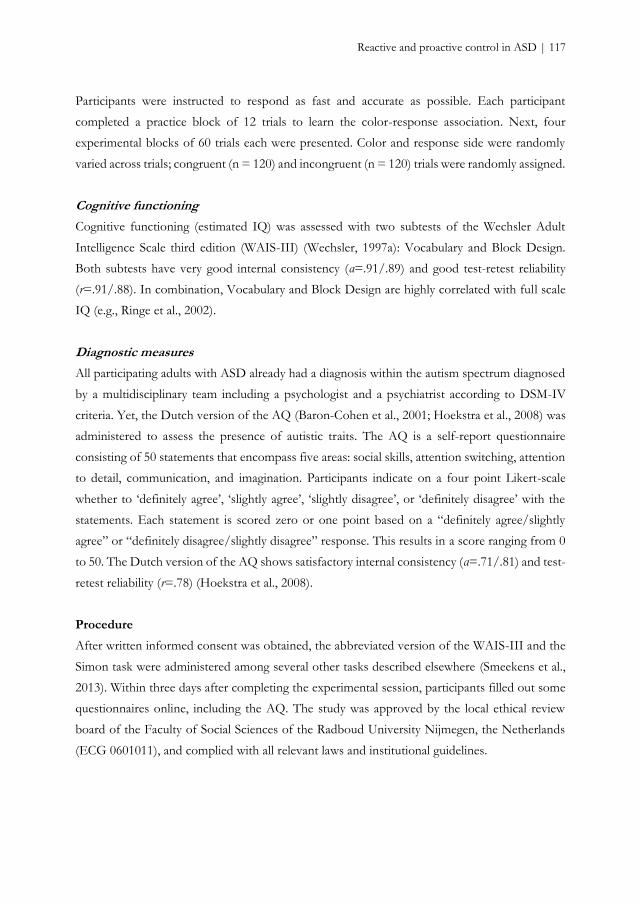
Reactive and proactive control in ASD | 117
Participants were instructed to respond as fast and accurate as possible. Each participant
completed a practice block of 12 trials to learn the color-response association. Next, four
experimental blocks of 60 trials each were presented. Color and response side were randomly
varied across trials; congruent (n = 120) and incongruent (n = 120) trials were randomly assigned.
Cognitive functioning
Cognitive functioning (estimated IQ) was assessed with two subtests of the Wechsler Adult
Intelligence Scale third edition (WAIS-III) (Wechsler, 1997a): Vocabulary and Block Design.
Both subtests have very good internal consistency (α=.91/.89) and good test-retest reliability
(r=.91/.88). In combination, Vocabulary and Block Design are highly correlated with full scale
IQ (e.g., Ringe et al., 2002).
Diagnostic measures
All participating adults with ASD already had a diagnosis within the autism spectrum diagnosed
by a multidisciplinary team including a psychologist and a psychiatrist according to DSM-IV
criteria. Yet, the Dutch version of the AQ (Baron-Cohen et al., 2001; Hoekstra et al., 2008) was
administered to assess the presence of autistic traits. The AQ is a self-report questionnaire
consisting of 50 statements that encompass five areas: social skills, attention switching, attention
to detail, communication, and imagination. Participants indicate on a four point Likert-scale
whether to ‘definitely agree’, ‘slightly agree’, ‘slightly disagree’, or ‘definitely disagree’ with the
statements. Each statement is scored zero or one point based on a “definitely agree/slightly
agree” or “definitely disagree/slightly disagree” response. This results in a score ranging from 0
to 50. The Dutch version of the AQ shows satisfactory internal consistency (α=.71/.81) and test-
retest reliability (r=.78) (Hoekstra et al., 2008).
Procedure
After written informed consent was obtained, the abbreviated version of the WAIS-III and the
Simon task were administered among several other tasks described elsewhere (Smeekens et al.,
2013). Within three days after completing the experimental session, participants filled out some
questionnaires online, including the AQ. The study was approved by the local ethical review
board of the Faculty of Social Sciences of the Radboud University Nijmegen, the Netherlands
(ECG 0601011), and complied with all relevant laws and institutional guidelines.
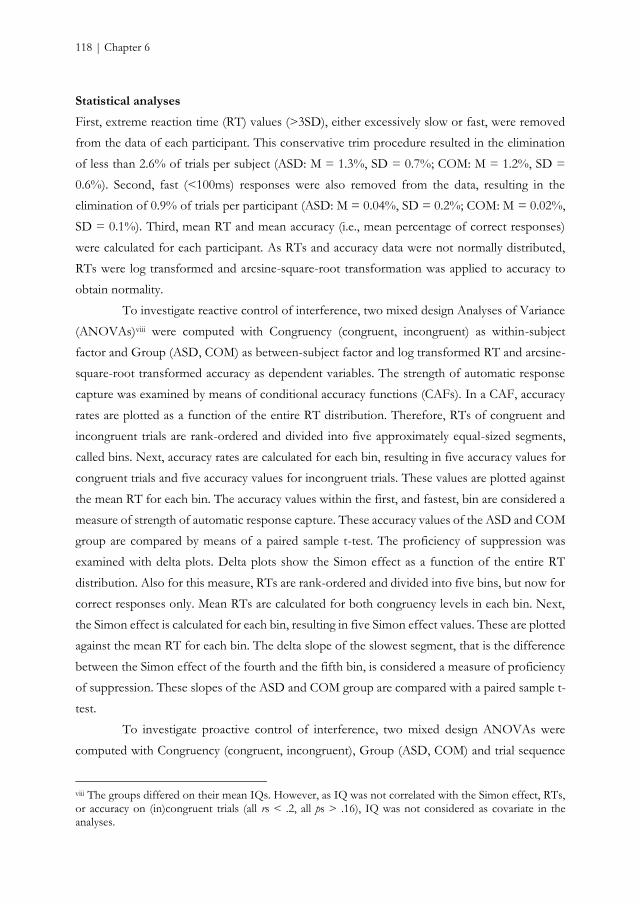
118 | Chapter 6
Statistical analyses
First, extreme reaction time (RT) values (>3SD), either excessively slow or fast, were removed
from the data of each participant. This conservative trim procedure resulted in the elimination
of less than 2.6% of trials per subject (ASD: M = 1.3%, SD = 0.7%; COM: M = 1.2%, SD =
0.6%). Second, fast (<100ms) responses were also removed from the data, resulting in the
elimination of 0.9% of trials per participant (ASD: M = 0.04%, SD = 0.2%; COM: M = 0.02%,
SD = 0.1%). Third, mean RT and mean accuracy (i.e., mean percentage of correct responses)
were calculated for each participant. As RTs and accuracy data were not normally distributed,
RTs were log transformed and arcsine-square-root transformation was applied to accuracy to
obtain normality.
To investigate reactive control of interference, two mixed design Analyses of Variance
(ANOVAs)viii were computed with Congruency (congruent, incongruent) as within-subject
factor and Group (ASD, COM) as between-subject factor and log transformed RT and arcsine-
square-root transformed accuracy as dependent variables. The strength of automatic response
capture was examined by means of conditional accuracy functions (CAFs). In a CAF, accuracy
rates are plotted as a function of the entire RT distribution. Therefore, RTs of congruent and
incongruent trials are rank-ordered and divided into five approximately equal-sized segments,
called bins. Next, accuracy rates are calculated for each bin, resulting in five accuracy values for
congruent trials and five accuracy values for incongruent trials. These values are plotted against
the mean RT for each bin. The accuracy values within the first, and fastest, bin are considered a
measure of strength of automatic response capture. These accuracy values of the ASD and COM
group are compared by means of a paired sample t-test. The proficiency of suppression was
examined with delta plots. Delta plots show the Simon effect as a function of the entire RT
distribution. Also for this measure, RTs are rank-ordered and divided into five bins, but now for
correct responses only. Mean RTs are calculated for both congruency levels in each bin. Next,
the Simon effect is calculated for each bin, resulting in five Simon effect values. These are plotted
against the mean RT for each bin. The delta slope of the slowest segment, that is the difference
between the Simon effect of the fourth and the fifth bin, is considered a measure of proficiency
of suppression. These slopes of the ASD and COM group are compared with a paired sample t-
test.
To investigate proactive control of interference, two mixed design ANOVAs were
computed with Congruency (congruent, incongruent), Group (ASD, COM) and trial sequence
viii The groups differed on their mean IQs. However, as IQ was not correlated with the Simon effect, RTs, or accuracy on (in)congruent trials (all rs < .2, all ps > .16), IQ was not considered as covariate in the analyses.
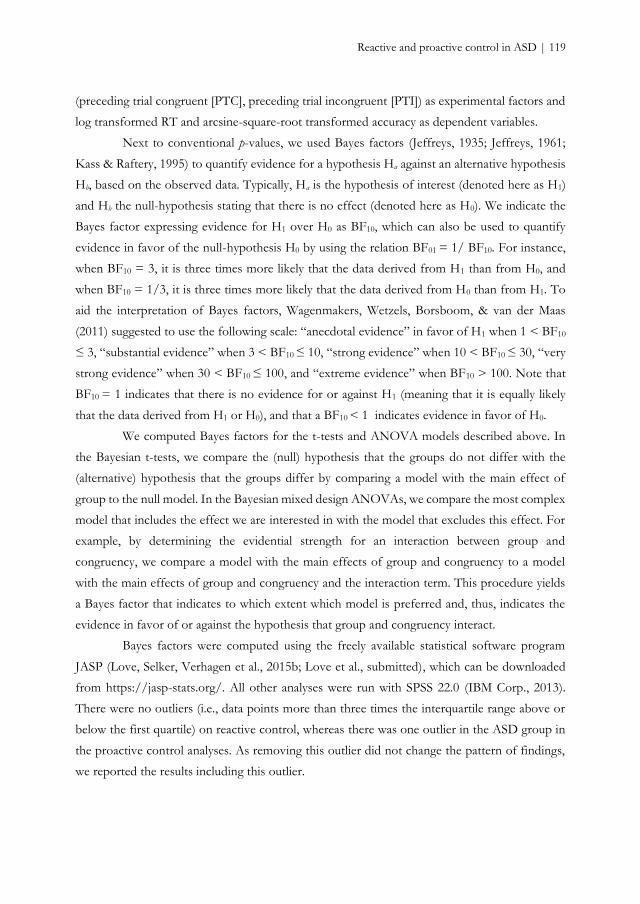
Reactive and proactive control in ASD | 119
(preceding trial congruent [PTC], preceding trial incongruent [PTI]) as experimental factors and
log transformed RT and arcsine-square-root transformed accuracy as dependent variables.
Next to conventional p-values, we used Bayes factors (Jeffreys, 1935; Jeffreys, 1961;
Kass & Raftery, 1995) to quantify evidence for a hypothesis Ha against an alternative hypothesis
Hb, based on the observed data. Typically, Ha is the hypothesis of interest (denoted here as H1)
and Hb the null-hypothesis stating that there is no effect (denoted here as H0). We indicate the
Bayes factor expressing evidence for H1 over H0 as BF10, which can also be used to quantify
evidence in favor of the null-hypothesis H0 by using the relation BF01 = 1/ BF10. For instance,
when BF10 = 3, it is three times more likely that the data derived from H1 than from H0, and
when BF10 = 1/3, it is three times more likely that the data derived from H0 than from H1. To
aid the interpretation of Bayes factors, Wagenmakers, Wetzels, Borsboom, & van der Maas
(2011) suggested to use the following scale: “anecdotal evidence” in favor of H1 when 1 < BF10
≤ 3, “substantial evidence” when 3 < BF10 ≤ 10, “strong evidence” when 10 < BF10 ≤ 30, “very
strong evidence” when 30 < BF10 ≤ 100, and “extreme evidence” when BF10 > 100. Note that
BF10 = 1 indicates that there is no evidence for or against H1 (meaning that it is equally likely
that the data derived from H1 or H0), and that a BF10 < 1 indicates evidence in favor of H0.
We computed Bayes factors for the t-tests and ANOVA models described above. In
the Bayesian t-tests, we compare the (null) hypothesis that the groups do not differ with the
(alternative) hypothesis that the groups differ by comparing a model with the main effect of
group to the null model. In the Bayesian mixed design ANOVAs, we compare the most complex
model that includes the effect we are interested in with the model that excludes this effect. For
example, by determining the evidential strength for an interaction between group and
congruency, we compare a model with the main effects of group and congruency to a model
with the main effects of group and congruency and the interaction term. This procedure yields
a Bayes factor that indicates to which extent which model is preferred and, thus, indicates the
evidence in favor of or against the hypothesis that group and congruency interact.
Bayes factors were computed using the freely available statistical software program
JASP (Love, Selker, Verhagen et al., 2015b; Love et al., submitted), which can be downloaded
from https://jasp-stats.org/. All other analyses were run with SPSS 22.0 (IBM Corp., 2013).
There were no outliers (i.e., data points more than three times the interquartile range above or
below the first quartile) on reactive control, whereas there was one outlier in the ASD group in
the proactive control analyses. As removing this outlier did not change the pattern of findings,
we reported the results including this outlier.
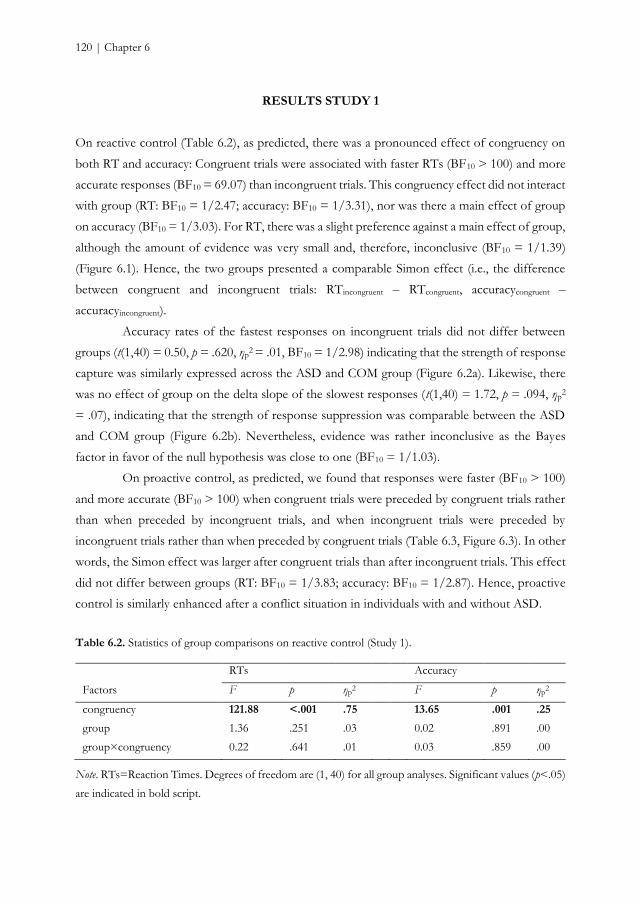
120 | Chapter 6
RESULTS STUDY 1
On reactive control (Table 6.2), as predicted, there was a pronounced effect of congruency on
both RT and accuracy: Congruent trials were associated with faster RTs (BF10 > 100) and more
accurate responses (BF10 = 69.07) than incongruent trials. This congruency effect did not interact
with group (RT: BF10 = 1/2.47; accuracy: BF10 = 1/3.31), nor was there a main effect of group
on accuracy (BF10 = 1/3.03). For RT, there was a slight preference against a main effect of group,
although the amount of evidence was very small and, therefore, inconclusive (BF10 = 1/1.39)
(Figure 6.1). Hence, the two groups presented a comparable Simon effect (i.e., the difference
between congruent and incongruent trials: RTincongruent – RTcongruent, accuracycongruent –
accuracyincongruent).
Accuracy rates of the fastest responses on incongruent trials did not differ between
groups (t(1,40) = 0.50, p = .620, ηp2 = .01, BF10 = 1/2.98) indicating that the strength of response
capture was similarly expressed across the ASD and COM group (Figure 6.2a). Likewise, there
was no effect of group on the delta slope of the slowest responses (t(1,40) = 1.72, p = .094, ηp2
= .07), indicating that the strength of response suppression was comparable between the ASD
and COM group (Figure 6.2b). Nevertheless, evidence was rather inconclusive as the Bayes
factor in favor of the null hypothesis was close to one (BF10 = 1/1.03).
On proactive control, as predicted, we found that responses were faster (BF10 > 100)
and more accurate (BF10 > 100) when congruent trials were preceded by congruent trials rather
than when preceded by incongruent trials, and when incongruent trials were preceded by
incongruent trials rather than when preceded by congruent trials (Table 6.3, Figure 6.3). In other
words, the Simon effect was larger after congruent trials than after incongruent trials. This effect
did not differ between groups (RT: BF10 = 1/3.83; accuracy: BF10 = 1/2.87). Hence, proactive
control is similarly enhanced after a conflict situation in individuals with and without ASD.
Table 6.2. Statistics of group comparisons on reactive control (Study 1).
RTs Accuracy
Factors F p ηp2 F p ηp
2
congruency 121.88 <.001 .75 13.65 .001 .25
group 1.36 .251 .03 0.02 .891 .00
group×congruency 0.22 .641 .01 0.03 .859 .00
Note. RTs=Reaction Times. Degrees of freedom are (1, 40) for all group analyses. Significant values (p<.05)
are indicated in bold script.
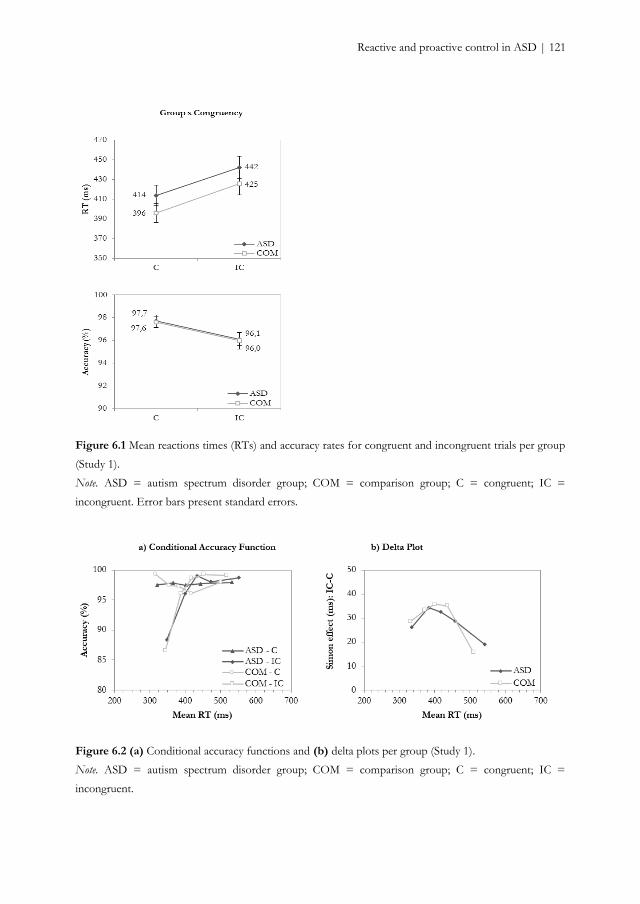
Reactive and proactive control in ASD | 121
Figure 6.1 Mean reactions times (RTs) and accuracy rates for congruent and incongruent trials per group
(Study 1).
Note. ASD = autism spectrum disorder group; COM = comparison group; C = congruent; IC =
incongruent. Error bars present standard errors.
Figure 6.2 (a) Conditional accuracy functions and (b) delta plots per group (Study 1).
Note. ASD = autism spectrum disorder group; COM = comparison group; C = congruent; IC =
incongruent.
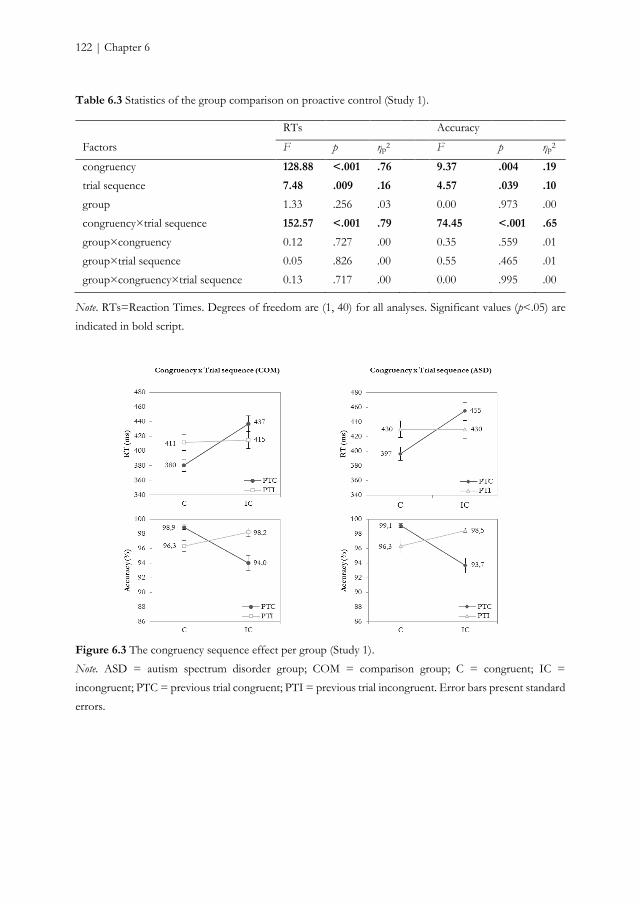
122 | Chapter 6
Table 6.3 Statistics of the group comparison on proactive control (Study 1).
RTs Accuracy
Factors F p ηp2 F p ηp
2
congruency 128.88 <.001 .76 9.37 .004 .19
trial sequence 7.48 .009 .16 4.57 .039 .10
group 1.33 .256 .03 0.00 .973 .00
congruency×trial sequence 152.57 <.001 .79 74.45 <.001 .65
group×congruency 0.12 .727 .00 0.35 .559 .01
group×trial sequence 0.05 .826 .00 0.55 .465 .01
group×congruency×trial sequence 0.13 .717 .00 0.00 .995 .00
Note. RTs=Reaction Times. Degrees of freedom are (1, 40) for all analyses. Significant values (p<.05) are
indicated in bold script.
Figure 6.3 The congruency sequence effect per group (Study 1).
Note. ASD = autism spectrum disorder group; COM = comparison group; C = congruent; IC =
incongruent; PTC = previous trial congruent; PTI = previous trial incongruent. Error bars present standard
errors.
Reactive and proactive control in ASD | 123
DISCUSSION STUDY 1
In line with earlier clinical studies (Ridderinkhof et al., 2005; Wylie et al., 2007; Wylie et al., 2010),
we applied distributional techniques, designed to test the activation-suppression hypothesis
(Ridderinkhof, 2002), and examined CSEs to study the underlying mechanisms of interference
control in ASD. With regard to reactive control, Study 1 demonstrated that the congruency effect
elicited by conflict and the number of fast errors on incongruent trials was comparable among
young adults with and without ASD. Fast responses on incongruent trials are prone to errors as
they activate a direct reflex-like route that leads to the activation of the incorrect response and
are considered a measure of automatic response capture (Ridderinkhof, 2002). Furthermore, the
deliberate suppression of responses by means of the deliberate route, revealed by a reduction of
the Simon effect on slow responses (van den Wildenberg et al., 2010), was similar in individuals
with ASD and controls.
Study 1 also indicated that the proactive mechanism adopted to detect and adjust
behavior in reaction to conflict situations seems to be intact in individuals with ASD. As in
typically developing adults (Botvinick et al., 2001; Egner, 2007; Gratton et al., 1992), we observed
a reduced interference effect after incongruent trials compared to congruent trials, indicating
enhanced cognitive control after conflict. This behavioral result is in line with previous studies
in ASD (Larson et al., 2012; Worsham et al., 2015).
Hence, we demonstrated in Study 1 similar reactive and proactive interference control
abilities in young adults with ASD compared to those without ASD. Despite that the exploratory
Bayesian analyses show support for these frequentist results as they indicate some evidence
against H1 (i.e., a group effect), the amount of evidence ranges from small (BF10 ≤ 1/3.83) to no
evidence at all (BF10 ≤ 1/1.03). In addition, there are some potential methodological caveats
suggesting that we need to be careful in making strong claims based on this single study.
First, although the task we used has proven its validity in a sample of Parkinson disease
patients (e.g., Broeders et al., in prep), it was not yet administered to individuals with ASD. The
interstimulus interval of the Simon task had a rather long duration and the colored circles
appeared close to the fixation point. Adults with ASD are sensitive to event presentation rate,
showing similar performances on slow or medium event rate, but decreased performance on fast
event rates (Raymaekers, van der Meere, & Roeyers, 2004). Moreover, Adams and Jarrold (2012)
showed that increasing size of the target and increasing distance between distractors in a Flanker
task reduced the interference effect in typically developing controls, but not in children with
ASD. Also in the Simon task, increasing the distance between fixation and the stimulus (i.e., a
larger eccentricity) reduced the Simon effect (Hommel, 1993). If individuals with ASD are less
124 | Chapter 6
sensitive to distractor salience, than they should demonstrate a larger interference effect
compared to controls when distractor salience is large. These observations suggest that
diminishing the interstimulus interval and increasing the stimulus-fixation distance should
facilitate finding an effect between individuals with and without ASD when difficulties in
interference control indeed exists in ASD. Therefore, we changed these parameters of the Simon
task in a second study.
Second, only 12 practice trials were administered before starting the test session. This
small number may suffice to acquaint the participants with the global properties of the task, but
perhaps not to train them to attain asymptote reaction times, in particular when responding to
incongruent stimuli.
Third, the low number of self-reported ASD traits caught our attention. It may indicate
that the ASD participants presented mild symptoms, which could be a potential argument for
absent interference control deficits, but it also may illustrate poor introspection (see Frith, 2004).
As these AQ scores did not deviate from those previously reported by participants with the same
mean age (Bishop & Seltzer, 2012; Ketelaars et al., 2008; Kurita, Koyama, & Osada, 2005), it
seems plausible that young adults tend to report low ASD traits. Furthermore, although the
sample consisted of individuals who were diagnosed with ASD by a specialized mental health
institution, their diagnoses were not independently verified by the researchers with a
standardized diagnostic instrument to assess the quality and quantity of current ASD
symptomatology. Therefore, in the second study, we administered one of the most commonly
used instruments in ASD research: the Autism Diagnostic Observation Schedule (ADOS) (Lord
et al., 2000) to assess the current presence of ASD symptoms to validate the clinical diagnosis as
determined by ASD experts.
Finally, despite the observation that age does not seem to be a relevant moderator in
interference control among individuals with ASD (Geurts et al., 2014), only a few studies took
adults with ASD into account and it is, thus, unclear whether the absence of age-related effects
protracts into adulthood. Typically developing adults experience age-related decline in several
cognitive domains (e.g., Friedman et al., 2009; Verhaeghen & Cerella, 2002). Although aging is
not systematically associated with impairments in interference control (Nieuwenhuis et al., 2002;
Wild-Wall, Falkenstein, & Hohnsbein, 2008) and proactive control of interference seems to be
spared (Puccioni & Vallesi, 2012; Yano, 2011), older adults generally show a larger Simon effect
compared to younger adults (see Proctor, Pick, Vu, & Anderson, 2005, for an overview; Van der
Lubbe & Verleger, 2002; Pick & Proctor, 1999; Kawai, Kubo-Kawai, Kubo, Terazawa, &
Masataka, 2012). Whether automatic response capture and deliberate response suppression are
sensitive to age-related differences is yet unknown. Hence, we set out to examine the role of age
Reactive and proactive control in ASD | 125
in interference control processes among individuals with and without ASD across adulthood in
a new experiment, extending the age range of the sample to the adult lifespan.
In sum, to determine whether we can corroborate our null findings in an independent
ASD sample, we conducted Study 2 with an adapted visual Simon task in a larger sample with
an extended age range to investigate also age-related differences in underlying processes of
interference control across adulthood in ASD.
STUDY 2
METHODS STUDY 2
Participants
Individuals between 19 and 79 years with a diagnosis within the autism spectrum according to
DSM-IV criteria (American Psychiatric Association, 2000) were diagnosed by a multidisciplinary
team including a psychologist or psychiatrist and were recruited through several mental health
institutions across the Netherlands and by advertisements on client organization websites. Of
the 168 individuals, 45 were excluded due to (1) the absence of a clinical ASD diagnosis, (2) the
current or former presence of neurological problems (e.g., epilepsy, stroke, cerebral contusion),
schizophrenia or psychoses, (3) a current alcohol- or drugs dependency, or (4) an estimated IQ
below 80. ADOS module 4 (Lord et al., 2000) and AQ (Baron-Cohen et al., 2001) were
administered to verify the participants’ clinical diagnosis. Participants who scored above the
ADOS threshold (≥7) or AQ (≥26) threshold were included in the current study. Of the 39
participants who did not meet the ADOS criterion, only five did also not meet the AQ criterion
and were excluded from further analysis. This resulted in an eligible ASD sample of 118
participants, of whom all completed the Simon task (for a description of the sample, see also
Lever & Geurts, 2015; Lever et al., 2015).
Individuals without ASD were recruited by means of advertisements on the university
website and on social media, and within the social network of the researchers. Of the 193
individuals, 36 were excluded due to (1) the presence of ASD or schizophrenia in close relatives,
(2) a diagnosis of ADHD, (3) the current or former presence of neurological problems (e.g.
epilepsy, stroke, cerebral contusion), schizophrenia or a psychosis, comorbid psychoses or a
history of schizophrenia, (3) a current alcohol- or drugs dependency, or (4) an estimated IQ
below 80. COM participants with an incomplete AQ (≥10% missing values, n=1) or an AQ
score above the threshold proposed for the general population (≥32, n=1; Woodbury-Schmidt
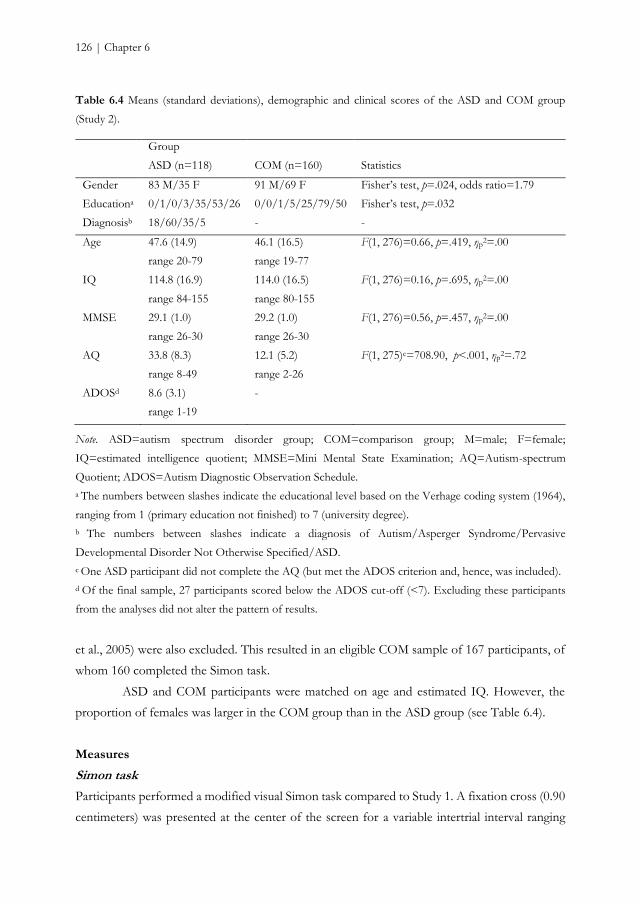
126 | Chapter 6
Table 6.4 Means (standard deviations), demographic and clinical scores of the ASD and COM group
(Study 2).
Group
ASD (n=118) COM (n=160) Statistics
Gender 83 M/35 F 91 M/69 F Fisher’s test, p=.024, odds ratio=1.79
Educationa 0/1/0/3/35/53/26 0/0/1/5/25/79/50 Fisher’s test, p=.032
Diagnosisb 18/60/35/5 - -
Age 47.6 (14.9)
range 20-79
46.1 (16.5)
range 19-77
F(1, 276)=0.66, p=.419, ηp2=.00
IQ 114.8 (16.9)
range 84-155
114.0 (16.5)
range 80-155
F(1, 276)=0.16, p=.695, ηp2=.00
MMSE 29.1 (1.0)
range 26-30
29.2 (1.0)
range 26-30
F(1, 276)=0.56, p=.457, ηp2=.00
AQ 33.8 (8.3)
range 8-49
12.1 (5.2)
range 2-26
F(1, 275)c=708.90, p<.001, ηp2=.72
ADOSd 8.6 (3.1)
range 1-19
-
Note. ASD=autism spectrum disorder group; COM=comparison group; M=male; F=female;
IQ=estimated intelligence quotient; MMSE=Mini Mental State Examination; AQ=Autism-spectrum
Quotient; ADOS=Autism Diagnostic Observation Schedule.
a The numbers between slashes indicate the educational level based on the Verhage coding system (1964),
ranging from 1 (primary education not finished) to 7 (university degree).
b The numbers between slashes indicate a diagnosis of Autism/Asperger Syndrome/Pervasive
Developmental Disorder Not Otherwise Specified/ASD.
c One ASD participant did not complete the AQ (but met the ADOS criterion and, hence, was included).
d Of the final sample, 27 participants scored below the ADOS cut-off (<7). Excluding these participants
from the analyses did not alter the pattern of results.
et al., 2005) were also excluded. This resulted in an eligible COM sample of 167 participants, of
whom 160 completed the Simon task.
ASD and COM participants were matched on age and estimated IQ. However, the
proportion of females was larger in the COM group than in the ASD group (see Table 6.4).
Measures
Simon task
Participants performed a modified visual Simon task compared to Study 1. A fixation cross (0.90
centimeters) was presented at the center of the screen for a variable intertrial interval ranging
Reactive and proactive control in ASD | 127
from 1250 to 1750 milliseconds. Next, a circle (diameter 2.11 centimeters) appeared on either
the right or the left side (4.23 centimeters) of fixation. As in Study 1, the circle was displayed
until response was made for a maximum of 1500 milliseconds and was either green or blue. Also,
each color was associated with a left or right response key and participants were instructed to
respond as fast and accurate as possible. Four experimental blocks were preceded by two practice
blocks, instead of one short practice block in Study 1, during which participants could familiarize
with the task. The first practice block consisted of 30 only congruent trials. The second practice
block consisted of a mixture of 60 congruent and incongruent trials. As participants had
difficulties to memorize the color-response association, two colored cues were provided in
concordance with the color-response mapping. Color and response side were again
counterbalanced across trials resulting in an equal probability of congruent (n = 120) and
incongruent trials (n = 120). In addition, the color-response mappings were counterbalanced
across participants (i.e., half of the participants associated the green circle with the left response
button and the blue circle with the right response button; the other half associated the blue circle
with the left response button and the green circle with the right response button).
Cognitive functioning
Cognitive functioning (estimated IQ) was assessed with two subtests of the WAIS-III (Wechsler,
1997a): Vocabulary and Matrix Reasoning, instead of Block Design in Study 1. Both subtests
have very good international consistency (α=.91/.91) and good test-retest reliability (r=.91/.78).
In combination, Vocabulary and Matrix Reasoning are highly correlated with full scale IQ (e.g.,
Ringe et al., 2002).
Diagnostic measures
The Dutch version of the ADOS Module 4 (de Bildt & de Jonge, 2008; Lord et al., 2000) was
administered to assess the presence of ASD symptoms. The ADOS is a standardized semi-
structured instrument designed for the assessment of ASD. Social interaction, communication,
and play are elicited by means of 10-15 small conversations and activities. A client’s behavior is
observed and scored according to 31 criteria. A subset of criteria is used to compute the
“original” diagnostic algorithm. We used a threshold of 7 for the classification of ASD. The
ADOS was administered and scored by a trained and certified psychologist. Module 4 has
moderate sensitivity (0.61), good specificity (0.82), and good predictive value (0.81) when
administered to high-functioning adults (Bastiaansen et al., 2011).
As in Study 1, the Dutch version of the AQ (Baron-Cohen et al., 2001; Hoekstra et al., 2008)
was administered to assess the presence of autistic traits.
128 | Chapter 6
Procedure
After written informed consent was obtained, participants underwent an extensive screening
during which the ADOS (only ASD participants) and the abbreviated version of the WAIS-III
were administered. A few weeks later, the participants returned for an experimental session,
including the Simon task. As the current study is part of larger project on aging in ASD, more
tasks and questionnaires were administered, but these are described elsewhere (e.g., Lever &
Geurts, 2015; Lever et al., 2015). The order of tasks in the experimental session was
counterbalanced across participants. Travel expenses were refunded up to 20 euros. The study
was approved by the local ethical review board of the Department of Psychology of the
University of Amsterdam, the Netherlands (2011-PN-1952), and complied with all relevant laws
and institutional guidelines.
Statistical analyses
Study 2 used the same procedure to analyze the data as described in Study 1, but gender was
added as a between-subject factor as the ASD and COM group differed on their gender ratio. In
addition, to investigate the effect of age on reactive and proactive control, centered age was
added as a covariate to the mixed design ANOVAs and the interaction between centered age
and group was inspected. Furthermore, we computed step-wise regressions with centered age in
the first step, and group, group-by-centered age, and gender in the second step as predictors on
accuracy of the first bin and on the slowest segment of the delta slope to examine the effect of
age on automatic response capture and suppression, respectively. In addition to the previously
mentioned Bayesian analyses, we ran Bayesian (mixed design) ANCOVAs with centered age as
covariate and Bayesian regressions to assess the evidential strength for the data supporting the
hypothesis of a differential age-related effect in the two groups on reactive and proactive control
by comparing two models, as described in the Methods section of Study 1.
Applying the conservative trim procedure to remove extreme RT values (>3SD)
resulted in the elimination of less than 2.6% trials per subject (ASD: M = 1.2%, SD = 0.6%;
COM: M = 1.1%, SD = 0.5%). Removing fast (<100ms) responses resulted in the elimination
of less than 4.7% of trials per participant (ASD: M = 0.05%, SD = 0.2%; COM: M = 0.1%, SD
= 0.5%). RTs were again log transformed and arcsine-square-root transformation was applied
to accuracy to increase normality.
Again, Bayes factors were computed with JASP (Love et al., 2015b; Love et al.,
submitted), whereas all other analyses were run with SPSS 22.0 (IBM Corp., 2013). As removing
one outlier (i.e., data points more than three times the interquartile range above or below the
first quartile) in the COM group for the reactive control analyses and six outliers (5 COM, 1
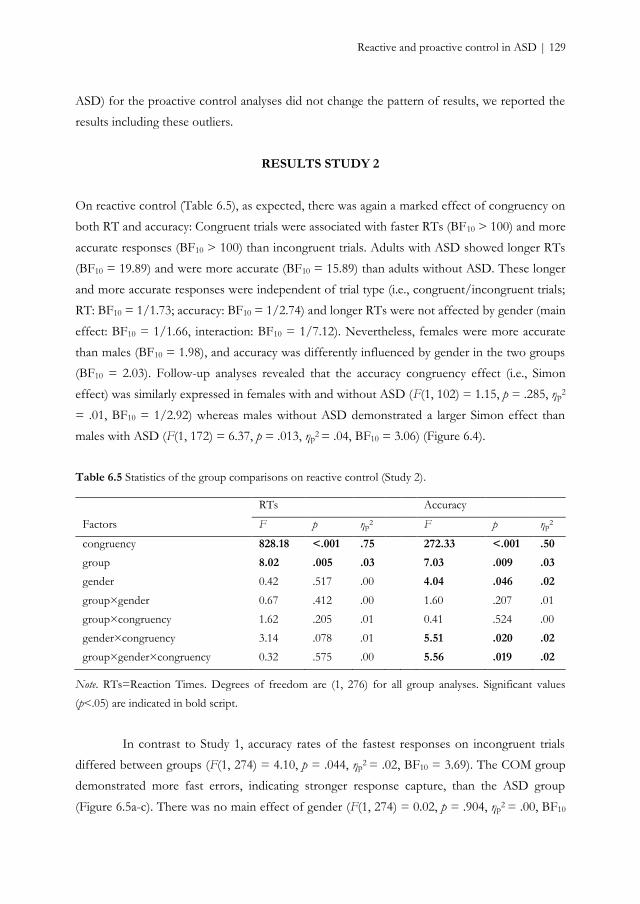
Reactive and proactive control in ASD | 129
ASD) for the proactive control analyses did not change the pattern of results, we reported the
results including these outliers.
RESULTS STUDY 2
On reactive control (Table 6.5), as expected, there was again a marked effect of congruency on
both RT and accuracy: Congruent trials were associated with faster RTs (BF10 > 100) and more
accurate responses (BF10 > 100) than incongruent trials. Adults with ASD showed longer RTs
(BF10 = 19.89) and were more accurate (BF10 = 15.89) than adults without ASD. These longer
and more accurate responses were independent of trial type (i.e., congruent/incongruent trials;
RT: BF10 = 1/1.73; accuracy: BF10 = 1/2.74) and longer RTs were not affected by gender (main
effect: BF10 = 1/1.66, interaction: BF10 = 1/7.12). Nevertheless, females were more accurate
than males (BF10 = 1.98), and accuracy was differently influenced by gender in the two groups
(BF10 = 2.03). Follow-up analyses revealed that the accuracy congruency effect (i.e., Simon
effect) was similarly expressed in females with and without ASD (F(1, 102) = 1.15, p = .285, ηp2
= .01, BF10 = 1/2.92) whereas males without ASD demonstrated a larger Simon effect than
males with ASD (F(1, 172) = 6.37, p = .013, ηp2 = .04, BF10 = 3.06) (Figure 6.4).
Table 6.5 Statistics of the group comparisons on reactive control (Study 2).
RTs Accuracy
Factors F p ηp2 F p ηp
2
congruency 828.18 <.001 .75 272.33 <.001 .50
group 8.02 .005 .03 7.03 .009 .03
gender 0.42 .517 .00 4.04 .046 .02
group×gender 0.67 .412 .00 1.60 .207 .01
group×congruency 1.62 .205 .01 0.41 .524 .00
gender×congruency 3.14 .078 .01 5.51 .020 .02
group×gender×congruency 0.32 .575 .00 5.56 .019 .02
Note. RTs=Reaction Times. Degrees of freedom are (1, 276) for all group analyses. Significant values
(p<.05) are indicated in bold script.
In contrast to Study 1, accuracy rates of the fastest responses on incongruent trials
differed between groups (F(1, 274) = 4.10, p = .044, ηp2 = .02, BF10 = 3.69). The COM group
demonstrated more fast errors, indicating stronger response capture, than the ASD group
(Figure 6.5a-c). There was no main effect of gender (F(1, 274) = 0.02, p = .904, ηp2 = .00, BF10
130 | Chapter 6
= 1/7.11) nor an interaction effect (F(1, 274) = 2.82, p = .095, ηp2 = .01), even though the Bayes
factor of this interaction effect indicates that evidence is inconclusive (BF10 = 1/1.35). The
gradient of the delta slope of the slowest responses was comparable across groups (F(1, 274) =
1.52, p = .219, ηp2 = .01, BF10 = 1/5.07), indicating similar response suppression (Figure 6.5d-f).
Gender did not seem to influence this result (main effect: F(1, 274) = 3.24, p = .073, ηp2 = .01,
BF10 = 1.23 [i.e., is inconclusive]; interaction: F(1, 274) = 1.63, p = .203, ηp2 = .01, BF10 = 1/2.51).
On proactive control, as in Study 1, responses were faster (BF10 > 100) and more
accurate (BF10 > 100) when congruent trials were preceded by congruent trials rather than when
preceded by incongruent trials, and when incongruent trials were preceded by incongruent trials
rather than when preceded by congruent trials (Table 6.6). In other words, the Simon effect was
larger after congruent trials than after incongruent trials. Although this effect was again similar
across groups on RTs (BF10 = 1/4.85), it was more pronounced in the COM group on accuracy
(BF10 = 1/1.39) (Figure 6.6). Hence, albeit individuals without ASD might more strongly release
control after a non-conflict situation when accuracy is considered, the Bayes factor shows that
the evidence for this effect is anecdotal at best. Yet, cognitive control is enhanced after a conflict
situation in both groups, revealed by a reduction of the Simon effect after incongruent trials.
Role of age
When examining the effect of age on reactive control, increasing age was associated with longer
RTs (F(1, 273) = 73.33, p < .001, ηp2 = .21, BF10 > 100), and higher accuracy rates (F(1, 273) =
14.59, p < .001, ηp2 = .05, BF10 > 100). Whereas RTs were longer overall, independently of
whether congruent or incongruent trials were presented (i.e., the RT Simon effect was not
affected by age) (F(1, 273) = 0.17, p = .680, ηp2 = .00, BF10 = 1/23.26), age interacted with
congruency on accuracy (F(1, 273) = 5.11, p = .025, ηp2 = .02), although there is little evidence
for (or against) this effect (BF10 = 1.03). The association between increasing age and higher
accuracy rates was significant on incongruent trials (B = .002, SE = .001, t(1, 273) = 2.62, p =
.009) but not on congruent trials (B = .000, SE = .001, t(1, 273) = 0.92, p = .359) (i.e., the
accuracy Simon effect became smaller with increasing age). Nevertheless, the role of age on
reactive control did not differ across groups (RT: F(1, 273) = 2.47, p = .117, ηp2 = .01, BF10 =
1/9.66; accuracy: F(1, 273) = 1.09, p = .298, ηp2 = .00, BF10 = 1/3.11).
Although increasing age was related to a lower percentage of fast errors (F(1, 276) =
5.04, p = .026, β = 0.13, R2 = .02, BF10 = 1.43), it was not when the whole model was considered
(p = .262, β = 0.08, BF10 = 1/2.03), suggesting the effect of age to be small (Figure 6.7a). Also
the Bayesian analysis provide little evidence for or against an age effect. However, increasing age
yielded a steeper downward slope of the delta plot at longer RTs (Figure 6.7b) (F(1, 276) = 6.28,
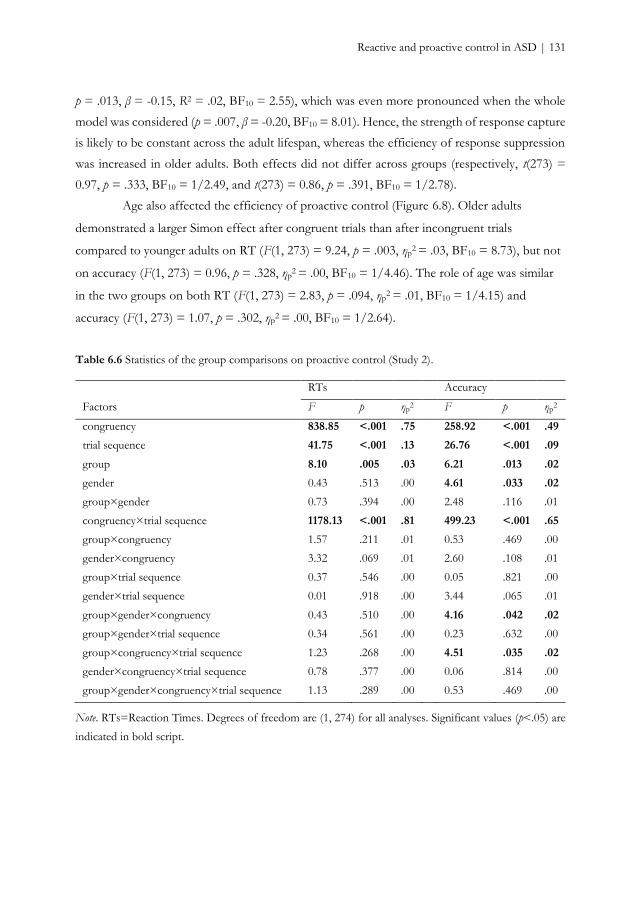
Reactive and proactive control in ASD | 131
p = .013, β = -0.15, R2 = .02, BF10 = 2.55), which was even more pronounced when the whole
model was considered (p = .007, β = -0.20, BF10 = 8.01). Hence, the strength of response capture
is likely to be constant across the adult lifespan, whereas the efficiency of response suppression
was increased in older adults. Both effects did not differ across groups (respectively, t(273) =
0.97, p = .333, BF10 = 1/2.49, and t(273) = 0.86, p = .391, BF10 = 1/2.78).
Age also affected the efficiency of proactive control (Figure 6.8). Older adults
demonstrated a larger Simon effect after congruent trials than after incongruent trials
compared to younger adults on RT (F(1, 273) = 9.24, p = .003, ηp2 = .03, BF10 = 8.73), but not
on accuracy (F(1, 273) = 0.96, p = .328, ηp2 = .00, BF10 = 1/4.46). The role of age was similar
in the two groups on both RT (F(1, 273) = 2.83, p = .094, ηp2 = .01, BF10 = 1/4.15) and
accuracy (F(1, 273) = 1.07, p = .302, ηp2 = .00, BF10 = 1/2.64).
Table 6.6 Statistics of the group comparisons on proactive control (Study 2).
RTs Accuracy
Factors F p ηp2 F p ηp
2
congruency 838.85 <.001 .75 258.92 <.001 .49
trial sequence 41.75 <.001 .13 26.76 <.001 .09
group 8.10 .005 .03 6.21 .013 .02
gender 0.43 .513 .00 4.61 .033 .02
group×gender 0.73 .394 .00 2.48 .116 .01
congruency×trial sequence 1178.13 <.001 .81 499.23 <.001 .65
group×congruency 1.57 .211 .01 0.53 .469 .00
gender×congruency 3.32 .069 .01 2.60 .108 .01
group×trial sequence 0.37 .546 .00 0.05 .821 .00
gender×trial sequence 0.01 .918 .00 3.44 .065 .01
group×gender×congruency 0.43 .510 .00 4.16 .042 .02
group×gender×trial sequence 0.34 .561 .00 0.23 .632 .00
group×congruency×trial sequence 1.23 .268 .00 4.51 .035 .02
gender×congruency×trial sequence 0.78 .377 .00 0.06 .814 .00
group×gender×congruency×trial sequence 1.13 .289 .00 0.53 .469 .00
Note. RTs=Reaction Times. Degrees of freedom are (1, 274) for all analyses. Significant values (p<.05) are
indicated in bold script.
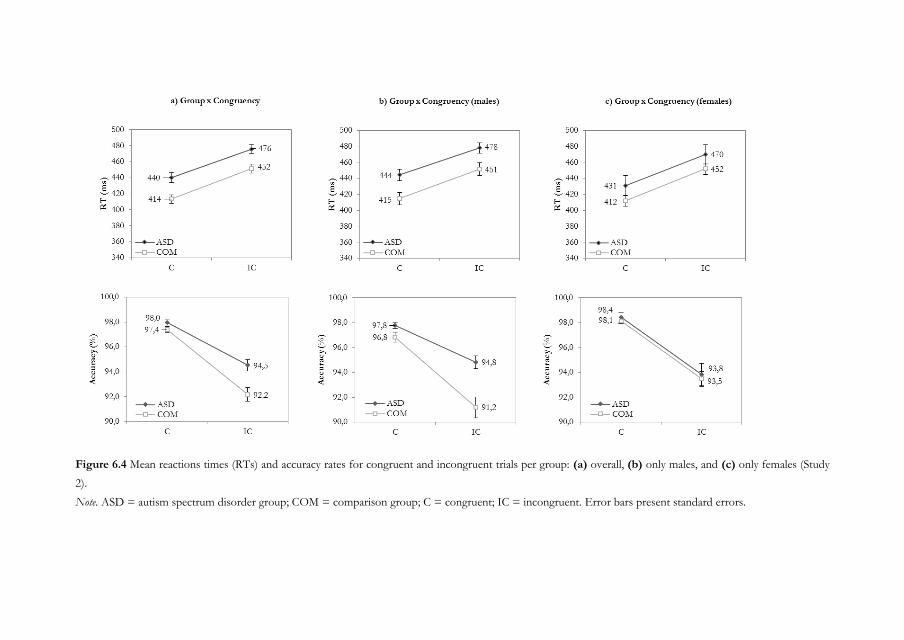
Figure 6.4 Mean reactions times (RTs) and accuracy rates for congruent and incongruent trials per group: (a) overall, (b) only males, and (c) only females (Study
2).
Note. ASD = autism spectrum disorder group; COM = comparison group; C = congruent; IC = incongruent. Error bars present standard errors.
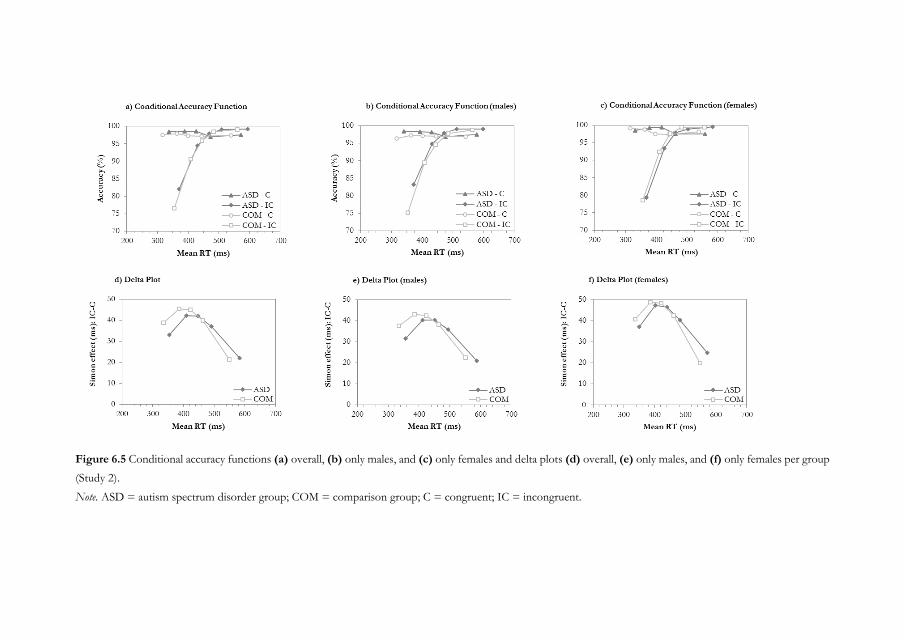
Figure 6.5 Conditional accuracy functions (a) overall, (b) only males, and (c) only females and delta plots (d) overall, (e) only males, and (f) only females per group
(Study 2).
Note. ASD = autism spectrum disorder group; COM = comparison group; C = congruent; IC = incongruent.
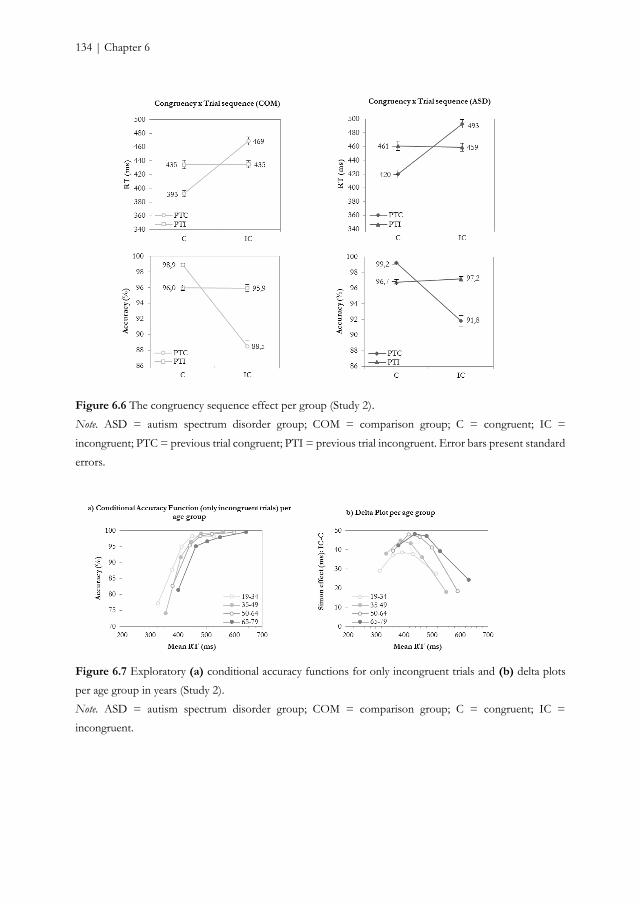
134 | Chapter 6
Figure 6.6 The congruency sequence effect per group (Study 2).
Note. ASD = autism spectrum disorder group; COM = comparison group; C = congruent; IC =
incongruent; PTC = previous trial congruent; PTI = previous trial incongruent. Error bars present standard
errors.
Figure 6.7 Exploratory (a) conditional accuracy functions for only incongruent trials and (b) delta plots
per age group in years (Study 2).
Note. ASD = autism spectrum disorder group; COM = comparison group; C = congruent; IC =
incongruent.
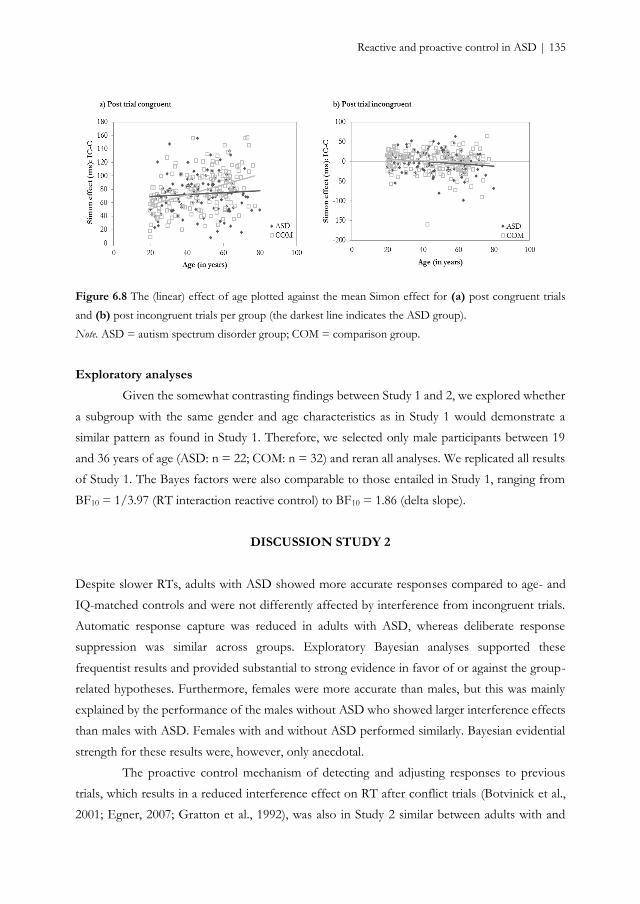
Reactive and proactive control in ASD | 135
Figure 6.8 The (linear) effect of age plotted against the mean Simon effect for (a) post congruent trials
and (b) post incongruent trials per group (the darkest line indicates the ASD group).
Note. ASD = autism spectrum disorder group; COM = comparison group.
Exploratory analyses
Given the somewhat contrasting findings between Study 1 and 2, we explored whether
a subgroup with the same gender and age characteristics as in Study 1 would demonstrate a
similar pattern as found in Study 1. Therefore, we selected only male participants between 19
and 36 years of age (ASD: n = 22; COM: n = 32) and reran all analyses. We replicated all results
of Study 1. The Bayes factors were also comparable to those entailed in Study 1, ranging from
BF10 = 1/3.97 (RT interaction reactive control) to BF10 = 1.86 (delta slope).
DISCUSSION STUDY 2
Despite slower RTs, adults with ASD showed more accurate responses compared to age- and
IQ-matched controls and were not differently affected by interference from incongruent trials.
Automatic response capture was reduced in adults with ASD, whereas deliberate response
suppression was similar across groups. Exploratory Bayesian analyses supported these
frequentist results and provided substantial to strong evidence in favor of or against the group-
related hypotheses. Furthermore, females were more accurate than males, but this was mainly
explained by the performance of the males without ASD who showed larger interference effects
than males with ASD. Females with and without ASD performed similarly. Bayesian evidential
strength for these results were, however, only anecdotal.
The proactive control mechanism of detecting and adjusting responses to previous
trials, which results in a reduced interference effect on RT after conflict trials (Botvinick et al.,
2001; Egner, 2007; Gratton et al., 1992), was also in Study 2 similar between adults with and
136 | Chapter 6
without ASD (Larson et al., 2012; Worsham et al., 2015). This indicates that both groups
enhanced control after incompatible trials. Even though controls were more sensitive to
interference after congruent trials, suggesting that they more strongly released control when a
previous trial was a non-conflict trial, exploratory Bayesian analyses indicated no group effect.
Hence, this latest finding should be interpreted with caution.
Slower and more accurate responses, and reduced response capture fit well together
and converge to the idea of a more cautious response strategy among adults with ASD. Although
the task instructions were to respond as fast and accurate as possible, individuals with ASD
reported that they preferred to be accurate rather than fast, despite several attempts of the
researchers to emphasize the importance of speed. Hence, adults with ASD seem to adopt a
conservative response criterion.
Increasing age was associated with slower and more accurate responses as well, but we
did not find evidence for a larger RT Simon effect in older adults. In regular Simon tasks, age-
related differences have previously been reported to be absent (see Proctor, Miles, & Baroni,
2011; Vu & Proctor, 2008; Proctor et al., 2005), although in tasks that used spatial features for
both the relevant and irrelevant stimulus dimensions, age changes have been reported (Castel,
Balota, Hutchison, Logan, & Yap, 2007; Kawai et al., 2012; Pick & Proctor, 1999; Van der Lubbe
& Verleger, 2002). This would suggest that older adults present problems suppressing irrelevant
information (i.e., stimulus location) when the relevant stimulus dimension also contains spatial
information, such as an arrow (Proctor et al., 2011).
Although age-related RT prolongation did not result in significantly fewer fast errors
on incongruent trials, deliberate suppression on the slowest RTs was enhanced in older adults.
These findings suggests that a more conservative approach is adopted with increasing age during
reactive control. However, on proactive control, while age did not influence the RT Simon effect
after incongruent trials (see also Puccioni & Vallesi, 2012; Yano, 2011), it did after congruent
trials. Increasing age was related to greater interference when the congruent trial was followed
by an incongruent trial. Yet, the CSE remains intact across adulthood (Puccioni & Vallesi, 2012;
Yano, 2011).
GENERAL DISCUSSION
The aim of the current studies was to investigate the temporal dynamics underlying reactive and
proactive interference control processes among adults with ASD. In the first study, we examined
these processes in young adults by using a visual Simon task. In the second study, we tried to
validate the findings in an independent sample and, moreover, examined to role of age.
Reactive and proactive control in ASD | 137
Study 1 demonstrated that young adults with ASD present comparable interference
control performance compared to young adults without ASD as measured with a Simon task.
The findings of Study 1 and 2 converge, despite changing task parameters, when considering
only young adults (18-36 years). Young adults with and without ASD performed similarly on
reactive and proactive control, and on the underlying reactive control processes of response
capture and response suppression. When considering large part of the adult lifespan (19-79 years)
in Study 2, our results provide a partially different perspective. On reactive control, adults with
ASD were slower but more accurate, and had reduced response capture but similar response
suppression. On proactive control, as in Study 1, there were no differences between groups.
These findings may suggest that middle-aged and older adults with ASD use a
quantitatively different response strategy than young adults with ASD, reflected by longer
response duration, higher accuracy rates, and fewer fast errors. Slowing of RTs has been
previously reported for individuals with ASD (Travers et al., 2014), but increased accuracy also
suggests a shift in the balance between speed and accuracy. Typical aging is associated with
diminished processing speed as well (e.g., Salthouse, 1996) and older adults take more time in
making decisions and avoiding errors, whereas younger adults decide more quickly and find
making errors more acceptable (Rabbitt, 1979; Salthouse, 1979; Smith & Brewer, 1995). Indeed,
older adults adjust their behavior in order to minimize the number of errors against the cost of
speed (Starns & Ratcliff, 2010). Older adults might also be less able to estimate the time or control
the time of their responses and, therefore, provide slower responses (Rabbitt, 1979). A similar
suggestion has been proposed for individuals with ASD (Falter, Noreika, Wearden, & Bailey,
2012). Hence, it seem that there are some similarities between the behavior of individuals with
ASD and typically developing older adults (see Bowler, 2007, for the aging analogy in ASD).
The current results appear inconsistent with those entailed by a meta-analysis indicating
that individuals with ASD present interference control difficulties (Geurts et al., 2014). Although
in the meta-analysis no evidence for age affecting effect sizes was found, this might be due to
the inclusion of only a few adult studies. The number of included adult studies may not have
been sufficient to detect age-related differences. In addition, the type of task used might have
affected the results. While the Simon task taps into processes related to response interference,
the Eriksen flanker task also involves perceptual interference (Egner, 2007; van den Wildenberg
et al., 2010). As our results suggest that response interference is not impaired among adults with
ASD, the possibility that perceptual interference is affected in ASD should be evaluated. Indeed,
individuals with ASD seem to demonstrate perceptual enhancement (e.g., Lever & Geurts, 2015;
Mottron, Dawson, Soulieres, Hubert, & Burack, 2006; but see Van der Hallen et al., 2015) and
it has been suggested that, therefore, they get more easily distracted (Adams & Jarrold, 2012).
138 | Chapter 6
Several limitations should be mentioned. First, we only included individuals with a
normal-to-high intelligence. Whether our results generalize to the entire autism spectrum,
including those individuals with an intellectual disability, remains unknown. Second, the cross-
sectional nature of our study provides initial insights into age-related differences in interference
control across adulthood in ASD, but does not allow to investigate changes over time (Raz &
Lindenberger, 2011). Third, despite the suggestion of a more conservative response bias in ASD,
there was an insufficient number of trials to examine speed-accuracy trade-off by means of, for
example, diffusion models (Ratcliff & McKoon, 2008).
In sum, we used a cognitive framework to investigate interference control among adults
with ASD, which provided the opportunity to not only examine overall measures but also
underlying mechanisms involved in interference control processes. Across the adult lifespan, our
findings do not support the idea of behaviorally impaired reactive and proactive interference
control processes in ASD. Given our findings, it seems premature to conclude that the
application of this cognitive dual-process model leads to an explanation for the observed
heterogeneity among ASD studies on interference control (Geurts et al., 2014) and further
research is, therefore, warranted. However, it does suggest that the framework is useful to
disentangle different processes involved in interference control and it may contribute to an
increased understanding of interference control among individuals with ASD.

Chapter 7
Summary and general discussion
140 | Chapter 7
SUMMARY
Main findings
The current thesis provides a first series of large cross-sectional cohort studies on adults with
ASD including individuals up to 80 years of age. While ASDs are heterogeneous,
neurodevelopmental disorders characterized by difficulties in social communication and social
interaction, and restricted, repetitive patterns of behavior, interests, or activities (American
Psychiatric Association, 2000; American Psychiatric Association, 2013), the developmental
trajectory of individuals with ASD across the adult lifespan is not well charted (Happé &
Charlton, 2012; Perkins & Berkman, 2012; Piven & Rabins, 2011; Wright et al., 2013). In this
thesis, we aimed at filling this gap. We focused on three essential domains, either for ASD or
typical aging: symptomatology (Chapter 2), co-occurring psychopathology (Chapter 3), and
cognitive functioning (Chapter 4, 5, 6). Taken together, the results converge to four major
conclusions. First, the burden of ASD symptomatology and depression is high and particularly
perceived in middle adulthood. Second, in the specific cohort of adults with ASD included in
the current thesis, there was no evidence for an accelerated age-related decline (i.e., double
jeopardy); the effect of age was even smaller in adults with ASD on some cognitive domains (i.e.,
safeguard) and parallel on most domains. Third, differences between adults with and without
ASD on cognitive functioning are, if present, subtle and not pronounced. Fourth, there are
important discrepancies between measures and between informants. While we need to be careful
with drawing strong conclusions in this stage, we observed some interesting findings that will be
discussed in further detail below. We will first summarize the findings of each investigated
domain, followed by a critical discussion of the main results and we will end with implications
and avenues for future research.
Symptomatology
In Chapter 2, we examined age-related differences in ASD symptoms in a large sample of
intellectually able individuals with and without clinical ASD (Nmax = 435). We obtained
information about ASD symptomatology, including general symptoms, cognitive and affective
empathy, and sensory sensitivity, by means of both self-report and proxy-report questionnaires.
The symptomatology findings can be clustered into three major conclusions.
First, in line with the suggestion that ASD symptoms are likely to fluctuate over the
lifespan, we found age-related differences in general ASD symptoms and sensory sensitivities.
However, unlike previous longitudinal studies among younger adults that demonstrated
improvement of symptoms over time (e.g., Howlin et al., 2013; Woodman et al., 2015), older
Summary and general discussion | 141
adults reported more general ASD symptoms and sensory sensitivities than young adults, while
middle-aged adults reported more of these symptoms than young and older adults. A similar
pattern was observed on sensory sensitivity, but age-related differences in cognitive and affective
empathy were not detected.
Second, adults with ASD reported more ASD symptoms (e.g., Baron-Cohen et al.,
2001; Ruzich et al., 2015), higher sensory sensitivity (Crane et al., 2009; Minshew & Hobson,
2008), and lower perspective taking and fantasy tendencies, similar empathic concern, and higher
personal distress in reaction to the emotions of others (Rogers et al., 2007) than individuals
without ASD. Moreover, we replicated earlier findings that females with ASD had more sensory
issues and reported more ASD characteristics than males (Lai et al., 2011), whereas females
without ASD manifested fewer ASD traits than non-ASD males see Ruzich et al., 2015, for an
overview). The high number of self-reported general ASD symptoms and sensory sensitivities
and the persistence of these symptoms across the adult lifespan, emphasize the impact of this
neuropsychiatric condition up to late adulthood.
Third, proxies who have known the participants for a long time did not report similar
age-related differences in ASD symptoms. Furthermore, they reported no gender differences on
ASD traits. Comparing self- and other-report of adults with ASD revealed that the proxies
reported more ASD symptoms and fewer empathy and sensory sensitivities than participants
themselves. Indeed, there were relevant discrepancies between self- and proxy-report.
Nevertheless, poor agreement was not only observed among individuals with ASD: Also
individuals without ASD showed inconsistencies with their proxies in the amount of reported
symptoms.
Comorbidity
In Chapter 3, we compared psychological symptoms and psychiatric disorders between young,
middle, and older adults with and without ASD by administering a neuropsychiatric interview
(MINI) and self-reported questionnaires (Nmax = 344). Furthermore, we explored several risk
factors that potentially predicted psychopathology, specifically anxiety and depression, in
individuals with ASD or in the general population. Our first main finding was that, comparable
to other studies involving slightly younger adults (Hofvander et al., 2009; Lugnegård et al., 2011;
Roy et al., 2015), 79% of the adults with ASD met diagnostic criteria for a psychiatric diagnosis
at least once in their lives. As expected, most frequent disorders were mood (57%) and anxiety
(54%) disorders, followed by ADHD (30%). Secondly, when examining potential differences
between young, mid, and older adults, we found that older adults with ASD less often met
diagnostic criteria for a psychiatric diagnosis than young and middle-aged adults. This pattern
142 | Chapter 7
has also been observed in large typical aging studies (Bijl et al., 1998; Kessler et al., 2005). While
depression was most common in middle-aged adults with ASD, social phobia occurred less often
in older adults with ASD than in younger adults with ASD. Thirdly, despite the fact that adults
with ASD experienced many feelings of depression, anxiety, and psychological distress, these
elevated rates were comparable to those reported by other psychiatric patients. Fourthly, more
severe self-reported ASD symptoms and ASD symptoms as observed by an expert were both
risk factors for (self-reported) depression and anxiety symptoms. While self-reported ASD
symptoms and lower age constituted risk factors for the adherence of any lifetime anxiety
disorder, as revealed by the neuropsychiatric interview, female gender was a risk factor for any
lifetime mood disorder (including depression and dysthymia) after young adulthood.
Cognitive functioning
Typical aging is associated with age-related deterioration in cognitive functioning (e.g., Friedman
et al., 2009; Hasher & Zacks, 1988; Hultsch, 1998; Park & Reuter-Lorenz, 2009; Salthouse, 2009).
As there is overlap in the cognitive challenges encountered by typically developing older adults
and young individuals with ASD, we examined in the remaining chapters several cognitive
functions among adults with and without ASD by means of an extensive neuropsychological test
battery (Chapter 4) and experimental paradigms (Chapter 5 and 6). We hypothesized three
possible cross-sectional age-related trajectories. First, individuals with ASD could present a
similar developmental trajectory compared to individuals without ASD, most likely characterized
by an age-related decline in cognitive functioning. Second, individuals with ASD could
demonstrate a divergent pattern in which age-related differences are increased compared to
controls. In this hypothetical situation, ASD and aging would be two factors that jeopardize each
other. Third, individuals with ASD could show a convergent pattern, characterized by reduced
age-related differences compared to controls. ASD would then provide a ‘safeguard’ against age-
related decline. Thus, we aimed to elucidate whether the developmental trajectory of adults with
ASD followed a different age-related pattern compared to those without ASD.
Memory, generativity, and theory of mind
In Chapter 4, we examined age-related differences and strengths and weaknesses in verbal and
visual episodic memory, generativity, and ToM of adults with and without ASD by means of a
neuropsychological test battery and we explored the relation between objective and subjective
cognitive functioning (Nmax = 236). The main finding of Chapter 4 was that age-related
differences in ASD were similar or reduced, but not increased, compared to typically developing
controls. We demonstrated that this pattern was parallel (verbal memory, generativity, ToM) or
Summary and general discussion | 143
less pronounced (visual memory) in individuals with ASD compared to those without ASD.
Hence, we found, like Geurts and Vissers (2012), mainly evidence for a parallel developmental
trajectory and some evidence for the safeguard hypothesis. However, we did not replicate their
findings that led to the hypothesis that age-related differences in cognition could be increased in
ASD.
Secondly, cognitive strengths and weaknesses occurring in adulthood were still present
in old age, although ToM impairments seem to be less apparent in late adulthood. Across the
adult lifespan, individuals with ASD demonstrated relatively intact abilities in verbal episodic
memory, outperformed the adults without ASD on visual memory, and showed difficulties in
generativity. On ToM, a domain generally considered impaired in children and adolescents and
young adults with ASD (Boucher, 2012; Yirmiya et al., 1998; but see Scheeren, de Rosnay, Koot,
& Begeer, 2013), we found ToM difficulties in ASD when considering the whole adult lifespan.
However, when focusing on only 50+ adults, these impairments were no longer observed.
Finally, adults with ASD reported many cognitive failures in daily life. However, we found that
these self-reported cognitive failures and neuropsychological test performance were unrelated in
both adults with and without ASD.
In addition to the findings obtained with tasks frequently used within clinical
neuropsychology, we assessed cognitive functioning more in depth by focusing on two EF
domains: working memory and interference control.
Working memory
In Chapter 5, we examined working memory (WM) performance by means of an n-back task
and compared the performance of adults with and without ASD, investigated age-related
differences and inter-individual differences herein (N = 275). The first finding was that n-back
performance did not differ between adults with and without ASD on neither load level, even
though individuals with ASD needed more time to respond. Being contrary to our expectations,
we proposed that this result could be due to the task not being sufficiently challenging, the
involvement of verbal WM to a greater extent than expected, or to individual differences. Even
though children with ASD showed impaired WM performance on a similar task, only a minority
accounted for this group difference (de Vries & Geurts, 2014). Hence, not all individuals with
ASD presented WM deficits, and this could also be the case in adults.
Second, the age-related gradual decline observed in typical individuals was differentially
expressed in ASD when allowing for a non-linear pattern. Although old age in ASD seemed to
be associated with better WM performance, we argued that this finding should be interpreted
with caution. Furthermore, also the additional exploratory Bayesian analyses suggested that the
144 | Chapter 7
evidence for age-related differences in WM performance among adults with ASD was rather
small and, thus, barely worth mentioning. This shows that it is of importance to not just rely on
the commonly used frequentist accounts and that alternative statistical procedures, such as a
Bayesian approach, may provide an interesting and valuable addition to conventional methods
(see also Chapter 6). Hence, although the pattern could still fit with the idea of ASD being a
‘safeguard’ for typical age-related decline in WM performance, careful interpretation about the
pattern among older adults with ASD is warranted and further research is needed.
Third, of all potential factors, only estimated IQ constituted a factor that predicted
inter-individual differences in age-gradients. However, differences in age-gradients were mostly
due to the large heterogeneity within the small, lower IQ group. These results should, thus, be
interpreted with caution.
Interference control
In Chapter 6, we investigated interference control by administering a Simon conflict task to two
independent adult samples (Study 1: N = 42) (Study 2: N = 278). We compared measures of
reactive (i.e., the expression and suppression of action impulses after the occurrence of a conflict
situation within the same trial) and proactive control (i.e., the adjustment of behavior in response
to a previous conflict situation in order to anticipate and prevent interference) and applied
distributional analyses to examine temporal dynamics underlying these processes in ASD. The
results can be summarized into two major findings. First, across the adult lifespan, our findings
do not support the idea of behaviorally impaired reactive and proactive interference control
processes in ASD. Nevertheless, we observed an important difference between young adult
males, and middle-aged and older adult males and females. While young adult males with ASD
demonstrated comparable interference effects in both reactive and proactive control, made as
many fast errors on conflict trials as neurotypical controls and showed similar suppression on
slow responses (Study 1), over the adult lifespan, males and females with ASD made fewer fast
errors on conflict trials, and had overall slower and more accurate responses than controls on
both reactive and proactive control (Study 2). These results converge to the idea that individuals
with ASD adopt a more cautious response bias over the adult lifespan, which is not yet observed
among young adults.
Second, increasing age was associated with longer RTs and more accurate responses in
both groups. The strength of response capture was likely to be constant across the adult lifespan,
whereas the efficiency of response suppression was increased in older adults. Moreover, older
adults demonstrated a larger Simon effect after congruent trials than after incongruent trials
compared to younger adults on RT. These findings may suggest that middle-aged and older
Summary and general discussion | 145
adults with ASD use a quantitatively different response strategy than young adults with ASD,
reflected by longer response duration, higher accuracy rates, and fewer fast errors.
GENERAL DISCUSSION
What happens to ASD symptomatology, co-occurring psychopathology, and cognitive
functioning when people with ASD grow old?
ASD is considered a developmental disorder (American Psychiatric Association, 2000; American
Psychiatric Association, 2013). Developmental disorders originate in childhood and cause a delay
in one or more psychological functions. What we know about ASD is mainly based on our
knowledge of the condition in childhood (Mukaetova‐Ladinska et al., 2012). However, this thesis
substantiates the idea that several problems are still present in adulthood. Moreover, our findings
suggest different developmental trajectories across the adult lifespan in ASD.
When focusing on ASD symptomatology and co-occurring psychopathology (Chapter
2 and 3), it becomes evident that many ASD-related symptoms and other psychopathology are
experienced throughout adulthood. Furthermore, the personal burden of ASD symptomatology
and depression is particularly perceived in middle adulthood. What gives rise to these elevated
rates, especially in midlife? Midlife is associated with increased demands of responsibility, shifting
roles, and adjustments to changes. It is a rather broad period approximately expanding from 40
to 60 years (albeit even broader ranges have been considered) in which people may need to deal
with changes in multiple domains, including psychosocial, emotional, and physical changes (see
Lachman, 2004, for an overview). For example, this period can be governed by the care for
young children or seeing grown up children leave home; by reconsidering one’s role in relation
to one’s parents, such as in case of caregiving or death; by the role of work, either paid or
voluntary, such as making career or the transition to retirement; by changes in physical
functioning, such as the emergence of health problems or menopause. In childhood,
adolescence, and maybe also young adulthood, parents often provide support and structure, but
when they pass away or they become in need of support themselves, parents will be unable to
do so. This will lead to increased demands on middle-aged adults. Hence, the life events
occurring in this specific stage of life may require substantial resources that could be lacking or
be inefficient in adults with ASD. For example, reduced flexibility in ASD may cause difficulties
in making adjustments to changes in the environment, and reduced social skills may lead to social
rejection or misinterpretation. Considerable distress would be a consequence (Tantam, 2000). It
has been suggested that individuals with ASD miss the coping skills to adequately deal with
stressors (Groden, Baron, & Groden, 2006) and high anxiety levels were found to be related to
146 | Chapter 7
the ability to cope with change, anticipation, sensory stimuli, and unpleasant events (Gillott &
Standen, 2007), suggesting a relationship between coping skills and coping strategies and the
experience of psychological distress and symptoms. Thus, midlife challenges in combination
with impairments associated with ASD and reduced coping skills (or ineffective coping
strategies) may account for the high levels of experienced ASD symptoms and the increased
vulnerability for psychopathology. Nevertheless, it remains unclear whether more symptoms are
experienced due to the challenges of this life period or whether symptoms increase independent
of these challenges. Please also note that age-related differences in the personal burden of adults
with ASD are not perceived by well-known proxies (Chapter 2).
In Chapters 4, 5, and 6, we examined age-related differences in cognitive functioning
and compared developmental trajectories between adults with and without ASD. In contrast to
the popular idea that there might be an accelerated decline in ASD due to the presence of several
risk factors (Happé & Charlton, 2012; Mukaetova‐Ladinska et al., 2012; Piven & Rabins, 2011),
our findings mainly supported the hypothesis of a parallel trajectory in which individuals with
and without ASD showed similar age-related differences across the adult lifespan (Chapter 4 and
6). This suggests that, despite increased vulnerability, there are other factors that may protect
against accelerated decline in this specific group of adults with ASD. The fact that anxiety and
depression were experienced by many, but not all adults with ASD, raises the question whether
there is a subgroup of adults with ASD that is at risk for accelerated decline. These potential
individual differences in vulnerability are a new interesting research area.
Nevertheless, the age-related pattern in ASD seemed to fit the safeguard hypothesis in
three domains by showing attenuation with age (Chapter 4 and 5). Age hardly appeared to affect
performance in visual memory (immediate recall and recognition), ToM, and WM in adults with
ASD. Based on these findings, we could hypothesize that adults with ASD rely on other
strategies than controls. For example, as shown in Chapters 5 and 6, individuals with ASD show
similar or enhanced accuracy rates compared to controls at the expense of slower responses.
Their strategy seems, thus, to be featured by accuracy rather than speed. On a similar note, we
could speculate that the adopted strategy by controls declines with age, whereas that of adults
with ASD does not. For example, in ToM, individuals with ASD without ID mainly seem to use
their verbal and reasoning skills to be able to make explicit inferences about another person’s
thoughts, believes, intentions, and behavior, as they lack the implicit ToM abilities that enable
them to quickly and intuitively understand social situations (Senju et al., 2009). Typically
developing adults mainly rely on spontaneous, implicit ToM throughout their lives. Whether and
how these two ToM aspects are sensitive to age-related decline is, however, unclear. Hence, it
remains an issue for future research to determine whether indeed the lack of age-related effects
Summary and general discussion | 147
as observed in the aforementioned cognitive domains in individuals with ASD is due to
differences in strategy use.
How to explain the discrepancy between informants and between measures?
In this thesis we observed discrepancies on two dimensions. Inconsistencies were detected
between self and proxy informants (Chapter 2) and between objective and subjective cognitive
measures (Chapter 4).
While self-report is a valuable tool to gain insight into a person’s experience and
understanding of certain feelings, thoughts, and behaviors, it is sensitive to meta-cognitive
abilities. Poor introspection has been reported in ASD (Frith, 2004; Johnson et al., 2009; Kievit
& Geurts, 2011), but the reliability of self-reports from intellectually high functioning adults with
ASD have also been shown (De la Marche et al., 2015). Our results indicate poor agreement
between raters (Chapter 2). However, given that low agreement was observed in both the ASD
group and the comparison group, it seems unsuitable to conclude that this is due to poor
metacognitive abilities in ASD. Rather, a rater bias (Hirschfeld, 1993; John & Robins, 1993;
Leising et al., 2010) or a different way of perceiving or experiencing behavioral traits (Carlson et
al., 2013) may reflect the discrepancy between self- and proxy-report.
With regard to objective cognitive measures, we found that differences between adults
with and without ASD on cognitive functioning such as memory, generativity, and ToM
(Chapter 4), WM (Chapter 5), and interference control (Chapter 6) are, if present, subtle and not
pronounced. When exploring individual differences in cognitive functioning, we found that only
a few individuals had performances that significantly deviated from a normative mean based on
performance of the neurotypical comparison group (Chapter 4). Hence, if present, cognitive
impairments in ASD did not seem clinically significant. Nevertheless, adults with ASD
subjectively experienced many cognitive daily challenges as revealed by self-report, which were
unrelated to test performance (Chapter 4). Forty percent reported clinically significant failures
(<2SD below normative mean). Importantly, there was, thus, a discordance between subjective
cognitive complaints and objective test performance.
There are several potential factors that may account for this discrepancy. One could
hypothesize that individuals over-report or exaggerate their symptoms. As the individuals in our
sample were intellectually high functioning, they may feel the need to report many symptoms in
order to get recognition of their difficulties and, in consequence, appropriate help. However,
this is not a likely explanation given that proxies reported even more difficulties than those with
ASD themselves on the questionnaire focusing on symptomatology (Chapter 2). Alternatively,
as information is differently processed in ASD and individuals with ASD are more prone to
148 | Chapter 7
focus on details (Happé & Frith, 2006; Mottron et al., 2006), individuals with ASD may perceive
certain feelings, thoughts, and situations as much more intense and problematic compared to
individuals without such a condition or they may be excessively focused on the perceived
difficulties. Also, if there are impairments in taking another person’s perspective (Chapter 2 and
4), small daily failures may be interpreted as actual difficulties rather than situations that are
experienced by many people or are suited to a stage of life. The combination of a focus on details
and difficulties in contextualizing perceived failures may lead to the report of many cognitive
challenges.
Although these aspects can all be involved, in related research domains there have been
numerous attempts to examine the clinical relevance of self-evaluations on cognitive failures.
While some studies address the importance of these subjective reports to predict cognitive
decline or dementia (see Jonker, Geerlings, & Schmand, 2000, for an overview), others link these
complaints to personality traits, psychiatric symptoms, or physical health problems. For example,
subjectively experienced cognitive failures are associated with personality traits, such as
neuroticism (Comijs, Deeg, Dik, Twisk, & Jonker, 2002) and conscientiousness (Lane & Zelinski,
2003), depression (Comijs et al., 2002; Ponds, van Boxtel, & Jolles, 2000; Zimprich, Martin, &
Kliegel, 2003) and anxiety symptoms (Comijs et al., 2002), and physical health problems (Comijs
et al., 2002). Depression and anxiety are common in individuals with ASD (Chapter 3) and
physical health problems are often reported (Croen et al., 2015). The high rates of subjectively
reported cognitive complaints among adults with ASD could, thus, also be explained in light of
these aspects.
Finally, according to Toplak and colleagues (2013), self-ratings reflect typical
performance, whereas psychometric tests reflect optimal performance. Subjective experiences
of cognitive failures may reflect daily life difficulties, which may not (yet) be captured by our
selection of laboratory tasks.
Are cognitive complaints risk factors for developing dementia?
Even though our neuropsychological assessment did not reveal obvious cognitive difficulties in
ASD (Chapter 4) and the findings did not indicate accelerated age-related decline in individuals
with ASD (Chapter 4, 5, and 6), the elevated number of cognitive complaints warrant further
research. Longitudinal studies show a relationship between higher cognitive complaints and a
more rapid cognitive decline (Hohman, Beason-Held, Lamar, & Resnick, 2011), and an increased
risk of Alzheimer’s dementia, especially in individuals with a high education (van Oijen, de Jong,
Hofman, Koudstaal, & Breteler, 2007). If cognitive complaints are a true representation of
(subtle) cognitive failures, rather than the result of over-reporting, hypersensitivity, personality,
Summary and general discussion | 149
or psychopathology, and are a risk factor for Alzheimer’s dementia, then we would expect a
higher rate of Alzheimer’s dementia in aging individuals with ASD.
However, it has recently been reported that individuals with ASD would suffer less
frequently from Alzheimer’s dementia than a general or schizophrenia population based on a
database analysis (Oberman & Pascual-Leone, 2014) but this could result from a report bias.
Individuals with ASD may be more hesitant to contact preventive health services (Croen et al.,
2015), there are likely many unrecognized cases of ASD among older adults (Brugha et al., 2011),
and a reduced social network may cause delayed detection of initial cognitive impairment
(Howlin et al., 2013). Not only in contrast to the study of Oberman and Pascual-Leone (2014)
but also against this line of reasoning, is a recent study on the health status of adults with ASD
that showed that dementia is more prevalent in ASD than in controls (respectively, 2.3% against
0.5%) and that females with ASD are more at risk than males with ASD for dementia compared
to, respectively, females or males without ASD (Croen et al., 2015). The methodology of both
studies may account for these substantial differences. While Oberman and Pascual-Leone (2014)
based their prevalence rates on a database query on Harvard hospital records, Croen and
colleagues (2015) based their findings on data of general health care on adults over 18 years of
age. However, more importantly, Oberman based her conclusion on the comparison between
people over 55 years of age with ASD (3.7%) and those without ASD (13%). This rate in the
non-ASD population is far higher than those reported by large population-based cohort studies
(Lobo et al., 2000) or the prevalence estimated by an expert panel (Ferri et al., 2006), suggesting
that the comparison group is atypical. Finally, it should be kept in mind that 20% of the adults
with ASD in the Croen study had an intellectual disability and there is an increased risk for
dementia in intellectually disabled people (Strydom, Chan, King, Hassiotis, & Livingston, 2013).
These considerations and inconsistent findings affirm the need for further research to examine
whether ASD is an increased vulnerability factor for developing dementia, for example by
studying whether and how subjective complaints have predictive value for developing dementia
in ASD. Hence, even though cognitive performance difficulties in ASD may be clinically
insignificant and there are several plausible explanations for the elevated perceived subjective
difficulties, the discordance with subjective experiences still warrants further research.
Strengths, limitations, and future directions
Given the limited knowledge on ASD over the adult lifespan, and mainly late adulthood,
investigating age-related differences in cross-sectional studies represents a logical initial step and
provides valuable insight into ASD among older adults. However, while the current sample is
unique due to the inclusion of a large group of adults over 50 years of age, a cross-sectional
150 | Chapter 7
design does not allow drawing conclusions about changes in symptomatology, psychopathology,
and cognitive functioning over the years within individual developmental trajectories. Several
longitudinal studies have examined also ASD symptoms (e.g., Howlin et al., 2013; Woodman et
al., 2015), but not yet until old age and most studies are based on parent report. To overcome
this gap a follow-up study to gather longitudinal self-reported data, including ASD
symptomatology, cognitive failures, psychological distress, and quality of life has recently started
in our lab. This new study will provide knowledge about how adults with ASD perceive their
functioning over the years. Furthermore, for example, cognitive age-related changes in
longitudinal studies do not always show the same patterns as age-related differences of cross-
sectional designs (Nyberg et al., 2012; Raz & Lindenberger, 2011). Therefore, the examination
of longitudinal changes in ASD symptomatology, psychopathology and cognitive functioning
across middle and late adulthood should also constitute a next step in ASD research.
Our ASD sample consisted of individuals who already had a formal, clinical diagnosis
within the autism spectrum before participating in the project, generally after thorough
assessment by a multidisciplinary team. Nevertheless, we included a specific subgroup of
individuals with ASD. Firstly, while 16-70% of the ASD population has an intellectual disability
(Matson & Shoemaker, 2009), we included only adults with an estimated IQ above 80. Yet,
estimated IQ did not differ between the ASD and comparison group (Chapter 2-6) and it did
not constitute a risk factor for psychiatric comorbidity (Chapter 3), even though it appeared to
be a significant predictor of age gradients in WM performance (Chapter 5). Secondly, one may
argue that the ASD participants described in the current thesis presented relatively mild
symptoms due to their late, mostly in adulthood, diagnoses. However, the elevated number of
ASD traits reported by both self and proxy (comparable to the original sample of Baron-Cohen
et al., 2001 and to the clustered sample mentioned in the recent review of Ruzich et al., 2015)
(Chapter 2), the elevated number of psychological distress and many psychiatric problems
(Chapter 3), the anecdotal accounts of problems with interpersonal relationships and jobs, and
the lower quality of life (results not presented in the current thesis), do reveal that adults with
ASD experience serious difficulties. Hence, they might be able to camouflage their symptoms
until adulthood, for example due to sufficient cognitive abilities (Heijnen-Kohl & van Alphen,
2009), but perceive and experience a heavy burden of their condition later in life. Thirdly, we
included a relatively large sample of females with ASD in the presented studies (males:females
ratio = 3:1). While generally the ratio between males and females is estimated on 4-5:1, is has
also been suggested that this proportion might be lower (2-5:1) (see Halladay et al., 2015; Lai,
Lombardo, Auyeung, Chakrabarti, & Baron-Cohen, 2015, for an overview). However, in
contrast to the previous idea that this ratio is especially lower in individuals with co-occurring
Summary and general discussion | 151
intellectual disability (ID), dissociations from ID have been reported (Idring et al., 2012) and the
male bias seems less pronounced than formerly assumed (see Lai et al., 2015, for an overview).
In this light, our proportion of females represents a strength rather than a limitation. As numbers
of diagnoses in adulthood are rising, it is a possibility that the group investigated in the current
thesis share many characteristics with other individuals diagnosed with ASD in adulthood. Yet,
it is important to keep in mind that our conclusions might not hold for those with a lower IQ
and/or with early diagnosis and/or in need of substantial support. Directions for future research
include the extension of aging research to the entire autism spectrum.
The large majority of the ASD participants had a psychiatric co-occurring diagnosis at
least once in their lives and used psychotropic medication. On the one hand this augments the
representativeness of the sample, as comorbidity and medication usage is rather common. On
the other hand, psychopathology may influence cognitive functioning (e.g., Engelhardt et al.,
2008; Paterniti et al., 2002) and self-reported cognitive functioning (Comijs et al., 2002; Ponds
et al., 2000; Zimprich et al., 2003). A previous study in adult males with ASD demonstrated that
comorbid conditions did not affect cognitive performance (Wilson et al., 2014), and in one of
our studies it also was unrelated to cognitive performance (Chapter 5). However, we did not
check whether this was also the case in the other studies and we only inquired about lifetime
psychiatric disorders rather than current disorders. Finally, psychotropic medication may affect
cognitive functioning by enhancing (e.g., Grön, Kirstein, Thielscher, Riepe, & Spitzer, 2005;
Sahakian & Morein-Zamir, 2007) or reducing (e.g., Barker, Greenwood, Jackson, & Crowe, 2004;
Deptula & Pomara, 1990; Tannenbaum, Paquette, Hilmer, Holroyd-Leduc, & Carnahan, 2012)
it, but we did not control for this potential influence. Future research may shed light on these
issues.
We used Bayesian hypothesis testing to explore the evidential strength for our findings
in Chapter 5 and 6. This approach provided an interesting and valuable addition to conventional
methods and it is of interest to use this statistical approach more often. While the majority of
our studies investigated cognition in ASD (Chapter 4, 5, and 6), we selectively examined
cognitive control and did not consider, for example, cognitive flexibility and planning.
Furthermore, only one aspect of ToM was taken into account and weak central coherence was
not studied at all. This represents a limitation of our study. Nevertheless, our results are in line
with the idea that EF and ToM problems are not universal (Chapter 4, 5, and 6), which underlines
the relevance of studying inter-individual differences and subgroups of individuals with ASD.
Finally, in line with the manual in use at the start of our study, the ASD participants
were diagnosed according to DSM-IV criteria with autistic disorder, Asperger’s syndrome, or
PDD-NOS (American Psychiatric Association, 2000). In the current DSM-5, this distinction is
152 | Chapter 7
abolished and changed into one spectrum diagnosis with a severity indication based on one’s
need for support. Although we examined sensory sensitivity, a domain newly added to the DSM-
5, we are not able to meet all amendments of the DMS-5 and, for example, to draw conclusions
on a severity indication of the participants.
Clinical implications
ASD is a highly disabling disorder that affects approximately 1% of the population (Brugha et
al., 2011). With the increasing number of older adults as a result of the aging population and the
increasing number of diagnosed cases in (late) adulthood, this has an impact on costs for health
care and use of services. Also, it requires clinicians to be aware of the ASD phenotype in late
adulthood, which is often still lacking (van Niekerk et al., 2011). Furthermore, professionals
working in elderly homes would benefit from more awareness about ASD in older adults. Hence,
the findings presented in this thesis may have a number of clinical implications.
The age-related differences observed in ASD symptomatology (Chapter 2) suggest that
it would be meaningful to regularly inquire after the experience of symptoms throughout the
adult lifespan in clinical settings. Hence, not only at the time of diagnosis, but also during follow-
up. Furthermore, the increased behavioral symptoms (Chapter 2) and increased rates of
depression in middle adulthood (Chapter 3), suggests the importance of monitoring individuals
with ASD in middle adulthood and providing adequate support to reduce stress and distress,
and improving their well-being.
Females with ASD reported more ASD traits than males with ASD, whereas this gender
difference was not perceived by proxies (Chapter 2). A meta-analysis on gender differences in
core ASD symptoms as reported by parents or as denoted by observational instruments,
demonstrated that females with ASD show similar social and communication symptoms, but
fewer restricted, repetitive behaviors than ASD males (Van Wijngaarden-Cremers et al., 2014).
This latter difference may, however, be because female interests were not detected and
recognized as restricted and repetitive (Halladay et al., 2015). Moreover, in presence of similar
ASD symptom severity in childhood, females showed less deviant current behaviors in social
interaction and communication (Lai et al., 2011). These findings and the gender comparable
ASD traits as perceived by proxies in the presence of more self-reported ASD traits by females,
may support the idea that females are, in general, better in camouflaging (i.e., masking or
compensating for) their condition (see Lai et al., 2015). They could be more motivated by societal
expectations, take more effort to develop social skills, and may have better self-referential
abilities (Lai et al., 2011). However, females may also more strongly perceive their symptoms or,
although highly speculative, they may feel the need to report more ASD symptoms. They might
Summary and general discussion | 153
do the latter in order to be recognized as having ASD, getting access to the mental health system
and receiving appropriate treatment, as ASD in girls and women is still underdiagnosed (see
Halladay et al., 2015, for an overview). Even though this latest suggestion seems unlikely given
that the female participants in our study already had a clinical diagnosis, clinical professionals
should be aware of possible symptomatic differences between males and females. Finally, our
findings indicate that females with ASD are vulnerable for dysphoria related to the period
preceding menstruation and, especially after young adulthood, for mood disorders (Chapter 3).
This may require special attention in terms of support or treatment.
Diagnosing older individuals is complicated (Heijnen-Kohl & van Alphen, 2009).
Often, there is no developmental history available (Geurts & Jansen, 2012; Happé & Charlton,
2012) and expression of symptoms may change over the adult lifespan. It would then be
important to have an appropriate measure to observe current symptoms. The ADOS has been
considered as one of the ‘gold-standard’ instruments for ASD assessment (Ozonoff, Goodlin-
Jones, & Solomon, 2005). Although it was developed as a research instrument (Lord et al., 2000)
and has proven its usefulness in this regard, it is currently also in use by clinicians as part of
multimethod assessment. Although we did not investigate the validity of the ADOS and it was
not our purpose to draw conclusions about this instrument, our experience with the ADOS, and
those of others working with intellectually high functioning adults (e.g., Bastiaansen et al., 2011;
Ring et al., 2016), suggests that the ADOS is not sensitive enough to detect ASD in adults who
do not have an intellectual disability, are diagnosed in adulthood, and are not in need of
substantial support. Therefore, we suggest, in line with the Dutch ASD guidelines (Trimbos,
2013) that clinicians should not only rely on one instrument such as the ADOS when assessing
ASD, even though the ADOS can be fruitful when used in combination with other measures.
Moreover, our findings also suggest that it is important to rely on more than one source
for diagnostic assessment (see again Dutch guidelines; Trimbos, 2013). This reliance on multiple
sources is especially important as it is often the partner who initiates the diagnostic process
(National Institute for Health and Clinical Excellence, 2012; Trimbos, 2013) and often a family
member is involved in the assessment of the developmental history, if possible. Hence, a proxy
has a pivotal function. Our findings indicate that whether the proxy is a partner, family member,
or friend does not largely affect the report of ASD-related symptoms (see Supplementary
material Chapter 2), despite subtle differences. However, clients and proxies seem to perceive
different aspects of ASD symptomatology. The discrepancies observed between both
informants may provide an interesting contrast to discuss during assessment.
The findings indicate that the neuropsychological profile of adults with ASD without
intellectual disability does not reflect severe cognitive difficulties (Chapter 4, 5, 6). Clinicians,
154 | Chapter 7
thus, should be aware that cognitive problems may not be pronounced in adults with ASD.
Moreover, the observed strengths represent useful targets for treatment. Although age may have
a negative impact on the cognitive functioning of individuals with ASD, as it does in the general
population, this does not seem to lead to a more severe trajectory in ASD.
Even though cognitive functioning does not appear severely impaired as measured with
neuropsychological and experimental tests, adults with ASD report poor well-being. Cognitive
failures are often experienced, severity of self-reported symptoms is pronounced, psychological
distress is high, co-occurring psychopathology is common, and medication use is frequent.
Exploratory analyses on available data also indicate that quality of life is low in adults with ASD.
Although interventions for adults with ASD are limited (Brugha, Doos, Tempier, Einfeld, &
Howlin, 2015), these poor subjective experiences underline the need for adequate interventions
and support to reduce the personal burden of adults with ASD. Guidelines indicate that
psychoeducation is a first step in providing this support. The results presented in this thesis
provide a basis for the development of such a psychoeducation for older adults with ASD, which
is currently being tested for its effectiveness.
To conclude, the findings of the large pioneering study presented in this doctoral thesis
indicate that for the majority of the examined adults with ASD, who are referred to mental health
services and who are intellectually high functioning, relatively independent, and diagnosed later
in life, experience of ASD-related and psychiatric symptoms and cognitive failures is substantial.
However, no evidence for accelerated cognitive decline has been found, which may provide
some reassurance to individuals with ASD across the adult lifespan.

Dutch summary (Nederlandse samenvatting)
Autisme en veroudering:
Symptomatologie, bijkomende psychopathologie
en cognitief functioneren gedurende de levensloop
156 | Dutch summary (Nederlandse samenvatting)
ACHTERGROND
Autismespectrumstoornissen (ASS) worden omschreven als heterogene, neurobiologische
ontwikkelingsstoornissen die gekenmerkt worden door kwalitatieve beperkingen in sociale
communicatie en sociale interactie en beperkte, repetitieve patronen van gedrag, interesses of
activiteiten (American Psychiatric Association, 2000; American Psychiatric Association, 2013;
Volkmar et al., 2004). ASS komt bij ongeveer 1% van de bevolking voor, ongeacht leeftijd
(Brugha et al., 2011). Kenmerkende symptomen zijn afwijkend oogcontact, moeite met het
aangaan en onderhouden van relaties, gefixeerde interesses en sensorische hypo- of
hypergevoeligheid. Hoewel ASS in eerste instantie als een kindstoornis werd beschouwd
(Kanner, 1943; Kanner, 1944) en onderzoek zich dus voornamelijk op kinderen heeft gericht
(Mukaetova‐Ladinska et al., 2012), wordt nu wel onderkend dat ASS ook gedurende de
volwassenheid blijft bestaan (Gillberg & Steffenburg, 1987; Kanner, 1971; Rumsey et al., 1985).
Omdat ASS voor het eerst in de jaren `40 werd beschreven (Asperger, 1944; Kanner, 1943) en
het dus een relatief recente diagnose is, is het niet verrassend dat er nog heel weinig onderzoek
is gedaan naar ASS bij oudere volwassenen (Happé & Charlton, 2012; Perkins & Berkman, 2012;
Piven & Rabins, 2011; Wright et al., 2013). Het is echter wel relevant om meer over ASS in de
volwassenheid te weten te komen. Als mensen met ASS ouder worden, dan moeten ze omgaan
met de veranderingen die optreden als onderdeel van het verouderingsproces, maar ook met de
moeilijkheden die geassocieerd worden met ASS. Daarnaast komen er steeds meer ouderen als
gevolg van de vergrijzing. Dit betekent dat er mogelijk ook steeds meer ouderen met ASS zullen
zijn die ondersteuning behoeven. Tot slot worden er steeds vaker ASS diagnoses pas in de
volwassenheid gesteld, mede door verruiming en verandering van de diagnostische criteria en
toegenomen kennis en bewustzijn van ASS. Dit proefschrift heeft dan ook als algemeen doel om
meer kennis te vergaren over welke kenmerken wanneer gedurende de gehele volwassenheid op
de voorgrond staan zodat behandeling en hulp hier op afgestemd kunnen worden.
Omdat er zo weinig bekend is over ASS gedurende de volwassen levensloop, hebben
we ervoor gekozen om drie basale domeinen beter in kaart te brengen. Ten eerste hebben we
ASS symptomen onderzocht. De diagnose ASS wordt gesteld op basis van gedragskenmerken
en we wilden graag weten of en hoe deze kenmerken gedurende de levensloop veranderen
(Hoofdstuk 2). Ten tweede hebben we bijkomende psychopathologie bestudeerd. Omdat
mensen met ASS veel bijkomende psychische problemen ervaren, wilden we graag weten of deze
problemen consequent gedurende de levensloop aanwezig zijn (Hoofdstuk 3). Tot slot hebben
we onderzocht of volwassenen met ASS vergelijkbare leeftijd gerelateerde veranderingen in
cognitief functioneren laten zien als volwassenen zonder ASS. We hebben ons hierbij gericht op
Dutch summary (Nederlandse samenvatting) | 157
meerdere cognitieve domeinen, zoals geheugen en theory of mind (ToM; sociaal snapvermogen)
(Hoofdstuk 4), werkgeheugen (Hoofdstuk 5) en interferentie controle (Hoofdstuk 6).
METHODE
De bevindingen van dit onderzoek (met uitzondering van Studie 1 beschreven in Hoofdstuk 6)
zijn afkomstig van één grote groep volwassenen met een diagnose binnen het autisme spectrum
(nmax = 241) en een vergelijkingsgroep van volwassenen zonder ASS (nmax = 199). Alle
volwassenen waren tussen 19 en 79 jaar oud en hadden een geschat IQ van tenminste 80. De
ASS groep is geworven via verschillende GGZ-instellingen en door middel van advertenties op
de websites van cliëntorganisaties. De ASS diagnose was voor aanvang en onafhankelijk van dit
project vastgesteld. Aanvullende diagnostische informatie kwam via een ASS vragenlijst (n =
237) en een diagnostisch observatie instrument (n = 142). De vergelijkingsgroep is benaderd via
advertenties op de website van de universiteit en op social media en door middel van de sociale
omgeving van de onderzoekers.
Gegevens voor dit onderzoek zijn tussen maart 2012 en juli 2014 verzameld door
middel van psychologisch onderzoek bestaande uit vragenlijsten, interviews, en
neuropsychologische en experimentele cognitieve tests. De grootte van de deelnemersgroep
beschreven in elk hoofdstuk varieert als gevolg van het gebruikte instrument en het
onderzoekdoel.
SYMPTOMATOLOGIE
In Hoofdstuk 2 onderzochten we leeftijd gerelateerde verschillen in ASS symptomen. Door
middel van vragenlijsten verkregen we informatie over ASS kenmerken, waaronder empathie en
sensorische gevoeligheid (Nmax = 435). Empathie is het inlevingsvermogen of de vaardigheid om
de gedachten en gevoelens van anderen te begrijpen en bestaat uit zowel een cognitief als een
affectief aspect (Davis, 1983). Sensorische gevoeligheid refereert zowel naar overgevoeligheid als
ondergevoeligheid voor sensorische prikkels. Omdat een betekenisvolle bekende een belangrijk
rol speelt bij ASS diagnostiek (National Institute for Health and Clinical Excellence, 2012),
bijvoorbeeld voor het verschaffen van informatie over de ontwikkelingsgeschiedenis, en omdat
er wel eens wordt getwijfeld aan de capaciteit van mensen met ASS om betrouwbare zelf-
rapportage te geven (Frith, 2004; Johnson et al., 2009; Kievit & Geurts, 2011; maar zie De la
Marche et al., 2015), hebben we zelf-rapportage vergeleken met rapportage door een bekende
(bijvoorbeeld een partner, ouder of vriend; zogeheten proxy-rapportage).
158 | Dutch summary (Nederlandse samenvatting)
In tegenstelling tot longitudinale onderzoeken bij jongere volwassenen die lieten zien
dat de ernst van ASS symptomen over het algemeen afneemt met het ouder worden (bijv.
Howlin et al., 2013; Piven et al., 1996; Woodman et al., 2015), vonden wij een piek in de
middelbare volwassenheid wat betreft ASS kenmerken en sensorische gevoeligheid. Jongere en
oudere volwassenen met ASS rapporteerden minder van deze symptomen dan volwassenen in
de middelbare leeftijd. De perceptie van empathie werd niet beïnvloed door leeftijd.
Volwassenen met ASS rapporteerden meer ASS kenmerken en prikkelgevoeligheid en
gaven aan minder te fantaseren en minder geneigd te zijn om het perspectief van een ander in te
nemen dan controles. Tegelijkertijd maakten zij zich evenveel zorgen om anderen en voelden zij
zich ongemakkelijker bij de emoties van anderen. Vrouwen met ASS rapporteerden meer ASS
kenmerken en prikkelgevoeligheid dan mannen, terwijl dit bij controles juist andersom was. Deze
bevindingen komen overeen met eerder onderzoek (Baron-Cohen et al., 2001; Crane et al., 2009;
Minshew & Hobson, 2008; Rogers et al., 2007; zie Lai et al., 2011; Ruzich et al., 2015, voor een
overzicht).
Tot slot vonden we dat de rapportages van mensen zelf en van hun betekenisvolle
bekenden afweken. Proxies van mensen met ASS rapporteerden bijvoorbeeld meer sociale en
minder sensorische symptomen en gaven geen verschillen in leeftijd en geslacht aan. De
discrepantie tussen zelf- en proxyrapportage was echter zowel bij de mensen met ASS als bij de
mensen zonder ASS aanwezig. Het lijkt daarom niet toepasselijk om te stellen dat er sprake is
van verminderd zelfinzicht bij volwassenen met ASS. Er kan sprake zijn van een informanten
bias (Hirschfeld, 1993; John & Robins, 1993; Leising et al., 2010), maar het kan ook zijn dat
beide informanten verschillende ASS kenmerken herkennen en ervaren (Carlson et al., 2013).
Deze bevindingen zijn ook vanuit klinisch oogpunt relevant. Ten eerste suggereren de
leeftijd gerelateerde verschillen in ASS symptomen dat het zinvol is om cliënten regelmatig
gedurende de volwassen levensloop naar hun beleving van symptomen te vragen. Dit is dus niet
alleen belangrijk als onderdeel van de diagnostiek, maar ook tijdens latere fases in het
begeleidingstraject. Ten tweede geven deze resultaten aan dat mensen met ASS van middelbare
leeftijd extra goed in de gaten gehouden zouden moeten worden omdat zij mogelijk extra steun
en zorg nodig hebben. Ten derde is het belangrijk dat clinici rekening houden met man/vrouw
verschillen bij het gebruik van zelfrapportage bij volwassenen met ASS zonder intellectuele
beperking. Tot slot kunnen de verschillen in beleving tussen cliënten en hun betekenisvolle
personen aanknopingspunten bieden voor het begrijpen van de ervaren problematiek (zie
National Institute for Health and Clinical Excellence, 2012; Trimbos, 2013).
Dutch summary (Nederlandse samenvatting) | 159
BIJKOMENDE PSYCHOPATHOLOGIE
Het doel in Hoofdstuk 3 was het in kaart brengen van psychiatrische klachten en stoornissen
bij volwassenen met ASS en het vergelijken van jonge, middelbare en oudere volwassenen hierin.
Daarnaast zijn risicofactoren voor de meest voorkomende klachten en stoornissen onderzocht.
Met behulp van vragenlijsten en een neuropsychiatrisch interview (Nmax = 344) vonden we dat
79% van de volwassenen met ASS ooit in hun leven heeft voldaan aan de criteria voor een
psychiatrische diagnose. Meest voorkomend waren stemmingsstoornissen (57%) en
angststoornissen (54%). Deze percentages komen overeen met de bevindingen van eerdere
studies bij jongere volwassenen (Hofvander et al., 2009; Lugnegård et al., 2011; Roy et al., 2015).
Daarnaast bleken mensen met ASS gedurende de volwassenheid veel psychologische klachten te
ervaren (zie ook van Heijst & Geurts, 2014). De ernst van deze klachten was echter vergelijkbaar
met de klachten ervaren door een grote vergelijkingsgroep van poliklinische psychiatrische
patiënten.
Een tweede bevinding was dat oudere volwassenen (55-80 jaar) minder vaak voldeden
aan de criteria voor een psychiatrische diagnose dan jongere volwassenen. Hoewel dit aansluit
bij de resultaten van grote cohort studies in de algemene populatie (Bijl et al., 1998; Kessler et
al., 2005) en die van een eerdere studie bij volwassenen met ASS met een intellectuele beperking
(Totsika et al., 2010), is het niet overeenkomstig met de enige andere studie gedaan bij oudere
volwassenen met ASS zonder intellectuele beperking (Roy et al., 2015). We hebben dit verschil
toegewezen aan de kleine groep en de definitie van “oudere volwassene” (40-62 jaar) in de
eerdere studie. Psychische stoornissen zoals depressie komen met name bij volwassenen van
middelbare leeftijd meer voor (Bijl et al., 1998; Kessler et al., 2005). Aangezien de volwassenen
in de Roy studie (2015) veelal van middelbare leeftijd waren terwijl onze oudere groep bestond
uit volwassenen van 55-80 jaar, lijkt de discrepantie hieraan toe te schrijven. We vonden ook dat
depressie het meest voorkwam bij volwassenen met ASS van middelbare leeftijd en dat sociale
fobie minder prevalent was bij ouderen met ASS.
Van de potentiele risicofactoren die we hebben meegenomen in onze analyses (zelf
gerapporteerde en geobserveerde ernst van ASS, geslacht, sociaal economische status [opleiding
en werk], woonsituatie, geschat IQ en algemeen cognitief functioneren) bleken ernst van ASS
symptomen geassocieerd met depressieve en angstklachten. Daarnaast hingen zelf
gerapporteerde ASS kenmerken samen met de aanwezigheid van angststoornissen gedurende de
levensloop en, na de jongvolwassenheid, was vrouw-zijn een risicofactor voor
stemmingsstoornissen.
160 | Dutch summary (Nederlandse samenvatting)
In de middelbare volwassenheid zien we dus niet alleen een piek in ASS symptomen,
maar ook in depressie. Dit suggereert dat het belangrijk is om deze volwassenen goed te
monitoren en te zoeken naar adequate steun en zorg om hun situatie te verlichten en hun
welbevinden te verbeteren.
COGNITIEF FUNCTIONEREN
Veroudering wordt geassocieerd met een achteruitgang in cognitief functioneren. Mensen
krijgen bijvoorbeeld meer moeite met het onthouden van nieuwe informatie, met het actief
houden van informatie, of met het bedenken van woorden en nieuwe oplossingen (generativiteit)
(Borella et al., 2008; Friedman et al., 2009; Goh et al., 2012; Hasher & Zacks, 1988; Hultsch,
1998; Nyberg et al., 2012; Park et al., 2002; Park & Reuter-Lorenz, 2009; Salthouse, 1996;
Salthouse, 2009; Verhaeghen & Cerella, 2002). Sommige van deze cognitieve problemen zijn ook
aanwezig bij kinderen, adolescenten en jongvolwassenen met ASS (Boucher et al., 2012; Geurts
et al., 2014; O'Hearn et al., 2008; Russell, 1997). Gezien deze overeenkomst tussen typische
veroudering en ASS is het de vraag wat er gebeurt als mensen met ASS ouder worden.
In Hoofdstuk 4, 5 en 6 stond de vraag centraal of volwassenen met ASS een ander
leeftijd gerelateerd patroon van veroudering laten zien vergeleken met controles. We hebben dit
onderzocht door middel van een uitgebreide neuropsychologische testbatterij (Hoofdstuk 4) en
experimentele testen (Hoofdstuk 5 en 6). Gebaseerd op de bevindingen van de allereerste
groepsstudie bij ouderen met ASS waarbij cognitie is onderzocht (Geurts & Vissers, 2012),
hebben we drie mogelijke hypotheses opgesteld. Ten eerste zouden volwassenen met ASS een
vergelijkbaar verouderingspatroon kunnen laten zien (parallel). Ten tweede zou er sprake kunnen
zijn van een verslechterend of versneld verouderingspatroon bij ASS (double jeopardy) waarbij
leeftijd gerelateerd verschillen tussen volwassenen met en zonder ASS steeds groter worden. ASS
en veroudering zouden dan twee factoren zijn die elkaar versterken. Ten derde zou er een
verminderend verouderingspatroon verwacht kunnen worden bij ASS (safeguard), bijvoorbeeld
doordat mensen met ASS compensatiemechanismen hebben ontwikkeld.
Geheugen, generativiteit en theory of mind
In Hoofdstuk 4 vonden we op geen enkel domein evidentie voor een versneld
verouderingspatroon (Nmax = 236). Het patroon was parallel (verbaal geheugen, generativiteit,
en ToM) of verminderd (visueel geheugen) in volwassenen met ASS vergeleken met controles.
Deze bevindingen komen grotendeels overeen met eerder onderzoek (Geurts & Vissers, 2012).
Dutch summary (Nederlandse samenvatting) | 161
Daarnaast toonden we aan dat cognitieve sterktes en zwaktes in de volwassenheid
grotendeels blijven bestaan. Volwassenen met ASS vergeleken met controles, presteerden
vergelijkbaar op verbaal geheugen, beter op de visueel geheugen, en minder goed op
generativiteit en ToM. Een interessante bevinding was dat ToM problemen die vaak gevonden
worden bij ASS (Boucher, 2012; Yirmiya et al., 1998; maar zie Scheeren et al., 2013), verdwenen
bij oudere volwassenen met ASS. Ondanks dat slechts een paar mensen met ASS klinisch
afwijkende prestaties lieten zien, werden er zeer veel cognitieve klachten gerapporteerd door
volwassenen met ASS. Er was nauwelijks samenhang tussen prestaties op testen en de subjectief
ervaren klachten. Het kan zo zijn dat mensen met ASS het nodig achten om veel klachten te
rapporteren opdat zij adequate hulp krijgen, maar dit lijkt niet waarschijnlijk omdat proxies zelfs
nog meer moeilijkheden rapporteren als het om symptomatologie gaat dan de mensen met ASS
zelf (Hoofdstuk 2). Het kan echter ook te maken hebben met een focus op details of met het
versterkt ervaren van bepaalde gevoelens, gedachtes of situaties. In combinatie met het moeilijk
vinden om eigen klachten in perspectief te plaatsen, kunnen wellicht kleine cognitieve foutjes
geïnterpreteerd worden als daadwerkelijke moeilijkheden in plaats van iets dat door meerdere
personen wordt ervaren of passend is bij een bepaalde levensfase. Verder kunnen
persoonlijkheidskenmerken, bijkomende psychologische problemen of gezondheidsproblemen
een rol spelen. Tot slot kan het zijn dat neuropsychologische testen dagelijkse problemen niet
oppikken.
Naast het onderzoeken van cognitieve functies door middel van neuropsychologische
tests die in de klinische praktijk veel worden gebruikt, hebben we twee executieve functies
specifieker onderzocht door middel van experimentele tests. Hierdoor kunnen onderliggende
processen en eventuele problemen hierin beter in kaart worden gebracht. Executieve functies
zijn cognitieve functies die gebruikt worden voor het controleren, coördineren en uitvoeren van
doelgericht gedrag, zoals werkgeheugen (Hoofdstuk 5) en interferentiecontrole (Hoofdstuk 6).
Deze twee domeinen worden beide geassocieerd met de temporele integratie van informatie
(Fuster, 2002).
Werkgeheugen
Ook in Hoofdstuk 5 vonden we geen bewijs voor een versneld verouderingsproces van
werkgeheugen (N = 275). Werkgeheugen is het vermogen om informatie tijdelijk vast te houden
en te bewerken voor het uitvoeren van doelgericht gedrag. Controles lieten een geleidelijke
achteruitgang zien in werkgeheugen, terwijl ouderen met ASS zelfs iets beter leken te worden.
Hoewel passend bij een safeguard patroon, moet dit resultaat echter zeer voorzichtig
geïnterpreteerd worden. Door middel van Bayesian analyses waarmee we de evidentie voor een
162 | Dutch summary (Nederlandse samenvatting)
bepaalde hypothese ten opzichte van een andere hypothese konden toetsen, lieten we namelijk
zien dat evidentie voor een leeftijdseffect bij volwassenen met ASS heel erg klein is.
Daarnaast vonden we dat volwassenen met ASS niet slechter presteerden op een
werkgeheugen taak dan volwassenen zonder ASS. Wel hadden mensen met ASS meer tijd nodig
om tot een vergelijkbare prestatie te komen. Deze bevindingen waren tegenstrijdig met onze
verwachtingen, maar kunnen verklaard worden doordat de taak niet moeilijk genoeg was,
doordat verbaal werkgeheugen een belangrijkere rol speelde dan verwacht, of door individuele
verschillen. Hoewel kinderen met ASS werkgeheugenproblemen lieten zien op een vergelijkbare
taak, waren slechts een paar kinderen verantwoordelijk voor dit groepsverschil (de Vries &
Geurts, 2014). Het kan dus zijn dat werkgeheugenproblemen voorkomen bij een kleine groep
volwassenen, maar dit zou in toekomstig onderzoek verder onderzocht moeten worden.
Tot slot hebben we onderzocht of we leeftijd gerelateerde verschillen in werkgeheugen
konden voorspellen aan de hand van een aantal factoren die samenhangen met achteruitgang
van werkgeheugen bij typische veroudering en die een rol spelen bij ASS, zoals ASS ernst,
geslacht, psychopathologie, opleiding, geschat IQ, en verwerkingssnelheid. Alleen IQ bleek een
voorspeller, maar dit resultaat moet voorzichtig geïnterpreteerd worden gezien de grote
heterogeniteit van de groep met een lager IQ.
Interferentiecontrole
In Hoofdstuk 6 hebben we interferentiecontrole bestudeerd in twee onafhankelijke volwassen
steekproeven (Studie 1: N = 42; Studie 2: N = 278). Interferentiecontrole is het vermogen om
irrelevante informatie te negeren. Door middel van distributieanalyses konden we de temporele
dynamiek bekijken die ten grondslag ligt aan interferentiecontrole processen, zoals reactieve
controle (het vermogen om een conflict tussen een automatische respons en een intentionele
respons die tot het gewenste gedrag leidt te detecteren en op te lossen) en proactieve controle
(het vermogen om te anticiperen op een conflict). Ten eerste vonden we ook hier geen bewijs
voor een versnelde achteruitgang bij ASS. Op zowel reactieve als proactieve controle lieten
volwassenen met en zonder ASS hetzelfde patroon zien (parallel). Ten tweede zagen we een
vergelijkbare reactieve en proactieve controle bij volwassenen met en zonder ASS. Desondanks
was er een belangrijk verschil tussen jonge mannen (Studie 1) en middelbare en oudere mannen
en vrouwen (Studie 2). Over de volwassen levensloop waren mensen met ASS trager, maakten
ze minder fouten en waren ze minder gevoelig voor snelle foutieve responsen als gevolg van een
conflict dan controles. Dit verschil kwam niet naar voren bij jonge mannen met ASS. Deze
bevindingen doen vermoeden dat middelbare en oudere volwassenen met ASS een voorzichtiger
responsstrategie hanteren die nog niet geobserveerd wordt bij jongvolwassenen.

Dutch summary (Nederlandse samenvatting) | 163
CONCLUSIE
De resultaten beschreven in dit proefschrift zijn gebaseerd op de eerste grote cross-sectionele
cohort studie bij volwassenen met een leeftijd tot 80 jaar. Onze bevindingen kunnen worden
samengevat in vier hoofdconclusies. Een eerste belangrijke conclusie is dat we geen bewijs
hebben gevonden voor een versneld verouderingspatroon bij deze specifieke groep van
volwassenen met ASS. Hoewel cognitief functioneren op verschillende domeinen achteruitgaat
bij mensen met ASS, is dit vergelijkbaar met de leeftijd gerelateerde verschillen die we zien bij
volwassenen zonder ASS. Er zijn zelfs domeinen waarbij volwassenen met ASS een mindere
sterke achteruitgang laten zien. Mogelijk kan dit voor mensen met ASS een geruststelling zijn.
Een tweede belangrijke bevinding is dat cognitieve problemen die op de voorgrond
kunnen staan bij kinderen en adolescenten met ASS, zoals (werk)geheugenproblemen en
problemen met het onderdrukken van afleidende informatie, niet meer aanwezig lijken te zijn in
de volwassenheid. Moeilijkheden met het genereren van nieuwe oplossingen blijven echter wel
bestaan. Interessant genoeg wijzen onze resultaten er op dat verschillen ToM tussen ouderen
met en zonder ASS verdwijnen. Eventuele cognitieve problemen lijken echter gering bij deze
groep volwassenen en zijn slechts bij een klein aantal mensen als klinisch afwijkend te
beschouwen. De geobserveerde sterktes in cognitief functioneren bieden een bruikbaar
aanknopingspunt voor interventies voor volwassenen en ouderen met ASS.
Ondanks dat cognitieve problemen niet op de voorgrond lijken te staan, ervaren
volwassenen met ASS enorm veel klachten en een laag welbevinden (resultaten niet
gerapporteerd in proefschrift). Ze rapporteren ernstige ASS symptomatologie en psychologische
klachten en psychische stoornissen komen veelvuldig voor. Aansluitend bij deze derde conclusie,
is dat de perceptie van ASS kenmerken en depressie het hoogst is bij volwassenen op middelbare
leeftijd. Dit geeft aan dat het belangrijk is om in de klinische praktijk regelmatig te vragen naar
de beleving van symptomen en psychische klachten en rekening te houden met de kwetsbaarheid
van deze mensen.
Tot slot kunnen we concluderen dat er belangrijke verschillen zijn tussen subjectieve
beleving en objectieve maten en tussen persoonlijke beleving en de beleving van een
betekenisvolle informant (zoals een partner, ouder of vriend). Terwijl de eerste discrepantie
aanleiding geeft om uit te zoeken waar de verschillen vandaan komen, laat de tweede discrepantie
zien dat het belangrijk is om meerdere bronnen te betrekken bij de diagnostiek (zie ook Trimbos,
2013).
Hoewel individuele veranderingen in symptomatologie, bijkomende psychopathologie
en cognitief functioneren niet konden worden onderzocht in dit proefschrift, is een longitudinaal

164 | Dutch summary (Nederlandse samenvatting)
design de volgende stap waaraan we werken. Desondanks geven de huidige bevindingen
relevante inzichten voor ASS in de klinische praktijk en in de maatschappij. ASS is een
ontwikkelingsstoornis waarbij veel veranderingen optreden gedurende de levensloop en die een
levenslange impact heeft. Dit suggereert dat adequate interventies en ondersteuning om de
persoonlijke last van volwassenen met ASS te verminderen noodzakelijk zijn.

References
166 | References
Adams, N. C., & Jarrold, C. (2012). Inhibition in autism: Children with autism have difficulty inhibiting irrelevant distractors but not prepotent responses. Journal of Autism and Developmental Disorders, 42(6), 1052-1063.
Aman, M. G., Lam, K. S., & Van Bourgondien, M. E. (2005). Medication patterns in patients with autism: Temporal, regional, and demographic influences. Journal of Child & Adolescent Psychopharmacology, 15(1), 116-126.
American Psychiatric Association. (2000). Diagnostic and statistical manual of mental disorders (4th ed., text rev.). Washington, DC: Author.
American Psychiatric Association. (2013). The diagnostic and statistical manual of mental disorders (5th ed.). Washington, DC: Author.
Andersen, P. N., Skogli, E. W., Hovik, K. T., Geurts, H. M., Egeland, J., & Oie, M. (2014). Working memory arrest in children with high-functioning autism compared to children with attention-deficit/hyperactivity disorder: Results from a 2-year longitudinal study. Autism, doi:1362361314524844 [pii]
Arrindell, W. A., & Ettema, J. H. M. (2005). SCL-90. Handleiding bij een multidimensionale psychopathologie-indicator [SCL-90: Manual for a multidimensional indicator of psychopathology]. Amsterdam: Pearson.
Asperger, H. (1944). Die „Autistischen psychopathen” im kindesalter. European Archives of Psychiatry and Clinical Neuroscience, 117(1), 76-136.
Baddeley, A. D. (2003). Working memory: Looking back and looking forward. Nature Reviews Neuroscience, 4(10), 829-839.
Bailey, P. E., Henry, J. D., & Von Hippel, W. (2008). Empathy and social functioning in late adulthood. Aging and Mental Health, 12(4), 499-503.
Baltes, P. B., & Lindenberger, U. (1997). Emergence of a powerful connection between sensory and cognitive functions across the adult life span: A new window to the study of cognitive aging? Psychology and Aging, 12(1), 12-21.
Baltes, P. B., Staudinger, U. M., & Lindenberger, U. (1999). Lifespan psychology: Theory and application to intellectual functioning. Annual Review of Psychology, 50, 471-507.
Baranek, G. T., Parham, L. D., & Bodfish, J. W. (2005). Sensory and motor features in autism: Assessment and intervention. In F. R. Volkmar, R. H. Paul, A. Klin & J. D. Cohen (Eds.), Handbook of autism and pervasive developmental disorders: Assessment, interventions, and policy (vol. 2) (third ed., pp. 831-857) Wiley Online Library.
Barendse, E. M., Hendriks, M. P., Jansen, J. F., Backes, W. H., Hofman, P. A., Thoonen, G., . . . Aldenkamp, A. P. (2013). Working memory deficits in high-functioning adolescents with autism spectrum disorders: Neuropsychological and neuroimaging correlates. Journal of Neurodevelopmental Disorders, 5(1), 14. doi:10.1186/1866-1955-5-14 [doi]
Barker, M. J., Greenwood, K. M., Jackson, M., & Crowe, S. F. (2004). Cognitive effects of long-term benzodiazepine use. CNS Drugs, 18(1), 37-48.
Baron-Cohen, S., Leslie, A. M., & Frith, U. (1985). Does the autistic child have a “theory of mind”? Cognition, 21(1), 37-46.
Baron-Cohen, S., O'Riordan, M., Stone, V., Jones, R., & Plaisted, K. (1999). Recognition of faux pas by normally developing children and children with asperger syndrome or high-functioning autism. Journal of Autism and Developmental Disorders, 29(5), 407-418.
Baron-Cohen, S., Wheelwright, S., Skinner, R., Martin, J., & Clubley, E. (2001). The autism-spectrum quotient (AQ): Evidence from asperger syndrome/high-functioning autism, males and females, scientists and mathematicians. Journal of Autism and Developmental Disorders, 31(1), 5-17.
Bastiaansen, J. A., Meffert, H., Hein, S., Huizinga, P., Ketelaars, C., Pijnenborg, M., . . . de Bildt, A. (2011). Diagnosing autism spectrum disorders in adults: The use of autism diagnostic
References | 167
observation schedule (ADOS) module 4. Journal of Autism and Developmental Disorders, 41(9), 1256-1266.
Bastiaansen, J. A., Thioux, M., Nanetti, L., van der Gaag, C., Ketelaars, C., Minderaa, R., & Keysers, C. (2011). Age-related increase in inferior frontal gyrus activity and social functioning in autism spectrum disorder. Biological Psychiatry, 69(9), 832-838.
Beekman, A. T., Bremmer, M. A., Deeg, D. J., Van Balkom, A., Smit, J. H., De Beurs, E., . . . Van Tilburg, W. (1998). Anxiety disorders in later life: A report from the longitudinal aging study amsterdam. International Journal of Geriatric Psychiatry, 13(10), 717-726.
Beekman, A. T., de Beurs, E., van Balkom, A. J., Deeg, D. J., van Dyck, R., & van Tilburg, W. (2000). Anxiety and depression in later life: Co-occurrence and communality of risk factors. American Journal of Psychiatry, 157(1), 89-95.
Bellini, S. (2004). Social skill deficits and anxiety in high-functioning adolescents with autism spectrum disorders. Focus on Autism and Other Developmental Disabilities, 19(2), 78-86.
Benton, A. L., & Hamsher, K. D. E. S. (1989). Multilingual aphasia examination. Iowa City, IA: AJA Associates.
Bijl, R., Ravelli, A., & Van Zessen, G. (1998). Prevalence of psychiatric disorder in the general population: Results of the netherlands mental health survey and incidence study (NEMESIS). Social Psychiatry and Psychiatric Epidemiology, 33(12), 587-595.
Billstedt, E., Gillberg, C. I., & Gillberg, C. (2007). Autism in adults: Symptom patterns and early childhood predictors. use of the DISCO in a community sample followed from childhood. Journal of Child Psychology and Psychiatry, 48(11), 1102-1110.
Billstedt, E., Gillberg, I. C., & Gillberg, C. (2011). Aspects of quality of life in adults diagnosed with autism in childhood. Autism: The International Journal of Research & Practice, 15(1), 7-20.
Bishop, S. L., & Seltzer, M. M. (2012). Self-reported autism symptoms in adults with autism spectrum disorders. Journal of Autism and Developmental Disorders, 42(11), 2354-2363.
Bolla, K. I., Lindgren, K. N., Bonaccorsy, C., & Bleecker, M. L. (1990). Predictors of verbal fluency (FAS) in the healthy elderly. Journal of Clinical Psychology, 46(5), 623-628.
Borella, E., Carretti, B., & De Beni, R. (2008). Working memory and inhibition across the adult life-span. Acta Psychologica, 128(1), 33-44.
Botvinick, M. M., Braver, T. S., Barch, D. M., Carter, C. S., & Cohen, J. D. (2001). Conflict monitoring and cognitive control. Psychological Review, 108(3), 624-652.
Boucher, J., Mayes, A., & Bigham, S. (2012). Memory in autistic spectrum disorder. Psychological Bulletin, 138(3), 458-496.
Boucher, J. (2012). Putting theory of mind in its place: Psychological explanations of the socio-emotional-communicative impairments in autistic spectrum disorder. Autism : The International Journal of Research and Practice, 16(3), 226-246. doi:10.1177/1362361311430403 [doi]
Bowler, D. M. (2007). Autism spectrum disorder. psychological theory and research. Chichester, UK: Wiley.
Bowler, D. M., Limoges, E., & Mottron, L. (2009). Different verbal learning strategies in autism spectrum disorder: Evidence from the rey auditory verbal learning test. Journal of Autism and Developmental Disorders, 39(6), 910-915.
Bramham, J., Ambery, F., Morris, R., Russell, A., Asherson, P., & Murphy, D. (2009). Executive functioning differences between adults with attention deficit hyperactivity disorder and autistic spectrum disorder in initiation, planning and strategy formation. Autism, 13(3), 245-264.
Brandmaier, A. M., von Oertzen, T., McArdle, J. J., & Lindenberger, U. (2014). Exploratory data mining with structural equation model trees. In J. J. McArdle, & G. Ritschard (Eds.),
168 | References
Contemporary issues in exploratory data mining in the behavioral sciences (pp. 96-127). New York: Routledge.
Brandmaier, A. M., von Oertzen, T., McArdle, J. J., & Lindenberger, U. (2013). Structural equation model trees. Psychological Methods, 18(1), 71-86.
Braver, T. S. (2012). The variable nature of cognitive control: A dual mechanisms framework. Trends in Cognitive Sciences, 16(2), 106-113.
Broadbent, D. E., Cooper, P. F., FitzGerald, P., & Parkes, K. R. (1982). The cognitive failures questionnaire (CFQ) and its correlates. British Journal of Clinical Psychology, 21(1), 1-16.
Broadbent, J., Galic, I., & Stokes, M. A. (2013). Validation of autism spectrum quotient adult version in an australian sample. Autism Research and Treatment, 2013, 984205. doi:10.1155/2013/984205 [doi]
Broeders, M., Schmand, B., Wylie, S., de Bie, R. M. A., & Ridderinkhof, K. R. (in prep). Cognitive and motor deficits in parkinson's disease correspond to proactive and reactive control in a conflict task: A dissociation.
Brugha, T. S., Doos, L., Tempier, A., Einfeld, S., & Howlin, P. (2015). Outcome measures in intervention trials for adults with autism spectrum disorders; a systematic review of assessments of core autism features and associated emotional and behavioural problems. International Journal of Methods in Psychiatric Research, 24(2), 99-115.
Brugha, T. S., McManus, S., Bankart, J., Scott, F., Purdon, S., Smith, J., . . . Meltzer, H. (2011). Epidemiology of autism spectrum disorders in adults in the community in england. Archives of General Psychiatry, 68(5), 459-465.
Brunsdon, V. E., & Happé, F. G. E. (2014). Exploring the 'fractionation' of autism at the cognitive level. Autism, 18(1), 17-30.
Buck, T. R., Viskochil, J., Farley, M., Coon, H., McMahon, W. M., Morgan, J., & Bilder, D. A. (2014). Psychiatric comorbidity and medication use in adults with autism spectrum disorder. Journal of Autism and Developmental Disorders, 44(12), 3063-3071.
Carlson, E. N., Vazire, S., & Oltmanns, T. F. (2013). Self‐Other knowledge asymmetries in personality pathology. Journal of Personality, 81(2), 155-170.
Castel, A. D., Balota, D. A., Hutchison, K. A., Logan, J. M., & Yap, M. J. (2007). Spatial attention and response control in healthy younger and older adults and individuals with alzheimer's disease: Evidence for disproportionate selection impairments in the simon task. Neuropsychology, 21(2), 170-182.
Cath, D. C., Ran, N., Smit, J. H., van Balkom, A. J., & Comijs, H. C. (2008). Symptom overlap between autism spectrum disorder, generalized social anxiety disorder and obsessive-compulsive disorder in adults: A preliminary case-controlled study. Psychopathology, 41(2), 101-110.
Cederlund, M., Hagberg, B., & Gillberg, C. (2010). Asperger syndrome in adolescent and young adult males. interview, self-and parent assessment of social, emotional, and cognitive problems. Research in Developmental Disabilities, 31(2), 287-298.
Cederlund, M. (2008). Asperger syndrome and autism: A comparative longitudinal follow-up study more than 5 years after original diagnosis. J Autism Dev Disord, 38(1), 72-85.
Charlton, R. A., Barrick, T. R., Markus, H. S., & Morris, R. G. (2009). Theory of mind associations with other cognitive functions and brain imaging in normal aging. Psychology and Aging, 24(2), 338-348.
Chatham, C. H., Herd, S. A., Brant, A. M., Hazy, T. E., Miyake, A., O'Reilly, R., & Friedman, N. P. (2011). From an executive network to executive control: A computational model of the n-back task. Journal of Cognitive Neuroscience, 23(11), 3598-3619.
Christ, S. E., Holt, D. D., White, D. A., & Green, L. (2007). Inhibitory control in children with autism spectrum disorder. Journal of Autism and Developmental Disorders, 37(6), 1155-1165.
References | 169
Christ, S. E., Kester, L. E., Bodner, K. E., & Miles, J. H. (2011). Evidence for selective inhibitory impairment in individuals with autism spectrum disorder. Neuropsychology, 25(6), 690-701.
Chung, Y. S., Barch, D., & Strube, M. (2014). A meta-analysis of mentalizing impairments in adults with schizophrenia and autism spectrum disorder. Schizophrenia Bulletin, 40(3), 602-616.
Cicchetti, D. V. (1994). Guidelines, criteria, and rules of thumb for evaluating normed and standardized assessment instruments in psychology. Psychological Assessment, 6(4), 284-290.
Ciliberti, C., Gould, C., Smith, M., Chorney, D., & Edelstein, B. (2011). A preliminary investigation of developmentally sensitive items for the assessment of social anxiety in late life. Journal of Anxiety Disorders, 25(5), 686-689.
Comijs, H. C., Deeg, D. J. H., Dik, M. G., Twisk, J. W. R., & Jonker, C. (2002). Memory complaints; the association with psycho-affective and health problems and the role of personality characteristics: A 6-year follow-up study. Journal of Affective Disorders, 72(2), 157-165.
Conklin, H. M., Luciana, M., Hooper, C. J., & Yarger, R. S. (2007). Working memory performance in typically developing children and adolescents: Behavioral evidence of protracted frontal lobe development. Developmental Neuropsychology, 31(1), 103-128.
Cowan, N. (2014). Working memory underpins cognitive development, learning, and education. Educational Psychology Review, 26(2), 197-223.
Crane, L., Goddard, L., & Pring, L. (2009). Sensory processing in adults with autism spectrum disorders. Autism : The International Journal of Research and Practice, 13(3), 215-228. doi:10.1177/1362361309103794 [doi]
Croen, L. A., Zerbo, O., Qian, Y., Massolo, M. L., Rich, S., Sidney, S., & Kripke, C. (2015). The health status of adults on the autism spectrum. Autism : The International Journal of Research and Practice, 19(7), 814-823.
Davis, M. H. (1980). A multidimensional approach to individual differences in empathy. JSAS Catalog of Selected Documents in Psychology, 10, 85-104.
Davis, M. H. (1983). Measuring individual differences in empathy: Evidence for a multidimensional approach. Journal of Personality and Social Psychology, 44(1), 113-126. doi:10.1037/0022-3514.44.1.113
Davis, T. E., Moree, B. N., Dempsey, T., Reuther, E. T., Fodstad, J. C., Hess, J. A., . . . Matson, J. L. (2011). The relationship between autism spectrum disorders and anxiety: The moderating effect of communication. Research in Autism Spectrum Disorders, 5(1), 324-329.
de Bildt, A., & de Jonge, M. V. (2008). Autisme diagnostisch observatie schema. Amsterdam: Hogrefe. de Bruin, E. I., Ferdinand, R. F., Meester, S., de Nijs, P. F., & Verheij, F. (2007). High rates of
psychiatric co-morbidity in PDD-NOS. Journal of Autism and Developmental Disorders, 37(5), 877-886.
de Corte, K., Buysse, A., Verhofstadt, L. L., Roeyers, H., Ponnet, K., & Davis, M. H. (2007). Measuring empathic tendencies: Reliability and validity of the dutch version of the interpersonal reactivity index. Psychologica Belgica, 47(4), 235-260.
De Jong, R., Liang, C., & Lauber, E. (1994). Conditional and unconditional automaticity: A dual-process model of effects of spatial stimulus-response correspondence. Journal of Experimental Psychology: Human Perception and Performance, 20(4), 731-750.
De la Marche, W., Noens, I., Kuppens, S., Spilt, J. L., Boets, B., & Steyaert, J. (2015). Measuring quantitative autism traits in families: Informant effect or intergenerational transmission? European Child & Adolescent Psychiatry, 24(4), 385-395.
de Vries, M., & Geurts, H. M. (2014). Beyond individual differences: Are working memory and inhibition informative specifiers within ASD? Journal of Neural Transmission, 121(9), 1183-1198.
170 | References
De Waal, F. B. (2008). Putting the altruism back into altruism: The evolution of empathy. Annual Review of Psychology, 59, 279-300.
Deptula, D., & Pomara, N. (1990). Effects of antidepressants on human performance: A review. Journal of Clinical Psychopharmacology, 10(2), 105-111.
Derogatis, L. R. (1977). Administration, scoring, and procedures manual for the SCL-90-R. Baltimore, MD: Clinical Psychometrics Research.
Donders, F. C. (1869). On the speed of mental processes. Acta Psychologica, 30, 412-431. Duval, C., Piolino, P., Bejanin, A., Eustache, F., & Desgranges, B. (2011). Age effects on
different components of theory of mind. Consciousness and Cognition, 20(3), 627-642. Eenshuistra, R. M., Ridderinkhof, K. R., & van der Molen, M. W. (2004). Age-related changes
in antisaccade task performance: Inhibitory control or working-memory engagement? Brain and Cognition, 56(2), 177-188.
Egner, T. (2007). Congruency sequence effects and cognitive control. Cognitive, Affective, & Behavioral Neuroscience, 7(4), 380-390.
Engelhardt, P. E., Nigg, J. T., Carr, L. A., & Ferreira, F. (2008). Cognitive inhibition and working memory in attention-deficit/hyperactivity disorder. Journal of Abnormal Psychology, 117(3), 591-605.
Eriksen, B. A., & Eriksen, C. W. (1974). Effects of noise letters upon the identification of a target letter in a nonsearch task. Perception & Psychophysics, 16(1), 143-149.
Esbensen, A. J., Seltzer, M. M., Lam, K. S., & Bodfish, J. W. (2009). Age-related differences in restricted repetitive behaviors in autism spectrum disorders. Journal of Autism and Developmental Disorders, 39(1), 57-66.
Eysenck, S. B., Pearson, P. R., Easting, G., & Allsopp, J. F. (1985). Age norms for impulsiveness, venturesomeness and empathy in adults. Personality and Individual Differences, 6(5), 613-619.
Falter, C. M., Noreika, V., Wearden, J. H., & Bailey, A. J. (2012). More consistent, yet less sensitive: Interval timing in autism spectrum disorders. The Quarterly Journal of Experimental Psychology, 65(11), 2093-2107.
Ferri, C. P., Prince, M., Brayne, C., Brodaty, H., Fratiglioni, L., Ganguli, M., . . . Huang, Y. (2006). Global prevalence of dementia: A delphi consensus study. The Lancet, 366(9503), 2112-2117.
Fjell, A. M., Walhovd, K. B., Westlye, L. T., Østby, Y., Tamnes, C. K., Jernigan, T. L., . . . Dale, A. M. (2010). When does brain aging accelerate? dangers of quadratic fits in cross-sectional studies. NeuroImage, 50(4), 1376-1383.
Folstein, M. F., Folstein, S. E., & McHugh, P. R. (1975). “Mini-mental state”: A practical method for grading the cognitive state of patients for the clinician. Journal of Psychiatric Research, 12(3), 189-198.
Fombonne, E. (2009). Epidemiology of pervasive developmental disorders. Pediatric Research, 65(6), 591-598.
Fombonne, E. (2012). Autism in adult life. Canadian Journal of Psychiatry, 57(5), 273-274. Fozard, J. L. (1990). Vision and hearing in aging. Handbook of the Psychology of Aging, 3, 143-156. Friedman, D., Nessler, D., Cycowicz, Y. M., & Horton, C. (2009). Development of and change
in cognitive control: A comparison of children, young adults, and older adults. Cognitive, Affective & Behavioral Neuroscience, 9(1), 91-102.
Friedman, N. P., & Miyake, A. (2004). The relations among inhibition and interference control functions: A latent-variable analysis. Journal of Experimental Psychology: General, 133(1), 101-135. doi:10.1037/0096-3445.133.1.101
Frith, U. (1989). Autism: Explaining the enigma. Oxford: Blackwell. Frith, U. (2004). Emanuel miller lecture: Confusions and controversies about asperger syndrome.
Journal of Child Psychology and Psychiatry, 45(4), 672-686.
References | 171
Frith, U. (2012). Why we need cognitive explanations of autism. The Quarterly Journal of Experimental Psychology, 65(11), 2073-2092.
Frith, U., & Happé, F. G. E. (1994). Autism: Beyond “theory of mind”. Cognition, 50(1), 115-132. Fuster, J. M. (2002). Frontal lobe and cognitive development. Journal of Neurocytology, 31(3-5), 373-
385. Ganz, M. L. (2007). The lifetime distribution of the incremental societal costs of autism. Archives
of Pediatrics & Adolescent Medicine, 161(4), 343-349.
García‐Villamisar, D., & Rojahn, J. (2015). Comorbid psychopathology and stress mediate the relationship between autistic traits and repetitive behaviours in adults with autism. Journal of Intellectual Disability Research, 59(2), 116-124.
Gathercole, S. E., Pickering, S. J., Ambridge, B., & Wearing, H. (2004). The structure of working memory from 4 to 15 years of age. Developmental Psychology, 40(2), 177-190.
Geurts, H. M., & Jansen, M. D. (2012). A retrospective chart study: The pathway to a diagnosis for adults referred for ASD assessment. Autism, 16(3), 299-305.
Geurts, H. M., Luman, M., & Van Meel, C. S. (2008). What’s in a game: The effect of social motivation on interference control in boys with ADHD and autism spectrum disorders. Journal of Child Psychology and Psychiatry, 49(8), 848-857.
Geurts, H. M., Sinzig, J., Booth, R., & Happé, F. G. E. (2014). Neuropsychological heterogeneity in executive functioning in autism spectrum disorders. International Journal of Developmental Disabilities, 60(3), 155-162.
Geurts, H. M., Stek, M., & Comijs, H. (2016). Autism characteristics in older adults with depressive disorders. The American Journal of Geriatric Psychiatry, 24(2), 161-169.
Geurts, H. M., van den Bergh, S. F. W. M., & Ruzzano, L. (2014). Prepotent response inhibition
and interference control in autism spectrum disorders: Two Meta‐Analyses. Autism Research, 7(4), 407-420.
Geurts, H. M., & Vissers, M. E. (2012). Elderly with autism: Executive functions and memory. Journal of Autism and Developmental Disorders, 42(5), 665-675.
Ghaziuddin, M., Ghaziuddin, N., & Greden, J. (2002). Depression in persons with autism: Implications for research and clinical care. Journal of Autism and Developmental Disorders, 32(4), 299-306.
Ghaziuddin, M., & Zafar, S. (2008). Psychiatric comorbidity of adults with autism spectrum disorders. Clinical Neuropsychiatry, 5(1), 9-12.
Gillberg, C., & Steffenburg, S. (1987). Outcome and prognostic factors in infantile autism and similar conditions: A population-based study of 46 cases followed through puberty. Journal of Autism and Developmental Disorders, 17(2), 273-287.
Gillott, A., & Standen, P. (2007). Levels of anxiety and sources of stress in adults with autism. Journal of Intellectual Disabilities, 11(4), 359-370.
Goh, J. O., An, Y., & Resnick, S. M. (2012). Differential trajectories of age-related changes in components of executive and memory processes. Psychology and Aging, 27(3), 707-719.
Gonzalez-Gadea, M. L., Baez, S., Torralva, T., Castellanos, F. X., Rattazzi, A., Bein, V., . . . Ibanez, A. (2013). Cognitive variability in adults with ADHD and AS: Disentangling the roles of executive functions and social cognition. Research in Developmental Disabilities, 34(2), 817-830.
Gotham, K., Unruh, K., & Lord, C. (2015). Depression and its measurement in verbal adolescents and adults with autism spectrum disorder. Autism : The International Journal of Research and Practice, 19(4), 491-504.
Grandin, T. (2011). The way I see it: A personal look at autism & asperger's. Arlington, TX: Future Horizons.
172 | References
Gratton, G., Coles, M. G., & Donchin, E. (1992). Optimizing the use of information: Strategic control of activation of responses. Journal of Experimental Psychology: General, 121(4), 480-506.
Groden, J., Baron, M. G., & Groden, G. (2006). Assessment and coping strategies. In M. G. Baron, J. Groden, G. Groden & L. P. Lipsitt (Eds.), Stress and coping in autism (pp. 15-41). New York: Oxford University Press.
Grön, G., Kirstein, M., Thielscher, A., Riepe, M. W., & Spitzer, M. (2005). Cholinergic enhancement of episodic memory in healthy young adults. Psychopharmacology, 182(1), 170-179.
Grühn, D., Rebucal, K., Diehl, M., Lumley, M., & Labouvie-Vief, G. (2008). Empathy across the adult lifespan: Longitudinal and experience-sampling findings. Emotion, 8(6), 753-765.
Halladay, A. K., Bishop, S., Constantino, J. N., Daniels, A. M., Koenig, K., Palmer, K., . . . Szatmari, P. (2015). Sex and gender differences in autism spectrum disorder: Summarizing evidence gaps and identifying emerging areas of priority. Molecular Autism, 6, 36-015-0019-y. eCollection 2015. doi:10.1186/s13229-015-0019-y [doi]
Hallgren, K. A. (2012). Computing inter-rater reliability for observational data: An overview and tutorial. Tutorials in Quantitative Methods for Psychology, 8(1), 23-34.
Happé, F. G. E. (1999). Autism: Cognitive deficit or cognitive style? Trends in Cognitive Sciences, 3(6), 216-222.
Happé, F. G. E., & Booth, R. D. L. (2008). The power of the positive: Revisiting weak coherence in autism spectrum disorders. The Quarterly Journal of Experimental Psychology, 61(1), 50-63.
Happé, F. G. E., Booth, R. D. L., Charlton, R. A., & Hughes, C. (2006). Executive function deficits in autism spectrum disorders and attention-deficit/hyperactivity disorder: Examining profiles across domains and ages. Brain and Cognition, 61(1), 25-39.
Happé, F. G. E., & Charlton, R. A. (2012). Aging in autism spectrum disorders: A mini-review. Gerontology, 58(1), 70-78.
Happé, F. G. E., & Frith, U. (2006). The weak coherence account: Detail-focused cognitive style in autism spectrum disorders. Journal of Autism and Developmental Disorders, 36(1), 5-25.
Hasher, L., & Zacks, R. T. (1988). Working memory, comprehension, and aging: A review and a new view. Psychology of Learning and Motivation, 22, 193-225.
Heijnen-Kohl, S. M., & van Alphen, S. P. (2009). Diagnosis of autism spectrum disorders in older adults. [Diagnostiek van autismespectrumstoornissen bij ouderen] Tijdschrift Voor Psychiatrie, 51(5), 339-343. doi:TVPart_2783 [pii]
Henderson, H., Schwartz, C., Mundy, P., Burnette, C., Sutton, S., Zahka, N., & Pradella, A. (2006). Response monitoring, the error-related negativity, and differences in social behavior in autism. Brain and Cognition, 61(1), 96-109.
Henninger, N. A., & Taylor, J. L. (2013). Outcomes in adults with autism spectrum disorders: A historical perspective. Autism : The International Journal of Research and Practice, 17(1), 103-116. doi:10.1177/1362361312441266 [doi]
Herrman, H., Schofield, H., Murphy, B., Metelko, Z., Szabo, S., Pibernik-Okanovic, M., . . . Kumar, S. (1998). Development of the world health organization WHOQOL-BREF quality of life assessment. Psychological Medicine, 28(3), 551-558.
Hill, E. L. (2004). Executive dysfunction in autism. Trends in Cognitive Sciences, 8(1), 26-32. Hirschfeld, R. M. (1993). Personality disorders: Definition and diagnosis. Journal of Personality
Disorders, Vol Suppl 1, 9-17. Hockey, A., & Geffen, G. (2004). The concurrent validity and test–retest reliability of a
visuospatial working memory task. Intelligence, 32(6), 591-605.
References | 173
Hoekstra, R. A., Bartels, M., Cath, D. C., & Boomsma, D. I. (2008). Factor structure, reliability and criterion validity of the autism-spectrum quotient (AQ): A study in dutch population and patient groups. Journal of Autism and Developmental Disorders, 38(8), 1555-1566.
Hofvander, B., Delorme, R., Chaste, P., Nydén, A., Wentz, E., Ståhlberg, O., . . . Gillberg, C. (2009). Psychiatric and psychosocial problems in adults with normal-intelligence autism spectrum disorders. BMC Psychiatry, 9(1), 35-44.
Hohman, T. J., Beason-Held, L. L., Lamar, M., & Resnick, S. M. (2011). Subjective cognitive complaints and longitudinal changes in memory and brain function. Neuropsychology, 25(1), 125-130.
Holtmann, M., Bölte, S., & Poustka, F. (2007). Autism spectrum disorders: Sex differences in autistic behaviour domains and coexisting psychopathology. Developmental Medicine and Child Neurology, 49(5), 361-366.
Hommel, B. (1993). The relationship between stimulus processing and response selection in the simon task: Evidence for a temporal overlap. Psychological Research, 55(4), 280-290.
Hothorn, T., Hornik, K., & Zeileis, A. (2006). Party: A laboratory for recursive partitioning. R package version 0.9-11.
Howlin, P., & Moss, P. (2012). In review-adults with autism spectrum disorders. Canadian Journal of Psychiatry, 57(5), 275-283.
Howlin, P., Moss, P., Savage, S., & Rutter, M. (2013). Social outcomes in mid-to later adulthood among individuals diagnosed with autism and average nonverbal IQ as children. Journal of the American Academy of Child & Adolescent Psychiatry, 52(6), 572-581.
Hultsch, D. F. (1998). Memory change in the aged. Cambridge, UK: Cambridge University Press. IBM Corp. (2013). IBM SPSS statistics for windows (Version 22.0 ed.). Armonk, NY: IBM Corp. Idring, S., Rai, D., Dal, H., Dalman, C., Sturm, H., Zander, E., . . . Magnusson, C. (2012). Autism
spectrum disorders in the stockholm youth cohort: Design, prevalence and validity. PloS One, 7(7), e41280.
Jaeggi, S. M., Buschkuehl, M., Perrig, W. J., & Meier, B. (2010). The concurrent validity of the N-back task as a working memory measure. Memory, 18(4), 394-412.
James, I. A., Mukaetova‐Ladinska, E., Reichelt, F. K., Briel, R., & Scully, A. (2006). Diagnosing aspergers syndrome in the elderly: A series of case presentations. International Journal of Geriatric Psychiatry, 21(10), 951-960.
Jang, J., & Matson, J. L. (2015). Autism severity as a predictor of comorbid conditions. Journal of Developmental and Physical Disabilities, 27(3), 405-415.
Jarrold, C., & Towse, J. N. (2006). Individual differences in working memory. Neuroscience, 139(1), 39-50.
Jeffreys, H. (1935). Some tests of significance, treated by the theory of probability. Mathematical Proceedings of the Cambridge Philosophical Society, 31(02), 203-222.
Jeffreys, H. (1961). Theory of probability. Oxford, UK: Oxford University Press. John, O. P., & Robins, R. W. (1993). Determinants of interjudge agreement on personality traits:
The big five domains, observability, evaluativeness, and the unique perspective of the self. Journal of Personality, 61(4), 521-551.
Johnson, S. A., Filliter, J. H., & Murphy, R. R. (2009). Discrepancies between self-and parent-perceptions of autistic traits and empathy in high functioning children and adolescents on the autism spectrum. Journal of Autism and Developmental Disorders, 39(12), 1706-1714.
Jones, A. P., Happé, F. G. E., Gilbert, F., Burnett, S., & Viding, E. (2010). Feeling, caring, knowing: Different types of empathy deficit in boys with psychopathic tendencies and autism spectrum disorder. Journal of Child Psychology and Psychiatry, 51(11), 1188-1197.
174 | References
Jonker, C., Geerlings, M. I., & Schmand, B. (2000). Are memory complaints predictive for
dementia? A review of clinical and population‐based studies. International Journal of Geriatric Psychiatry, 15(11), 983-991.
Joshi, G., Wozniak, J., Petty, C., Martelon, M. K., Fried, R., Bolfek, A., . . . Bourgeois, M. (2013). Psychiatric comorbidity and functioning in a clinically referred population of adults with autism spectrum disorders: A comparative study. Journal of Autism and Developmental Disorders, 43(6), 1314-1325.
Kanner, L. (1943). Autistic disturbances of affective contact. Nervous Child, 2, 217-250. Kanner, L. (1944). Early infantile autism. The Journal of Pediatrics, 25(3), 211-217. Kanner, L. (1971). Follow-up study of eleven autistic children originally reported in 1943. Journal
of Autism and Childhood Schizophrenia, 1(2), 119-145. Kass, R. E., & Raftery, A. E. (1995). Bayes factors. Journal of the American Statistical Association,
90(430), 773-795. Kawai, N., Kubo-Kawai, N., Kubo, K., Terazawa, T., & Masataka, N. (2012). Distinct aging
effects for two types of inhibition in older adults: A near-infrared spectroscopy study on the simon task and the flanker task. Neuroreport, 23(14), 819-824.
Kemp, J., Després, O., Sellal, F., & Dufour, A. (2012). Theory of mind in normal ageing and neurodegenerative pathologies. Ageing Research Reviews, 11(2), 199-219.
Kern, J. K., Trivedi, M. H., Garver, C. R., Grannemann, B. D., Andrews, A. A., Savla, J. S., . . . Schroeder, J. L. (2006). The pattern of sensory processing abnormalities in autism. Autism : The International Journal of Research and Practice, 10(5), 480-494. doi:10/5/480 [pii]
Kerns, C. M., & Kendall, P. C. (2012). The presentation and classification of anxiety in autism spectrum disorder. Clinical Psychology-Science and Practice, 19(4), 323-347.
Kessler, R. C., Berglund, P., Demler, O., Jin, R., Merikangas, K. R., & Walters, E. E. (2005). Lifetime prevalence and age-of-onset distributions of DSM-IV disorders in the national comorbidity survey replication. Archives of General Psychiatry, 62(6), 593-602.
Ketelaars, C., Horwitz, E., Sytema, S., Bos, J., Wiersma, D., Minderaa, R., & Hartman, C. A. (2008). Brief report: Adults with mild autism spectrum disorders (ASD): Scores on the autism spectrum quotient (AQ) and comorbid psychopathology. Journal of Autism and Developmental Disorders, 38(1), 176-180.
Kievit, R. A., & Geurts, H. M. (2011). Autism and perception of awareness in self and others: Two sides of the same coin or dissociated abilities? Cognitive Neuroscience, 2(2), 119-120.
Kohane, I. S., McMurry, A., Weber, G., MacFadden, D., Rappaport, L., Kunkel, L., . . . Churchill, S. (2012). The co-morbidity burden of children and young adults with autism spectrum disorders. PloS One, 7(4), e33224. doi:10.1371/journal.pone.0033224 [doi]
Kok, R. M., & Verhey, F. R. J. (2002). Dutch translation of the mini mental state examination (folstein et al., 1975).
Kooij, J., Burger, H., Boonstra, A., Van der Linden, P., Kalma, L., & Buitelaar, J. (2004). Efficacy and safety of methylphenidate in 45 adults with attention-deficit/hyperactivity disorder. A randomized placebo-controlled double-blind cross-over trial. Psychological Medicine, 34(06), 973-982.
Kooij, J. J. S., Buitelaar, J. K., van den Oord, E. J., Furer, J. W., Rijnders, C. A. T., & Hodiamont, P. P. G. (2005). Internal and external validity of attention-deficit hyperactivity disorder in a population-based sample of adults. Psychological Medicine, 35(06), 817-827.
Kooij, J. J. S., Marije Boonstra, A., Swinkels, S. H., Bekker, E. M., de Noord, I., & Buitelaar, J. K. (2008). Reliability, validity, and utility of instruments for self-report and informant report concerning symptoms of ADHD in adult patients. Journal of Attention Disorders, 11(4), 445-458.
References | 175
Kornblum, S., Hasbroucq, T., & Osman, A. (1990). Dimensional overlap: Cognitive basis for stimulus-response compatibility--a model and taxonomy. Psychological Review, 97(2), 253-270.
Koshino, H., Carpenter, P. A., Minshew, N. J., Cherkassky, V. L., Keller, T. A., & Just, M. A. (2005). Functional connectivity in an fMRI working memory task in high-functioning autism. NeuroImage, 24(3), 810-821.
Koshino, H., Kana, R. K., Keller, T. A., Cherkassky, V. L., Minshew, N. J., & Just, M. A. (2008). fMRI investigation of working memory for faces in autism: Visual coding and underconnectivity with frontal areas. Cerebral Cortex, 18(2), 289-300.
Kurita, H., Koyama, T., & Osada, H. (2005). Autism‐Spectrum Quotient–Japanese version and its short forms for screening normally intelligent persons with pervasive developmental disorders. Psychiatry and Clinical Neurosciences, 59(4), 490-496.
Labouvie-Vief, G. (2009). Dynamic integration theory: Emotion, cognition, and equilibrium in later life. In V. L. Bengston, D. Gans, N. M. Pulney & M. Silverstein (Eds.), Handbook of theories of aging (pp. 277-293). New York: Springer Publishing Co.
Lachman, M. E. (2004). Development in midlife. Annual Review of Psychology, 55, 305-331. Lai, M., & Baron-Cohen, S. (2015). Identifying the lost generation of adults with autism spectrum
conditions. The Lancet Psychiatry, 2(11), 1013-1027. Lai, M., Lombardo, M. V., Auyeung, B., Chakrabarti, B., & Baron-Cohen, S. (2015). Sex/gender
differences and autism: Setting the scene for future research. Journal of the American Academy of Child & Adolescent Psychiatry, 54(1), 11-24.
Lai, M., Lombardo, M. V., Pasco, G., Ruigrok, A., Wheelwright, S. J., Sadek, S. A., . . . Baron-Cohen, S. (2011). A behavioral comparison of male and female adults with high functioning autism spectrum conditions. PloS One, 6(6), e20835.
Lainhart, J. E. (1999). Psychiatric problems in individuals with autism, their parents and siblings. International Review of Psychiatry, 11(4), 278-298.
Lane, C. J., & Zelinski, E. M. (2003). Longitudinal hierarchical linear models of the memory functioning questionnaire. Psychology and Aging, 18(1), 38-53.
Larson, M. J., South, M., Clayson, P. E., & Clawson, A. (2012). Cognitive control and conflict
adaptation in youth with high‐functioning autism. Journal of Child Psychology and Psychiatry, 53(4), 440-448.
LeBreton, J. M., & Senter, J. L. (2007). Answers to 20 questions about interrater reliability and interrater agreement. Organizational Research Methods, 11(4), 815-852.
Lecrubier, Y., Sheehan, D., Weiller, E., Amorim, P., Bonora, I., Harnett Sheehan, K., . . . Dunbar, G. (1997). The mini international neuropsychiatric interview (MINI). A short diagnostic structured interview: Reliability and validity according to the CIDI. European Psychiatry, 12(5), 224-231.
Leising, D., Erbs, J., & Fritz, U. (2010). The letter of recommendation effect in informant ratings of personality. Journal of Personality and Social Psychology, 98(4), 668-682.
Lejbak, L., Crossley, M., & Vrbancic, M. (2011). A male advantage for spatial and object but not verbal working memory using the n-back task. Brain and Cognition, 76(1), 191-196.
Lever, A. G., & Geurts, H. M. (2012). Vragenlijst voor sensorische gevoeligheid. Unpublished, University of Amsterdam, Amsterdam.
Lever, A. G., & Geurts, H. M. (2015). Age-related differences in cognition across the adult lifespan in autism spectrum disorder. Autism Research, doi:10.1002/aur.1545 [pii]
Lever, A. G., & Geurts, H. M. (2016). Lifelong lasting? Self- and other-reported ASD symptoms across adulthood. Manuscript submitted for publication.
176 | References
Lever, A. G., Werkle-Bergner, M., Brandmaier, A. M., Ridderinkhof, K. R., & Geurts, H. M. (2015). Atypical working memory decline across the adult lifespan in autism spectrum disorder? Journal of Abnormal Psychology, 124(4), 1014-1026.
Levy, A., & Perry, A. (2011). Outcomes in adolescents and adults with autism: A review of the literature. Research in Autism Spectrum Disorders, 5(4), 1271-1282.
Leyfer, O. T., Folstein, S. E., Bacalman, S., Davis, N. O., Dinh, E., Morgan, J., . . . Lainhart, J. E. (2006). Comorbid psychiatric disorders in children with autism: Interview development and rates of disorders. Journal of Autism and Developmental Disorders, 36(7), 849-861.
Lindenberger, U., Von Oertzen, T., Ghisletta, P., & Hertzog, C. (2011). Cross-sectional age variance extraction: What's change got to do with it? Psychology and Aging, 26(1), 34-47.
Lobo, A., Launer, L. J., Fratiglioni, L., Andersen, K., Di Carlo, A., Breteler, M. M., . . . Hofman, A. (2000). Prevalence of dementia and major subtypes in europe: A collaborative study of population-based cohorts. neurologic diseases in the elderly research group. Neurology, 54(11 Suppl 5), S4-9.
Logan, S. L., Carpenter, L., Leslie, R. S., Garrett-Mayer, E., Hunt, K. J., Charles, J., & Nicholas, J. S. (2015). Aberrant behaviors and co-occurring conditions as predictors of psychotropic polypharmacy among children with autism spectrum disorders. Journal of Child and Adolescent Psychopharmacology, 25(4), 323-336.
Lopez, B. R., Lincoln, A. J., Ozonoff, S., & Lai, Z. (2005). Examining the relationship between executive functions and restricted, repetitive symptoms of autistic disorder. Journal of Autism and Developmental Disorders, 35(4), 445-460.
Lord, C., Risi, S., Lambrecht, L., Cook Jr, E. H., Leventhal, B. L., DiLavore, P. C., . . . Rutter, M. (2000). The autism diagnostic observation Schedule—Generic: A standard measure of social and communication deficits associated with the spectrum of autism. Journal of Autism and Developmental Disorders, 30(3), 205-223.
Lövdén, M., Ghisletta, P., & Lindenberger, U. (2005). Social participation attenuates decline in perceptual speed in old and very old age. Psychology and Aging, 20(3), 423-434.
Love, J., Marsman, M., Jamil, T., Ly, A., Verhagen, J., Selker, R., . . . Wagenmakers, E. -. (submitted). Bayesian benefits with JASP: A fresh way to do statistics.
Love, J., Selker, R., Verhagen, A. J., Smira, M., Wild, A., Marsman, M., . . . Wagenmakers, E. J. (2015a). JASP (version 0.7.0)
Love, J., Selker, R., Verhagen, J., Marsman, M., Gronau, Q. F., Jamil, T., . . . Rouder, J. N. (2015b). Software to sharpen your stats. APS Observer, USA: Association for Psychological Science, 28(3), 27-29.
Lozier, L. M., Vanmeter, J. W., & Marsh, A. A. (2014). Impairments in facial affect recognition associated with autism spectrum disorders: A meta-analysis. Development and Psychopathology, 26(4pt1), 933-945.
Lugnegård, T., Hallerbäck, M. U., & Gillberg, C. (2011). Psychiatric comorbidity in young adults with a clinical diagnosis of asperger syndrome. Research in Developmental Disabilities, 32(5), 1910-1917.
Luna, B., Doll, S. K., Hegedus, S. J., Minshew, N. J., & Sweeney, J. A. (2007). Maturation of executive function in autism. Biological Psychiatry, 61(4), 474-481.
Lundström, S., Reichenberg, A., Melke, J., Råstam, M., Kerekes, N., Lichtenstein, P., . . . Anckarsäter, H. (2015). Autism spectrum disorders and coexisting disorders in a nationwide swedish twin study. Journal of Child Psychology and Psychiatry, 56(6), 702-710.
Luteijn, F., & Barelds, D. P. H. (2004). Groningen intelligence test 2 (GIT-2): Manual. Amsterdam: Pearson Assessment.
References | 177
Magiati, I., Tay, X. W., & Howlin, P. (2014). Cognitive, language, social and behavioural outcomes in adults with autism spectrum disorders: A systematic review of longitudinal follow-up studies in adulthood. Clinical Psychology Review, 34(1), 73-86.
Matson, J. L., & Cervantes, P. E. (2014). Commonly studied comorbid psychopathologies among persons with autism spectrum disorder. Research in Developmental Disabilities, 35(5), 952-962.
Matson, J. L., & Shoemaker, M. (2009). Intellectual disability and its relationship to autism spectrum disorders. Research in Developmental Disabilities, 30(6), 1107-1114.
Mattila, M., Hurtig, T., Haapsamo, H., Jussila, K., Kuusikko-Gauffin, S., Kielinen, M., . . . Joskitt, L. (2010). Comorbid psychiatric disorders associated with asperger syndrome/high-functioning autism: A community-and clinic-based study. Journal of Autism and Developmental Disorders, 40(9), 1080-1093.
Maylor, E. A., Moulson, J. M., Muncer, A., & Taylor, L. A. (2002). Does performance on theory of mind tasks decline in old age? British Journal of Psychology, 93(4), 465-485.
McGraw, K. O., & Wong, S. P. (1996). Forming inferences about some intraclass correlation coefficients. Psychological Methods, 1(1), 30.
Merckelbach, H., Muris, P., Nijman, H., & de Jong, P. J. (1996). Self-reported cognitive failures and neurotic symptomatology. Personality and Individual Differences, 20(6), 715-724.
Minshew, N. J., & Hobson, J. A. (2008). Sensory sensitivities and performance on sensory perceptual tasks in high-functioning individuals with autism. Journal of Autism and Developmental Disorders, 38(8), 1485-1498.
Molloy, D. W., Alemayehu, E., & Roberts, R. (1991). A standardized mini-mental state examination (SMMSE): Improved reliability compared to the traditional MMSE. American Journal of Psychiatry, 148, 102-105.
Moran, J. M. (2013). Lifespan development: The effects of typical aging on theory of mind. Behavioural Brain Research, 237, 32-40.
Moss, P., Howlin, P., Savage, S., Bolton, P., & Rutter, M. (2015). Self and informant reports of mental health difficulties among adults with autism findings from a long-term follow-up study. Autism, 19(7), 832-841.
Mottron, L., Dawson, M., Soulieres, I., Hubert, B., & Burack, J. (2006). Enhanced perceptual functioning in autism: An update, and eight principles of autistic perception. Journal of Autism and Developmental Disorders, 36(1), 27-43.
Mukaddes, N. M., Hergüner, S., & Tanidir, C. (2010). Psychiatric disorders in individuals with high-functioning autism and asperger's disorder: Similarities and differences. The World Journal of Biological Psychiatry, 11(8), 964-971.
Mukaetova‐Ladinska, E. B., Perry, E., Baron, M., & Povey, C. (2012). Ageing in people with autistic spectrum disorder. International Journal of Geriatric Psychiatry, 27(2), 109-118.
Mulder, J. L., Dekker, P. H., & Dekker, R. (2006). Woord-fluency test & figuur-fluency test. Leiden, the Netherlands: PITS Publisher.
Nagel, I. E., Chicherio, C., Li, S. C., von Oertzen, T., Sander, T., Villringer, A., . . . Lindenberger, U. (2008). Human aging magnifies genetic effects on executive functioning and working memory. Frontiers in Human Neuroscience, 2, 1. doi:10.3389/neuro.09.001.2008 [doi]
National Institute for Health and Clinical Excellence. (2012). Autism: Recognition, referral, diagnosis and management of adults on the autism spectrum. NICE clinical guideline 142. doi:Available at http://guidance.nice.org.uk/CG142 [NICE guideline]
Nieuwenhuis, S., Ridderinkhof, K. R., Talsma, D., Coles, M. G. H., Holroyd, C. B., Kok, A., & Van der Molen, M. W. (2002). A computational account of altered error processing in older age: Dopamine and the error-related negativity. Cognitive, Affective, & Behavioral Neuroscience, 2(1), 19-36.
178 | References
Nigg, J. T. (2000). On inhibition/disinhibition in developmental psychopathology: Views from cognitive and personality psychology and a working inhibition taxonomy. Psychological Bulletin, 126(2), 220-246.
Nyberg, L., Lövdén, M., Riklund, K., Lindenberger, U., & Bäckman, L. (2012). Memory aging and brain maintenance. Trends in Cognitive Sciences, 16(5), 292-305.
Oberman, L. M., & Pascual-Leone, A. (2014). Hyperplasticity in autism spectrum disorder confers protection from alzheimer’s disease. Medical Hypotheses, 83(3), 337-342.
O'Brien, E., Konrath, S. H., Gruhn, D., & Hagen, A. L. (2013). Empathic concern and perspective taking: Linear and quadratic effects of age across the adult life span. The Journals of Gerontology.Series B, Psychological Sciences and Social Sciences, 68(2), 168-175. doi:10.1093/geronb/gbs055 [doi]
O'Hearn, K., Asato, M., Ordaz, S., & Luna, B. (2008). Neurodevelopment and executive function in autism. Development and Psychopathology, 20(04), 1103-1132.
Ozonoff, S., Goodlin-Jones, B. L., & Solomon, M. (2005). Evidence-based assessment of autism spectrum disorders in children and adolescents. Journal of Clinical Child and Adolescent Psychology, 34(3), 523-540.
Ozonoff, S., & Strayer, D. L. (2001). Further evidence of intact working memory in autism. Journal of Autism and Developmental Disorders, 31(3), 257-263.
Park, D. C., Lautenschlager, G., Hedden, T., Davidson, N. S., Smith, A. D., & Smith, P. K. (2002). Models of visuospatial and verbal memory across the adult life span. Psychology and Aging, 17(2), 299-320.
Park, D. C., & Reuter-Lorenz, P. (2009). The adaptive brain: Aging and neurocognitive scaffolding. Annual Review of Psychology, 60, 173-196.
Paterniti, S., Verdier-Taillefer, M. H., Dufouil, C., & Alperovitch, A. (2002). Depressive symptoms and cognitive decline in elderly people. longitudinal study. The British Journal of Psychiatry : The Journal of Mental Science, 181, 406-410.
Pennington, B. F., & Ozonoff, S. (1996). Executive functions and developmental psychopathology. Journal of Child Psychology and Psychiatry, 37(1), 51-87.
Perkins, E. A., & Berkman, K. A. (2012). Into the unknown: Aging with autism spectrum disorders. American Journal on Intellectual and Developmental Disabilities, 117(6), 478-496.
Pick, D. F., & Proctor, R. W. (1999). Age differences in the effects of irrelevant location information. In M. W. Scerbo, & M. Mouloua (Eds.), Automation technology and human performance: Current research and trends (pp. 258-261). Mahwah, NJ: Lawrence Erlbaum Associates.
Piven, J., Harper, J., Palmer, P., & Arndt, S. (1996). Course of behavioral change in autism: A retrospective study of high-IQ adolescents and adults. Journal of the American Academy of Child & Adolescent Psychiatry, 35(4), 523-529.
Piven, J., & Rabins, P. (2011). Autism spectrum disorders in older adults: Toward defining a research agenda. Journal of the American Geriatrics Society, 59(11), 2151-2155.
Ponds, R. W. H. M., van Boxtel, M. P. J., & Jolles, J. (2000). Age-related changes in subjective cognitive functioning. Educational Gerontology, 26(1), 67-81.
Proctor, R. W., Miles, J. D., & Baroni, G. (2011). Reaction time distribution analysis of spatial correspondence effects. Psychonomic Bulletin & Review, 18(2), 242-266.
Proctor, R. W., Pick, D. F., Vu, K. L., & Anderson, R. E. (2005). The enhanced simon effect for older adults is reduced when the irrelevant location information is conveyed by an accessory stimulus. Acta Psychologica, 119(1), 21-40.
Puccioni, O., & Vallesi, A. (2012). Conflict resolution and adaptation in normal aging: The role of verbal intelligence and cognitive reserve. Psychology and Aging, 27(4), 1018-1026.
R Core Team. (2012). R: A language and environment for statistical computing.
References | 179
Rabbitt, P. (1979). How old and young subjects monitor and control responses for accuracy and speed. British Journal of Psychology, 70(2), 305-311.
Ratcliff, R., & McKoon, G. (2008). The diffusion decision model: Theory and data for two-choice decision tasks. Neural Computation, 20(4), 873-922.
Raymaekers, R., van der Meere, J., & Roeyers, H. (2004). Event-rate manipulation and its effect on arousal modulation and response inhibition in adults with high functioning autism. Journal of Clinical and Experimental Neuropsychology, 26(1), 74-82.
Raz, N., & Lindenberger, U. (2011). Only time will tell: Cross-sectional studies offer no solution to the age–brain–cognition triangle: Comment on salthouse (2011). Psychological Bulletin, 137(5), 790-795.
Redick, T. S., & Lindsey, D. R. (2013). Complex span and n-back measures of working memory: A meta-analysis. Psychonomic Bulletin & Review, 20(6), 1102-1113.
Rey, A. (1964). L'examen clinique en psychologie. Paris: Presses Universitaires de France. Ridderinkhof, K. R. (2002). Activation and suppression in conflict tasks: Empirical clarification
through distributional analyses. In W. Prinz, & B. Hommel (Eds.), Attention and performance (Common Mechanisms in Perception and Action ed., pp. 494-519). Oxford: Oxford University Press.
Ridderinkhof, K. R., Forstmann, B. U., Wylie, S. A., Burle, B., & van den Wildenberg, W. P. M. (2011). Neurocognitive mechanisms of action control: Resisting the call of the sirens. Wiley Interdisciplinary Reviews: Cognitive Science, 2(2), 174-192.
Ridderinkhof, K. R., Scheres, A., Oosterlaan, J., & Sergeant, J. A. (2005). Delta plots in the study of individual differences: New tools reveal response inhibition deficits in AD/hd that are eliminated by methylphenidate treatment. Journal of Abnormal Psychology, 114(2), 197-215.
Ridderinkhof, K. R., van den Wildenberg, W. P. M., Segalowitz, S. J., & Carter, C. S. (2004). Neurocognitive mechanisms of cognitive control: The role of prefrontal cortex in action selection, response inhibition, performance monitoring, and reward-based learning. Brain and Cognition, 56(2), 129-140.
Ridderinkhof, K. R., van der Molen, M. W., & Bashore, T. R. (1995). Limits on the application of additive factors logic: Violations of stage robustness suggest a dual-process architecture to explain flanker effects on target processing. Acta Psychologica, 90(1), 29-48.
Ring, M., Gaigg, S. B., & Bowler, D. M. (2015). Object‐location memory in adults with autism spectrum disorder. Autism Research, 8(5), 609-619.
Ring, M., Gaigg, S. B., & Bowler, D. M. (2016). Relational memory processes in adults with autism spectrum disorder. Autism Research, 9(1), 97-106.
Ringe, W. K., Saine, K. C., Lacritz, L. H., Hynan, L. S., & Cullum, C. M. (2002). Dyadic short forms of the wechsler adult intelligence scale-III. Assessment, 9(3), 254-260.
Robertson, A. E., & Simmons, D. R. (2013). The relationship between sensory sensitivity and autistic traits in the general population. Journal of Autism and Developmental Disorders, 43(4), 775-784.
Rogers, K., Dziobek, I., Hassenstab, J., Wolf, O. T., & Convit, A. (2007). Who cares? revisiting empathy in asperger syndrome. Journal of Autism and Developmental Disorders, 37(4), 709-715.
Rosenthal, M., Wallace, G. L., Lawson, R., Wills, M. C., Dixon, E., Yerys, B. E., & Kenworthy, L. (2013). Impairments in real-world executive function increase from childhood to adolescence in autism spectrum disorders. Neuropsychology, 27(1), 13-18.
Rouder, J. N., Speckman, P. L., Sun, D., Morey, R. D., & Iverson, G. (2009). Bayesian t tests for accepting and rejecting the null hypothesis. Psychonomic Bulletin & Review, 16(2), 225-237.
Roy, M., Prox-Vagedes, V., Ohlmeier, M. D., & Dillo, W. (2015). Beyond childhood: Psychiatric comorbidities and social background of adults with asperger syndrome. Psychiatria Danubina, 27(1), 50-59.
180 | References
Rumsey, J. M., & Hamburger, S. D. (1988). Neuropsychological findings in high-functioning men with infantile autism, residual state. Journal of Clinical and Experimental Neuropsychology, 10(2), 201-221.
Rumsey, J. M., Rapoport, J. L., & Sceery, W. R. (1985). Autistic children as adults: Psychiatric, social, and behavioral outcomes. Journal of the American Academy of Child Psychiatry, 24(4), 465-473.
Russell, J. E. (1997). Autism as an executive disorder. Oxford, UK: Oxford University Press. Russo, N., Flanagan, T., Iarocci, G., Berringer, D., Zelazo, P. D., & Burack, J. A. (2007).
Deconstructing executive deficits among persons with autism: Implications for cognitive neuroscience. Brain and Cognition, 65(1), 77-86.
Rutter, M. (2005). Incidence of autism spectrum disorders: Changes over time and their meaning*. Acta Paediatrica, 94(1), 2-15.
Ruzich, E., Allison, C., Smith, P., Watson, P., Auyeung, B., Ring, H., & Baron-Cohen, S. (2015). Measuring autistic traits in the general population: A systematic review of the autism-spectrum quotient (AQ) in a nonclinical population sample of 6,900 typical adult males and females. Molecular Autism, 6(2) doi:10.1186/2040-2392-6-2
Saan, R., & Deelman, B. (1986). The 15-words test A and B (A preliminary manual). Groningen, the Netherlands: University Hospital, Department of Neuropsychology.
Sahakian, B., & Morein-Zamir, S. (2007). Professor's little helper. Nature, 450(7173), 1157-1159. Salthouse, T. A., & Meinz, E. J. (1995). Aging, inhibition, working memory, and speed. The
Journals of Gerontology Series B: Psychological Sciences and Social Sciences, 50(6), 297. Salthouse, T. A. (1979). Adult age and the speed-accuracy trade-off. Ergonomics, 22(7), 811-821. Salthouse, T. A. (1996). The processing-speed theory of adult age differences in cognition.
Psychological Review, 103(3), 403-428. Salthouse, T. A. (2009). When does age-related cognitive decline begin? Neurobiology of Aging,
30(4), 507-514. Salthouse, T. A., & Miles, J. D. (2002). Aging and time-sharing aspects of executive control.
Memory & Cognition, 30(4), 572-582. Samson, F., Mottron, L., Soulieres, I., & Zeffiro, T. A. (2012). Enhanced visual functioning in
autism: An ALE meta‐analysis. Human Brain Mapping, 33(7), 1553-1581. Sander, M. C., Lindenberger, U., & Werkle-Bergner, M. (2012). Lifespan age differences in
working memory: A two-component framework. Neuroscience & Biobehavioral Reviews, 36(9), 2007-2033.
Sartorius, N., Üstün, T. B., Lecrubier, Y., & Wittchen, H. (1996). Depression comorbid with anxiety: Results from the WHO study on "psychological disorders in primary health care". The British Journal of Psychiatry, 168(30), 38-43.
Scheeren, A. M., de Rosnay, M., Koot, H. M., & Begeer, S. (2013). Rethinking theory of mind in
high‐functioning autism spectrum disorder. Journal of Child Psychology and Psychiatry, 54(6), 628-635.
Schmand, B., Groenink, S., & Van den Dungen, M. (2008). Letterfluency: Psychometrische eigenschappen en nederlandse normen. Tijdschrift Voor Gerontologie En Geriatrie, 39(2), 64-74.
Schmitz, N., Rubia, K., Daly, E., Smith, A., Williams, S., & Murphy, D. G. (2006). Neural correlates of executive function in autistic spectrum disorders. Biological Psychiatry, 59(1), 7-16.
Seltzer, M. M., Shattuck, P., Abbeduto, L., & Greenberg, J. S. (2004). Trajectory of development in adolescents and adults with autism. Mental Retardation and Developmental Disabilities Research Reviews, 10(4), 234-247.
References | 181
Senju, A., Southgate, V., White, S., & Frith, U. (2009). Mindblind eyes: An absence of spontaneous theory of mind in asperger syndrome. Science (New York, N.Y.), 325(5942), 883-885. doi:10.1126/science.1176170 [doi]
Severens, E., Lommel, S. V., Ratinckx, E., & Hartsuiker, R. J. (2005). Timed picture naming norms for 590 pictures in dutch. Acta Psychologica, 119(2), 159-187.
Shattuck, P. T., Seltzer, M. M., Greenberg, J. S., Orsmond, G. I., Bolt, D., Kring, S., . . . Lord, C. (2007). Change in autism symptoms and maladaptive behaviors in adolescents and adults with an autism spectrum disorder. Journal of Autism and Developmental Disorders, 37(9), 1735-1747.
Sheehan, D., Lecrubier, Y., Harnett Sheehan, K., Janavs, J., Weiller, E., Keskiner, A., . . . Dunbar, G. (1997). The validity of the mini international neuropsychiatric interview (MINI) according to the SCID-P and its reliability. European Psychiatry, 12(5), 232-241.
Sheehan, D., Lecrubier, Y., Sheehan, K., Amorim, P., Janavs, J., Weiller, E., . . . Dunbar, G. (1998). The mini-international neuropsychiatric interview ( M.I.N.I.): The development and validation of a structured diagnostic psychiatric interview for DSM-IV and ICD-10. Journal of Clinical Psychiatry, 59, 22-33.
Shrout, P. E., & Fleiss, J. L. (1979). Intraclass correlations: Uses in assessing rater reliability. Psychological Bulletin, 86(2), 420-428.
Simon, J. R. (1969). Reactions toward the source of stimulation. Journal of Experimental Psychology, 81(1), 174-176.
Simonoff, E., Jones, C. R., Baird, G., Pickles, A., Happé, F. G. E., & Charman, T. (2013). The persistence and stability of psychiatric problems in adolescents with autism spectrum disorders. Journal of Child Psychology and Psychiatry, 54(2), 186-194.
Simonoff, E., Pickles, A., Charman, T., Chandler, S., Loucas, T., & Baird, G. (2008). Psychiatric disorders in children with autism spectrum disorders: Prevalence, comorbidity, and associated factors in a population-derived sample. Journal of the American Academy of Child & Adolescent Psychiatry, 47(8), 921-929.
Sinzig, J., Walter, D., & Doepfner, M. (2009). Attention deficit/hyperactivity disorder in children and adolescents with autism spectrum disorder symptom or syndrome? Journal of Attention Disorders, 13(2), 117-126. doi:10.1177/1087054708326261
Smeekens, I., Didden, R., & Verhoeven, E. (2013). Exploring the relationship of autonomic and endocrine activity with social functioning in adults with autism spectrum disorders. Journal of Autism and Developmental Disorders, 45(2), 495-505.
Smith, E. E., & Jonides, J. (1997). Working memory: A view from neuroimaging. Cognitive Psychology, 33(1), 5-42.
Smith, G. A., & Brewer, N. (1995). Slowness and age: Speed-accuracy mechanisms. Psychology and Aging, 10(2), 238-247.
Solomon, M., Ozonoff, S. J., Cummings, N., & Carter, C. S. (2008). Cognitive control in autism spectrum disorders. International Journal of Developmental Neuroscience, 26(2), 239-247.
Solomon, M., Ozonoff, S. J., Ursu, S., Ravizza, S., Cummings, N., Ly, S., & Carter, C. S. (2009). The neural substrates of cognitive control deficits in autism spectrum disorders. Neuropsychologia, 47(12), 2515-2526.
Solomon, M., Yoon, J. H., Ragland, J. D., Niendam, T. A., Lesh, T. A., Fairbrother, W., & Carter, C. S. (2014). The development of the neural substrates of cognitive control in adolescents with autism spectrum disorders. Biological Psychiatry, 76(5), 412-421.
Spek, A. A., Schatorjé, T., Scholte, E., & van Berckelaer-Onnes, I. (2009). Verbal fluency in adults with high functioning autism or asperger syndrome. Neuropsychologia, 47(3), 652-656.
182 | References
Spek, A. A., Scholte, E. M., & Van Berckelaer-Onnes, I. A. (2010). Theory of mind in adults with HFA and asperger syndrome. Journal of Autism and Developmental Disorders, 40(3), 280-289.
Starns, J. J., & Ratcliff, R. (2010). The effects of aging on the speed–accuracy compromise: Boundary optimality in the diffusion model. Psychology and Aging, 25(2), 377-390.
Steele, S. D., Minshew, N. J., Luna, B., & Sweeney, J. A. (2007). Spatial working memory deficits in autism. Journal of Autism and Developmental Disorders, 37(4), 605-612.
Sterling, L., Dawson, G., Estes, A., & Greenson, J. (2008). Characteristics associated with presence of depressive symptoms in adults with autism spectrum disorder. Journal of Autism and Developmental Disorders, 38(6), 1011-1018.
Stevens, J. P. (2012). Applied multivariate statistics for the social sciences. New York, NY: Routledge. Stone, V. E., Baron-Cohen, S., & Knight, R. T. (1998). Frontal lobe contributions to theory of
mind. Journal of Cognitive Neuroscience, 10(5), 640-656. Strobl, C., Malley, J., & Tutz, G. (2009). An introduction to recursive partitioning: Rationale,
application, and characteristics of classification and regression trees, bagging, and random forests. Psychological Methods, 14(4), 323-348.
Strydom, A., Chan, T., King, M., Hassiotis, A., & Livingston, G. (2013). Incidence of dementia in older adults with intellectual disabilities. Research in Developmental Disabilities, 34(6), 1881-1885.
Tamnes, C. K., Walhovd, K. B., Grydeland, H., Holland, D., Østby, Y., Dale, A. M., & Fjell, A. M. (2013). Longitudinal working memory development is related to structural maturation of frontal and parietal cortices. Journal of Cognitive Neuroscience, 25(10), 1611-1623.
Tannenbaum, C., Paquette, A., Hilmer, S., Holroyd-Leduc, J., & Carnahan, R. (2012). A systematic review of amnestic and non-amnestic mild cognitive impairment induced by anticholinergic, antihistamine, GABAergic and opioid drugs. Drugs & Aging, 29(8), 639-658.
Tantam, D. (2000). Psychological disorder in adolescents and adults with asperger syndrome. Autism, 4(1), 47-62.
Thomas, M. S., Annaz, D., Ansari, D., Scerif, G., Jarrold, C., & Karmiloff-Smith, A. (2009). Using developmental trajectories to understand developmental disorders. Journal of Speech, Language, and Hearing Research, 52(2), 336-358.
Tombaugh, T. N., Kozak, J., & Rees, L. (1999). Normative data stratified by age and education for two measures of verbal fluency: FAS and animal naming. Archives of Clinical Neuropsychology, 14(2), 167-177.
Toplak, M. E., West, R. F., & Stanovich, K. E. (2013). Practitioner review: Do performance‐based measures and ratings of executive function assess the same construct? Journal of Child Psychology and Psychiatry, 54(2), 131-143.
Totsika, V., Felce, D., Kerr, M., & Hastings, R. P. (2010). Behavior problems, psychiatric symptoms, and quality of life for older adults with intellectual disability with and without autism. Journal of Autism and Developmental Disorders, 40(10), 1171-1178.
Towgood, K. J., Meuwese, J. D. I., Gilbert, S. J., Turner, M. S., & Burgess, P. W. (2009). Advantages of the multiple case series approach to the study of cognitive deficits in autism spectrum disorder. Neuropsychologia, 47(13), 2981-2988.
Travers, B. G., Bigler, E. D., Tromp, D. P. M., Adluru, N., Froehlich, A. L., Ennis, C., . . . Alexander, A. L. (2014). Longitudinal processing speed impairments in males with autism and the effects of white matter microstructure. Neuropsychologia, 53, 137-145.
Trimbos. (2013). Multidisciplinaire richtlijn diagnostiek en behandeling van autismespectrumstoornissen bij volwassenen. Utrecht, the Netherlands: De Tijdstroom.
References | 183
Trompenaars, F. J., Masthoff, E. D., Van Heck, G. L., Hodiamont, P. P., & De Vries, J. (2005). Content validity, construct validity, and reliability of the WHOQOL-bref in a population of dutch adult psychiatric outpatients. Quality of Life Research, 14(1), 151-160.
Tureck, K., Matson, J. L., Cervantes, P., & Konst, M. J. (2014). An examination of the relationship between autism spectrum disorder, intellectual functioning, and comorbid symptoms in children. Research in Developmental Disabilities, 35(7), 1766-1772.
Tyler, C. V., Schramm, S. C., Karafa, M., Tang, A. S., & Jain, A. K. (2011). Chronic disease risks in young adults with autism spectrum disorder: Forewarned is forearmed. American Journal on Intellectual and Developmental Disabilities, 116(5), 371-380.
Uterwijk, J. (2000). WAIS-III nederlandstalige bewerking. technische handleiding. Lisse, the Netherlands: Swets & Zeitlinger.
van den Burg, W., Saan, R. J., & Deelman, B. G. (1985). 15-woordentest. provisional manual. Groningen, the Netherlands: University Hospital, Department of Neuropsychology.
van den Wildenberg, W. P. M., Wylie, S. A., Forstmann, B. U., Burle, B., Hasbroucq, T., & Ridderinkhof, K. R. (2010). To head or to heed? beyond the surface of selective action inhibition: A review. Frontiers in Human Neuroscience, 4, 222.
Van der Hallen, R., Evers, K., Brewaeys, K., Van den Noortgate, W., & Wagemans, J. (2015). Global processing takes time: A meta-analysis on local–global visual processing in ASD. Psychological Bulletin, 141(3), 549-573.
Van der Lubbe, R. H. J., & Verleger, R. (2002). Aging and the simon task. Psychophysiology, 39(01), 100-110.
van Heijst, B. F. C., & Geurts, H. M. (2014). Quality of life in autism across the lifespan: A meta-analysis. Autism, 19(2), 158-167.
van Niekerk, M. E., Groen, W., Vissers, C. T. W., van Driel-de Jong, D., Kan, C. C., & Oude Voshaar, R. C. (2011). Diagnosing autism spectrum disorders in elderly people. International Psychogeriatrics, 23(05), 700-710.
van Oijen, M., de Jong, F. J., Hofman, A., Koudstaal, P. J., & Breteler, M. (2007). Subjective memory complaints, education, and risk of alzheimer’s disease. Alzheimer's & Dementia, 3(2), 92-97.
van Steensel, F. J., Bögels, S. M., & de Bruin, E. I. (2013). Psychiatric comorbidity in children with autism spectrum disorders: A comparison with children with ADHD. Journal of Child and Family Studies, 22(3), 368-376.
van Steensel, F. J., Bögels, S. M., & Dirksen, C. D. (2012). Anxiety and quality of life: Clinically anxious children with and without autism spectrum disorders compared. Journal of Clinical Child & Adolescent Psychology, 41(6), 731-738.
van Vliet, I. M., Leroy, H., & van Megen, H. J. G. M. (2000). De MINI internationaal neuropsychiatrisch interview, nederlandse versie 5.0.0. Leiden, the Netherlands: Leiden University Medical Center, Department of Psychiatry.
Van Wijngaarden-Cremers, P. J., van Eeten, E., Groen, W. B., Van Deurzen, P. A., Oosterling, I. J., & Van der Gaag, Rutger Jan. (2014). Gender and age differences in the core triad of impairments in autism spectrum disorders: A systematic review and meta-analysis. Journal of Autism and Developmental Disorders, 44(3), 627-635.
Vannucchi, G., Masi, G., Toni, C., Dell'Osso, L., Marazziti, D., & Perugi, G. (2014). Clinical features, developmental course, and psychiatric comorbidity of adult autism spectrum disorders. CNS Spectrums, 19(02), 157-164.
Vazire, S. (2010). Who knows what about a person? the self–other knowledge asymmetry (SOKA) model. Journal of Personality and Social Psychology, 98(2), 281-300.
Verhaeghen, P., & Cerella, J. (2002). Aging, executive control, and attention: A review of meta-analyses. Neuroscience & Biobehavioral Reviews, 26(7), 849-857.
184 | References
Verhage, F. (1964). Intelligentie en leeftijd. Assen, the Netherlands: Van Gorcum. Vogel, E. K., & Awh, E. (2008). How to exploit diversity for scientific gain using individual
differences to constrain cognitive theory. Current Directions in Psychological Science, 17(2), 171-176.
Volkmar, F. R., Lord, C., Bailey, A., Schultz, R. T., & Klin, A. (2004). Autism and pervasive developmental disorders. Journal of Child Psychology and Psychiatry, 45(1), 135-170.
Vom Hofe, A., Mainemarre, G., & Vannier, L. (1998). Sensitivity to everyday failures and cognitive inhibition: Are they related? European Review of Applied Psychology/Revue Européenne De Psychologie Appliquée, 48(1), 49-56.
Vu, K. L., & Proctor, R. W. (2008). Age differences in response selection for pure and mixed stimulus–response mappings and tasks. Acta Psychologica, 129(1), 49-60.
Wagenmakers, E., Wetzels, R., Borsboom, D., & van der Maas, H. L. J. (2011). Why psychologists must change the way they analyze their data: The case of psi: Comment on bem (2011). Journal of Personality and Social Psychology, 100(3), 426-432.
Wang, Z., & Su, Y. (2013). Age-related differences in the performance of theory of mind in older adults: A dissociation of cognitive and affective components. Psychology and Aging, 28(1), 284-291.
Wechsler, D. (1997a). Wechsler adult intelligence scale (WAIS-III). San Antonio, TX: Psychological Corporation.
Wechsler, D. (1997b). Wechsler memory scale (WMS-III). San Antonio, TX: Psychological Corporation.
Werkle-Bergner, M., Freunberger, R., Sander, M. C., Lindenberger, U., & Klimesch, W. (2012). Inter-individual performance differences in younger and older adults differentially relate to amplitude modulations and phase stability of oscillations controlling working memory contents. NeuroImage, 60(1), 71-82.
Wild-Wall, N., Falkenstein, M., & Hohnsbein, J. (2008). Flanker interference in young and older participants as reflected in event-related potentials. Brain Research, 1211, 72-84.
Williams, D. L., Goldstein, G., Carpenter, P. A., & Minshew, N. J. (2005). Verbal and spatial working memory in autism. Journal of Autism and Developmental Disorders, 35(6), 747-756.
Williams, D. L., Goldstein, G., & Minshew, N. J. (2006). The profile of memory function in children with autism. Neuropsychology, 20(1), 21-29.
Wilson, C. E., Happé, F. G. E., Wheelwright, S. J., Ecker, C., Lombardo, M. V., Johnston, P., . .
. Lai, M. ‐. (2014). The neuropsychology of male adults with High‐Functioning autism or asperger syndrome. Autism Research, 7(5), 568-581.
Wolitzky‐Taylor, K. B., Castriotta, N., Lenze, E. J., Stanley, M. A., & Craske, M. G. (2010). Anxiety disorders in older adults: A comprehensive review. Depression and Anxiety, 27(2), 190-211.
Wood, J. J., & Gadow, K. D. (2010). Exploring the nature and function of anxiety in youth with autism spectrum disorders. Clinical Psychology: Science and Practice, 17(4), 281-292.
Woodbury-Smith, M., Robinson, J., Wheelwright, S., & Baron-Cohen, S. (2005). Screening adults for asperger syndrome using the AQ: A preliminary study of its diagnostic validity in clinical practice. Journal of Autism and Developmental Disorders, 35(3), 331-335.
Woodman, A. C., Smith, L. E., Greenberg, J. S., & Mailick, M. R. (2015). Change in autism symptoms and maladaptive behaviors in adolescence and adulthood: The role of positive family processes. Journal of Autism and Developmental Disorders, 45(1), 111-126.
Worsham, W., Gray, W. E., Larson, M. J., & South, M. (2015). Conflict adaptation and congruency sequence effects to social-emotional stimuli in individuals with autism spectrum disorders. Autism, 19(8), 897-905. doi:1362361314553280 [pii]
References | 185
Wright, S. D., Brooks, D. E., D'Astous, V., & Grandin, T. (2013). The challenge and promise of autism spectrum disorders in adulthood and aging: A systematic review of the literature. Autism Insights, 5, 21-73.
Wylie, S. A., Ridderinkhof, K. R., Bashore, T. R., & van den Wildenberg, W. P. M. (2010). The effect of parkinson's disease on the dynamics of on-line and proactive cognitive control during action selection. Journal of Cognitive Neuroscience, 22(9), 2058-2073.
Wylie, S. A., Ridderinkhof, K. R., Eckerle, M. K., & Manning, C. A. (2007). Inefficient response inhibition in individuals with mild cognitive impairment. Neuropsychologia, 45(7), 1408-1419.
Yano, M. (2011). Aging effects in response inhibition: General slowing without decline in inhibitory functioning. Journal of Human Ergology, 40, 129-139.
Yirmiya, N., Erel, O., Shaked, M., & Solomonica-Levi, D. (1998). Meta-analyses comparing theory of mind abilities of individuals with autism, individuals with mental retardation, and normally developing individuals. Psychological Bulletin, 124(3), 283-307.
Zimprich, D., Martin, M., & Kliegel, M. (2003). Subjective cognitive complaints, memory performance, and depressive affect in old age: A change-oriented approach. The International Journal of Aging and Human Development, 57(4), 339-366.


List of abbreviations
188 | List of abbreviations
ADHD Attention deficit hyperactivity disorder
ADOS Autism diagnostic observation schedule
AN(C)OVA Analysis of (co)variance
AQ Autism-spectrum quotient
ASD Autism spectrum disorder
BF Bayes factor
CAF Conditional accuracy function
CFQ Cognitive failures questionnaire
CI Confidence interval
COM Comparison group
COWAT Controlled oral word association test
CSE Congruency sequence effect
DSM Diagnostic and statistical manual of mental disorders
EF Executive functions
GAD Generalized anxiety disorder
GIT Groninger intelligentie test
ICC Intra-class correlation coefficient
ICD International classification of diseases and related health problems
ID Intellectual disability
IQ Intelligence quotient
IRI Interpersonal reactivity index
ISCO International standard classification of occupations
MAN(C)OVA Multivariate analysis of (co)variance
MINI Mini international neuropsychiatric interview
MMSE Mini mental state examination
OCD Obsessive compulsive disorder
PDD-NOS Pervasive developmental disorder not otherwise specified
PDyD Premenstrual dysphoric disorder
PTC Preceding trial congruent
PTI Preceding trial incongruent
PTSS Post-traumatic stress disorder
RAVLT Rey auditory verbal learning task
List of abbreviations | 189
RRBI Restricted, repetitive behaviors and interests
RT Reaction time
SCID Structured clinical interview for DSM-IV
SCL-90-R Symptom checklist 90 revised
SSQ Sensory sensitivity questionnaire
ToM Theory of mind
WAIS Wechsler adult intelligence scale
WHO World health organization
WM Working memory
WMS Wechsler memory scale


Acknowledgements (Dankwoord)

192 | Acknowledgements (Dankwoord)
Dit proefschrift was er niet geweest zonder de hulp, steun en betrokkenheid van vele mensen.
De laatste pagina’s van dit proefschrift wil ik dan ook graag gebruiken om hen te bedanken.
In de eerste plaats, Hilde, wat ben ik blij dat ik deel heb mogen uitmaken van dit
prachtige project. Dank voor je vertrouwen, enthousiasme, scherpzinnigheid en geweldige
hoeveelheid energie. Wat heb ik enorm veel van je geleerd!
Richard, bedankt dat jij mijn copromotor wilde zijn. Met je kennis, kritische blik, en
aanstekelijke passie voor wetenschap heb je een belangrijke bijdrage geleverd en heb je me
enthousiast gemaakt over delta plots (over veroudering was ik al enthousiast!).
Highly esteemed members of the Doctorate Committee, Bas van Alphen, Ina van
Berckelaer-Onnis, Francesca Happé, Ben Schmand, and Reinout Wiers thank you so much for
reading and evaluating this doctoral thesis.
Een heel groot woord van dank gaat uit naar alle mensen, met en zonder autisme, die
hebben deelgenomen aan dit onderzoek. Zonder jullie bereidwilligheid, enthousiasme, inzet en
toewijding zou dit niet mogelijk zijn geweest. Ik hoop dat we, mede dankzij jullie, een stapje
hebben gezet om de wereld van autisme gedurende de volwassen levensloop een beetje beter te
begrijpen.
Graag wil ik de GGZ instellingen (Dr. Leo Kannerhuis; GGZ Noord Holland Noord;
GGZ Breburg) en patiëntenverenigingen (NVA en PAS) bedanken voor de inzet met de
werving. Met jullie hulp was het mogelijk om zoveel deelnemers met autisme te bereiken.
Markus, thank you so much for hosting me at your lab at the Max Planck Institute for
Human Development (MPIB). I am grateful of your willingness to share your knowledge with
me, of the time you took to answer my many questions, and of the thought-provoking
discussions we had. It was a great pleasure to work together. Andreas, many thanks for
familiarizing a non-methodologist with the interesting opportunities of some (inter)individual
differences methods. You, Markus, and Myriam made me feel welcome. Dank aan het Jo Kolk
studiefonds voor het mede mogelijk maken van mijn bezoek aan het MPIB.
Veel dank ben ik verschuldigd aan de twee onderzoeksassistenten die afgelopen jaren
hebben meegewerkt aan dit project. Nynke, wat was het leuk om met je samen te werken. Ik had
mij geen betere collega kunnen wensen om kennis te maken met de wondere wereld van autisme.
Jouw klinische ervaring was een waardevolle aanvulling. Barbara, van meehelpende research
master student en veelzijdige, betrouwbare onderzoeksassistent tot, tegenwoordig, het-
longitudinale-project-voortzettende AIO. Ik kan wel stellen dat je bent meegegroeid.
Studenten, Aislinn, Anna, Anouk, Barbara, Esther, Jet, Jildou, Jorien, Mira, Nicolien,
Nikki, Puck, Roxanne, Simone: bedankt voor jullie inzet en hulp bij de dataverzameling en de
werving van controles.
Acknowledgements (Dankwoord) | 193
D’Arc collega’s, Anke, Barbara, Bianca, Cédric, Esther, Hyke, Iuno, Jopie, Laura, Laura,
Linda, Marie, Marieke, Marieke, Nynke en Sanne, wat zijn jullie een fijne club. Natuurlijk dank
voor alle wetenschappelijke bijdrages, maar bovenal dank voor jullie gezelligheid. B&C en KNP
collega’s en secretariaat medewerkers, dank voor de inspirerende input en fijne werksfeer. Dank
aan de TOP, met name aan Jasper en Nico voor, respectievelijk, de begeleiding in de
programeerwereld van Presentation en de flexibiliteit bij het boeken van testruimtes. Eric-Jan en
Maarten, bedankt voor de introductie in Bayesian statistiek en, Maarten, voor jouw
bewonderingswaardige geduld om mijn vele vragen vriendelijk te blijven beantwoorden. Irene,
wat leuk dat een toevallige ontmoeting op de squashbaan leidde tot meer sportieve en gezellige
momenten! Cédric, heel erg bedankt voor het meedenken, voor je betrokkenheid,
opmerkzaamheid en zorgvuldigheid. Het was leerzaam en leuk om met je samen te werken. Leve
de happies, sappies en zeeanemoonmuziek! Laura, dank voor alle fijne discussies en gesprekken.
Anke, wat ben ik blij dat jij mijn algemene discussie kritisch wilde lezen. Heel veel dank hiervoor,
en natuurlijk ook voor alle leuke, grappige, gezellige en leerzame momenten toen we kort
kamergenoten waren en daarna!
Lieve Marieke, Mark, en Renate, wat een geluk dat ik lange tijd met jullie een kamer heb
mogen delen. De vele kannen thee (maar géén kaneel, helaas), gezellige en inspirerende
gesprekken, AT5 filmpjes, en wielrennen-updates zorgden voor fijne momenten. Dankzij jullie
werden lange dagen minder lang, zware dagen minder zwaar en werden alle andere dagen nóg
leuker. Laten we de gezellige 3.18 etentjes vooral in stand houden!
Lieve Daan, Erik, Frans, Marlies, Laura, Karin, Siggy, Sjoerd en La Touche-gangers,
dank voor de gezellige etentjes en drankjes, mooie festivals, concerten en uitjes die voor een
meer dan welkome afleiding hebben gezorgd. Carissimi Alessandra, Eva, Matteo e Sara, grazie
per la vostra amicizia. Anche se non ci vediamo spesso, la vostra presenza a distanza mi è cara.
Lieve schoonfamilie, Hanjo, Marianne, Jeroen, Maartje, Liv en Jack, bedankt dat ik bij jullie even
niet bezig hoefde te zijn met mijn onderzoek. Lieve Relinde en oma bedankt voor jullie interesse
en betrokkenheid. Liefste familie, Sietse, Melita, Femke, Elsemieke en Laurens, dank voor jullie
liefde en steun. Mam, dankzij jouw netwerk hebben nog net wat meer mensen meegedaan.
Lieve Mark, wat fijn om dit traject in jouw aanwezigheid te kunnen doorlopen. Dank
voor je liefde en vertrouwen, voor je geduld en begrip na de zoveelste lange werkdag, voor je
relativeringsvermogen en pragmatische instelling die ervoor zorgen dat er een juiste tijd en plaats
voor alles is.


Curriculum Vitae, publications, and author contributions
196 | CV, publications, and author contributions
Curriculum Vitae
Anne Geeke Lever was born in Apeldoorn, the Netherlands, in 1985. After graduating from
secondary school (Staring College, Lochem), she travelled to Italy to do voluntary work in an
elderly home. This experience contributed to her decision to study neuropsychology at the
University of Turin, where she obtained her bachelor’s degree cum laude in 2008. As part of her
two year interdisciplinary master in mind sciences, she went to England for a research internship
in experimental psychology at the University of Birmingham. She participated in a project on
interpersonal memory based guidance of attention supervised by prof. Glyn W. Humphreys and
became co-author on a peer-reviewed publication of this project. This work also constituted the
basis for her master thesis, written under supervision of prof. Maurizio Tirassa. She graduated
cum laude in 2011 at the University of Turin. Later that year she started her PhD project entitled
“Aging in Autism: Symptomatology, co-occurring psychopathology, and cognitive functioning
across the adult lifespan” under supervision of prof. dr. Hilde M. Geurts and prof. dr. K. Richard
Ridderinkhof at the University of Amsterdam, the Netherlands. To further increase her
knowledge on aging, she became a visiting student at the Lifespan Psychology department of the
Max Planck Institute for Human Development in Berlin, Germany. Currently, she holds a part-
time position as an assistant professor in clinical neuropsychology at the University of
Amsterdam and as a postdoc at the VU medical center.
International peer-reviewed publications
Lever, A.G. & Geurts, H.M. (2016). Quality of life in autism spectrum disorders from young to late
adulthood. Manuscript in preparation.
Lever, A.G., Ridderinkhof, K.R., & Geurts, H.M. (2016). Attention and inhibition in ASD: two sides
of the same coin? Manuscript in preparation.
Lever, A.G. & Geurts, H.M. (2016). Lifelong lasting? Self- and other-reported ASD symptoms across
adulthood. Manuscript submitted.
Lever, A.G., Ridderinkhof, K.R., Marsman, M., & Geurts, H.M. (2016). Reactive and proactive
interference control in adults with autism spectrum disorder across the lifespan. Manuscript under
review.
Scheeren, A.M., Olde Dubbelink, L.M.E., Lever, A.G., & Geurts, H.M. (2016). Two validation
studies of a performance validity test for autism spectrum disorders. Manuscript under review.
Lever, A.G. & Geurts, H.M. (2016). Psychiatric co-occurring symptoms and disorders among
young, middle-aged, and older adults with autism spectrum disorder. Journal of Autism and
Developmental Disorders. Advanced online publication, doi:10.1007/s10803-016-2722-8.
CV, publications, and author contributions | 197
Lever, A.G., Werkle-Bergner, M., Brandmaier, A.M., Ridderinkhof, K.R., & Geurts, H.M.
(2015). Atypical working memory decline across the adult lifespan in autism spectrum
disorder? Journal of Abnormal Psychology, 124(4), 1014-1026.
Lever, A.G. & Geurts, H.M. (2015). Age-related differences in cognition across the adult
lifespan in autism spectrum disorder. Autism Research. Advanced online publication,
doi:10.1002/aur.1545.
He, X., Lever, A.G., & Humphreys, G.W. (2011). Interpersonal memory-based guidance of
attention is reduced for ingroup members. Experimental Brain Research, 211(3-4), 429-438.
Other publications
Geurts, H.M., & Lever, A.G. (2016). The clinical neuropsychology of ASD. In: B. Barahona
Correa and R.J. van der Gaag (Eds). Autism spectrum disorders in adults. Springer.
Geurts, H.M., Koolschijn, P.C.M.C., & Lever, A.G. (2014). Veroudering bij mensen met
autisme: Versnelde achteruitgang? Sterk! In Autisme. Autisme Centraal, 1, 3-7.
Lever, A.G, & Geurts, H.M. (2013). Een nieuw instrument voor sensorische gevoeligheid.
Wetenschappelijk Tijdschrift Autisme, 2, 68-73.
Oral presentations
Lever, A.G., & Geurts, H.M. (2016, May). ASD-Related and Psychiatric Symptomatology Across the
Adult Lifespan. Meeting of International Society for Autism Research (IMFAR), Baltimore,
United States.
Lever, A.G., Werkle-Bergner, M., Brandmaier, A.M., Ridderinkhof, K.R., & Geurts, H.M. (2015,
December). Working memory across the adult lifespan: Do individuals with and without autism show
differential age-related decline? Meeting of Dutch Society for Psychonomics (NVP), Egmond
aan Zee, the Netherlands.
Lever, A.G. (2015, December). Aging in Autism: A lifespan perspective on symptomatology,
comorbidity, and cognitive functioning. Talk at the Brown Bag Meeting, Brain &
Cognition, Department of Lifespan Psychology, University of Amsterdam, the
Netherlands.
Lever, A.G., Werkle-Bergner, M., Brandmaier, A.M., Ridderinkhof, K.R., & Geurts, H.M. (2015,
May). Working memory across the adult lifespan: Do individuals with and without autism show
differential age-related decline? Meeting of International Society for Autism Research (IMFAR),
Salt Lake City, United States.
198 | CV, publications, and author contributions
Lever, A.G., & Geurts, H.M. (2015, May). Do Cognitive Challenges of Adults with Autism Persist,
Abate or Increase into Old Age? Meeting of International Society for Autism Research
(IMFAR), Salt Lake City, United States.
Lever, A.G., & Geurts, H.M. (2015, April). Do Cognitive Challenges of Adults with Autism Persist,
Abate or Increase into Old Age? Meeting of Aging & Cognition, Dortmund, Germany.
Lever, A.G. (2014, September). Aging in Autism. Talk at the Max Planck Institute for Human
Development, Department of Lifespan Psychology, Berlin, Germany.
Geurts, H.M. & Lever, A.G. (2014, May). Self-reports of ASD symptomatology, cognition, & quality of
life in adults (19 to 79 years) with ASD and without intellectual disabilities. International Society
for Autism Research (IMFAR), Atlanta, United States.
Refereed poster presentations
Lever, A.G., & Geurts, H.M. (2016, March). Lifelong lasting? Self- and other-reported ASD symptoms
across adulthood. National Autism Meeting, Rotterdam, the Netherlands.
Lever, A.G., & Geurts, H.M. (2016, March). Psychiatric co-occurring symptoms and disorders in young,
middle-aged, and older adults with autism spectrum disorder. National Autism Meeting, Rotterdam,
the Netherlands.
Lever, A.G., Werkle-Bergner, M., Brandmaier, A.M., Ridderinkhof, K.R., & Geurts, H.M. (2015,
April). Atypical working memory decline across the adult lifespan in autism spectrum disorder? Meeting
of Aging & Cognition, Dortmund, Germany.
Lever, A.G., Werkle-Bergner, M., Brandmaier, A.M., Ridderinkhof, K.R., & Geurts, H.M. (2015,
March). Atypical working memory decline across the adult lifespan in autism spectrum disorder?
National Autism Meeting, Rotterdam, the Netherlands.
Lever, A.G., & Geurts, H.M. (2015, March). Do Cognitive Challenges of Adults with Autism Persist,
Abate or Increase into Old Age? National Autism Meeting, Rotterdam, the Netherlands.
Lever, A.G., Ridderinkhof, K.R., & Geurts, H.M. (2013, December). Activation and suppression
during online and proactive cognitive control in autism. Meeting of Dutch Society for Psychonomics
(NVP), Egmond aan Zee, the Netherlands.
Lever, A.G., & Geurts, H.M. (2013, July). Working memory in adults and elderly with autism spectrum
disorders. International Neuropsychological Society (INS), Amsterdam, the Netherlands.
Lever, A.G., & Geurts, H.M. (2013, May). Perspective taking abilities in aging adults with ASD: an
exploratory study. International Society for Autism Research (IMFAR), San Sebastian, Spain.
CV, publications, and author contributions | 199
Author contributions
Chapter 2
Lever, A.G. & Geurts, H.M. (2016). Lifelong lasting? Self- and other-reported ASD symptoms across
adulthood. Manuscript submitted.
AGL participated in the design and the execution and coordination of the study, performed
measurements and the statistical analysis and interpretation of the data, and wrote the
manuscript; HMG supervised the study, participated in the design, the set-up of the statistical
plan and interpretation of the data, and reviewed the manuscript.
Chapter 3
Lever, A.G. & Geurts, H.M. (2016). Psychiatric co-occurring symptoms and disorders among
young, middle-aged, and older adults with autism spectrum disorder. Journal of Autism and
Developmental Disorders. Advanced online publication, doi:10.1007/s10803-016-2722-8.
AGL participated in the design and the execution and coordination of the study, performed
measurements and the statistical analysis and interpretation of the data, and wrote the
manuscript; HMG supervised the study, participated in the design, the set-up of the statistical
plan and interpretation of the data, and reviewed the manuscript.
Chapter 4
Lever, A.G. & Geurts, H.M. (2015). Age-related differences in cognition across the adult
lifespan in autism spectrum disorder. Autism Research. Advanced online publication,
doi:10.1002/aur.1545.
AGL participated in the design and the execution and coordination of the study, performed
measurements and the statistical analysis and interpretation of the data, and wrote the
manuscript; HMG supervised the study, participated in the design, the set-up of the statistical
plan and interpretation of the data, and reviewed the manuscript.
Chapter 5
Lever, A.G., Werkle-Bergner, M., Brandmaier, A.M., Ridderinkhof, K.R., & Geurts, H.M.
(2015). Atypical working memory decline across the adult lifespan in autism spectrum disorder?
Journal of Abnormal Psychology, 124(4), 1014-1026.
200 | CV, publications, and author contributions
AGL participated in the design and the execution and coordination of the study, performed
measurements and the statistical analysis and interpretation of the data, and wrote the
manuscript; MWB participated in the set-up of the statistical plan and interpretation of the data,
provided conceptual contributions to and reviewed the manuscript; AMB participated in the set-
up of the statistical plan and interpretation of the data, helped with the data analyses, and
reviewed the manuscript; KRR participated in the set-up of the statistical plan and interpretation
of the data, and reviewed the manuscript; HMG supervised the study, participated in the design,
the set-up of the statistical plan and interpretation of the data, and reviewed the manuscript.
Chapter 6
Lever, A.G., Ridderinkhof, K.R., Marsman, M., & Geurts, H.M. (2016). Reactive and proactive
interference control in adults with autism spectrum disorder across the lifespan. Manuscript under review.
AGL participated in the design and the execution and coordination of the study, performed
measurements and the statistical analysis and interpretation of the data, and wrote the
manuscript; KRR supervised the study, participated in the set-up of the statistical plan and
interpretation of the data, and reviewed the manuscript; MM provided conceptual contributions
to and helped with the Bayesian data analyses; HMG supervised the study, participated in the
design, the set-up of the statistical plan and interpretation of the data, and reviewed the
manuscript.
Related Documents