Aggregation and Manipulation in Prediction Markets: Effects of Trading Mechanism and Information Distribution Lian Jian Annenberg School of Communication University of Southern California [email protected] Rahul Sami School of Information University of Michigan [email protected] July 22, 2011 Abstract We conduct laboratory experiments on variants of market scoring rule prediction markets, under different information distribution patterns, in order to evaluate the efficiency and speed of information aggregation, as well as test recent theoretical results on manipulative behavior by traders. We find that markets structured to have a fixed sequence of trades exhibit greater accuracy of information aggregation than the typical form that has unstructured trade. In comparing two commonly used mechanisms, we find no significant difference between the performance of the direct probability-report form and the indirect security-trading form of the market scoring rule. In the case of the markets with a structured order, we find evidence supporting the theoretical prediction that information aggregation is slower when information is complementary. In structured markets, the theoretical prediction that there will be more delayed trading in complementary markets is supported, but we find no support for the prediction that there will be more bluffing in complementary markets. However, the theoretical predictions are not borne out in the unstructured markets. 1 Introduction Market prices facilitate efficient resource allocations, and also act as information aggregators: they reflect market participants’ valuation of resources (17). Prediction markets — markets in which traders buy and sell bets on future events — are designed to explicitly take advantage of the information aggregation function of market prices to provide decision makers with forecasts of future events. Such markets have been created for a wide range of applications; examples include the Iowa Electronic Market for forecasting elections and other political events, the Hollywood Stock Exchange for forecasting movie box office receipts, and intra-company markets to forecast sales. In this paper, we use laboratory experiments to study the effectiveness of information aggregation of different variants of market scoring rule prediction markets, under differing information conditions. Our experimental results shed new light on the validity of theoretical predictions for these markets, as well as on the impact of common mechanism variations. Although all prediction markets involve speculative bets on future events, the particular form taken by these bets can vary significantly. One common form is the continuous double auction, in which traders submit buy or sell orders for units of a security, and the market operator matches buy and sell orders to execute trades. When the outcome of the future event is known, the security is cashed out at a value that depends on the outcome. Continuous double auctions are very complex strategically, for the traders as 1

Welcome message from author
This document is posted to help you gain knowledge. Please leave a comment to let me know what you think about it! Share it to your friends and learn new things together.
Transcript
Aggregation and Manipulation in Prediction Markets: Effects of
Trading Mechanism and Information Distribution
Lian Jian
Annenberg School of Communication
University of Southern California
Rahul Sami
School of Information
University of Michigan
July 22, 2011
Abstract
We conduct laboratory experiments on variants of market scoring rule prediction markets, underdifferent information distribution patterns, in order to evaluate the efficiency and speed of informationaggregation, as well as test recent theoretical results on manipulative behavior by traders. We find thatmarkets structured to have a fixed sequence of trades exhibit greater accuracy of information aggregationthan the typical form that has unstructured trade. In comparing two commonly used mechanisms, wefind no significant difference between the performance of the direct probability-report form and theindirect security-trading form of the market scoring rule. In the case of the markets with a structuredorder, we find evidence supporting the theoretical prediction that information aggregation is slower wheninformation is complementary. In structured markets, the theoretical prediction that there will be moredelayed trading in complementary markets is supported, but we find no support for the prediction thatthere will be more bluffing in complementary markets. However, the theoretical predictions are not borneout in the unstructured markets.
1 Introduction
Market prices facilitate efficient resource allocations, and also act as information aggregators: they reflectmarket participants’ valuation of resources (17). Prediction markets — markets in which traders buyand sell bets on future events — are designed to explicitly take advantage of the information aggregationfunction of market prices to provide decision makers with forecasts of future events. Such marketshave been created for a wide range of applications; examples include the Iowa Electronic Market forforecasting elections and other political events, the Hollywood Stock Exchange for forecasting movie boxoffice receipts, and intra-company markets to forecast sales. In this paper, we use laboratory experimentsto study the effectiveness of information aggregation of different variants of market scoring rule predictionmarkets, under differing information conditions. Our experimental results shed new light on the validityof theoretical predictions for these markets, as well as on the impact of common mechanism variations.
Although all prediction markets involve speculative bets on future events, the particular form takenby these bets can vary significantly. One common form is the continuous double auction, in which traderssubmit buy or sell orders for units of a security, and the market operator matches buy and sell orders toexecute trades. When the outcome of the future event is known, the security is cashed out at a value thatdepends on the outcome. Continuous double auctions are very complex strategically, for the traders as
1

well as the analyst. Recently, a new market form for prediction markets, the market scoring rule (15), hasbecome popular. Market scoring rules (MSR) are being used in a growing number of deployed predictionmarkets, including the public prediction market site Inkling Markets (inklingmarkets.com) that hostspublic markets as well as closed markets for organizations, such as Yahoo!’s Predictalot1 and Microsoft’sinternal prediction market (1). MSR markets have advantages over continuous double auction markets,particularly in situations with thin trade. In addition, they are more amenable to theoretical analysisof the price-formation process, and there have been a number of recent studies that provide insightinto optimal theoretical strategies in MSR markets (15, 6, 9, 4). In this paper, we use human-subjectlaboratory experiments to study the speed and efficiency of information aggregation in MSR markets,while varying the mechanism form, constraints on trade timing, and information distribution pattern.
The first dimension of variation we consider is in comparing two commonly used mechanism formsthat implement MSR markets: a direct mechanism in which traders report their beliefs as probabilities,and an indirect mechanism in which traders reveal their beliefs through buying and selling securities. Thesimplest representation of a market scoring rule market is as a sequence of reported probabilities. Eachtrade in the market involves a trader changing the current report. We call this type of market a directMSR market. Once the outcome of the event is revealed, each trader is paid off according to a prespecifiedscoring rule, which depends on his report as well as the previous report. In practice, however, marketsthat use the market scoring rule, such as the public prediction market site Inklingmarkets.com, typicallyuse an alternative mechanism: Traders buy and sell units of a security, but instead of trading directlywith each other, they trade with an automated market maker who constantly adjusts the prices. We callthis type of market an indirect MSR market. Direct and indirect MSR markets are formally equivalent,but may appear very different to traders in the market. There is a debate about which interface is moreeffective in practice (26). In fact, Inklingmarkets.com leaves the choice to the traders themselves: itrecently introduced a switch that allowed its traders the choice of a direct or indirect trading interface.2
Our laboratory experiments provide insight into this question.Market speed and efficiency depends on appropriate behavior by traders, and hence trader strategies
have to be taken into account. Hanson (15) showed that MSR markets have a myopic honesty property:A trader trading only once maximizes her expected profit by reporting her true beliefs. However, fortraders potentially using non-myopic strategies over multiple trades, the theoretical results show a sharpdistinction based on the pattern of information distribution among the traders: If traders’ informationsignals are independent conditional on the true outcome of the event, then the signals are substitutes, andhonest reporting of beliefs is the optimal strategy even in a non-myopic sense; if the traders’ informationsignals are unconditionally independent, then the signals are complements, and honest reporting is ingeneral not a sequential equilibrium (4). In the latter case, a complete characterization of equilibria isunknown, but it is known that a trader can profitably deviate from the honest strategy profile by bluffing(trading in the opposite direction to her signal with some probability) or delaying (waiting for theother traders to reveal their information before trading); these deviations are construed as manipulativestrategies. This motivates the second dimension along which we vary our experimental design: We studymarket performance under a complementary signal structure, and under a substitute signal structure.This enables us to paint a broader picture of the comparison between different market forms, as well asto conduct the first experimental test of these theoretical results on strategic manipulation.
The third variation we study is in providing the structure of strictly sequenced opportunities to trade,as compared to the standard approach of letting traders choose when to trade in an unstructured way. Wehave two motivations in considering a structure: First, the existing theoretical results (6, 9, 4) implicitlyassume a structured order of trading opportunities, whereas almost all the prediction markets used inpractice have unstructured participation. In the theoretical models, any timing-game elements of thestrategic interaction between traders are abstracted away. In particular, traders are modeled as knowingwhen they will receive future opportunities to trade, as well as knowing that other traders have hadopportunities to trade between their trades. This experiment allows us to test if these assumptions areof practical significance. Second, enforcing more structured interaction has been shown to help in groupforecasting performance (14). For example, the Delphi method was developed as a multiple-round surveyto elicit expert forecasts (33). Our experiments allow us to test if the additional structure of a tradingsequence, which might simplify traders’ information processing, improves the aggregation performance
1See http://labs.yahoo.com/project/336, retrieved on July 14, 2010.2See http://blog.inklingmarkets.com/2011/01/improved-trading-interface-coming-soon.html, retrieved on March 17,
2011.
2
of a prediction market.We designed and carried out market trading experiments to investigate the effect of varying these
three dimensions on trader behavior and overall market performance. Our experiments involved 8 treat-ments generated by a factorial exploration of these three dimensions of variation. All experiments wereconducted using markets with two traders in each market. Restricting the participation to two tradersmakes the signal interpretation problem for the subjects easier: there is only one information signal atrader does not have, and she can attribute every trade other than her own to the other trader who hasthis information. It also allows for the market form to most closely match the theoretical models, therebygiving us a best-case situation in which to test the theoretical predictions. Based on the theoretical resultssummarized in (4), we expect the following: In the substitutes markets, traders should trade honestly, asearly as they can. In the complements markets, traders have an incentive to reveal their information aslate as possible; they also have an incentive to bluff with some probability if they can correct the marketlater. Both these should lead to poorer early information aggregation in the complements case thanin the substitutes case. Further, with ideal rational traders, the choice of direct or indirect mechanismshould make no difference to the market aggregation. The comparison of structured and unstructuredtrading orders is an open question.
The results of our experiments make several contributions to our understanding of the aggregativeand strategic properties of prediction markets with different trading mechanisms, and under differentinformation conditions. First, we find that structured markets (with an exogenous sequence of tradingopportunities), aggregate information more efficiently than unstructured markets, with an endogenoustrading order. (This result was significant in three out of the four treatments. For the fourth treatment,the comparison was in the same direction, but not statistically significant).
Second, in the first experimental comparison between the direct and indirect trading mechanismsthat have been proposed for market scoring rules, we find no significant difference in performance.
Third, in markets with a structured trading order, we found evidence supporting the theoretical pre-diction that price convergence will be slower in markets where information is complementary. Individual-level analysis also indicates that strategic delaying is used more frequently in complements treatments,but the difference in a measure of bluffing frequency were not significant. However, the theoreticalpredictions are not borne out in the unstructured markets.
The rest of this paper is structured as follows: In Section 2, we summarize the prior research relatedto our work. Section 3 details our experimental design, analysis metrics, and hypotheses. We presentthe results in Section 4. We summarize the paper and outline important directions for future work inSection 5.
2 Related Work and Background
The theoretical underpinnings of using market prices as reliable forecasts of future events are providedby the theory of Rational Expectations Equilibrium (23, 29, 10). Rational expectations equilibriummodels predict that, generically, prices in prediction markets can fully aggregate all individual traders’private information. Prediction markets’ advantages over other methods of information aggregationsuch as polls and expert deliberations have also been empirically demonstrated in a large number ofmarkets (2, 8, 32, 12). Because of their perceived accuracy, as well as the fact that they are relativelyeasy and inexpensive to run, we are witnessing a rapid growth in the use of prediction markets as toolsfor information aggregation (8, Footnote 2).
2.1 Market Scoring Rules
In our study, we focus on market scoring rules (MSR) based prediction markets as suggested by Han-son (15). Hanson outlined two alternative implementations of the MSR. One is a direct implementationof the MSR (we call it direct MSR), in which each trader reports their own predictions and receives pay-ments accordingly. The other one is an indirect implementation of the MSR (we call it indirect MSR),which contains a market maker offering n securities that each pay $1 if the associated outcome is realized,or $0 otherwise (15, 5). The two implementations are mathematically and hence strategically equivalent,but they have very different look and feel to the market traders. Although both implementations havebeen used in practice (26), to the best of our knowledge, there have been no empirical tests comparing
3
the performance of these two implementations to provide guidelines for prediction market designers. Itis one of our goals in this paper to compare the performance of these two implementations.
Direct MSR Scoring rules are tools for eliciting private beliefs. Given a random variable X which hasn possible outcomes, to elicit an individual’s, say Alice’s, belief about the probabilities of each of theseoutcomes p = (p1, · · · , pn), we can ask her to express her beliefs by r = (r1, · · · , rn) — a vector of reportedprobabilities for the random variable X — and pay her based on the scoring rule S = {s1(r), · · · , sn(r)}.Thus, if outcome 1 is realized, she will be paid s1(r); if 2 is realized, she will be paid s2(r), and so on.Alice maximizes her expected score S(r) by choosing an r to report:
S(r) = Σni=1si(r)pi (1)
If the scoring rule is proper, Alice would find that r = p maximizes her expected payoffs expressed inEquation (1). Popularly used proper scoring rules include quadratic, spherical, and logarithmic scoringrules.3 In an MSR-based prediction market, traders report their forecasts sequentially, and have accessto the sequence of forecasts made up to the current time. A trader earns the difference between her scoreand the previous trader’s score. That is, if outcome i is realized, trader m who reported rm will receivepayment si(rm)− si(rm−1), where rm−1 is the report of the previous trader. Throughout this paper, weuse an MSR based on the logarithmic market scoring rule, i.e., si(r) = log(ri).
Indirect MSR The market scoring rule can be viewed as a specific form of automated market-maker,an agent that posts prices, is always willing to trade securities at the posted price, and updates the pricesfollowing every trade. Thus, every trade in an MSR market is made with the automated market-makeras either the buyer or the seller; this is formally equivalent to the sequence model of direct MSR, whileproviding users with a mechanism that is more familiar to them from other markets. In particular,the (logarithmic) MSR equivalent market price of security i, pi, can be derived from the followingexpression (1):
pi =esi/b
∑k e
sk/b(2)
where b is the scaling factor in the scoring rule, and si is the total amount of security i that has beensold. Berg et al. (1) detail the implementation of indirect MSR markets. (For reviewers’ reference, thedirect and indirect MSR mechanisms used in our experiment have been included in Figure 5 and Figure 6in Appendix A.)
2.2 Theoretical Analysis of MSR
A number of theoretical results have been shown concerning optimal strategies in market scoring rulemarkets. Building on prior work on scoring rules (3, 13, 30), Hanson established a myopic honesty result:A risk-neutral trader who trades only once (or does not consider any future trades while making a report)will maximize her expected utility by reporting her true belief about the item (15).
The strategic situation is more complex when traders can trade repeatedly, and are non-myopic. Twospecific kinds of non-myopic strategies that have been analyzed (4) are dubbed as bluffing and delaying.In a bluffing strategy, a trader first makes a trade that, with some probability, suggests informationopposite to her true belief, so as to mislead other traders into reporting erroneous probabilities. In hernext trade, she can then gain a profit by correcting the market price according to her true belief. Hertotal payoff will be the sum of the payoffs she earned from both trades. If she earns more from hersecond trade than she loses from her first trade, she gains a net profit. The extended game view of tradein a market also permits the delaying strategy: A trader with private information may choose to waitfor other traders to report before revealing her private information. In comparison to the myopicallyoptimal strategy, both bluffing and delaying have a negative effect on the speed of market convergence:The market price may not reflect the available information because one or more traders has either chosento delay until later, or entered a report that is misleading.
In MSR-based markets, the profitability of these non-myopic strategies (relative to honest trading atthe first opportunity) depends on the structure of traders’ private information, i.e., the joint distribution
3See (30) and (7, p.139) for a discussion of various proper scoring rules.
4
of the signals they receive and the true outcome of the event. In particular, two natural distributionfamilies have been studied: substitute and complementary signals.
In our substitute signal environments, private signals are independently distributed, conditional onthe true outcome. For example, two people, A and B, try to predict if it is going to rain tomorrow. Atries to see if swallows fly low, and B uses the heuristic that “ring around the moon, rain is coming soon.”Both A and B would receive private signals from “independent” sources about the weather tomorrow,though their signals are independent conditional on the current humidity of the air. In this case, the twosignals are substitutes: It can be shown that the marginal value of a signal, measured in terms of theexpected profit of trading based on this signal, reduces if other signals have been revealed (4).
Another class of distributions involves signals that are (unconditionally) independent of each other.For example, firm A announces that at the end of the year each employee will receive a bonus if firmA’s sales on both the East and West Coasts have met their targets. Employee E knows how the firmperformed on the East Coast and employee W knows how it did on the West Coast. Assuming thatthe sales on the East and West Coasts are completely independent — knowing E’s signals does not helpone in guessing what W’s signal is and vice versa. In this case, it can be shown that the signals arecomplementary: The marginal value of a signal (measured in terms of expected profit) increases afterother signals are revealed. In other words, the predictive power of both traders’ signals combined isgreater than the sum of their individual predictive value.
When traders’ private signals are substitutes, Chen et al. (4, 6) show that misleading non-myopicstrategies are not profitable. Honest reporting of beliefs at the earliest opportunity is the only perfectBayesian equilibrium. On the other hand, when traders’ private signals are complements, Dimitrov andSami (9) and Chen et al. (4) show that non-myopic players can indeed profit from deviating from honestreporting by either bluffing or delaying.
Other recent theoretical results have characterized the equilibrium price in infinite-stage (or contin-uous time) models of market scoring rule markets. Ostrovsky (25) has shown that, for a wide class ofinformation distributions, the equilibrium price always converges to the correct posterior price as thetime approaches the end of the trading period. Iyer et. al (19) identify conditions under which thisequilibrium result continues to hold even for risk-averse traders. Thus, in these models, the final marketprice should be efficient for both complement and substitute information conditions. However, the pricepaths and strategies leading to this efficient price may depend on the information context.
To the best of our knowledge, there has been no experimental study on non-myopic strategic manip-ulation in MSR-based prediction markets. Experimental tests of these predictions can not only provideguidance to the designers of prediction markets, but also inform theory development in terms of suggest-ing future directions. Our study is the first one to test the theoretical predictions of this literature.
2.3 Prior Experimental Work
There have been a number of studies conducted to measure the aggregative efficiency of predictionmarkets (see, for example, (27) and (28)). Apart from a few papers mentioned below, these have studiedcontinuous double-auction markets or parimutuel markets, and not market scoring rule markets. Werefer readers to the excellent literature review by Tziralis and Tatsiopoulos (31) for further information.
There have been experimental studies comparing the accuracy of the forecasts produced by predictionmarkets and other information aggregation methods. Ledyard et al. (22) study alternative forecastingtechniques for combinatorial forecasting problems, and find that market scoring rules outperform all thealternatives studied. Graefe and Armstrong (14) found that structured information aggregation methods,including prediction markets, perform better than the unstructured information aggregation method, i.e.face-to-face meetings. Healy et al. (18) found that the relative performance of market scoring rule toother information aggregation methods, namely, iterative polls (or Delphi method), double auctions,and pari-mutuel betting, depends on the complexity of the information environment. They also foundthat market scoring rule produced fewer instances of misrepresentation (i.e., bluffing) than pari-mutuelbetting and double auctions. This result is consistent with theory. As the traders’ private signals in theirexperimental markets were substitutes, bluffing should not be profitable.
Our work is also related to prior work on manipulation in prediction markets. Hanson et al. (16)gave half of the subjects (the manipulators) incentives to manipulate the market price by pushing theprice up. Other traders were informed of the existence of these manipulators and the direction in whichthey wanted to push price. Hanson et al. found the market price was robust to manipulations, because
5

Direct MSR Indirect MSR
Substitutes Complements Substitutes Complements
Structured Str-Dir-Sub Str-Dir-Comp Str-Indi-Sub Str-Indi-CompUnstructured Unstr-Dir-Sub Unstr-Dir-Comp Unstr-Indi-Sub Unstr-Indi-Comp
Table 1: Experimental Design
knowing what the manipulators were trying to do, other traders effectively counteracted their influences.Oprea et al. (24) further tested the influence of manipulators under the condition that all other tradersonly knew the existence of the manipulators but not the direction in which they push the price. Theyfound that the traders still were able to counter-balance the manipulators’ influence.
Our experiment differs from (16) and (24) in two aspects. First, we study internal manipulation —manipulations aimed at profiting within the same market — while (16) and (24) study external manip-ulation — manipulations aimed at profiting outside the market. To model the external manipulation,(16) and (24) gave the manipulators extra payments based on how successfully they influenced themarket prices, in addition to their earnings as regular traders in the market. In our experiment, all thetraders’ payments are made as regular traders in the markets, even if they attempt to manipulate themarket price. Second, our experimental prediction markets are based on a logarithmic market scoringrule, while (16) and (24) are based on double-auction markets. In our experimental design, the informa-tion distribution in the substitute treatment is consistent with the base model in (24), restricted to twotraders.
3 Experiment Design
Our experiment follows a between-subject design — each subject only participates in one treatment.We recruited 256 subjects who were all students at the University of Michigan. Before the experimentbegan, an experimenter read the instructions to all the subjects. 4 These instructions included a tutorialon the experimental market’s software interface, each individual’s payoff functions, and the informationthey would receive based on the treatment. The experimenter then administered a paper-based quiz toall the subjects and checked each subject’s answers in person. No practice rounds were given before thedata collection started. Communications among the subjects were strictly forbidden.
In all the treatments, subjects participate in the market via computer software. The experimentwas programmed and conducted with the software z-Tree (11). Each trader started with 200 units ofexperiment currency in each round. They were also informed that 133 units of experimental currencycould be later exchanged for US$1.5 For each treatment, we ran 4 independent sessions to achievesufficient repetitions. There were 8 subjects in each session, which consisted of 25 rounds.
At the beginning of each round, the 8 subjects were randomly paired into 4 groups of 2 traders.Subjects were not told whom they were matched with or whether they have been paired before. In eachpair, one trader is assigned to be trader 1 and the other is trader 2. The traders are forecasting whethera ball drawn that round will turn out to be black or white. Each trader gets a ‘+’ or ‘-’ signal thatis connected with the outcome of the ball draw; the precise connection is different for substitute andcomplement treatments, and will be detailed in Section 3.3. At the end of the round, the outcome of theball draw is revealed, and the traders’ profit and loss are tallied up.
We use a 2 x 2 x 2 factorial design as shown in Table 1. The factors are: direct vs. indirect MSR,substitute vs. complementary private signals, and structured vs. unstructured trading order. Thefollowing sections contain details about these treatments.
3.1 Structured vs. Unstructured
In treatments with a structured trading order, for each round we randomly determine the trading orderbetween the two traders. The two traders then take turns to report their predictions; they may, of course,
4The instructions can be found in the online supplement.5The average payment made to our subjects was $42, with the minimum being $28 and the maximum being $52.
6
20 40 60 80 100Current price HcentsL
0.5
1.0
1.5
2.0
2.5
Price increase HcentsL
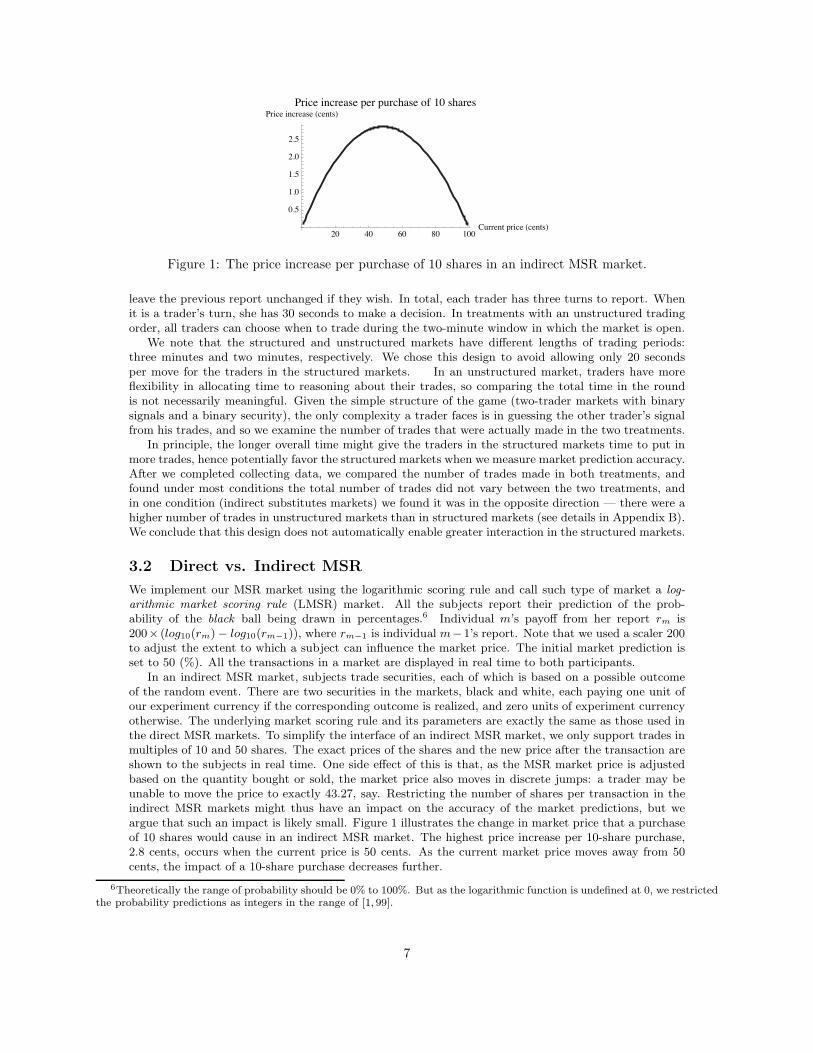
Price increase per purchase of 10 shares
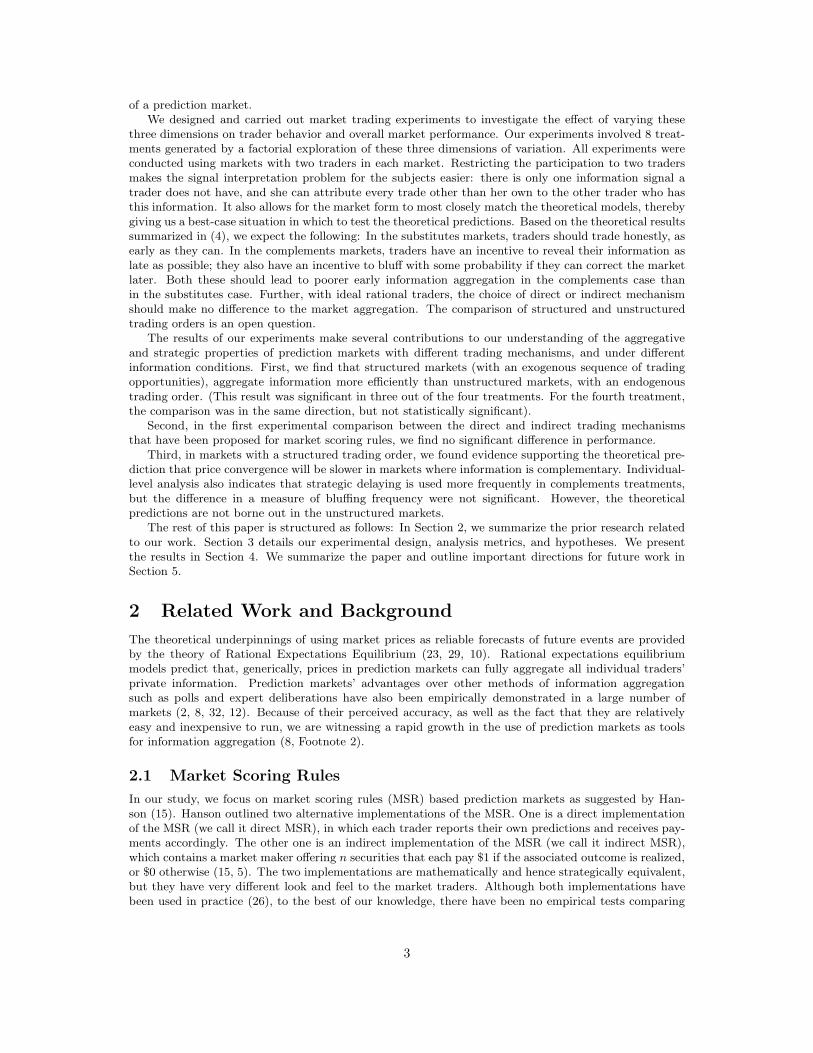
Figure 1: The price increase per purchase of 10 shares in an indirect MSR market.
leave the previous report unchanged if they wish. In total, each trader has three turns to report. Whenit is a trader’s turn, she has 30 seconds to make a decision. In treatments with an unstructured tradingorder, all traders can choose when to trade during the two-minute window in which the market is open.
We note that the structured and unstructured markets have different lengths of trading periods:three minutes and two minutes, respectively. We chose this design to avoid allowing only 20 secondsper move for the traders in the structured markets. In an unstructured market, traders have moreflexibility in allocating time to reasoning about their trades, so comparing the total time in the roundis not necessarily meaningful. Given the simple structure of the game (two-trader markets with binarysignals and a binary security), the only complexity a trader faces is in guessing the other trader’s signalfrom his trades, and so we examine the number of trades that were actually made in the two treatments.
In principle, the longer overall time might give the traders in the structured markets time to put inmore trades, hence potentially favor the structured markets when we measure market prediction accuracy.After we completed collecting data, we compared the number of trades made in both treatments, andfound under most conditions the total number of trades did not vary between the two treatments, andin one condition (indirect substitutes markets) we found it was in the opposite direction — there were ahigher number of trades in unstructured markets than in structured markets (see details in Appendix B).We conclude that this design does not automatically enable greater interaction in the structured markets.
3.2 Direct vs. Indirect MSR
We implement our MSR market using the logarithmic scoring rule and call such type of market a log-arithmic market scoring rule (LMSR) market. All the subjects report their prediction of the prob-ability of the black ball being drawn in percentages.6 Individual m’s payoff from her report rm is200× (log10(rm)− log10(rm−1)), where rm−1 is individual m−1’s report. Note that we used a scaler 200to adjust the extent to which a subject can influence the market price. The initial market prediction isset to 50 (%). All the transactions in a market are displayed in real time to both participants.
In an indirect MSR market, subjects trade securities, each of which is based on a possible outcomeof the random event. There are two securities in the markets, black and white, each paying one unit ofour experiment currency if the corresponding outcome is realized, and zero units of experiment currencyotherwise. The underlying market scoring rule and its parameters are exactly the same as those used inthe direct MSR markets. To simplify the interface of an indirect MSR market, we only support trades inmultiples of 10 and 50 shares. The exact prices of the shares and the new price after the transaction areshown to the subjects in real time. One side effect of this is that, as the MSR market price is adjustedbased on the quantity bought or sold, the market price also moves in discrete jumps: a trader may beunable to move the price to exactly 43.27, say. Restricting the number of shares per transaction in theindirect MSR markets might thus have an impact on the accuracy of the market predictions, but weargue that such an impact is likely small. Figure 1 illustrates the change in market price that a purchaseof 10 shares would cause in an indirect MSR market. The highest price increase per 10-share purchase,2.8 cents, occurs when the current price is 50 cents. As the current market price moves away from 50cents, the impact of a 10-share purchase decreases further.
6Theoretically the range of probability should be 0% to 100%. But as the logarithmic function is undefined at 0, we restrictedthe probability predictions as integers in the range of [1, 99].
7

3.3 Substitutes vs. Complements
For the substitutes treatment, we use the same substitutes signals as used in (24). At the beginning ofeach round, the computer randomly draws a black or white ball with equal probability. Once the roundbegins, each subject receives a private signal, either a “+” or a “-”. The signal each subject receivesdepends on the color of the ball drawn at the beginning of the round. If the black ball was drawn, thesignal will be a “+” with a 2/3 chance; and if the white ball was drawn, the signal will be a “-” witha 2/3 chance. At the end of each round, the color of the ball drawn is revealed, based on which all thesubjects receive their individual payments.
We report the probabilities of the outcome of “black” conditional on the traders’ signals in Table 2.The first three rows of Table 2 contain the posterior probabilities based on the three possible signalcombinations (“++”, “+ -”, and “- -”) received by both traders, under the substitutes and complementstreatments respectively (we will explain the probabilities under the complements treatments below). Thenext two rows contain the probabilities conditional on knowing one of the signals. The last row containsthe prior distribution of the two outcomes (black or white).
There are in principle many different complementary signal distributions that we could have chosen. Inorder to deduce a single complementary distribution, we imposed the following two symmetry conditions,with the aim of making the substitutes and complements treatments more comparable:
C.1 The prior distributions of the random outcomes are the same under both environments. Thatis, the color of the ball drawn is black or white with equal probability.
C.2 The total expected earnings of the two subjects are the same in both information conditions.
Criterion C. 1 ensures that the subjects in both treatments have the same prior belief about thesecurity, to rule out confounds that people may behave differently when dealing with different priorprobabilities. Criterion C. 2 implies that the value of the signals are equal. Specifically, if one personobserves both subjects’ private signals, in expectation, he would earn the same payoffs in both environ-ments.7 Recall, however, that the distribution of the total value may be different in the two treatments,even if traders are myopic and honest: In the substitute condition, the first trader gets a larger share ofthis value, while in the complementary information condition, the second trader gets a larger share.
We found the following complement signal structure that satisfies criterion C. 1 and approximatelysatisfies C. 2. (We do not exactly meet criterion C. 2 because we rounded the probability values to twosignificant digits, in order to make it easier for our subjects to understand.) Once the round begins, eachsubject receives a signal, a “+” or a “-” randomly drawn with equal probability. At the end of eachround, a color (black or white) is randomly drawn by the computer, depending on the numbers of eachsignal that everyone together has received. How the signals determine the probability that a black ballwill be drawn is shown in Table 2. For example, if there are 0 “+”’s and 2 “-”’s (there are only twotraders in the market), there is a 19% chance that the black ball will be drawn, and an 81% chance thata white ball will be drawn. Note that, due to the different generating processes, the posterior probabilityof drawing a black ball given, say, two “+” signals, is slightly different in the complements treatment. Itfollows that, conditioned on getting two “+” signals, there is a different total expected profit from idealaggregation in the substitutes and complements treatments. However, the probability of getting two “+”signals is also different, and by design, these two factors balance so that the expected total profit is thesame in the two treatments.
Based on the probabilities shown in Table 2, it might appear that the substitutes and complementssignals are so similar that one would not expect much behavioral difference due to these two treatments.However, this difference in signal structure has a significant impact on the relative profitability of differentstrategies. Assuming one’s partner believes one’s initial trade and trades honestly according to her ownsignal, in a complements market, the first trader can increase her payoff by 54% by bluffing insteadof trading honestly. In a substitutes market, however, a trader would expect a 53% profit loss frombluffing, compared to trading honestly.8 Likewise, the benefits of delaying are significantly different: inthe substitutes market, a trader makes 11% less by trading after the other trader’s signal is known, while
7Since we are using the logarithmic scoring rule, the fact that the two signals have the same value has an interpretation ininformation theory: in both settings, the two signals lead to the same reduction in the entropy (uncertainty) of the forecastedevent.
8The calculations are straightforward but tedious. We omit it here due to space limitations.
8
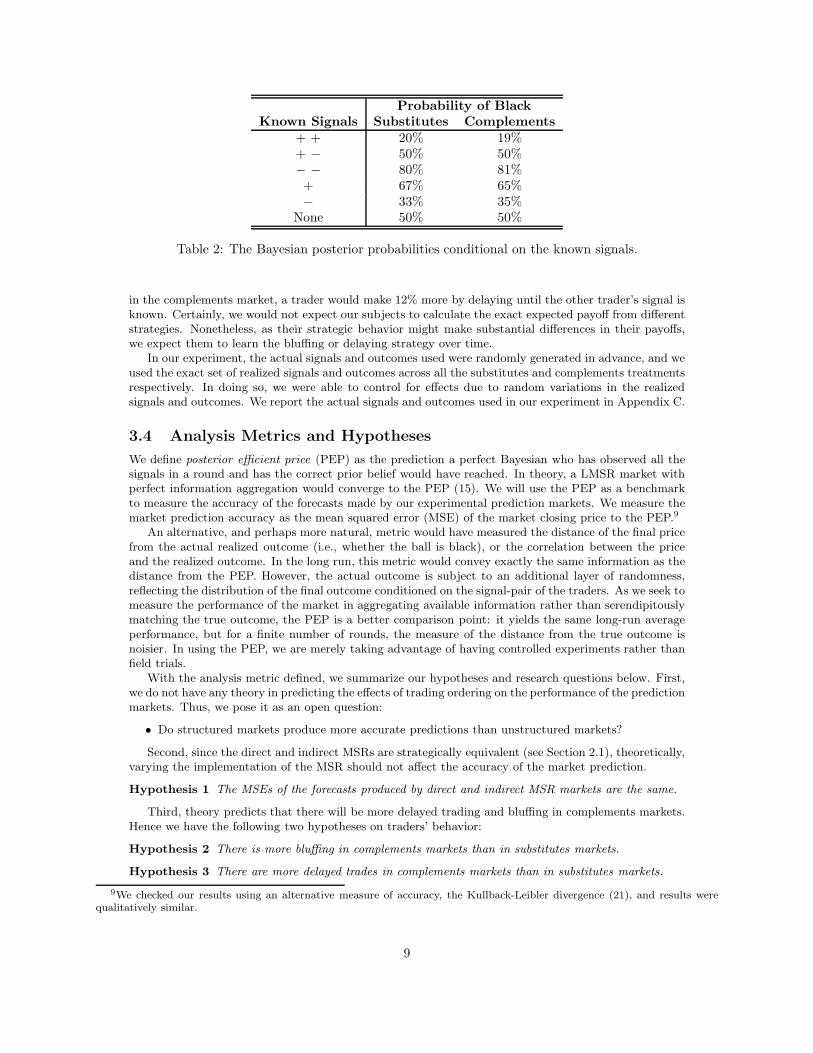
Probability of Black
Known Signals Substitutes Complements
+ + 20% 19%+ − 50% 50%− − 80% 81%+ 67% 65%− 33% 35%
None 50% 50%
Table 2: The Bayesian posterior probabilities conditional on the known signals.
in the complements market, a trader would make 12% more by delaying until the other trader’s signal isknown. Certainly, we would not expect our subjects to calculate the exact expected payoff from differentstrategies. Nonetheless, as their strategic behavior might make substantial differences in their payoffs,we expect them to learn the bluffing or delaying strategy over time.
In our experiment, the actual signals and outcomes used were randomly generated in advance, and weused the exact set of realized signals and outcomes across all the substitutes and complements treatmentsrespectively. In doing so, we were able to control for effects due to random variations in the realizedsignals and outcomes. We report the actual signals and outcomes used in our experiment in Appendix C.
3.4 Analysis Metrics and Hypotheses
We define posterior efficient price (PEP) as the prediction a perfect Bayesian who has observed all thesignals in a round and has the correct prior belief would have reached. In theory, a LMSR market withperfect information aggregation would converge to the PEP (15). We will use the PEP as a benchmarkto measure the accuracy of the forecasts made by our experimental prediction markets. We measure themarket prediction accuracy as the mean squared error (MSE) of the market closing price to the PEP.9
An alternative, and perhaps more natural, metric would have measured the distance of the final pricefrom the actual realized outcome (i.e., whether the ball is black), or the correlation between the priceand the realized outcome. In the long run, this metric would convey exactly the same information as thedistance from the PEP. However, the actual outcome is subject to an additional layer of randomness,reflecting the distribution of the final outcome conditioned on the signal-pair of the traders. As we seek tomeasure the performance of the market in aggregating available information rather than serendipitouslymatching the true outcome, the PEP is a better comparison point: it yields the same long-run averageperformance, but for a finite number of rounds, the measure of the distance from the true outcome isnoisier. In using the PEP, we are merely taking advantage of having controlled experiments rather thanfield trials.
With the analysis metric defined, we summarize our hypotheses and research questions below. First,we do not have any theory in predicting the effects of trading ordering on the performance of the predictionmarkets. Thus, we pose it as an open question:
• Do structured markets produce more accurate predictions than unstructured markets?
Second, since the direct and indirect MSRs are strategically equivalent (see Section 2.1), theoretically,varying the implementation of the MSR should not affect the accuracy of the market prediction.
Hypothesis 1 The MSEs of the forecasts produced by direct and indirect MSR markets are the same.
Third, theory predicts that there will be more delayed trading and bluffing in complements markets.Hence we have the following two hypotheses on traders’ behavior:
Hypothesis 2 There is more bluffing in complements markets than in substitutes markets.
Hypothesis 3 There are more delayed trades in complements markets than in substitutes markets.
9We checked our results using an alternative measure of accuracy, the Kullback-Leibler divergence (21), and results werequalitatively similar.
9
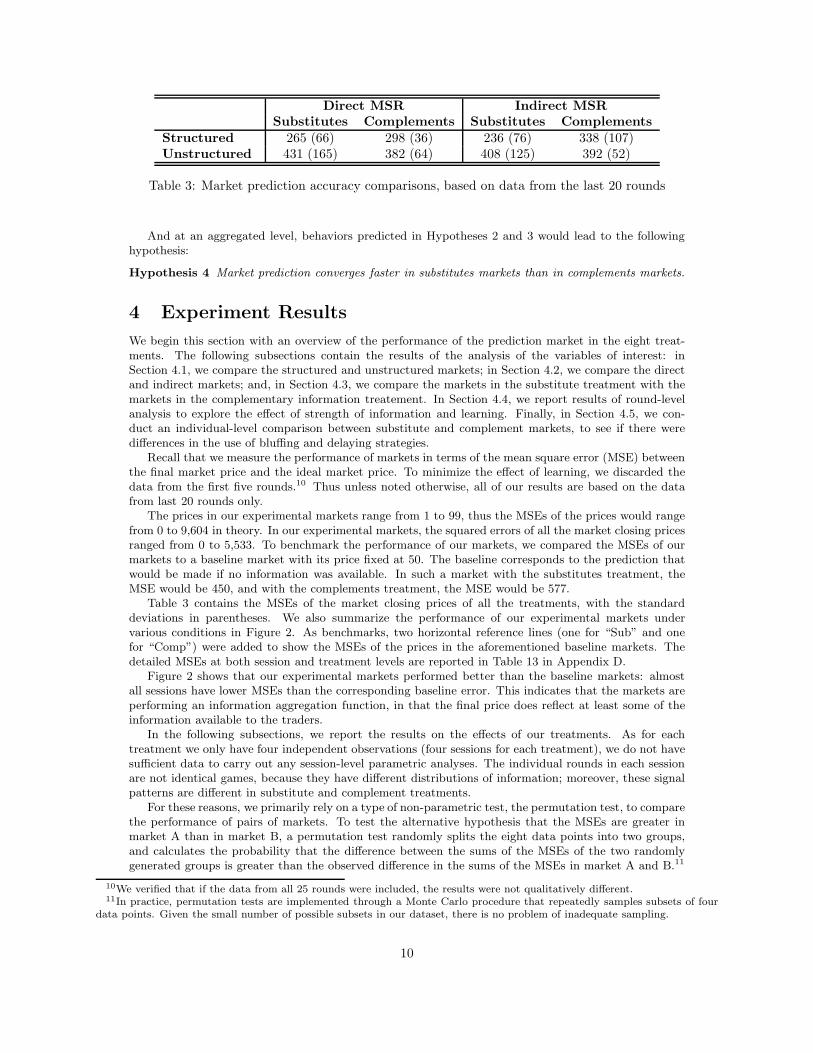
Direct MSR Indirect MSR
Substitutes Complements Substitutes Complements
Structured 265 (66) 298 (36) 236 (76) 338 (107)Unstructured 431 (165) 382 (64) 408 (125) 392 (52)
Table 3: Market prediction accuracy comparisons, based on data from the last 20 rounds
And at an aggregated level, behaviors predicted in Hypotheses 2 and 3 would lead to the followinghypothesis:
Hypothesis 4 Market prediction converges faster in substitutes markets than in complements markets.
4 Experiment Results
We begin this section with an overview of the performance of the prediction market in the eight treat-ments. The following subsections contain the results of the analysis of the variables of interest: inSection 4.1, we compare the structured and unstructured markets; in Section 4.2, we compare the directand indirect markets; and, in Section 4.3, we compare the markets in the substitute treatment with themarkets in the complementary information treatement. In Section 4.4, we report results of round-levelanalysis to explore the effect of strength of information and learning. Finally, in Section 4.5, we con-duct an individual-level comparison between substitute and complement markets, to see if there weredifferences in the use of bluffing and delaying strategies.
Recall that we measure the performance of markets in terms of the mean square error (MSE) betweenthe final market price and the ideal market price. To minimize the effect of learning, we discarded thedata from the first five rounds.10 Thus unless noted otherwise, all of our results are based on the datafrom last 20 rounds only.
The prices in our experimental markets range from 1 to 99, thus the MSEs of the prices would rangefrom 0 to 9,604 in theory. In our experimental markets, the squared errors of all the market closing pricesranged from 0 to 5,533. To benchmark the performance of our markets, we compared the MSEs of ourmarkets to a baseline market with its price fixed at 50. The baseline corresponds to the prediction thatwould be made if no information was available. In such a market with the substitutes treatment, theMSE would be 450, and with the complements treatment, the MSE would be 577.
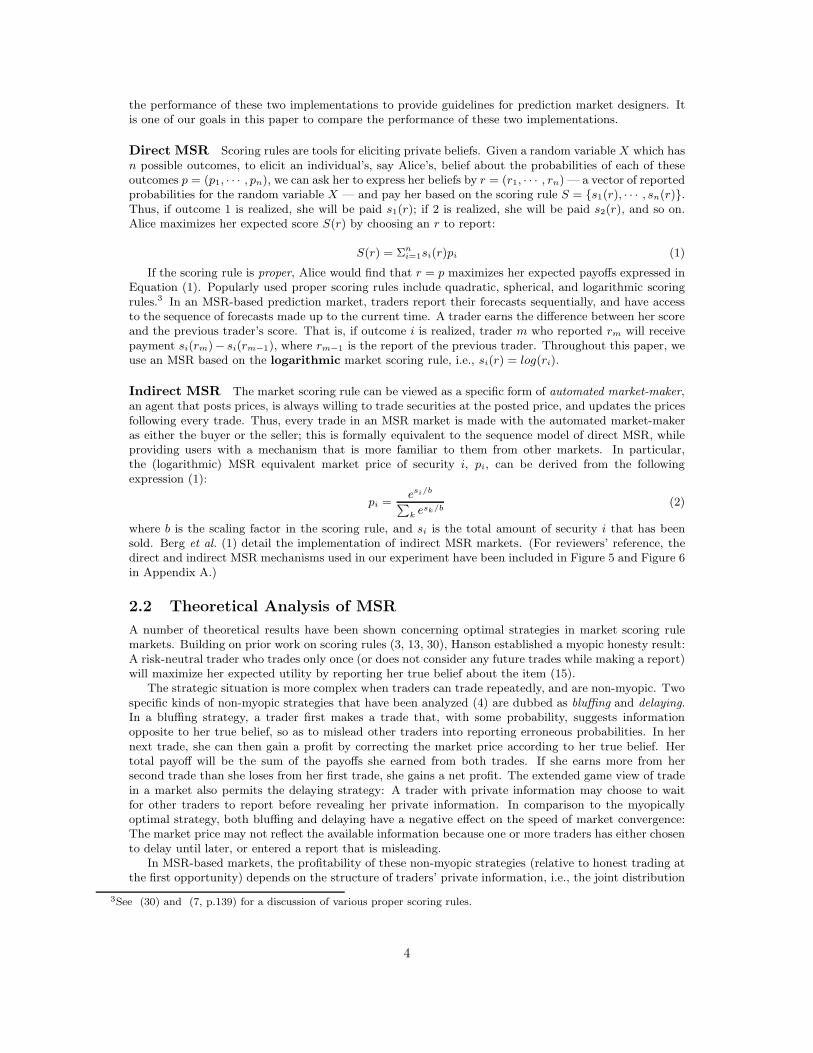
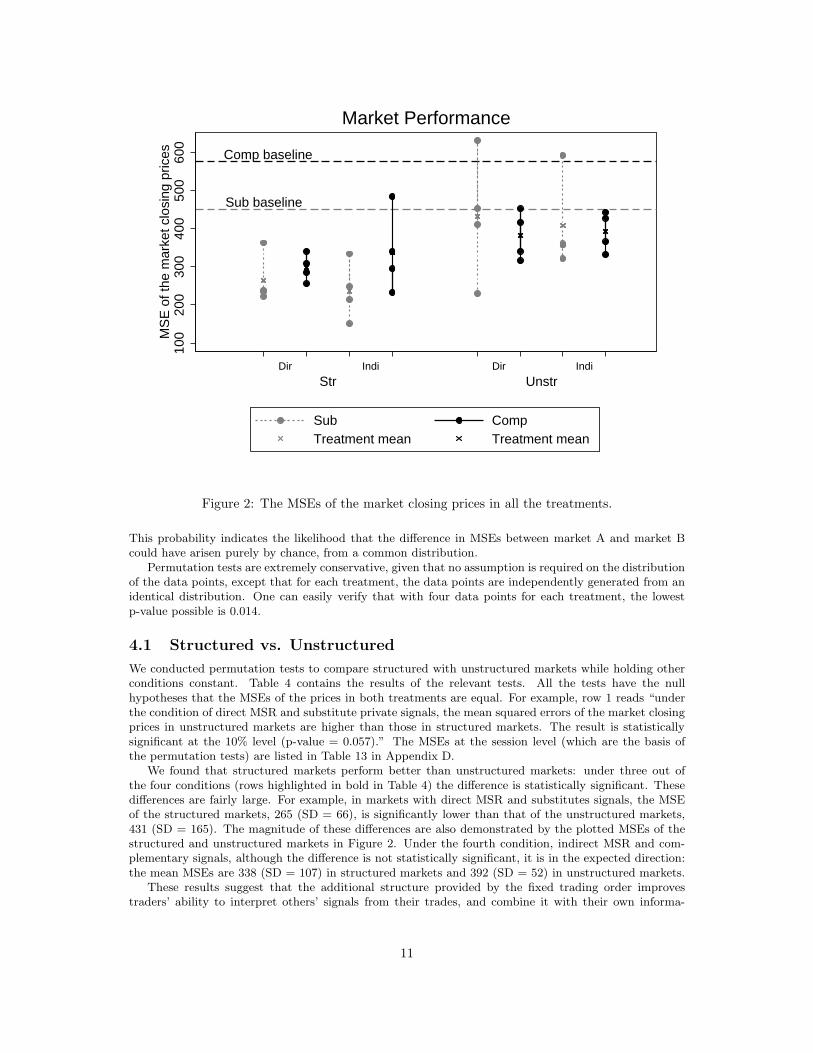
Table 3 contains the MSEs of the market closing prices of all the treatments, with the standarddeviations in parentheses. We also summarize the performance of our experimental markets undervarious conditions in Figure 2. As benchmarks, two horizontal reference lines (one for “Sub” and onefor “Comp”) were added to show the MSEs of the prices in the aforementioned baseline markets. Thedetailed MSEs at both session and treatment levels are reported in Table 13 in Appendix D.
Figure 2 shows that our experimental markets performed better than the baseline markets: almostall sessions have lower MSEs than the corresponding baseline error. This indicates that the markets areperforming an information aggregation function, in that the final price does reflect at least some of theinformation available to the traders.
In the following subsections, we report the results on the effects of our treatments. As for eachtreatment we only have four independent observations (four sessions for each treatment), we do not havesufficient data to carry out any session-level parametric analyses. The individual rounds in each sessionare not identical games, because they have different distributions of information; moreover, these signalpatterns are different in substitute and complement treatments.
For these reasons, we primarily rely on a type of non-parametric test, the permutation test, to comparethe performance of pairs of markets. To test the alternative hypothesis that the MSEs are greater inmarket A than in market B, a permutation test randomly splits the eight data points into two groups,and calculates the probability that the difference between the sums of the MSEs of the two randomlygenerated groups is greater than the observed difference in the sums of the MSEs in market A and B.11
10We verified that if the data from all 25 rounds were included, the results were not qualitatively different.11In practice, permutation tests are implemented through a Monte Carlo procedure that repeatedly samples subsets of four
data points. Given the small number of possible subsets in our dataset, there is no problem of inadequate sampling.
10
Str UnstrDir Indi Dir Indi
Sub baseline
Comp baseline
100
200
300
400
500
600
MS
E o
f the
mar
ket c
losi
ng p
rices
Sub CompTreatment mean Treatment mean
Market Performance
Figure 2: The MSEs of the market closing prices in all the treatments.
This probability indicates the likelihood that the difference in MSEs between market A and market Bcould have arisen purely by chance, from a common distribution.
Permutation tests are extremely conservative, given that no assumption is required on the distributionof the data points, except that for each treatment, the data points are independently generated from anidentical distribution. One can easily verify that with four data points for each treatment, the lowestp-value possible is 0.014.
4.1 Structured vs. Unstructured
We conducted permutation tests to compare structured with unstructured markets while holding otherconditions constant. Table 4 contains the results of the relevant tests. All the tests have the nullhypotheses that the MSEs of the prices in both treatments are equal. For example, row 1 reads “underthe condition of direct MSR and substitute private signals, the mean squared errors of the market closingprices in unstructured markets are higher than those in structured markets. The result is statisticallysignificant at the 10% level (p-value = 0.057).” The MSEs at the session level (which are the basis ofthe permutation tests) are listed in Table 13 in Appendix D.
We found that structured markets perform better than unstructured markets: under three out ofthe four conditions (rows highlighted in bold in Table 4) the difference is statistically significant. Thesedifferences are fairly large. For example, in markets with direct MSR and substitutes signals, the MSEof the structured markets, 265 (SD = 66), is significantly lower than that of the unstructured markets,431 (SD = 165). The magnitude of these differences are also demonstrated by the plotted MSEs of thestructured and unstructured markets in Figure 2. Under the fourth condition, indirect MSR and com-plementary signals, although the difference is not statistically significant, it is in the expected direction:the mean MSEs are 338 (SD = 107) in structured markets and 392 (SD = 52) in unstructured markets.
These results suggest that the additional structure provided by the fixed trading order improvestraders’ ability to interpret others’ signals from their trades, and combine it with their own informa-
11
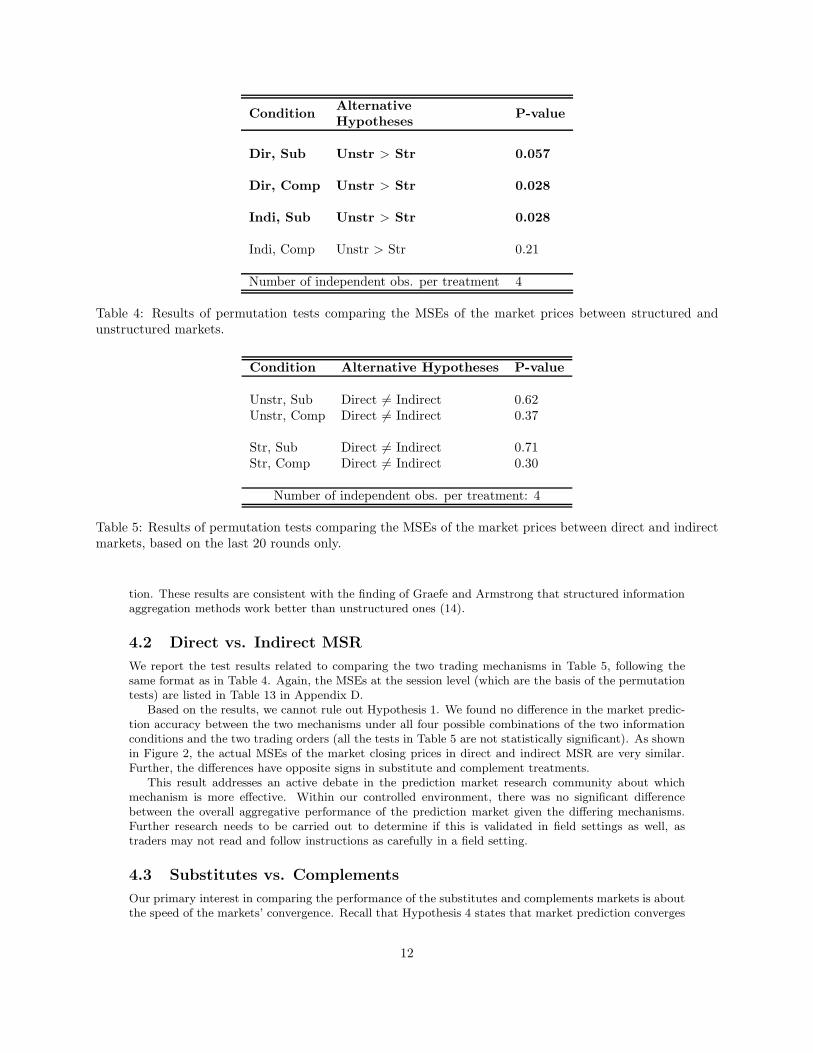
ConditionAlternative
P-valueHypotheses
Dir, Sub Unstr > Str 0.057
Dir, Comp Unstr > Str 0.028
Indi, Sub Unstr > Str 0.028
Indi, Comp Unstr > Str 0.21
Number of independent obs. per treatment 4
Table 4: Results of permutation tests comparing the MSEs of the market prices between structured andunstructured markets.
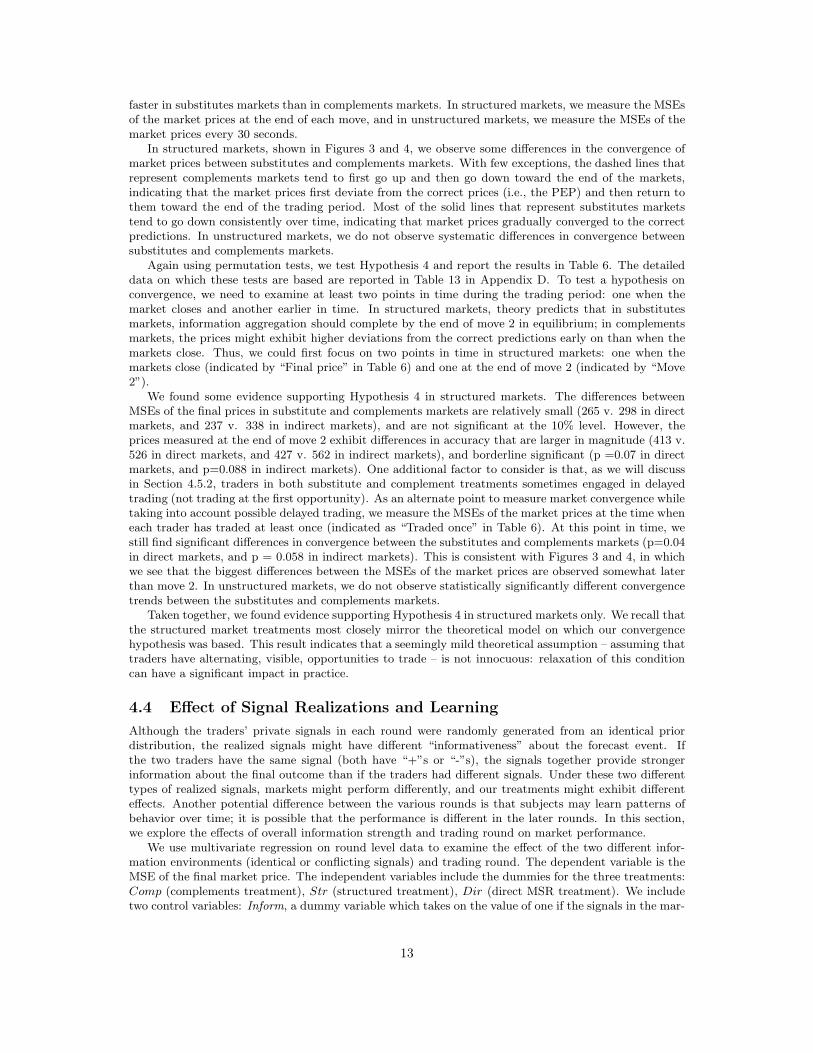
Condition Alternative Hypotheses P-value
Unstr, Sub Direct 6= Indirect 0.62Unstr, Comp Direct 6= Indirect 0.37
Str, Sub Direct 6= Indirect 0.71Str, Comp Direct 6= Indirect 0.30
Number of independent obs. per treatment: 4
Table 5: Results of permutation tests comparing the MSEs of the market prices between direct and indirectmarkets, based on the last 20 rounds only.
tion. These results are consistent with the finding of Graefe and Armstrong that structured informationaggregation methods work better than unstructured ones (14).
4.2 Direct vs. Indirect MSR
We report the test results related to comparing the two trading mechanisms in Table 5, following thesame format as in Table 4. Again, the MSEs at the session level (which are the basis of the permutationtests) are listed in Table 13 in Appendix D.
Based on the results, we cannot rule out Hypothesis 1. We found no difference in the market predic-tion accuracy between the two mechanisms under all four possible combinations of the two informationconditions and the two trading orders (all the tests in Table 5 are not statistically significant). As shownin Figure 2, the actual MSEs of the market closing prices in direct and indirect MSR are very similar.Further, the differences have opposite signs in substitute and complement treatments.
This result addresses an active debate in the prediction market research community about whichmechanism is more effective. Within our controlled environment, there was no significant differencebetween the overall aggregative performance of the prediction market given the differing mechanisms.Further research needs to be carried out to determine if this is validated in field settings as well, astraders may not read and follow instructions as carefully in a field setting.
4.3 Substitutes vs. Complements
Our primary interest in comparing the performance of the substitutes and complements markets is aboutthe speed of the markets’ convergence. Recall that Hypothesis 4 states that market prediction converges
12
faster in substitutes markets than in complements markets. In structured markets, we measure the MSEsof the market prices at the end of each move, and in unstructured markets, we measure the MSEs of themarket prices every 30 seconds.
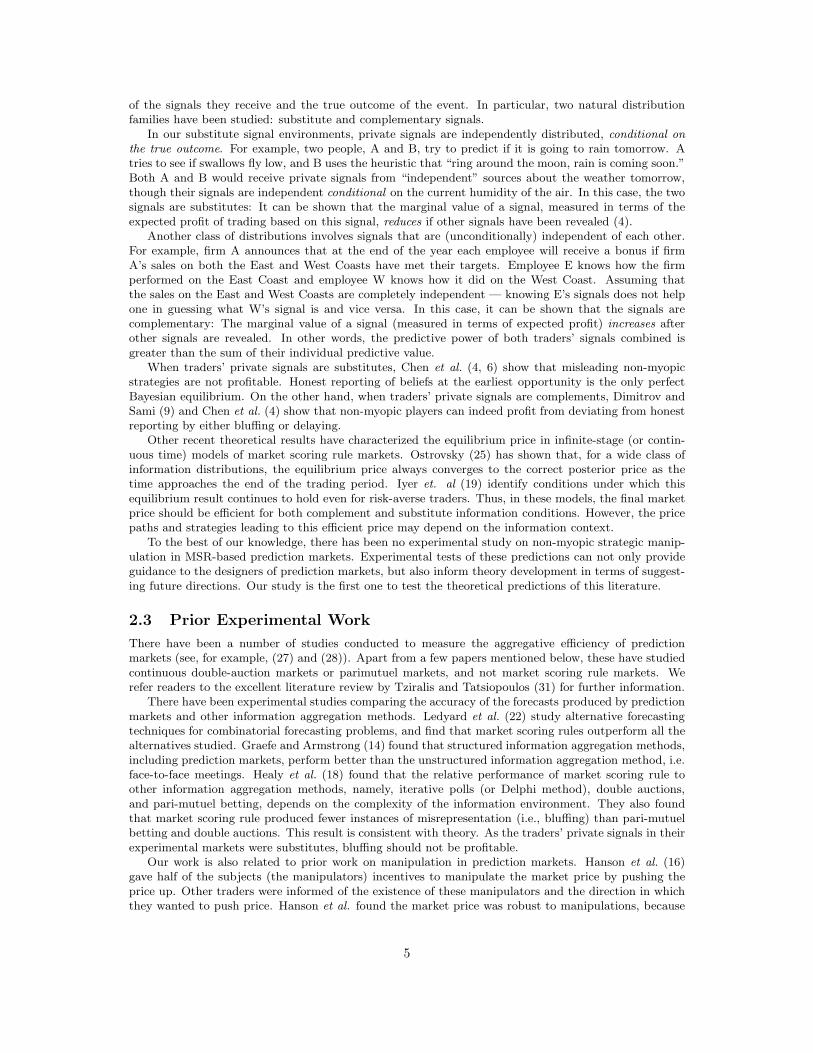
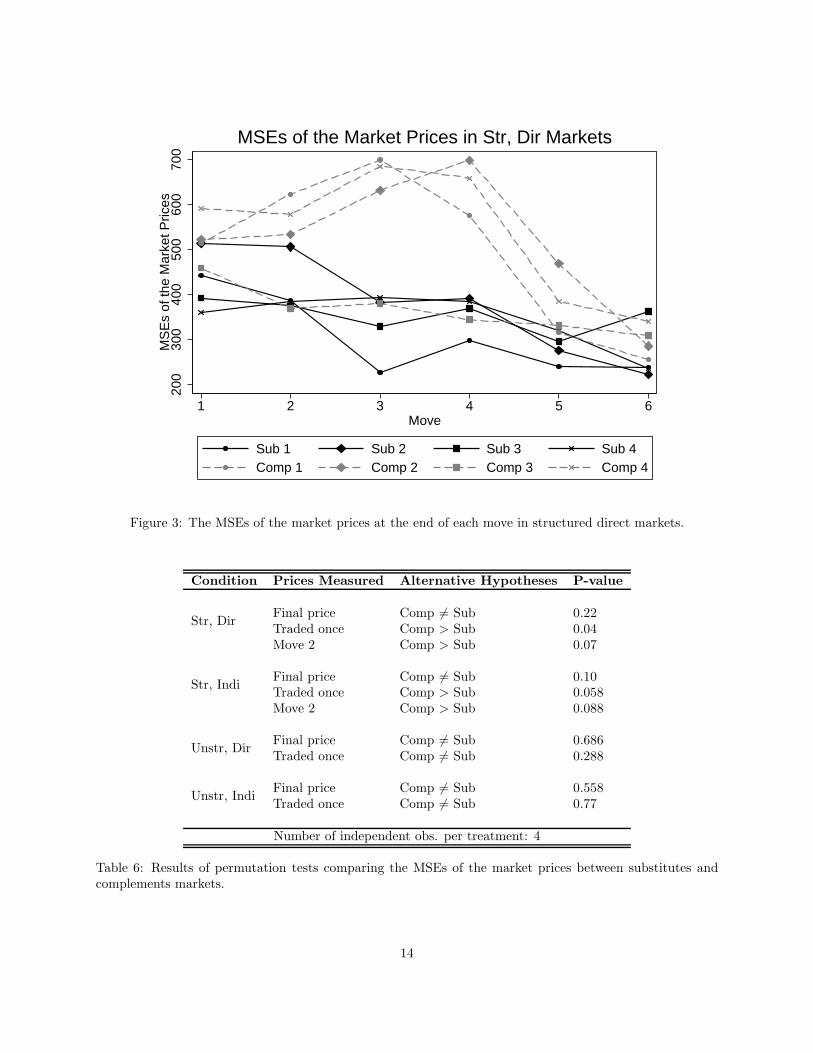
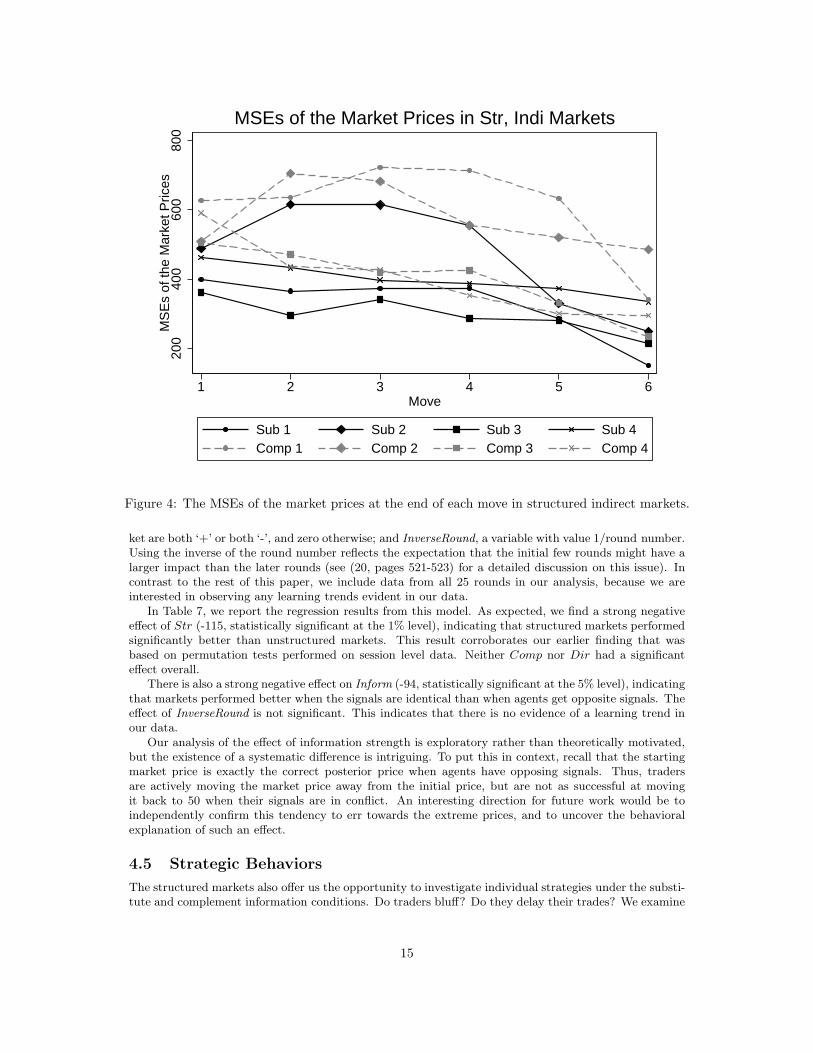
In structured markets, shown in Figures 3 and 4, we observe some differences in the convergence ofmarket prices between substitutes and complements markets. With few exceptions, the dashed lines thatrepresent complements markets tend to first go up and then go down toward the end of the markets,indicating that the market prices first deviate from the correct prices (i.e., the PEP) and then return tothem toward the end of the trading period. Most of the solid lines that represent substitutes marketstend to go down consistently over time, indicating that market prices gradually converged to the correctpredictions. In unstructured markets, we do not observe systematic differences in convergence betweensubstitutes and complements markets.
Again using permutation tests, we test Hypothesis 4 and report the results in Table 6. The detaileddata on which these tests are based are reported in Table 13 in Appendix D. To test a hypothesis onconvergence, we need to examine at least two points in time during the trading period: one when themarket closes and another earlier in time. In structured markets, theory predicts that in substitutesmarkets, information aggregation should complete by the end of move 2 in equilibrium; in complementsmarkets, the prices might exhibit higher deviations from the correct predictions early on than when themarkets close. Thus, we could first focus on two points in time in structured markets: one when themarkets close (indicated by “Final price” in Table 6) and one at the end of move 2 (indicated by “Move2”).
We found some evidence supporting Hypothesis 4 in structured markets. The differences betweenMSEs of the final prices in substitute and complements markets are relatively small (265 v. 298 in directmarkets, and 237 v. 338 in indirect markets), and are not significant at the 10% level. However, theprices measured at the end of move 2 exhibit differences in accuracy that are larger in magnitude (413 v.526 in direct markets, and 427 v. 562 in indirect markets), and borderline significant (p =0.07 in directmarkets, and p=0.088 in indirect markets). One additional factor to consider is that, as we will discussin Section 4.5.2, traders in both substitute and complement treatments sometimes engaged in delayedtrading (not trading at the first opportunity). As an alternate point to measure market convergence whiletaking into account possible delayed trading, we measure the MSEs of the market prices at the time wheneach trader has traded at least once (indicated as “Traded once” in Table 6). At this point in time, westill find significant differences in convergence between the substitutes and complements markets (p=0.04in direct markets, and p = 0.058 in indirect markets). This is consistent with Figures 3 and 4, in whichwe see that the biggest differences between the MSEs of the market prices are observed somewhat laterthan move 2. In unstructured markets, we do not observe statistically significantly different convergencetrends between the substitutes and complements markets.
Taken together, we found evidence supporting Hypothesis 4 in structured markets only. We recall thatthe structured market treatments most closely mirror the theoretical model on which our convergencehypothesis was based. This result indicates that a seemingly mild theoretical assumption – assuming thattraders have alternating, visible, opportunities to trade – is not innocuous: relaxation of this conditioncan have a significant impact in practice.
4.4 Effect of Signal Realizations and Learning
Although the traders’ private signals in each round were randomly generated from an identical priordistribution, the realized signals might have different “informativeness” about the forecast event. Ifthe two traders have the same signal (both have “+”s or “-”s), the signals together provide strongerinformation about the final outcome than if the traders had different signals. Under these two differenttypes of realized signals, markets might perform differently, and our treatments might exhibit differenteffects. Another potential difference between the various rounds is that subjects may learn patterns ofbehavior over time; it is possible that the performance is different in the later rounds. In this section,we explore the effects of overall information strength and trading round on market performance.
We use multivariate regression on round level data to examine the effect of the two different infor-mation environments (identical or conflicting signals) and trading round. The dependent variable is theMSE of the final market price. The independent variables include the dummies for the three treatments:Comp (complements treatment), Str (structured treatment), Dir (direct MSR treatment). We includetwo control variables: Inform, a dummy variable which takes on the value of one if the signals in the mar-
13
200
300
400
500
600
700
MS
Es
of th
e M
arke
t Pric
es
1 2 3 4 5 6Move
Sub 1 Sub 2 Sub 3 Sub 4Comp 1 Comp 2 Comp 3 Comp 4
MSEs of the Market Prices in Str, Dir Markets
Figure 3: The MSEs of the market prices at the end of each move in structured direct markets.
Condition Prices Measured Alternative Hypotheses P-value
Str, DirFinal price Comp 6= Sub 0.22Traded once Comp > Sub 0.04Move 2 Comp > Sub 0.07
Str, IndiFinal price Comp 6= Sub 0.10Traded once Comp > Sub 0.058Move 2 Comp > Sub 0.088
Unstr, DirFinal price Comp 6= Sub 0.686Traded once Comp 6= Sub 0.288
Unstr, IndiFinal price Comp 6= Sub 0.558Traded once Comp 6= Sub 0.77
Number of independent obs. per treatment: 4
Table 6: Results of permutation tests comparing the MSEs of the market prices between substitutes andcomplements markets.
14
200
400
600
800
MS
Es
of th
e M
arke
t Pric
es
1 2 3 4 5 6Move
Sub 1 Sub 2 Sub 3 Sub 4Comp 1 Comp 2 Comp 3 Comp 4
MSEs of the Market Prices in Str, Indi Markets
Figure 4: The MSEs of the market prices at the end of each move in structured indirect markets.
ket are both ‘+’ or both ‘-’, and zero otherwise; and InverseRound, a variable with value 1/round number.Using the inverse of the round number reflects the expectation that the initial few rounds might have alarger impact than the later rounds (see (20, pages 521-523) for a detailed discussion on this issue). Incontrast to the rest of this paper, we include data from all 25 rounds in our analysis, because we areinterested in observing any learning trends evident in our data.
In Table 7, we report the regression results from this model. As expected, we find a strong negativeeffect of Str (-115, statistically significant at the 1% level), indicating that structured markets performedsignificantly better than unstructured markets. This result corroborates our earlier finding that wasbased on permutation tests performed on session level data. Neither Comp nor Dir had a significanteffect overall.
There is also a strong negative effect on Inform (-94, statistically significant at the 5% level), indicatingthat markets performed better when the signals are identical than when agents get opposite signals. Theeffect of InverseRound is not significant. This indicates that there is no evidence of a learning trend inour data.
Our analysis of the effect of information strength is exploratory rather than theoretically motivated,but the existence of a systematic difference is intriguing. To put this in context, recall that the startingmarket price is exactly the correct posterior price when agents have opposing signals. Thus, tradersare actively moving the market price away from the initial price, but are not as successful at movingit back to 50 when their signals are in conflict. An interesting direction for future work would be toindependently confirm this tendency to err towards the extreme prices, and to uncover the behavioralexplanation of such an effect.
4.5 Strategic Behaviors
The structured markets also offer us the opportunity to investigate individual strategies under the substi-tute and complement information conditions. Do traders bluff? Do they delay their trades? We examine
15
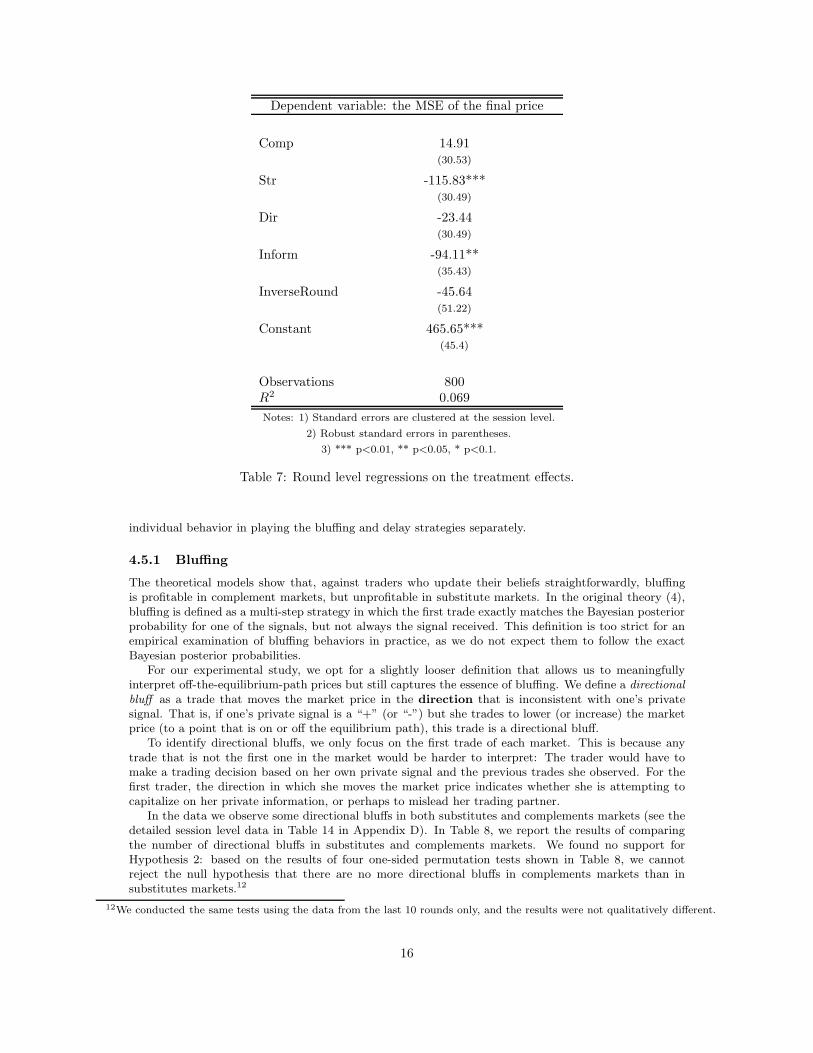
Dependent variable: the MSE of the final price
Comp 14.91(30.53)
Str -115.83***(30.49)
Dir -23.44(30.49)
Inform -94.11**(35.43)
InverseRound -45.64(51.22)
Constant 465.65***(45.4)
Observations 800R2 0.069
Notes: 1) Standard errors are clustered at the session level.
2) Robust standard errors in parentheses.
3) *** p<0.01, ** p<0.05, * p<0.1.
Table 7: Round level regressions on the treatment effects.
individual behavior in playing the bluffing and delay strategies separately.
4.5.1 Bluffing
The theoretical models show that, against traders who update their beliefs straightforwardly, bluffingis profitable in complement markets, but unprofitable in substitute markets. In the original theory (4),bluffing is defined as a multi-step strategy in which the first trade exactly matches the Bayesian posteriorprobability for one of the signals, but not always the signal received. This definition is too strict for anempirical examination of bluffing behaviors in practice, as we do not expect them to follow the exactBayesian posterior probabilities.
For our experimental study, we opt for a slightly looser definition that allows us to meaningfullyinterpret off-the-equilibrium-path prices but still captures the essence of bluffing. We define a directionalbluff as a trade that moves the market price in the direction that is inconsistent with one’s privatesignal. That is, if one’s private signal is a “+” (or “-”) but she trades to lower (or increase) the marketprice (to a point that is on or off the equilibrium path), this trade is a directional bluff.
To identify directional bluffs, we only focus on the first trade of each market. This is because anytrade that is not the first one in the market would be harder to interpret: The trader would have tomake a trading decision based on her own private signal and the previous trades she observed. For thefirst trader, the direction in which she moves the market price indicates whether she is attempting tocapitalize on her private information, or perhaps to mislead her trading partner.
In the data we observe some directional bluffs in both substitutes and complements markets (see thedetailed session level data in Table 14 in Appendix D). In Table 8, we report the results of comparingthe number of directional bluffs in substitutes and complements markets. We found no support forHypothesis 2: based on the results of four one-sided permutation tests shown in Table 8, we cannotreject the null hypothesis that there are no more directional bluffs in complements markets than insubstitutes markets.12
12We conducted the same tests using the data from the last 10 rounds only, and the results were not qualitatively different.
16
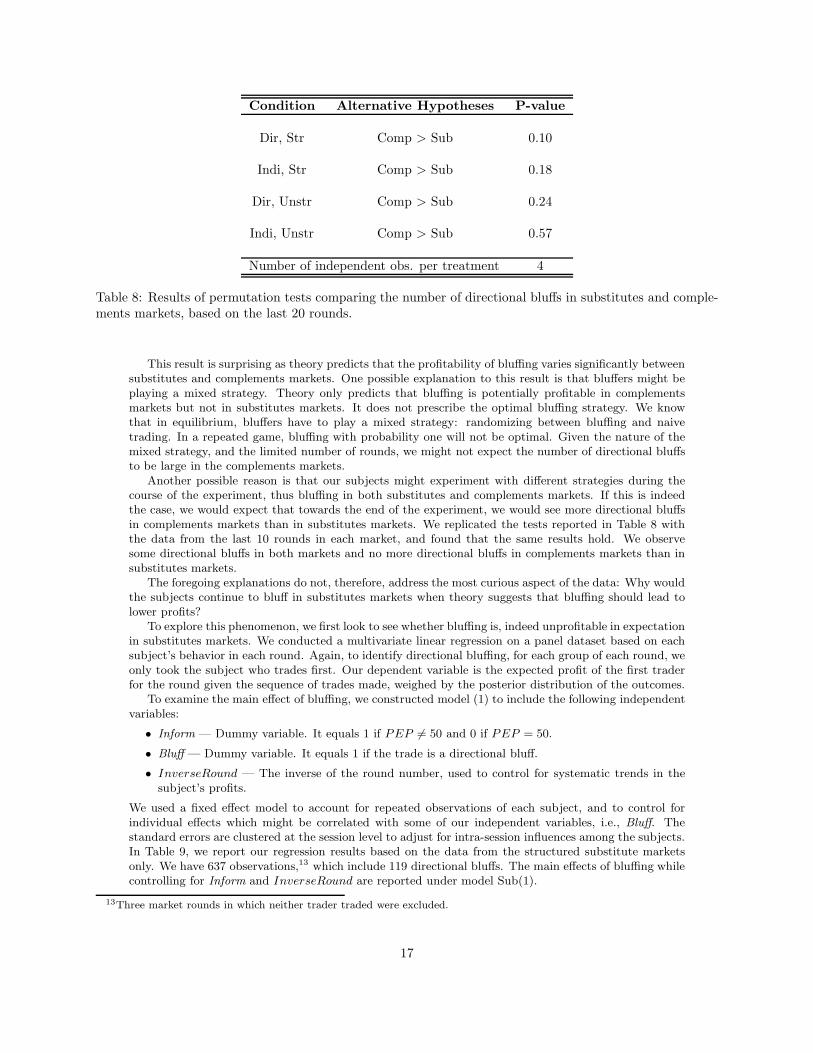
Condition Alternative Hypotheses P-value
Dir, Str Comp > Sub 0.10
Indi, Str Comp > Sub 0.18
Dir, Unstr Comp > Sub 0.24
Indi, Unstr Comp > Sub 0.57
Number of independent obs. per treatment 4
Table 8: Results of permutation tests comparing the number of directional bluffs in substitutes and comple-ments markets, based on the last 20 rounds.
This result is surprising as theory predicts that the profitability of bluffing varies significantly betweensubstitutes and complements markets. One possible explanation to this result is that bluffers might beplaying a mixed strategy. Theory only predicts that bluffing is potentially profitable in complementsmarkets but not in substitutes markets. It does not prescribe the optimal bluffing strategy. We knowthat in equilibrium, bluffers have to play a mixed strategy: randomizing between bluffing and naivetrading. In a repeated game, bluffing with probability one will not be optimal. Given the nature of themixed strategy, and the limited number of rounds, we might not expect the number of directional bluffsto be large in the complements markets.
Another possible reason is that our subjects might experiment with different strategies during thecourse of the experiment, thus bluffing in both substitutes and complements markets. If this is indeedthe case, we would expect that towards the end of the experiment, we would see more directional bluffsin complements markets than in substitutes markets. We replicated the tests reported in Table 8 withthe data from the last 10 rounds in each market, and found that the same results hold. We observesome directional bluffs in both markets and no more directional bluffs in complements markets than insubstitutes markets.
The foregoing explanations do not, therefore, address the most curious aspect of the data: Why wouldthe subjects continue to bluff in substitutes markets when theory suggests that bluffing should lead tolower profits?
To explore this phenomenon, we first look to see whether bluffing is, indeed unprofitable in expectationin substitutes markets. We conducted a multivariate linear regression on a panel dataset based on eachsubject’s behavior in each round. Again, to identify directional bluffing, for each group of each round, weonly took the subject who trades first. Our dependent variable is the expected profit of the first traderfor the round given the sequence of trades made, weighed by the posterior distribution of the outcomes.
To examine the main effect of bluffing, we constructed model (1) to include the following independentvariables:
• Inform — Dummy variable. It equals 1 if PEP 6= 50 and 0 if PEP = 50.
• Bluff — Dummy variable. It equals 1 if the trade is a directional bluff.
• InverseRound — The inverse of the round number, used to control for systematic trends in thesubject’s profits.
We used a fixed effect model to account for repeated observations of each subject, and to control forindividual effects which might be correlated with some of our independent variables, i.e., Bluff. Thestandard errors are clustered at the session level to adjust for intra-session influences among the subjects.In Table 9, we report our regression results based on the data from the structured substitute marketsonly. We have 637 observations,13 which include 119 directional bluffs. The main effects of bluffing whilecontrolling for Inform and InverseRound are reported under model Sub(1).
13Three market rounds in which neither trader traded were excluded.
17
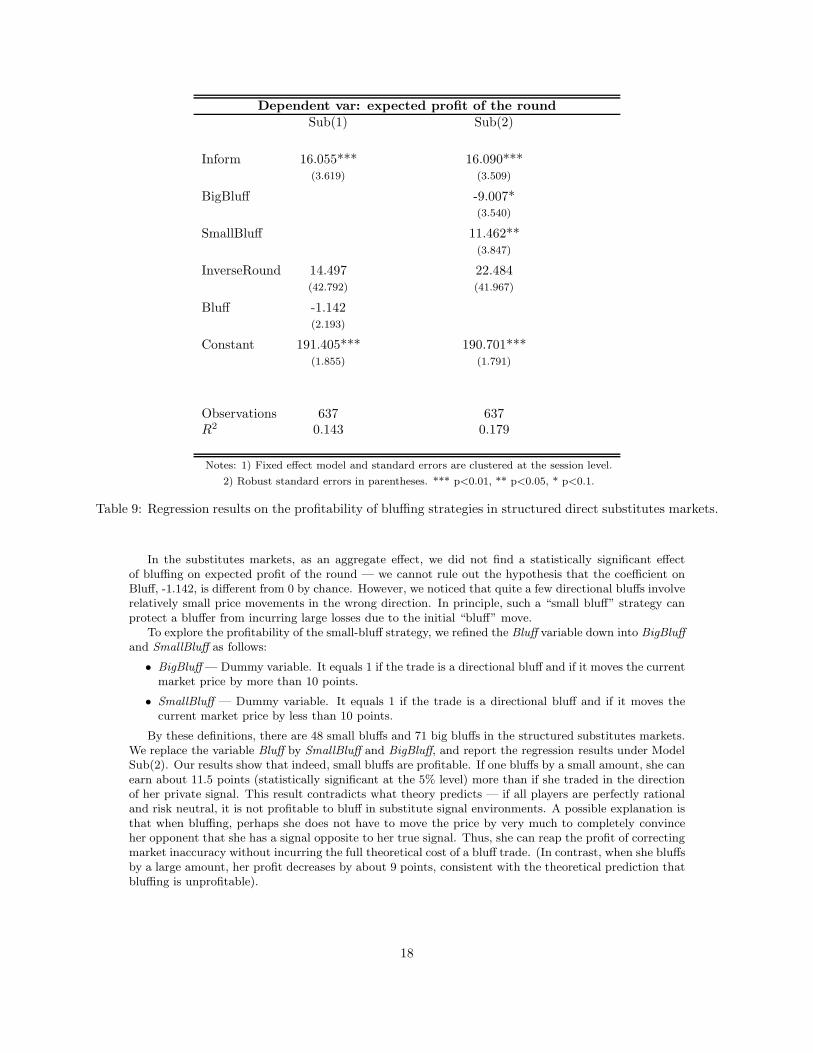
Dependent var: expected profit of the round
Sub(1) Sub(2)
Inform 16.055*** 16.090***(3.619) (3.509)
BigBluff -9.007*(3.540)
SmallBluff 11.462**(3.847)
InverseRound 14.497 22.484(42.792) (41.967)
Bluff -1.142(2.193)
Constant 191.405*** 190.701***(1.855) (1.791)
Observations 637 637R2 0.143 0.179
Notes: 1) Fixed effect model and standard errors are clustered at the session level.
2) Robust standard errors in parentheses. *** p<0.01, ** p<0.05, * p<0.1.
Table 9: Regression results on the profitability of bluffing strategies in structured direct substitutes markets.
In the substitutes markets, as an aggregate effect, we did not find a statistically significant effectof bluffing on expected profit of the round — we cannot rule out the hypothesis that the coefficient onBluff, -1.142, is different from 0 by chance. However, we noticed that quite a few directional bluffs involverelatively small price movements in the wrong direction. In principle, such a “small bluff” strategy canprotect a bluffer from incurring large losses due to the initial “bluff” move.
To explore the profitability of the small-bluff strategy, we refined the Bluff variable down into BigBluffand SmallBluff as follows:
• BigBluff — Dummy variable. It equals 1 if the trade is a directional bluff and if it moves the currentmarket price by more than 10 points.
• SmallBluff — Dummy variable. It equals 1 if the trade is a directional bluff and if it moves thecurrent market price by less than 10 points.
By these definitions, there are 48 small bluffs and 71 big bluffs in the structured substitutes markets.We replace the variable Bluff by SmallBluff and BigBluff, and report the regression results under ModelSub(2). Our results show that indeed, small bluffs are profitable. If one bluffs by a small amount, she canearn about 11.5 points (statistically significant at the 5% level) more than if she traded in the directionof her private signal. This result contradicts what theory predicts — if all players are perfectly rationaland risk neutral, it is not profitable to bluff in substitute signal environments. A possible explanation isthat when bluffing, perhaps she does not have to move the price by very much to completely convinceher opponent that she has a signal opposite to her true signal. Thus, she can reap the profit of correctingmarket inaccuracy without incurring the full theoretical cost of a bluff trade. (In contrast, when she bluffsby a large amount, her profit decreases by about 9 points, consistent with the theoretical prediction thatbluffing is unprofitable).
18
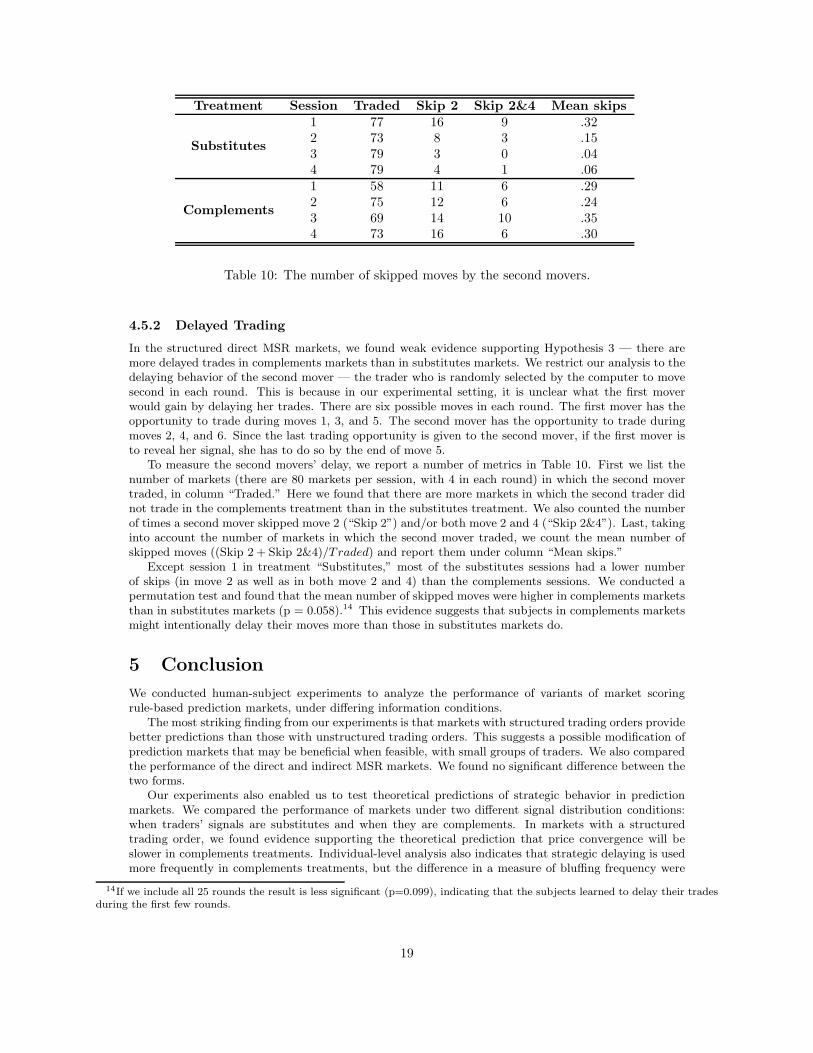
Treatment Session Traded Skip 2 Skip 2&4 Mean skips
Substitutes
1 77 16 9 .322 73 8 3 .153 79 3 0 .044 79 4 1 .06
Complements
1 58 11 6 .292 75 12 6 .243 69 14 10 .354 73 16 6 .30
Table 10: The number of skipped moves by the second movers.
4.5.2 Delayed Trading
In the structured direct MSR markets, we found weak evidence supporting Hypothesis 3 — there aremore delayed trades in complements markets than in substitutes markets. We restrict our analysis to thedelaying behavior of the second mover — the trader who is randomly selected by the computer to movesecond in each round. This is because in our experimental setting, it is unclear what the first moverwould gain by delaying her trades. There are six possible moves in each round. The first mover has theopportunity to trade during moves 1, 3, and 5. The second mover has the opportunity to trade duringmoves 2, 4, and 6. Since the last trading opportunity is given to the second mover, if the first mover isto reveal her signal, she has to do so by the end of move 5.
To measure the second movers’ delay, we report a number of metrics in Table 10. First we list thenumber of markets (there are 80 markets per session, with 4 in each round) in which the second movertraded, in column “Traded.” Here we found that there are more markets in which the second trader didnot trade in the complements treatment than in the substitutes treatment. We also counted the numberof times a second mover skipped move 2 (“Skip 2”) and/or both move 2 and 4 (“Skip 2&4”). Last, takinginto account the number of markets in which the second mover traded, we count the mean number ofskipped moves ((Skip 2 + Skip 2&4)/Traded) and report them under column “Mean skips.”
Except session 1 in treatment “Substitutes,” most of the substitutes sessions had a lower numberof skips (in move 2 as well as in both move 2 and 4) than the complements sessions. We conducted apermutation test and found that the mean number of skipped moves were higher in complements marketsthan in substitutes markets (p = 0.058).14 This evidence suggests that subjects in complements marketsmight intentionally delay their moves more than those in substitutes markets do.
5 Conclusion
We conducted human-subject experiments to analyze the performance of variants of market scoringrule-based prediction markets, under differing information conditions.
The most striking finding from our experiments is that markets with structured trading orders providebetter predictions than those with unstructured trading orders. This suggests a possible modification ofprediction markets that may be beneficial when feasible, with small groups of traders. We also comparedthe performance of the direct and indirect MSR markets. We found no significant difference between thetwo forms.
Our experiments also enabled us to test theoretical predictions of strategic behavior in predictionmarkets. We compared the performance of markets under two different signal distribution conditions:when traders’ signals are substitutes and when they are complements. In markets with a structuredtrading order, we found evidence supporting the theoretical prediction that price convergence will beslower in complements treatments. Individual-level analysis also indicates that strategic delaying is usedmore frequently in complements treatments, but the difference in a measure of bluffing frequency were
14If we include all 25 rounds the result is less significant (p=0.099), indicating that the subjects learned to delay their tradesduring the first few rounds.
19

not significant. In unstructured markets, however, the hypothesized difference in convergence speed wasnot borne out: there was no significant difference between substitutes and complements treatments inthis regard.
Our results suggest several important directions for future research. Firstly, our experiments wereconducted in two-trader markets so that we could closely test the theoretical predictions and makecleaner inferences about trader behavior; it is important to confirm the validity of our conclusions withlarger group experiments. Secondly, field experiments will complement our lab experiments comparingdirect and indirect MSR: the effect of variations in interface may be more pronounced when users arenot provided training in a controlled laboratory environment. Finally, the difference between structuredand unstructured markets suggests that future theoretical research should explicitly model the lack ofvisibility of trading opportunities that is typical of deployed prediction markets.
6 Acknowledgements
The authors thank the department editor, Teck-Hua Ho, the associate editor, and two anonymous review-ers for their helpful comments. This work was supported by the National Science Foundation grant CCF-0728768. We thank our Matthew Bombyk and Roberto Jimenez for their excellent research assistance inprogramming and conducting some of our pilot sessions, and Yan Chen, Jeffrey K. MacKie-Mason, PaulResnick and other seminar participants at the School of Information, University of Michigan for theirhelpful comments and suggestions.
References
[1] H. Berg and T. A. Proebsting. Hanson’s automated market maker. The Journal of PredictionMarkets, pages 45–49, Jan 2009.
[2] J. E. Berg, F. D. Nelson, and T. A. Rietz. Prediction market accuracy in the long run. InternationalJournal of Forecasting, 24(2):285 – 300, 2008.
[3] G. W. Brier. Verification of forecasts expressed in terms of probability. Monthly Weather Review,78:1–3, 1950.
[4] Y. Chen, S. Dimitrov, R. Sami, D. Reeves, D. Pennock, R. Hanson, L. Fortnow, and R. Gonen.Gaming prediction markets: Equilibrium strategies with a market maker. Algorithmica, 2009.
[5] Y. Chen and D. M. Pennock. A utility framework for bounded-loss market makers. In Proceedings ofthe 23rd Conference on Uncertainty in Artificial Intelligence (UAI 2007), pages 49–56, Vancouver,BC Canada, 2007.
[6] Y. Chen, D. M. Reeves, D. M. Pennock, R. D. Hanson, L. Fortnow, and R. Gonen. Bluffingand strategic reticence in prediction markets. In Lecture Notes in Computer Science, The ThirdWorkshop on Internet and Network Economics (WINE 2007), pages 70–81, 2007.
[7] R. M. Cooke. Experts in Uncertainty: Opinion and Subjective Probability in Science. OxfordUniversity Press, New York, 1991.
[8] B. Cowgill, J. Wolfers, and E. Zitzewitz. Using prediction markets to track information flow: Evi-dence from google, 2008.
[9] S. Dimitrov and R. Sami. Non-myopic strategies in prediction markets. In Proceedings of the NinethACM Conference on Electronic Commerce (EC’08), Chicago, IL, July 2008.
[10] E. F. Fama. Efficient capital market: A review of theory and empirical work. Journal of Finance,25:383–417, 1970.
[11] U. Fischbacher. z-tree: Zurich toolbox for ready-made economic experiments. Experimental Eco-nomics, 10(2):171–178, 2007.
[12] R. Forsythe, F. Nelson, G. R. Neumann, and J. Wright. Anatomy of an experimental political stockmarket. American Economic Review, 82(5), 1992.
[13] I. J. Good. Rational decisions. Journal of the Royal Statistical Society. Series B (Methodological),14(1):107–114, 1952.
20

[14] A. Graefe and J. S. Armstrong. Comparing face-to-face meetings, nominal groups, delphi andprediction markets on an estimation task. Working paper.
[15] R. Hanson. Combinatorial information market design. Information Systems Frontiers, 5(1):107–119,2003.
[16] R. Hanson, R. Oprea, and D. Porter. Information aggregation and manipulation in an experimentalmarket. Journal of Economic Behavior and Organization, Jan 2006.
[17] F. A. Hayek. The use of knowledge in society. The American Economic Review, 35:519 – 530, 1945.
[18] P. J. Healy, S. Linardi, J. R. Lowery, and J. O. Ledyard. Prediction markets: alternative mechanismsfor complex environments with few traders. 56(11):1977–1996, 2010.
[19] K. Iyer, R. Johari, and C. C. Moallemi. Information aggregation and allocative efficiency in smoothmarkets. In Proceedings of the Eleventh ACM Conference on Electronic Commerce (EC’10), Cam-bridge, MA, June 2010.
[20] J. H. Kagel. Auctions: a survey of experimental research, pages 501–585. Princeton UniversityPress, Princeton, NJ, 1995.
[21] S. Kullback and R. Leibler. On information and sufficiency. Annals of Mathematical Statistics,22(1):79–86, 1951.
[22] J. Ledyard, R. Hanson, and T. Ishikida. An experimental test of combinatorial information markets.Journal of Economic Behavior and Organization, 69(2):182–189, 2009.
[23] J. F. Muth. Rational expectations and the theory of price movements. Econometrica, 29:315–335,1961.
[24] R. Oprea, D. Porter, C. Hibbert, R. Hanson, and D. Tila. Can manipulators mislead marketobservers? Working paper, 2007.
[25] M. Ostrovsky. Information aggregation in dynamic markets with strategic traders. In Proceedingsof the Tenth ACM Conference on Electronic Commerce (EC’09), Stanford, CA, July 2009.
[26] D. Pennock. Implementing Hanson’s Market Maker, 2006. Blog post, available athttp://blog.oddhead.com/2006/10/30/implementing-hansons-market-maker/ .
[27] C. R. Plott and S. Sunder. Efficiency of experimental security markets with insider information: anapplication of rational-expectations models. The Journal of Political Economy, 90:663–698, 1982.
[28] C. R. Plott and S. Sunder. Rational expectations and the aggregation of diverse information inlaboratory security markets. Econometric, 56(5):1085–1118, 1988.
[29] R. Radner. Rational expectations equilibrium: Generic existence and the information revealed inprices. Econometrica, 47(3):655–678, 1979.
[30] R. Selten. Axiomatic characterization of the quadratic scoring rule. Experimental Economics,1(1):43–62, June 1998.
[31] G. Tziralis and I. Tatsiopoulos. Prediction markets: An extended literature review. Journal ofPrediction Markets, 1(1):75–91, 2007.
[32] J. Wolfers and E. Zitzewitz. Prediction markets. Journal of Economic Perspectives, 18(2):107–126,2004.
[33] F. Woudenberg. An evaluation of delphi. Technological Forecasting and Social Change, 40:131–150,1991.
21
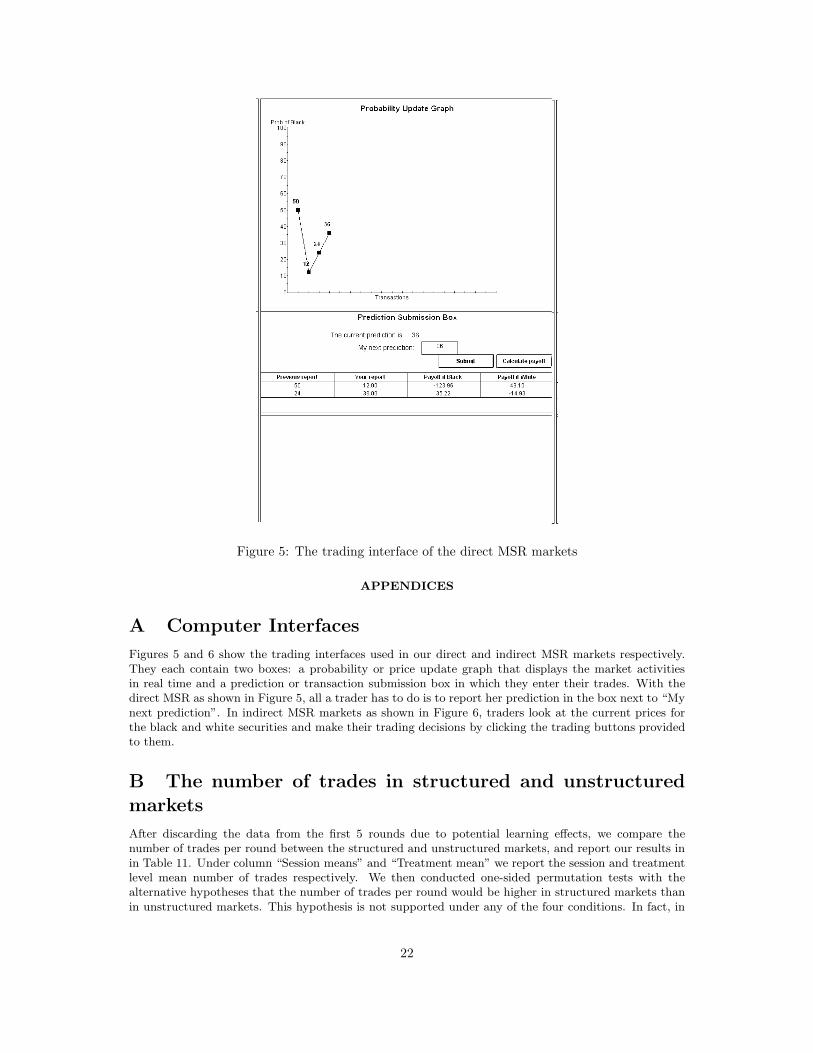
Figure 5: The trading interface of the direct MSR markets
APPENDICES
A Computer Interfaces
Figures 5 and 6 show the trading interfaces used in our direct and indirect MSR markets respectively.They each contain two boxes: a probability or price update graph that displays the market activitiesin real time and a prediction or transaction submission box in which they enter their trades. With thedirect MSR as shown in Figure 5, all a trader has to do is to report her prediction in the box next to “Mynext prediction”. In indirect MSR markets as shown in Figure 6, traders look at the current prices forthe black and white securities and make their trading decisions by clicking the trading buttons providedto them.
B The number of trades in structured and unstructured
markets
After discarding the data from the first 5 rounds due to potential learning effects, we compare thenumber of trades per round between the structured and unstructured markets, and report our results inin Table 11. Under column “Session means” and “Treatment mean” we report the session and treatmentlevel mean number of trades respectively. We then conducted one-sided permutation tests with thealternative hypotheses that the number of trades per round would be higher in structured markets thanin unstructured markets. This hypothesis is not supported under any of the four conditions. In fact, in
22
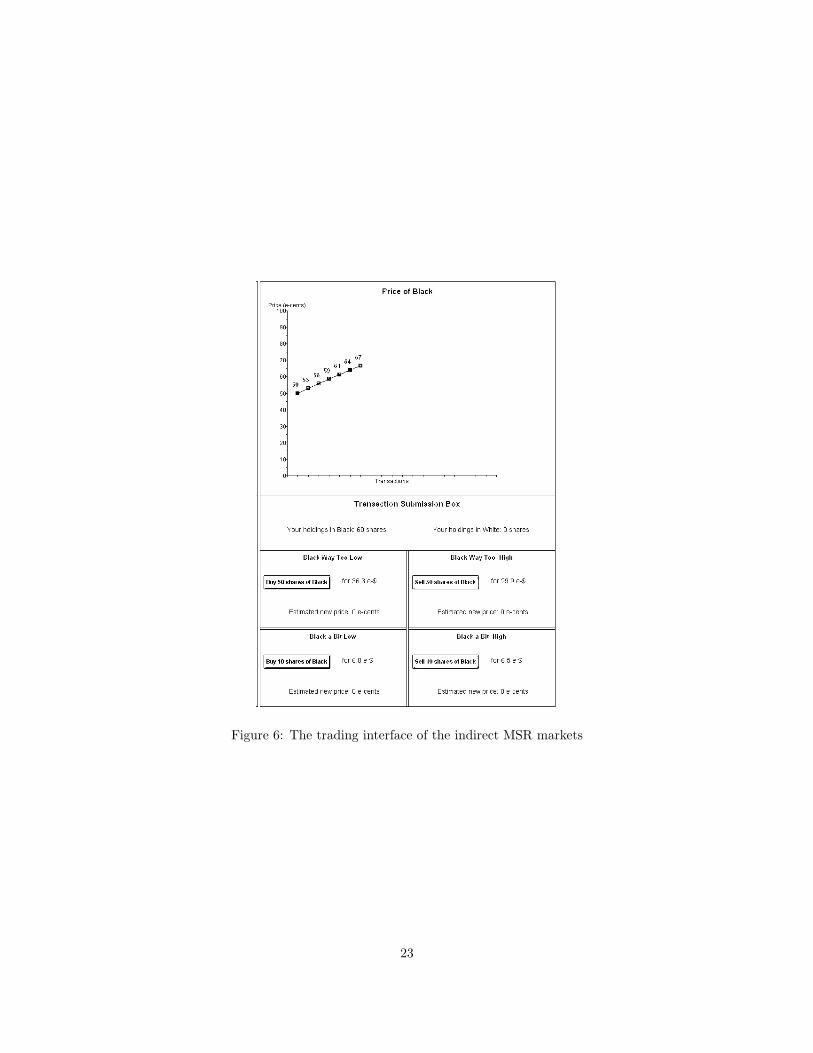
Figure 6: The trading interface of the indirect MSR markets
23
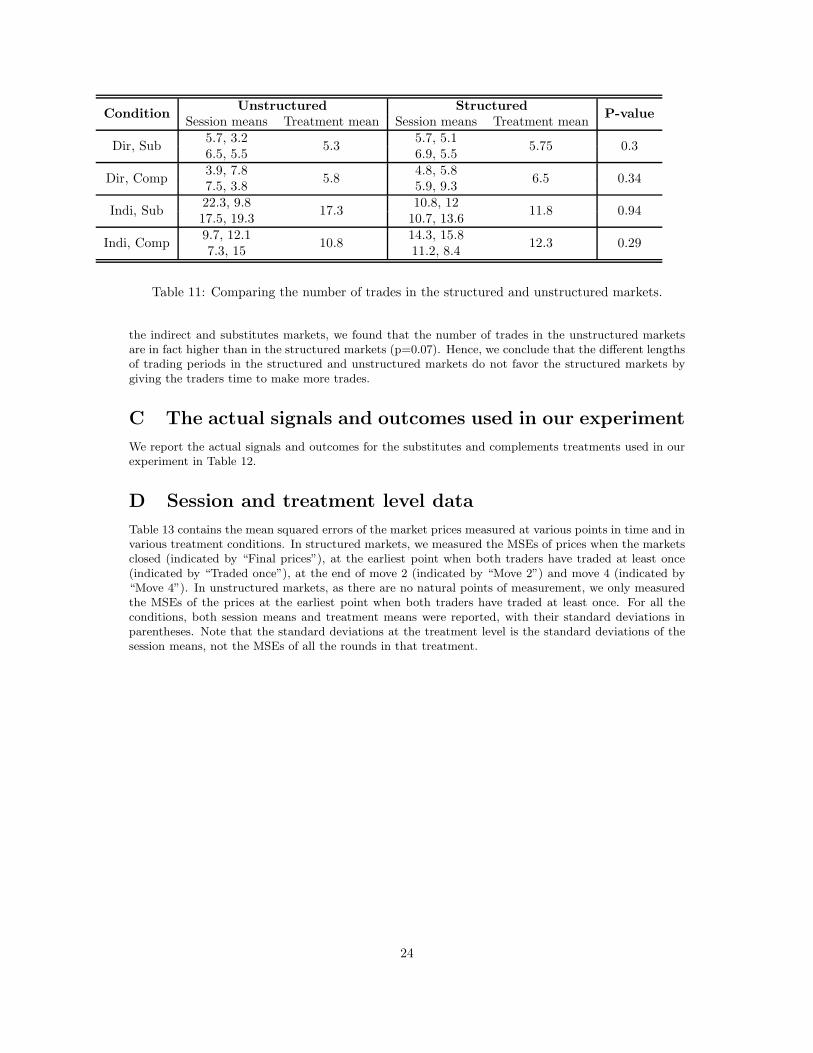
ConditionUnstructured Structured
P-valueSession means Treatment mean Session means Treatment mean
Dir, Sub5.7, 3.2
5.35.7, 5.1
5.75 0.36.5, 5.5 6.9, 5.5
Dir, Comp3.9, 7.8
5.84.8, 5.8
6.5 0.347.5, 3.8 5.9, 9.3
Indi, Sub22.3, 9.8
17.310.8, 12
11.8 0.9417.5, 19.3 10.7, 13.6
Indi, Comp9.7, 12.1
10.814.3, 15.8
12.3 0.297.3, 15 11.2, 8.4
Table 11: Comparing the number of trades in the structured and unstructured markets.
the indirect and substitutes markets, we found that the number of trades in the unstructured marketsare in fact higher than in the structured markets (p=0.07). Hence, we conclude that the different lengthsof trading periods in the structured and unstructured markets do not favor the structured markets bygiving the traders time to make more trades.
C The actual signals and outcomes used in our experiment
We report the actual signals and outcomes for the substitutes and complements treatments used in ourexperiment in Table 12.
D Session and treatment level data
Table 13 contains the mean squared errors of the market prices measured at various points in time and invarious treatment conditions. In structured markets, we measured the MSEs of prices when the marketsclosed (indicated by “Final prices”), at the earliest point when both traders have traded at least once(indicated by “Traded once”), at the end of move 2 (indicated by “Move 2”) and move 4 (indicated by“Move 4”). In unstructured markets, as there are no natural points of measurement, we only measuredthe MSEs of the prices at the earliest point when both traders have traded at least once. For all theconditions, both session means and treatment means were reported, with their standard deviations inparentheses. Note that the standard deviations at the treatment level is the standard deviations of thesession means, not the MSEs of all the rounds in that treatment.
24

Substitutes Treatment Complements Treatment
Round Trader 1 Trader 2 Outcome Trader 1 Trader 2 Outcome
1 1 -1 Black 1 1 Black2 -1 1 Black -1 1 Black3 1 -1 White -1 1 Black4 1 1 Black -1 -1 White5 1 -1 White 1 -1 White
6 1 1 Black -1 -1 White7 -1 -1 White -1 -1 White8 1 1 Black 1 1 White9 -1 -1 White 1 1 Black10 -1 -1 White -1 -1 White
11 1 1 Black -1 1 Black12 -1 -1 White -1 -1 Black13 -1 1 White -1 -1 White14 1 1 Black 1 -1 White15 -1 1 White -1 1 Black
16 -1 1 White 1 -1 White17 1 1 Black 1 1 Black18 -1 1 White -1 -1 Black19 -1 1 White 1 -1 White20 -1 1 White 1 -1 Black
21 -1 -1 White -1 1 White22 -1 1 Black -1 -1 White23 1 -1 White -1 -1 White24 -1 1 Black 1 -1 White25 1 -1 Black -1 -1 White
Table 12: The actual signals and outcomes for the substitutes and complements treatments respectively
25
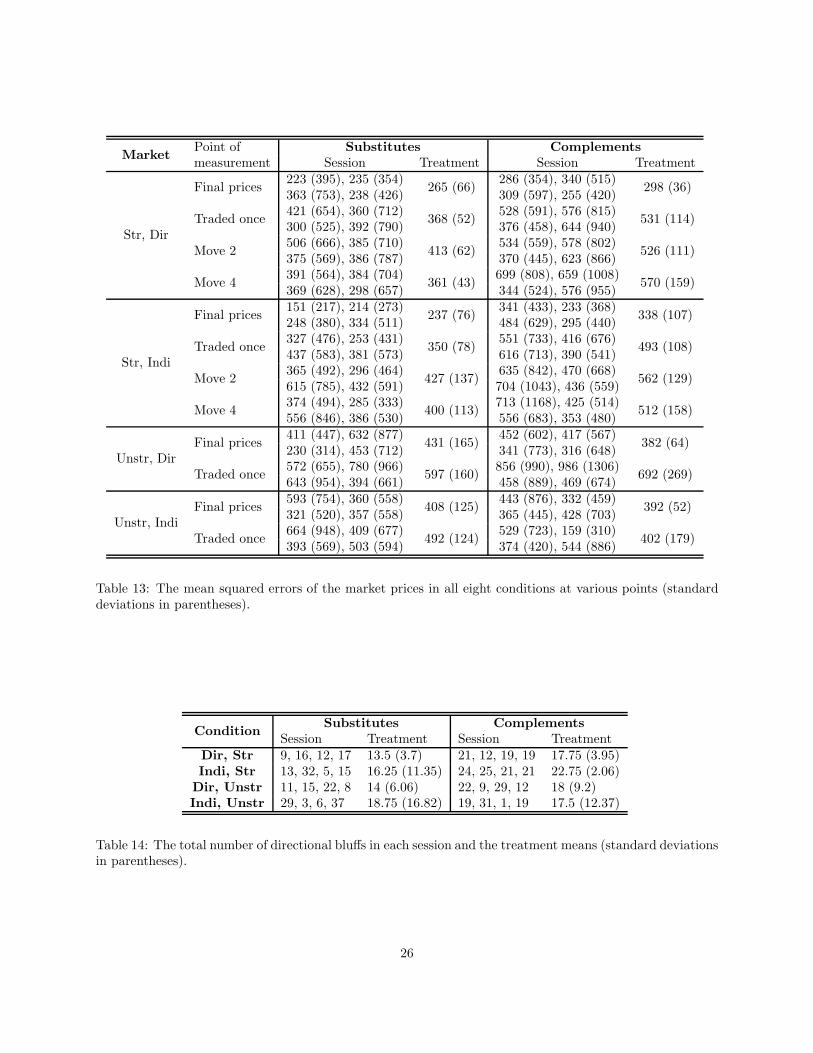
MarketPoint of Substitutes Complements
measurement Session Treatment Session Treatment
Str, Dir
Final prices223 (395), 235 (354)
265 (66)286 (354), 340 (515)
298 (36)363 (753), 238 (426) 309 (597), 255 (420)
Traded once421 (654), 360 (712)
368 (52)528 (591), 576 (815)
531 (114)300 (525), 392 (790) 376 (458), 644 (940)
Move 2506 (666), 385 (710)
413 (62)534 (559), 578 (802)
526 (111)375 (569), 386 (787) 370 (445), 623 (866)
Move 4391 (564), 384 (704)
361 (43)699 (808), 659 (1008)
570 (159)369 (628), 298 (657) 344 (524), 576 (955)
Str, Indi
Final prices151 (217), 214 (273)
237 (76)341 (433), 233 (368)
338 (107)248 (380), 334 (511) 484 (629), 295 (440)
Traded once327 (476), 253 (431)
350 (78)551 (733), 416 (676)
493 (108)437 (583), 381 (573) 616 (713), 390 (541)
Move 2365 (492), 296 (464)
427 (137)635 (842), 470 (668)
562 (129)615 (785), 432 (591) 704 (1043), 436 (559)
Move 4374 (494), 285 (333)
400 (113)713 (1168), 425 (514)
512 (158)556 (846), 386 (530) 556 (683), 353 (480)
Unstr, DirFinal prices
411 (447), 632 (877)431 (165)
452 (602), 417 (567)382 (64)
230 (314), 453 (712) 341 (773), 316 (648)
Traded once572 (655), 780 (966)
597 (160)856 (990), 986 (1306)
692 (269)643 (954), 394 (661) 458 (889), 469 (674)
Unstr, IndiFinal prices
593 (754), 360 (558)408 (125)
443 (876), 332 (459)392 (52)
321 (520), 357 (558) 365 (445), 428 (703)
Traded once664 (948), 409 (677)
492 (124)529 (723), 159 (310)
402 (179)393 (569), 503 (594) 374 (420), 544 (886)
Table 13: The mean squared errors of the market prices in all eight conditions at various points (standarddeviations in parentheses).
ConditionSubstitutes Complements
Session Treatment Session TreatmentDir, Str 9, 16, 12, 17 13.5 (3.7) 21, 12, 19, 19 17.75 (3.95)Indi, Str 13, 32, 5, 15 16.25 (11.35) 24, 25, 21, 21 22.75 (2.06)Dir, Unstr 11, 15, 22, 8 14 (6.06) 22, 9, 29, 12 18 (9.2)Indi, Unstr 29, 3, 6, 37 18.75 (16.82) 19, 31, 1, 19 17.5 (12.37)
Table 14: The total number of directional bluffs in each session and the treatment means (standard deviationsin parentheses).
26
Related Documents