International Journal of Scientific and Research Publications, Volume 3, Issue 11, November 2013 1 ISSN 2250-3153 www.ijsrp.org Aggravation of Silent killer; Air pollution in the City of Colombo L. Manawadu * , Manjula Ranagalage ** * Professor of Geography, University of Colombo, Sri Lanka ** Lecturer, Department of Social Sciences, Rajarata University of Sri Lanka, Sri Lanka Abstract- Air pollution has been identified as one of the silent killers in the present world as pollutants are taking lives of people without making any noise. Unlike other disasters, air pollution destroys human life gradually. People can see and people can predict when disasters occur. However, people cannot understand or cannot see when air pollution is taking place until people are seriously affected. The road transport and traffic significantly contribute to degrade the quality of air in any region of the world. This study attempts to examine the spatial pattern of Sulfur dioxide and Nitrogen dioxide in the city of Colombo using the data collected by the National Building Research Organization (NBRO), Sri Lanka from January, 2003 to December, 2005. Some socio- economic data which are used as explanatory variables for the spatial pattern of air pollutants were collected from different government organizations. GIS techniques such as spatial interpolation, spatial query and Geostatistical techniques were adopted to achieve the desired objectives. The main objective of this study is to understand the air pollution dynamics and explore the reasons for aggravating air pollutants in the city in recent past. It has been identified that there is a very significant periodic changes of contamination of pollutants with the rainy seasons. However, human factors of the city contribute more than the physical factors in degradation of the air quality. By using grid based regression analysis, traffic density was identified as the most significant explanatory variable among the selected socio-economic variables. Characteristics of traffic fleets are found to be highly responsible for the degradation of air quality in the city of Colombo. Index Terms- Air pollution, Car journey travel time, Silent Killer, Sulfur dioxide I. INTRODUCTION he average contamination of Nitrogen dioxide (NO 2 ) and Sulfur dioxide (SO 2 ) in the city of Colombo shows fairly significant statistics when compared with the national air quality standards of the country (Table 01). However, someone can argue that the air quality of the city is not healthy or there is a high tendency to decrease the quality of air when look at the individual observations and occurrences of exceedances (Table 02). Both parameters, SO 2 and NO 2 indicate a high tendency to be increased during the period Table 01: Average Contamination of Pollutants and National Control levels Period Average Contamination of Sulphur dioxide (μg/m 3 ) Average Contamination of Nitrogen dioxide (μg/m 3 ) Entire Period (2003 – 2005) 34.03 32.43 National Control Levels 80 (24 hr)* 100 (24 hr)* * See appendix 01 from 2003 to 2005 where data have been collected by the National Building Research Organization (Figure 01 and 02). T

Welcome message from author
This document is posted to help you gain knowledge. Please leave a comment to let me know what you think about it! Share it to your friends and learn new things together.
Transcript
International Journal of Scientific and Research Publications, Volume 3, Issue 11, November 2013 1 ISSN 2250-3153
www.ijsrp.org
Aggravation of Silent killer; Air pollution in the City of
Colombo
L. Manawadu*, Manjula Ranagalage
**
* Professor of Geography, University of Colombo, Sri Lanka
** Lecturer, Department of Social Sciences, Rajarata University of Sri Lanka, Sri Lanka
Abstract- Air pollution has been identified as one of the silent
killers in the present world as pollutants are taking lives of
people without making any noise. Unlike other disasters, air
pollution destroys human life gradually. People can see and
people can predict when disasters occur. However, people cannot
understand or cannot see when air pollution is taking place until
people are seriously affected.
The road transport and traffic significantly contribute to
degrade the quality of air in any region of the world. This study
attempts to examine the spatial pattern of Sulfur dioxide and
Nitrogen dioxide in the city of Colombo using the data collected
by the National Building Research Organization (NBRO), Sri
Lanka from January, 2003 to December, 2005. Some socio-
economic data which are used as explanatory variables for the
spatial pattern of air pollutants were collected from different
government organizations.
GIS techniques such as spatial interpolation, spatial query
and Geostatistical techniques were adopted to achieve the desired
objectives. The main objective of this study is to understand the
air pollution dynamics and explore the reasons for aggravating
air pollutants in the city in recent past.
It has been identified that there is a very significant periodic
changes of contamination of pollutants with the rainy seasons.
However, human factors of the city contribute more than the
physical factors in degradation of the air quality.
By using grid based regression analysis, traffic density was
identified as the most significant explanatory variable among the
selected socio-economic variables. Characteristics of traffic
fleets are found to be highly responsible for the degradation of
air quality in the city of Colombo.
Index Terms- Air pollution, Car journey travel time, Silent
Killer, Sulfur dioxide
I. INTRODUCTION
he average contamination of Nitrogen dioxide (NO2) and
Sulfur dioxide (SO2) in the city of Colombo shows fairly
significant statistics when compared with the national air quality
standards of the country (Table 01). However, someone can
argue that the air quality of the city is not healthy or there is a
high tendency to decrease the quality of air when look at the
individual observations and occurrences of exceedances (Table
02). Both parameters, SO2 and NO2 indicate a high tendency to
be increased during the period
Table 01: Average Contamination of Pollutants and National Control levels
Period Average Contamination of
Sulphur dioxide (µg/m3)
Average Contamination of
Nitrogen dioxide (µg/m3)
Entire Period (2003 – 2005) 34.03 32.43
National Control Levels 80 (24 hr)* 100 (24 hr)*
* See appendix 01
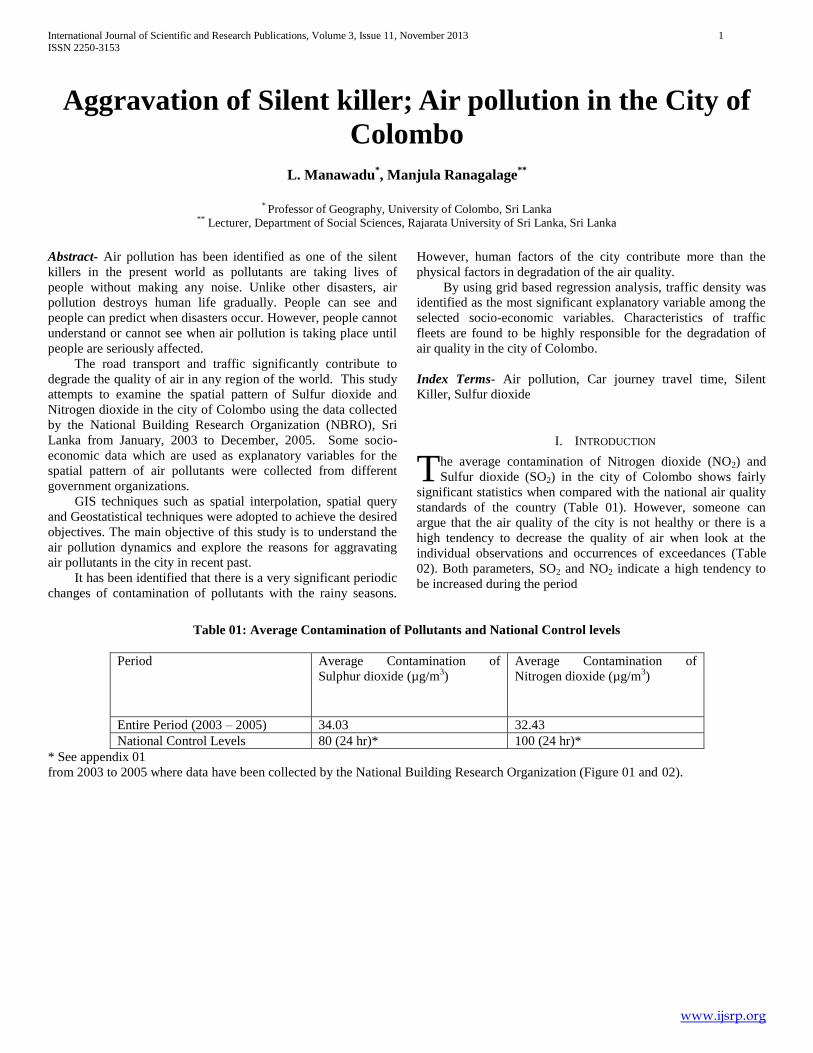
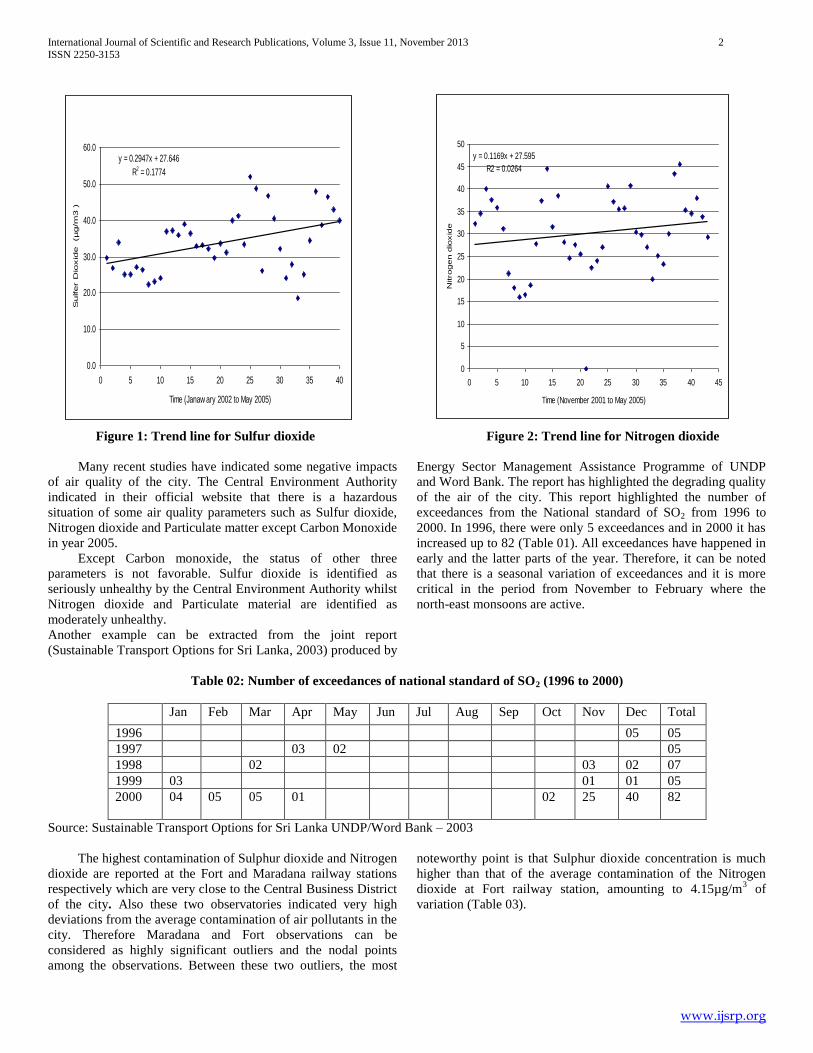
from 2003 to 2005 where data have been collected by the National Building Research Organization (Figure 01 and 02).
T
International Journal of Scientific and Research Publications, Volume 3, Issue 11, November 2013 2
ISSN 2250-3153
www.ijsrp.org
Figure 1: Trend line for Sulfur dioxide Figure 2: Trend line for Nitrogen dioxide
Many recent studies have indicated some negative impacts
of air quality of the city. The Central Environment Authority
indicated in their official website that there is a hazardous
situation of some air quality parameters such as Sulfur dioxide,
Nitrogen dioxide and Particulate matter except Carbon Monoxide
in year 2005.
Except Carbon monoxide, the status of other three
parameters is not favorable. Sulfur dioxide is identified as
seriously unhealthy by the Central Environment Authority whilst
Nitrogen dioxide and Particulate material are identified as
moderately unhealthy.
Another example can be extracted from the joint report
(Sustainable Transport Options for Sri Lanka, 2003) produced by
Energy Sector Management Assistance Programme of UNDP
and Word Bank. The report has highlighted the degrading quality
of the air of the city. This report highlighted the number of
exceedances from the National standard of SO2 from 1996 to
2000. In 1996, there were only 5 exceedances and in 2000 it has
increased up to 82 (Table 01). All exceedances have happened in
early and the latter parts of the year. Therefore, it can be noted
that there is a seasonal variation of exceedances and it is more
critical in the period from November to February where the
north-east monsoons are active.
Table 02: Number of exceedances of national standard of SO2 (1996 to 2000)
Jan Feb Mar Apr May Jun Jul Aug Sep Oct Nov Dec Total
1996 05 05
1997 03 02 05
1998 02 03 02 07
1999 03 01 01 05
2000 04 05 05 01 02 25 40 82
Source: Sustainable Transport Options for Sri Lanka UNDP/Word Bank – 2003
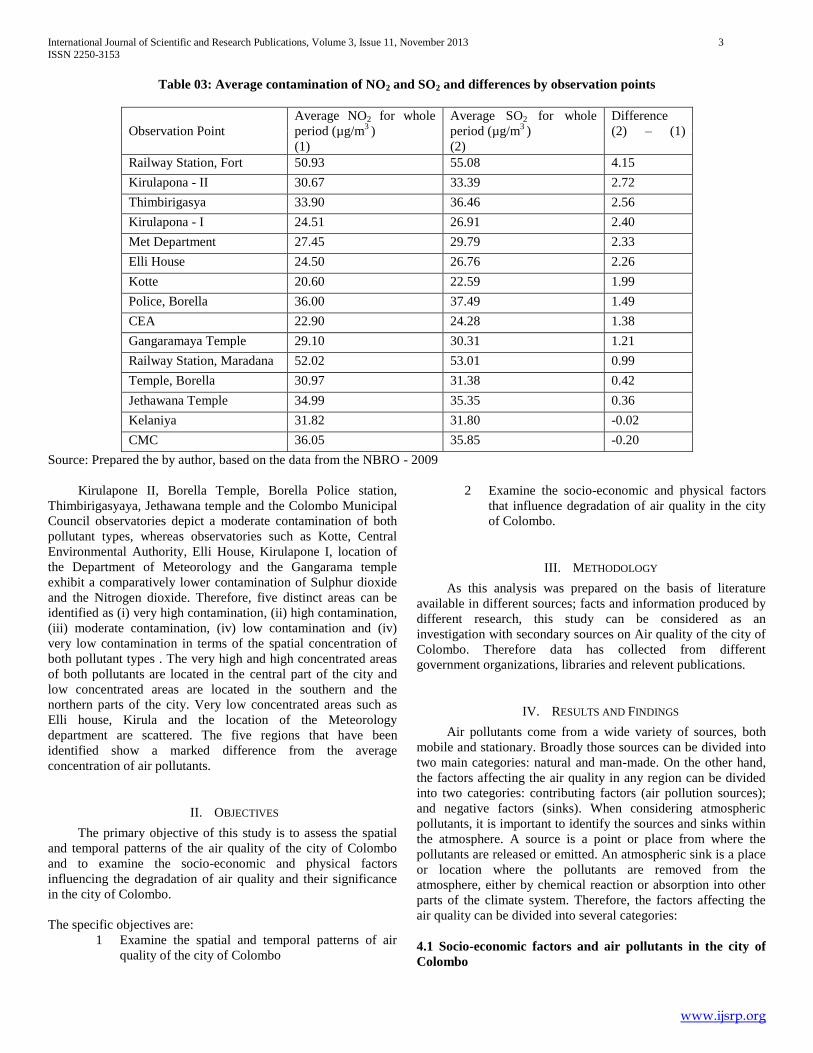
The highest contamination of Sulphur dioxide and Nitrogen
dioxide are reported at the Fort and Maradana railway stations
respectively which are very close to the Central Business District
of the city. Also these two observatories indicated very high
deviations from the average contamination of air pollutants in the
city. Therefore Maradana and Fort observations can be
considered as highly significant outliers and the nodal points
among the observations. Between these two outliers, the most
noteworthy point is that Sulphur dioxide concentration is much
higher than that of the average contamination of the Nitrogen
dioxide at Fort railway station, amounting to 4.15µg/m3 of
variation (Table 03).
Figure 3.1: Trend line for Sulfer Dioxide
y = 0.2947x + 27.646
R2 = 0.1774
0.0
10.0
20.0
30.0
40.0
50.0
60.0
0 5 10 15 20 25 30 35 40
Time (Janaw ary 2002 to May 2005)
Sulfer D
ioxid
e (µg/m
3 )
Figure 3.2: Trend line for Nitrogen dioxide
y = 0.1169x + 27.595
R2 = 0.0264
0
5
10
15
20
25
30
35
40
45
50
0 5 10 15 20 25 30 35 40 45
Time (November 2001 to May 2005)
Nitrogen d
ioxid
e
International Journal of Scientific and Research Publications, Volume 3, Issue 11, November 2013 3
ISSN 2250-3153
www.ijsrp.org
Table 03: Average contamination of NO2 and SO2 and differences by observation points
Observation Point
Average NO2 for whole
period (µg/m3 )
(1)
Average SO2 for whole
period (µg/m3 )
(2)
Difference
(2) – (1)
Railway Station, Fort 50.93 55.08 4.15
Kirulapona - II 30.67 33.39 2.72
Thimbirigasya 33.90 36.46 2.56
Kirulapona - I 24.51 26.91 2.40
Met Department 27.45 29.79 2.33
Elli House 24.50 26.76 2.26
Kotte 20.60 22.59 1.99
Police, Borella 36.00 37.49 1.49
CEA 22.90 24.28 1.38
Gangaramaya Temple 29.10 30.31 1.21
Railway Station, Maradana 52.02 53.01 0.99
Temple, Borella 30.97 31.38 0.42
Jethawana Temple 34.99 35.35 0.36
Kelaniya 31.82 31.80 -0.02
CMC 36.05 35.85 -0.20
Source: Prepared the by author, based on the data from the NBRO - 2009
Kirulapone II, Borella Temple, Borella Police station,
Thimbirigasyaya, Jethawana temple and the Colombo Municipal
Council observatories depict a moderate contamination of both
pollutant types, whereas observatories such as Kotte, Central
Environmental Authority, Elli House, Kirulapone I, location of
the Department of Meteorology and the Gangarama temple
exhibit a comparatively lower contamination of Sulphur dioxide
and the Nitrogen dioxide. Therefore, five distinct areas can be
identified as (i) very high contamination, (ii) high contamination,
(iii) moderate contamination, (iv) low contamination and (iv)
very low contamination in terms of the spatial concentration of
both pollutant types . The very high and high concentrated areas
of both pollutants are located in the central part of the city and
low concentrated areas are located in the southern and the
northern parts of the city. Very low concentrated areas such as
Elli house, Kirula and the location of the Meteorology
department are scattered. The five regions that have been
identified show a marked difference from the average
concentration of air pollutants.
II. OBJECTIVES
The primary objective of this study is to assess the spatial
and temporal patterns of the air quality of the city of Colombo
and to examine the socio-economic and physical factors
influencing the degradation of air quality and their significance
in the city of Colombo.
The specific objectives are:
1 Examine the spatial and temporal patterns of air
quality of the city of Colombo
2 Examine the socio-economic and physical factors
that influence degradation of air quality in the city
of Colombo.
III. METHODOLOGY
As this analysis was prepared on the basis of literature
available in different sources; facts and information produced by
different research, this study can be considered as an
investigation with secondary sources on Air quality of the city of
Colombo. Therefore data has collected from different
government organizations, libraries and relevent publications.
IV. RESULTS AND FINDINGS
Air pollutants come from a wide variety of sources, both
mobile and stationary. Broadly those sources can be divided into
two main categories: natural and man-made. On the other hand,
the factors affecting the air quality in any region can be divided
into two categories: contributing factors (air pollution sources);
and negative factors (sinks). When considering atmospheric
pollutants, it is important to identify the sources and sinks within
the atmosphere. A source is a point or place from where the
pollutants are released or emitted. An atmospheric sink is a place
or location where the pollutants are removed from the
atmosphere, either by chemical reaction or absorption into other
parts of the climate system. Therefore, the factors affecting the
air quality can be divided into several categories:
4.1 Socio-economic factors and air pollutants in the city of
Colombo
International Journal of Scientific and Research Publications, Volume 3, Issue 11, November 2013 4
ISSN 2250-3153
www.ijsrp.org
Since the Industrial Revolution, atmospheric concentrations
of many greenhouse gases have been increasing, primarily due to
human activities. During the last fifty years, there has been an
additional input to the atmosphere of halocarbons such as CFCs,
as well as depleting Ozone, also act as greenhouse gases. With
more greenhouse gases in the atmosphere, the natural greenhouse
effect is being enhanced artificially, and this could bring about
global warming.
In this section, some of the selected man-made factors have
been examined against the air quality of the city. The selected
man made factors are: population density (population
distribution), population density in underserved settlements,
housing density, housing condition, building density, traffic
density and land use and land cover. Statistical relationships
between these parameters and air pollutants have been examined
using different techniques available in Geographical Information
Systems (GIS). Among the socio-economic parameters selected,
traffic density can be considered as the highly contributing factor
for degrading the air quality of the city (Table 04).
Table 04: Correlation coefficients between air pollutants and
socio-economic parameters.
Socio-economic parameter Sulfur dioxide Nitrogen
dioxide
Population density 0.2422 0.2810
Population density
(Undeserved settlements)
0.1413 0.1416
Housing Density 0.1213 0.1222
Housing Density
(Undeserved settlements)
0.1657 0.1534
Housing condition 0.0348 0.0247
Building density 0.1592 0.1865
Traffic density 0.5218 0.5220
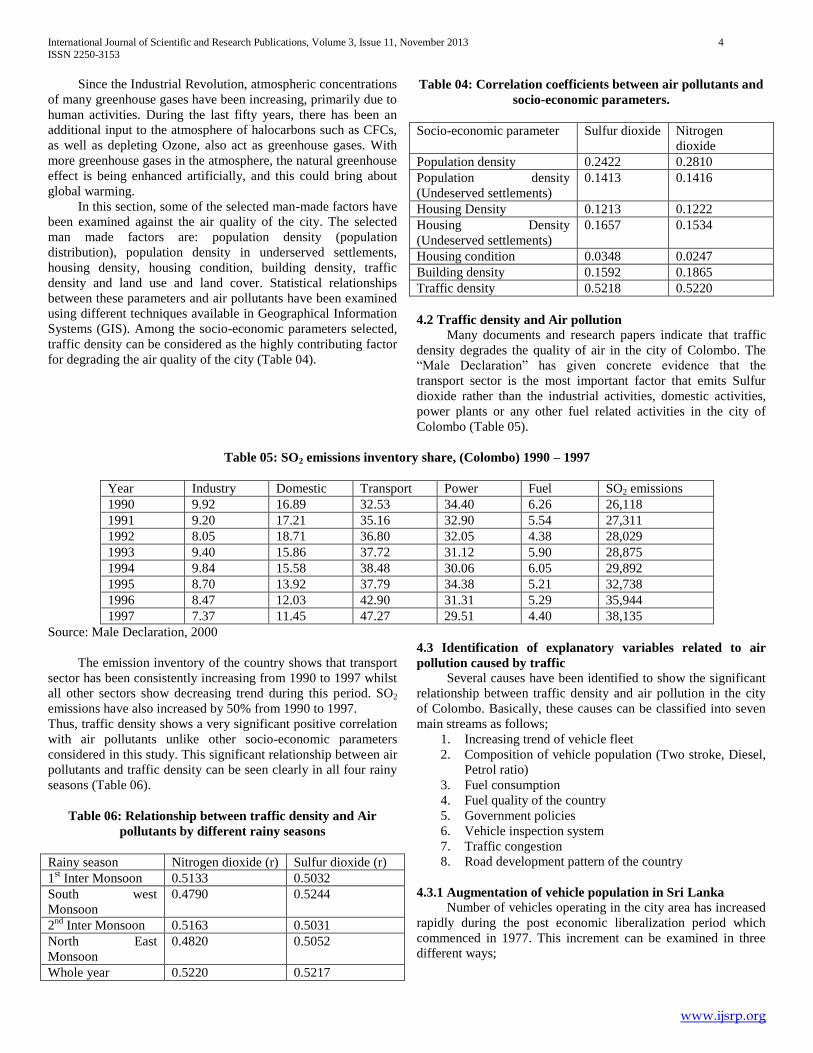
4.2 Traffic density and Air pollution
Many documents and research papers indicate that traffic
density degrades the quality of air in the city of Colombo. The
“Male Declaration” has given concrete evidence that the
transport sector is the most important factor that emits Sulfur
dioxide rather than the industrial activities, domestic activities,
power plants or any other fuel related activities in the city of
Colombo (Table 05).
Table 05: SO2 emissions inventory share, (Colombo) 1990 – 1997
Year Industry Domestic Transport Power Fuel SO2 emissions
1990 9.92 16.89 32.53 34.40 6.26 26,118
1991 9.20 17.21 35.16 32.90 5.54 27,311
1992 8.05 18.71 36.80 32.05 4.38 28,029
1993 9.40 15.86 37.72 31.12 5.90 28,875
1994 9.84 15.58 38.48 30.06 6.05 29,892
1995 8.70 13.92 37.79 34.38 5.21 32,738
1996 8.47 12.03 42.90 31.31 5.29 35,944
1997 7.37 11.45 47.27 29.51 4.40 38,135
Source: Male Declaration, 2000
The emission inventory of the country shows that transport
sector has been consistently increasing from 1990 to 1997 whilst
all other sectors show decreasing trend during this period. SO2
emissions have also increased by 50% from 1990 to 1997.
Thus, traffic density shows a very significant positive correlation
with air pollutants unlike other socio-economic parameters
considered in this study. This significant relationship between air
pollutants and traffic density can be seen clearly in all four rainy
seasons (Table 06).
Table 06: Relationship between traffic density and Air
pollutants by different rainy seasons
Rainy season Nitrogen dioxide (r) Sulfur dioxide (r)
1st Inter Monsoon 0.5133 0.5032
South west
Monsoon
0.4790 0.5244
2nd
Inter Monsoon 0.5163 0.5031
North East
Monsoon
0.4820 0.5052
Whole year 0.5220 0.5217
4.3 Identification of explanatory variables related to air
pollution caused by traffic
Several causes have been identified to show the significant
relationship between traffic density and air pollution in the city
of Colombo. Basically, these causes can be classified into seven
main streams as follows;
1. Increasing trend of vehicle fleet
2. Composition of vehicle population (Two stroke, Diesel,
Petrol ratio)
3. Fuel consumption
4. Fuel quality of the country
5. Government policies
6. Vehicle inspection system
7. Traffic congestion
8. Road development pattern of the country
4.3.1 Augmentation of vehicle population in Sri Lanka
Number of vehicles operating in the city area has increased
rapidly during the post economic liberalization period which
commenced in 1977. This increment can be examined in three
different ways;
International Journal of Scientific and Research Publications, Volume 3, Issue 11, November 2013 5
ISSN 2250-3153
www.ijsrp.org
1. Increasing trend of number of vehicles enter / operate
in the city
2. Number of vehicles registered in Sri Lanka
3. Changing pattern of car journey speed
4.3.1.1 Increasing trend of number of vehicles enter the city
According o the statistics published by the Road
Development Authority (RDA) in year 2000, almost 400,000
vehicles entered the city from main entry points in an average
week day (Table 07).
Table 07: Number of vehicles entered the city of Colombo (in
a week day)
Entry Points 1985 1995 2000
Negambo road 36,549 54,833 71,270
Kandy road 35,175 52,762 68,591
Kota road 19,391 29,086 37,812
Avissawella
road
9,258 13,887 18,053
Kolonnawa road 10,811 16,216 21,081
Nawala road 12,949 19,423 25,250
High level road 25,541 36,811 47,854
Dutugemunu
road
11,750 17,625 22,912
Galle road 42,183 63,199 82,159
Total 203,607 303,842 394,982
Source: Road Development Authority, 2003
The number of vehicles that enter the city has increased
almost two times from 1985 to 2000. This two fold increase of
the number of vehicles, is a general trend at all entry points of the
city. However the entry points of from Galle road, Negambo road
and Kandy road show that a significantly high number of
vehicles have entered the city during week days.
In year 2000, approximately 400,000 vehicles entered the
city in a week day. In addition to this it can be assumed that
additional100,000 vehicles are positioned within the city limits.
Therefore it can be estimated that the total vehicle fleet operating
within the city area is almost 500,000 in a week day. This is
approximately 1/6 of the total active vehicle fleet in the country
(In year 2000, total active vehicle fleet in the country is 3
million).
Another estimation describes the number of vehicles
entered to the city as follows.
“Commuting population uses various forms of
transportation to enter the city. According to the estimates,
approximately 27,215 buses, operated both by private and public
sectors, transport 958,000 passengers daily to the city. Another
560,132 use about 243,459 private vehicles. The number of
commuters who use the railway is estimated to be around
165,000. Both the number of vehicles and the commuters
entering the city are increasing year by year. At the same time
the residential population and the ownership of vehicles within
the city limits will also experience an unprecedented growth.
Vehicles that enter the City from 9 entry points on working days
have been estimated to be around 275,000, and this is in addition
to the contribution to the traffic floor by the use of vehicles of the
residents in the city”.
4.3.1.2 Increasing trend of number of vehicles registered in
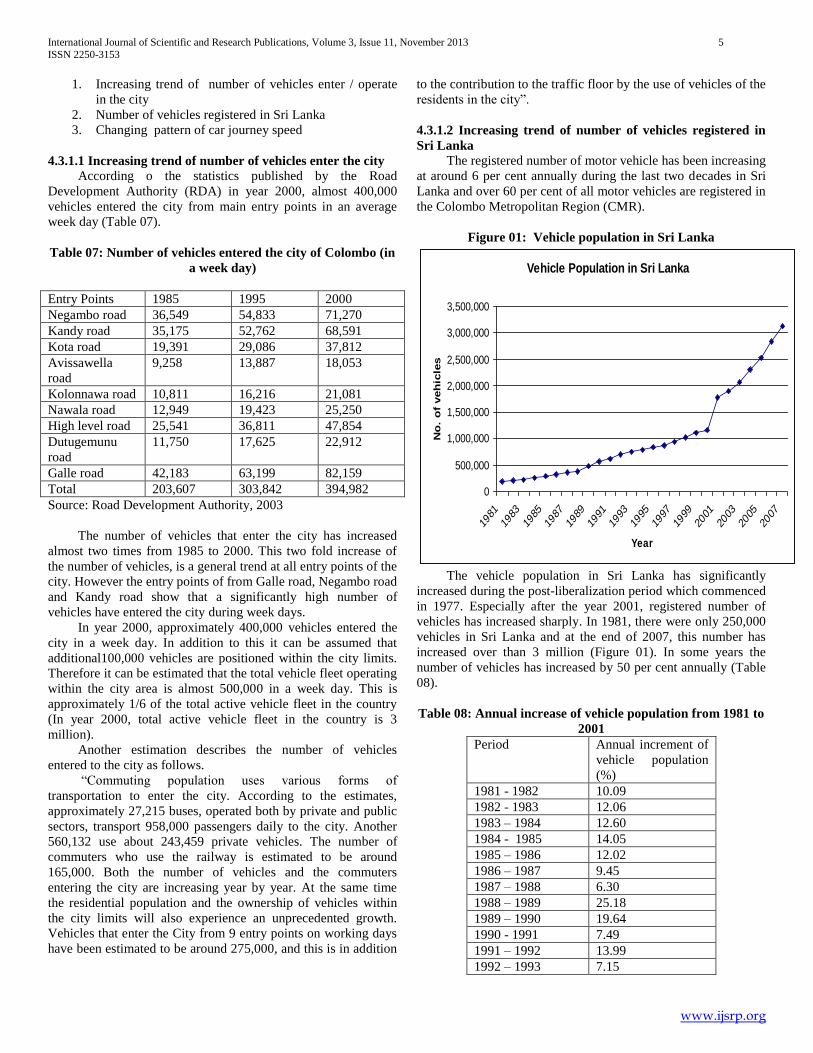
Sri Lanka The registered number of motor vehicle has been increasing
at around 6 per cent annually during the last two decades in Sri
Lanka and over 60 per cent of all motor vehicles are registered in
the Colombo Metropolitan Region (CMR).
Figure 01: Vehicle population in Sri Lanka
Vehicle Population in Sri Lanka
0
500,000
1,000,000
1,500,000
2,000,000
2,500,000
3,000,000
3,500,000
1981
1983
1985
1987
1989
1991
1993
1995
1997
1999
2001
2003
2005
2007
Year
No
. o
f veh
icle
s
The vehicle population in Sri Lanka has significantly
increased during the post-liberalization period which commenced
in 1977. Especially after the year 2001, registered number of
vehicles has increased sharply. In 1981, there were only 250,000
vehicles in Sri Lanka and at the end of 2007, this number has
increased over than 3 million (Figure 01). In some years the
number of vehicles has increased by 50 per cent annually (Table
08).
Table 08: Annual increase of vehicle population from 1981 to
2001
Period Annual increment of
vehicle population
(%)
1981 - 1982 10.09
1982 - 1983 12.06
1983 – 1984 12.60
1984 - 1985 14.05
1985 – 1986 12.02
1986 – 1987 9.45
1987 – 1988 6.30
1988 – 1989 25.18
1989 – 1990 19.64
1990 - 1991 7.49
1991 – 1992 13.99
1992 – 1993 7.15
International Journal of Scientific and Research Publications, Volume 3, Issue 11, November 2013 6
ISSN 2250-3153
www.ijsrp.org
1993 – 1994 5.31
1994 – 1995 5.27
1995 – 1996 4.59
1996 – 1997 7.55
1997 – 1998 8.63
1998 – 1999 9.24
1999 – 2000 4.91
2000 – 2001 52.24
2001 – 2002 6.37
2002 – 2003 9.59
2003 – 2004 10.79
2004 - 2005 10.00
2005 - 2006 11.89
2006 - 2007 10.53
Average 11.82
Source: Prepared by the Author, 2008
Annually vehicle population of the country has increased
by over 10 per cent from 1981 to 2006. However, there are some
extreme cases during 1988 – 1989, 1989 – 1990 and 2000 –
2001. Due to the duty concession given in year 2000, large
number of vehicles entered the local market during 2000-2001.
Furthermore, this increasing trend of vehicle fleet in Sri Lanka
describes by Jayaweera (2000) as follows:
“In 2000, the total active vehicle fleet in Sri Lanka was
estimated to be 1.165 million, almost twice its size in 1991. In
2004, this further increased to 1.5 million. It is estimated that
60% of this fleet operate in the Colombo Metropolitan Region
(Jayaweera, 2000).
In addition to the number, the average age of the vehicle
fleet in Sri Lanka is another important factor pertaining to the air
quality of the country. Average age of the active vehicle fleet is
6.2 years, which is relatively higher compared to international
standards (Jayaweera, 2000).
4.3.1 3 Changing pattern of car journey speed
The changing pattern of car journey speed is a good
indicator of the traffic congestion of any area. Car speed has been
reduced drastically in the city of Colombo. The survey carried
out by the Transport Studies Planning Center, Ministry of
Transport in 2001 shows the decreasing trend of car journey
speed of the 7 entry points of the city (Table 09). Galle road and
High-level road indicate the highest decreasing trend of car
journey speed. In 1997, car journey speed in the Galle road was
28 km per hour and in 2001 it has been reduced up to 8km per
hour by 4 times. The situation in the high-level road is worse
than the Galle road. In 1997 car journey speed in the high-level
road was 32 km per hour and in 2001 it has been reduced up to 6
km per hour.
Table 09: Car journey time survey results (as average speeds, km/hour) Inward direction, morning peak
Road and junction 1997 1999 2001
Colombo-Galle (MalibanJunction to Dickman Road) 28 18 8
Colombo – Ratnapura (Maharagama to Kirulap) 32 16 6
Colombo - Kandy (Kadawatha to Orugodawatte) 23 22 11
Colombo - Puttalam (Mahabage to Kelani Bridge) 18 16 7
Jayawardanapura-Kollupitiya Battaramulla to Senanayake Junction 23 17 9
Colombo-Horana (Papiliyana to Vilasitha Nivasa Junc) 27 17 8
Wellampitiya - Kaduwela (Abatale to Wellampitiya) 28 18 9
Source: Transport Studies Planning Centre, Ministry of Transport, 2001
The reduction of car journey speed caused to burn fuel
unnecessarily. For an instance, distance from Moratuwa to
Colombo is 16 km. Assuming a car needs one liter of fuel to
travel to Colombo in 1997, at present 4 liters of fuel are required
to travel the same distance from Moratuwa to Colombo with low
car journey speed. It appears 3 liters of extra fuel burn by each
car approximately running from Moratuwa to Colombo. This
simple arithmetic helps to estimate the total wastage of fuel due
to the traffic congestion of the city of Colombo.
4.3.2 Composition of vehicle population
In the view of air pollution, the composition of vehicle fleet
of the country can be examined in different angles.
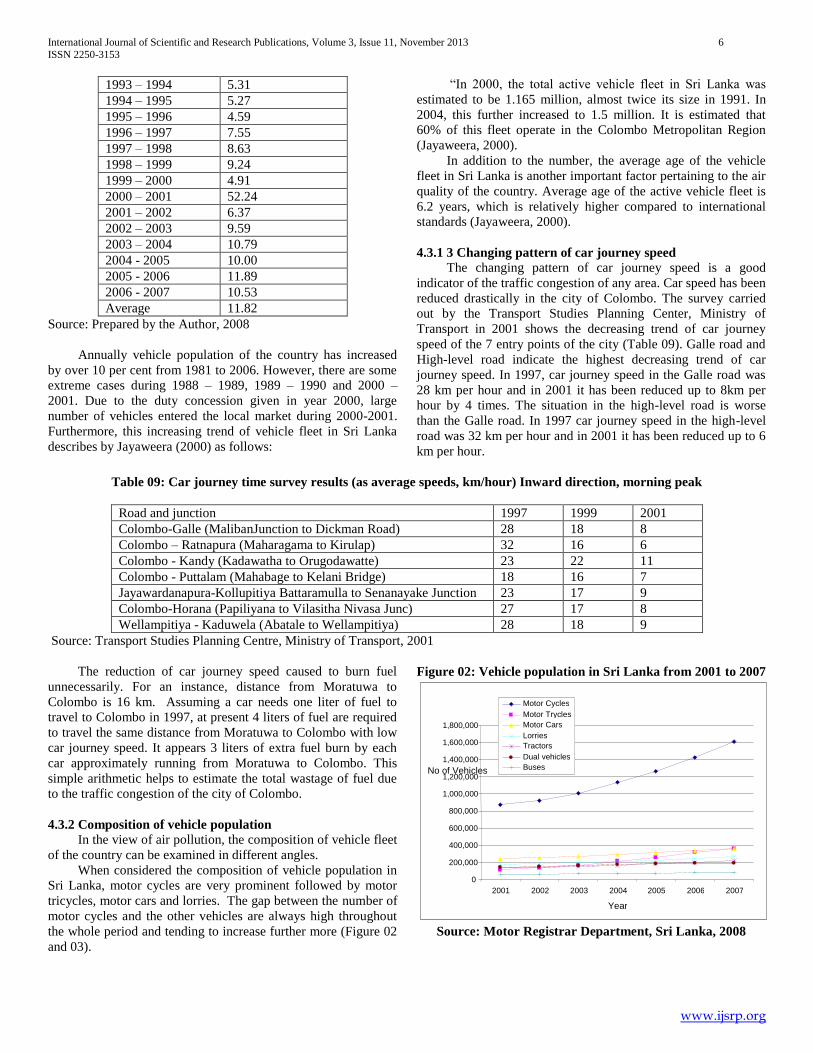
When considered the composition of vehicle population in
Sri Lanka, motor cycles are very prominent followed by motor
tricycles, motor cars and lorries. The gap between the number of
motor cycles and the other vehicles are always high throughout
the whole period and tending to increase further more (Figure 02
and 03).
Figure 02: Vehicle population in Sri Lanka from 2001 to 2007
Source: Motor Registrar Department, Sri Lanka, 2008
0 200,000 400,000 600,000 800,000
1,000,000 1,200,000 1,400,000 1,600,000 1,800,000
2001 2002 2003 2004 2005 2006 2007 Year
No of Vehicles
Motor Cycles Motor Trycles Motor Cars Lorries Tractors Dual vehicles Buses
International Journal of Scientific and Research Publications, Volume 3, Issue 11, November 2013 7
ISSN 2250-3153
www.ijsrp.org
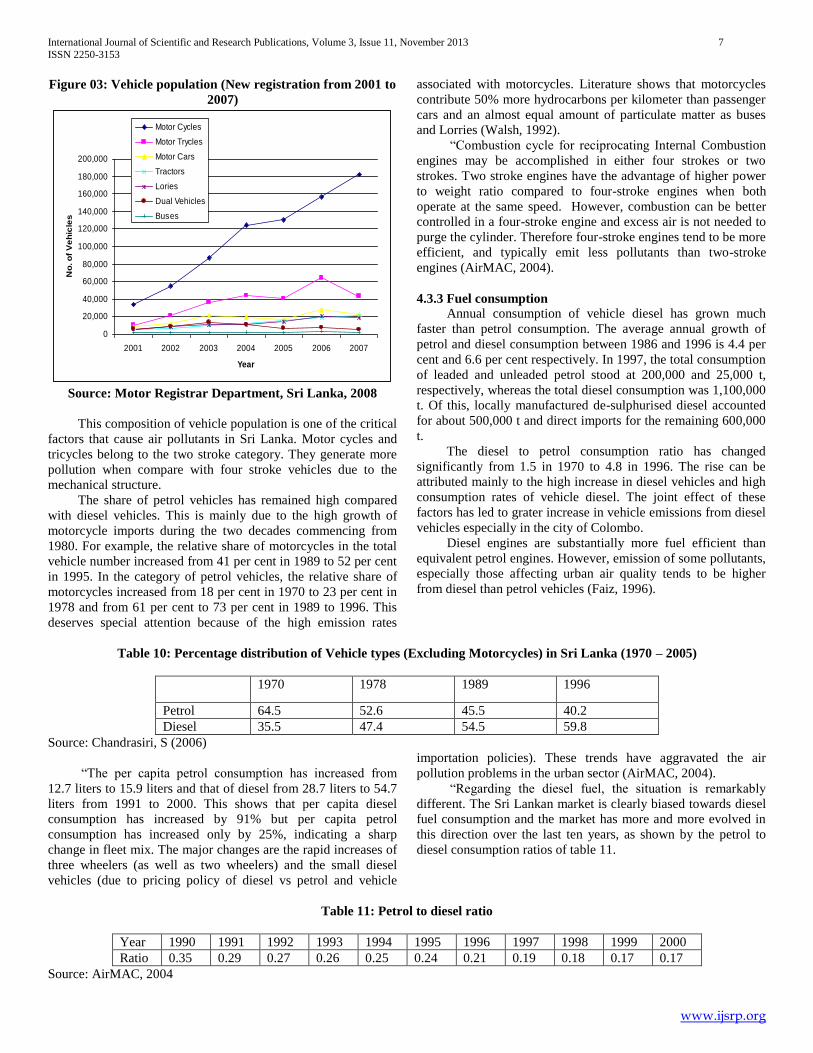
Figure 03: Vehicle population (New registration from 2001 to
2007)
0
20,000
40,000
60,000
80,000
100,000
120,000
140,000
160,000
180,000
200,000
2001 2002 2003 2004 2005 2006 2007
Year
No
. o
f V
eh
icle
s
Motor Cycles
Motor Trycles
Motor Cars
Tractors
Lories
Dual Vehicles
Buses
Source: Motor Registrar Department, Sri Lanka, 2008
This composition of vehicle population is one of the critical
factors that cause air pollutants in Sri Lanka. Motor cycles and
tricycles belong to the two stroke category. They generate more
pollution when compare with four stroke vehicles due to the
mechanical structure.
The share of petrol vehicles has remained high compared
with diesel vehicles. This is mainly due to the high growth of
motorcycle imports during the two decades commencing from
1980. For example, the relative share of motorcycles in the total
vehicle number increased from 41 per cent in 1989 to 52 per cent
in 1995. In the category of petrol vehicles, the relative share of
motorcycles increased from 18 per cent in 1970 to 23 per cent in
1978 and from 61 per cent to 73 per cent in 1989 to 1996. This
deserves special attention because of the high emission rates
associated with motorcycles. Literature shows that motorcycles
contribute 50% more hydrocarbons per kilometer than passenger
cars and an almost equal amount of particulate matter as buses
and Lorries (Walsh, 1992).
“Combustion cycle for reciprocating Internal Combustion
engines may be accomplished in either four strokes or two
strokes. Two stroke engines have the advantage of higher power
to weight ratio compared to four-stroke engines when both
operate at the same speed. However, combustion can be better
controlled in a four-stroke engine and excess air is not needed to
purge the cylinder. Therefore four-stroke engines tend to be more
efficient, and typically emit less pollutants than two-stroke
engines (AirMAC, 2004).
4.3.3 Fuel consumption
Annual consumption of vehicle diesel has grown much
faster than petrol consumption. The average annual growth of
petrol and diesel consumption between 1986 and 1996 is 4.4 per
cent and 6.6 per cent respectively. In 1997, the total consumption
of leaded and unleaded petrol stood at 200,000 and 25,000 t,
respectively, whereas the total diesel consumption was 1,100,000
t. Of this, locally manufactured de-sulphurised diesel accounted
for about 500,000 t and direct imports for the remaining 600,000
t.
The diesel to petrol consumption ratio has changed
significantly from 1.5 in 1970 to 4.8 in 1996. The rise can be
attributed mainly to the high increase in diesel vehicles and high
consumption rates of vehicle diesel. The joint effect of these
factors has led to grater increase in vehicle emissions from diesel
vehicles especially in the city of Colombo.
Diesel engines are substantially more fuel efficient than
equivalent petrol engines. However, emission of some pollutants,
especially those affecting urban air quality tends to be higher
from diesel than petrol vehicles (Faiz, 1996).
Table 10: Percentage distribution of Vehicle types (Excluding Motorcycles) in Sri Lanka (1970 – 2005)
1970 1978 1989 1996
Petrol 64.5 52.6 45.5 40.2
Diesel 35.5 47.4 54.5 59.8
Source: Chandrasiri, S (2006)
“The per capita petrol consumption has increased from
12.7 liters to 15.9 liters and that of diesel from 28.7 liters to 54.7
liters from 1991 to 2000. This shows that per capita diesel
consumption has increased by 91% but per capita petrol
consumption has increased only by 25%, indicating a sharp
change in fleet mix. The major changes are the rapid increases of
three wheelers (as well as two wheelers) and the small diesel
vehicles (due to pricing policy of diesel vs petrol and vehicle
importation policies). These trends have aggravated the air
pollution problems in the urban sector (AirMAC, 2004).
“Regarding the diesel fuel, the situation is remarkably
different. The Sri Lankan market is clearly biased towards diesel
fuel consumption and the market has more and more evolved in
this direction over the last ten years, as shown by the petrol to
diesel consumption ratios of table 11.
Table 11: Petrol to diesel ratio
Year 1990 1991 1992 1993 1994 1995 1996 1997 1998 1999 2000
Ratio 0.35 0.29 0.27 0.26 0.25 0.24 0.21 0.19 0.18 0.17 0.17
Source: AirMAC, 2004
International Journal of Scientific and Research Publications, Volume 3, Issue 11, November 2013 8
ISSN 2250-3153
www.ijsrp.org
4.3.4 Fuel quality of the country
Fuel quality is one of the most important factors affecting
vehicles emission in Colombo. The Ceylon Petroleum
Corporation (CPC), the sole supplier of vehicle fuel in Sri Lanka,
imports 65 per cent of super diesel and 100 per cent of unleaded
petrol. In addition, 35 per cent of normal diesel and 100 per cent
of leaded petrol sold in the market are produced by CPC using
import crude oil. However, the Sulphur content of the fuel
available in Sri Lanka is relatively high when compared with
countries in the region (Table 12). The Sulphur contain in the
fuel in Sri Lanka is more than twice in the other countries in the
region.
Table 12: Sulfur content in Diesel fuel (Percentages by
weight)
Country 1998 1999 2000 2001 Future
Plans
Brunei 0.25 0.25 0.25 0.25
Cambodia
Indonesia 0.5 0.5 0.5
Laos
Malaysia 0.5 0.5 0.3
Myanmar 0.5 0.5 0.5
Philippines 0.5 0.5 0.5 0.2
Singapore 0.3 0.05 0.05 0.05
Thailand 0.25 0.05 0.05 0.07
Vietnam 0.5 0.5 0.5
India
Bangladesh
China 0.2 –
1.0
0.2
(2002)
Pakistan 1.0 0.5
(2002)
Sri Lanka 1.1 1.1 1.1 1.1 0.5
(2002)
Source: Male Declaration
The import of diesel fuel increased by about 25 per cent
over the period 1991-1995 while from 1995 to 1996 the increase
has been a phenomenal 60 per cent. This is particularly due to the
operation of new diesel power plants. Sri Lankan produced diesel
has a higher concentration of Sulphur compared to other
countries in the region. Nearly 99 per cent of vehicles use leaded
gasoline which has the potential of causing health problems in
the city (Male declaration).
4.3 5 Government Policies
The government policies which are favorable to increase
the contamination of air pollutants in the city of Colombo can be
classified into two main sections namely; Pricing policies and
other government policies.
The high growth of diesel-powered vehicles and the high
rate of auto-diesel consumption were clearly noticeable
throughout the 1990s. This was attributed to the auto-fuel pricing
policy (on petrol and diesel) and fiscal policy on vehicle imports.
A distinctive feature of auto-fuel (petrol and diesel) pricing in Sri
Lanka is the significant price differential between petrol and
diesel. In fact, in the 1990s, Sri Lanka was the only country
which maintained the highest disparity between petrol and diesel
prices. The discriminatory pricing policies adopted by successive
governments over the past four decades have been highly
favorable towards diesel users. Similarly, the fiscal policy on
vehicle imports has also been discriminatory against certain
categories of vehicles. Furthermore, the road user charge
applicable to different categories of vehicles do not fully capture
environment damage cost. These distortions have led to high
growth of diesel-powered vehicles which use low quality diesel
(i.e., 0.8 per cent of Sulphur). One of the major environmental
problems associated with this development is the deterioration of
ambient air quality.
Table 13: Retail selling prices in Petroleum products (Price
in Rupees per liter)
1998 1999 2000 2001 2002 2003 2004 2005
Super
Petrol
50.00 50.00 50.00 50.00 49.00 53.00 70.00 80.00
Auto
Diesel
13.20 13.20 24.50 26.50 30.00 32.00 44.00 50.00
Super
Diesel
18.50 18.50 29.80 31.80 35.30 37.30 49.30 55.30
Ratio 3.79 3.70 2.04 1.89 1.63 1.66 1.59 1.60
Source: Annual Report, Ceylon Petroleum Corporation, 2005
Always there is a very high disparity in prices of the main
fuel types in Sri Lanka. However there is a positive trend in
decreasing the price gap between petrol and diesel which is
positively contributed to reduce the air pollution in the country.
Table 14 : Sulfure Emissions kt/y
Year Diesel Engines
Emissions
1990 23.1
1995 31.4
2000 40.6
2005 52.0
2010 63.6
2015 79.3
Source: AirMac, 2004
The emissions of Sulphates are growing proportionately to
the growth of the diesel vehicles fleet (AirMac, 2004).
4.3.6. Vehicle inspection system
The National Environmental Act (NEA) of 1980 as
amended in 1988 prohibits any discharge of pollutants into the
environment. Sections 23J and K prohibit emission of pollutants
into the atmosphere. The National Environmental (Protection and
quality) Regulations of 1990 prohibits the discharge of wastes
into the environment. Discharge standards have been prescribed
by the CEA for liquid wastes and the Sri Lanka Standards
Institution (SLSI) has prescribed emission standards for
Sulphuric acid plants. The CEA in December 1994 gazetted
national ambient air quality standards for Sri Lanka. These
International Journal of Scientific and Research Publications, Volume 3, Issue 11, November 2013 9
ISSN 2250-3153
www.ijsrp.org
regulations do not however address vehicular air pollution (Male
declaration).
Though the NEA gives the CEA the mandate to regulate
and control air pollution, enforcement has been rather slow due
to the lack of specific mission standards and reliable data. While
the Motor Traffic Act considered visible emission an offence, it
is not rigorously enforced (Male declaration).
Diesel consumption has substantially increased in both in
absolute and relative terms in the last decade. There are sound
technical reasons that justify diesel-powered lorries and buses.
The share of diesel cars with respect to the total number of cars
has remained constant at roughly 10%. Temporary increases
seem to be mainly due to concessionary import licenses. The
main source of increase in diesel consumption has been the
increases in both the share and the vehicle kilometers traveled
(KVT) of vans, pickups and dual-purpose vehicles. The reasons
behind this trend seem to be the following:
1. The final price of diesel has never been much more than
half the final price of petrel until 2004.
2. A dual-purpose vehicle is a moderately close substitute
for a car, depending on the price difference. The price of
a diesel dual-purpose vehicle can be lower than the
price of a car. The reason for this price difference is
threefold;
I. Imported cars cannot be older than three years, whereas
imported vans cannot be older than five years. The import
price net of taxes is therefore lower for vans, if anything,
because they are older. The national base to compute
import and excise duties is therefore lower.
II. The excise duty rate is approximately 111% of the import
price for diesel cars and 57% for diesel dual-purpose
vehicles.
III. The custom duty and the surcharge as percentage of
customs duty rates are the same for both vehicle types.
The cumulative effort of (II) and (III) results in that the
average fuel tax paid on imported diesel cars is 146% of
the import price net of taxes whereas the average fuel tax
paid on imported diesel dual-purpose vehicles is 92% of
the import price net of taxes.
3. The annual license fee is the same for both diesel cars
and dual-purpose vehicles.
4. The registration charges are higher for diesel cars than
for dual-purpose vehicles.
(AirMac, 2004)
…..and the import regime then favors diesel vans over
petrol cars. The problem of pollution is therefore one of vehicle
maintenance, possibly of fuel quality and the encouragement
offered by the import regime towards older and more polluting
vehicles AirMAC, 2004.
4.3.7 Traffic congestion
Traffic congestion is one of the prominent factors which
attributed to aggravate the contamination of pollutants in the
urban areas. The main reason for heavy traffic congestion of the
city of Colombo is, although the traffic on the roads has
increased a very high speed, the automobile and railway network
dating back to the colonial days has remained almost unchanged
except for marginal improvements.
The present transport crisis / impasse / breakdown in the
Greater Colombo Area could be quite clearly seen in the traffic
congestion along almost of all the major trunk roads leading to
Colombo; Galle road congestion starts from Kalutara-Panadura,
is intensified after Rathmalana, and leads to vehicles inching
their way after Dehiwala. High level road congestion starts from
Homagama-Kottawa area, is intensified after Maharagama and
leads to vehicles inching their way after Nugegoda. Negombo-
Katunayake road congestion starts from Ja-Ela- Kandana area
and leads to vehicles inching their way their way after Wattala.
Kandy-Colombo road congestion starts from Yakkalamulla –
Kadawatha area makes another procession towards Colombo
from Kiribathgoda. Hanwella low lying road congestion starts
from Habarakada-Athurugiriya area and leads to vehicles inching
their way after Malabe-Koswatta.
This traffic congestion starts from 6 a.m. almost on all the
roads with fleets of school vehicles and continues until about 10
p.m. with returning evening workers with intermittent brief
respites. In a congested hour it takes nearly two hours to reach
Colombo from Panadura whereas train takes only 45 minutes.
The current traffic problem in the Colombo Metropolitan
Region (CMR) emerged wasting thousands of productive man-
hours on roads as well as generating more and more pollutants
and burning thousands of barrels of fuel unnecessarily.
This high traffic congestion and generating of high
pollutants clearly described the order given by the Supreme
Court of Sri Lanka. The attorney General was instructed to
prepare a new action plan in consultation with several
government organizations to reduce air pollution and traffic
congestion from 2010.
4.3.8 Road Development pattern of the city
The city of Colombo attracts about 1.5 Million floating
population on any working day and with the addition of the
resident population in the city, the total population in the city
increases to more than 2 Million during the daytime. It is
estimated that about 50% of the commuting population arrives in
the city for employment or to engage in commercial activities
and or to attend educational institutions. The rest comes to the
city for various other purposes.
Traffic problem has been aggravated by the concentration
of all forms of economic, commercial and administrative
functions in the city. Furthermore, Colombo is the largest city in
the country and, therefore, it attracts people because of its
commercial and political significance and it offers better
facilities in health, education, etc. than any other city in the
country. The combination of all these aspects results in a greater
attraction of the city for people from the rest of the country thus
aggravating the transport problem in the city of Colombo.
Transport problem that currently experienced by the city of
Colombo is reflected in the increasing traffic congestion. A few
years ago, the traffic congestion was largely limited to the CBD,
but now it has spread to the entire core area lasting sometimes
most of the peak period. The number of vehicles in the city is not
the only factor that contributes to congestion. Shortage of
parking areas, inadequate facilities for pedestrians, parking of
heavy vehicles on busy highways during normal working hours
and poor public transport facilities are also equally significant
contributors to the congestion problem. As a consequence the
International Journal of Scientific and Research Publications, Volume 3, Issue 11, November 2013 10
ISSN 2250-3153
www.ijsrp.org
average vehicle speed has reduced to around 10 kilometres per
hour within most parts of the city during the day.
The main implication of traffic congestion is that it causes
higher running costs to the owners of vehicles and results in a
considerable loss to the national economy. This problem is likely
to exacerbate in the immediate future since the road networks are
severely inadequate to meet even the current demand given the
projected growth in the demand for transport facilities in the
coming decade, upgrading, modernizing and expanding the
transport sector must receive urgent priority.
V. CONCLUSIONS
Different factors have contributed for the quality of air in
the city of Colombo in different ways and in different magnitude.
Some of them are physical factors and some of them are man-
made factors. Except rainfall other physical factors are not very
significant. The contamination of pollutants is not very high
within the Southwest Monsoon period and the contamination of
pollutants increased drastically in the Municipal area within the
Northeast Monsoon period due to different climatic scenarios in
different Monsoon periods.
Among the socio-economic factors, traffic density is the
most contributing factor for degrading the quality of air in the
city of Colombo. Some characteristics related to the vehicle fleet
such as, Number of vehicles, Composition of the vehicle fleet
and some government policies such as fuel quality of the
country, pricing policy and vehicle inspection systems are
directly contributed to degrade the quality of air in the city of
Colombo.
The decision makers and the policy makers of the country
should pay necessary attention to this matter and review the
existing government policies related to the air quality and air
quality monitoring system and make necessary arrangements to
introduce viable government policies which can prevent the air
quality of the city.
REFERENCES
[1] AirMAC, Urban Air Quality Management in Sri Lanka, Ministry of Environment and Natural Resources , Sri Lank, 2004.
[2] Attalage, R.A., Perera, K.K.C.K., Sugathapala, A.G.T., Analyse and forecast of future vehicle fleet, Department of Mechanical Engineering, University of Moratuwa, 2002.
[3] Chandrasiri, S., Health Impact of Diesel vehicle Emissions: The case study of Colombo city, Research Report, Economic and Environment Programme for South East Asia, 2006.
[4] Jayaweera, D.S., Vehicle inspection and Maintenance Policies and Programmes – Sri Lanka, Ministry of Transport, Sri Lanka, 2003.
[5] Weaver, C.S, Chan, L.M, Sri Lanka Vehicle Emissions Control Project: Interim Report, Submitted to the Air Resource Management Center, Ministry of Environment and Natural Resources of Sri Lanka. Engine, Fuel, and Emissions Engineering, 2003.
[6] Male Declaration, Baseline Information and Action Plan. United Nations Environment Programme Regional Resource Center for Asia Pacific, 2000.
[7] Ministry of Health, Annual Health Bulleting, 2000.
[8] UNDP and World Bank (ESMAP), Sustainable Transport Options for Sri Lanka, Joint Energy sector Management Assistance Progamme, Munasinghe Institute for Development, 2003.
AUTHORS
First Author – Prof. L.Manawadu, Ph.D,, Department of
Geography, University of Colombo,Colombo, Sri Lanka
SecondAuthor –Manjula Ranagalage, Lecturer, MSc in
Geoinformatics, Department of Social Sciences, Rajarata
University of Sri Lanka, Mihintale, Sri Lanka,
Correspondence Author – Manjula Ranagalage,
[email protected], +94717953995
Related Documents