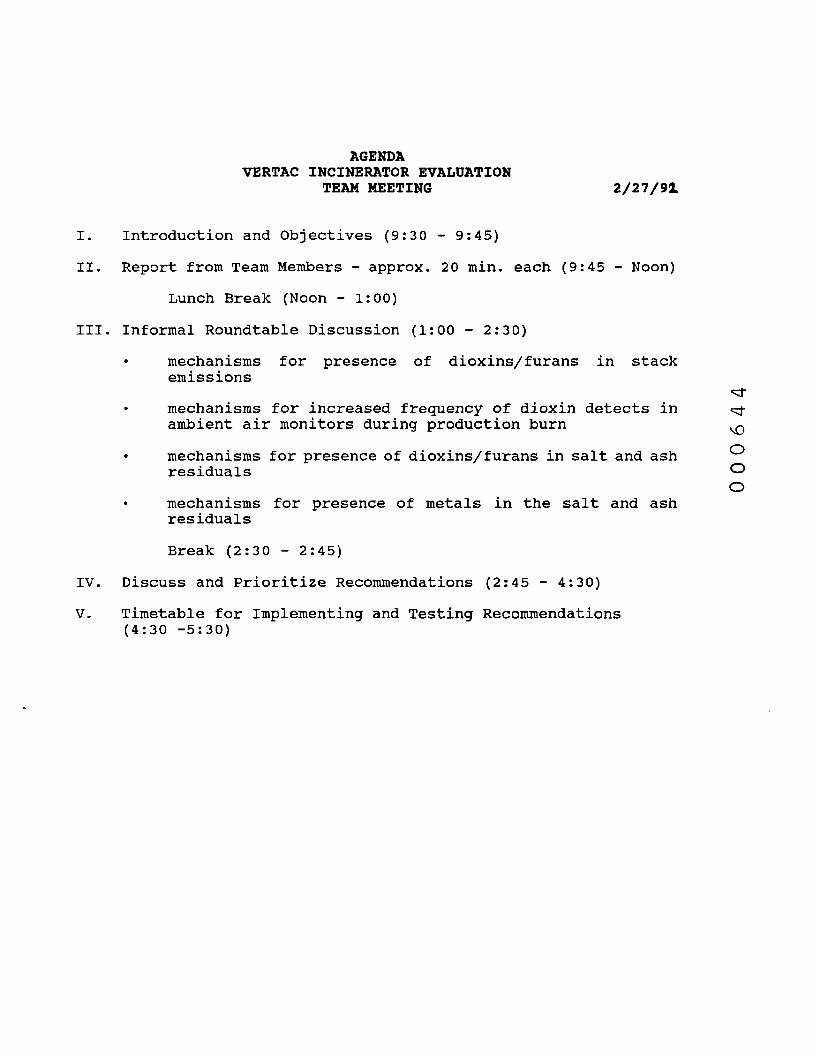
AGENDA VERTAC INCINERATOR EVALUATION TEAM MEETING 2/27/91 I. Introduction and Objectives (9:30 - 9:45) II. Report from Team Members - approx. 20 min. each (9:45 - Noon) Lunch Break (Noon - 1:00) III. Informal Roundtable Discussion (1:00 - 2:30) mechanisms for presence of dioxins/furans in stack emissions ^ mechanisms for increased frequency of dioxin detects in ^ ambient air monitors during production burn ^0 • mechanisms for presence of dioxins/furans in salt and ash residuals 0 0 mechanisms for presence of metals in the salt and ash residuals Break (2:30 - 2:45) IV. Discuss and Prioritize Recommendations (2:45 - 4:30) V. Timetable for Implementing and Testing Recommendations (4:30 -5:30)

Welcome message from author
This document is posted to help you gain knowledge. Please leave a comment to let me know what you think about it! Share it to your friends and learn new things together.
Transcript
AGENDAVERTAC INCINERATOR EVALUATION
TEAM MEETING 2/27/91
I. Introduction and Objectives ( 9 : 3 0 - 9 : 4 5 )
II. Report from Team Members - approx. 20 min. each ( 9 : 4 5 - Noon)
Lunch Break (Noon - 1:00)
III. Informal Roundtable Discussion (1:00 - 2 : 3 0 )
mechanisms for presence of dioxins/furans in stackemissions
^mechanisms for increased frequency of dioxin detects in ^ambient air monitors during production burn 0̂
• mechanisms for presence of dioxins/furans in salt and ashresiduals 0
0mechanisms for presence of metals in the salt and ashresiduals
Break ( 2 : 3 0 - 2: 4 5 )
IV. Discuss and Prioritize Recommendations ( 2 : 4 5 - 4:30 )
V. Timetable for Implementing and Testing Recommendations( 4 : 3 0 -5:30)
VERTAC TECHNICAL ASSISTANCE TEAM MEETING
EPA REGION VIDALLAS, TEXAS
FOCUS ENVIRONMENTAL, INC.KNOXVILLE, TENNESSEE
PROJECT NO. 029205* •
FEBRUARY 27, 1992
PROJECT ISSUES
PROCESS ISSUES:
. ASH QUALITY (DIOXINS, METALS)
. BAGHOUSE SOLIDS QUALITY (DIOXINS, METALS)
. STACK EMISSIONS (DIOXINS)
. DIOXIN DESTRUCTION AND REMOVAL EFFICIENCY
AMBIENT AIR ISSUES:
. DETECTABLE DIOXIN LEVELS IN OFFSITE MONITORS
SAMPLING AND ANALYSIS ISSUES:
. DATA INTERPRETATION
PROCESS EVALUATION
2
QUALITY OF TREATED SOLIDS
• INCINERATOR ASH
DIOXINS
CADMIUM, CHROMIUM, LEAD (TCLP)
• BAGHOUSE SOLIDS
DIOXINS
CADMIUM, CHROMIUM, LEAD (TCLP)
3
POTENTIAL PROCESS PROBLEMS
FEED SYSTEM:
. NON-UNIFORM LIQUIDS COMPOSITION
. SOLIDS BLENDING: HEAT INPUT CONTROL
• SOLIDS BLENDING: METALS INPUT CONTROL
• SOLIDS FEED RATE CONTROL
COMBUSTION SYSTEM:
. LIQUID WASTE ATOMIZAT10N
• SUB-STOICHIOMETRIC OXYGEN IN KILN
• SLAG RING AT KILN EXIT
AIR POLLUTION CONTROL:
• CHLORINE EQUILIBRIUM CONCENTRATION
. DENOVO DIOXIN SYNTHESIS IN APC SYSTEM
. STACK GAS DOWNWASH
4
POTENTIAL PROCESS IMPROVEMENTS
FEED SYSTEM:
. SEGREGATE AND CAMPAIGN PLASTIC DRUMS
. ORGANIC SOLIDS SEGREGATION AND CATEGORIZATION
. MIX ORGANIC LIQUIDS IN FEED TANKS
. FEED SLUDGES WITH POSITIVE DISPLACEMENT PUMP
oin\oo
USE AIR ATOMIZED ORGANIC FEED NOZZLE ^
FEED AQUEOUS WASTE CONTINUOUSLY
WATER INJECTION INTO KILN
REPROCESS ASH UNDER OXIDIZING CONDITIONS
BURNER AT REAR END OF KILN TO MELT SLAG RING
RE-DESIGN OF SCO (KILN GAS/SCC BURNER GAS MIXING)
COMBUSTION SYSTEM:
AIR POLLUTION CONTROL:
. LOWER BAGHOUSE INLET TEMPERATURE
. MINIMIZE AIR LEAKAGE
. ACTIVATED CARBON ADDITION TO BAGHOUSE
. VENT SOLIDS TRANSFER FROM BAGHOUSE
. INCREASE STACK HEIGHT
5
PROCESS ANALYSIS APPROACH
WASTE COMPOSITION ESTIMATION
Cl DATA
HEAT OF COMBUSTION DATA
2,4-D ULTIMATE ANALYSIS
. PROCESS MASS AND ENERGY BALANCE
COMBUSTION SYSTEM
- AIR POLLUTION CONTROL SYSTEM
. HALOGEN HALIDE EQUILIBRIUM CALCULATIONS
6
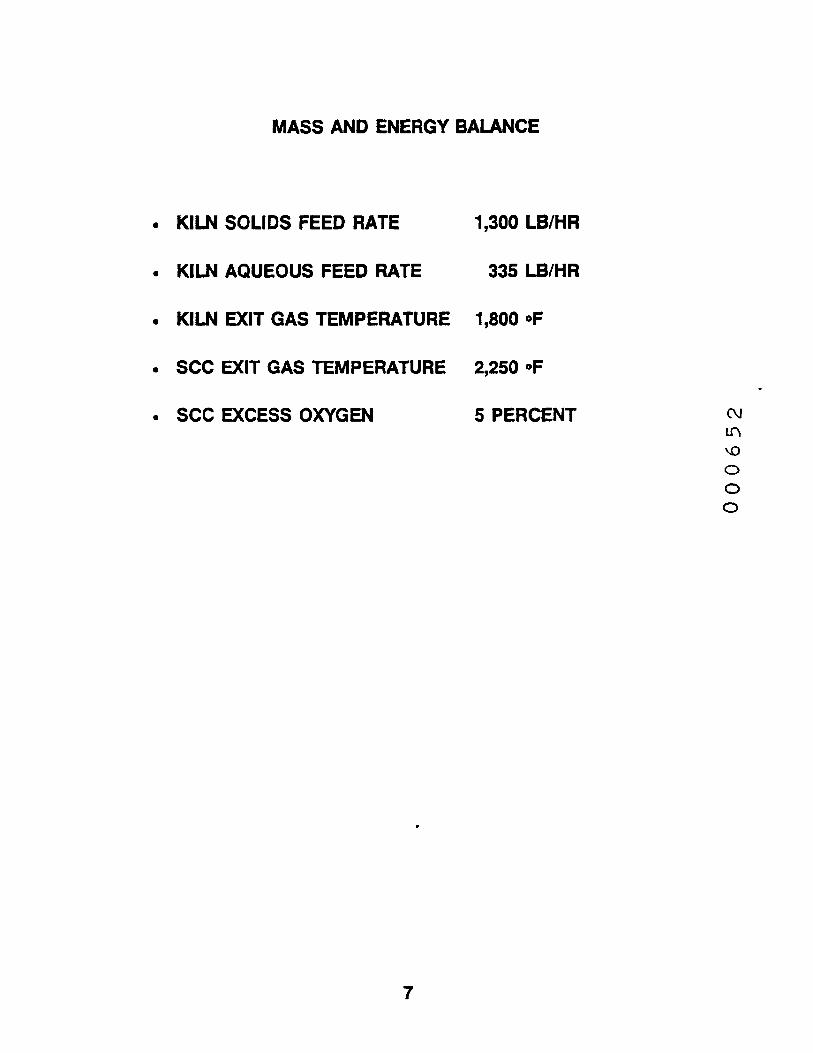
MASS AND ENERGY BALANCE
. KILN SOLIDS FEED RATE 1,300 LB/HR
• KILN AQUEOUS FEED RATE 335 LB/HR
. KILN EXIT GAS TEMPERATURE 1,800 »F
. SCC EXIT GAS TEMPERATURE 2,250 •»F
. SCC EXCESS OXYGEN 5 PERCENT
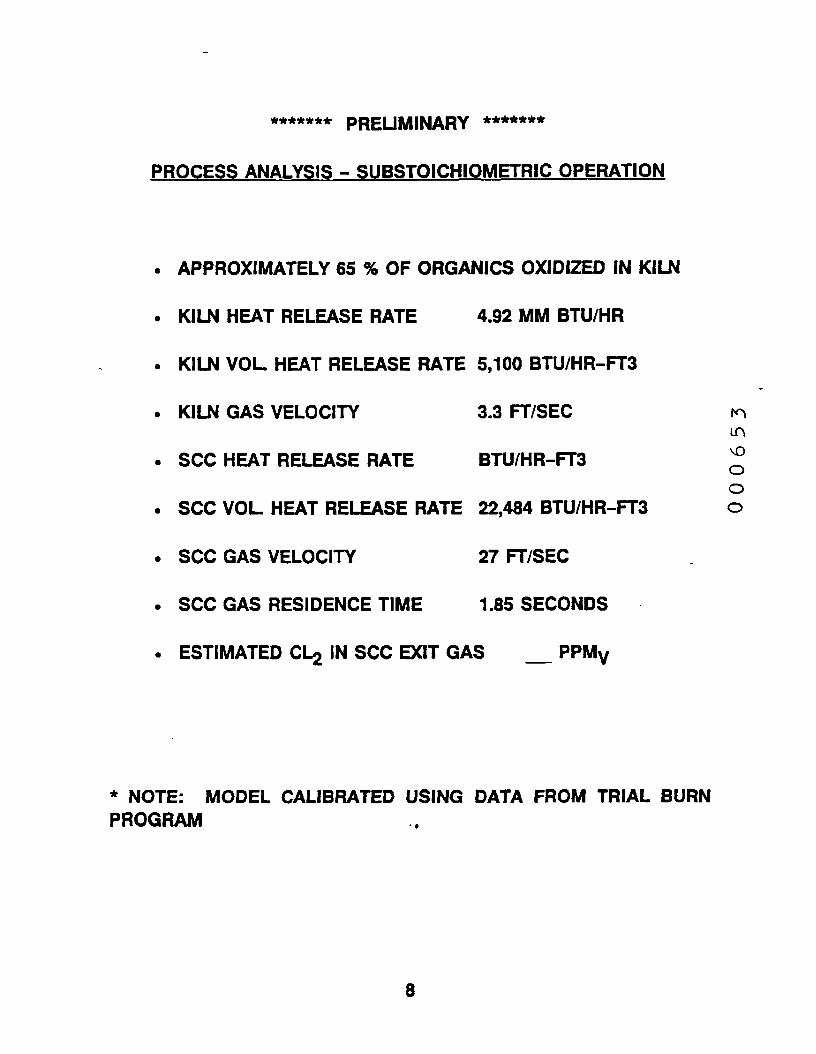
******* PRELIMINARY *******
PROCESS ANALYSIS - SUBSTOICHIOMETRIC OPERATION
. APPROXIMATELY 65 % OF ORGANICS OXIDIZED IN KILN
• KILN HEAT RELEASE RATE 4.92 MM BTU/HR
. KILN VOL. HEAT RELEASE RATE 5.100 BTU/HR-FT3
. KILN GAS VELOCITY 3.3 FT/SEC
. SCC HEAT RELEASE RATE BTU/HR-FT3
. SCC VOL. HEAT RELEASE RATE 22.484 BTU/HR-FT3
. SCC GAS VELOCITY 27 FT/SEC
SCC GAS RESIDENCE TIME 1.85 SECONDS
. ESTIMATED Cl-2 IN SCC EXIT GAS _ PPMy
* NOTE: MODEL CALIBRATED USING DATA FROM TRIAL BURNPROGRAM
8
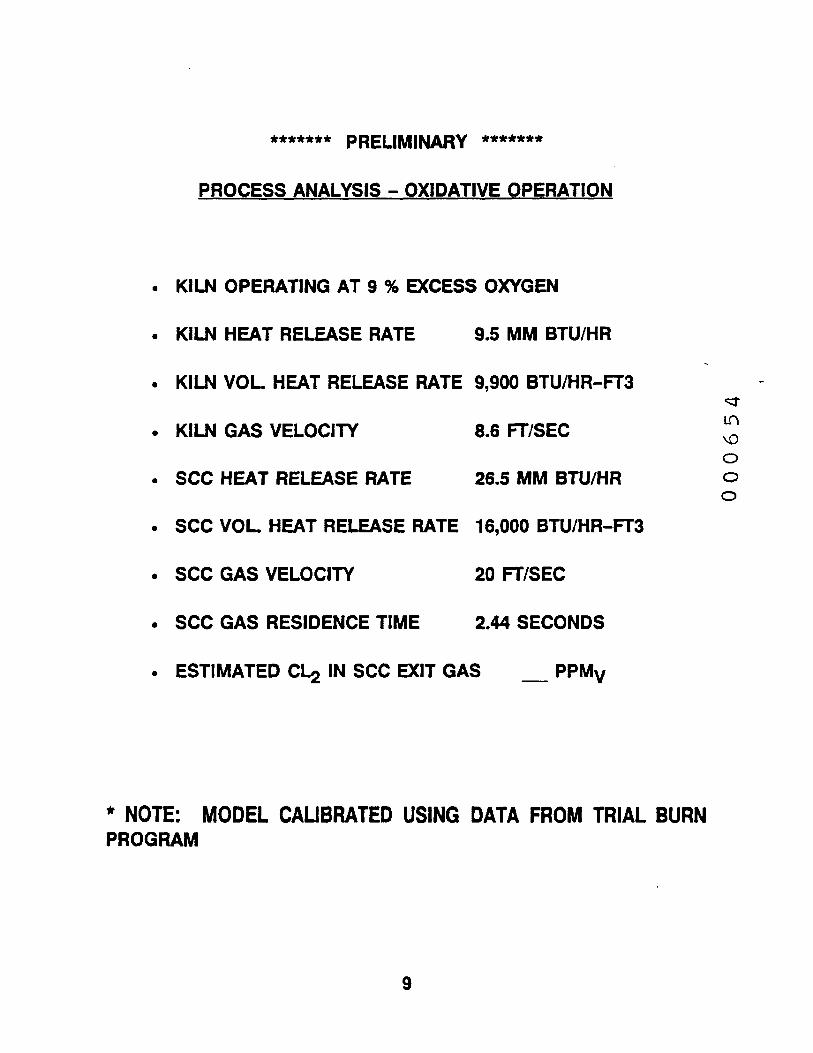
******* PRELIMINARY *******
PROCESS ANALYSIS - OXIDATIVE OPERATION
. KILN OPERATING AT 9 % EXCESS OXYGEN
• KILN HEAT RELEASE RATE 9.5 MM BTU/HR
. KILN VOL. HEAT RELEASE RATE 9,900 BTU/HR-FT3
. KILN GAS VELOCITY 8.6 FT/SEC
. SCC HEAT RELEASE RATE 26.5 MM BTU/HR
. SCC VOL. HEAT RELEASE RATE 16,000 BTU/HR-FT3
. SCC GAS VELOCITY 20 FT/SEC
. SCC GAS RESIDENCE TIME 2.44 SECONDS
. ESTIMATED CL^ IN SCC EXIT GAS _ PPMy
* NOTE: MODEL CALIBRATED USING DATA FROM TRIAL BURNPROGRAM
9
AMBIENT MONITORING
10
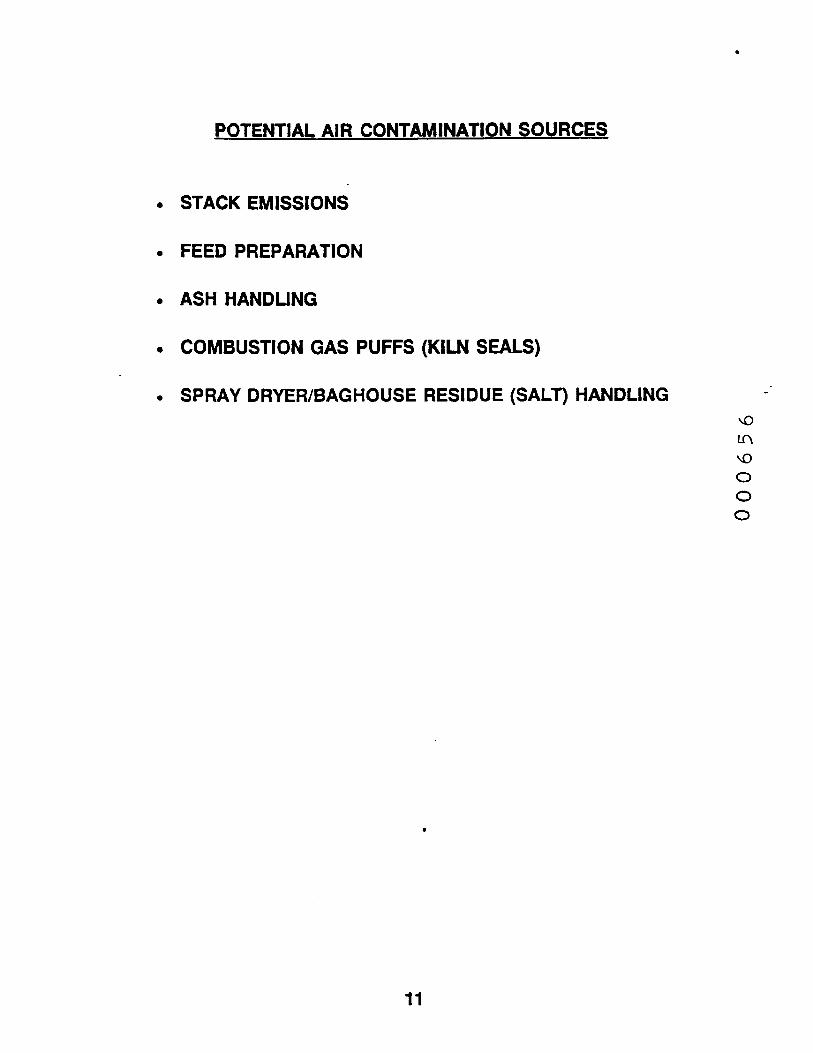
POTENTIAL AIR CONTAMINATION SOURCES
• STACK EMISSIONS
. FEED PREPARATION
ASH HANDLING
COMBUSTION GAS PUFFS (KILN SEALS)
SPRAY DRYER/BAGHOUSE RESIDUE (SALT) HANDLING
11
AMBIENT AIR MONITORING ANALYSIS - STACK EMISSIONS
U.S. EPA SCREEN DISPERSION MODEL
EMISSIONS TO REACH DETECTION LEVEL - 2,000 pg/m3
EMISSIONS TO REACH ACTION LEVEL - 12,000 pg/m3
MEASURED EMISSIONS TOTAL TCDDs - 1,869 pg/m3 (MAX)(10/11/91)
* NOTE: RESULTS BASED ON RECEPTOR 1,000 METERSDOWNWIND
12
AMBIENT AIR MONITORING ANALYSIS - FUGITIVE EMISSIONS
. TO BE COMPLETED
13
AMBIENT EMISSIONS ASSESSMENT RECOMMENDATIONS
. ANALYZE SOLIDS ON HITS FILTERS FOR SODIUM
. ANALYZE RATIOS OF OTHER ORGAN1CS/DIOX1NS DURINGHITS AND NORMAL OPERATION
. CHECK WIND SPEED AND DIRECTION DURING HITSEVENTS
. CHECK KILN PRESSURE RECORDS DURING HITS EVENTS ^in
. VENT SOLIDS TRANSFER FROM BAGHOUSE \0
oo
14
SAMPLING AND ANALYSIS
15
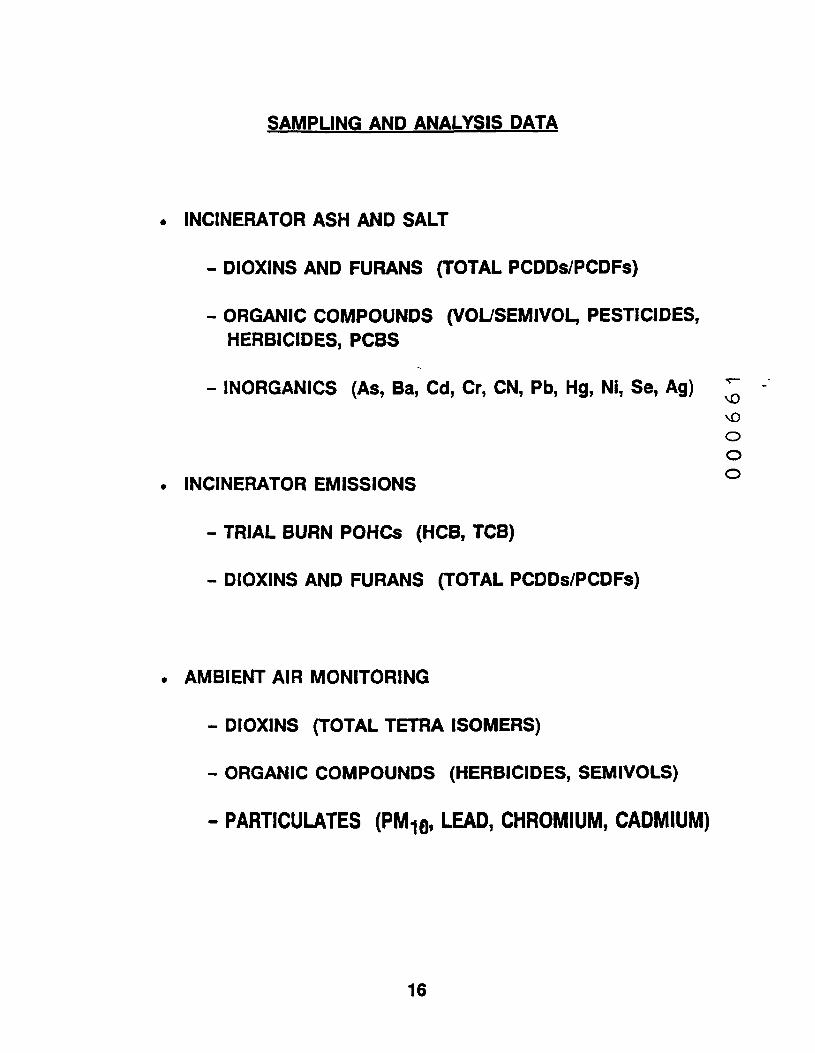
SAMPLING AND ANALYSIS DATA
• INCINERATOR ASH AND SALT
- DIOXINS AND FURANS (TOTAL PCDDs/PCDFs)
- ORGANIC COMPOUNDS (VOUSEMIVOL, PESTICIDES,
HERBICIDES, PCBS
- INORGANICS (As, Ba, Cd, Cr, CN, Pb, Hg, Ni, Se, Ag) ^
\oo0
. INCINERATOR EMISSIONS °
- TRIAL BURN POHCs (HCB. TCB)
- DIOXINS AND FURANS (TOTAL PCDDs/PCDFs)
. AMBIENT AIR MONITORING
DIOXINS (TOTAL TETRA ISOMERS)
ORGANIC COMPOUNDS (HERBICIDES, SEMIVOLS)
PART1CULATES (PM^Q, LEAD, CHROMIUM, CADMIUM)
16
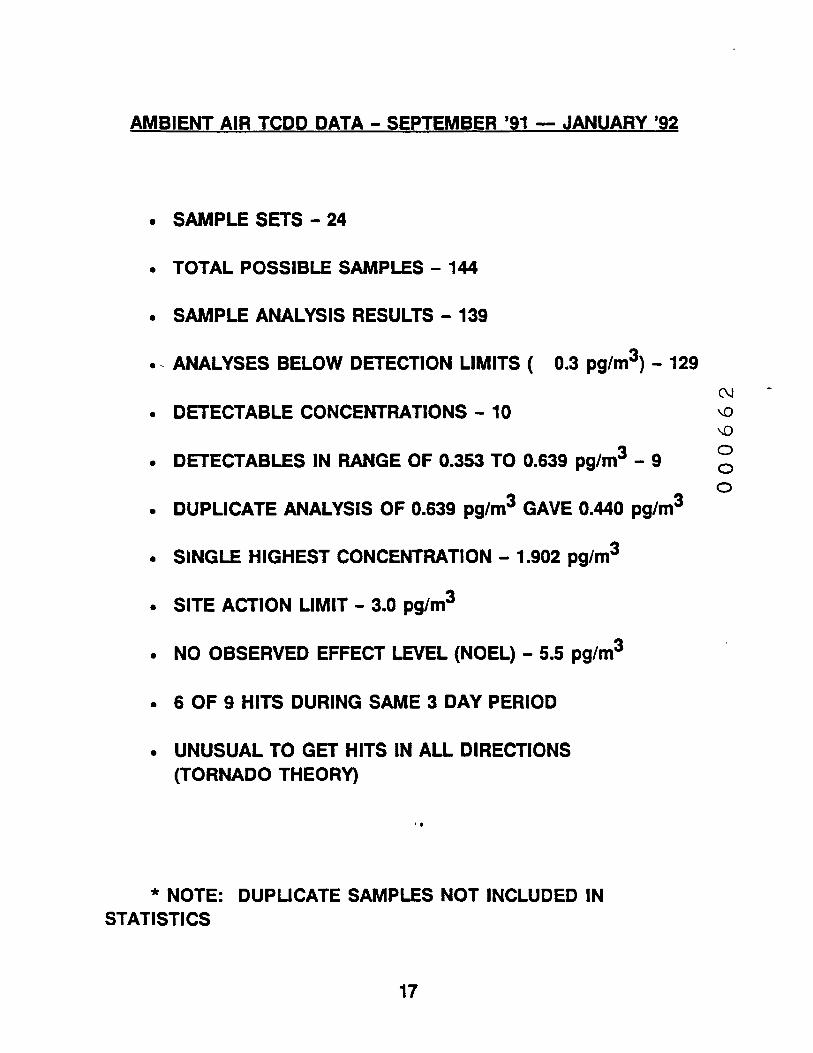
AMBIENT AIR TCDD DATA - SEPTEMBER '91 — JANUARY '92
. SAMPLE SETS - 24
• TOTAL POSSIBLE SAMPLES - 144
. SAMPLE ANALYSIS RESULTS - 139
• ANALYSES BELOW DETECTION LIMITS ( 0.3 pg/m3) - 129
C\J
. DETECTABLE CONCENTRATIONS - 10 ^\o
. DETECTABLES IN RANGE OF 0.353 TO 0.639 pg/m3 - 9 ^
3 3 °. DUPLICATE ANALYSIS OF 0.639 pg/m3 GAVE 0.440 pg/m3
. SINGLE HIGHEST CONCENTRATION - 1.902 pg/m3
. SITE ACTION LIMIT - 3.0 pg/m3
. NO OBSERVED EFFECT LEVEL (NOEL) - 5.5 pg/m3
• 6 OF 9 HITS DURING SAME 3 DAY PERIOD
. UNUSUAL TO GET HITS IN ALL DIRECTIONS(TORNADO THEORY)
* NOTE: DUPLICATE SAMPLES NOT INCLUDED INSTATISTICS
17
V£/?-TI.LOK(
2./^/^P-^ i
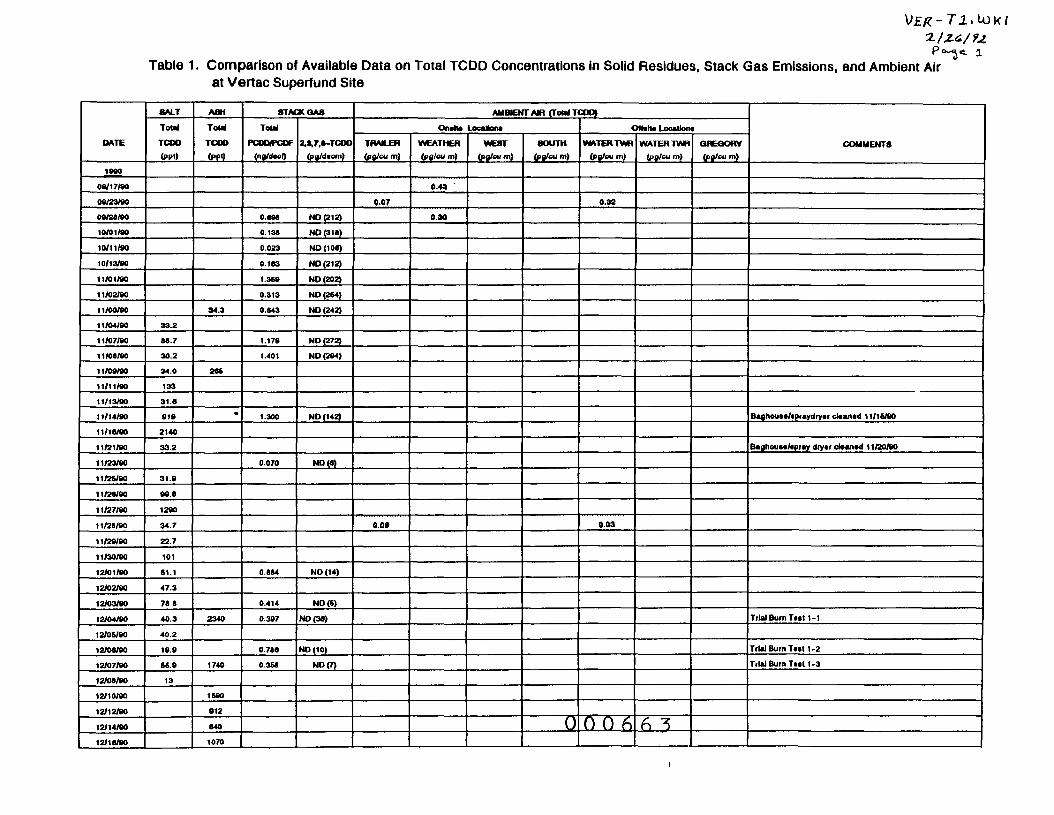
Table 1. Comparison of Available Data on Total TCDD Concentrations in Solid Residues, Stack Gas Emissions, and Ambient Airat Vertac Superfund Site
DATE
1880
08/17/80
08/23/80
08/2W80
10/01/80
10/11(80
10/13/80
11/01/80
11/02/80
11/03/80
11/04/80
11/07/80
11/08/80
11/08/80
11 /11 /80
11/13/80
11/14/80
11/18/80
11/21/80
11/23/80
11/26/80
11/20/80
11/27/80
11/21/80
11/28/80
11/30/80
12/01(80
12/02/80
12/03/80
12/04/80
12/06/80
12/00/80
12/07/80
12/OJ/80
12/10/00
12/12/80
12/14/80
12/16/80
SALT
Told
TCOO
(ppl)
33.2
B».7
30.2
34.0
133
31 «
818
2140
33.2
31.8
88.6
1280
34.7
22.7
101
61.1
47.3
7»»
40.3
40.2
18.8
66.8
13
AmTold
TCOO
(ppl)
34.3
SM
•
2340
1740
1f80
812
•40
1070
STACK OAS
TomPCOOiPCOF
(n^dicq
O.OfX
0.131
0.023
0.183
1.368
0.313
0.643
1.178
1.401
1.300
0.070
0.»»4
0.414
0.3B7
078B
0.36*
2,»,7,*-TCOO
(pll/dttcm)
N0(212)
NO (31B)
N0(10«)
N0(212)
N0(202)
N0(264)
N0 (242)
N0(272)
N0(284)
N0(142)
NOW
N0 (14)
N0(6)
N0(30
ND (10)
N0(7)
AMBIENT AIR (Totel TCOO)
TRAILER
(py/curn^
Q.07
O.OB
WEATHER
(pg/eum)
6.43
0.30
ww(py/wm)
SOUTH
(pg/eum)
0
WATER TWR
(pg/ou m)
0.32
0.03
0 0 6
WATER TWR
(py/cu m)
6 ?
QHEQORV
(p9/cu m)
COMMENTS
BaghouM/iprydryt cl«an«d 11/16/80
Baghour/lpray dryr d*an*d 11/20/80
Tilal Burn Tct 1 - 1
Trial Burn T*«l 1-2
Trial Burn TMI 1-3
Vfr/<.~ l a.' u-i n. i
2/^a/yz^"yZ
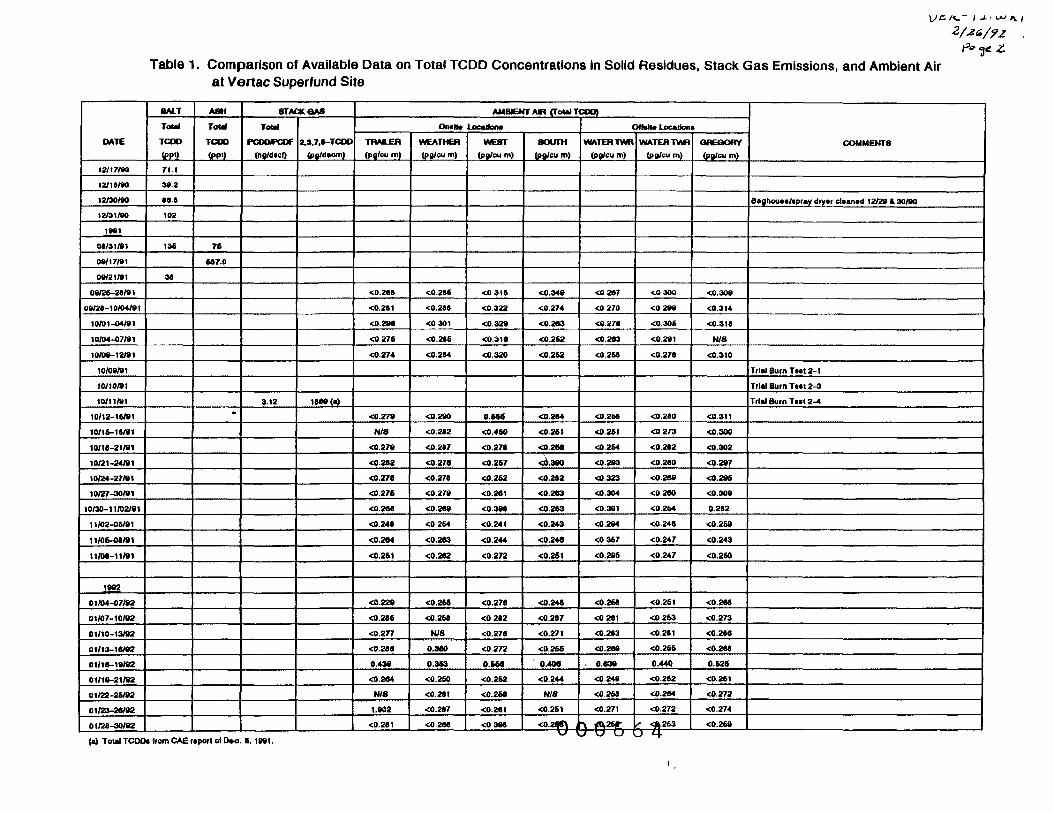
Table 1. Comparison of Available Data on Total TCDD Concentrations in Solid Residues. Stack Gas Emissions, and Ambient Airat Vertac Superfund Site
DATE
12/17/tO
12/1B/W
12/30/BO
12/31/80
1W1
Oe/31/81
08/17/81
08/21/81
OW26-28/8)
08/2«-10f04/81
10/01-04/81
10/04-07/81
10/08-12/81
10/08/81
10/10/91
10/11/81
10/12-16/81
10/16-r/ttl
10/1B-21/81
10/21-24/81
10/24-27/81
10/27-30/81
10/30-11/02/81
11/02-06/81
n/d6-o»/»i
u/oe-u/8.
1802
01/04-07/82
01/07-10/82
01/10-13/82
01/13-11/82
01/10-18/02
01/18-21/82
01/22-26/82
01/23-21/92
01/28-30/82'"'
BALT
Total
TCOO
(ppl)
71.1
38.2
•a.e
102
136
3«
ASH
Total
TCOO
(ppl)
76
U7.0
•
8TACKOA8
Total
PCOO/PCOF
(ng/d>cl)
3.12
2.a.7.»-TCOO
(pg/d«am)
ieaeo
AUBIENTAM (Total TCOO)
QmH* LocJUon*
TRAM-EB
(p0/cu ml
<028«
<o.2ai
<0.28«
<027t
<0.274
<0.278
HIS
<0.278
<0.2B2
<0.27B
<0.276
<o.zo«
<0.24«
<0.204
<0.261
<0.228
<0.2»6
<0.277
<0.2M
0.438
<0.2«4
HIS
1.802
<0.2«1
WEATHER
(PQ/CU m)
<0.2<6
<o.2e«
<0301
<0.2(«
<0.2»4
<OZBO
<0.212
<0.2(7
<0.27B
<0.27«
<0.278
<02B»
<02M
<0.2fl3
<0.262
<0.2«6
<0.2U
HIS
0.360
0.3M
<0.260
<02BI
<0.2t7
<02aa
WEST
(pg/ou m)
<0316
<0.322
<0.328
<0.31«
<0.320
0.1>««
<0.460
<027»
<0267
<0.262
<o.2ai
<03W
<0241
<0.244
<0.272
<0.27«
<0282
<027«
<0.272
O.M9
<0.262
<0.2&8
<0.2fll
<038*
SOUTH
(pg/cu m)
<0.348
<0.274
<0.203
<0.262
<0.262
<0.2M
<0.261
<o.2aa
<6.380
<0.2«Z
<0.203
<0.263
<0.243
<0.24«
<0.261
<0.24«
<02B7
<0.27<
<0.266
0.40«
<0.244
N/8
<0.261
<0.2W
WATER TWR
(pg/cu in)
<02«7
<0270
<0.27B
<0.2o3
<0.261
<0.2W
<0.26)
•C0.264
<0.283
<0.323
<0.304
<0.301
<0.284
<0367
<0.286
<026«
<02fll
<0.2«3
<0.2B»
. 0.«3«
<0.248
<02M
<0.271
•» iaik26g-U U 0 f
WATER T\AIR
(pd/Gu in)
<0300
<0288
<0,306
<0.281
<027«
<0280
<0273
<0.212
<0.280
<0.20C
<02BO
<0.264
<0.24«
•C0.247
<0.247
<0261
<0263
<02t1
<0266
0.440
<0.262
<0.284
<0.272
' <»263
0-4————
Qpcaom(pg/cu m)
<0.30»
<0.314
<0.31«
N/8
<0.310
<0.311
•CO 300
<0.302
<0.287
<0.286
<0.308
0.282
<0.268
•C0.243
<0.260
<0.2W
<0.273
<02ea
<O.SM
O-Ki
<0.261
<0272
<0.274
<0.268
COMMENTS
Baghour/>pry <liy*r ctoantd 12/28 ft 30/80
Trial Burn TMI 2-1
Trud Burn Tot 2-3
Trial Burn THI 2-4
TECHNICAL ASSISTANCE TEAM RECOMMENDATIONS
. ANALYTICAL CHEMIST
. TOXICOLOGIST/RISK ASSESSMENT SPECIALIST
18
VERTAC SUPERFUND SITEASSESSMENT OF INCINERATION
OPERATIONS
PREPARED FOR:
* U.S.EPAREGION VI
DALLAS, TEXAS
PREPARED BY:CHsMHILL
DENVER, CO&
EER CORPORATIONDURHAM, NC
?rgyQVironmental FEBRUARY 27,1992research Corporation
0 0 0 6 6 6
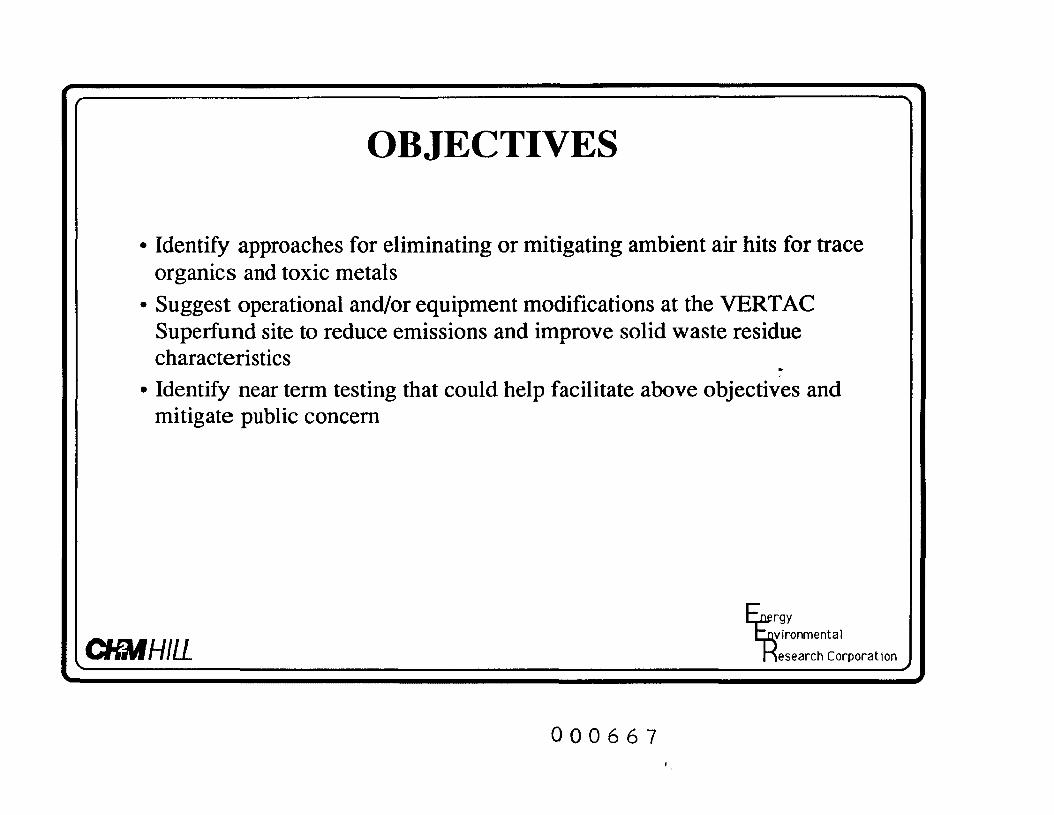
OBJECTIVES
• Identify approaches for eliminating or mitigating ambient air hits for traceorganics and toxic metals
• Suggest operational and/or equipment modifications at the VERTACSuperfund site to reduce emissions and improve solid waste residuecharacteristics
• Identify near term testing that could help facilitate above objectives andmitigate public concern
?rgyQvironmental
research Corporation
0 0 0 6 6 7
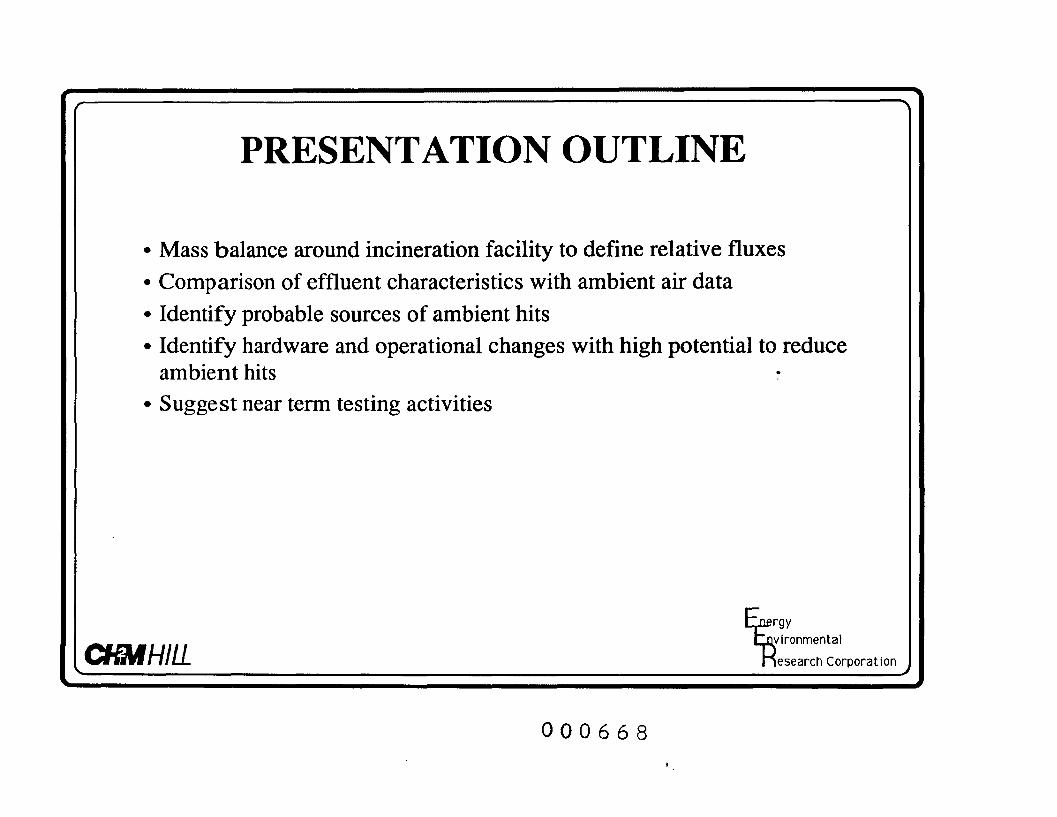
PRESENTATION OUTLINE
• Mass balance around incineration facility to define relative fluxes• Comparison of effluent characteristics with ambient air data• Identify probable sources of ambient hits• Identify hardware and operational changes with high potential to reduce
ambient hits• Suggest near term testing activities
yironmental
esearch Corporation
0 0 0 6 6 8
DATA LIMITATIONS
• Lack of complete data during trial bum periods• Incomplete dioxin and furan analysis during many tests• Feed composition uncertain; only single sample collected and analysis
reported
rgyivironmental
e5earch Corporation
0 0 0 6 6 9
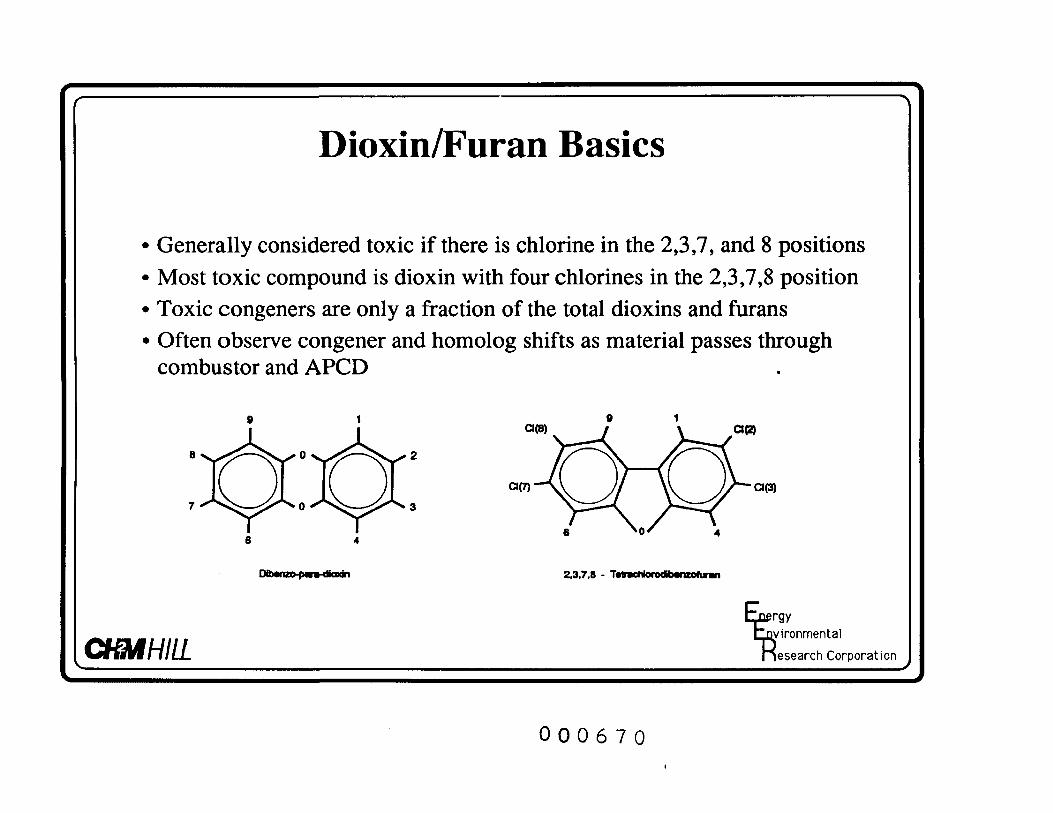
Dioxin/Furan Basics
• Generally considered toxic if there is chlorine in the 2,3,7, and 8 positions• Most toxic compound is dioxin with four chlorines in the 2,3,7,8 position• Toxic congeners are only a fraction of the total dioxins and furans• Often observe congener and homolog shifts as material passes through
combustor and APCD
d(7) d(3)
2,3,7,8 - Tfctilorodibwizotufn
?rgynyironmental
research Corporation
0 0 0 6 7 0
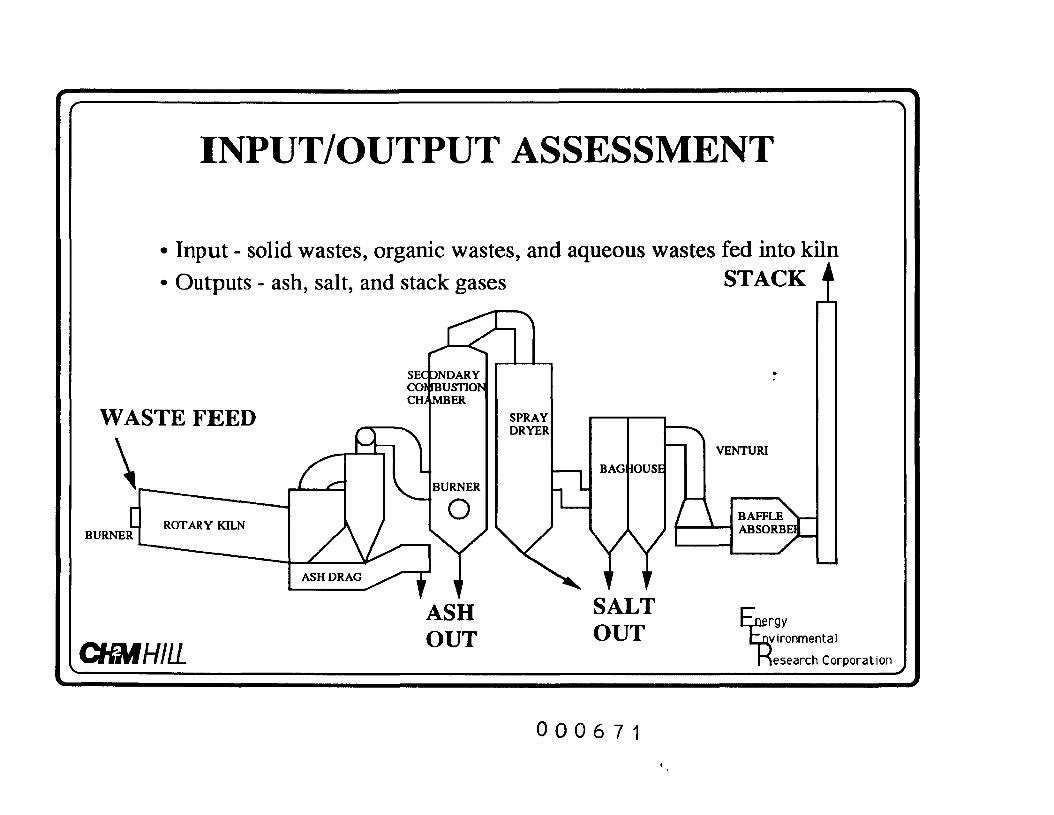
INPUT/OUTPUT ASSESSMENT
• Input - solid wastes, organic wastes, and aqueous wastes fed into kiln• Outputs - ash, salt, and stack gases STACK 4
0 0 0 6 7 1
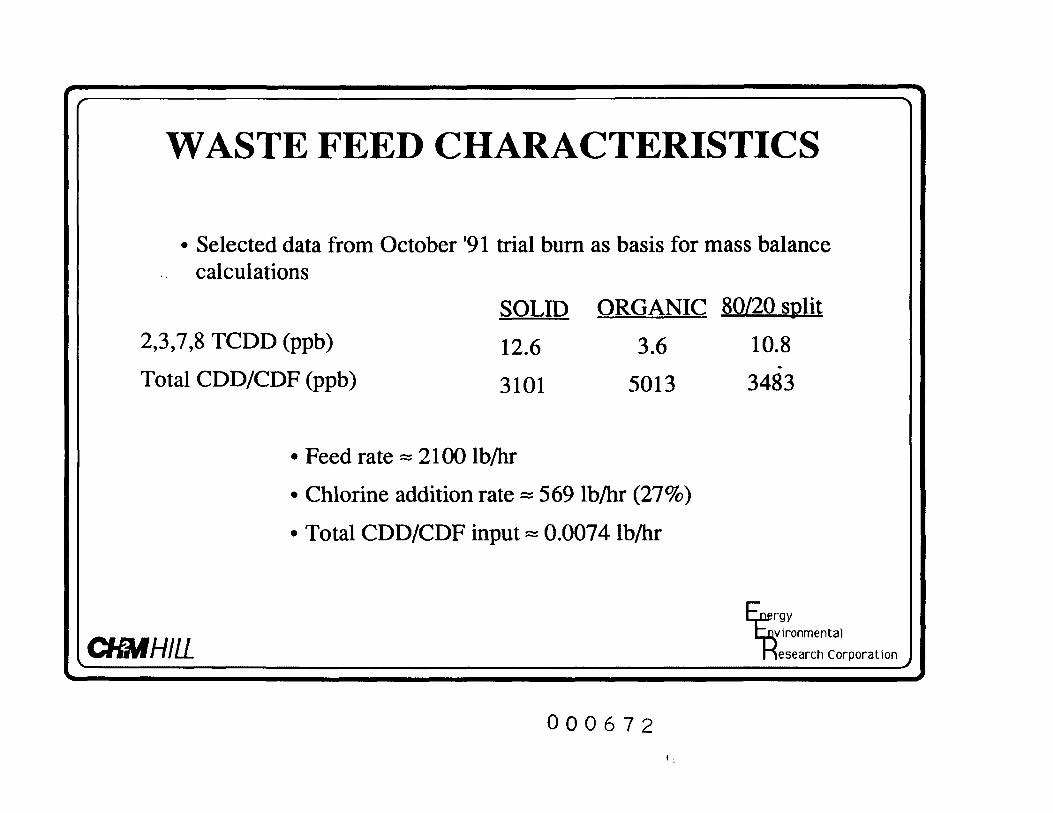
WASTE FEED CHARACTERISTICS
• Selected data from October '91 trial bum as basis for mass balancecalculations
SOLID ORGANIC 80/20 split
2,3,7,8 TCDD (ppb) 12.6 3.6 10.8
Total CDD/CDF (ppb) 3101 5013 3483
• Feed rate s= 2100 Ib/hr
• Chlorine addition rate == 569 Ib/hr (27%)
• Total CDD/CDF input - 0.0074 Ib/hr
LVironmenta)
esearch Corporation
0 0 0 6 7 2
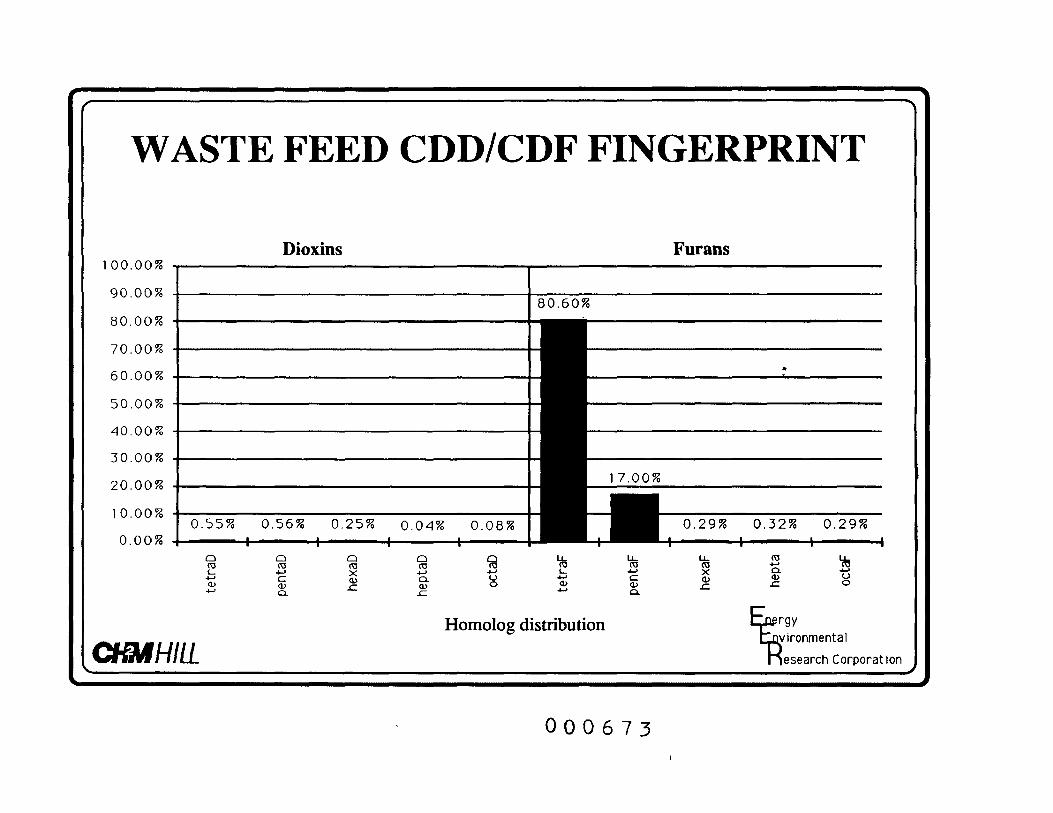
WASTE FEED CDD/CDF FINGERPRINT
Dioxins Furans
90.00% -
Q /"^ r\ r\ O?
~i r\ r\ [\ v
60.00% -
t- r\ r\ Pi v?
•-10.00% -
-? r\ c\r\v
20.00% -
in r\ r\v?
O r\r\v
CKMHI
1 0 0 . 0 0 % i————————————————————————————————————————————————
0.55% 0.56% 0.25% 0.04% 0.08%
Q Q Q Q Qro (\3 rts ro t^1- 4-' X 4-1 *-•-" c oi Q- °^ g. -c ^ o
Homolog d
IL
80.60%
^^^^^^^H •
^^B 1 7 . 0 0 %
^^H ^^H 0.29% 0.32% 0.29%
Li Ll- Ll- ro Lfcro ro ro -y ro^ ^ $ & t;£ ^ ^ ^ °
istribution 4 '̂'̂L-Qvironmental
nesearch Corporation1 1 1 — -y
0 0 0 6 7 3
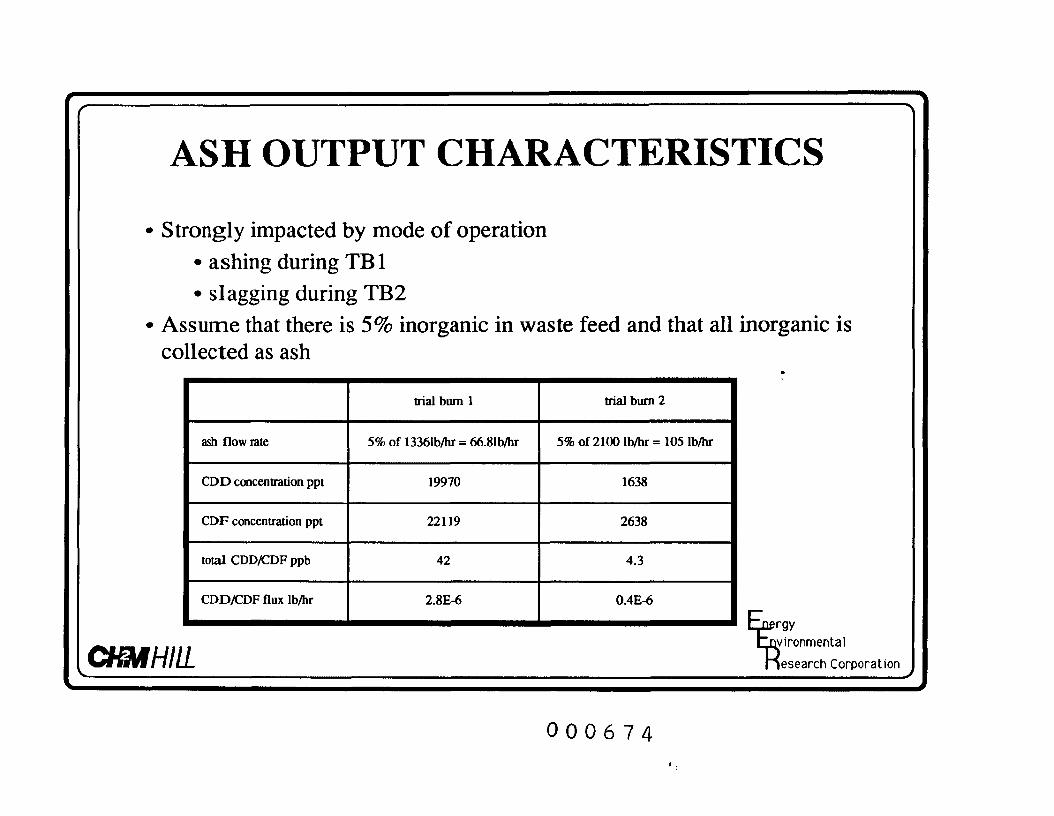
ASH OUTPUT CHARACTERISTICS
• Strongly impacted by mode of operation• ashing during TB 1• slagging during TB2
• Assume that there is 5% inorganic in waste feed and that all inorganic iscollected as ash
trial bum 1 trial bum 2
ash flow rate 5% of 13361b/hr = 66.81b/hr 5% of 2100 Ib/hr = 105 Ib/hr
CDD concentration ppt 19970 1638
CDF concentration ppt 22119 2638
total CDD/CDF ppb 42 4.3
CDD/CDF flax Ib/hr 2.8E-6 0.4E-6
rgyLVironmental
esearch Corporation
0 0 0 6 7 4
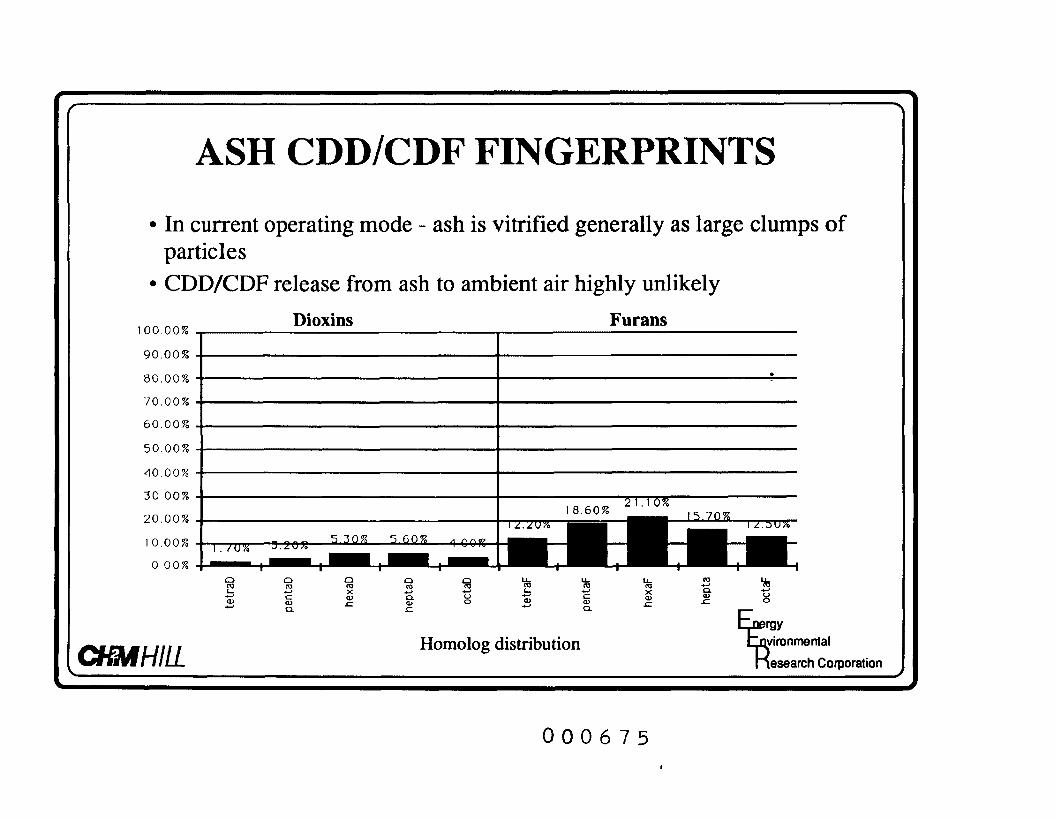
ASH CDD/CDF FINGERPRINTS
• In current operating mode - ash is vitrified generally as large clumps ofparticles
• CDD/CDF release from ash to ambient air highly unlikely
100.00%
90.00%
80.00%
70.00%
60.00%
50.00%
40.00%
30 00%
20.00%
10 .00%
0 00%
Dioxins Furans
0 0 0 6 7 5
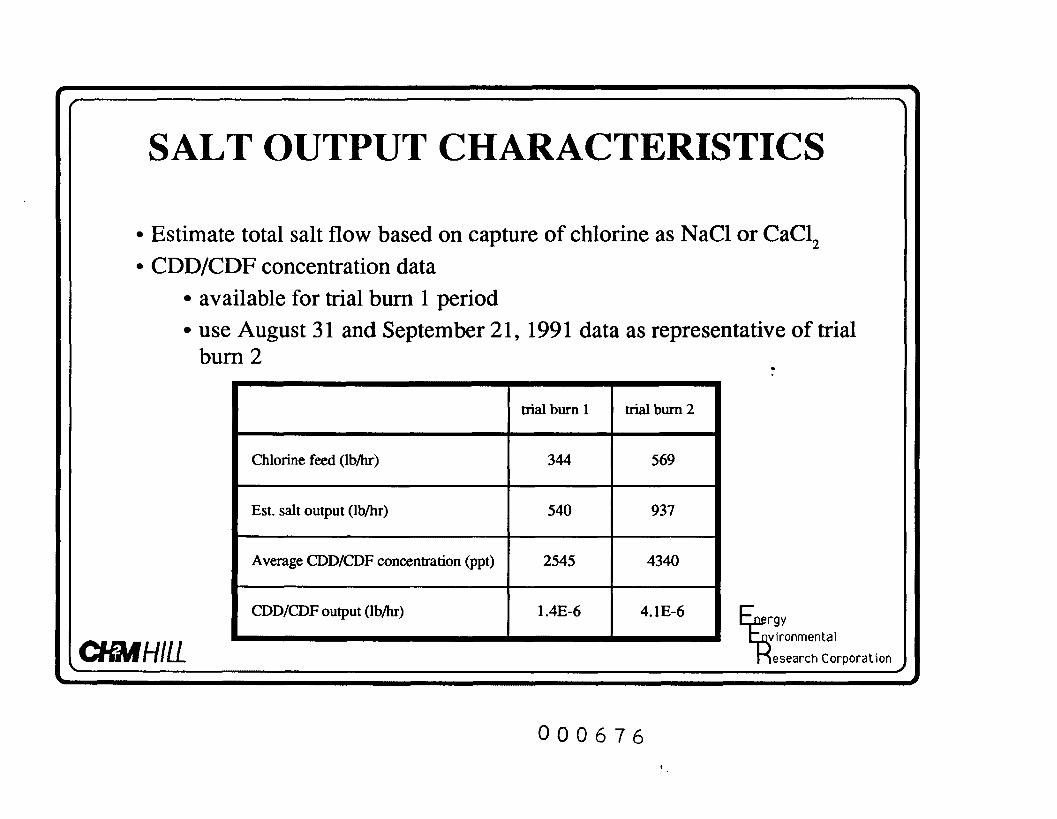
SALT OUTPUT CHARACTERISTICS
• Estimate total salt flow based on capture of chlorine as NaCI or CaCI^• CDD/CDF concentration data
• available for trial bum 1 period• use August 31 and September 21, 1991 data as representative of trial
bum 2
Chlorine feed (Ib/hr)
Est. salt output (Ib/hr)
Average CDD/CDF concentration (ppt)
CDD/CDF output (Ib/hr)
trial bum 1
344
540
2545
1.4E-6
trial bum 2
569
937
4340
4.1E-6
0 0 0 6 7 6
rgyLvironmental
esearch Corporation
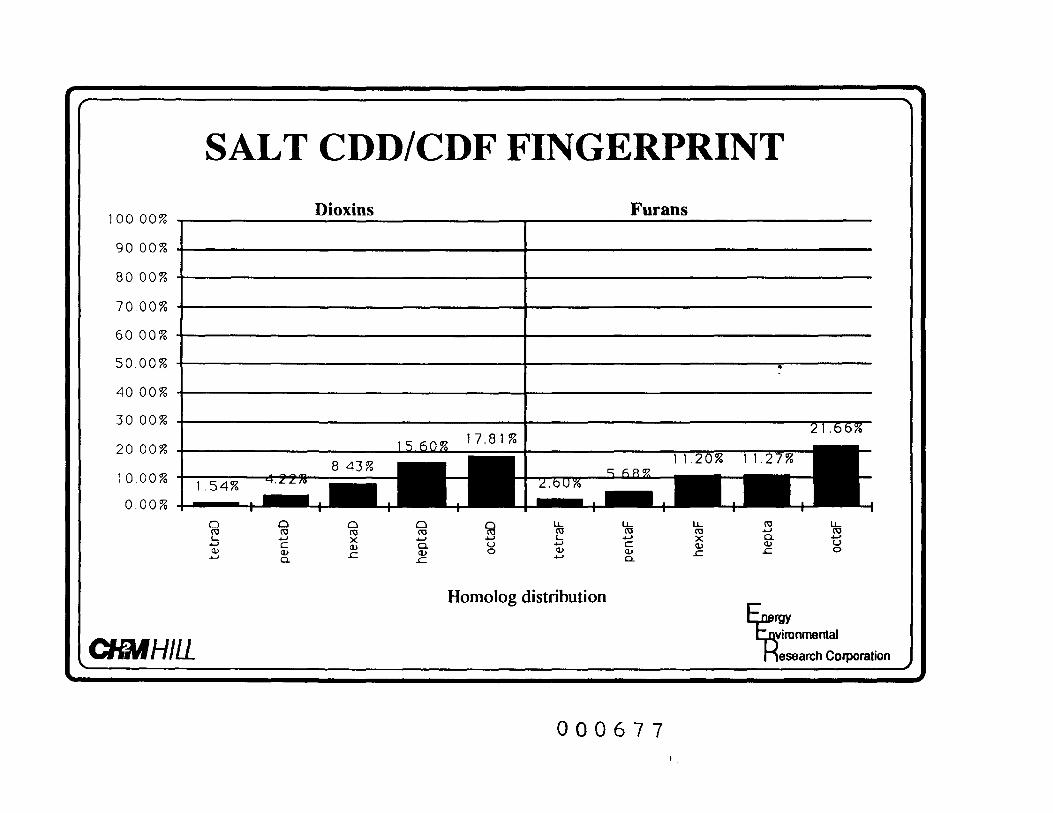
SALT CDD/CDF FINGERPRINT
Dioxins Furans
90.00% •
80.00% •
-7 A ("i ("i v
60.00% •
E- r\ r\r\<p
40.00% •
"7 n n r^ <y
20 00% •
1 0 .00% •
0 .00% •
yowHii
1^0% ^-^
8 43^ ———— ————1 . 5 4 % •4•zz 'o l ^^H ^J
Q Q 0 Q Qro ro ro ro rot *-> y -̂> ••-'"̂ c= S Q- "<i> <i» ,— a> o-^ Q. J=
Homolog (
I
^ 1 . 6 6 %
1 1 . 2 0 % 1 1 . 2 7 % |HB5 f}f\% ^^M ^^M ^^H•^.t)U% ^^f ^^H ^^H
LL u- LL ro u-ro ro ro -*-' roi 4-> >; Q. •;-»-'-' i= £ i> 0<D 0} r- C. 0••-' Q.
distributionfc-flergy
["qyironmental
nesearch Corporationy
0 0 0 6 7 7
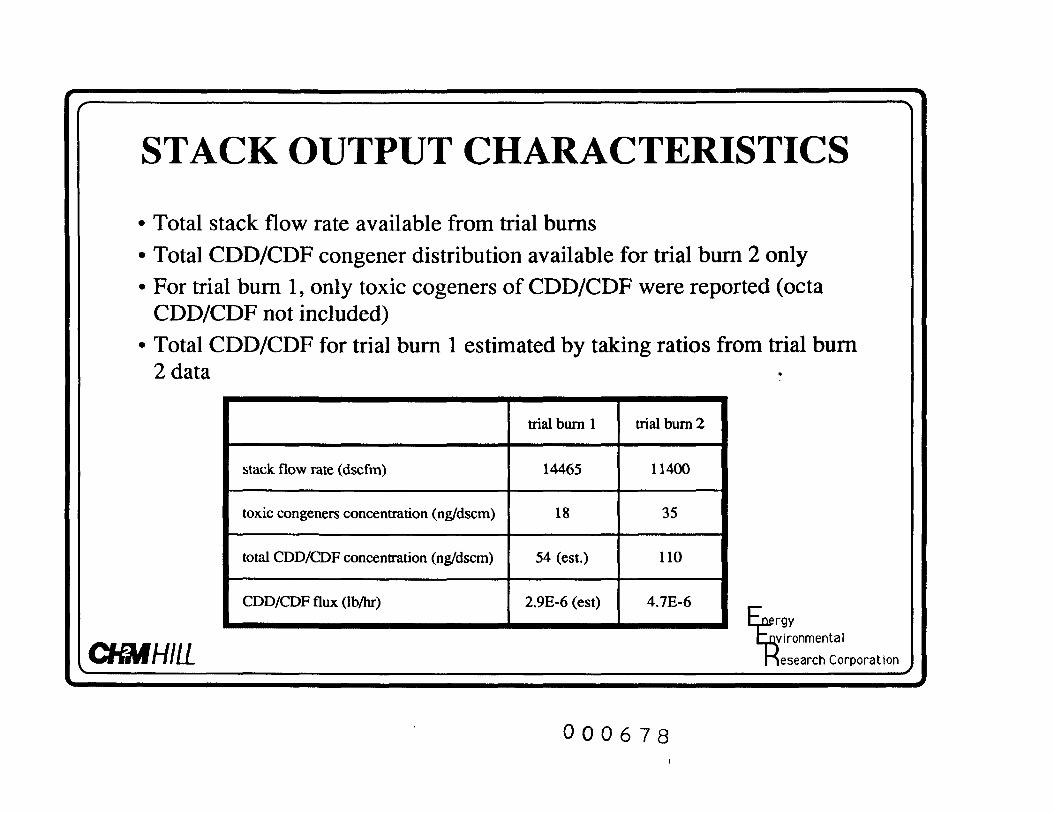
STACK OUTPUT CHARACTERISTICS
• Total stack flow rate available from trial bums• Total CDD/CDF congener distribution available for trial bum 2 only• For trial bum 1, only toxic cogeners of CDD/CDF were reported (octa
CDD/CDF not included)• Total CDD/CDF for trial bum 1 estimated by taking ratios from trial bum
2 data
stack flow rate (dscfm)
toxic congeners concentration (ng/dscm)
total CDD/CDF concentration (ng/dscm)
CDD/CDF flux (Ib/hr)
trial bum 1
14465
18
54 (est.)
2.9E-6 (est)
trial bum 2
11400
35
110
4.7E-6
0 0 0 6 78
irgyQvironmenta)
lesearch Corporation
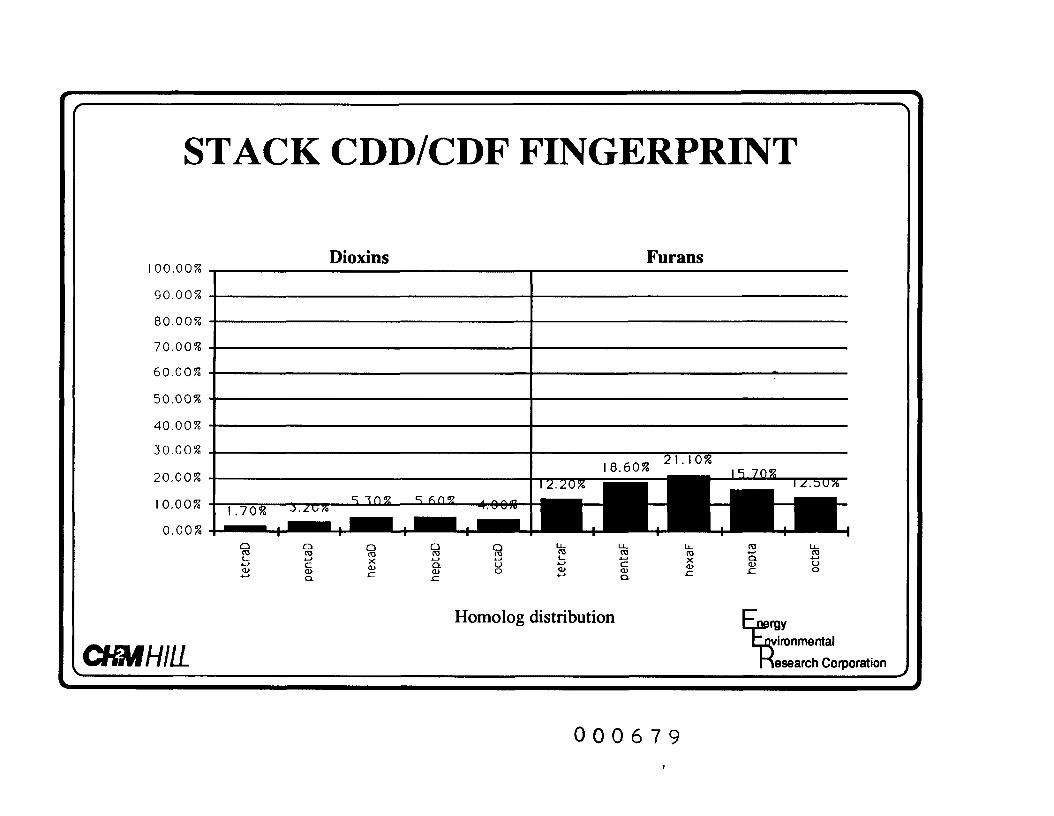
STACK CDD/CDF FINGERPRINT
Dioxins Furans1 0 0 . 0 0 % -——————————————————————————————————————————————————————————————————
90.00% -
80.00% -
~J r\ C\C\07
60.00% -
c~ f\ r\ r\ <y
40.00% -
30.00% -
n r\ r\r\a7
i r\ r\ r\ q?
O r\ /~\ 07
OBVIHIIL^
^ -(n°? ^ f tn% , QO-"1 . 7 0 % J.ZU/a t.UU/U
Q Q Q Q Qro ro m ro rol» ^-* ^ 4-* *J
S s ^ I ^
Homolog
l f l f i07 2 ' • 1 0 %1 O.OU/i . c -7/->o7
1 J . ^ O % ^^ ^^J ^^^ l-i:.=)U%
1 • • • • 1^1-L. Ll- u- (0 Ll-ro ro ro +-' rot- 4-t ^ Q. -»-*<-' c n> a> <->^ ^ ^ r: o
distribution Energyt-Dyironmental
nesearch Corporation
0 0 0 6 7 9
c
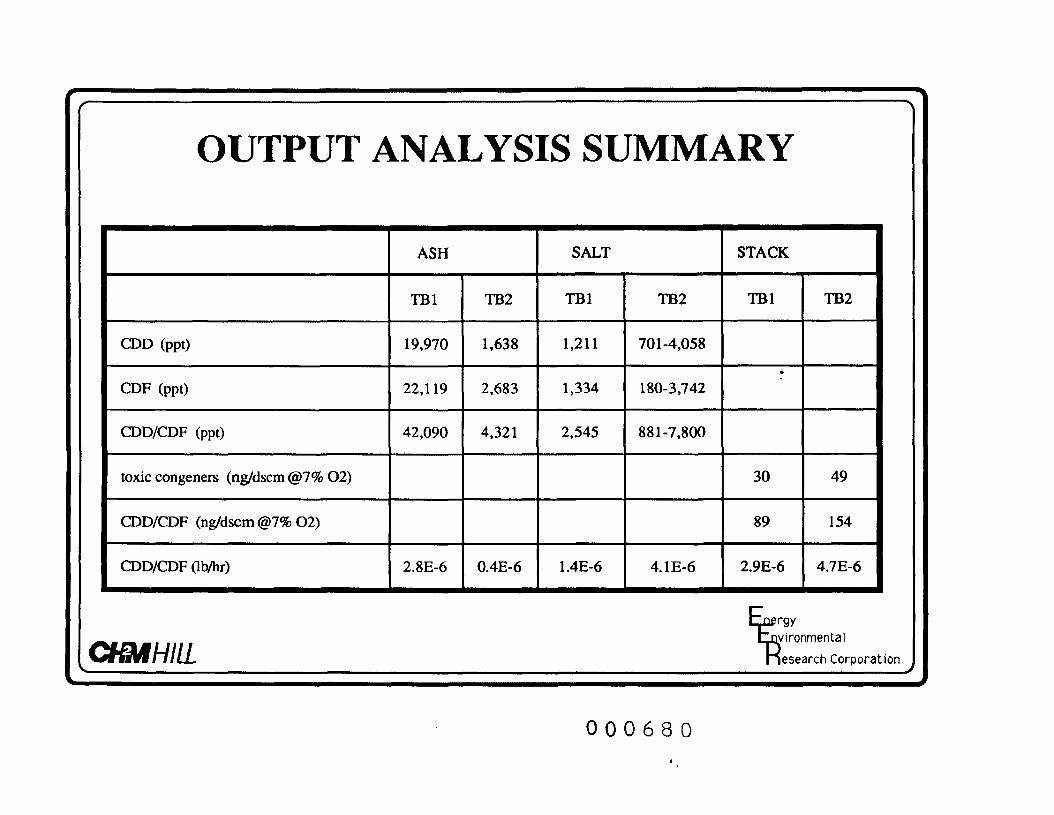
OUTPUT ANALYSIS SUMMARY
CDD (ppt)
CDF (ppt)
CDD/CDF (ppt)
toxic congeners (ng/dscm @7% 02)
CDD/CDF (ng/dscm @7% 02)
CDD/CDF Ob/hr)
i n e r g y
WMHIII Lnvironmenta,WlW/7/LL liesearch Corporat
ASH
TB1
19,970
22,119
42.090
2.8E-6
TB2
1.638
2,683
4,321
0.4E-6
SALT
TB1
1,211
1,334
2.545
1.4E-6
TB2
701-4,058
180-3,742
881-7,800
4.1E-6
STACK
TB1
•
30
89
2.9E-6
TB2
49
154
4.7E-6
lion ^
0 0 0 6 8 0
COMPARISON OF TRIAL BURNS 1&2
• Total concentration of CDD/CDF in ash reduced by an order of magnitudeinTB2
• Total CDD/CDF concentration in salt is highly variable when operated inTB2 mode: no discernible distinction between CDD/CDF concentration inTB1& TB2
• Total CDD/CDF stack emission concentration and mass flux are equalwithin a factor of two
• Perception that dioxins from TB2 are 2 to 3 orders of magnitudehigher than during TB1 is not correct
energyLJqyironmental
nesearch Corporation
0 0 0 6 8 1
WHAT CAN THE FINGERPRINTS TELLUS?
• Waste feed, salt, and stack gas have drastically different fingerprints. Canhelp determine source of ambient hits.
• Waste Feed
•Salt
• Stack
almost all CDD/CDF as TCDF and PeCDF*
CDF^CDD
TCDD/F<PeCDD/F<HxCDD/F<HpCDD/F<OCDD/F
CDF-4*CDD
CDD homologs about equal; CDF homologs about equal
CSHMHIU.
rgyLvironmental
esearch Corporation
0 0 0 6 8 2
WHAT'S CAUSING THE DIOXIN HITS
FUGITIVE SALT EMISSIONS
Ratio of CDD/CDF and PM,
or
10collected in the ambient monitorsshould be consistent withCDD/CDF concentration in thesalt
STACK EMISSIONS
reasonable dilutionratios should result inenough dioxin reachingthe ambient airmonitors to cause theobserved hits
VfMHIU.rgyLVironmenta)
esearch Corporation
0 0 0 6 8 3
COULD FUGITIVE SALT EMISSIONSCAUSE AMBIENT CDD/CDF HITS?
• 0.50 ng of TCDD on filter• salt contained ^ 39 ppt TCDD (avg during TB1)• would require 0.5E-9 (gm TCDD)/39E-12 (gm TCDD/gm salt) = 13 gm
salt on filter• only 0.02 gm of PM^ collected on particulate monitor •• Conclusion - fugitive salt emissions unlikely source of dioxin hits
yironmentat
esearch Corporation
0 0 0 6 8 4
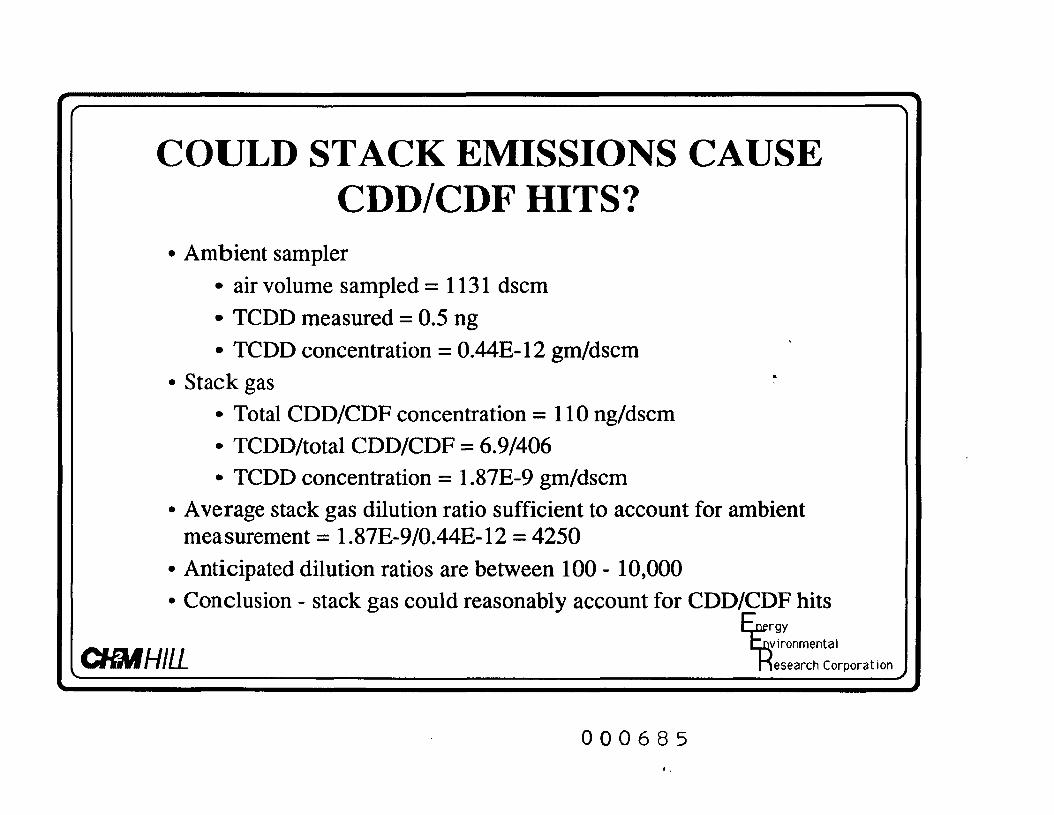
COULD STACK EMISSIONS CAUSECDD/CDF HITS?
• Ambient sampler• air volume sampled =1131 dscm• TCDD measured = 0.5 ng• TCDD concentration = 0.44E-12 gm/dscm
• Stack gas• Total CDD/CDF concentration =110 ng/dscm• TCDD/total CDD/CDF = 6.9/406• TCDD concentration = 1.87E-9 gm/dscm
• Average stack gas dilution ratio sufficient to account for ambientmeasurement = 1.87E-9/0.44E-12 = 4250
• Anticipated dilution ratios are between 100 - 10,000• Conclusion - stack gas could reasonably account for CDD/CDF hits
i ne rgv
CUM H i l l LnvironmentalWMWfi/LL nesearch Corporation
-y
0 0 0 6 8 5
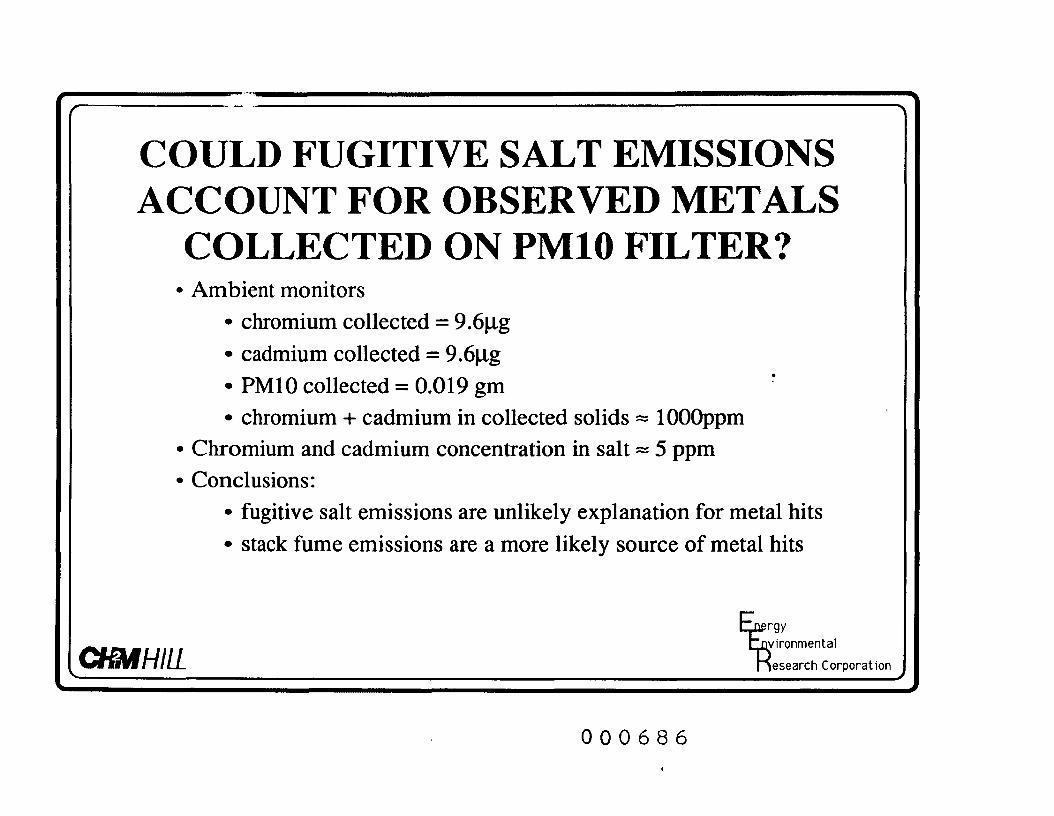
COULD FUGITIVE SALT EMISSIONSACCOUNT FOR OBSERVED METALS
COLLECTED ON PM10 FILTER?• Ambient monitors
• chromium collected = 9.6ug• cadmium collected == 9.6|J.g• PM 10 collected = 0.019 gm• chromium + cadmium in collected solids ^ lOOOppm
• Chromium and cadmium concentration in salt == 5 ppm• Conclusions:
• fugitive salt emissions are unlikely explanation for metal hits• stack fume emissions are a more likely source of metal hits
Lvironmental
esearch Corporation
0 0 0 6 8 6
HOW DO WE REDUCESTACK CDD/CDF?
yironmental
esearch Corporation
0 0 0 6 8 7
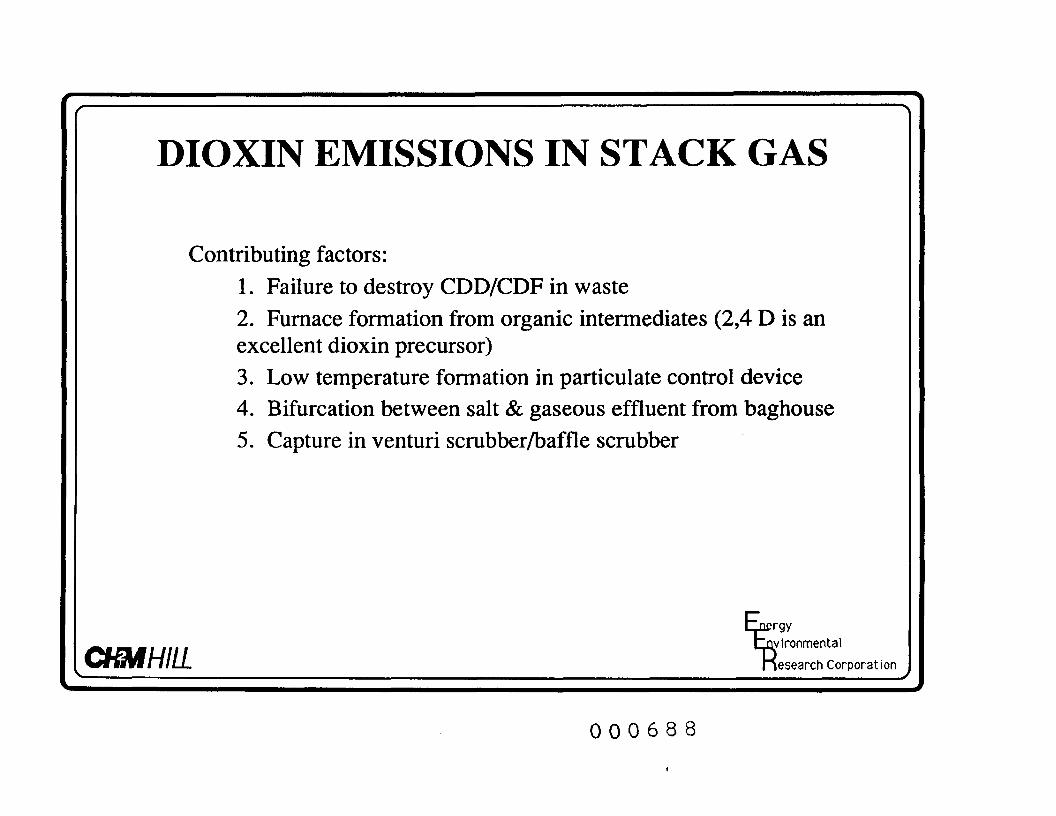
DIOXIN EMISSIONS IN STACK GAS
Contributing factors:1. Failure to destroy CDD/CDF in waste2. Furnace formation from organic intermediates (2,4 D is anexcellent dioxin precursor)3. Low temperature formation in paniculate control device4. Bifurcation between salt & gaseous effluent from baghouse5. Capture in venturi scrubber/baffle scrubber
ivironmental
esearch Corporation
0 0 0 6 8 8
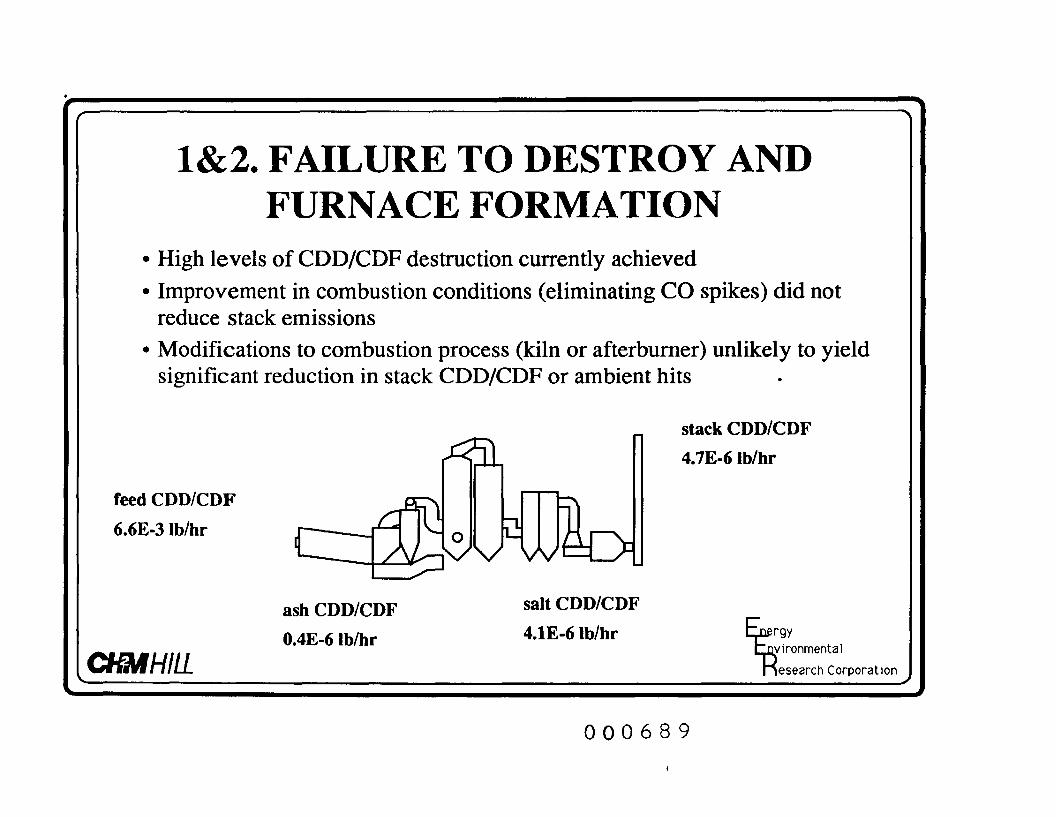
1&2. FAILURE TO DESTROY ANDFURNACE FORMATION
• High levels of CDD/CDF destruction currently achieved• Improvement in combustion conditions (eliminating CO spikes) did not
reduce stack emissions• Modifications to combustion process (kiln or afterburner) unlikely to yield
significant reduction in stack CDD/CDF or ambient hits
stack CDD/CDF
^\\\, 4.7E-6 Ib/hr
feed CDD/CDF PC^ rT"b\
6.6E-3 Ib/hr
ash CDD/CDF
0.4E-6 Ib/hr
salt CDD/CDF
4.1E-6 Ib/hr srgyoyironmental
(esearch Corporation
0 0 0 6 8 9
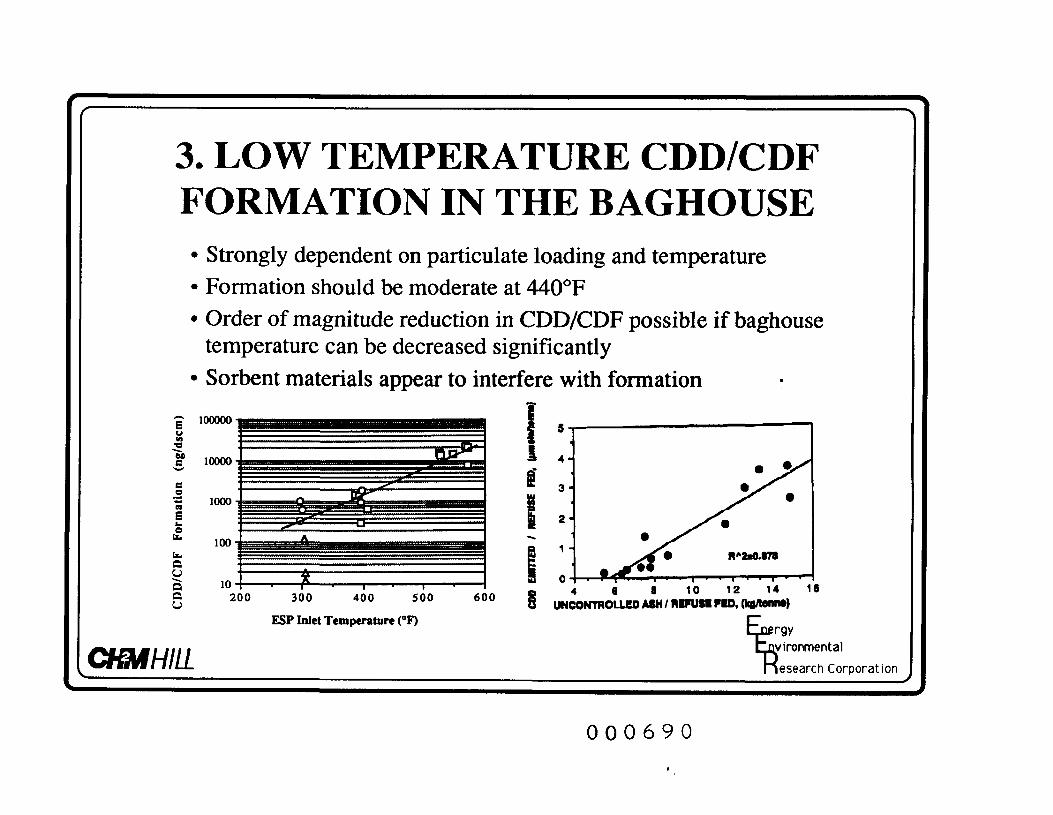
3. LOW TEMPERATURE CDD/CDFFORMATION IN THE BAGHOUSE• Strongly dependent on particulate loading and temperature• Formation should be moderate at 440°F• Order of magnitude reduction in CDD/CDF possible if baghouse
temperature can be decreased significantly• Sorbent materials appear to interfere with formation
ec
£.EfcQyQQU
100000 •
10000
1000
=0=
100
10200 300 400 500 600
ESP Inlet Temperature (°F)
4 6 8 1 0 1 2 1 4 1 6UNCONTROLLED A8H / HIPUSI PID, MWW}
rgyLVironmenta)
esearch Corporation
0 0 0 6 9 0
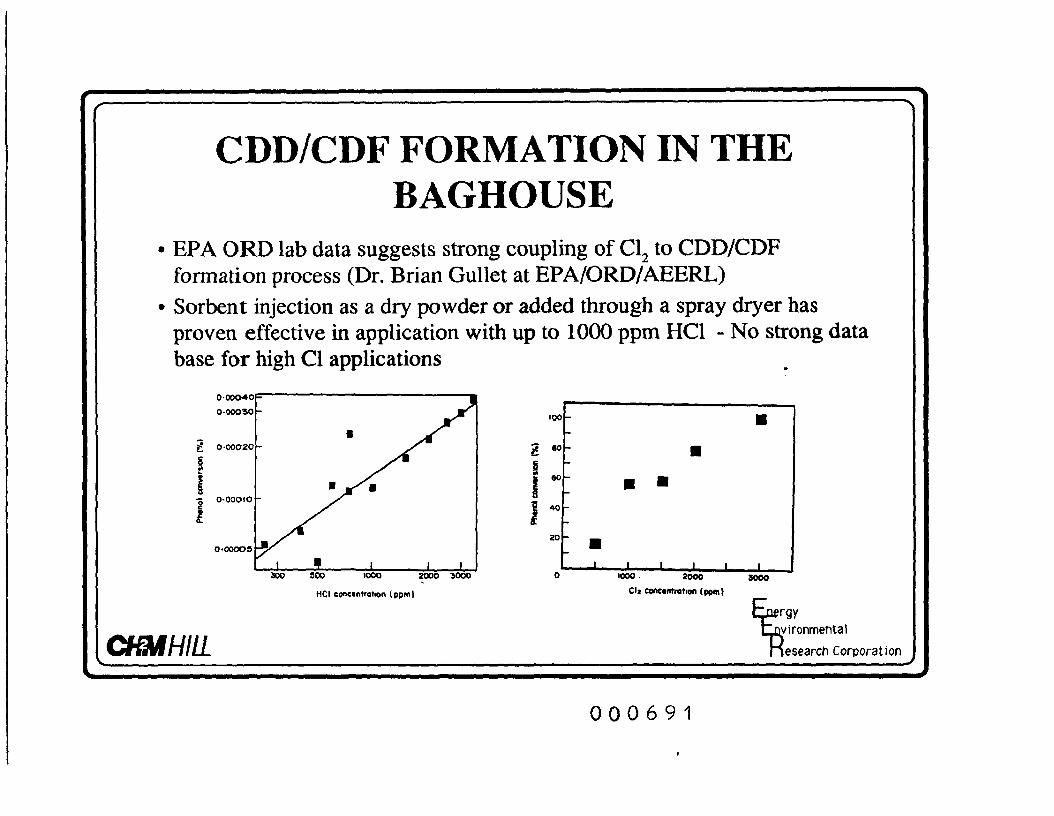
CDD/CDF FORMATION IN THEBAGHOUSE
EPA ORD lab data suggests strong coupling of CL. to CDD/CDFformation process (Dr. Brian Gullet at EPA/ORD/AEERL)Sorbent injection as a dry powder or added through a spray dryer hasproven effective in application with up to 1000 ppm HC1 - No strong database for high Cl applications
2 w
I CO
200 SCO 1000 2000 3000
HC1 conctnt'otion (ppml
1000 2000
Cl* concentration I ppm)3000
rgy[vironmental
esearch Corporation
0 0 0 6 9 1
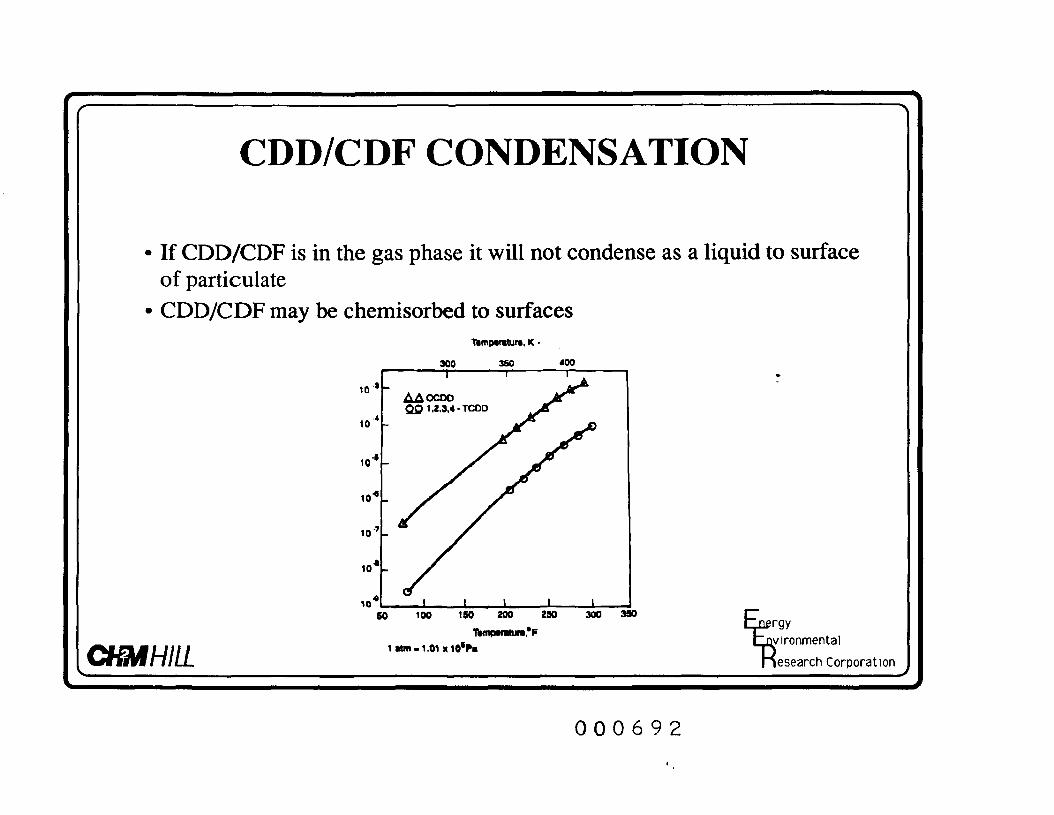
CDD/CDF CONDENSATION
• If CDD/CDF is in the gas phase it will not condense as a liquid to surfaceof particulate
• CDD/CDF may be chemisorbed to surfaces
60 100 1SO 200 230 300 390
TKnpfMUK'F
1 tm-1.01 x10*P«
rgylyironmenta)
esearch Corporation
0 0 0 6 9 2
4. CDD/CDF BIFURCATION INBAGHOUSE
• Carbon provides excellent surface for chemisorbtion of organics• Lack of carbonaceous paniculate leads to increased CDD/CDF in gaseous
effluent• Injection of small quantities of activated carbon dramatically increases
fraction of CDD/CDF retained on collected solids
LVironmenta)
esearch Corporation
0 0 0 6 9 5
5. CDD/CDF COLLECTION IN THE WETSCRUBBER
• CDD/CDF leaving baghouse is probably in the gas phase - not attached toparticulate matter
• Condensation of CDD/CDF is not expected• Low level CDD/CDF removal expected in venturi/baffle scrubber• Expect to see majority of stack CDD/CDF in the back half of the-sampling
train• Expect low CDD/CDF concentration in brine
rgyLvironmental
esearch Corporation
0 0 0 6 9 4
THINGS TO CHECK
• Fingerprint of CDD/CDF on ambient samples• Front half/back half split of stack concentration• measure CDD/CDF concentration in brine (also measure metals
concentration)
rgyLVironmental
esearch Corporation
0 0 0 6 9 5
SUGGESTED SYSTEM ADJUSTMENTS
• Add some caustic to spray drier instead of venturi for partial HC1 captureand possible reduction of Cl^ concentration in baghouse
• Adjust baghouse temperature to lowest possible level without undueoperational problems
• Inject activated charcoal into duct prior to baghouse• Anticipate stack CDD/CDF concentration to be reduced to " 10 ng/dscm
@ 7% 0,• If there is CDD/CDF in brine - add a carbon filter to brine flow prior to
spray drier
CHMHIU.rgyLVironmental
esearch Corporation
0 0 0 6 9 6
Related Documents