Adverse Birth Outcomes Statistical Review for TriCounty Health Department March 17, 2015 1 ADVERSE BIRTH OUTCOMES STUDY Adverse Birth Outcomes Statistical Review Investigating the TriCounty Health Department Study Area (Daggett, Duchesne and Uintah Counties), Utah, 1991 - 2013 March 17, 2015 Prepared by the Utah Department of Health Division of Disease Control and Prevention Bureau of Epidemiology Environmental Epidemiology Program

Welcome message from author
This document is posted to help you gain knowledge. Please leave a comment to let me know what you think about it! Share it to your friends and learn new things together.
Transcript
Adverse Birth Outcomes Statistical Review for TriCounty Health Department March 17, 2015
1
ADVERSE BIRTH OUTCOMES STUDY Adverse Birth Outcomes Statistical Review Investigating the TriCounty Health Department Study Area (Daggett, Duchesne and Uintah Counties), Utah, 1991 - 2013
March 17, 2015 Prepared by the Utah Department of Health Division of Disease Control and Prevention Bureau of Epidemiology Environmental Epidemiology Program
Adverse Birth Outcomes Statistical Review for TriCounty Health Department March 17, 2015
2
TABLE OF CONTENTS ACKNOWLEDGMENT..................................................................................................................3 EXECUTIVE SUMMARY .............................................................................................................4 INTRODUCTION ...........................................................................................................................5 DATA AND METHODS ................................................................................................................7 FINDINGS .....................................................................................................................................15 DISCUSSION ................................................................................................................................18 CONCLUSIONS AND RECOMMENDATIONS ........................................................................22 AUTHORSHIP, REVIEW, AND CITATION ..............................................................................24 CERTIFICATION .........................................................................................................................25 REFERENCES ..............................................................................................................................26 TABLES 1-7 ..................................................................................................................................42 DEFINITIONS ...............................................................................................................................51 APPENDIX A ................................................................................................................................56 APPENDIX B ................................................................................................................................57 APPENDIX C: Evaluation of Birth Defect Occurrence ...............................................................59

Adverse Birth Outcomes Statistical Review for TriCounty Health Department March 17, 2015
3
ACKNOWLEDGMENT Birth records data used for this investigation were obtained from the Office of Vital Records and Statistics (OVRS) within the Utah Department of Health (UDOH). Other data and analytical tools used for this investigation were obtained from the Utah Environmental Public Health Tracking Network (UEPHTN). In addition, the UEPHTN provides geocoding services to the birth records data. The UEPHTN is funded by a grant from the Centers for Disease Control and Prevention (CDC), Environmental Public Health Tracking Branch. The current UEPHTN award is number 2U38EH000954 entitled “Utah Environmental Public Health Tracking Network Implementation and Supplemental.”

Adverse Birth Outcomes Statistical Review for TriCounty Health Department March 17, 2015
4
EXECUTIVE SUMMARY In June 2013, the Environmental Epidemiology Program (EEP) became aware of a perceived increased rate of stillbirths in the Uintah Basin through a series of communications with the University of Utah School of Medicine’s Department of Pediatrics. At that time, the EEP contacted the TriCounty Health Department (TCHD) to offer assistance in conducting a statistical review of adverse birth outcomes (ABO) for Daggett, Duchesne, and Uintah counties. The TCHD authorized this investigation. The adverse birth outcomes considered for this investigation were the incidences of low-birth-weight births, premature births, small-for-gestational-age births, infant deaths, and stillbirths. The risk-standardized rate ratios for those five adverse birth outcomes were calculated for a sequence of multiple year analytical periods, using the remainder of the State of Utah as a comparison population. The study period was from 1991 to 2013. The risk factors controlled for were maternal health and behavioral risk factors that were not related to environmental exposures. This report presents the findings of the statistical review of ABO among the TCHD study area population. There was evidence that the rate for ABO in general in the study area population was higher than the rate for the rest of the state. The statistical differences between the TCHD study area rates for individual categories of ABO are not statistically different from the corresponding state rates. However, this investigation did reveal patterns of ABO that are concerning from a local perspective, particularly for small-for-gestational-age births and stillbirths. This report concludes that the initial observation of increased stillbirths in the TCHD study area based on the region’s historical experience was valid. A brief discussion of the intrinsic, extrinsic, medical, and environmental risk factors found in the literature is provided. This study is a statistical review and does not have the power to identify causal factors for the findings. Additionally, this is a population-based study and the findings may not be applicable at the individual level.

Adverse Birth Outcomes Statistical Review for TriCounty Health Department March 17, 2015
5
INTRODUCTION Statistical Reviews: A core function of epidemiology is to track and evaluate disease patterns. This function helps public health officials and policy-makers identify and assess communities with public health challenges, define public health priorities, monitor and evaluate public health actions, and discover knowledge about public health concerns (Dicker 2002; Stanbury et al. 2012; Thacker 2000; Thacker et al. 2012). Public health agencies conduct investigations of public health concerns using one of several methods. The first is a statistical review of cases which focuses on determining if a particular community is experiencing more adverse outcomes than would be expected. A statistical review is usually conducted by linking a health outcome registry to population data and evaluating trends. From the public health perspective, a statistical review is most useful in identifying community needs about health education and awareness building, public health screening services, and other public health interventions. Statistical reviews also are used to identify concerns that need further investigation. These kinds of studies empower the community to make improvements in governmental policymaking and health care services (Kingsley et al. 2007). Another method available to public health practitioners is a community cluster investigation. Community cluster investigations focus on characterizing the size and extent of a population with a known excess of an adverse health outcome and determining potential causal factors (Besag and Newell 1991). The community cluster methodology involves linking many causal variables, usually collected by medical record review, individual surveys or interviews, and biomonitoring, followed by complex statistical analysis to identify the few variables that seem to explain the cluster. Cluster investigations rarely result in important discoveries of causality (Kingsley et al. 2007). Request for Investigation: In June 2013, the Environmental Epidemiology Program (EEP) within the Utah Department of Health (UDOH) received a chain of communication initiated by a Vernal, Utah midwife through the Department of Pediatrics (DOP) at the University of Utah School of Medicine. In this communication, the midwife reported a perceived increase in the incidence of stillbirths. The EEP provided this communication to the TriCounty Health Department (TCHD) which has jurisdiction over Daggett, Duchesne, and Uintah counties, along with an offer to conduct a statistical review of adverse birth outcome (ABO) rates (including stillbirths) for the three counties. Between July and September 2013, with EEP support, the DOP explored the feasibility of conducting an epidemiologic investigation of the perceived stillbirth cluster. The DOP determined that it did not have the ability to accomplish this investigation. In January 2014, the Governor’s Clean Air Action Team (CAAT) contacted the EEP to determine if the EEP could conduct an investigation. The EEP contacted the TCHD to receive authorization to conduct a statistical review. In March 2014, the TCHD Board of Health authorized the investigation but requested the investigation be delayed until data for 2013 could be made available. The 2013 data became available in October 2014. Uintah Basin: The Uintah Basin, located in eastern Utah, is a geologic structural basin formed by the remains of the ancient Uinta Lake during the Tertiary period. The Uintah Basin is fed by creeks and rivers flowing south from the Uinta Mountains to the north. The basin’s landscape is diverse, ranging from the high mountain pines and cedar trees to low desert areas mainly
Adverse Birth Outcomes Statistical Review for TriCounty Health Department March 17, 2015
6
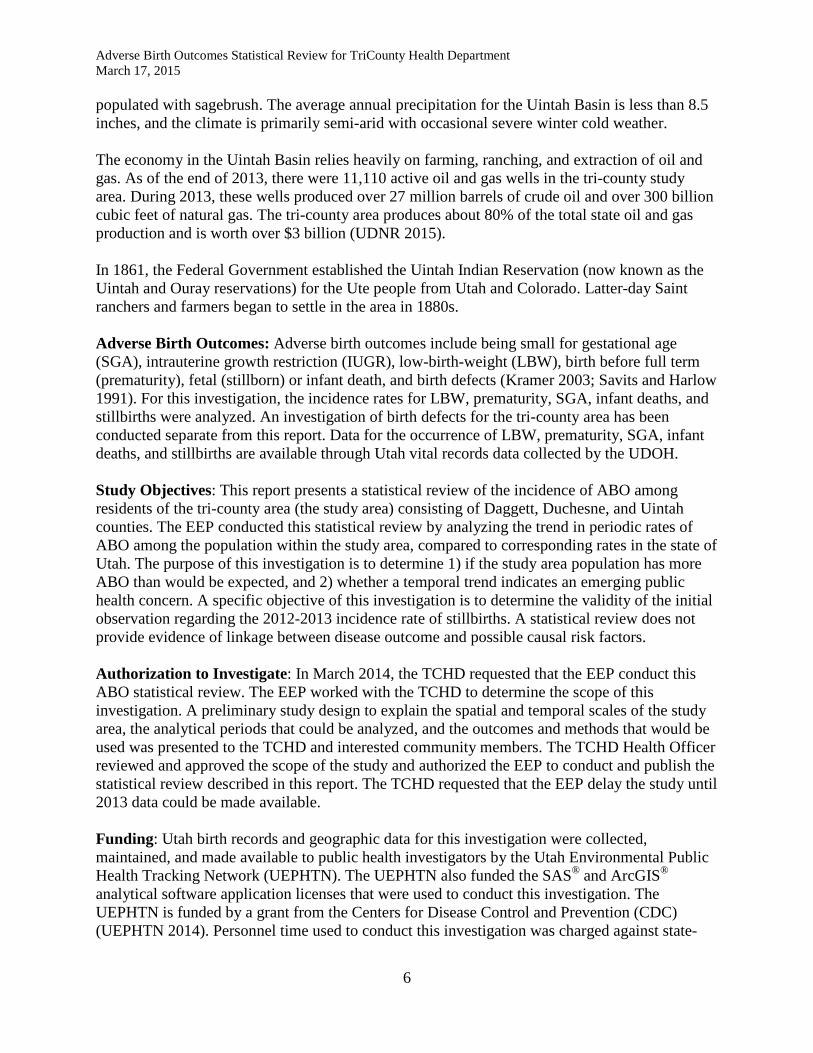
populated with sagebrush. The average annual precipitation for the Uintah Basin is less than 8.5 inches, and the climate is primarily semi-arid with occasional severe winter cold weather. The economy in the Uintah Basin relies heavily on farming, ranching, and extraction of oil and gas. As of the end of 2013, there were 11,110 active oil and gas wells in the tri-county study area. During 2013, these wells produced over 27 million barrels of crude oil and over 300 billion cubic feet of natural gas. The tri-county area produces about 80% of the total state oil and gas production and is worth over $3 billion (UDNR 2015). In 1861, the Federal Government established the Uintah Indian Reservation (now known as the Uintah and Ouray reservations) for the Ute people from Utah and Colorado. Latter-day Saint ranchers and farmers began to settle in the area in 1880s. Adverse Birth Outcomes: Adverse birth outcomes include being small for gestational age (SGA), intrauterine growth restriction (IUGR), low-birth-weight (LBW), birth before full term (prematurity), fetal (stillborn) or infant death, and birth defects (Kramer 2003; Savits and Harlow 1991). For this investigation, the incidence rates for LBW, prematurity, SGA, infant deaths, and stillbirths were analyzed. An investigation of birth defects for the tri-county area has been conducted separate from this report. Data for the occurrence of LBW, prematurity, SGA, infant deaths, and stillbirths are available through Utah vital records data collected by the UDOH. Study Objectives: This report presents a statistical review of the incidence of ABO among residents of the tri-county area (the study area) consisting of Daggett, Duchesne, and Uintah counties. The EEP conducted this statistical review by analyzing the trend in periodic rates of ABO among the population within the study area, compared to corresponding rates in the state of Utah. The purpose of this investigation is to determine 1) if the study area population has more ABO than would be expected, and 2) whether a temporal trend indicates an emerging public health concern. A specific objective of this investigation is to determine the validity of the initial observation regarding the 2012-2013 incidence rate of stillbirths. A statistical review does not provide evidence of linkage between disease outcome and possible causal risk factors. Authorization to Investigate: In March 2014, the TCHD requested that the EEP conduct this ABO statistical review. The EEP worked with the TCHD to determine the scope of this investigation. A preliminary study design to explain the spatial and temporal scales of the study area, the analytical periods that could be analyzed, and the outcomes and methods that would be used was presented to the TCHD and interested community members. The TCHD Health Officer reviewed and approved the scope of the study and authorized the EEP to conduct and publish the statistical review described in this report. The TCHD requested that the EEP delay the study until 2013 data could be made available. Funding: Utah birth records and geographic data for this investigation were collected, maintained, and made available to public health investigators by the Utah Environmental Public Health Tracking Network (UEPHTN). The UEPHTN also funded the SAS® and ArcGIS® analytical software application licenses that were used to conduct this investigation. The UEPHTN is funded by a grant from the Centers for Disease Control and Prevention (CDC) (UEPHTN 2014). Personnel time used to conduct this investigation was charged against state-

Adverse Birth Outcomes Statistical Review for TriCounty Health Department March 17, 2015
7
funded Environmental Health Administrative funds. No federal funds were directly used to conduct this investigation. DATA AND METHODS Study Design: This investigation is a retrospective statistical review of the incidence of ABO among the study area population (defined below). Statistical reviews are not disease cluster investigations, and lack the power to link adverse health concerns to putative risk factors (CDC 1990; Jekel et al. 1996a; Mann 2003). Statistical reviews are a tool used by the EEP to review the health status of a population and assess public health activities. The incidence of ABO, quantified in sequential time periods for each outcome category among the study area population, was compared to an expected ABO incidence derived from the corresponding outcome rates for the state of Utah. The study’s null hypothesis is that the rate of ABO in the study area is not significantly different from the state rate. Decisions about scope and analytical parameters, such as defining the study area, analytical periods, and interpretation thresholds, were made in collaboration with the TCHD. Study Area and Study Population: The study population was defined as all residents living in Daggett, Duchesne, and Uintah counties. The 2013 estimated study area population is 53,661 people (USCB 2014d). The following information characterizes the study area population’s socio-economic and behavioral disparities and consistencies with the state. Measures of percent were tested using a standard z-test method. Median age, family size, and family income were tested using a standard 2-tailed t-test (1 degree of freedom) method. A result was significant when the corresponding p-value was less than 0.01 (99% confidence). Study area measures that are statistically different from the state measure are presented in bold red.
Criteria Daggett County
Duchesne County
Uintah County
Study Area
State of Utah
2013 population (USCB 2014d) 830 19,109 33,722 53,661 2,813,673 Percent of population that are of minority race (USCB 2014d)
3.5% 10.0% 15.9% 13.6% 12.8%
Percent of population that are Hispanic or Latino (USCB 2014d)
4.1% 6.7% 7.5% 7.2% 13.1%
Percent of population that are First Nation People (Native American Indian) (USCB 2014d)
0.5% 4.6% 7.6% 6.4% 1.1%
Percent of population that are foreign born (USCB 2014a)
1.8% 3.0% 3.7% 3.4% 8.2%
Percent of population that are not U.S. citizens (USCB 2014a)
1.8% 1.9% 2.3% 2.1% 5.4%
Percent of population that do not use English as their primary language (USCB 2014a)
1.8% 6.9% 8.6% 7.9% 14.3%

Adverse Birth Outcomes Statistical Review for TriCounty Health Department March 17, 2015
8
Criteria Daggett County
Duchesne County
Uintah County
Study Area
State of Utah
Percent of adults with at least a high school education (USCB 2014a)
86.0% 86.4% 86.2% 86.3% 90.9%
Median age of the population (USCB 2014d)
48.2 29.8 29.7 30.0 29.6
Number of Households (USCB 2014a)
305 6,850 11,007 18,162 886,770
Percent of households that are families (USCB 2014a)
63.9% 80.2% 75.8% 77.3% 75.1%
Percent of households that are single-parent families (USCB 2014a)
40.3% 33.0% 39.1% 36.8% 38.8%
Average family size (USCB 2014a) 2.37 2.74 3.04 2.92 3.12 Average household income (USCB 2014b)
$59,115 $67,241 $71,948 $69,957 $73,717
Percent of population living below poverty (USCB 2014b)
8.6% 8.9% 11.6% 10.6% 12.7%
Percent of adults that are employed (USCB 2014b)
36.4% 57.3% 61.1% 59.3% 63.1%
Percent of employed adults working in jobs with a high risk for chemical exposure (agriculture, construction, manufacturing, military, transportation) (USCB 2014b)
47.6% 41.1% 38.6% 39.5% 24.1%
Percent of housing units that are owner occupied (USCB 2014c)
74.1% 75.9% 75.0% 75.3% 70.1%
Percent of occupied housing units that are heated with dirty fuel (coal, oil, wood, etc.) (USCB 2014c)
18.4% 11.7% 6.6% 8.7% 1.7%
Percent of adult women who smoke (IBIS 2014)
N/A 15.8% 16.5% 15.9% 8.8%
Percent of adult women who consume alcohol (IBIS 2014)
N/A 18.4% 23.6% 22.0% 25.0%
Percent of adult women with a body mass index (BMI) greater than 25 (IBIS 2014)
N/A 44.7% 54.2% 49.7% 51.8%
Percent of population with no health coverage in 2013 (USCB 2014b)
8.7% 15.4% 19.2% 17.7% 14.6%
Percent of population that did not receive a routine medical checkup in the previous year (BISI 2014)
61.3% 40.8% 48.4% 45.5% 39.1%
The study area includes a larger proportion of American First Nations people than the state average. Educationally, the study area is worse off than the state. Economically, the study area is generally worse off than the rest of the state, although the rate of people living below poverty is

Adverse Birth Outcomes Statistical Review for TriCounty Health Department March 17, 2015
9
lower than the state rate. With respect to housing, the study area is better off than the state, with the exception of the percentage of homes that use dirty fuel for heat. Comparison Population: All births of Utah children except those assigned to the study area were used as the comparison population. Children whose mother’s residential address was outside of Utah were excluded from the comparison population. For this investigation, only Utah data was available at the required geographic and temporal scales and with some measurements indicative of intrinsic risk factors. Utah’s birth health status is better than most populations in the United States (Martin et al. 2013). Therefore, comparison of the study area ABO status to that of the rest of the state is appropriate. Vital Birth Records: The UEPHTN maintains a dataset of birth record data on infants born in Utah from 1991 through 2013. These records were obtained from the Office of Vital Records and Statistics (OVRS) within the UDOH. The UEPHTN receives records of all births occurring in Utah on an annual basis. The most recent years of data are not made available to the UEPHTN until they have been finalized. The birth record data includes some birth outcome information such as birth weight, gestational age, demographic characteristics of the parents if known, information about maternal care, information about abnormal pregnancy and birth conditions, and maternal residential address. The residential address information provided by the OVRS includes the city and ZIP code. The UEPHTN geocodes each birth record’s maternal residential address data to obtain an x- and y-coordinate for that address. Using those coordinates, the UEPHTN is able to geo-reference birth record data to their respective U.S. 2010 census areas (UEPHTN 2014). Stillbirth Records: The OVRS maintains a fetal death registry and prepared a file of Utah fetal deaths from 1991 through 2013 for this investigation. This dataset included stillbirths defined as spontaneous abortion of the pregnancy at or after the 22nd week of gestation. The dataset does not include pregnancies that result in miscarriages (spontaneous abortions occurring before the 22nd week of pregnancy), elective terminations of the pregnancy, or other non-viable pregnancies such as ectopic pregnancies. The data included variables about the developmental status of the fetus, demographic characteristics of the parents if known, information about maternal care, information about abnormal pregnancy and birth conditions, and the maternal residential address. These records were similarly geo-referenced to their respective U.S. 2010 census areas. From 1991 through 2013, a total of 1,085,492 pregnancies resulting in live birth or stillbirth among Utah residents were registered with the OVRS. Of these, 18,917 (1.74%) were among mothers who were part of the study area population. These records included pregnancies resulting in 1,080,478 live births and 4,744 stillbirths. Within the study area, there were 18,832 live births and 85 stillbirths during the investigation time period. Vital Death Records: The UEPHTN also receives death records from the OVRS on an annual basis. The death records contain demographic information about the deceased individual, information about the primary and contributing causes of death, and information about the deceased individual’s situation and the health care provided at the time of death. The records also contain residential address information which is used by the UEPHTN to geo-reference the

Adverse Birth Outcomes Statistical Review for TriCounty Health Department March 17, 2015
10
records. Death records for infants who had lived in the study area at the time of their death were cross-referenced with their birth record and evaluated for cause of death. From 1991 through 2013, a total of 5,719 infant deaths (died before first birthday), including 2,923 (51.1%) perinatal deaths (died within seven days of birth), were recorded in Utah. Of the infant deaths, 118 (2.06% of the state total) were among the children born in the study area. Of those, 72 (61.0% of the study area infant deaths) were perinatal deaths. Statewide, 42% were female infants and 58% were male infants. For the study area, 45% of the infant deaths were female and 55% were male. Investigation Exclusion Criteria: The Utah vital records data contains birth registrations for some infants who were born in Utah to mothers who resided out-of-state. The mother’s residential address was used to identify records where the mother most likely lived in Utah during her pregnancy. Mothers with a Utah address or with an unknown address were considered to be Utah residents. Mothers with an out-of-state address were considered to be out-of-state residents. Records for 32,585 out-of-state mothers were excluded from the analysis. Some records had administrative errors. Those errors were either missing information or improbable birth outcome measurements. Improbable birth outcome measurements are birth weights or gestational ages that are highly improbable to be viable births and are more likely recording errors. Records of live births with probable administrative errors were excluded. Multiparity live births (i.e., twins, triplets, etc.) also were excluded. No records of a pregnancy resulting in a stillbirth were excluded regardless of the presence of exclusionary conditions. The following are the criteria and justifications for exclusion for live births:
Criteria Births
excluded Supporting reference Gestational age less than 22 weeks (not likely viable)
3,506 Joseph et al. 2001
Greater than 45 weeks (not likely viable) 1,721 Ananth et al. 2004
Birth weight less than 375 grams (not likely viable)
293 Joseph et al. 2001
Birth weight greater than 4,500 grams (not likely viable)
9,412 Joseph et al. 2001
Sex not recorded 14 Multiparity births 30,721 Ananth et al. 2004; Kramer 2003 Defining Adverse Birth Outcomes: Four ABO were selected as endpoints for this investigation: LBW, premature birth, SGA, and infant deaths (Savits and Harlow 1991). Newborns weighing less than 2,500 grams at birth were considered to be LBW babies. Newborns delivered before the completion of the 38th week of pregnancy (postmenstrual age) were considered premature (Ananth et al. 2004; Hunt 2007; Kramer 2003; Miranda et al. 2009). The definition for SGA is a birth weight in the lowest 10th percentile for gestational age (Ananth et al. 2004; Basso et al. 2005; Lee et al. 2003a; Oken et al. 2003). Utah specific 10th percentile levels
Adverse Birth Outcomes Statistical Review for TriCounty Health Department March 17, 2015
11
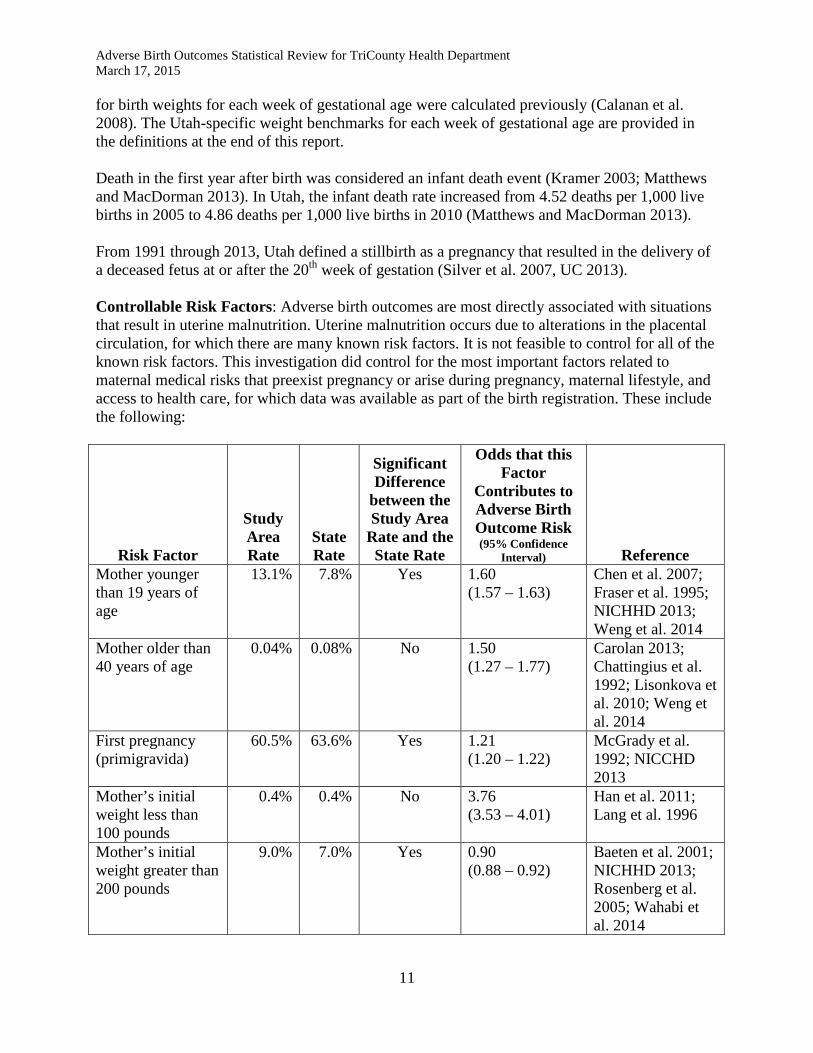
for birth weights for each week of gestational age were calculated previously (Calanan et al. 2008). The Utah-specific weight benchmarks for each week of gestational age are provided in the definitions at the end of this report. Death in the first year after birth was considered an infant death event (Kramer 2003; Matthews and MacDorman 2013). In Utah, the infant death rate increased from 4.52 deaths per 1,000 live births in 2005 to 4.86 deaths per 1,000 live births in 2010 (Matthews and MacDorman 2013). From 1991 through 2013, Utah defined a stillbirth as a pregnancy that resulted in the delivery of a deceased fetus at or after the 20th week of gestation (Silver et al. 2007, UC 2013). Controllable Risk Factors: Adverse birth outcomes are most directly associated with situations that result in uterine malnutrition. Uterine malnutrition occurs due to alterations in the placental circulation, for which there are many known risk factors. It is not feasible to control for all of the known risk factors. This investigation did control for the most important factors related to maternal medical risks that preexist pregnancy or arise during pregnancy, maternal lifestyle, and access to health care, for which data was available as part of the birth registration. These include the following:
Risk Factor
Study Area Rate
State Rate
Significant Difference
between the Study Area
Rate and the State Rate
Odds that this Factor
Contributes to Adverse Birth Outcome Risk (95% Confidence
Interval) Reference Mother younger than 19 years of age
13.1% 7.8% Yes 1.60 (1.57 – 1.63)
Chen et al. 2007; Fraser et al. 1995; NICHHD 2013; Weng et al. 2014
Mother older than 40 years of age
0.04% 0.08% No 1.50 (1.27 – 1.77)
Carolan 2013; Chattingius et al. 1992; Lisonkova et al. 2010; Weng et al. 2014
First pregnancy (primigravida)
60.5% 63.6% Yes 1.21 (1.20 – 1.22)
McGrady et al. 1992; NICCHD 2013
Mother’s initial weight less than 100 pounds
0.4% 0.4% No 3.76 (3.53 – 4.01)
Han et al. 2011; Lang et al. 1996
Mother’s initial weight greater than 200 pounds
9.0% 7.0% Yes 0.90 (0.88 – 0.92)
Baeten et al. 2001; NICHHD 2013; Rosenberg et al. 2005; Wahabi et al. 2014

Adverse Birth Outcomes Statistical Review for TriCounty Health Department March 17, 2015
12
Risk Factor
Study Area Rate
State Rate
Significant Difference
between the Study Area
Rate and the State Rate
Odds that this Factor
Contributes to Adverse Birth Outcome Risk (95% Confidence
Interval) Reference Mother of a minority race or ethnicity (as an indicator of socioeconomic disparity)
10.2% 8.0% Yes 1.61 (1.59 – 1.64)
Blumenshine et al. 2010; Dominguez 2008; McGrady et al. 1992
Inadequate health care and prenatal visits during pregnancy
37.0% 39.0% Yes 0.94 (0.93 – 0.95)
Shy and Brown 1984
Mother used tobacco during pregnancy
16.4% 7.2% Yes 2.42 (2.37 – 2.47)
Andriani and Kuo 2014; Inamdar et al. 2014; Knopik 2009; Minnes et al. 2011; Mund et al. 2013; NICCHD 2013; Pollack et al. 2000; Shu et al. 1995
Mother used alcohol or recreational drugs during pregnancy
1.1% 1.2% No 3.06 (2.82 – 3.33)
NICHHD 2013; Minnes et al. 2011; Miyake et al. 2014; WWDP 2008
Mother experienced diabetes (either preexisting or gestational)
5.0% 2.6% Yes 1.38 (1.34 – 1.42)
NICHHD 2013; Rosenberg et al. 2005; Wahabi et al. 2014
Mother had a chronic or pregnancy induced health condition during pregnancy
44.4% 36.6% Yes 1.58 (1.56 – 1.60)
Lang et al. 1996; NICHHD 2013; Shy and Brown 1984
Mother’s age is at the time of delivery. Mother’s weight is at the time of initial prenatal care visit. In later years, the vital birth record has information to calculate weight gain and BMI, but it was not consistently collected through the whole study period. Mother’s minority race or ethnicity is coded as white non-Hispanic or otherwise. Adequacy of health care is determined by
Adverse Birth Outcomes Statistical Review for TriCounty Health Department March 17, 2015
13
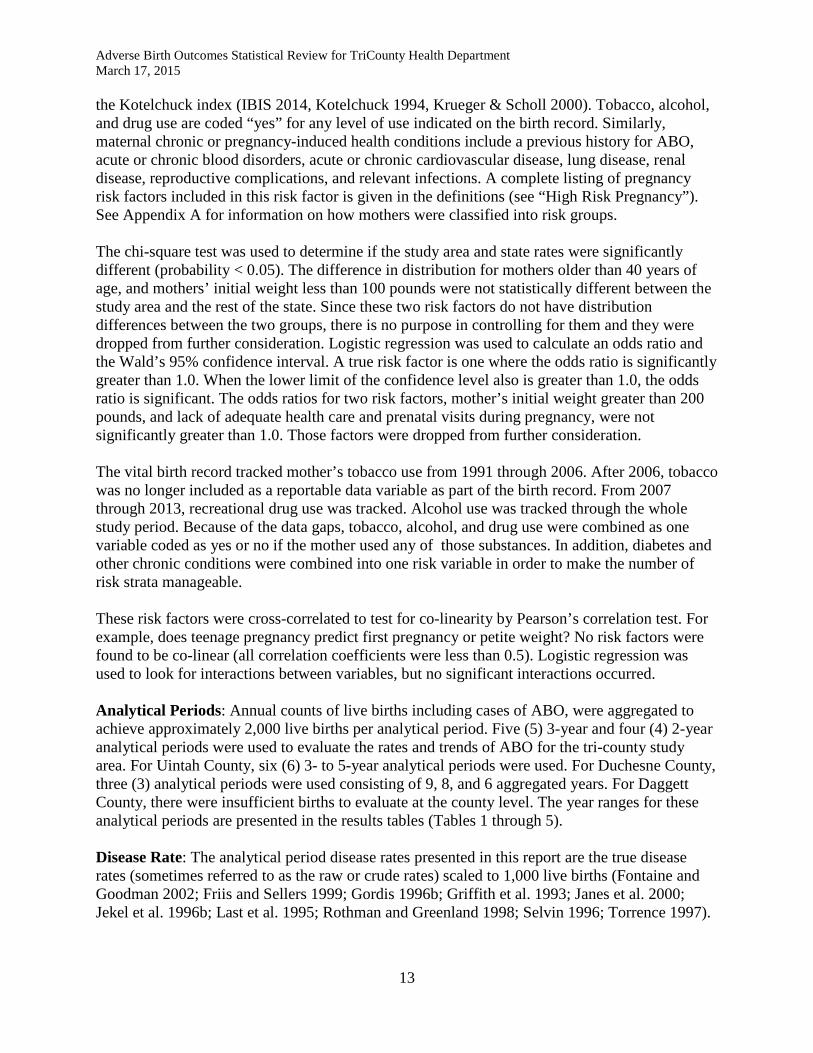
the Kotelchuck index (IBIS 2014, Kotelchuck 1994, Krueger & Scholl 2000). Tobacco, alcohol, and drug use are coded “yes” for any level of use indicated on the birth record. Similarly, maternal chronic or pregnancy-induced health conditions include a previous history for ABO, acute or chronic blood disorders, acute or chronic cardiovascular disease, lung disease, renal disease, reproductive complications, and relevant infections. A complete listing of pregnancy risk factors included in this risk factor is given in the definitions (see “High Risk Pregnancy”). See Appendix A for information on how mothers were classified into risk groups. The chi-square test was used to determine if the study area and state rates were significantly different (probability < 0.05). The difference in distribution for mothers older than 40 years of age, and mothers’ initial weight less than 100 pounds were not statistically different between the study area and the rest of the state. Since these two risk factors do not have distribution differences between the two groups, there is no purpose in controlling for them and they were dropped from further consideration. Logistic regression was used to calculate an odds ratio and the Wald’s 95% confidence interval. A true risk factor is one where the odds ratio is significantly greater than 1.0. When the lower limit of the confidence level also is greater than 1.0, the odds ratio is significant. The odds ratios for two risk factors, mother’s initial weight greater than 200 pounds, and lack of adequate health care and prenatal visits during pregnancy, were not significantly greater than 1.0. Those factors were dropped from further consideration. The vital birth record tracked mother’s tobacco use from 1991 through 2006. After 2006, tobacco was no longer included as a reportable data variable as part of the birth record. From 2007 through 2013, recreational drug use was tracked. Alcohol use was tracked through the whole study period. Because of the data gaps, tobacco, alcohol, and drug use were combined as one variable coded as yes or no if the mother used any of those substances. In addition, diabetes and other chronic conditions were combined into one risk variable in order to make the number of risk strata manageable. These risk factors were cross-correlated to test for co-linearity by Pearson’s correlation test. For example, does teenage pregnancy predict first pregnancy or petite weight? No risk factors were found to be co-linear (all correlation coefficients were less than 0.5). Logistic regression was used to look for interactions between variables, but no significant interactions occurred. Analytical Periods: Annual counts of live births including cases of ABO, were aggregated to achieve approximately 2,000 live births per analytical period. Five (5) 3-year and four (4) 2-year analytical periods were used to evaluate the rates and trends of ABO for the tri-county study area. For Uintah County, six (6) 3- to 5-year analytical periods were used. For Duchesne County, three (3) analytical periods were used consisting of 9, 8, and 6 aggregated years. For Daggett County, there were insufficient births to evaluate at the county level. The year ranges for these analytical periods are presented in the results tables (Tables 1 through 5). Disease Rate: The analytical period disease rates presented in this report are the true disease rates (sometimes referred to as the raw or crude rates) scaled to 1,000 live births (Fontaine and Goodman 2002; Friis and Sellers 1999; Gordis 1996b; Griffith et al. 1993; Janes et al. 2000; Jekel et al. 1996b; Last et al. 1995; Rothman and Greenland 1998; Selvin 1996; Torrence 1997).
Adverse Birth Outcomes Statistical Review for TriCounty Health Department March 17, 2015
14
Standardized Relative Risk Ratio: The statistical analysis program SAS® version 9.3 was used to manage and analyze the data. Birth records were classified as part of the study area or part of the comparison group. Each record was classified for the presence of any of the five ABO. In some situations, a child may have had more than one ABO. For example, it is possible for a child to have a LBW and be born prematurely, but not be SGA. Cases of ABO were coded for all adverse conditions at birth. Total births and cases of each ABO were summarized by year. The relative risk (RR) and associated 95% confidence interval (95% CI) for the RR were calculated using standard methods (Friis and Sellers 1999; Gordis 1996a; Greenland 2004; Greenland and Rothman 1998; Griffith et al. 1993; Jekel et al. 1996a; Kahn and Sempos 1989; Selvin 1996; Torrence 1997). Tables 2 through 5 present the annual RRs for ABO in the study area for all births, as well as for births after excluding non-environmental exposure risks. The RR is a ratio of the disease rate in a study population compared to disease rate for a comparison population. This investigation used the state population (excluding the study population) as the comparison population. The RR for a particular disease such as an ABO in this investigation, is an estimate of the level of risk a population has of developing that disease. A RR less than one (1.0) means that the disease rate in the study population is lower than the rate in the comparison population. Conversely, a RR greater than one means that the study population rate is greater than the comparison population rate. When the rates of disease are the same for both the study and comparison populations, the ratio will equal one (1.0). The 95% CI accounts for the sensitivity and specificity of the rates, and it represents the range of numbers that the reader can be 95% confident will contain the true level of risk. The study population rates and the comparison population rates are seldom exactly the same. The 95% CI is used to assess whether the difference between two similar rates is statistically significant, by determining if the confidence interval includes the value one (1.0). Small sample sizes usually result in a wider interval because of the reduced power of the study. Larger sample sizes usually result in a narrower interval and more power to detect differences (Jekel et al. 1996a; Selvin 1996). See Appendix B for more information on the calculation of the standardized incidence rates and ratios. Interpretation for Meaningful Results: Use of the 95% CI is standard practice in statistical reviews of health data. The 95% CI suggests that there is a 1 in 20 chance (5%) of incorrectly determining a RR is significantly elevated when this is truly caused by random variation within the data. This investigation reports the results of 45 RR calculations for the tri-county study area, 30 calculations for Uintah County, and 15 calculations for Duchesne County, one for each analytical period for each ABO. Within these 90 calculations, one would expect that at least four (5% of 90) results would be incorrectly evaluated. To better understand which RRs are truly statistically significant and which are part of the random variation in the data, the EEP applies a set of interpretive rules for meaningful results (Abrams et al. 2013; CDC 1990). These rules are: • The occurrence of two or more consecutive analytical periods with statistically significant
RRs suggests a low level chronic temporal cluster of disease (Bender et al. 1990; Hardy et al. 1990).
• The statistical power is at least 80%. Statistical power is a measure of the ability to correctly distinguish statistical significance from random variation. This investigation used the method

Adverse Birth Outcomes Statistical Review for TriCounty Health Department March 17, 2015
15
recommended by Beaumont to estimate power (Beaumont and Breslow 1981). A power level of 80% or higher is an acceptable level (Abrams et al. 2013; Park 2010).
• The last analytical period’s RR is statistically significant. An elevated RR in the final analytical period of the study may indicate an emerging problem that could have been found if future years of data were available. This situation suggests that another investigation should be conducted after a few more years of data are available (Hardy et al. 1990).
Results Suppression: The EEP is required to protect confidential data from unlawful disclosure and consequently suppresses results for analytical time periods containing three or fewer cases (UDOH 2009). Trend Analysis: The Kendall-Stuart Tau-c (or Kendall rank correlation coefficient) test for trend was used to assess temporal trends of increasing or decreasing ABO rates (Kendall 1938; Stuart 1953). The Kendal-Stuart Tau-c statistic is an appropriate method to investigate trends when there are fewer than 30 analytical periods. This method produces a correlation coefficient, the Tau-c, with a value range from -1 to +1. A negative valued Tau-c indicates a decreasing trend in the incidence rates with time, a positive value indicates an increasing trend, and a value near zero indicates no trend. A trend is statistically significant when the p-value ≤ 0.05. For this investigation, achieving that level of significance requires the Tau-c value to be equal to or more extreme than ± 0.80. FINDINGS Annually, about 16% (range = 15.8 - 18.2%) of Utah pregnancies and 20% (range = 16.5 – 24.3%) of the tri-county study area pregnancies result in an ABO. The state annual rates and study area annual rates for ABO are statistically different by Student’s t-test (p < 0.0001). The state ABO rate has been consistent for the last 10 years. The analytical results for the study area for each of the five ABO are presented in Tables 1, 2, 3, 4, and 5. Statistically significant elevated or lower RRs are indicated with an “S” followed by the direction (“elevated” or “lower”) and the power. In comparing results, it is important to keep in mind that RRs indicating a risk lower than the state level are bounded between zero (0) and one (1), whereas elevated RRs are bounded between one (1) and infinity (∞). Because of this bounding difference, the statistical power levels may not correspond to the perceived degree of lowness or highness. Hence, an elevated RR with a lower confidence limit of 1.09 (i.e., 0.09 units higher) may have a power level of 66% (not meaningful), whereas a low RR with an upper confidence limit of 0.97 (i.e., 0.03 units lower) may have a power level of 100%. Tri-County Study Area: Low-birth-weight Infants: Between 1991 and 2013, 1,210 babies were born with LBW out of a total of 18,832 live births. The cumulative (1991-2013) rate of 64.3 LBW babies per 1,000 live births is higher than the state rate of 61.6 LBW babies per 1,000 live births, but the difference is not statistically significant (RR = 1.04, 95% CI = 0.99 – 1.10). Two analytical periods (1991-1993 and 2006-2007) had statistically elevated rates, but were not meaningful. One period
Adverse Birth Outcomes Statistical Review for TriCounty Health Department March 17, 2015
16
(1997-1999) had a significantly lower rate than expected. Trend analysis indicated that the study area rates were consistent through the study period. More results are shown in Table 1. Premature Births: Between 1991 and 2013, 1,702 babies were born prematurely out of a total of 18,832 live births. The cumulative (1991-2013) rate of 90.4 premature babies per 1,000 live births is slightly higher than the state rate of 87.3 premature babies per 1,000 live births, but the difference is not statistically significant (RR = 1.04, 95% CI = 0.99 – 1.09). Two analytical periods (1991-1993 and 2008-2009) had statistically elevated rates, but were not meaningful. One period (1997-1999) had a significantly lower rate than expected. Trend analysis indicated that the study area rates were consistent through the study period. More results are shown in Table 2. Small-for-Gestational-Age Births: Between 1991 and 2013, 2,135 babies were born SGA out of a total of 18,832 live births. Some of these babies were also low-birth-weight or preterm birth babies. The cumulative (1991-2013) rate of 113.4 SGA babies per 1,000 live births is significantly higher than the state rate of 102.4 SGA babies per 1,000 live births (RR = 1.11, 95% CI = 1.06 – 1.15). Three analytical periods (1991-1993, 2000-2002, and 2008-2009) had statistically elevated rates. Two of those periods (1991-1993 and 2008-2009) had sufficient power to be meaningful. Trend analysis indicated that the study area rates were generally declining through the study period (p = 0.01). More results are shown in Table 3. Infant Deaths: Between 1991 and 2013, 118 infants died before the age of one year out of a total of 18,832 live births. The cumulative (1991-2013) rate of 6.3 infant deaths per 1,000 live births is statistically higher than the state rate of 4.3 infant deaths per 1,000 live births (RR = 1.44, 95% CI = 1.19 – 1.73). One analytical period (1994-1996) had a statistically elevated and meaningful rate. Trend analysis indicated that the study area rates were consistent through the study period. More results are shown in Table 4. Causes of Infant Death: The causes of infant death are listed in Table 6. Causes of death were grouped into four categories. Developmental or genetic defects at the time of birth account for 58% (68 of 118) of the infant deaths. Complications and injuries occurring at the time of birth account for 22% (26 of 118) of the infant deaths. Infections account for 9% (11 of 118) of the infant deaths. Injuries, including accidental or deliberate trauma and exposure to toxic chemicals (chemical injuries), account for 11% (13 of 118) of the infant deaths. Stillbirths: Between 1991 and 2013, a total of 85 stillbirths occurred along with the 18,832 live births. The cumulative (1991-2013) rate of 4.5 stillbirths per 1,000 live births is statistically and meaningfully lower than the state rate of 7.0 stillbirths per 1,000 live births (RR = 0.56, 95% CI = 0.45 – 0.70, power = 99%). Three early analytical periods (covering 1994-2003) were statistically lower than what would have been expected based on the state rate. The final analytical period (2012-2013) is the only period that is higher than would be expected based on the state rate but is not statistically significant (RR = 1.23, 95% CI = 0.65 – 2.10). Trend analysis indicated no significant change in the rates through the study period. More results are shown in Table 5.
Adverse Birth Outcomes Statistical Review for TriCounty Health Department March 17, 2015
17
Causes of Stillbirth: The primary cause of stillbirth was recorded for 61 of the 85 cases that occurred in the tri-county study area. Of the 61 cases, 45 (73.8%) resulted from a complication at birth. All of the complications involved the cord or placenta. Seven (11.5%) cases of stillbirth resulted from developmental anomalies. Most these anomalies included problems with the development of the brain, gonads, heart, kidneys and diaphragm. Two (3.3%) cases were related to a genetic syndrome (Edward’s syndrome and Patau’s syndrome). Six (7.1%) were the result of a pre-existing maternal health condition such as maternal diabetes. One case (1.6%) was the result of hydrops fetalis due to Rh-factor sensitivity. Uintah County: Low-birth-weight Infants: Between 1991 and 2013, 840 babies were born with LBW out of a total of 12,998 live births. Two analytical periods (1991-1995 and 2005-2007) had statistically elevated rates, but were not meaningful. Trend analysis indicated that the study area rates were consistent through the study period. More results are shown in Table 1. Premature Births: Between 1991 and 2013, 1,208 babies were born prematurely out of a total of 12,998 live births. No analytical period’s rate was statistically different from what was expected based on the corresponding state rate. Trend analysis indicated that the study area rates were consistent through the study period. More results are shown in Table 2. Small-for-Gestational-Age Births: Between 1991 and 2013, 1,476 babies were born SGA out of a total of 12,998 live births. Some of these babies were also low-birth-weight or preterm birth babies. Three analytical periods (1991-1995, 2005-2007, and 2008-2010) had statistically elevated rates. Two of those periods (1991-1995 and 2008-2010) had sufficient power to be meaningful. Additionally, the 2005-2007 and 2008-2010 analytical periods were consecutive. This may indicate a meaningful cluster of SGA babies that has since resolved. Trend analysis indicated that the study area rates were consistent through the study period. More results are shown in Table 3. Infant Deaths: Between 1991 and 2013, 75 infants died before the age of one year out of a total of 12,998 live births. No analytical period had statistically elevated rates. However, all rates were persistently above 1.0. Trend analysis indicated that the study area rates were consistent through the study period. More results are shown in Table 4. Stillbirths: Between 1991 and 2013, a total of 54 stillbirths occurred along with the 12,998 live births. The earliest three analytical period rates, covering 1991-2004, were statistically lower than what would have been expected based on the state rate. One period (2005-2007) had a higher rate than would be expected based on the corresponding state rate, but the difference is not statistically significant. Trend analysis indicated that the study area rates were consistent through the study period. More results are shown in Table 5.

Adverse Birth Outcomes Statistical Review for TriCounty Health Department March 17, 2015
18
Duchesne County: Low-birth-weight Infants: Between 1991 and 2013, 357 babies were born with LBW out of a total of 5,620 live births. No analytical period’s rate was statistically different from what was expected based on the corresponding state rate. More results are shown in Table 1. Premature Births: Between 1991 and 2013, 482 babies were born prematurely out of a total of 5,620 live births. No analytical period’s rate was statistically different from what was expected based on the corresponding state rate. More results are shown in Table 2. Small-for-Gestational-Age Births: Between 1991 and 2013, 637 babies were born SGA out of a total of 5,620 live births. Some of these babies were also low-birth-weight or preterm birth babies. The last analytical period (2008-2013) had a statistically elevated but not meaningful rate. More results are shown in Table 3. Infant Deaths: Between 1991 and 2013, 42 infants died before the age of one year out of a total of 5,620 live births. Between 2000-2007, the rate of infant death in Duchesne County was elevated but lacked power. The rates for all periods were above 1.0. Trend analysis indicated that the study area rates were consistent through the study period. More results are shown in Table 4. Stillbirths: Between 1991 and 2013, a total of 31 stillbirths occurred along with the 5,620 live births. Between 2000-2007 the rate of stillbirths in Duchesne County was significantly and meaningfully lower than what would be expected based on the state rate. However, the period covering 2008-2013, the rate was higher than the state rate, but not significantly higher. More results are shown in Table 5. Trend Analysis: Trend analysis was not conducted because only three analytical periods were used to investigate ABO activity in Duchesne County. Other Observations: This investigation presents 45 analyses (9 analytical periods for each of the 5 categories of ABO) of rates and the comparisons of those rates to corresponding state rates. From an observational perspective the EEP found that approximately 64% of the ABO-analytical period combinations (29 of 45) were above the corresponding state rates. Roughly 18% (8 of 45) were statistically significant and 7% (3 of 45) were also meaningful. The rate of preterm births, LBW babies, and SGA babies in the last analytical period for the study area (2012-2013) appear to be downward trending from the previous analytical period. Infant death rates for the study area appear to be consistently, although non-significantly, higher than the corresponding state rates for all periods except the first. Stillbirth rates had historically been significantly below the corresponding state rates. During the last analytical period, the tri-county area stillbirth rate rose to match the state rate. DISCUSSION Public Health Importance of Adverse Birth Outcomes: The consequences of ABO (LBW, preterm, and SGA) on the child’s health and wellbeing during childhood and into adulthood are
Adverse Birth Outcomes Statistical Review for TriCounty Health Department March 17, 2015
19
well established. Adverse birth outcomes have been associated with increased risk for adult obesity, insulin resistance, type-2 diabetes (non-insulin-dependent diabetes), poor lung function, asthma, bronchopulmonary dysplasia, cardiovascular disease, and end-stage renal disease (Ali and Greenough 2012; Barker 2004, 2006; Barker et al. 2002; Berends and Ozanne 2012; Calkins and Devaskar 2011; de Bie et al. 2010; Doyle and Anderson 2010; Duijts 2012. Godfrey and Barker 2001; Greenough 2008; Henderson and Warner 2012; Newnham 1998; Ong and Dunger 2002; Parsons et al, 1999; Signorello and Trichopoulos 1998; Terauchi et al. 2000; Wang et al. 2012; Whincup et al. 2008). Adverse birth outcomes also have been associated with increased risk of children experiencing decreased intelligence; behavioral and learning difficulties in school; minor motor and coordination problems; and depression. Some of these concerns do not persist into adulthood, but the consequences of school year problems may limit future opportunities (Aarnoudse-Moens et al. 2009; Cooke 2004; Dahl et al. 2006; de Bie et al. 2010; Wojcik et al. 2013; Zwicker and Harris 2008). Birth with these conditions may influence an individual’s subsequent fertility and reproductive health (Kondapalli and Perales-Puchalt 2013; Sydsjo 2011). There is some evidence that a child’s birth conditions may have transgenerational effects (Gallo et al. 2012; Painter et al. 2008). In Utah, the immediate cost for the post-health care of a child with an ABO is estimated to be at least six times higher than the average cost of a child born with normal birth weight and gestational age (Betit 1999). Risk Factors for Adverse Birth Outcomes: The causal factors discovered so far in the literature for ABO are many and varied. It is not feasible to list all of the known risk factors here. This discussion provides a brief overview of some of the risk factors that have been associated with ABO. The most important are socio-economic factors; maternal medical risk factors that preexist pregnancy or arise during pregnancy; and maternal lifestyles. Some risk factors are intrinsic and thus not controllable, including genetic factors such as race or ethnicity, certain genetic syndromes that influence maternal size at the beginning of pregnancy, and the ability to process and provide nutrition to the growing fetus. First pregnancies, young age (teenage) pregnancies, or multiparity pregnancies are also intrinsic factors that are not controllable once pregnancy has started (Ananth et al. 2004; Chen et al. 2007; Fraser et al. 1995; Kramer 2003; Lisonkova et al. 2010). Other risk factors are extrinsic and controllable, sometimes with financial assistance. Extrinsic factors for ABO include lack of access to proper prenatal care and nutrition, starvation, low gestational weight gain, and unhealthy life choices (i.e., smoking) (Kramer 2003; Meng et al. 2013; Miranda et al. 2009; Morello-Frosch and Shenassa 2006; Ponce et al. 2005; Ricciardi and Guastadisegni 2003). Tobacco use is a particularly well-documented extrinsic risk factor (Infant-Rivard et al. 2006; Kharrazi et al. 2004; Kramer 2003; Miranda et al. 2009; Misra et al. 2005). Coffee consumption during pregnancy may also contribute to some ABO, most likely because coffee suppresses the appetite (Bech et al. 2005). Medical risk factors may be known prior to pregnancy and therefore be manageable or they may arise during pregnancy. There are many maternal medical risk factors for ABO, including a prior history of ABO, diabetes, gestational diabetes, pregnancy-induced hypertension, eclampsia, toxemia, the acquisition of certain infectious diseases, and genital tract infections (Anderson et al. 2005; Kramer 2003).

Adverse Birth Outcomes Statistical Review for TriCounty Health Department March 17, 2015
20
The statistical review methodology does not quantify the linkage of ABO to possible causal risk factors. This investigation controlled for the intrinsic causal risk factors. Environmental risk factors such as exposures to hazardous chemicals were not controlled for. Specific environmental factors, hazardous chemicals of concern, and exposure risk are not addressed by this report. Environmental risk factors for ABO, predominately exposures to hazardous pollution, indicate increased risk, although there is some disagreement. The volume of literature addressing environmental risks is indicative of the complexity of environmental exposure factors and the inability of studies to demonstrate conclusive findings (Maisonet et al. 2004; Malmqvist et al. 2011; Ponce et al. 2005; Sram et al. 2005). The most studied environmental exposure risk for ABO is air pollution. Air pollution has been extensively investigated both by specific substances (i.e., carbon monoxide [CO], nitrogen oxides [NOX], sulfur oxides [SOX], ozone [O3], particulate matter [PM], etc.) as well as by source (i.e., traffic-related air pollution, landfills, hazardous waste sites, etc.) (Backes et al. 2013; Barnett et al. 2011; Bauer et al. 2008; Bell et al. 2007; Darrow et al. 2011; de Medeiros et al. 2009; Dugandzic et al. 2006; Elliott et al. 2001; Gilboa et al. 2005; Hwang and Jaakkola 2008; Lee et al. 2003b; Lepeule et al. 2010; Liu et al. 2003; Malmqvist et al. 2011; Maroziene and Grazuleviciene 2002; Miranda et al. 2009; Olsson et al. 2013; Parker et al. 2005, 2008; Pearce et al. 2012; Ponce et al. 2005; Proietti et al. 2013; Rankin et al. 2009; Rich et al. 2009; Ritz et al. 2002; Rogers and Dunlop 2006; Rogers et al. 2000; Salem et al. 2005, 2007; Van den Hooven et al. 2009; Wilhelm et al. 2011; Wilhelm and Ritz 2003, 2005; Woodruff et al. 2003; Wu et al. 2009; Yorifuji et al. 2011). Those studies have found very small associations between ABO and the studied exposure, although there are some contradictions in the results (Glinianaia et al. 2004; Hansen et al. 2009; Langlois et al. 2009; Rogers et al. 2006). The low amount ABO risk that can be attributed to air pollution exposure, compared to intrinsic, extrinsic, and medical risk factors suggests that these environmental risk factors are not likely to be very important to overall community health with respect to ABO rates (Morello-Frosch et al. 2010). Maternal exposure to water contaminated with hazardous chemicals has been investigated also with mixed results (Bove et al. 2002; Coleman et al. 2011; Dodds et al. 2004; Hoffman et al. 2008a, 2008b; Miranda et al. 2009; Nieuwenhuijsen et al. 2000; Sagiv et al. 2007; Shaw et al. 2003). Heavy metals have been associated with ABO, usually with small sex-specific effects, and are thought to be more important for developmental disabilities than for growth retardation (Hopenhayn et al. 2003; Milton et al. 2005; Miranda et al. 2009; Zhu et al. 2010; Zota et al. 2009). Exposure to pesticides is also a documented risk factor for some ABO (Miranda et al. 2009). Maternal diet can result in exposure to environmental contaminants, including dioxins and dioxin-like compounds. Studies have found that fetal exposure to dioxins may contribute to small, non-significant reductions in gestational age and birth weight (Eskenazi et al. 2003; Papadopoulou et al. 2013, 2014; Vafeiadi et al. 2014; Wesselink et al. 2014). Prenatal dioxin exposure has been associated with subtle developmental changes in liver function, respiratory system health, thyroid function, immune cell levels, and decreased performance in tests of learning and intelligence (Boersma and Lanting 2000; Gascon et al. 2013; Glynn et al. 2008; Holladay 1999; Lundqvist et al 2006; Tusscher et al. 2008; Vreugdenhil et al. 2002). However, many of these studies are confounded by the concomitant exposure to other organochlorine
Adverse Birth Outcomes Statistical Review for TriCounty Health Department March 17, 2015
21
compounds. Not all studies were able to find these associations (Giacomini et al. 2006). Dioxins also have been associated in delayed breast development in women who experienced fetal exposure (Leijs et al. 2008). Dioxins can be present in the mother’s milk. However, the nutrients and nurturing of breastfeeding appears to offer unique protections from dioxins’ adverse effects (Boersma and Lanting 2000). Birth Defects: Birth defects are another type of adverse birth outcome. A birth defect that is observable at the time of birth is noted on the birth record. However, the birth record is not a complete or accurate mechanism for conducting statistical reviews of birth defects. For this reason, birth defects were not included in this investigation. The Utah Birth Defects Network (UBDN), a program within the UDOH, maintains a registry of children born in Utah with major structural birth defects. The UBDN in conjunction with their University of Utah collaborators have prepared a separate report about birth defects in the study area. A copy of the UBDN report for the tri-county study area is attached as Appendix C. Disease Burden: Another useful consideration is the burden the ABO poses on the study population (Hessel 2008). The burden of disease is difficult to quantify, though it is represented in part by the magnitude of the RR. The RR is a measure of how much more disease is occurring in the study population than in the comparison population (Selvin 1996). The other, more difficult component of the burden concept is the impact the health concern has on the individual. Health impacts can range from slight annoyance or discomfort to severe disability, or even early death. A few individuals in a population suffering severe impacts are as meaningful as a large percentage of a population suffering minor impacts. In addition to the health and wellness effects, disease burden impacts include health care financial costs, lost opportunities, and other quality-of-life factors (Hessel 2008). Limitations: The public often wants public health investigations to determine if the risk for community health concerns can be linked to a putative environmental hazard. The methodology used in this investigation does not have the capability to definitively link the study area’s ABO rates to any inherent or external risk factors, including environmental exposures. There are a number of limitations that impede this linkage. These kinds of statistical reviews are based on annual incidence data reported to UDOH as part of vital birth records. There is seldom any knowledge about the frequency, duration, or intensity of exposure to putative environmental hazards. It may not be possible to control for more important intrinsic and extrinsic risk factors using vital birth records. For small populations, the incidences of adverse health concerns have a tendency to manifest as arbitrary clusters. This propensity is a common phenomenon encountered when investigating the rate of rare diseases in a small population. Overcoming these limitations usually requires a comprehensive assessment of individual risk supported by a clear and consistent trend of elevated rates for a population. An investigation that uses population-based summary data rather than individual-level data, such as this report, is called an ecologic study by epidemiologists. An interpretation error commonly associated with ecologic investigations is to apply population-level risk findings to the individual. This kind of interpretation error is called an “ecologic fallacy.” For example, this study found the risk of low-birth-weight infants in 1997 to be 1.38 times higher for the study population than for the state. This risk metric should not be applied to individuals, as an
Adverse Birth Outcomes Statistical Review for TriCounty Health Department March 17, 2015
22
individual may have no risk or a risk several times higher than the population risk based on the individual’s genetic makeup, behaviors, susceptibility, and environmental exposures (Greenland 2001; Greenland and Robins 1994; Izquierdo and Schoenbach 2000; Morgenstern 1982, 1995; Rockhill 2005). CONCLUSIONS AND RECOMMENDATIONS Overall Finding: From a statistical perspective, the EEP found that the tri-county study area had a significant and meaningful past problem with SGA births. This problem does not seem to have persisted. The EEP did not find evidence of any other consistent patterns of increased risk for ABO among the population within the study area when compared to the remainder of the state. From an observational perspective this investigation found evidence of public health concerns regarding infant deaths and stillbirths in the tri-county study area. If the study area were more populated – thus gaining statistical power – the analyses of the infant death and stillbirth rates might have statistically concluded that these two outcomes represent public health concerns. From a local perspective, these findings should be concerning, particularly if these patterns persist. Response to Public Concern: This investigation presents findings primarily from a perspective that employs statistics to identify areas of concern relative to other state public health priorities. From that state and statistical-centric perspective, this investigation determined that the study area population did not have more ABO that would be expected based on corresponding state rates. Typical of small area studies there is some variation. In addition, this investigation did not find evidence in the temporal trends of ABO indicative of an emerging public health concern. However, as discussed above, the state’s statistically-oriented perspective does not account for all of the observable patterns. From an observational and local perspective, some of the findings suggest an overall decline in reproductive and neonatal health and wellbeing in the study area. This investigation did confirm the validity of the initial observations that the incidence of stillbirths in the tri-county area during the 2012-2013 time period was higher than historically observed for that region. Recommendations: The EEP recommends that community advocates, political leaders, and policy-makers use this report as a tool to empower public health policy regarding pregnancy in the tri-county area. This report is suggestive of possible public health concerns that may warrant further investigation. Communities and political leaders should evaluate the feasibility of seeking a robust investigation into the causality of ABO in the tri-county study area. The EEP recommends that the TCHD coordinate with the UDOH Maternal and Infant Health Program (MIHP) to conduct a review of infant mortalities due to perinatal conditions and to evaluate current local programs aimed at improving pregnancy and infant health outcomes. The MIHP may be able to offer additional resources for the programs already established at TCHD.
Adverse Birth Outcomes Statistical Review for TriCounty Health Department March 17, 2015
23
The EEP further recommends that the TCHD, local hospitals, and obstetrics and gynecology clinics build upon and make available the list of services provided in Table 7. Finally, the EEP recommends that the TCHD request the UDOH or the EEP conduct a follow-up adverse birth outcome statistical review in 2 and 4 years. The first follow-up investigation will be useful to determine whether the stillbirth pattern presented in this report is a statistical artifact or a true emerging public health problem. The second investigation will be useful to monitor the effectiveness of intervention activities implemented after this report.
Adverse Birth Outcomes Statistical Review for TriCounty Health Department March 17, 2015
24
AUTHORSHIP, REVIEW AND CITATION This report was prepared by: Sam LeFevre Environmental Epidemiology Program Bureau of Epidemiology Utah Department of Health Mail: PO Box 142104, Salt Lake City, Utah 84114-2104 Street: 288 North 1460 West, Salt Lake City, Utah 84116 Phone: (801) 538-6191 Fax: (801) 538-6564 Email: [email protected] Participating Investigators: Greg Williams, MPH Craig Dietrich, PhD, DABT Nathan LaCross, PhD, MPH Alexander Barney Certifying Reviewers: Cristie Chesler Director, Bureau of Epidemiology Utah Department of Health Allyn K Nakashima, MD State Epidemiologist Utah Department of Health Wu Xu, PhD Director, Center for Health Data Utah Department of Health Recommended Citation: Environmental Epidemiology Program. Adverse Birth Outcomes Statistical Review Investigating TriCounty Health Department Study Area (Daggett, Duchesne and Uintah Counties), Utah, 1991 - 2013. March 17, 2015. Salt Lake City, UT: Utah Department of Health.
Adverse Birth Outcomes Statistical Review for TriCounty Health Department March 17, 2015
25
CERTIFICATION This report titled “Adverse Birth Outcomes Statistical Review Investigating TriCounty Health Department Area (Daggett, Duchesne and Uintah Counties), Utah, 1991 - 2013” was prepared by the Environmental Epidemiology Program, Utah Department of Health. This report covers an investigation of adverse birth outcomes (low-birth-weight, premature birth, small-for-gestational age, and infant death) using standard and approved methodology and procedures existing at the time the investigation herein reported was begun. Editorial and technical review was completed by Utah Department of Health certifying reviewers and program partners. Approved by:
Adverse Birth Outcomes Statistical Review for TriCounty Health Department March 17, 2015
26
REFERENCES Web links for citations of government or organizational websites may wrap onto multiple lines. Aarnoudse-Moens CS, Weisglas-Kuperus N, van Goudoever JB, Oosterlaan J. 2009. Meta-analysis of neurobehavioral outcomes in very preterm and/or very low-birth-weight children. Pediatrics 124(2):717-728. Abrams B, Anderson H, Blackmore C, Bove FJ, Condon SK, Eheman CR, Fagliano J, Haynes LB, Lewis LS, Major J, McGeehin MA, Simms E, Sircar K, Soler J, Stanbury M, Watkins SM, Wartenberg D. 2013. Investigating suspected cancer clusters and responding to community concerns: guidelines from CDC and the Council of State and Territorial Epidemiologists. Morbidity and Mortality Weekly Report – Recommendations and Reports 62(RR08):1-14. Ali K, Greenough A. 2012. Long-term respiratory outcome of babies born prematurely. Therapeutic Advances in Respiratory Disease 6(2):115-120. Ananth CV, Balasubramanian B, Demissie K, Kinzler WL. 2004. Small-for-gestational-age births in the United States: an age-period-cohort analysis. Epidemiology 15(1):28-35. Anderson JL, Waller DK, Canfield MA, Shaw GM, Watkins ML, Werler MM. 2005. Maternal obesity, gestational diabetes, and central nervous system birth defects. Epidemiology 16(1):87-92. Andriani H, Kuo H. 2014. Adverse effects of parental smoking during pregnancy in urban and rural areas. BMC Pregnancy and Childbirth 14(1):1210. Backes CH, Nelin T, Gorr MW, Wold LE. 2013. Early life exposure to air pollution, how bad is it? Toxicology Letters 216(1):47-53. Baeten JM, Bukusi EA, Lambe M. 2001. Pregnancy complications and outcomes among overweight and obese nulliparous women. American Journal of Public Health 91(3):436-440. Barker DJ. 2004. The developmental origins of adult disease. Journal of the American College of Nutrition 23(Suppl 6):588S-595S. Barker DJ. 2006. Adult consequence of fetal growth restriction. Clinical Obstetrics and Gynecology 49(2):270-283. Barker DJ, Eriksson JG, Forsén T, Osmond C. 2002. Fetal origins of adult disease: strength of effects and biological basis. International Journal of Epidemiology 31(6):1235-1239. Barnett AG, Plonka K, Seow WK, Wilson LA, Hansen C. 2011. Increased traffic exposure and negative birth outcomes: a prospective cohort in Australia. Environmental Health 10:26.
Adverse Birth Outcomes Statistical Review for TriCounty Health Department March 17, 2015
27
Basso O, Frydenberg M, Olsen S, Olsen J. 2005. Two definitions of "small size at birth" as predictors of motor development at six months. Epidemiology 16(5):657-663. Bauer M, Lencar C, Tamburic L, Koehoorn M, Demers P, Karr C. 2008. A cohort study of traffic-related air pollution impacts on birth outcomes. Environmental Health Perspectives 116(5):680-686. Beaumont JJ, Breslow NE. 1981. Power considerations in epidemiologic studies of vinyl chloride workers. American Journal of Epidemiology 114(5):725-734. Bech BH, Nohr EA, Vaeth M, Henriksen TB Olsen J. 2005. Coffee and fetal death: a cohort study with prospective data. American Journal of Epidemiology 162(10):983-990. Bell ML, Ebisu K, Belanger K. 2007. Ambient air pollution and low-birth-weight in Connecticut and Massachusetts. Environmental Health Perspectives 115(7):1118-1125. Bender AP, Williams AN, Johnson RA, Jagger HG. 1990. Appropriate public health response to clusters: the art of being responsibly responsive. American Journal of Epidemiology 132(Suppl 1):S48-S52. Berends LM, Ozanne SE. 2012. Early determinants of type-2 diabetes. Best Practices in Research: Clinical Endocrinology and Metabolism 26(5):569-580. Besag J, Newell J. 1991. The detection of clusters of rare disease. Journal of the Royal Statistical Society, Part A 154:143-155. Betit RL. 1999. Report on low-birth-weight in Utah. Salt Lake City, UT: Utah Department of Health. Information: http://health.utah.gov/mihp/pdf/lbw.pdf [accessed February 11, 2015]. Blumenshine P, Egerter S, Barclay CJ, Cubbin C, Braveman PA. 2010. Socioeconomic disparities in adverse birth outcomes: a systematic review. American Journal of Preventive Medicine 39(3):263-272. Boersma ER, Lanting CI. 2000. Environmental exposure to polychlorinated biphenyls (PCBs) and dioxins. Consequences for longterm neurological and cognitive development of the child lactation. Advances in Experimental Medicine and Biology 478:271-287. Bove F, Shim Y, Zeitz P. 2002. Drinking water contamination and adverse pregnancy outcomes: a review. Environmental Health Perspectives 110(Suppl 1):61S-74S. Calanan RM, LeFevre SD, Rolfs RT, Friedrichs M. 2008. Residential proximity to traffic pregnancy outcomes by sex – Utah, 2000-2005. Atlanta, GA: 2008 EIS Conference. Calkins K, Devaskar SU. 2011. Fetal origins of adult disease. Current Problems in Pediatric and Adolescent Health Care 41(6):158-176.

Adverse Birth Outcomes Statistical Review for TriCounty Health Department March 17, 2015
28
Carolan M. 2013. Maternal age ≥45 years and maternal and perinatal outcomes: a review of the evidence. Midwifery 29(5):479-489. CDC (Centers for Disease Control and Prevention). 1990. Guidelines for investigating clusters of health events. Morbidity and Mortality Weekly Report – Recommendations and Reports 39(RR-11):1-16. Chattingius S, Forman MR, Berendes HW, Isotalo L. 1992. Delayed childbearing and risk of advers perinatal outcome: a population-based study. The Journal of the American Medical Association (JAMA) 268(7):886-890. Chen XK, Wen SW, Fleming N, Demissie K, Rhoads GG, Walker M. 2007. Teenage pregnancy and adverse birth outcomes: a large population based retrospective cohort study. International Journal of Epidemiology 36(2):368-373. Colman J, Rice GE, Wright JM, Hunter ES 3rd, Teuschler LK, Lipscomb JC, Hertzberg RC, Simmons JE, Fransen M, Osier M, Narotsky MG. 2011. Identification of developmentally toxic drinking water disinfection byproducts and evaluation of data relevant to mode of action. Toxicology and Applied Pharmacology 254(2):100-126. Cooke RW. 2004. Health, lifestyle, and quality of life for young adults born very preterm. Archives of Diseases in Children 89(3):201-206. Dahl LB, Kaaresen PI, Tunby J, Handegård BH, Kvernmo S, Rønning JA. 2006. Emotional, behavioral, social, and academic outcomes in adolescents born with very low-birth-weight. Pediatrics 118(2):e449-e459. Darrow LA, Klein M, Strickland MJ, Mullolland JA, Tolbert PE. 2011. Ambient air pollution and birth weight in full-term infants in Atlanta, 1994-2004. Environmental Health Perspectives 119(5):731-737. de Bie HM, Oostrom KJ, Delemarre-van de Waal HA. 2010. Brain development, intelligence and cognitive outcome in children born small for gestational age. Hormone Research in Paediatrics 73(1):6-14. de Medeiros APP, Gouveia N, Machado RPP, de Souza MR, Alencar GP, Novaes HMD, de Almeida MF. 2009. Traffic-related air pollution and perinatal mortality: a case-control study. Environmental Health Perspectives 117(1):127-132. Dicker RC. 2002. A brief review of the basic principles of epidemiology. In: Field Epidemiology, 2nd Ed. (Gregg MB, ed.). New York, NY: Oxford University Press. Dietz PM, Callaghan WM, Cogswell ME, Morrow B, Ferre C, Schieve LA. 2006. Combined effects of prepregnancy body mass index and weight gain during pregnancy on the risk of preterm delivery. Epidemiology 17(2):170-177.
Adverse Birth Outcomes Statistical Review for TriCounty Health Department March 17, 2015
29
Dodds L, King W, Allen AC, Armson BA, Fell DB, Nimrod C. 2004. Trihalomethanes in public water supplies and risk of still birth. Epidemiology 15(2):179-186. Dominguez TP. 2008. Race, racism, and racial disparities in adverse birth outcomes. Clinical Obstetrics and Gynecology 51(2):360-370. Doyle LW, Anderson PJ. 2010. Adult outcome of extremely preterm infants. Pediatrics 126(2):342-351. Dugandzic R, Dodds L, Stieb D, Smith-Doiron M. 2006. The association between low level exposure to ambient air pollution and term low-birth-weight: a retrospective cohort study. Environmental Health 5:3. Duijts L. 2012. Fetal and infant origins of asthma. European Journal of Epidemiology 27(1):5-14. Elliott P, Briggs D, Morris S, de Hoogh C, Hurt C, Jensen TK, Maitland I, Richardson S, Wakefield J, Jarup L. 2001. Risk of adverse birth outcomes in populations living near landfill sites. British Medical Journal 323(7309):363-368. Eskenazi B, Mocarelli P, Warner M, Chee WY, Gerthoux PM, Samuels S, Needham LL, Patterson DG. 2003. Maternal serum dioxin levels and birth outcomes in women of Seveso, Italy. Environmental Health Perspectives 111(7):947-953. Fontaine RE, Goodman RA. 2002. Describing the findings. In: Field Epidemiology, 2nd Ed. (Gregg MB, ed.). New York, NY: Oxford University Press. Fraser AM, Brockert JE, Ward RH. 1995. Association of young maternal age with adverse reproductive outcomes. New England Journal of Medicine 332(17):1113-1117. Friis RH, Sellers TA. 1999. Measures of morbidity and mortality used in epidemiology. In: Epidemiology for public health practice. (Friis RH, Sellers TA. eds.). Gaithersburg, MD: Aspen Publishers, Inc. Gallo LA, Tran M, Master JS, Moritz KM, Wlodek ME. 2012. Maternal adaptations and inheritance in the transgenerational programming of adult disease. Cell and Tissue Research 349(3):863-880. Gascon M, Morales E, Sunyer J, Vrijheid M. 2013. Effects of persistent organic pollutants on the developing respiratory and immune systems: a systematic review. Environment International 52:51-65. Giacomini SM, Hou L, Bertazzi PA, Baccarelli A. 2006. Dioxin effects on neonatal and infant thyroid function: routes of perinatal exposure, mechanisms of action and evidence from epidemiology studies. International Archives of Occupational and Environmental Health 79(5):396-404.

Adverse Birth Outcomes Statistical Review for TriCounty Health Department March 17, 2015
30
Gilboa SM, Mendola P, Olshan AF, Lanlois PH, Savitz DA, Loomis D, Herring AH, Fixler DE. 2005. Relationship between ambient air quality and selected birth defects, seven county study, Texas, 1997-2000. American Journal of Epidemiology 162(3):238-252. Glinianaia SV, Rankin J, Bell R, Pless-Mulloli P, Howel D. 2004. Particulate air pollution on fetal health: a systematic review of epidemiologic evidence. Epidemiology 15(1):36-45. Glynn A, Thuvander A, Aune M, Johannisson A, Darnerud PO, Ronquist G, Cnattingius S. 2008. Immune cell counts and risks of respiratory infections among infants exposed pre- and postnatally to organochlorine compounds: a prospective study. Environmental Health 7:62. Godfrey KM, Barker DJ. 2001. Fetal programming and adult health. Public Health Nutrition 4(2B):611-624. Gordis L. 1996a. Estimating risk: is there an association? In: Epidemiology (Gordis L. ed.). Philadelphia, PA: W B Saunders Co. Gordis L. 1996b. Measuring the occurrence of disease. In: Epidemiology (Gordis L. ed.). Philadelphia, PA: W B Saunders Co. Greenland S. 2001. Ecologic versus individual-level sources of bias in ecologic estimates of contextual health effects. International Journal of Epidemiology 30(6):1343-1350. Greenland S. 2004. Model-based estimations of relative risks and other epidemiologic measures in studies of common out-comes and in case-control studies. American Journal of Epidemiology 160(4):301-305. Greenland S, Robins J. 1994. Ecologic studies – biases, misconceptions, and counter examples. American Journal of Epidemiology 139(8):747-760. Greenland S, Rothman KJ. 1998. Introduction to categorical statistics. In: Modern epidemiology 2nd ed. (Rothman KJ, Greenland S, eds.). Philadelphia, PA: Lippincott-Raven Publishers. Greenough A. 2008. Long-term pulmonary outcome in the preterm infant. Neonatology 93(4):324-327. Griffith J, Aldrich TE, Duncan RC. 1993. Epidemiologic research methods. In: Environmental epidemiology and risk assessment (Aldrich TE, Griffith J, Cooke C eds.). New York, NY: Van Nostrand Reinhold. Han Z, Mulla S, Beyene J, Liao G, McDonald SD. 2011. Maternal underweight and the risk of preterm birth and low-birth-weight: a systematic review and meta-analyses. International Journal of Epidemiology 40(1):65-101.
Adverse Birth Outcomes Statistical Review for TriCounty Health Department March 17, 2015
31
Hansen CA Barnett AG, Jalaludin BB, Morgan GG. 2009. Ambient air pollution and birth defects in Brisbane, Australia. PLoS ONE 4(4):e5408. Hardy RJ, Schroder GD, Cooper SP, Buffler PA, Prichard HM, Crane M. 1990. A surveillance system for assessing health effects from hazardous exposures. American Journal of Epidemiology 132(Suppl 1):S32-S42. Henderson AJ, Waner JO. 2012. Fetal origins of asthma. Seminars in Fetal and Neonatal Medicine 17(2):82-91. Hessel F. 2008. Burden of disease. In: Encyclopedia of public health, 1st Ed., Vol. 1. (Kirch W, ed). Dordrecht, The Netherlands: Springer Verlag Publishers. Hoffman CS, Mendola P, Savitz DA, Herring AH, Loomis D, Hartmann KE, Singer PC, Weinbreg HS, Olshan AF. 2008a. Drinking water disinfection bi-product exposure and duration of gestation. Epidemiology 19(5):738-746. Hoffman CS, Mendola P, Savitz DA, Herring AH, Loomis D, Hartmann KE, Singer PC, Weinberg HS, Olshan AF. 2008b. Drinking water disinfection by-product exposure and fetal growth. Epidemiology 19(5):729-737. Holladay SD. 1999. Prenatal immunotoxicant exposure and postnatal autoimmune disease. Environmental Health Perspectives 107(Suppl 5):687-691. Hopenhayn C, Ferreccio C, Browning SR, Huang B, Peralta C, Gibb H. Hertz-Picciotto I. 2003. Arsenic exposure from drinking water and birth weight. Epidemiology 14(5):593-602. Hunt CE. 2007. Small for gestational age infants and sudden death syndrome: a confluence of complex conditions. Archives of Disease in Children: Fetal & Neonatal Edition 92(6):F428-F429. Hwang BF, Jaakkola JJK. 2008. Ozone and other air pollutants and the risk of oral clefts. Environmental Health Perspectives 116(10):1411-1415. IBIS (Indicator-Based Information System for Public Health). 2014. Behavioral Risk Factors Surveillance System (BRFSS) dataset query module. Salt Lake City, UT: Utah Department of Health. [The geographic location of the query was the census tracts that were contained by the study area.] Available: http://ibis.health.utah.gov/ [accessed February 11, 2015]. Infante-Rivard C, Weinberg CR, Guiguet M. 2006. Xenobiotic-metabolizing genes and small-for-gestational-age births: interaction with maternal smoking. Epidemiology 17(1):38-46. Inamdar AS, Croucher RE, Chokhandre MK, Mashyakhy MH, Marinho VC. 2014. Maternal Smokeless Tobacco Use in Pregnancy and Adverse Health Outcomes in Newborns: A Systematic Review. Nicotine and Tobacco Research (Epub ahead of print).
Adverse Birth Outcomes Statistical Review for TriCounty Health Department March 17, 2015
32
Izquierdo JN, Schoenbach VJ. 2000. The potential and limitations of data from population-based state cancer registries. American Journal of Public Health 90(5):695-698. Janes GR, Hutwagner L, Cates W, Stroup DF, Williamson GD. 2000. Descriptive epidemiology: analyzing and intrepeting surveillance data. In: Principles and practice of public health surveillance, 2nd Ed. (Teutsch SM, Churchill RE, eds.). New York, NY: Oxford University Press. Jekel JF, Elmore JG, Katz DL. 1996a. Assessment of risk in epidemiologic studies. In: Epidemiology, biostatistics, and preventive medicine. (Jekel JF, Elmore JG, Katz DL, eds.). Philadelphia, PA: WB Saunders Co. Jekel JF, Elmore JG, Katz DL. 1996b. Epidemiologic data sources and measurements. In: Epidemiology, biostatistics, and preventive medicine. (Jekel JF, Elmore JG, Katz DL, eds.). Philadelphia, PA: WB Saunders Co. Joseph KS, Kramer MS, Allen AC, Mery LS, Platt RW, Wen SW. 2001. Implausible birth weight for gestational age. American Journal of Epidemiology 153(2):110-113. Kahn HA, Sempos CT. 1989. Relative risk and odds ratio. In: Statistical methods in epidemiology. (Kahn HA, Sempos CT. eds.). New York, NY: Oxford University Press. Kendall M. A new measure of rank correlation. 1938. Biometrika 30(1-2):81-93. Kingsley BS, Schmeichel KL, Rubin CH. 2007. An update on cancer cluster activities at the Centers for Disease Control and Prevention. Environmental Health Perspectives 115(1):167-171. Kharrazi M, DeLorenze GN, Kaufman FL, Eskenazi B, Bernert JT, Graham S, Pearl M, Pirkle J. 2004. Environmental tobacco smoke and pregnancy outcome. Epidemiology 15(6):660-670. Knopik V. 2009. Maternal smoking during pregnancy and child outcomes: real or spurious effect? Developmental Neuropsychology 34(1):1–36. Kondapalli LA, Perales-Puchalt A. 2013. Low-birth-weight: is it related to assisted reproductive technology or underlying infertility? Fertility and Sterility 99(2):303-310. Kotelchuck M. 1994. An evaluation of the Kessner adequacy of prenatal care index and a proposed adequacy of prenatal care utilization index. American Journal of Public Health 84(9):1414-1420. Kramer MS. 2003. The epidemiology of adverse pregnancy outcomes: an overview. The Journal of Nutrition 133(5):1592S-1596S. Krueger PM, Scholl TO. 2000. Adequacy of prenatal care and pregnancy outcome. Journal of the American Obstetrics Association 100(8):485-492.

Adverse Birth Outcomes Statistical Review for TriCounty Health Department March 17, 2015
33
Lang JM, Lieberman E, Cohen A. 1996. A comparison of risk factors for preterm labor and term small-for-gestational-age birth. Epidemiology 7(4):369-376. Langlois PH, Brender JD, Suarez L, Shan FB, Mistry JH, Scheuerle A, Moody K. 2009. Maternal residential proximity to waste sites and industrial facilities and conoctruncal heart defects in offspring. Paediatric and Perinatal Epidemiology 23(4):321-331. Last JM, Abramson JH, Friedman GD, Porta M, Spasoff RA, Thuriaux M. (eds.). 1995. A dictionary of epidemiology, 3rd ed. New York, NY: Oxford University Press. Lee PA, Chernausek SD, Hokken-Koelega ACS, Czernichow P, International SGA Advisory Board. 2003a. International Small for Gestational Age Advisory Board consensus development conference statement: management of short children born small for gestional age, April 24-October 1, 2001. Pediatrics 111(6):1253-1261. Lee BE, Ha EH, Park HS, Kim YJ, Hong YC, Kim H, Lee JT. 2003b. Exposure to air pollution during different gestational phases contributes to risk of low-birth-weight. Human Reproduction 18(3):638-643. Leijs MM, Koppe JG, Olie K, van Aalderen WM, Voogt Pd, Vulsma T, Westra M, ten Tusscher GW. 2008. Delayed initiation of breast development in girls with higher prenatal dioxin exposure; a longitudinal cohort study. Chemosphere 73(6):999-1004. Lepeule J, Caini F, Bottagisi S, Galineau J, Hulin A, Marquis N, Bohet A, Sirous V, Makinski M, Charles MA, Slama R, EDEN Mother-Child Cohort Study Group. 2010. Maternal exposure to nitrogen dioxide during pregnancy and offspring birth weight: comparison of two exposure models. Environmental Health Perspectives 118(10):1483-1489. Lisonkova S, Janssen PA, Sheps SB, Lee SK, Dahlgren L. 2010. The effect of maternal age on adverse birth outcomes: does parity matter? Journal of Obstetrics and Gynaecology Canada 32(6):541-548. Liu S, Kerwski D, Shi Y, Chen Y, Burnett RT. 2003. Association between gaseous ambient air pollutants and adverse birth outcomes in Vancouver, Canada. Environmental Health Perspectives 111(14):1773-1778. Lundqvist C, Zuurbier M, Leijs M, Johansson C, Ceccatelli S, Saunders M, Schoeters G, ten Tusscher G, Koppe JG. 2006. The effects of PCBs and dioxins on child health. Acta Paediatrica (Oslo, Norway) Supplemental 95(453):55-64. Maisonet M, Correa A, Misra D, Jaakkola JJK. 2004. A review of the literature on the effects of ambient air pollution on fetal growth. Environmental Research 95:106-115. Malmqvist E, Rignell-Hydbom A, Tinnerberg H, Bjork J, Stroh E, Jakobsson K, Rittner R, Rylander L. Maternal exposure to air pollution and birth outcomes. Environmental Health Perspectives 119(4):553-558.
Adverse Birth Outcomes Statistical Review for TriCounty Health Department March 17, 2015
34
Mann CJ. 2003. Observation research methods. Research design II: cohort, cross sectional, and case-control studies. Emergency Medicine Journal 20(1):54-60. Martin JA, Hamilton BE, Ventura SJ, Osterman MJK, Mathews TJ. 2013. Births: final data for 2011. National Vital Statistics Reports 52(1):1-70. Maroziene L, Grazuleviciene R. 2002. Maternal exposure to low-level air pollution and pregnancy outcomes: a population-based study. Environmental Health 1:6. Mathews TJ, MacDorman MF. 2013. Infant mortality statistics from the 2010 period linked birth/infant death data set. National Vital Statistics Report 62(8):1-33. McGrady GA, Sung JF, Rowley DL, Hogue CJ. 1992. Preterm delivery and low-birth-weight among first-born infants of black and white college graduates. American Journal of Epidemiology 136(3):266-267. Meng G, Thompson ME, Hall GB. 2013. Pathways of neighbourhood-level socio-economic determinants of adverse birth outcomes. International Journal of Health Geographics 12:13. Milton AH, Smith W, Rahman B, Hasan Z, Kulsum U, Dear K, Rakibuddin M, Ali A. 2005. Chronic arsenic exposure and adverse pregnancy outcomes in Bangladesh. Epidemiology 16(1):82-86. Minnes S, Lang A, Singer L. 2011. Prenatal tobacco, marijuana, stimulant, and opiate exposure: outcomes and practice implications. BMC Addiction Science and Clinical Practice 6(1):57-70. Miranda ML, Maxson P, Edwards S. 2009. Environmental contributions to disparities in pregnancy outcomes. Epidemiologic Reviews 31(1):67-83. Misra DP, Astone N, Lynch CD. 2005. Maternal smoking and birth weight: interaction with parity and mother's own in utero exposure to smoking. Epidemiology 16(3):288-293. Miyake Y, Tanaka K, Okubo H, Sasaki S. 2014. Alcohol consumption during pregnancy and birth outcomes: The Kyushu Okinawa maternal and child health study. BMC Pregnancy and Childbirth 14:79. Morello-Frosch R, Jesdale BM, Sadd JL, Pastor M. 2010. Ambient air pollution exposure and full-term birth weight in California. Environmental Health 9:44. Morello-Frosch R, Shenassa ED. 2006. The environmental "riskscape" and social inequality: implications for explaining maternal and child health disparities. Environmental Health Perspectives (114(8):1150-1153. Morgenstern H. 1982. Uses of ecologic analysis in epidemiologic research. American Journal of Public Health 72(12):1336-1344.
Adverse Birth Outcomes Statistical Review for TriCounty Health Department March 17, 2015
35
Morgenstern H. 1995. Ecologic studies in epidemiology: concepts, principles, and methods. Annual Reviews of Public Health 16:16-81. Mund M, Louwen F, Klingelhoefer D, Gerber A. 2013. Smoking and pregnancy: a review on the first major environmental risk factor of the unborn. International journal of Environmental Research and Public Health 10(12):6485–6499. National Institute of Child Health and Human Development (NICHHD). 2013. What are the factors that put a pregnancy at risk? Available at: http://www.nichd.nih.gov/health/topics/high-risk/conditioninfo/pages/factors.aspx [Accessed February 11, 2015]. Newnham J. 1998. Consequences of fetal growth restrictions. Current Opinions in Obstetrics and Gynecology 10(2):145-149. Nieuwenhuijsen MJ, Toledano MB, Eaton NE, Fawell J, Elliott P. 2000. Chlorination disinfection byproducts in water and their association with adverse reproductive outcomes: a review. Occupational and Environmental Medicine 57(2):73-85. Oken E, Kleinman KP, Rich-Edwards J, Gillman MW. 2003. A nearly continuous measure of birth weight for gestational age using a United States national reference. BMC Pediatrics 3:6. Olsson D, Mogren I, Forsberg B. 2013. Air pollution exposure in early pregnancy and adverse pregnancy outcomes: a register-based cohort study. British Medical Journal Open 3:e001955. Ong KK, Dunger DB. 2002. Perinatal growth failure: the road to obesity, insulin resistance and cardiovascular disease in adults. Best Practices and Research: Clinical Endocrinology and Metabolism 16(2):191-207. Painter RC, Osmond C, Gluckman P, Hanson M, Phillips DI, Roseboom TJ. 2008. Transgenerational effects of prenatal exposure to the Dutch famine on neonatal adiposity and health in later life. BJOG: An International Journal of Obstetrics and Gynecology 115(10):1243-1249. Papadopoulou E, Caspersen IH, Kvalem HE, Knutsen HK, Duarte-Salles T, Alexander J, Meltzer HM, Kogevinas M, Brantsæter AL, Haugen M. 2013. Maternal dietary intake of dioxins and polychlorinated biphenyls and birth size in the Norwegian Mother and Child Cohort Study (MoBa). Environment International 60:209-216. Papadopoulou E, Kogevinas M, Botsivali M, Pedersen M, Besselink H, Mendez MA, Fleming S, Hardie LJ, Knudsen LE, Wright J, Agramunt S, Sunyer J, Granum B, Gutzkow KB, Brunborg G, Alexander J, Meltzer HM, Brantsæter AL, Sarri K, Chatzi L, Merlo DF, Kleinjans JC, Haugen M. 2014. Maternal diet, prenatal exposure to dioxin-like compounds and birth outcomes in a European prospective mother-child study (NewGeneris). The Science of the Total Environment 484C:121-128.
Adverse Birth Outcomes Statistical Review for TriCounty Health Department March 17, 2015
36
Park HM. 2010. Hypothesis testing and statistical power of a test, working paper. Bloomington, IN: Indiana University: University Information Technology Services. Available at: http://www.indiana.edu/~statmath/stat/all/power/power.pdf [Accessed February 11, 2015]. Parker JD, Mendola P, Woodruff T. 2008. Preterm birth after the Utah Valley steel mill closure: a natural experiment. Epidemiology 19(6):820-823. Parker JD, Woodruff TJ, Basu R, Schoendorf KC. 2005. Air pollution and birth weight among term infants in California. Pediatrics 115(1):121-128. Parsons TJ, Power C, Logan S, Summerbell CD. 1999. Childhood predictors of adult obesity: a systematic review. International Journal of Obesity and Related Metabolic Disorders 23(Suppl 8):S1-107. Pearce MS, Glinianaia SV, Ghosh R, Rankin J, Rushton S, Charlton M, Parker L, Pless-Mulloli T. 2012. Particulate matter exposure during pregnancy is associated with birth weight, but not gestational age, 1962-1992: a cohort study. Environmental Health 11:13. Pollack H, Lantz PM, Frohna JG. 2000. Maternal smoking and adverse birth outcomes among singletons and twins. American Journal of Public Health 90(3):395-400. Ponce NA, Hoggatt KJ, Wilhelm M, Ritz B. 2005. Preterm birth: the interaction of traffic-related air pollution with economic hardship in Los Angeles neighborhoods. American Journal of Epidemiology 162(2):140-148. Proietti E, Röösli M, Frey U, Latzin P. 2013. Air pollution during pregnancy and neonatal outcome: a review. Journal of Aerosol Medicine and Pulmonary Drug Delivery 26(1):9-23. Rankin J, Chadwick T, Natarajan M, Howel D, Pearce MS, Pless-Mulloli T. 2009. Maternal exposure to ambient air pollutants and risk of congenital anomalies. Environmental Research 109(2):181-187. Ricciardi C, Guastadisegni C. 2003. Environmental inequalities and low-birth-weight. Annali dell'Istituto Superiore di Sanita 39(2):229-234. Rich DQ, Demissie K, Lu SE, Kamat L, Wartenberg D, Rhoads GG. 2009. Ambient air pollutant concentrations during pregnancy and the risk of fetal growth restriction. Journal of Epidemiology and Community Health 63(6):448-496. Ritz B, Yu F, Fruin S, Chapa G, Shaw GM, Harris JA. 2002. Ambient air pollution and risk of birth defects in southern California. American Journal of Epidemiology 156(1):17-25. Rockhill B. 2005. Theorizing about causes at the individual level while estimating effects at the population level: implications for prevention. Epidemiology 16(1):124-129.

Adverse Birth Outcomes Statistical Review for TriCounty Health Department March 17, 2015
37
Rogers JF, Dunlop AL. 2006. Air pollution and very low-birth-weight infants: a target population? Pediatrics 118(1):156-165. Rogers JF, Thompson SJ, Addy CL, McKeown RE, Cowen DJ, Decoufle P. 2000. Association of very low-birth-weight with exposure to environmental sulfur dioxide and total suspended particulates. American Journal of Epidemiology 151(6):602-613. Rosenberg TJ, Garbers S, Lipkind H, Chiasson MA. 2005. Maternal obesity and diabetes as risk factors for adverse pregnancy outcomes: differences among 4 racial/ethnic groups. American Journal of Public Health 95(9):1545-1551. Rothman KJ, Greenland S. 1887. Measure of disease frequency. In: Modern epidemiology 2nd ed. (Rothman KJ, Greenland S, eds.). Philadelphia, PA: Lippincott-Raven Publishers. Sagiv SK, Tolbert PE, Altsul LM, Korrick SA. 2007. Organochlorine exposure during pregnancy and infant size at birth. Epidemiology 18(1):120-129. Salem MT, Millstein J, Li YF, Lurmann FW, Margolis HG, Gillilan FD. 2005. Birth outcomes and prenatal exposure to ozone, carbon monoxide and particulate matter: results from children's health study. Environmental Health Perspectives 113(11):1638-1644. Savits DA, Harlow SD. 1991. Selection of reproductive health end points for environmental risk assessment. Environmental Health Perspectives 90(1):159-164. Selvin S. 1996. Chapter 1: Measures of risk: rates and probabilities. In: Monographs in epidemiology and biostatistics, Vol. 25: statistical analysis of epidemiologic data. (Selvin S, ed.). Oxford, UK: Oxford University Press. Signorello LB, Trichopoulos D. 1998. Perinatal determinants of adult cardiovascular disease and cancer. Scandinavian Journal of Social Medicine 26(3):161-165. Silver RM, Varner MW, Reddy U, Goldenberg R, Pinar H, Conway D, Bukowski R, Carpenter M, Hogue C, Willinger M, Dudley D, Saade G, Stoll B.2007. Work-up of stillbirth: a review fo the evidence. American Journal of Obstetrics and Gynecology 196(5):433-444. Shaw GM, Ranatunga D, Quach T, Neri E, Correa A, Neutra RR. 2003. Trihalomethane exposure from municipal water supplies and selected congenital malformations. Epidemiology 14(2):191-199. Shu XO, Hatch MC, Mills J, Clemens J, Susser M. 1995. Maternal smoking, alcohol drinking, caffeine consumption, and fetal growth: results from a prospective study. Epidemiology 6(2):115-120. Shy KK, Brown ZA. 1984. Maternal and fetal well-being. Western Journal of Medicine 141(6):807-815.

Adverse Birth Outcomes Statistical Review for TriCounty Health Department March 17, 2015
38
Slama R, Morgenstern V, Cyrys J, Zutavern A, Herbarth O, Wichmann HE, Heinrich J, LISA study group. 2007. Traffic-related atmospheric polllutants levels during pregnancy and offspring's term birth weight: a study relying on land-use regression exposure model. Environmental Health Perspectives 115(9):1283-1292. Sram RJ, Binkova B, Dejmek J, Bobak M. 2005. Ambient air pollution and pregnancy outcomes: a review of the literature. Environmental Health Perspectives 113(4):375-382. Stanbury M, Anderson H, Blackmore C, Fagliano J, Heumann M, Kass D, McGeehin M. 2012. Functions of environmental epidemiology and surveillance in state health departments. Journal of Public Health Management and Practice 18(5):453-460. Stuart A. 1953. The estimation and comparison of strengths of association in contingency tables. Biometrika 40(1/2):105-110. Sydsjo G. 2011. Long-term consequences of non-optimal birth characteristics. American Journal of Reproductive Immunology 66(Suppl 1):81-87. ten Tusscher GW, Guchelaar HJ, Koch J, Ilsen A, Vulsma T, Westra M, van der Slikke JW, Olie K, Koppe JG. 2008. Perinatal dioxin exposure, cytochrome P-450 activity, liver functions and thyroid hormones at follow-up after 7-12 years. Chemosphere 70(10):1865-1872. Terauchi Y, Kubota N, Tamemoto H, Sakura H, Nagai R, Akanuma Y, Kimura S, Kadowaki T. 2000. Insulin effect during embryogenesis determines fetal growth: a possible molecular link between birth weight and susceptibility to type 2 diabetes. Diabetes 49(1):82-86. Thacker SB. 2000. Historical development. In: Principles and practice of public health surveillance, 2nd Ed. (Teutsch SM, Churchill RE, eds.). New York, NY: Oxford University Press. Thacker SB, Qualters JR, Lee LM. 2012. Public health surveillance in the United States: evolution and challenges. Morbidity and Mortality Weekly Report – Surveillance Supplement 61(3):3-9. Torrence ME. 1997. Measures of frequency and association. In: Mosby's biomedical science series: understanding epidemiology. (Torrence ME, ed.). St. Louis, MO: Mosby-Year Book, Inc. UC (Utah Code). 2013. Title 26 Utah Health Code, Chapter 2 Utah Vital Statistics Act, Section 2 definitions. Available: http://le.utah.gov/xcode/Title26/Chapter2/26-2.html. [This statute was amended in 2014 to redefine stillbirth.] UDOH (Utah Department of Health). 2009. Report of guidelines for data result suppression. Salt Lake City, UT: Data Suppression Decision Rules Work Group. Internal policy. UDNR (Utah Department of Natural Resources). 2014. Oil and Gas Data Center website. Information: http://oilgas.ogm.utah.gov/Data_Center/DataCenter.cfm [Accessed February 11, 2015].
Adverse Birth Outcomes Statistical Review for TriCounty Health Department March 17, 2015
39
UEPHTN (Utah Environmental Public Health Tracking Network). 2014. Utah Environmental Public Health Tracking Network website. Information: http://epht.health.utah.gov/epht-view/ [Accessed February 11, 2015]. USCB (U.S. Census Bureau). 2014a. American Community Survey 5-Year estimates: Table DP02 Selected social characteristics in the United States, 2009-2013. American Fact Finder. [The geographic location of the query was the census tracts that were contained by the study area.] Available: http://factfinder2.census.gov [accessed December 1, 2014]. USCB (U.S. Census Bureau). 2014b. American Community Survey 5-Year estimates: Table DP03 Selected economic characteristics, 2009-2013. American Fact Finder. [The geographic location of the query was the census tracts that were contained by the study area.] Available: http://factfinder2.census.gov [accessed December 1, 2014]. USCB (U.S. Census Bureau). 2014c. American Community Survey 5-Year estimates: Table DP04 selected housing characteristics, 2009-2013. American Fact Finder. [The geographic location of the query was the census tracts that were contained by the study area.] Available: http://factfinder2.census.gov [accessed December 1, 2014]. USCB (U.S. Census Bureau). 2014d. American Community Survey 5-Year estimates: Table DP05 ACS demographic and housing estimates, 2009-2013. American Fact Finder. [The geographic location of the query was the census tracts that were contained by the study area.] Available: http://factfinder2.census.gov [accessed December 1, 2014]. Vafeiadi M, Agramunt S, Pedersen M, Besselink H, Chatzi L, Fthenou E, Fleming S, Hardie LJ, Wright J, Knudsen LE, Nielsen JK, Sunyer J, Carreras R, Brunborg G, Gutzkow KB, Nygaard UC, Løvik M, Kyrtopoulos SA, Segerbäck D, Merlo DF, Kleinjans JC, Vrijheid M, Kogevinas M; NewGeneris Consortium. 2014. In utero exposure to compounds with dioxin-like activity and birth outcomes. Epidemiology 25(2):215-224. Van den Hooven EH, Jaddoe VWV, de Kluizenaar Y, Hofman A, Mackenbach JP, Steegers EAP, Miedema HME, Pierik FH. 2009. Residential traffic exposure and pregnancy-related outcomes: a prospective birth cohort study. Environmental Health 8:59. Vreugdenhil HJ, Slijper FM, Mulder PG, Weisglas-Kuperus N. 2002. Effects of perinatal exposure to PCBs and dioxins on play behavior in Dutch children at school age. Environmental Health Perspectives 110(10):A593-A598. Wahabi HA, Fayed AA, Alzeidan RA, Mandil AA. 2014. The independent effects of maternal obesity and gestational diabetes on the pregnancy outcome. BMC Endocrine Disorders 14:47. Wang KC, Botting KJ, Padhee M, Zhang S, McMillen IC, Suter CM, Brooks DA, Morrison JL. 2012. Early origins of heart disease: low-birth-weight and the role of the insulin-like growth factor system in cardiac hypertrophy. Clinical and Experimental Pharmacology and Physiology 39(11):958-964.
Adverse Birth Outcomes Statistical Review for TriCounty Health Department March 17, 2015
40
Weng YH, Yang CY, Chiu YW. 2014. Risk Assessment of Adverse Birth Outcomes in Relation to Maternal Age. PLoS One 9:e114843. Wesselink A, Warner M, Samuels S, Parigi A, Brambilla P, Mocarelli P, Eskenazi B. 2014. Maternal dioxin exposure and pregnancy outcomes over 30 years of follow-up in Seveso. Environment International 63:143-148. Whincup PH, Kaye SJ, Owen CG, Huxley R, Cook DG, Anazawa S, Barrett-Connor E, Bhargava SK, Birgisdottir BE, Carlsson S, de Rooij SR, Dyck RF, Eriksson JG, Falkner B, Fall C, Forsén T, Grill V, Gudnason V, Hulman S, Hyppönen E, Jeffreys M, Lawlor DA, Leon DA, Minami J, Mishra G, Osmond C, Power C, Rich-Edwards JW, Roseboom TJ, Sachdev HS, Syddall H, Thorsdottir I, Vanhala M, Wadsworth M, Yarbrough DE. 2008. Birth weight and risk of type 2 diabetes: a systematic review. JAMA: The Journal of the American Medical Association 300(24):2886-2897. Wilhelm M, Ghosh JK, Su J, Cockburn M, Jerrett M, Ritz B. 2011. Traffic-related air toxics and preterm birth: a population-based case-control study in Los Angeles County, California. Environmental Health 10:89. Wilhelm M, Ritz B. 2003. Residential proximity to traffic and adverse birth outcomes in Los Angeles County, California, 1994-1996. Environmental Health Perspectives 111(2):207-216. Wilhelm M, Ritz B. 2005. Local variation in CO and particulate air pollution and adverse birth outcomes in Los Angeles County, California, USA. Environmental Health Perspectives 113(9):1212-1221. Wojcik W, Lee W, Colman I, Hardy R, Hotopf M. 2013. Foetal origins of depression? A systematic review and meta-analysis of low-birth-weight and later depression. Psychological Medicine 43(1):1-12. Woodruff TJ, Parker JD, Kyle AD, Schoendorf KC. 2003. Disparities in exposure to air pollution during pregnancy. Environmental Health Perspectives 111(7):942-946. Workgroup on Women, Drinking, and Pregnancy (WWDP). 2008. Preventing alcohol, tobacco, and other substance-exposed pregnancies: a community affair. Washington, DC: Interagency Coordinating Committee on Fetal Alcohol Syndrome. Wu JK, Ren C, Delfino RJ, Chung J, Wilhelm M, Ritz B. 2009. Association between local traffic-generated air pollution and preeclampsia and preterm delivery in the South Coast Air Basin of California. Environmental Health Perspectives 117(11):1773-1779. Yorifuji T, Haruse H, Kashima S, Ohki S, Murakoshi T, Takao S, Tsuda T, Doi H. 2011. Residential proximity to major roads and preterm births. Epidemiology 22(1):74-80. Zhu M, Fitzgerald EF, Gelberg KH, Druschel CM. 2010. Maternal low-level lead exposure and fetal growth. Environmental Health Perspectives 118(10):1471-1475.

Adverse Birth Outcomes Statistical Review for TriCounty Health Department March 17, 2015
41
Zota AR, Ettinger AS, Bouchard M, Amarasiriwardena CJ, Schwartz J, Hu H, Wright RO. 2009. Maternal blood manganese levels and infant birth weight. Epidemiology 20(3):367-373. Zwicker JG, Harris SR. 2008. Quality of life of formerly preterm and very low-birth-weight infants from preschool age to adulthood: a systematic review. Pediatrics 121(2):e366-e376.

Adverse Birth Outcomes Statistical Review for TriCounty Health Department March 17, 2015
42
Table 1. Relative risk of low-birth-weight infants in the TriCounty Health Department study area from 1991 through 2013. A red S means the relative risk is significantly higher than expected. A green S means that the relative risk is significantly lower than expected. The level of statistical power is also provided with these flags.
Study Period
Number of Live Births
Number of Low-birth-
weight Infants
Rate of Low-birth-weight Infants per
1,000 live births
Relative Risk (RR)
95% Confidence Limits of the Relative Risk (If significant,
flagged and level of statistical power provided)
Tri-County Study Area 1991 – 1993 1,949 132 67.7 1.25 (1.04 – 1.48) S elevated (67%) 1994 – 1996 1,864 125 67.1 1.08 (0.90 – 1.28) 1997 – 1999 1,892 119 62.9 0.82 (0.68 – 0.98) S lower (99%) 2000 – 2002 2,340 142 60.7 0.94 (0.79 – 1.11) 2003 – 2005 2,364 142 60.1 0.97 (0.82 – 1.15) 2006 – 2007 1,991 149 74.8 1.20 (1.01 – 1.41) S elevated (57%) 2008 – 2009 2,160 139 64.4 1.09 (0.92 – 1.29) 2010 – 2011 2,071 132 63.7 1.12 (0.93 – 1.32) 2012 – 2013 2,201 130 59.1 1.02 (0.86 – 1.22)
Uintah County 1991 – 1995 2,166 146 67.4 1.19 (1.00 – 1.40) S elevated (51%) 1996 – 2000 2,217 144 65.0 0.89 (0.75 – 1.05) 2001 – 2004 2,201 127 57.7 0.92 (0.76 – 1.09) 2005 – 2007 1,989 149 74.9 1.19 (1.00 – 1.39) S elevated (51%) 2008 – 2010 2,116 142 67.1 1.11 (0.94 – 1.23) 2011 – 2013 2,309 132 57.2 0.97 (0.81 – 1.15)
Duchesne County 1991 – 1999 1,750 117 66.9 1.04 (0.86 – 1.25) 2000 – 2007 1,930 117 60.6 1.00 (0.82 – 1.19) 2008 – 2013 1,940 123 63.4 1.17 (0.97 – 1.39)
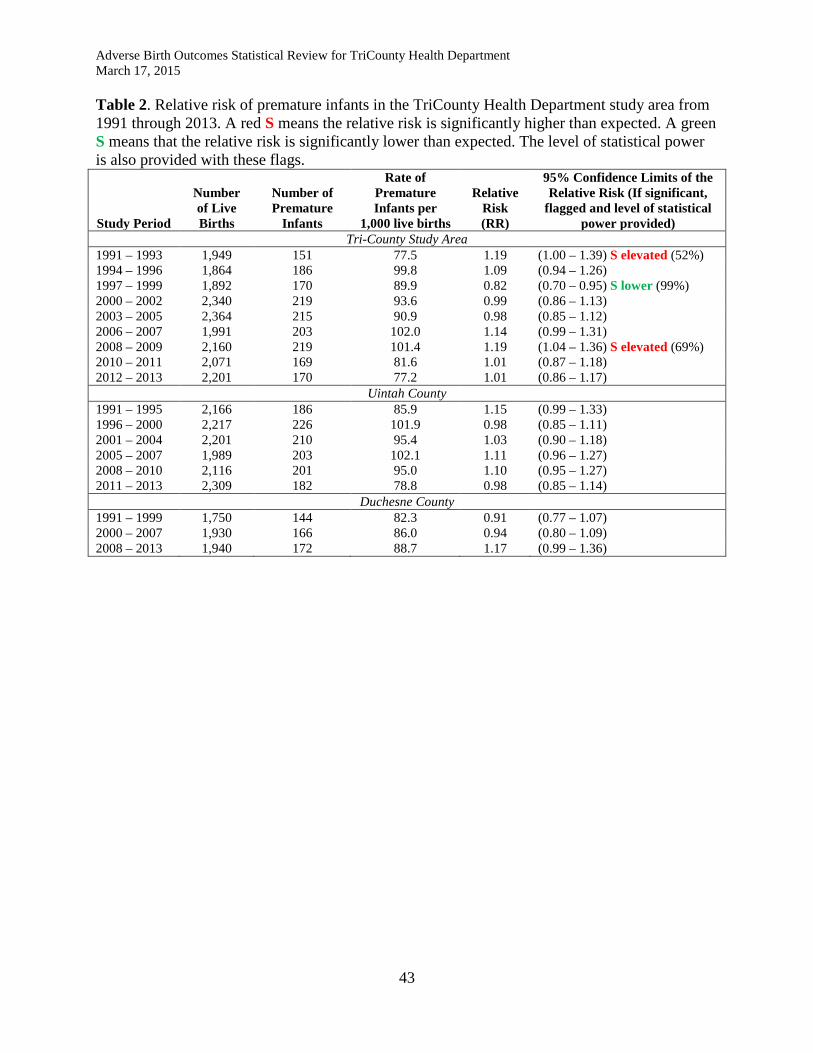
Adverse Birth Outcomes Statistical Review for TriCounty Health Department March 17, 2015
43
Table 2. Relative risk of premature infants in the TriCounty Health Department study area from 1991 through 2013. A red S means the relative risk is significantly higher than expected. A green S means that the relative risk is significantly lower than expected. The level of statistical power is also provided with these flags.
Study Period
Number of Live Births
Number of Premature
Infants
Rate of Premature Infants per
1,000 live births
Relative Risk (RR)
95% Confidence Limits of the Relative Risk (If significant,
flagged and level of statistical power provided)
Tri-County Study Area 1991 – 1993 1,949 151 77.5 1.19 (1.00 – 1.39) S elevated (52%) 1994 – 1996 1,864 186 99.8 1.09 (0.94 – 1.26) 1997 – 1999 1,892 170 89.9 0.82 (0.70 – 0.95) S lower (99%) 2000 – 2002 2,340 219 93.6 0.99 (0.86 – 1.13) 2003 – 2005 2,364 215 90.9 0.98 (0.85 – 1.12) 2006 – 2007 1,991 203 102.0 1.14 (0.99 – 1.31) 2008 – 2009 2,160 219 101.4 1.19 (1.04 – 1.36) S elevated (69%) 2010 – 2011 2,071 169 81.6 1.01 (0.87 – 1.18) 2012 – 2013 2,201 170 77.2 1.01 (0.86 – 1.17)
Uintah County 1991 – 1995 2,166 186 85.9 1.15 (0.99 – 1.33) 1996 – 2000 2,217 226 101.9 0.98 (0.85 – 1.11) 2001 – 2004 2,201 210 95.4 1.03 (0.90 – 1.18) 2005 – 2007 1,989 203 102.1 1.11 (0.96 – 1.27) 2008 – 2010 2,116 201 95.0 1.10 (0.95 – 1.27) 2011 – 2013 2,309 182 78.8 0.98 (0.85 – 1.14)
Duchesne County 1991 – 1999 1,750 144 82.3 0.91 (0.77 – 1.07) 2000 – 2007 1,930 166 86.0 0.94 (0.80 – 1.09) 2008 – 2013 1,940 172 88.7 1.17 (0.99 – 1.36)
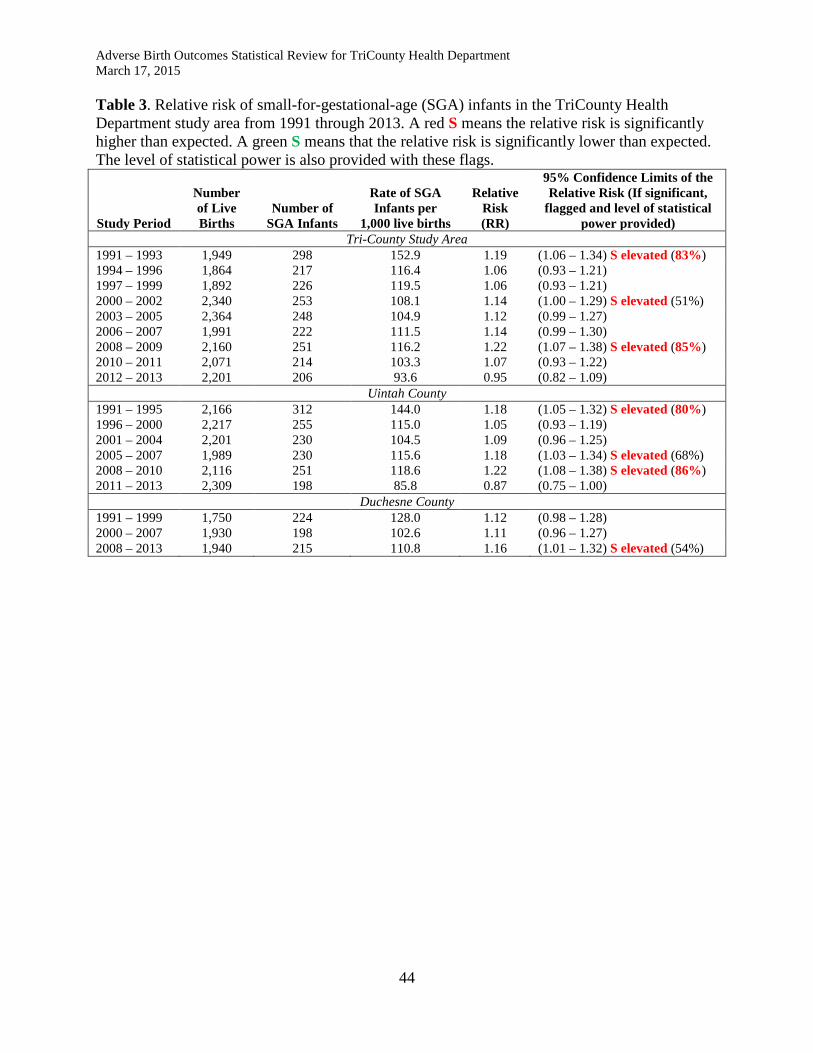
Adverse Birth Outcomes Statistical Review for TriCounty Health Department March 17, 2015
44
Table 3. Relative risk of small-for-gestational-age (SGA) infants in the TriCounty Health Department study area from 1991 through 2013. A red S means the relative risk is significantly higher than expected. A green S means that the relative risk is significantly lower than expected. The level of statistical power is also provided with these flags.
Study Period
Number of Live Births
Number of SGA Infants
Rate of SGA Infants per
1,000 live births
Relative Risk (RR)
95% Confidence Limits of the Relative Risk (If significant,
flagged and level of statistical power provided)
Tri-County Study Area 1991 – 1993 1,949 298 152.9 1.19 (1.06 – 1.34) S elevated (83%) 1994 – 1996 1,864 217 116.4 1.06 (0.93 – 1.21) 1997 – 1999 1,892 226 119.5 1.06 (0.93 – 1.21) 2000 – 2002 2,340 253 108.1 1.14 (1.00 – 1.29) S elevated (51%) 2003 – 2005 2,364 248 104.9 1.12 (0.99 – 1.27) 2006 – 2007 1,991 222 111.5 1.14 (0.99 – 1.30) 2008 – 2009 2,160 251 116.2 1.22 (1.07 – 1.38) S elevated (85%) 2010 – 2011 2,071 214 103.3 1.07 (0.93 – 1.22) 2012 – 2013 2,201 206 93.6 0.95 (0.82 – 1.09)
Uintah County 1991 – 1995 2,166 312 144.0 1.18 (1.05 – 1.32) S elevated (80%) 1996 – 2000 2,217 255 115.0 1.05 (0.93 – 1.19) 2001 – 2004 2,201 230 104.5 1.09 (0.96 – 1.25) 2005 – 2007 1,989 230 115.6 1.18 (1.03 – 1.34) S elevated (68%) 2008 – 2010 2,116 251 118.6 1.22 (1.08 – 1.38) S elevated (86%) 2011 – 2013 2,309 198 85.8 0.87 (0.75 – 1.00)
Duchesne County 1991 – 1999 1,750 224 128.0 1.12 (0.98 – 1.28) 2000 – 2007 1,930 198 102.6 1.11 (0.96 – 1.27) 2008 – 2013 1,940 215 110.8 1.16 (1.01 – 1.32) S elevated (54%)

Adverse Birth Outcomes Statistical Review for TriCounty Health Department March 17, 2015
45
Table 4. Relative risk of infant death in the TriCounty Health Department study area from 1991 through 2013. A red S means the relative risk is significantly higher than expected. A green S means that the relative risk is significantly lower than expected. The level of statistical power is also provided with these flags.
Study Period
Number of Live Births
Number of Infants Deaths
Rate of Infant Deaths per
1,000 live births
Relative Risk (RR)
95% Confidence Limits of the Relative Risk (If significant,
flagged and level of statistical power provided)
Tri-County Study Area 1991 – 1993 1,949 8 4.1 0.76 (0.32 – 1.50) 1994 – 1996 1,864 23 12.3 2.56 (1.62 – 3.84) S elevated (95%) 1997 – 1999 1,892 11 5.8 1.30 (0.65 – 2.34) 2000 – 2002 2,340 12 5.1 1.22 (0.63 – 2.14) 2003 – 2005 2,364 15 6.3 1.78 (0.99 – 2.94) 2006 – 2007 1,991 13 6.5 1.40 (0.74 – 2.40) 2008 – 2009 2,160 12 5.6 1.54 (0.79 – 2.70) 2010 – 2011 2,071 11 5.3 1.31 (0.65 – 2.35) 2012 – 2013 2,201 13 5.9 1.28 (0.68 – 2.20)
Uintah County 1991 – 1995 2,166 14 6.5 1.27 (0.69 – 2.13) 1996 – 2000 2,217 15 6.8 1.44 (0.80 – 2.39) 2001 – 2004 2,201 14 6.4 1.57 (0.86 – 2.65) 2005 – 2007 1,989 10 5.0 1.21 (0.57 – 2.23) 2008 – 2010 2,116 9 4.3 1.14 (0.52 – 2.17) 2011 – 2013 2,309 13 5.6 1.24 (0.66 – 2.12)
Duchesne County 1991 – 1999 1,750 15 8.6 1.78 (0.99 – 2.93) 2000 – 2007 1,930 14 7.3 1.85 (1.01 – 3.11) S elevated (51%) 2008 – 2013 1,940 13 6.7 1.74 (0.92 – 2.99)

Adverse Birth Outcomes Statistical Review for TriCounty Health Department March 17, 2015
46
Table 5. Relative risk of stillbirths in the TriCounty Health Department study area from 1991 through 2013. An “**” means the case count was three or less and that data element was suppressed. A red S means the relative risk is significantly higher than expected. A green S means that the relative risk is significantly lower than expected. The level of statistical power is also provided with these flags.
Study Period
Number of Live Births
Number of Stillbirths
Rate of Stillbirths per
1,000 live births
Relative Risk (RR)
95% Confidence Limits of the Relative Risk (If significant,
flagged and level of statistical power provided)
Tri-County Study Area 1991 – 1993 1,949 16 8.2 0.82 (0.47 – 1.34) 1994 – 1996 1,864 8 4.3 0.35 (0.15 – 0.68) S lower (99%) 1997 – 1999 1,892 8 4.2 0.36 (0.15 – 0.71) S lower (99%) 2000 – 2002 2,340 6 2.6 0.19 (0.07 – 0.42) S lower (99%) 2003 – 2005 2,364 10 4.2 0.86 (0.41 – 1.58) 2006 – 2007 1,991 7 3.5 0.84 (0.33 – 1.73) 2008 – 2009 2,160 8 3.7 0.64 (0.27 – 1.27) 2010 – 2011 2,071 9 4.3 0.79 (0.36 – 1.51) 2012 – 2013 2,201 13 5.9 1.23 (0.65 – 2.10)
Uintah County 1991 – 1995 2,166 13 6.0 0.46 (0.24 – 0.79) S lower (99%) 1996 – 2000 2,217 6 2.7 0.22 (0.08 – 0.48) S lower (99%) 2001 – 2004 2,201 7 3.2 0.41 (0.16 – 0.86) S lower (99%) 2005 – 2007 1,989 10 5.0 1.15 (0.55 – 2.13) 2008 – 2010 2,116 7 3.3 0.57 (0.23 – 1.19) 2011 – 2013 2,309 11 4.8 0.95 (0.48 – 1.72)
Duchesne County 1991 – 1999 1,750 14 8.0 0.74 (0.40 – 1.24) 2000 – 2007 1,930 5 2.6 0.38 (0.12 – 0.91) S lower (99%) 2008 – 2013 1,940 12 6.2 1.19 (0.61 – 2.09)

Adverse Birth Outcomes Statistical Review for TriCounty Health Department March 17, 2015
47
Table 6: List of causes of death for infants (age less than 1 year) in the tri-county study area from 1991 through 2013. Developmental and genetic defects
• Acute vascular disorders of the intestine • Agenesis, hypoplasia, and dysplasia of lung • Anemia of prematurity • Anomalies of diaphragm • Congenital diaphragmatic hernia • Congenital malformation of brain • Congenital malformation syndromes predominantly affecting facial appearance • Congenital malformation, unspecified • Congenital osteodystrophies • Cystic kidney disease • Disease of the digestive system • Down's syndrome • Edwards' syndrome • Extreme immaturity • Fatty (change of) liver • Hydrops fetalis not due to hemolytic disease • Hypoplasia and dysplasia of lung • Hypoplastic left heart syndrome • Multiple congenital anomalies • Non-infective disorder of lymphatic vessels and lymph nodes • Other conditions due to autosomal anomalies • Other congenital malformations of musculoskeletal system • Other ill-defined conditions • Other preterm infants • Other unspecified congenital malformation syndromes • Primary atelectasis of newborn • Renal agenesis • Renal dysplasia • Respiratory distress syndrome in newborn • Sudden death, cause unknown • Sudden infant death syndrome • Thanatophoric short stature • Unspecified congenital anomaly of heart • Unspecified essential hypertension • Ventricular septal defect
Complications and injuries occurring during birth
• Birth asphyxia • Fetus and newborn affected by chorioamnionitis • Fetus and newborn affected by unspecified complication of labor and delivery

Adverse Birth Outcomes Statistical Review for TriCounty Health Department March 17, 2015
48
• Fetus and newborn affected by oligohydramnios • Fetus and newborn affected by placental transfusion syndromes • Fetus and newborn affected by premature rupture of membranes • Hypoxic ischemic encephalopathy of newborn • Other apnea of newborn • Other ill-defined and unspecified causes of mortality • Pneumothorax originating in the perinatal period • Respiratory distress syndrome of newborn • Unspecified intraventricular (nontraumatic) hemorrhage of fetus and newborn • Unspecified pulmonary hemorrhage originating in the perinatal period • Unspecified severity of birth asphyxia in live born infant
Infections and infectious diseases
• Bacterial sepsis of newborn • Necrotizing enterocolitis of fetus and newborn • Other infections specific to the perinatal period • Sepsis due to other Gram-negative organisms • Transient neonatal neutropenia • Bacterial pneumonia • Viral pneumonia
Accidental, intentional, traumatic or toxic injuries
• Abrasion or friction burn of elbow, forearm, and wrist, without mention of infection • Accidental suffocation and strangulation in bed • Anoxic brain damage • Assault by unspecified means • Crushing injury of unspecified site of lower limb • Enzyme toxicity • Fall • Fracture of upper end of humerus open • Inhalation or ingestion of object causing respiratory obstruction • Perinatal intestinal perforation • Toxic effect of corrosive aromatic acids and caustic alkalis
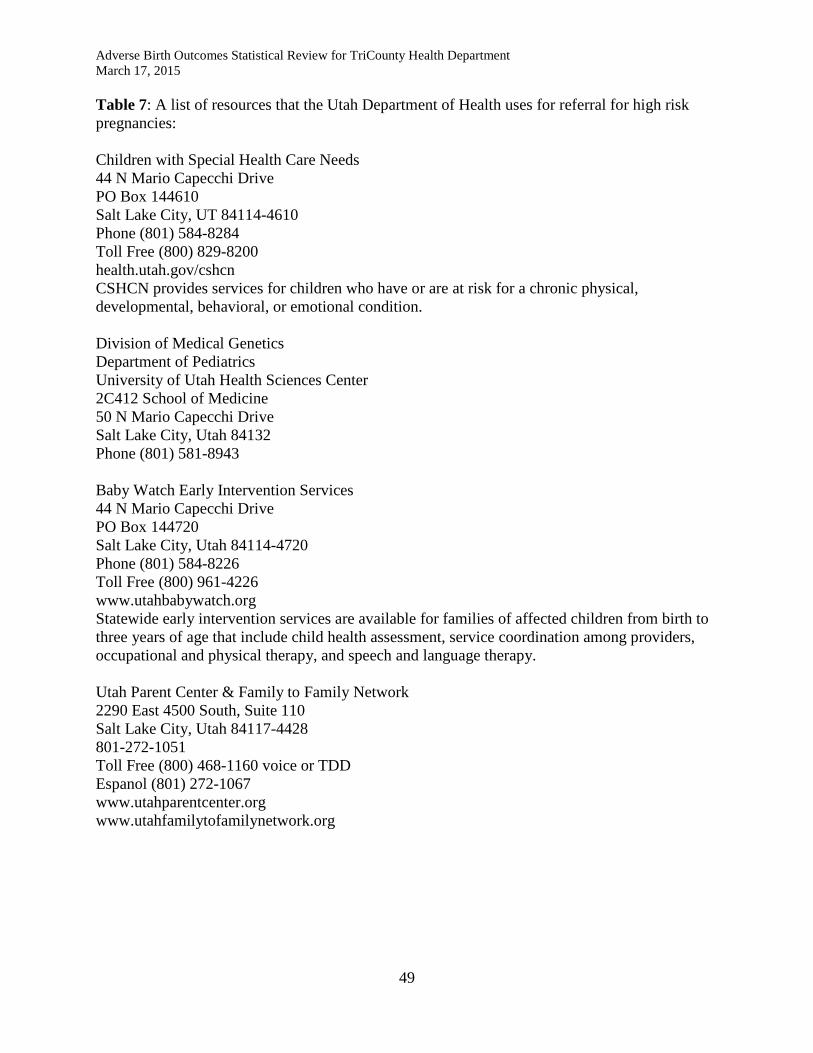
Adverse Birth Outcomes Statistical Review for TriCounty Health Department March 17, 2015
49
Table 7: A list of resources that the Utah Department of Health uses for referral for high risk pregnancies: Children with Special Health Care Needs 44 N Mario Capecchi Drive PO Box 144610 Salt Lake City, UT 84114-4610 Phone (801) 584-8284 Toll Free (800) 829-8200 health.utah.gov/cshcn CSHCN provides services for children who have or are at risk for a chronic physical, developmental, behavioral, or emotional condition. Division of Medical Genetics Department of Pediatrics University of Utah Health Sciences Center 2C412 School of Medicine 50 N Mario Capecchi Drive Salt Lake City, Utah 84132 Phone (801) 581-8943 Baby Watch Early Intervention Services 44 N Mario Capecchi Drive PO Box 144720 Salt Lake City, Utah 84114-4720 Phone (801) 584-8226 Toll Free (800) 961-4226 www.utahbabywatch.org Statewide early intervention services are available for families of affected children from birth to three years of age that include child health assessment, service coordination among providers, occupational and physical therapy, and speech and language therapy. Utah Parent Center & Family to Family Network 2290 East 4500 South, Suite 110 Salt Lake City, Utah 84117-4428 801-272-1051 Toll Free (800) 468-1160 voice or TDD Espanol (801) 272-1067 www.utahparentcenter.org www.utahfamilytofamilynetwork.org

Adverse Birth Outcomes Statistical Review for TriCounty Health Department March 17, 2015
50
Utah Family Voices – Family to Family Health Information Center Phone (801) 272-1068 Toll Free (800) 468-1160 www.utahfamilyvoices.org/ This is a resource for families with a child or family member with a physical, mental, or developmental special needs Medical Home Portal Department of Pediatrics University of Utah PO Box 581289 Salt Lake City, UT 84158 www.medicalhomeportal.org
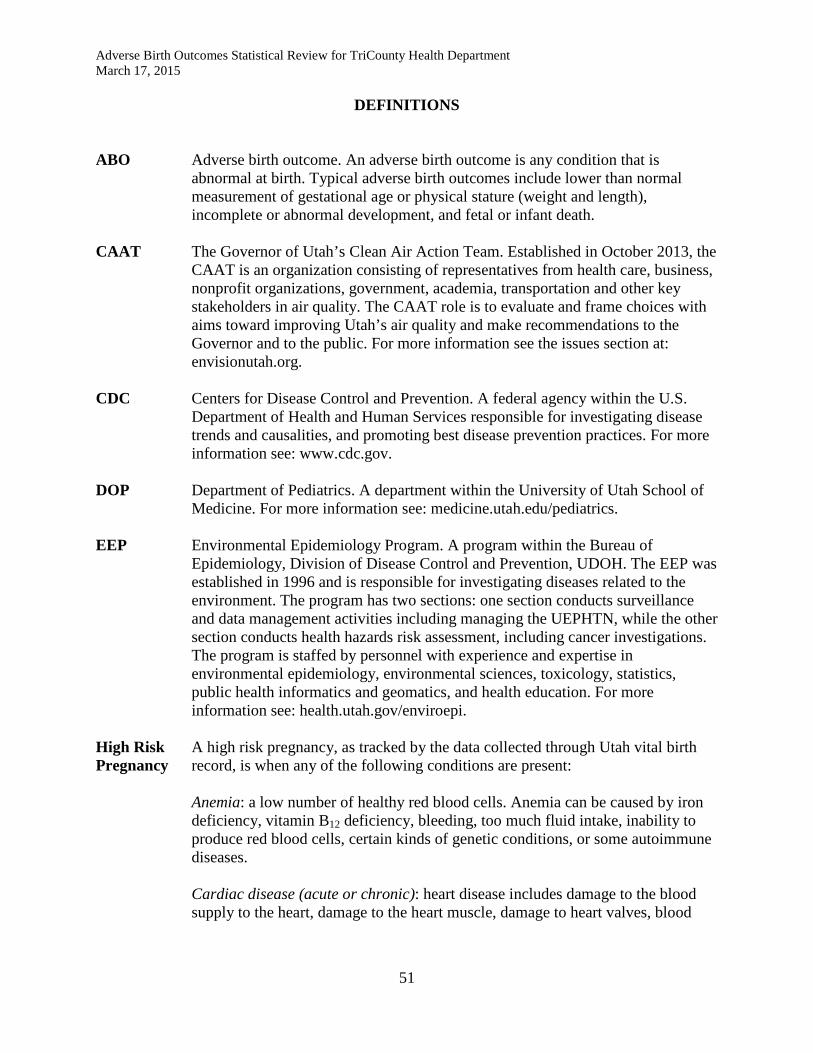
Adverse Birth Outcomes Statistical Review for TriCounty Health Department March 17, 2015
51
DEFINITIONS ABO Adverse birth outcome. An adverse birth outcome is any condition that is
abnormal at birth. Typical adverse birth outcomes include lower than normal measurement of gestational age or physical stature (weight and length), incomplete or abnormal development, and fetal or infant death.
CAAT The Governor of Utah’s Clean Air Action Team. Established in October 2013, the
CAAT is an organization consisting of representatives from health care, business, nonprofit organizations, government, academia, transportation and other key stakeholders in air quality. The CAAT role is to evaluate and frame choices with aims toward improving Utah’s air quality and make recommendations to the Governor and to the public. For more information see the issues section at: envisionutah.org.
CDC Centers for Disease Control and Prevention. A federal agency within the U.S.
Department of Health and Human Services responsible for investigating disease trends and causalities, and promoting best disease prevention practices. For more information see: www.cdc.gov.
DOP Department of Pediatrics. A department within the University of Utah School of
Medicine. For more information see: medicine.utah.edu/pediatrics. EEP Environmental Epidemiology Program. A program within the Bureau of
Epidemiology, Division of Disease Control and Prevention, UDOH. The EEP was established in 1996 and is responsible for investigating diseases related to the environment. The program has two sections: one section conducts surveillance and data management activities including managing the UEPHTN, while the other section conducts health hazards risk assessment, including cancer investigations. The program is staffed by personnel with experience and expertise in environmental epidemiology, environmental sciences, toxicology, statistics, public health informatics and geomatics, and health education. For more information see: health.utah.gov/enviroepi.
High Risk A high risk pregnancy, as tracked by the data collected through Utah vital birth Pregnancy record, is when any of the following conditions are present: Anemia: a low number of healthy red blood cells. Anemia can be caused by iron
deficiency, vitamin B12 deficiency, bleeding, too much fluid intake, inability to produce red blood cells, certain kinds of genetic conditions, or some autoimmune diseases.
Cardiac disease (acute or chronic): heart disease includes damage to the blood
supply to the heart, damage to the heart muscle, damage to heart valves, blood

Adverse Birth Outcomes Statistical Review for TriCounty Health Department March 17, 2015
52
leakage between chambers (murmurs), abnormal heart rhythm, and inflammation of heart tissue.
Diabetes: a metabolic condition that results in the inability to properly maintain
blood sugar levels. Eclampsia: a condition resulting in sudden seizures and coma that can be life
threatening. It may be the result of excessive pregnancy-related shock triggering compounds or regulatory compounds in the blood.
Hypertension: high blood pressure can cause damage to most of the body systems.
Approximately 8-10% of pregnancies involve hypertension. Hypertension can be caused by poor diet and lack of exercise; certain medications; excessive stress; diseases of the heart, kidney, adrenal glands or thyroid; obstructive sleep apnea; and drug, alcohol and tobacco use.
Hemoglobinopathy: a condition that results in abnormal formation of the
hemoglobin molecule that is used by red blood cells to carry oxygen to body tissues. One example is sickle-cell anemia. Most hemoglobinopathies are the result of a genetic defect.
Incompetent cervix: a cervix that is not strong enough to carry the weight of the
growing fetus to full term. An incompetent cervix may result from a previous surgery or damage to the cervix, or a maternal birth defect that results in a malformed cervix.
Infections: The following genital infections are the most common, but they are not
all of the possible infections that are associated with adverse birth outcomes.
Infection Stillbirths Other ABO Borreliosis (Lyme disease) X Chlamydia X Coxsackie virus X Cytomegalovirus X X Gonorrhea X Group B Streptococcus X Herpes simplex X HIV X Influenza X Leptospirosis X Listeriosis X Malaria X Parvovirus B19 X Q fever X Rubella (German measles) X X Syphilis X

Adverse Birth Outcomes Statistical Review for TriCounty Health Department March 17, 2015
53
Toxoplasmosis X X Trichomonas X Ureaplasmosis X Varicella (Chicken pox) X
Lung disease (acute or chronic): conditions resulting from anatomical, hormonal,
or functional changes to the lung; or the presence of chronic obstructive pulmonary disease; or past history of physical injury.
Oligohydramnios: insufficient amniotic fluid in the womb. Oligohydramnios can
be caused by other health problems, certain medications, ruptures in the amniotic sac, or certain birth defects.
Polyhydramnios: excessive amounts of amniotic fluid in the womb.
Polyhydramnios is caused by diabetes, certain birth defects that prevent the baby from swallowing, a mismatch between fetal and maternal blood types, problems with the baby’s heart rate, and certain kinds of infections.
Previous history of adverse birth outcomes: the risk for subsequent adverse birth
outcomes is up to four times higher if the mother has already had an adverse birth outcome pregnancy.
Renal disease (acute or chronic): caused by damage to or failure of the kidneys as
a result of hypertension, injury, kidney stones, anemia, or toxic substances. Rh sensitization: an immune response by an Rh-negative mother to an Rh-positive
baby’s blood. The Rh factor is a protein that is on the surface of red blood cells. An Rh-negative mother’s blood lacks that protein, while an Rh-positive baby’s blood has that protein. The mother’s immune system will see the Rh factor in the baby’s blood as a foreign protein and try to destroy it. The baby gets its Rh-positive status from the father.
Uterine bleeding: may result from injury or infections of the uterus, the use of
certain drugs, and certain genetic conditions. IUGR Intrauterine growth restriction is a condition in which a baby in the womb fails to
grow at the expected rate during pregnancy. In many cases, IUGR is the result of a condition that prevents the developing fetus from getting enough oxygen or nutrients for normal growth. A common cause is placental insufficiency, in which the placental tissue that delivers oxygen and nutrients to the fetus is not attached properly to the womb or isn’t working correctly. IUGR can be symmetrical (where all parts of the baby’s body are equally small but in proper proportion to each other) or asymmetrical (where the baby’s head is of normal size, but the rest of the body is small).
LBW Low-birth-weight. Babies that weigh less than 2,500 grams (5.5 pounds) at birth.
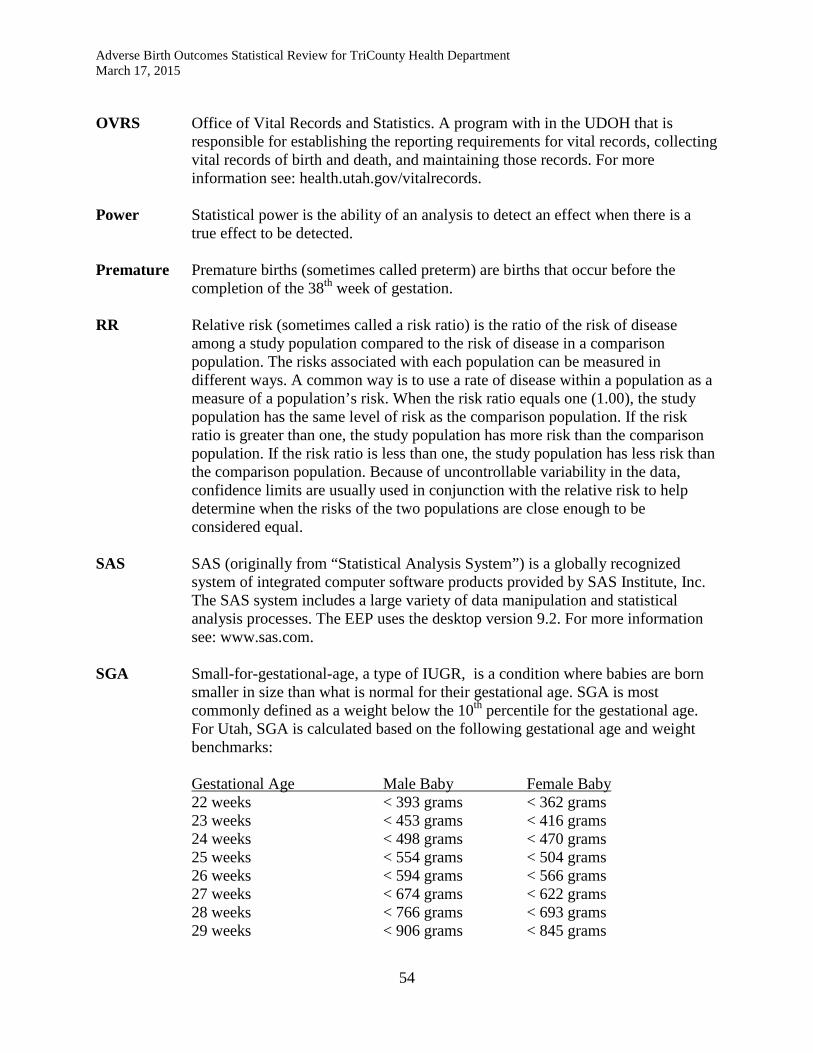
Adverse Birth Outcomes Statistical Review for TriCounty Health Department March 17, 2015
54
OVRS Office of Vital Records and Statistics. A program with in the UDOH that is
responsible for establishing the reporting requirements for vital records, collecting vital records of birth and death, and maintaining those records. For more information see: health.utah.gov/vitalrecords.
Power Statistical power is the ability of an analysis to detect an effect when there is a
true effect to be detected. Premature Premature births (sometimes called preterm) are births that occur before the
completion of the 38th week of gestation. RR Relative risk (sometimes called a risk ratio) is the ratio of the risk of disease
among a study population compared to the risk of disease in a comparison population. The risks associated with each population can be measured in different ways. A common way is to use a rate of disease within a population as a measure of a population’s risk. When the risk ratio equals one (1.00), the study population has the same level of risk as the comparison population. If the risk ratio is greater than one, the study population has more risk than the comparison population. If the risk ratio is less than one, the study population has less risk than the comparison population. Because of uncontrollable variability in the data, confidence limits are usually used in conjunction with the relative risk to help determine when the risks of the two populations are close enough to be considered equal.
SAS SAS (originally from “Statistical Analysis System”) is a globally recognized
system of integrated computer software products provided by SAS Institute, Inc. The SAS system includes a large variety of data manipulation and statistical analysis processes. The EEP uses the desktop version 9.2. For more information see: www.sas.com.
SGA Small-for-gestational-age, a type of IUGR, is a condition where babies are born
smaller in size than what is normal for their gestational age. SGA is most commonly defined as a weight below the 10th percentile for the gestational age. For Utah, SGA is calculated based on the following gestational age and weight benchmarks:
Gestational Age Male Baby Female Baby 22 weeks < 393 grams < 362 grams 23 weeks < 453 grams < 416 grams 24 weeks < 498 grams < 470 grams 25 weeks < 554 grams < 504 grams 26 weeks < 594 grams < 566 grams 27 weeks < 674 grams < 622 grams 28 weeks < 766 grams < 693 grams 29 weeks < 906 grams < 845 grams
Adverse Birth Outcomes Statistical Review for TriCounty Health Department March 17, 2015
55
30 weeks < 1,044 grams < 965 grams 31 weeks < 1,241 grams < 1,180 grams 32 weeks < 1,475 grams < 1,390 grams
33 weeks < 1,712 grams < 1,638 grams 34 weeks < 1,957 grams < 1,872 grams 35 weeks < 2,192 grams < 2,099 grams 36 weeks < 2,410 grams < 2,299 grams 37 weeks < 2,609 grams < 2,495 grams 38 weeks < 2,807 grams < 2,694 grams 39 weeks < 2,947 grams < 2,834 grams 40 weeks < 3,029 grams < 2,919 grams More than 40 weeks < 3,063 grams < 2,949 grams TCHD TriCounty Health Department. One of the 13 local health departments with public
health jurisdiction in Utah. TCHD provides public health services to all residents within Daggett, Duchesne, and Uintah counties in Utah. For more information see: www.tricountyhealth.com or call (435) 247-1177.
UDOH Utah Department of Health, one of the executive agencies within Utah state
government. The UDOH strives to improve health in Utah through promoting healthy lifestyles, evidence-based interventions, creating healthy and safe communities, and eliminating health disparities. The EEP is a program within the UDOH. For more information, see: health.utah.gov.
UEPHTN Utah Environmental Public Health Tracking Network. The UEPHTN is a data
warehouse that contains health outcomes, environmental, and supporting data. Data from the UDOH Office of Vital Records and Statistics and population data derived from the U.S. Census Bureau are warehoused in the UEPHTN. For more information see: epht.health.utah.gov/epht-view.

Adverse Birth Outcomes Statistical Review for TriCounty Health Department March 17, 2015
56
APPENDIX A
Identifying Mother’s Health Risk Group: Each mother was placed into one of 32 risk groups representing all of the permutations of maternal health risk factors that were controlled for in this investigation. Each record was annotated with a risk group numeric variable. The following process was used create a risk group identity for the mother:
• If the mother was a teenager, or if this was the mother’s first pregnancy, 1 was added to the risk group variable.
• If the mother’s weight was over 200 lbs. at the first prenatal care visit, 2 was added to the risk group variable.
• If the mother was of a minority race or ethnic group, 4 was added to the risk group variable.
• If the mother used tobacco, and/or alcohol, and/or recreational drugs during the pregnancy, 8 was added to the risk group variable.
• If the mother had any chronic or pregnancy-induced medical condition, such as diabetes, 16 was added to the risk group variable.
Through this addition process, the mother was classified into one of 32 groups (identified with labels from 0 to 31). Note that the value of the risk group variable does not quantify the mother’s risk. The value is simply an identifier for one of the 32 risk groups. For example:
• A healthy mother would be in the “no risk” group, labeled with the value 0. • An otherwise healthy teenager would be in risk group 1. • An overweight teenager would be in risk group 3 (1 for teenager + 2 for overweight). • An overweight teenager with diabetes would be in group 19 (1 for teenager + 2 for
overweight + 16 for medical condition). • A mother of minority race or ethnicity who used tobacco would be in group 12 (4 for
minority + 8 for tobacco use). • A teenage mother of minority race who used tobacco would be in group 13 (1 for
teenager + 4 for minority + 8 for tobacco use). • A mother with all of the risk factors would be in group 31 (1 + 2 + 4 + 8 + 16).

Adverse Birth Outcomes Statistical Review for TriCounty Health Department March 17, 2015
57
APPENDIX B Indirect Standardized Incidence Rate. The raw (sometimes called “crude”) disease incidence rate (number of new cases per time period divided by the person-years per period) reflects reality. The raw rate is the simplest and most straightforward summary of the population experience. Interpretation of a disease rate involves a contrast of that rate with some comparison rate to determine if the rate in question is higher or lower. The comparison rate should reflect what is normal if the disease occurred randomly. Because rates will almost always involve comparing two populations with different distributions of various demographic and risk factors, comparison of a raw disease incidence rate with a comparison rate is problematic. It does not make sense to compare the rate of disease of a relatively young population with a relatively old population for a disease that is more common in the elderly. One would not be able to state with confidence that the disease rate is higher or lower than expected. For this reason, when the objective is to compare two rates, standardized rates are preferable. However, it should be noted that the rate itself, once standardized, is not the exact disease burden. The standardized rate should be of the same magnitude as the raw rate. The indirect standardization method is preferable when stratified disease counts are small or zero. A disadvantage of the indirect method is that the rate is comparable to the comparison population used in its computation, but is not comparable to other population rates. For example, for this study, the study area’s rates are adjusted using the Utah state population and therefore are comparable to the Utah state rates. However, they are not comparable to other Utah county rates or to national rates. The indirect standardized rate for the study area (ISRM) is calculated by:
𝐼𝐼𝐼𝑀 = 𝐶𝑀
∑ �𝐶𝑈,𝐹𝑃𝑈,𝐹
𝑃𝑀,𝐹�𝐹
× �𝐶𝑈𝑃𝑈� × 𝐼𝐹
Where: ISRM is the indirect standardized incidence rate for the study area. CM is the total case count for the study area. F is a strata level used to control for certain risks such as age, sex, or some
behavior. CU,F is a case count of one strata (i.e., an age group) in the comparison
population (i.e., the state of Utah). PU,F is the population count of one strata in the comparison population
(i.e., the state of Utah).

Adverse Birth Outcomes Statistical Review for TriCounty Health Department March 17, 2015
58
PM,F is the population count (in terms of person-years) of one strata in the study population.
. CU is the total case count for the comparison population. PU is the total population count (in terms of person years) for the
comparison population. SF is a scaling factor. For this investigation the scaling factor is set to
10,000. For purposes of presentation, a rate of 60 cases per 10,000 people is easier to understand than a rate of 0.0006 cases per person.
Standardized Incidence Ratio. The standardized incidence ratio (SIR) is a way of comparing two rates. When using indirect standardization, the SIR is the first term of the formula to compute the rate.
𝐼𝐼𝐼 = 𝐶𝑀
∑ �𝐶𝑈,𝐹𝑃𝑈,𝐹
𝑃𝑀,𝐹�𝐹
=𝐶𝑀𝐸𝑀
The Byar’s 95% confidence limits (Zα = 1.96) can be calculated for the SIR by:
𝐼𝐼𝐼�⃖����⃗ =(𝐶𝑀 + 𝑘)
𝐸𝑀× �1 − �
13 ∙ (𝐶𝑀 + 𝑘)� + �
±1.963 ∙ �𝐶𝑀 + 𝑘
��3
Where: SIR is the standardized incidence ratio. The double-arrowed bar over the
SIR means the upper and lower confidence limits of the SIR. EM is the expected case count for the study area for a specific analytical
period. This count is derived by rescaling the comparison population to the same size as the study population.
k is a constant for symmetry. For the upper confidence limit, k = 1. For the
lower confidence limit, k = 0. ±1.96 is the normal distribution (Zα) function for a 95% confidence
interval. For the upper confidence interval it is a positive value. For the lower confidence interval it is a negative value.

Adverse Birth Outcomes Statistical Review for TriCounty Health Department March 17, 2015
59
APPENDIX C
An Initial Evaluation of Birth Defect Occurrence in the Tri-County Area, Utah Prepared by Lorenzo Botto, Marcia Feldkamp, Sergey Krikov, Matt Reeder
Division of Medical Genetics, University of Utah 29 August 2014
Background. This preliminary report addresses a request to us from the leadership of the Department of Health’s birth defect program to help respond to a rumor about an increase of birth defect occurrence in the Tri-County area in Utah. A separate report addresses a recommended approach to these investigations. Here we focus on the findings so far and on specific recommendations for next steps. The nature of the rumor and the stepwise approach to the investigation. One challenge for us in this investigation is the nebulous (for us) nature of the rumor. As far as we understand, the rumor relates in part to a perceived excess of early deaths (possibly stillbirths or infant deaths), and in part on a report by Dr Brian Moench of a perceived excess in the occurrence of rare birth defects. A first step in a rumor investigation is to gather initial data to confirm the cases, gather initial data to make an initial determination of whether a potential cluster is indeed present, and to open two-way communication with the concerned community. We understand that this step has not been completed yet. These would be our recommendations relative to this initial step: 1-We are available to help gather the initial data, in particular to clarify the nature of the perceived cluster or increase. However, we believe that this should be initiated and driven by the Department of Health, as the main responding agency. For our part, we (preferably one of our medical genetic professionals) can be available to work with a designated DOH person to interview the reporting individuals, including Dr Moench if he is available. The goal would be to clarify the perceived nature of the cluster—how many cases, what birth defects, what other clinical presentation, where and when the babies were born and diagnosed, presence of family history or genetic factors, concerns related to exposures. This information is crucial when deciding whether or not pursuing further step in the investigation. 2-DOH would benefit from establishing and maintaining a mechanism for open communication between the community and the agency, so that information can be shared and explained. We can be available to share our clinical and epidemiologic expertise during these conversations. A second step is to assess available data to begin evaluating more rigorously whether a cluster may be present. A cluster can be operationally defined as a greater than expected number of birth defect cases that occurs within a group of people in a geographic area over a defined period of time. After discussion with and in agreement with Amy Nance (UBDN) relative to the time frame, geographic area, and background information, our group went forward with the following scope of work:
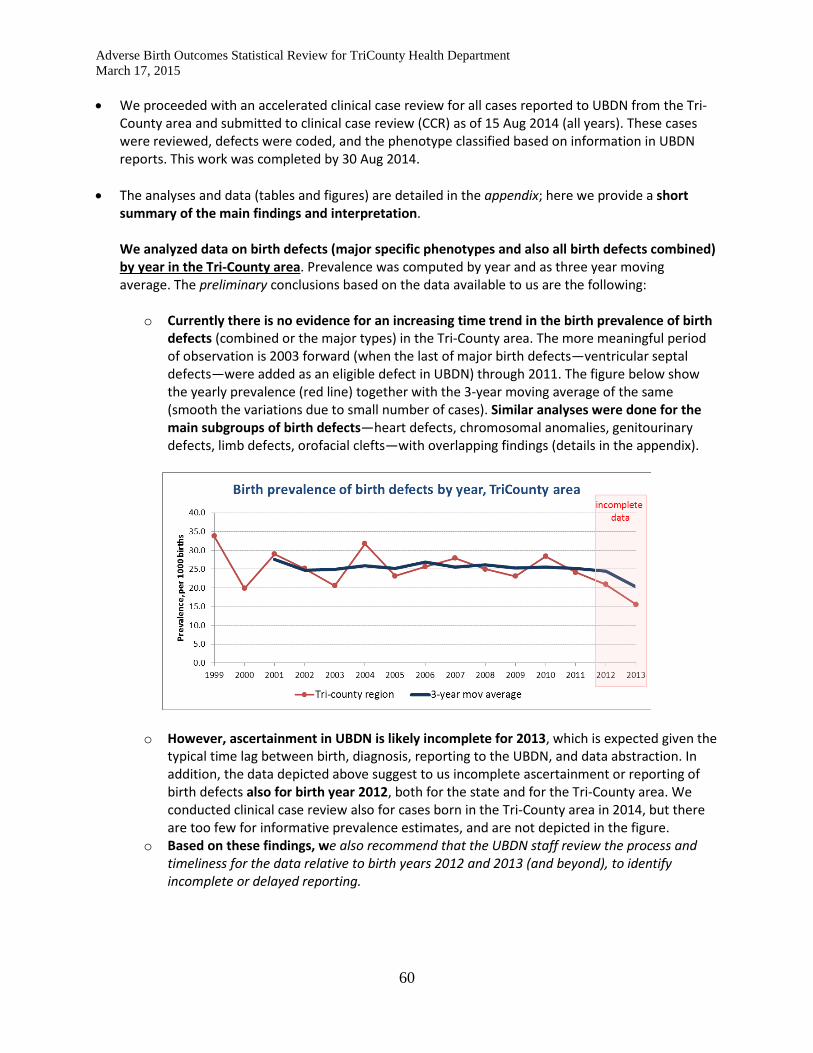
Adverse Birth Outcomes Statistical Review for TriCounty Health Department March 17, 2015
60
• We proceeded with an accelerated clinical case review for all cases reported to UBDN from the Tri-County area and submitted to clinical case review (CCR) as of 15 Aug 2014 (all years). These cases were reviewed, defects were coded, and the phenotype classified based on information in UBDN reports. This work was completed by 30 Aug 2014.
• The analyses and data (tables and figures) are detailed in the appendix; here we provide a short summary of the main findings and interpretation. We analyzed data on birth defects (major specific phenotypes and also all birth defects combined) by year in the Tri-County area. Prevalence was computed by year and as three year moving average. The preliminary conclusions based on the data available to us are the following:
o Currently there is no evidence for an increasing time trend in the birth prevalence of birth defects (combined or the major types) in the Tri-County area. The more meaningful period of observation is 2003 forward (when the last of major birth defects—ventricular septal defects—were added as an eligible defect in UBDN) through 2011. The figure below show the yearly prevalence (red line) together with the 3-year moving average of the same (smooth the variations due to small number of cases). Similar analyses were done for the main subgroups of birth defects—heart defects, chromosomal anomalies, genitourinary defects, limb defects, orofacial clefts—with overlapping findings (details in the appendix).
o However, ascertainment in UBDN is likely incomplete for 2013, which is expected given the typical time lag between birth, diagnosis, reporting to the UBDN, and data abstraction. In addition, the data depicted above suggest to us incomplete ascertainment or reporting of birth defects also for birth year 2012, both for the state and for the Tri-County area. We conducted clinical case review also for cases born in the Tri-County area in 2014, but there are too few for informative prevalence estimates, and are not depicted in the figure.
o Based on these findings, we also recommend that the UBDN staff review the process and timeliness for the data relative to birth years 2012 and 2013 (and beyond), to identify incomplete or delayed reporting.
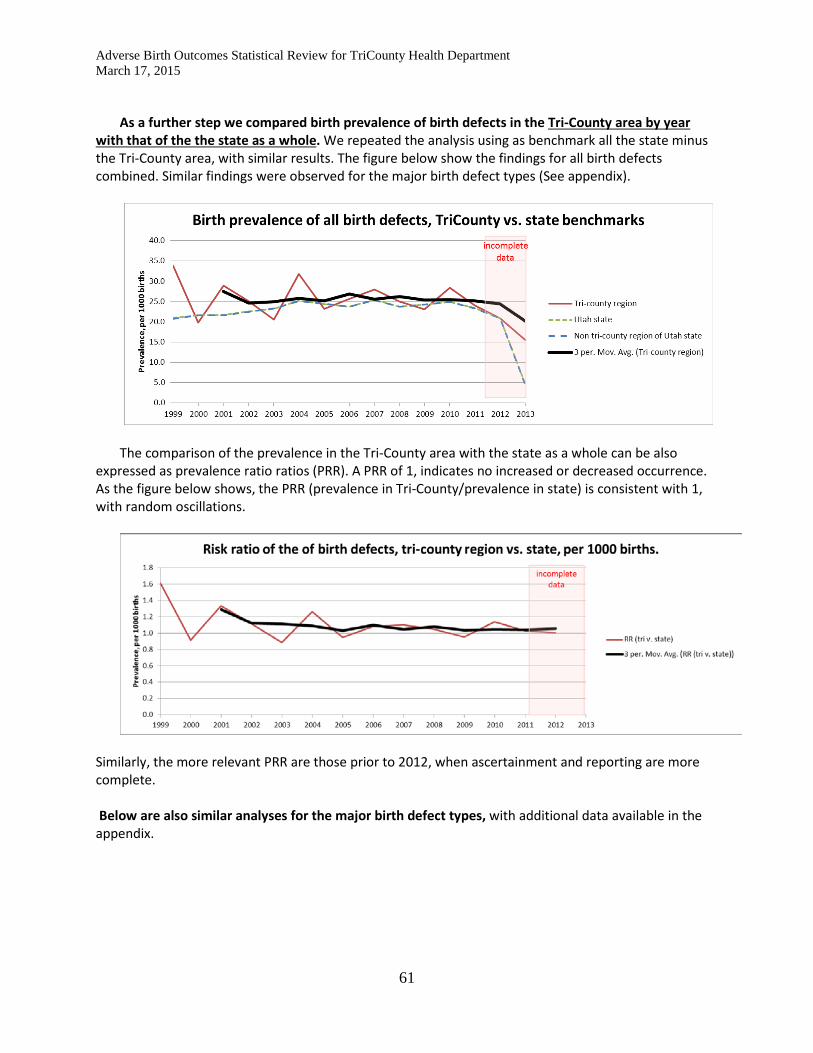
Adverse Birth Outcomes Statistical Review for TriCounty Health Department March 17, 2015
61
As a further step we compared birth prevalence of birth defects in the Tri-County area by year
with that of the the state as a whole. We repeated the analysis using as benchmark all the state minus the Tri-County area, with similar results. The figure below show the findings for all birth defects combined. Similar findings were observed for the major birth defect types (See appendix).
The comparison of the prevalence in the Tri-County area with the state as a whole can be also expressed as prevalence ratio ratios (PRR). A PRR of 1, indicates no increased or decreased occurrence. As the figure below shows, the PRR (prevalence in Tri-County/prevalence in state) is consistent with 1, with random oscillations.
Similarly, the more relevant PRR are those prior to 2012, when ascertainment and reporting are more complete. Below are also similar analyses for the major birth defect types, with additional data available in the appendix.

Adverse Birth Outcomes Statistical Review for TriCounty Health Department March 17, 2015
62

Adverse Birth Outcomes Statistical Review for TriCounty Health Department March 17, 2015
63
In summary:
• We conducted accelerated clinical case review of babies with birth defects born to date to mothers
resident in the Tri-County area and reported to the UBDN • Ascertainment is likely incomplete for 2013 and in part 2012, and we recommend a review of the
UBDN procedures and data sources for those years at a minimum • We analyzed available data specifically looking for time trends within the Tri-County area and for
variations compared to the state as a whole, and found no abnormal signals to date. This preliminary conclusion should be reassessed when more complete or recent data are available
• It is important to look at birth defect types, which are typically more informative than looking at all birth defects combined. We evaluated the major types of birth defects as well as cases associated with chromosomal anomalies and found no unusual pattern or increase at this time. This analysis can be revisited either when more data become available or if there are specific questions raised by an evaluation of the rumor itself (e.g., if the concern is about a specific type of birth defect). At the same time, data analyses and stratifications (by type, time, place, and population subgroup) are statistically limited by increasingly smaller sample size that are generated as the stratification increases.
Related Documents