ADVANCED MASTERS IN STRUCTURAL ANALYSYS OF MONUMENTS AND HISTORICAL CONSTRUCTION Master’s Thesis Sarah Francisca Dynamic characterisation of the bell tower of Sant Cugat Monastery. University of Minho Spain | 2020 Dynamic characterisation of the bell tower of Sant Cugat Monastery. Sarah Francisca Spain | 2020

Welcome message from author
This document is posted to help you gain knowledge. Please leave a comment to let me know what you think about it! Share it to your friends and learn new things together.
Transcript

ADVANCED MASTERS IN STRUCTURAL ANALYSYS OF MONUMENTS AND HISTORICAL CONSTRUCTION
Master’s Thesis
Sarah Francisca
Dynamic characterisation of the bell tower of Sant Cugat Monastery.
University of Minho
Spain | 2020
Dynam
ic c
hara
cteri
sati
on o
f th
e b
ell t
ow
er
of
Sant
Cuga
t M
onast
ery
. Sa
rah
Fran
cisca
Sp
ain
| 2
020


Dynamic characterisation of the bell tower of Sant Cugat Monastery
ADVANCED MASTERS IN STRUCTURAL ANALYSIS OF MONUMENTS AND HISTORICAL
CONSTRUCTIONS ii
This page is left blank on purpose.

Dynamic characterisation of the bell tower of Sant Cugat Monastery
ADVANCED MASTERS IN STRUCTURAL ANALYSIS OF MONUMENTS AND HISTORICAL
CONSTRUCTIONS iii
ACKNOWLEDGEMENTS
I would like to express my most sincere appreciation to all those who supported and encouraged me
throughout this rewarding experience with the SAHC master’s program. I would like to express gratitude
to all the professors who taught the coursework at the University of Minho, as each one increased both
my knowledge base and passion for conservation engineering. In addition to the wonderful professors,
I would like to thank the master’s consortium for the scholarship that I was awarded as it greatly
influenced my decision to pursue this opportunity.
I would like to thank my dissertation supervisors, Professors Climent Molins and Nirvan Makoond, for
providing me with the opportunity to work on such an interesting topic and develop my knowledge in the
field. I would also like to thank them for their constant support and encouragement despite the tough
times with COVID-19. Without them, this thesis would not have been possible.
I would like to recognize the influence that my former University Professor and conservation engineering
mentor, Jack Vandenberg, had on my decision to pursue this master’s. Without his encouragement and
mentorship, I do not think that I would be where I am today. I would also like to thank former SAHC
students and colleagues, Carol Kung and Sandryne Lefebrve, for sharing their SAHC experience with
me and encouraging the endeavour.
Lastly, I would like to give immense gratitude to my family for always pushing me to achieve my dreams
and supporting me with everything that I do. I would also like to acknowledge the amazing people that
became my family during my time in Portugal. I am forever grateful for their kindness, friendship, and
support. SAHC 2020 will never be forgotten.

Dynamic characterisation of the bell tower of Sant Cugat Monastery
ADVANCED MASTERS IN STRUCTURAL ANALYSIS OF MONUMENTS AND HISTORICAL
CONSTRUCTIONS iv
This page is left blank on purpose.

Dynamic characterisation of the bell tower of Sant Cugat Monastery
ADVANCED MASTERS IN STRUCTURAL ANALYSIS OF MONUMENTS AND HISTORICAL
CONSTRUCTIONS v
ABSTRACT
Recent investigations have revealed that the bell tower of the Monastery of Sant Cugat could be
continuing to experience lateral displacement linked to an active deterioration mechanism. As such, it
was envisioned that obtaining key dynamic characteristics of the bell tower through full-scale ambient
vibration testing (AVT) may help calibrate a numerical finite element (FE) model to better understand
the deterioration mechanisms affecting the tower, if any. Therefore, it was the objective of this
dissertation to develop a robust procedure for the dynamic identification of the bell tower including a
preliminary state-of-the-art literature review, the creation of a suitable numerical model to obtain
expected modal properties, and a detailed dynamic testing procedure to be conducted in the future.
Both a simplified and more detailed FE model were constructed in DIANA FEA to obtain expected modal
parameters. The modal parameters were compared, and it was concluded that the simplified model
validifies the full solid model. However, the solid model should be utilized for the dynamic
characterisation as it is more accurate and is able to produce three-dimensional global and local mode
shapes. Various restraint scenarios were analysed in the FE models since the supports and connections
of the bell tower are unknown. This included modelling the tower fixed as a cantilever and with lateral
restraints. The possibility of poor soil-structure interaction was also considered through the
implementation of boundary springs at the base of the tower. An iterative sensitivity analysis was
conducted to obtain ranges of stiffness for the boundary surfaces. Following the analyses, it was
observed that eigenfrequencies tend to decrease with reduced stiffness at the boundary surfaces.
Therefore, when analysing the results from the dynamic testing, lower eigenfrequencies likely indicate
loss of stiffness at one or more connection surfaces. The aim of the iterative model updating procedure
is to identify the source of the observed flexibility.
The information obtained from the literature review and the FE models was utilized to design a dynamic
testing campaign using AVT to obtain experimental modal parameters. Accelerometer locations were
suggested according to the modal parameters obtained in the preliminary FE models and the testing will
require 2 triaxial accelerometers, 4 uniaxial accelerometers, 10 cables and 10 channels to be connected
to the centralized data acquisition system. Two acquisitions were recommended to capture the modal
properties of both the bell tower and the bells.
Once the dynamic testing has been conducted, modal analysis software may be used to identify the
modal parameters of the bell tower through operational modal analysis identification techniques and
calibration of the numerical model can be achieved through iterative modification of the defined updating
parameters. Following model calibration, the cause of the lateral displacement of the bell tower may
become apparent. In addition, the calibrated model may be used to analyse the dynamic interaction
between the bells and the supporting structure.

Dynamic characterisation of the bell tower of Sant Cugat Monastery
ADVANCED MASTERS IN STRUCTURAL ANALYSIS OF MONUMENTS AND HISTORICAL
CONSTRUCTIONS vi
This page is left blank on purpose.

Dynamic characterisation of the bell tower of Sant Cugat Monastery
ADVANCED MASTERS IN STRUCTURAL ANALYSIS OF MONUMENTS AND HISTORICAL
CONSTRUCTIONS vii
ABSTRACTE
Investigacions recents han revelat que el campanar del monestir de Sant Cugat podria continuar
l'experiència de desplaçament lateral lligat a un mecanisme de deteriorament actiu. Com a tal, es va
preveure que l'obtenció de característiques dinàmiques clau del campanar a través de proves de
vibració ambiental a gran escala (AVT) pot ajudar a calibrar un model numèric d'elements finits (FE) per
comprendre millor els mecanismes de deteriorament que afecten la torre, si escau. Per tant, va ser
l'objectiu d'aquesta dissertació per desenvolupar un procediment robust per a la identificació dinàmica
del campanar incloent una revisió preliminar de la literatura d'última generació, la creació d'un model
numèric adequat per obtenir propietats modals que s'esperava, i un detallat procediment de proves
dinàmiques que es durà a terme en el futur.
Es van construir models de FE simplificats i complets a Diana FEA to per obtenir paràmetres
modalsque s'esperava. S'han comparat els paràmetres modals i es va concloure que el model
simplificat validifica tot el model sòlid, però, el model sòlid s'ha d'utilitzar per a la caracterització
dinàmica, ja que és més precís i és capaç de produir formes de mode tridimensional globals i locals.
En els models fe es van analitzar diversos escenaris de contenció, ja que els suports i les connexions
del campanar són desconeguts. Això incloïa la modelització de la torre fixada com a voladís i amb
restriccions laterals. La possibilitat de la mala interacció de l'estructura del sòl també es va plantejar
mitjançant l'aplicació de fonts de frontera a la base de l'estructura. Es va realitzar una anàlisi de
sensibilitat iterativa per obtenir rangs de rigidesa per a les superfícies de la frontera. Després de les
anàlisis, es va observar que les eigenfreqüències tendeixen a disminuir amb la rigidesa reduïda a la
superfície de la frontera. Per tant, en analitzar els resultats de les proves dinàmiques, els
eigenfreqüències inferiors indiquen la pèrdua de rigidesa en una o més superfícies de connexió.
L'objectiu del procediment d'actualització del model iteratiu és identificar l'origen de la flexibilitat
observada.
La informació obtinguda a partir de la revisió bibliogràfica i dels models FE es va utilitzar per dissenyar
una campanya de proves dinàmiques amb AVT per obtenir paràmetres modals experimentals. Els
acceleròmetres van ser col·locats segons els paràmetres modals obtinguts en els models de FE
preliminars. Es van recomanar dues adquisicions per capturar les propietats modals tant del campanar
com de les campanes. Un cop realitzades les proves dinàmiques, es pot emprar un programari d'anàlisi
modal per identificar els paràmetres modals del campanar a través de tècniques d'identificació d'anàlisi
modal operacional i el calibratge del model numèric que es pot aconseguir mitjançant la modificació
iterativadels paràmetres d'actualització definits. Després del calibratge del model, pot arribar a ser
evident la causa del desplaçament lateral del campanar. A més, el model calibrat es pot utilitzar per
analitzar la interacció dinàmica entre les campanes i l'estructura de suport.

Dynamic characterisation of the bell tower of Sant Cugat Monastery
ADVANCED MASTERS IN STRUCTURAL ANALYSIS OF MONUMENTS AND HISTORICAL
CONSTRUCTIONS viii
This page is left blank on purpose.

Dynamic characterisation of the bell tower of Sant Cugat Monastery
ADVANCED MASTERS IN STRUCTURAL ANALYSIS OF MONUMENTS AND HISTORICAL
CONSTRUCTIONS ix
Table of Contents
1. INTRODUCTION ............................................................................................................... 1
2. LITERATURE REVIEW: DYNAMIC IDENTIFICATION OF MASONRY TOWERS ........................ 3
2.1 Numerical Modelling Techniques ........................................................................................................ 6
2.1.1 Geometry ............................................................................................................................................... 7
2.1.2 Material Properties ................................................................................................................................ 7
2.1.3 Boundary Conditions.............................................................................................................................. 8
2.1.4 Updating Parameters ............................................................................................................................. 8
2.2 Experimental Dynamic Testing ............................................................................................................ 9
2.2.1 Testing Procedure ................................................................................................................................ 10
2.2.2 Typical Modal Parameters ................................................................................................................... 11
2.3 Modal Identification ...........................................................................................................................12
2.3.1 Signal Pre-Processing ........................................................................................................................... 13
2.3.2 Modal Identification Techniques ......................................................................................................... 13
2.3.3 Cross Validation - Modal Assurance Criterion (MAC) .......................................................................... 18
2.4 FE Model Calibration ..........................................................................................................................18
2.4.1 Manual Tuning ..................................................................................................................................... 19
2.4.2 The Inverse Eigen-Sensitivity (IE) Method ........................................................................................... 20
2.4.3 The Douglas-Reid (DR) Method ........................................................................................................... 21
2.4.4 The Genetic Algorithm Technique (GA) ............................................................................................... 21
2.4.5 Sensitivity Analysis (SA)........................................................................................................................ 22
2.5 Soil-Structure Interaction ...................................................................................................................23
2.6 Dynamic Action of the Bells ................................................................................................................25
2.6.1 Bell Systems in Europe ......................................................................................................................... 25
2.6.2 Static Analysis ...................................................................................................................................... 26
2.6.3 Dynamic Analysis ................................................................................................................................. 27
3. THE CASE STUDY: BELL TOWER OF SANT CUGAT MONASTERY ....................................... 31
3.1 Historic Survey ...................................................................................................................................32

Dynamic characterisation of the bell tower of Sant Cugat Monastery
ADVANCED MASTERS IN STRUCTURAL ANALYSIS OF MONUMENTS AND HISTORICAL
CONSTRUCTIONS x
3.1.1 Historic Values ..................................................................................................................................... 32
3.1.2 Construction Chronology ..................................................................................................................... 33
3.1.3 The Bells ............................................................................................................................................... 37
3.2 Geometrical Survey ............................................................................................................................39
3.2.1 Structure .............................................................................................................................................. 39
3.2.2 Connections ......................................................................................................................................... 43
3.2.3 Outward Tilt of SE façade ..................................................................................................................... 44
3.2.4 Limitations & Assumptions .................................................................................................................. 46
4. EXPECTED MODAL PARAMETERS ................................................................................... 47
4.1 Simplified Beam Element Estimation ..................................................................................................47
4.1.1 Geometry ............................................................................................................................................. 47
4.1.2 Materials .............................................................................................................................................. 49
4.1.3 Loads .................................................................................................................................................... 50
4.1.4 Boundary Conditions............................................................................................................................ 50
4.1.5 Mesh .................................................................................................................................................... 51
4.1.6 Linear Self Weight Analysis .................................................................................................................. 52
4.1.7 Linear Modal Response Analysis .......................................................................................................... 52
4.2 Full Solid Element Estimation .............................................................................................................52
4.2.1 Geometry ............................................................................................................................................. 52
4.2.2 Materials .............................................................................................................................................. 53
4.2.3 Loads .................................................................................................................................................... 53
4.2.4 Supports & Connections ...................................................................................................................... 53
4.2.5 Mesh .................................................................................................................................................... 57
4.2.6 Linear Self Weight Analysis .................................................................................................................. 58
4.2.7 Linear Modal Response Analysis .......................................................................................................... 58
4.3 Results & Analysis ..............................................................................................................................59
4.3.1 Linear Self Weight Analysis .................................................................................................................. 59
4.3.2 Linear Modal Response Analysis .......................................................................................................... 59
4.4 Soil-Structure Interaction ...................................................................................................................66
4.4.1 Simplified Beam Model ........................................................................................................................ 66
4.4.2 Full 3D Solid Model .............................................................................................................................. 68

Dynamic characterisation of the bell tower of Sant Cugat Monastery
ADVANCED MASTERS IN STRUCTURAL ANALYSIS OF MONUMENTS AND HISTORICAL
CONSTRUCTIONS xi
4.5 FE Model for Dynamic Calibration ......................................................................................................71
5. DYNAMIC TESTING PLAN ............................................................................................... 75
5.1 Data Acquisition .................................................................................................................................75
5.1.1 Dynamic Testing: AVT .......................................................................................................................... 75
5.1.2 Required Equipment ............................................................................................................................ 75
5.1.3 Location of Accelerometers ................................................................................................................. 76
5.1.4 Testing Procedure ................................................................................................................................ 80
5.2 Modal Parameter Identification .........................................................................................................81
5.3 Calibration of the Finite Element Model .............................................................................................81
5.4 Computation of DAF ...........................................................................................................................83
6. CONCLUSIONS ............................................................................................................... 85
6.1 Expected Modal Parameters ..............................................................................................................85
6.2 Dynamic Testing Plan .........................................................................................................................86
6.3 Future studies ....................................................................................................................................87
REFERENCES ......................................................................................................................... 89
APPENDIX A – AS-FOUND DRAWING SET .............................................................................. 93
APPENDIX B – MODE SHAPE COMPARISON......................................................................... 103

Dynamic characterisation of the bell tower of Sant Cugat Monastery
ADVANCED MASTERS IN STRUCTURAL ANALYSIS OF MONUMENTS AND HISTORICAL CONSTRUCTIONS 1
1. INTRODUCTION
The Monastery of Sant Cugat is located in Sant Cugat del Vallès, 20 km NW of Barcelona, and consists
of various components built predominantly between the 12th to 15th centuries. Recent investigations
have revealed that its bell tower, constructed between the 12th and 18th centuries, may be continuing to
experience lateral displacement linked to an active deterioration mechanism. As such, it is envisioned
that obtaining key dynamic characteristics of the bell tower through full-scale ambient vibration testing
(AVT) will help calibrate a numerical finite element model to better understand the deterioration
mechanisms affecting the tower, if any. See Figure 1 depicting the southern portion of the Monastery
including the Basilica and Bell Tower.
Figure 1 – The Sant Cugat Monastery [1]
The key modal parameters that can be extracted from AVT include the natural frequencies of the bell
tower, their associated mode shapes, and the damping ratios of the mode shapes caused by the
excitation induced by the ringing of the bells. This information can then be used to calibrate the numerical
model with the aim to identify weaknesses in the structure.
Therefore, the objective of this dissertation is to develop a robust procedure for the dynamic identification
of the bell tower of Sant Cugat Monastery. This includes a preliminary state-of-the-art literature review
regarding dynamic identification of masonry bell towers, the creation of a suitable numerical model to
obtain expected modal properties, and lastly, a detailed dynamic testing procedure to be conducted in
the future. The dynamic testing procedure will outline the logistics of the in-situ testing and the
recommended procedure for model calibration.

Dynamic characterisation of the bell tower of Sant Cugat Monastery
ADVANCED MASTERS IN STRUCTURAL ANALYSIS OF MONUMENTS AND HISTORICAL CONSTRUCTIONS 2

Dynamic characterisation of the bell tower of Sant Cugat Monastery
ADVANCED MASTERS IN STRUCTURAL ANALYSIS OF MONUMENTS AND HISTORICAL CONSTRUCTIONS 3
2. LITERATURE REVIEW: DYNAMIC IDENTIFICATION OF MASONRY
TOWERS
A comprehensive literature review of existing documentation related to the dynamic characterisation of
historic masonry bell towers was conducted to obtain a thorough understanding of the subject matter.
The literature review focuses on topics such as dynamic testing and modal identification, numerical
modelling and calibration, and the dynamic impact of swinging bells. The aim of the review is to analyse
and compare findings from different authors to generate a thorough and efficient dynamic testing plan
for the bell tower of Sant Cugat Monastery. The literature review is comprised of over 20 published
documents, the most influential of which are summarized below.
• Salvador Ivorra, Maria José Palomo, Gumersindo Verdu and Alberto Zasso (2005) [2]
researched the dynamic forces produced by swinging bells in historic bell towers including the
calculation of the maximum forces that they may induce to their supporting structure. This was
achieved through a comparison of the three most common bell ringing systems in Europe:
Central European, English and Spanish. The study found that the forces transmitted to the
supporting structure are significantly lower in the Spanish system as opposed to the others, and
emphasized that the dynamic amplification caused by the interaction between the supporting
structure and the bells involves the measurement of the dynamic characteristics of both the
bells and the tower.
• Salvador Ivorra and Francisco J. Parallarés (2006) [3] conducted dynamic investigations on
a masonry bell tower in Valencia, Spain. In this study, different numerical models were
calibrated based on ambient vibration tests to determine the modal characteristics of the tower.
This work was complimented by an analysis of the inertia forces caused by the bell swinging
and the computation of possible dynamic amplification factors. Due to the good balance of the
Spanish bells, it was found that the horizontal forces developed during their swinging is quite
low and may be considered negligible.
• C. Gentile and A. Saisi (2007) [4] conducted ambient vibration testing (AVT) of an historic
masonry tower in Monza, Italy, to characterize its dynamic properties and to conduct a damage
assessment due to concerning through-wall cracks. This study involved full scale AVT of the
tower, modal identification through operational modal analysis, and finite element modelling and
updating. A good correlation was observed between experimental and theoretical modal
behaviour and therefore the updated models were deemed to be adequate to provide reliable
predictions in the safety assessment of the tower.
• Alemdar Bayraktarm Temel Turker, Baris Sevim, Ahmet Can Altunisik and Faruk Yildirim
(2009) [5] obtained the modal parameters of the bell tower of Hagia Sophia through ambient

Dynamic characterisation of the bell tower of Sant Cugat Monastery
ADVANCED MASTERS IN STRUCTURAL ANALYSIS OF MONUMENTS AND HISTORICAL CONSTRUCTIONS 4
vibration testing. Through this analysis, it was found that the theoretical and experimental mode
shapes were in good correlation, however, the theoretical frequencies were greater than the
experimental frequencies. This study highlights common difficulties present in the dynamic
characterisation of masonry bell towers including the complex and often unknown mechanical
properties of masonry walls, the difficulties involved with accurately modelling structural
damage, and the unknown boundary conditions often associated with historical constructions.
• Salvador Ivorra, Francisco J. Pallarés and Jose M. Adam (2011) [6] created a guideline for
the dynamic considerations of masonry bell towers as the oscillations of the bells often interact
with the tower’s natural frequencies causing dynamic amplification. The paper emphasizes how
the arrangement of the bells within the bell frame can considerably impact the dynamic
interaction between the bells and the supporting structure. Therefore, modifying the excitation
frequency of the bells or adding counterweights proves to be much less expensive than
modifying the natural frequencies of the tower through structural strengthening.
• Dora Foti, Salvador Ivorra Chorro and Maria Francesca Sabba (2012) [7] conducted a
dynamic investigation of an ancient masonry bell tower in Mola di Bari, Italy. The aim of this
research was to calibrate a numerical model through operational modal analysis to better
understand the dynamic behaviour of the structure.
• Mariella Diaferio, Dora Foti and Nicola Ivan Giannocaro (2014) [8] conducted the dynamic
characterisation of an old masonry tower in Bari, Italy through ambient vibration testing
accompanied with ground penetration radar (GPR) technology. Operational modal analysis was
utilized to estimate modal parameters of the tower whereas, GPR was utilized to estimate the
wall composition at each level to characterize the masonry in the finite element (FE) model. The
results allowed for the calibration of a complete FE model which was then utilized to characterize
the tower and to evaluate the dynamic interaction between the tower and the cathedral walls.
• N. Nisticò, S. Gambarelli, A. Fascetti and G. Quaranta (2016) [9] conducted the experimental
dynamic testing and numerical modelling of an historic belfry in Rome. Although this study is
not concerning a bell tower, it provided good insight regarding the impact of swinging bells on
supporting masonry structures. Ambient vibration testing was conducted under different
dynamic loading scenarios which confirmed that severe vibrations are induced when the bells
swing, and thus a slight reduction of the swing angle was recommended.
• F. Lorenzoni, M.R. Valluzzi, M. Salvalaggio, A. Minello and C. Modena (2017) [10]
performed a modal analysis to characterize four ancient water towers located in Pompeii, Italy.
This paper reports the outcomes of ambient vibration tests and the extraction of the towers

Dynamic characterisation of the bell tower of Sant Cugat Monastery
ADVANCED MASTERS IN STRUCTURAL ANALYSIS OF MONUMENTS AND HISTORICAL CONSTRUCTIONS 5
modal properties using various operational modal analysis techniques. The obtained data was
then used to study the soil-structure interaction of the towers through model updating.
• Massimiliano Ferraioli, Lorenzo Miccoli, Donato Abruzzese and Alberto Mandara (2017)
[11] conducted a dynamic characterisation and seismic assessment of two medieval masonry
towers located in Italy. This paper describes the full-scale ambient vibration testing and modal
identification of the towers followed by the calibration of their associated finite element models.
The challenges associated with model updating were highlighted due to the many uncertain
geometrical and mechanical properties of historic masonry structures. This uncertainty causes
difficulties in conducting accurate structural assessments and highlights the importance of
independent numerical modelling and simulation of the mechanical behaviour of the masonry
itself. This paper also conducted a seismic vulnerability analysis, emphasizing that the seismic
performance of masonry towers is greatly influenced by their geometry and slenderness, the
thickness of their perimeter walls, the percentage of openings, and their boundary conditions.
• Climent Molins and Nirvan Makoond (2017) [12] analysed the dynamic behaviour of an
historic bell tower in Lleida, Spain. This investigation aimed to characterise the dynamic
behaviour of the bell tower through an analysis of the dynamic impact of different bell ringing
systems on the supporting structure. The characterisation involved full scale ambient vibration
testing, extraction of modal parameters using various operational modal analysis techniques,
and the construction and calibration of a finite element model.
• Massimiliano Ferraioli, Lorenzo Miccoli and Donato Abruzzese (2018) [13] conducted a
dynamic characterisation of an historic bell tower in Vico, Italy, using a sensitivity-based
technique for model tuning. This study involved full-scale ambient vibration testing, operational
modal analysis and dynamic-based finite element (FE) modelling. Uncertain parameters of the
FE model were adjusted to match the experimental mode shapes, then, the most sensitive
parameters were chosen as updating parameters for the sensitivity-based model tuning
technique. It was found that the soil–structure interaction was very sensitive to adjustment and
therefore, it was recommended that a geotechnical study be conducted to verify the subsurface
conditions.
• David Bru, Salvador Ivorra, Michele Betti, Jose M. Adam and Gianni Bartoli (2019) [14]
conducted a parametric dynamic interaction assessment between bells and their supporting
masonry tower structures. This included the analysis of a case study through experimental
operational modal analysis and numerical evaluation of the dynamic interaction. This paper
suggested a method to analyse the dynamic properties of masonry bell towers as a significant
dynamic interaction between the harmonic bell forces and the fundamental tower modes may
exist. The numerical analysis was performed on a calibrated finite element model.

Dynamic characterisation of the bell tower of Sant Cugat Monastery
ADVANCED MASTERS IN STRUCTURAL ANALYSIS OF MONUMENTS AND HISTORICAL CONSTRUCTIONS 6
• Milorad Pavlovic, Sebastiano Trevisani and Antonella Cecchi (2019) [15] presented a
procedure for the structural identification of masonry towers as the determination of their
structural behaviour is often complex due to material inhomogeneity, manufacturing
imperfections, geometric configuration and/or structural interaction between the layers in multi-
leaf masonry structures. In this research, an efficient procedure was proposed based on
experimental measurements and numerical modelling with the aim to estimate average
mechanical characteristics under service loads. In summary, the procedure involved the
acquisition of the fundamental frequency of the tower using digital tromographs followed by finite
element model calibration based on experimental data.
An analysis of the findings from the literature review is provided below, divided into the following
subsections: Numerical Modelling Techniques, Experimental Dynamic Testing, Modal Identification,
Finite Element (FE) Model Calibration, Soil-Structure Interaction and the Dynamic Action of the Bells.
2.1 Numerical Modelling Techniques
Dynamic characterisation requires the combination of experimental test data and analytical methods
such as finite element (FE) modelling to determine the global dynamic properties of a structure [16].
Therefore, often before dynamic testing is conducted, a preliminary FE model is created to obtain the
expected modal characteristics of the structure which helps identify where the sensors should be placed
[16]. When constructing the FE model, various parameters must be defined and/or assumed such as:
geometry, material properties, boundary conditions and updating parameters. See Figure 2 for
examples of numerically modeled bell towers from existing literature.
Figure 2 – Examples of FE models from existing literature [4] [5] [8] [13]

Dynamic characterisation of the bell tower of Sant Cugat Monastery
ADVANCED MASTERS IN STRUCTURAL ANALYSIS OF MONUMENTS AND HISTORICAL CONSTRUCTIONS 7
2.1.1 Geometry
The geometry of the numerical model is often developed in three-dimensional FE software (such as
DIANA FEA [17]) and is typically based on a geometric survey of the structure and existing structural
and architectural drawings [4] [11] [13]. In general, it was observed that 3D solid elements were utilized
to represent the load-bearing masonry walls to allow for a uniform mass distribution and the accurate
representation of openings and floors [4] [7] [11] [13]. Following the construction of the geometry, a FE
mesh was implemented to create discretized finite elements and in most cases, the mesh was refined
until the change in frequency between considered mode shapes was negligible [11] [13]. The following
commonalities between analysed FE models were observed:
• FE element type: 8-node solid (most common), 4-node tetrahedral solid, 6-node solid
• Number of nodes: 4 000 – 54 000
• Number of solid elements: 2 500 – 180 000
As can be observed, the number of nodes and elements varies considerably depending of the
refinement of the mesh. In general, the larger the number of elements, the better the mass distribution
and resulting distribution of forces.
Oftentimes, in addition to the full 3D solid model, a simplified model was also created to obtain a
preliminary idea of the expected mode shapes and to validify the 3D model. However, due to the many
assumptions required to idealise the behaviour of the tower in the simplified models, the more detailed
3D models were always chosen for dynamic characterisation [4] [7] [12].
2.1.2 Material Properties
Due to the variable, inhomogeneous and nonlinear nature of masonry as a building material, it is difficult
to assume homogeneous, linear elastic properties for the hypothetical numerical model. However, the
purpose of dynamic testing is to obtain global dynamic properties of the entire structure. Therefore, for
the purposes of this type of analysis, linear elastic behaviour is considered acceptable. The following
common assumptions regarding material properties were observed from the literature review:
• Linear elastic isotropic material behaviour [7] [10] [11] [13]
• Constant self-weight per unit volume of masonry [4] [7] [11] [13] [15]
• Constant Poisson’s ratio [4] [11] [13] [15]
A range of linear elastic material properties was defined based on the literature review as shown in
Table 1.

Dynamic characterisation of the bell tower of Sant Cugat Monastery
ADVANCED MASTERS IN STRUCTURAL ANALYSIS OF MONUMENTS AND HISTORICAL CONSTRUCTIONS 8
Table 1 – Reference material properties from different case studies
Article E [MPa] v p (kg/m3)
[4] 985 – 1380 0.07 – 0.2 -
[3] - 0.15 -
[7] - 0.15 1700
[12] 11 200 0.2 2300
[6] - - 1220 - 1835
[13] 1800 - 2600 - -
[11] 1800 - 5000 0.15 – 0.2 1600-1900
[9] 2000 - 3600 0.3 1800
[15] 2200 0.2 1800
[5] 1300 0.15 1600
It was observed that Young’s Modulus (E) varies from 1 000 to 11 000 MPa (average of 3078 MPa),
Poisson’s ratio (v) varies from 0.07 to 0.3 (average of 0.177), and the specific weight varies from 1200
to 2300 kg/m3 (average of 1750 kg/m3). These values can be utilized as a reference for masonry tower
FE model construction, however, if possible, in situ material testing should be conducted to identify a
more accurate representation of the material properties.
2.1.3 Boundary Conditions
In general, most FE models were modelled with a fixed base due to the uncertainty of subsurface
conditions [4] [7] [8] [9] [12] [14] [15]. However, the soil-structure interaction should not be ignored,
particularly if there is structural concern regarding seismic resistance or lateral displacement. Some
papers assessed the soil-structure interaction through the implementation of a uniform distribution of
discrete linear elastic springs of constant stiffness at the base; this procedure is known as the Winkler
soil model [10] [11] [13]. With the implementation of these springs, it is possible to identify the stiffness
of the soil-structure interaction through the model calibration procedure.
Moreover, lateral restraints along exterior facades were also considered in many numerical models as
bell towers are often confined by a surrounding structure (i.e. the main body of the church). Similar to
the soil-structure interaction, these connections were modelled with a uniform distribution of linear elastic
springs in many case studies [4] [7] [8] [12] [13]. One of the case studies modelled the constraining walls
as 3D solids, however, concluded that introducing lateral springs would have been more efficient [14].
2.1.4 Updating Parameters
To calibrate the FE model, it is necessary to identify “updating parameters” that can be iteratively
changed, assessed, and compared against the experimental results until a high level of precision is
attained. In every explored case study, the Young’s Modulus of the masonry (E) was utilized as an
updating parameter as changes in E will considerably change the dynamic properties. In some case

Dynamic characterisation of the bell tower of Sant Cugat Monastery
ADVANCED MASTERS IN STRUCTURAL ANALYSIS OF MONUMENTS AND HISTORICAL CONSTRUCTIONS 9
studies, the masonry was modeled in different sections to identify areas of hypothesized low quality
masonry (lower E) versus high quality masonry (higher E) to be confirmed with the dynamic testing [4]
[13] [14].
In addition to Young’s Modulus, the spring constants (K) located at the foundation and connections
between the bell tower and its surrounding structure were chosen as updating parameters [4] [8] [10]
[11] [13]. These parameters were chosen to help identify the presence of poor connections and/or
subsurface conditions when compared with the experimental data. In some cases, the structural density
of the masonry was also chosen as an updating parameter [8] [14].
2.2 Experimental Dynamic Testing
Following the construction of the preliminary FE model, experimental dynamic testing is typically
conducted. Using dynamic testing, it is possible to evaluate the dynamic characteristics of a structure
(i.e. natural frequencies, mode shapes and damping ratios), develop realistic numerical models, identify
structural issues due to dynamic actions (i.e. interaction between vibrations induced by bell ringing and
the supporting structure), identify “weak points” within the structure, and evaluate structural health,
among many other uses [16]. In addition, experimental dynamic testing is the only non-destructive
technique used to measure parameters associated with global structural behaviour and therefore, it is a
useful tool when other experimental techniques are not viable [5] [16]. This is especially useful for
historic constructions as their structural details and mechanical properties are often unknown and
destructive testing is often prohibited.
Dynamic testing methods are classified in two main groups: Experimental Modal Analysis (EMA) and
Operational Modal Analysis (OMA) [5]. In EMA, structures are excited by measured forces and the
corresponding response is recorded. In contrast, OMA does not require any excitation and requires the
measurement of only the output signals [5].
In all reviewed articles that conducted experimental dynamic testing, Ambient Vibration Testing (AVT)
was chosen to extract modal parameters. AVT is based on OMA principles and is centred on the
assumption that the ambient excitation is a stationary Gaussian white noise stochastic process in the
frequency range of interest which requires only environmental excitations (i.e. wind, traffic, humans) [5]
[15] [16]. As OMA does not require any artificial excitement, AVT is a non-destructive test and therefore
has minimal interference with the normal use of the structure and its cultural/historic value [4] [5] [7] [9]
[15]. In addition, AVT has been proven to be especially suitable for flexible systems (such as tall, slender
towers) as even vibrations of low intensity generally produce very clear signals [4] [7].

Dynamic characterisation of the bell tower of Sant Cugat Monastery
ADVANCED MASTERS IN STRUCTURAL ANALYSIS OF MONUMENTS AND HISTORICAL CONSTRUCTIONS 10
2.2.1 Testing Procedure
The dynamic response of a structure can be measured using any type of device able to convert physical
quantities (i.e. displacements, accelerations, velocities, strains) into proportional electrical signals to be
processed by a data acquisition system (DAQ) [16]. For AVT, it is common to utilize piezoelectric
accelerometers due to their relatively low cost, high sensitivity, good signal-to-noise ratio, and no need
for an external power source [16]. The response signals are converted into discrete digital signals and
recorded as acceleration time-histories which can then be processed and analysed by modal
identification software. Due to the low signals recorded by the sensors under ambient excitation, it is
crucial to amplify the signals and filter them to obtain the desired output [13].
In the analysed case studies, it was found that piezoelectric accelerometers (uniaxial, biaxial and triaxial)
were installed at various locations within the bell towers depending on the desired outcome. For
example, in the case studies that were assessing global damage, accelerometers were installed at all
levels and in all directions to be compared with future tests; this involved the installation of several
accelerometers (20+) [4] [8]. However, much of the research that was examined was regarding dynamic
characterisation. In these cases, a fewer number of accelerometers were installed in strategic positions
related to the hypothetical mode shapes obtained from the preliminary FE models. This typically involved
2 to 10 accelerometers with one or more acquisitions. See Figure 3 for examples of accelerometer
placement.
Figure 3 – Examples of accelerometer placement for dynamic characterisation [3] [7] [11]

Dynamic characterisation of the bell tower of Sant Cugat Monastery
ADVANCED MASTERS IN STRUCTURAL ANALYSIS OF MONUMENTS AND HISTORICAL CONSTRUCTIONS 11
Accelerometers are typically installed to the surfaces of the bell tower through screws or putty. In
general, the piezoelectric accelerometers discussed in the reviewed articles had a working range of
0.025 to 2000 Hz and a sensitivity of 1 V/g. The sampling frequency was set between 100 and 2000 Hz
(the upper bound was utilized to capture the harmonics of the bells) and the acquisition time varied
between 5 and 40 minutes. An empirical rule for sampling time is equal to 2000 times the highest natural
period of interest from the hypothetical FE model [16].
With respect to the number of acquisitions required for dynamic testing, typically only one acquisition is
conducted in addition to a short preliminary test to ensure the DAQ is functioning properly [12]. However,
in the case of bell towers, it is also useful to measure the structural response subjected to the ringing of
the bells as this helps identify any interaction between the bells and the supporting structure. Therefore,
in the papers examining the dynamic impact of the bells, multiple acquisitions were conducted under
different bell ringing schemes [3] [7] [12] [14].
2.2.2 Typical Modal Parameters
Based on existing research and documentation, it is expected that the main frequencies of historic
masonry bell towers are between 0.9 and 2 Hz, with the first two modes being global bending in
orthogonal directions and the third mode being global torsion [3]. Table 2 outlines this phenomenon
through the analysis of several case studies as presented in one of the reviewed papers [3]. The same
study was conducted with the cases that were analyzed as apart of this research as indicated in Table
3. In both cases, the results were found to be generally consistent with the expected modal frequencies
of historic masonry bell towers.
Table 2 – Comparative study of some real cases [3]

Dynamic characterisation of the bell tower of Sant Cugat Monastery
ADVANCED MASTERS IN STRUCTURAL ANALYSIS OF MONUMENTS AND HISTORICAL CONSTRUCTIONS 12
Table 3 – Comparative study of experimental frequencies
Ref. Tower height (m) Natural frequencies (Hz)
1 2 3 4
Ivorra [3] 41 1.294a 1.489a 3.979a 4.321b
Diaferio [8] 60 2.04a 2.26a 7.03a 7.60a
Ferraioli [13] 40 1.31a 1.44a 2.91b 4.42a
Bru [14] 40 0.86a 0.98a 3.55b 3.99a
Ferraioli [11] 45.5 1.05a 1.37a 4.81b 4.89a
Ferraioli [11] 41 1.26a 1.29a 3.10b 6.15a
Turker [5] 23 2.56a 2.66a 6.22b 8.10a
a Bending mode; b Torsion mode.
Once the natural frequencies have been identified, it is simple to produce large structural deformations
in the experimental data with small energy input. This was achieved in several papers through the
oscillation of the bells and allowing for the free vibration of the tower while recording the vibration time
history. This type of test allows for the calculation of the logarithmic viscous damping coefficient [3]. A
typical damping coefficient for masonry buildings is equal to 0.015, however, is often lower in masonry
bell towers due to their flexible and slender nature [14]. Table 4 outlines typical damping coefficients of
masonry bell towers from the analysis of several case studies.
Table 4 – Comparative study of experimental damping coefficients
Ref. Tower height (m) Damping Coefficient Damping percentage [%]
Ivorra [3] 41 0.0159 1.59
Foti [7] 35 0.01745 1.75
UPC [12] 53 0.0061 0.61
Lund [18] various 0.014 – 0.078 1.4 – 7.8
Ivorra [6] various 0.0061 – 0.025 0.61 – 2.5
Bru [14] 40 0.0137 – 0.0166 1.37 – 1.66
Turker [5] 23 0.01932 -0.03616 1.93 – 3.62
Low damping ratios are characteristic of masonry bell towers and may cause a high dynamic
amplification factor when the excitation frequencies of the swinging bells come close to one of the
tower’s natural frequencies [12]. When the dynamic parameters of the tower subjected to bell ringing
are obtained, the dynamic amplification factor may be computed and the possible interaction between
excitation and natural frequencies can be analysed [6].
2.3 Modal Identification
Once the dynamic testing has been conducted, modal analysis software (such as ARTeMIS [19]) may
be used to identify the experimental dynamic parameters of the structure through OMA identification
techniques [4] [20]. The estimation is conducted through various system identification methods, in either
the frequency domain or the time domain, that are related to the equations of motion [20]. In general,

Dynamic characterisation of the bell tower of Sant Cugat Monastery
ADVANCED MASTERS IN STRUCTURAL ANALYSIS OF MONUMENTS AND HISTORICAL CONSTRUCTIONS 13
modal parameter identification consists of signal pre-processing, modal identification and parameter
extraction as discussed in the following subsections [12].
2.3.1 Signal Pre-Processing
Oftentimes, raw signals measured by the accelerometers lack certain characteristics required for further
processing such as amplitude, power level and bandwidth [12]. The signals may also be masked by
superimposed interference or excessive noise levels. Therefore, before conducting any system
identification and subsequent modal analysis, preliminary processing of the acceleration time-histories
must be carried out [12]. Examples of pre-processing include the following and are depicted in Figure 4
[12] [16]:
• Averaging of experimental signals to ensure data can be used with confidence,
• Decimation of the sampling frequency to a lower sampling rate to account for sampling
frequencies that are too high with respect to the bandwidth of interest. Another advantage of
decimation is that it reduces the processing time as it reduces the number of values in the time
histories, and,
• High or low pass filters to remove disturbances at very high or low frequencies.
Figure 4 – Signal pre-processing techniques: top – averaging, left – decimation, right - filtering [16]
2.3.2 Modal Identification Techniques
Once the raw data is pre-processed and comprehensible for the modal identification software, many
modal identification techniques exist in literature that may be used to extract the experimental modal
parameters. These techniques are based on complex mathematical processes, hence why modal

Dynamic characterisation of the bell tower of Sant Cugat Monastery
ADVANCED MASTERS IN STRUCTURAL ANALYSIS OF MONUMENTS AND HISTORICAL CONSTRUCTIONS 14
analysis software is typically used for modal estimation. However, the principles behind the most
common modal identification techniques will be discussed below and a more in-depth explanation of the
mathematics can be found in existing literature such as System identification methods for (operational)
modal analysis: review and comparison by Edwin Reynders (2012) [20].
Due to the inability to scale the measured mode shapes and the uncertainties often apparent in the
frequency content of the ambient excitation, it is important to use different techniques for modal
parameter extraction to gain confidence in the data [7] [12]. At a minimum, it is recommended that OMA
be conducted with one technique in both the frequency and time domains to ensure that the data is
accurate [16].
Frequency Domain Techniques
Frequency domain techniques are nonparametric methods which compute dynamic properties through
the use of the Fourier transformation allowing any harmonic function to be expressed as a summation
of periodic terms [16]. The Fourier transformation represents the distribution of frequencies of all
infinitesimal harmonic components in which a recorded signal can be decomposed [16]. The most
common OMA techniques in the frequency domain are the classical “Peak Picking” technique and the
more recent “Frequency Domain Decomposition” technique, both based on the evaluation of the spectral
eigenvalue matrix G(f) [4] [5]:
𝑮(𝒇) = 𝑬[𝑨(𝒇)𝑨𝑯(𝒇)] (1)
Where the vector A(f) collects the acceleration responses in the frequency domain, superscript H
denotes a complex conjugate transpose matrix, and E denotes the expected value. The diagonal terms
of the matrix G(f) are the real valued auto-spectral densities (ASD) while the other terms are the complex
cross-spectral densities (CSD) [4]. The ASD’s and CSD’s are estimated from the recorded time-histories
by averaging, dividing and filtering the data into several points [4].
Peak Picking (PP)
Peak Picking involves identifying natural frequencies from resonant peaks in the power spectral density
(PSD) plots which are obtained by converting the measured data to the frequency domain through the
Fast Fourier Transform (FFT) [11] [13]. This method is based on the evaluation of the G(f) matrix
discussed above, where the natural frequencies are identified from resonant peaks in the ASD’s and in
the amplitude of the CSD’s [4] [13]. The mode shapes are then obtained from the amplitude of square-
root ASD curves and the CSD phases are used to determine directions of relative motion [4]. Peak
Picking leads to reliable results provided that the basic assumptions of low damping and well-separated
modes are satisfied [4] [11] [13].

Dynamic characterisation of the bell tower of Sant Cugat Monastery
ADVANCED MASTERS IN STRUCTURAL ANALYSIS OF MONUMENTS AND HISTORICAL CONSTRUCTIONS 15
Frequency Domain Decomposition (FDD)
Frequency Domain Decomposition is an approximate decomposition of the response time histories into
a set of independent, single degree of freedom systems for each mode [5]. The FDD procedure identifies
modal frequencies through the location of the peaks of the first singular value of the spectral matrix, G(f)
[4]. This process involves the following main steps [4] [5]:
1. Estimation of the spectral density matrix from raw time series data,
2. Singular Value Decomposition (SVD) of the spectral density matrix at each frequency,
3. Averaging of singular values of all data sets if multiple data sets exist, and,
4. Peak picking of the highest average SVD to identify resonant frequencies and estimate
corresponding mode shapes.
Note that for well-separated modes, only the highest singular value should be considered whereas for
closely spaced modes, other singular values should be considered as well [12].
The FDD method is an improvement from the PP method as it effectively separates signal space from
noise space, the evaluation of mode shapes is automatic, and in the case of closely spaced modes,
every singular vector corresponding to a non-negligible singular value represents a mode shape
estimate [4]. Therefore, it is recommended to conduct FDD in opposition or addition to the PP method
when conducting OMA. See Figure 5 depicting a comparison between the PP and FDD interface for a
given data set [12].
Figure 5 – Example of modal analysis data using the PP method (left) and FDD method (right) [12]

Dynamic characterisation of the bell tower of Sant Cugat Monastery
ADVANCED MASTERS IN STRUCTURAL ANALYSIS OF MONUMENTS AND HISTORICAL CONSTRUCTIONS 16
Enhanced Frequency Domain Decomposition (EFDD)
The FDD method is limited by the frequency resolution of the spectral density estimates which can lead
to heavily biased modal estimates [15]. To increase the frequency resolution, the Enhanced Frequency
Domain Decomposition method can be used as it estimates modal parameters through computing the
inverse Fast Fourier Transform of each spectral density function for each mode shape in the time domain
[16]. Figure 6 shows a typical diagram obtained by the EFDD method where the red lines identify the
first modal frequencies [8].
Figure 6 – Example of an EFDD diagram and the identified frequencies [5]
Time Domain Techniques
Time domain techniques identify modal parameters through parametric methods which fit the response
of each measurement point to a mathematical model representative of the dynamic behaviour of the
structure [16]. The most common OMA technique in the time domain is “Stochastic Subspace
Identification” which typically uses data-driven system identification techniques to extract modal
parameters [8] [5] [12]. Time domain techniques are robust and allow for accurate modal parameter
estimation, however, are not as efficient or simple as the frequency domain techniques as more
processing time is typically required during parameter estimation [15].
Stochastic Subspace Identification (SSI)
Stochastic Subspace Identification works directly with the raw time history output data, without the need
to convert the data to correlations or spectra [5] [12]. The SSI algorithm identifies the state space
matrices based on the experimental measurements by using robust numerical techniques, however,

Dynamic characterisation of the bell tower of Sant Cugat Monastery
ADVANCED MASTERS IN STRUCTURAL ANALYSIS OF MONUMENTS AND HISTORICAL CONSTRUCTIONS 17
once the mathematical description of the structure is found, it is straightforward to determine the modal
parameters [5].
The numerical technique is based on first order differential equations and fits a model directly to the raw
time series data based on the State-Space Formulation and from the analysis of the response time
series [9] [15]. Under the hypotheses of unknown excitation and a time-invariant linear system, the SSI
is established on the following representation of the equation of motion [8]:
𝒙𝑝+1 = 𝑩𝒙𝒑 + 𝒘𝒑 (2)
𝒚𝒑 = 𝑪𝒙𝒑 + 𝒗𝒑 (3)
Where xp is the discrete-time state vector (which collects displacements and velocities at a point in time),
wp is the process noise (due to disturbances and model inaccuracies), yp is the output vector, vp is the
measurement noise (due to measurement errors), B is the discrete state matrix (which depends on
mass, stiffness and damping properties of the structure), and C is the discrete output matrix (which maps
the state vector into the measured output) [8].
Different SSI-based techniques are utilized to manipulate these equations to extract the modal
parameters and stabilization diagrams are analyzed to differentiate between real modes and noisy
modes [8]. Natural frequencies and damping ratios are obtained from the eigenvalues of B, and mode
shapes are computed from the product of the output matrix C with the eigenvectors of the state matrix
B [8]. Figure 7 shows a typical diagram obtained by SSI where a modal identification software was able
to identify stable frequencies as indicated by the red lines [8].
Figure 7 – Example of an SSI diagram and the identified frequencies [8]

Dynamic characterisation of the bell tower of Sant Cugat Monastery
ADVANCED MASTERS IN STRUCTURAL ANALYSIS OF MONUMENTS AND HISTORICAL CONSTRUCTIONS 18
2.3.3 Cross Validation - Modal Assurance Criterion (MAC)
The results obtained from the various methods should be compared using the Modal Assurance
Criterion (MAC) which correlates two sets of modal vectors as follows [4]:
𝑀𝐴𝐶 =(∅𝐴,𝑘
𝑇 ∙∅𝐵,𝑗)2
(∅𝐴,𝑘𝑇 ∙∅𝐴,𝑘)∙(∅𝐵,𝑗
𝑇 ∙∅𝐵,𝑗) (4)
Where ∅𝑨,𝒌 is the k-th mode of data set A, and ∅𝑩,𝒋 is the j-th mode of data set B. A MAC value of 1
implies perfect correlation of the two mode shape vectors, while a value of 0 indicates uncorrelated,
orthogonal vectors [4]. In general, a MAC greater than 0.80 is considered good and one less than 0.40
is considered poor [4]. If the MAC is low and the standard deviation is high between two mode shapes
identified through different techniques, this indicates that insufficient data was collected or an error was
incurred during the testing procedure [8].
2.4 FE Model Calibration
The final step in dynamic characterisation is the calibration of the hypothetical numerical model. This
procedure is illustrated in Figure 8 and involves the examination of the differences in main mode shapes
and frequencies between the hypothetical (FE) and experimental (OMA) results. If the difference is found
to be negligible, the model may be considered accurate, whereas, if a difference in values exists, the
updating parameters must be iteratively changed until convergence is achieved.

Dynamic characterisation of the bell tower of Sant Cugat Monastery
ADVANCED MASTERS IN STRUCTURAL ANALYSIS OF MONUMENTS AND HISTORICAL CONSTRUCTIONS 19
Figure 8 – Example of a dynamic-based assessment procedure for bell towers [6]
2.4.1 Manual Tuning
The updating parameters should first be assessed through a rough comparison between results of the
FE model and experimental OMA. This can be achieved through iteratively modifying the updating
parameters in the FE model until the differences in natural frequencies between the FE model and OMA
are minimized. This procedure is known as manual tuning and typically, the experimental value of the
first bending mode is used as a reference [13] [15].

Dynamic characterisation of the bell tower of Sant Cugat Monastery
ADVANCED MASTERS IN STRUCTURAL ANALYSIS OF MONUMENTS AND HISTORICAL CONSTRUCTIONS 20
This procedure is conducted by varying one updating parameter at a time until a satisfactory agreement
between results is achieved for the main global mode shapes (less than 5% error) [3] [4] [7] [8] [11] [12]
[13] [15]. To improve the efficiency of this method, the range of dynamic properties to be assessed may
be limited by examining only the following four ratios [13]:
• Ratio between the first flexural frequency in X and the first torsional frequencies,
• Ratio between the first flexural frequency in X and first flexural frequencies in Y,
• Ratio between first and second flexural frequencies in X and,
• Ratio between first and second flexural frequencies in Y.
The model can be further validated using the modal assurance criterion (MAC) defined as follows [13]:
𝑀𝐴𝐶 =(∅𝐴𝑉𝑇
𝑇 ∙∅𝐹𝐸𝑀)2
(∅𝐴𝑉𝑇𝑇 ∙∅𝐴𝑉𝑇)∙(∅𝐹𝐸𝑀
𝑇 ∙∅𝐹𝐸𝑀) (5)
Where Where ∅𝑨𝑽𝑻 is the modal displacement from the experimental data set and ∅𝑭𝑬𝑴 is the
corresponding modal displacement from the FE model. However, before computing the MAC, the
experimental results must be converted to real valued ones since mode shapes cannot be scaled in an
absolute way using OMA [11]. This is achieved by scaling the experimental mode shapes so that the
mode shape vector component of one of the channels is equal to 1, and then transforming the predicted
mode shapes at the approximate points of the accelerometers in the FE model to the simplified
coordinate system [11]. A MAC value of 1 indicates a perfect correlation of the two mode shape vectors,
while a value close to 0 indicates completely uncorrelated, orthogonal vectors. Typically, a MAC value
of 0.80–0.85 is considered acceptable [13].
Aside from manual tuning, which is largely based on trial and error, other system identification
techniques exist that can help refine the linear elastic model such as: the Inverse Eigen-sensitivity (IE)
method, the Douglas-Reid (DR) method [4], the Genetic Algorithm technique (GA) [14], and Sensitivity
Analysis (SA) [13], all of which are summarized below. Note that these methods are typically time
consuming and complex and therefore, may not be the most efficient or effective approach to calibrate
the FE model for the Sant Cugat Bell Tower.
2.4.2 The Inverse Eigen-Sensitivity (IE) Method
The IE method analyses the functional relationship between the measured responses “R” and the
structural updating parameters “X” of the model expressed in terms of a Taylor series expansion as
follows [4]:
𝑹𝒆 = 𝑹(𝑿𝟎) + 𝑺(𝑿 − 𝑿𝟎) (6)

Dynamic characterisation of the bell tower of Sant Cugat Monastery
ADVANCED MASTERS IN STRUCTURAL ANALYSIS OF MONUMENTS AND HISTORICAL CONSTRUCTIONS 21
Where Re is the vector associated with the reference experimental response data, R(X0) is a vector
containing the responses from the model corresponding to the starting choice X0 of the updating
parameters, and S is the sensitivity matrix [4]. This Equation is then rearranged to derive the following
iteration scheme to evaluate X [4]:
𝑿𝒏+𝟏 = 𝑿𝒏 + 𝑯[𝑹𝒆 − 𝑹(𝑿𝒏)] (7)
Where the gain matrix H is computed using either the Moore-Penrose pseudo-inverse or following the
Bayesian estimation theory [4].
2.4.3 The Douglas-Reid (DR) Method
The DR Method analyses the relationship between any modal response of the FE model where the
structural updating parameters Xk (k=1,2,…N) of the model are approximated based on the current
values of Xk through the following Equation [4]:
𝑅𝑖∗ = (𝑋1, 𝑋2, … , 𝑋𝑁) = ∑ [𝐴𝑖𝑘𝑋𝑘 + 𝐵𝑖𝑘𝑋𝑘
2]𝑁𝑘=1 + 𝐶𝑖 (8)
where 𝑹𝒊∗ represents the approximation of the i-th response of the FE model [3].
Table 5 outlines an example of this procedure, comparing the preliminary manual tuning scheme (lower
value, base value and upper value) and the numerical schemes (DR and IE) that were used to refine
the updating parameters and fully calibrate the FE model [3].
Table 5 – Updated structural parameters of a case study [3]
2.4.4 The Genetic Algorithm Technique (GA)
The GA method is a stochastic algorithm used for solving optimization problems based on a natural
selection process that mimics biological evolution [14]. A population of “chromosomes” with a uniform
random distribution must first be selected and several parameters must be defined [14]. Following the
manual tuning scheme, the relative errors between experimental and numerical modal frequencies may
be used as fitness functions for the first natural frequencies to obtain the possible ranges for the defined
updating parameters [14].

Dynamic characterisation of the bell tower of Sant Cugat Monastery
ADVANCED MASTERS IN STRUCTURAL ANALYSIS OF MONUMENTS AND HISTORICAL CONSTRUCTIONS 22
Following the manual tuning procedure, a parametric analysis may be performed by changing any
parameters with a high variation coefficient ranging from the lower bound of its range to the optimal
value as determined through the GA analysis until good correlation is achieved [14]. The following Table
outlines an example of this procedure showing the updated elastic properties, the initial range value and
the standard deviations of all parameters obtained by means of the GA after 3 runs [14].
Table 6 – Updated structural parameters of a case study through GA optimization [13]
2.4.5 Sensitivity Analysis (SA)
SA approaches are based on “element-level sensitivity equations” which relate the mode shapes of the
structure to the changes of the chosen updating parameters based on functions derived by changes in
stiffness [13]. Following preliminary manual tuning, the SA method can be used to further refine the
results by considering only the most sensitive updating parameters through a sensitivity analysis using
the following sensitivity index [13]:
𝑆𝑖,𝑗 =ln(𝜀𝑗)−𝑙𝑛(𝜀𝑗0)
ln(𝑥𝑖)−𝑙𝑛(𝑥𝑖0) (9)
where xi0 and xi are the initial nominal value of the i-th updating parameter and its value incremented
at a given percentage, ej0 is the error of the j-th output of the model corresponding to the nominal model,
and ej is the error corresponding to setting all parameters to their nominal value while setting the i-th
parameter to xi [13]. The SA technique calculates the sensitivity coefficient (Si,j) as the rate of change
of the j-th output of the model with respect to a change in the i-th input xi. An example of the results of
one case study are depicted in Figure 9 [13]. The computed sensitivity index allows for the identification
of the parameters most sensitive to change. In the example depicted below, parameters E2, k1, k2, and
α showed to be most sensitive to change [13].

Dynamic characterisation of the bell tower of Sant Cugat Monastery
ADVANCED MASTERS IN STRUCTURAL ANALYSIS OF MONUMENTS AND HISTORICAL CONSTRUCTIONS 23
Figure 9 – Local sensitivity index of a case study [13]
Once the updating parameters are chosen based on the sensitivity index, the model updating can
continue using a procedure where a parameter vector is defined for both the measured and FE
computed modal quantities and encloses the properties to be updated. This procedure is based on the
computation of the objective function over a multi-dimensional grid [13]. The structural parameters for
the case study mentioned above were computed using the SA technique as shown in Table 7.
Table 7 – Updating parameters for structural identification [13].
2.5 Soil-Structure Interaction
The soil–structure interaction is an important factor when attempting to identify seismic vulnerability or
sources of damage in masonry towers as differential soil settlement often causes structural issues. In
addition, it can be non-conservative to assume the soil to be rigid and perfectly fixed to the foundation
of the bell tower [13]. Therefore, should the subsurface conditions be unknown and of interest, it may
be appropriate to utilize experimental dynamic testing such as AVT to assess the stiffness of the soil-
structure interaction [13]. This can be achieved by adopting the Winkler model for soil and introducing
uniform linear elastic constraints (springs) as model updating parameters on the bottom surface of the

Dynamic characterisation of the bell tower of Sant Cugat Monastery
ADVANCED MASTERS IN STRUCTURAL ANALYSIS OF MONUMENTS AND HISTORICAL CONSTRUCTIONS 24
FE model in attempt to simulate the deformability of the ground [10] [11] [13]. See Figure 10 depicting
an example of the Winkler model where q is a distributed load (the masonry tower) applied to a set of
springs representing the subsurface soil.
Figure 10 – Example of Winkler model [21]
To obtain a range of expected spring stiffnesses, the FE model may be analysed comparing rigid
constraints versus elastic restraints [10]. In the report by F. Lorenzoni et al. (2017), a range of vertical
spring constants was obtained by merging literature data with the sensitivity analysis of the bell tower
under study resulting in an expected spring constant between 5.108 N/mm3 and 109 N/mm3 [10]. It is
recommended to assume that the horizontal springs have a value equal to 1/10th of the vertical stiffness
to account for the limited connection with the soil in this direction and the impact on shear behaviour of
the foundation [10]. An example of a soil-structure sensitivity analysis is depicted in Figure 11.
Figure 11 – a) Sensitivity analysis showing variations in numerical frequency with the change in spring stiffness; b) variation of MAC index with and without elastic foundations [10]
Once the experimental results have been recorded, the model may be calibrated by iteratively changing
the spring constants in the FE model until the modal parameters are in alignment with the experimental

Dynamic characterisation of the bell tower of Sant Cugat Monastery
ADVANCED MASTERS IN STRUCTURAL ANALYSIS OF MONUMENTS AND HISTORICAL CONSTRUCTIONS 25
data. This procedure is typically achieved by keeping the Young’s Modulus constant and equal to the
value that was obtained by model calibration assuming a rigid soil-structure interaction [10].
Ultimately, the calibrated models with foundation springs and without (i.e. rigid foundation) should be
compared. If the model with springs is more in alignment with the experimental results, this indicates
that there is likely a poor connection between the soil and the foundation and subsurface conditions may
be influencing the behaviour of the structure [10]. If this is the case, subsurface conditions should be
further examined through a geotechnical investigation.
2.6 Dynamic Action of the Bells
Oscillation of the bells is one of the strongest forces that bell towers are subjected to as the induced
forces to the structure are often amplified when the bells are swinging [6] [22]. The impact of the vertical
forces are often neglected as the axial stiffness of masonry towers is higher than their bending stiffness
and therefore, no resonance problems are expected [6] [14]. However, the horizontal forces are of
concern as historic masonry structures were not designed to resist large lateral forces.
There are various techniques provided in literature to analyse the interaction between ringing bells and
the supporting masonry structure. Currently, the primary technique for assessing this interaction is
through the comparison of the natural frequencies of the bell tower with those of the bells’ oscillation [6].
This work can be combined with numerical models to simulate the interaction between frequencies [6].
2.6.1 Bell Systems in Europe
Forces induced by the bells to their supporting structures vary with time and depend on the
characteristics of the bells and the way in which they are rung [6] [14]. Within Europe, the bells can be
classified into three main categories: Central European, Spanish, and English. Each system presents
certain characteristics of frequency, oscillation, unbalance and turn rate which results in a different
structural impact to the supporting structure [2] [14] [22]. See Figure 12 depicting the various bell ringing
systems.
In the Spanish system, a counterweight provides a high level of balance and the bells rotate continuously
in the same direction [12] [14]. In the Central European system, the bells tilt on their axis at swing angles
between 55 and 160̊ with no counterweight, often causing a highly unbalanced system which exerts
considerably more horizontal dynamic load on the supporting structure [12] [14]. In the English system,
the bells rotate in a complete circle, changing the direction of the swing in each cycle [6] [14].

Dynamic characterisation of the bell tower of Sant Cugat Monastery
ADVANCED MASTERS IN STRUCTURAL ANALYSIS OF MONUMENTS AND HISTORICAL CONSTRUCTIONS 26
Figure 12 – Different bell ringing systems (from left to right): Central European, Spanish, English [2]
The difference between the dynamic forces caused by bells swinging according to the Spanish vs.
Central European systems is illustrated in Figure 13.
Figure 13 – Typical dynamic horizontal forces induced by bells swinging according to the Spanish system (left) and Central European system (right) [2]
As can be observed, the Spanish system presents substantially lower levels of unbalance compared to
the Central European system [2] [14]. Subsequently, the horizontal forces induced by Spanish bells are
the smallest, approximately 0.15 times the weight of the bell assemble, and largest in the Central
European and English systems, approximately 2 (CE) to 4 (English) times the weight of the bell
ensemble [1].
2.6.2 Static Analysis
Depending on the angular velocity and balance of the bells, the forces that they induce to the supporting
structure can be considerable [14] [23]. Therefore, these forces should be evaluated to enable decisions
regarding structural strengthening and/or changing of the bells’ operating system to be made [6]. To
determine the quantity of these forces for a certain bell, a static analysis can be conducted considering
the characteristics of the bells including their dimensions, weight, centre of gravity, unbalance, initial
angular velocity, moment of inertia, swing angle, and maximum nondimensional horizontal and vertical

Dynamic characterisation of the bell tower of Sant Cugat Monastery
ADVANCED MASTERS IN STRUCTURAL ANALYSIS OF MONUMENTS AND HISTORICAL CONSTRUCTIONS 27
forces [3] [12]. With this information, analytical models can be used to estimate the dynamic forces
induced by a specific bell using the following Equations [6] [12]:
𝐻(𝑡) = 𝑀 ∙ 𝑎 ∙ [∅̇2 ∙ 𝑠𝑖𝑛∅(𝑡) − ∅̈ ∙ 𝑐𝑜𝑠∅(𝑡)] (10)
𝑉(𝑡) = 𝑀 ∙ 𝑔 − 𝑀 ∙ 𝑎 ∙ [∅̇2 ∙ 𝑐𝑜𝑠∅(𝑡) − ∅̈ ∙ 𝑠𝑖𝑛∅(𝑡)] (11)
Where a is the distance of G1 from C1 (G1 being the bells centre of gravity and C1 being the axis of
rotation), φ is the angle of the bell from the downward vertical of C1, g is acceleration due to gravity, t
is time, and M is the mass of bell and yoke [6]. The geometrical quantities are described in Figure 14.
Figure 14 – Simplified geometrical quantities of a bell [6]
Note that the total force transmitted to the supports in each direction is equal to the sum of the horizontal
forces of all the bells that turn in that direction at any given time [6]. Therefore, to reduce the horizontal
force, the arrangement of the bells is usually carefully considered [6].
2.6.3 Dynamic Analysis
It is impossible to calculate the sum of the horizontal forces of all the bells that turn in a particular
direction at any given time using the static method described above. In addition, the dynamic nature of

Dynamic characterisation of the bell tower of Sant Cugat Monastery
ADVANCED MASTERS IN STRUCTURAL ANALYSIS OF MONUMENTS AND HISTORICAL CONSTRUCTIONS 28
the bells often induces an amplification effect to the forces that are transferred to the supporting
structure. Therefore, to evaluate the effect of the bell swinging on the modal parameters of the
supporting tower, a Fast Fourier Transform (FFT) analysis of these forces must be conducted when the
bells are ringing [14]. This type of analysis can be achieved through AVT during the ringing of the bells
and identification of bell harmonics through modal identification procedures in the frequency domain
(see Section 2.3) [9].
If one of the predominant harmonics of the bells interacts with a natural frequency of the supporting bell
tower, a large dynamic amplification factor (DAF) may be induced which could impact the stability of the
structure [3]. In general, the predominant harmonic in the Central European system is the second
horizontal force, in the English system the third horizontal force, and the Spanish system the first
horizontal force [6]. This procedure is depicted in Figure 15 for a Spanish system.
Figure 15 – Example of a frequency analysis of a Spanish bell system [1]
As expected for a Spanish system, the first harmonic is strongly predominant however, is distant from
the bell towers’ typical natural frequencies, therefore, the bells will have a negligible influence on the
DAF [1]. However, should the first harmonic have been closer to the natural frequency of bell towers, or
the second and third frequencies been greater in amplitude, there likely would have been a considerable
DAF.
Once the dynamic properties of both the bell tower and the bells have been identified, the DAF can be
calculated through a parametric analysis considering the bell’s swing velocity, damping factor ( 𝝃),
harmonic component ( 𝛀𝒊), and the vibration frequencies ( 𝝎𝒋), as follows [14]:
𝐷𝐴𝐹𝑖𝑗 =1
√(1−(Ω𝑖𝜔𝑗
)
2
)
2
+(2𝜉(Ω𝑖𝜔𝑗
))
2 (12)

Dynamic characterisation of the bell tower of Sant Cugat Monastery
ADVANCED MASTERS IN STRUCTURAL ANALYSIS OF MONUMENTS AND HISTORICAL CONSTRUCTIONS 29
If the DAF is found to be less than 1 for all bell ringing schemes, no dynamic interaction is considered
between the bell tower and the bells [24].
An additional check may be conducted according to DIN 4078 through the comparison of the first three
modal frequencies of the tower subjected to the swinging bells and the first three natural frequencies of
the structure itself. If the corresponding modes are separated by more than 20%, the dynamic interaction
between the bells and the supporting structure may be considered negligible [24]. In addition, one case
study showed that when the first to third bell harmonics have a frequency between the first and second
tower frequencies, the horizontal displacement at the tower’s highest level can induce damage to the
structure, regardless of swing angle [14].
An alternate method to compute the DAF is through introducing the maximum static vertical and
horizontal forces caused by the bell swinging to the model at the height where the bells are situated,
running a modal analysis and comparing results between the tower with and without bell ringing [3] [12].
An example of the DAFs computed using this method for a bell tower subjected to various bells is
provided in Table 8.
Table 8 – Example of DAF evaluation of a historic bell tower for a given mode shape [3]
This Table shows that the San José and Minerva bells produced a DAF of approximately 5, indicating
that when those bells are rung, they can impact the dynamic characteristics of the bell tower by a factor
of 5, which is considerable.

Dynamic characterisation of the bell tower of Sant Cugat Monastery
ADVANCED MASTERS IN STRUCTURAL ANALYSIS OF MONUMENTS AND HISTORICAL CONSTRUCTIONS 30

Dynamic characterisation of the bell tower of Sant Cugat Monastery
ADVANCED MASTERS IN STRUCTURAL ANALYSIS OF MONUMENTS AND HISTORICAL CONSTRUCTIONS 31
3. THE CASE STUDY: BELL TOWER OF SANT CUGAT MONASTERY
The Sant Cugat Monastery is a 9th century Benedictine Abbey located in Sant Cugat del Vallès,
Catalonia, Spain, 20 km NW of Barcelona as shown in Figure 16. The Monastery is composed of two
main structures: the basilica church and the cloister; however, this report is focused on the bell tower
located within the body of the basilica church as depicted in Figure 17.
Figure 16 – Main façade of the Sant Cugat Monastery showing the rose window and bell tower (left); map showing the location of the Monastery (right) [25]
Figure 17 – Plan view of the Sant Cugat Monastery showing the bell tower within the main body of the basilica and the cloister [25]

Dynamic characterisation of the bell tower of Sant Cugat Monastery
ADVANCED MASTERS IN STRUCTURAL ANALYSIS OF MONUMENTS AND HISTORICAL CONSTRUCTIONS 32
The bell tower of the Sant Cugat Monastery is the subject of this case study as an outward tilt has been
observed in the tower since the early 19th century, causing great concern regarding the stability of the
structure. It is the objective of this dissertation to develop a robust procedure for the dynamic
identification of the bell tower based on the information obtained in the literature review and the
development of a representative numerical model. Once the dynamic testing has been conducted
according to the procedure presented in this report, it will be possible to identify the hypothetical cause(s)
of the displacement through the calibration of a finite element model using the experimental results. This
information will help inform the owner of the Monastery as to the level of concern associated with the
leaning of the bell tower. However, prior to the development of the dynamic characterisation plan, an
historic and geometric survey were conducted to obtain a better understanding of the structural history
and existing condition of the Monastery.
3.1 Historic Survey
As with any conservation project, it is essential to understand the building of study through an historic
survey prior to the development of any additional work. This is due to the unique nature of historic
buildings, each having their own construction history and historic values. The historic survey will
examine the initial construction of the Monastery and later interventions to ensure a proper
understanding of the existing condition of the structure. This is of particular importance for designated
heritage buildings, such as the Sant Cugat Monastery, as they have numerous character-defining
elements that should be protected. The following subsections will discuss the historic significance of
the Monastery along with a detailed chronology of historical events regarding the construction of and
later interventions made to the Monastery of Sant Cugat, with a focus on the bell tower.
3.1.1 Historic Values
The Monastery of Sant Cugat was designated as a National Monument in Spain in 1931 due to its
significant historic and architectural values. The Monastery is of particular historic significance as it was
one of the first monasteries to be built in Catalunya and sits upon the remains of an Ancient Roman
castrum [26]. In addition, the Monastery has withstood attacks by the Muslims in 985 AD and the War
of the Spanish Succession in the early 18th century [27].
Architecturally, the church is composed of three naves without a transept, and three apses of semi-
circular plan on the interior and polygonal plan on the exterior [28]. The Monastery is also an excellent
example of the architectural transition from the Romanesque period to the Gothic period. This is depicted
through the Romanesque sobriety of the church displayed in the lack of decoration and light, the gothic
grandeur of the 13th century dome, the large gothic rose window on the main façade, the Romanesque
vaults in the apse, the gothic vaults crossings the rest of the church, and the three Gothic lateral chapels
on the south side [26].

Dynamic characterisation of the bell tower of Sant Cugat Monastery
ADVANCED MASTERS IN STRUCTURAL ANALYSIS OF MONUMENTS AND HISTORICAL CONSTRUCTIONS 33
With respect to the bell tower, it was built in several periods and was not completed until the 18th century
[29]. It too has foundations on the ancient Roman fortress and displays decorative motifs characteristic
of the Lombard style, as well as two stone arches of Islamic Influence [29].
3.1.2 Construction Chronology
The Monastery was constructed between the 9th and 14th centuries and features a classic basilica plan,
a bell tower integrated into the SE façade, and a Romanesque cloister located adjacent to the NW
façade of the basilica [26]. The basilica and the bell tower were constructed upon the remains of a
Roman castrum, however, the rest of the church was founded directly on soil with a shallow foundation
[26] [30]. The masonry is comprised of stone blocks sourced from the local quarry “Pedrer de
Campanya” and is composed of detrital carbonate rocks, likely limestone [30].
The bell tower was built in several periods and was not completed until the 18th century [1]. The tower
began construction in 1062 AD as an external element founded upon one of the tower ruins of the former
Roman fortress [1]. The original structure extended up to a floor level that was used to install the first
bells as can be seen in the 16th century painting of the Martyrdom of Sant Cugat by Germanic artist
Ayne Bru shown in Figure 18 [1].
Figure 18 - Painting of the Martiri de Sant Cugat by Ayne Bru (1502-1507) showing the state of the Monastery at the time; note the construction of the bell tower and the arch connecting the bell tower to the dome [23]
In 1760, the construction of the bell tower advanced upwards under the initiative of Abbot Gayolà [1].
Under his campaign, the bell tower was finished through the construction of a new upper level housing

Dynamic characterisation of the bell tower of Sant Cugat Monastery
ADVANCED MASTERS IN STRUCTURAL ANALYSIS OF MONUMENTS AND HISTORICAL CONSTRUCTIONS 34
the liturgical bells and two smaller superimposed structures sitting atop the main tower to host the clock
bells as shown in Figure 19 [1].
Today, the bell tower is divided into several floors, some of which can be visited. On the ground floor, is
the Chapel of Mercy, which in the 16th century was divided into two levels to accommodate the
Renaissance organ. On the proceeding level, it is possible to see the early Romanesque barrel vaults,
above which, an internal staircase leads to a metal passageway which extends above the church’s
baroque chapels and beneath the old Gothic vaults that house them, as shown in Figure 19 [1]. The
level above is occupied by a clock from the late seventeenth century which has been restored and is
still responsible for the ringing the clock bells today, followed by the liturgical bell house which hosts the
four liturgical bells and finalizes the main body of the bell tower [1].
Figure 19 – SE façade of the bell tower today (left); metal passageway above the churches Baroque chapels (right) [30]
A summarized chronology of the construction and interventions made to the Sant Cugat Monastery is
provided in the following list accompanied by some historic photos as shown in Figure 21 to Figure 24:
• 9th century AD – the construction of the Monastery was founded and dedicated to unite the 5th
century church housing the remains of Sant Cugat [27]
• 10th century AD – expansion of the monastery [27]

Dynamic characterisation of the bell tower of Sant Cugat Monastery
ADVANCED MASTERS IN STRUCTURAL ANALYSIS OF MONUMENTS AND HISTORICAL CONSTRUCTIONS 35
• 985 AD – damage to Monastery during an attack of Muslim troops led by al-Mansur Ibn Abi
Aamir, who then repaired it and added the minaret [27]
• 1062 AD: initial construction of the Bell Tower upon the foundations of the former Roman
fortress [1]
• Mid-12th c. - 1337: construction of the new monastery and cloister adjacent to the church [27]
• 1350 - 1383: construction of the fortification walls and towers [27]
• 1502-1507: painting of the Martiri de Sant Cugat by Ayne Bru, now located at the Museu
Nacional de Catalunya [27]
• 16th century: separation of the main level of the bell tower into two floors to accommodate the
Renaissance organ [27]
• 1760: dismantling of the arch joining the octagonal dome with the bell tower and initiation of the
construction of the upper portion of the bell tower [1]
• 18th century: completion of the bell tower [27]
• 1701-1714: war of the Spanish Succession causing damage to the structure [27]
• 1782: construction of a new Sacristy in the eastern corner of the church, between the bell tower
and the apse [30]
• 1789: restoration work completed on damaged portions of the structure [27]
• 1835 – 1950: abandonment of the monastery [27]
• 1851: restoration works under the supervision of architect Elies Rogent due to the observation
of several large cracks and outward displacement in the bell tower, dome, SE wall and arches
of the SE lateral nave. This work included the following [29] [30]:
o extraction of the earth and rubble infill located above the vaults next to the dome,
o reinforcement of two arches in the SE lateral nave between the dome and the bell tower
with 60 cm wide brick walls intended to allow both the dome and bell tower to stand
independently,
o installation of two tie rods at the base of the dome to reduce lateral thrust, and
o repair works on the pendentives under the dome
• 1931: declaration of the Monastery as a National Monument [27]
• 1992: geotechnical study conducted by the Architectural Heritage Service of the Generalitat de
Catalunya which concluded the following [30]:

Dynamic characterisation of the bell tower of Sant Cugat Monastery
ADVANCED MASTERS IN STRUCTURAL ANALYSIS OF MONUMENTS AND HISTORICAL CONSTRUCTIONS 36
o the monastery lies over a 2 m deep layer of quaternary materials (soil, sand and rubble)
followed by a lower layer varying between 1 and 8 m in depth composed of tertiary
materials (silts, clays and sandy silts),
o the water table is at a depth of 10 m,
o the tertirary level is very near the surface beneath the Church (being only centimetres
from the surface at the SE wall). However, it is located much deeper as you approach
the cloister, and
o the depth of the foundation was found to be 2.3 m on the SE wall, 3.1 m on the main
SW façade, and 1.7 m on the NW wall between the church and the cloister.
• 1995 – 1996: restoration works by the Architectural Heritage Service of the Generalitat de
Catalunya conducted to stabilize the SE wall of the basilica. This was achieved primarily through
strengthening of selected arches, consolidation of select gothic vaults, insertion of steel ties in
the buttresses of the SE wall, and stitching of the wall between the Sacristy and the Bell Tower
to the main body of the church with steel tie bars as depicted in in Figure 20 [30].
Figure 20 – Drawings of the intervention performed in the 1990s: left – stitching of the wall between the sacristy
and the bell tower to the main body of the church; right – reinforcement of the buttresses supporting the
southern wall with steel ties [26]
• 2000: Geometric survey conducted by the municipality of Sant Cugat del Vallès as part of the
Master Plan for the rehabilitation of the Monastery [30]
• 2006: Structural stabilization project for the central and northern nave of the church [29]

Dynamic characterisation of the bell tower of Sant Cugat Monastery
ADVANCED MASTERS IN STRUCTURAL ANALYSIS OF MONUMENTS AND HISTORICAL CONSTRUCTIONS 37
Figure 21 – Painting of the Monastery of Sant Cugat in 1842 showing the NE façade of the
Church and bell tower [31]
Figure 22 – Picture of the Monastery of Sant Cugat in 1915 showing the SE and NE façades of the Church and
bell tower [32]
Figure 23 – Photograph of the Monastery of Sant Cugat in 1890 showing the NE and SE façades of the Church and bell tower [33]
Figure 24 – Photograph of the Monastery of Sant Cugat in 1920 showing the main SW façade of the Church and bell
tower [34]
3.1.3 The Bells
Within the bell tower, there are four liturgical bells (c. 1940s) located between levels 6 and 7, and two
clock bells (c. 1623) located within the two superimposed bell structures on top of the main body [35].
The liturgical bells were previously hung upon timber bridges in the windows to be rung using the
traditional Catalan yoke system. However, following the Spanish Civil War in 1936, the six liturgical bells
of Sant Cugat were destroyed, with only the clock bells (marking the hour and quarter hour) remaining
in the upper bodies [35]. Since the war, four new liturgical bells have been installed (Severa, Juliana,

Dynamic characterisation of the bell tower of Sant Cugat Monastery
ADVANCED MASTERS IN STRUCTURAL ANALYSIS OF MONUMENTS AND HISTORICAL CONSTRUCTIONS 38
Semproniana and Gugada) in a non-elastic metal structure, fixed to the wall, in the Central European
way and without yoke [35]. This "modern" installation does not allow the manual ringing of the bells, nor
does it allow for the reproduction of the traditional rhythm of the bells [35]. In addition, this system may
cause damage to the bell tower due to the lack of counterweight. See Figure 25 and Figure 26 depicting
the various bells.
Figure 25 – Picture of traditional Spanish Yoke bells with counterweights c. 1920s (left) [35]; Picture of the clock bell in level 7-8 today (right) [36]
Figure 26 – “Modern” church bell structure today [36]

Dynamic characterisation of the bell tower of Sant Cugat Monastery
ADVANCED MASTERS IN STRUCTURAL ANALYSIS OF MONUMENTS AND HISTORICAL CONSTRUCTIONS 39
3.2 Geometrical Survey
Following an historic survey, it is critical to understand the state of the existing structure prior to the
development of any additional work. Therefore, a thorough review of existing documentation regarding
the current structure of the bell tower was conducted prior to the development of the numerical model.
3.2.1 Structure
The geometry and structure of the bell tower of Sant Cugat Monastery were based primarily on an as-
found drawing set created by the Departament de Cultura of the Generalitat de Catalunya in 1991 [37]
and pictures of the Monastery found online. The drawing set was imported into AutoCAD, scaled to size,
and measured to obtain the necessary dimensions to create the 3-dimensional model. See Appendix A
for the amalgamation of drawings pertinent to the bell tower and for key dimensions utilized for the
creation of the model.
The bell tower of Sant Cugat Monastery measures approximately 42 m in height and has a floor plan
measuring approximately 7.2 m by 7.2 m. The floor plan is assumed to remain constant until the point
at which two smaller bell structures rest atop the main structure. However, the NW wall has an additional
thickness of 60 cm up to Level 5 from the 1851 restoration campaign. The structure of the bell tower is
composed primarily of limestone masonry walls, floors, and cross vaults. Based on the drawings, it was
assumed that the masonry walls measure approximately 1.35 m in thickness and that the masonry
cross-vaults measure approximately 0.25 m in thickness and are covered with a less dense infill beneath
floor levels. The structure is separated into nine levels as shown in Figure 27 and has cross vaults and
floor structures at levels 2, 3, 5, 6 and 7.

Dynamic characterisation of the bell tower of Sant Cugat Monastery
ADVANCED MASTERS IN STRUCTURAL ANALYSIS OF MONUMENTS AND HISTORICAL CONSTRUCTIONS 40
Figure 27 – Basic dimensions from existing drawing set [37]
Locations and measurements of openings were obtained from the drawing set and were included in the
3D model. Between levels 1 and 6 there are large openings on the interior NW façade and multiple
smaller openings (windows) on the exterior SE façade. The NE façade had no apparent openings and
the SW façade had door openings at the first, second and third floor levels, after which point, an external
staircase proceeds into the tower and continues upwards to the top of level 7. Between levels 6 and 7,
there are 2 large semicircular windows on each façade approximately 3.7 m in height and 1.3 m in width.
Between levels 7 and 8, there is one large semi-circular window on each façade measuring
approximately 3.3 m in height and 1.2 m in width, hosting one clock bell. Lastly, between levels 8 and
9, there is also one large semi-circular window on each façade measuring approximately 2.5 m in height
and 0.75 m in width, hosting a second clock bell. See Figure 28 and Figure 29 depicting the geometry
of the bell tower as created in AutoCAD 3D.

Dynamic characterisation of the bell tower of Sant Cugat Monastery
ADVANCED MASTERS IN STRUCTURAL ANALYSIS OF MONUMENTS AND HISTORICAL CONSTRUCTIONS 41
Figure 28 – Elevations of all four facades of the 3D model of the bell tower (from left to right: NW, NE, SE, SW)
Figure 29 – Sections of the 3D model of the bell tower showing openings and cross-vaults (from left to right: NE-SW section looking towards SE façade, NW-SE section looking towards NE façade ,NE-SW section looking
towards NW façade)

Dynamic characterisation of the bell tower of Sant Cugat Monastery
ADVANCED MASTERS IN STRUCTURAL ANALYSIS OF MONUMENTS AND HISTORICAL CONSTRUCTIONS 42
The cross-vaults were modelled by intersecting two barrel vaults with thicknesses of 0.25 m within the
external masonry walls where the load is transferred. The vault geometry is depicted in Figure 30
showing how the masonry infill (blue) is located atop the vaults in order to model the different mechanical
properties.
Figure 30 – Construction of the barrel vaults: left – masonry infill; middle – masonry infill located with the vault structure; right – 3D solid model of the vault, infill is hidden
Following vault construction, the entire model was built by extruding the main floor plan to each level,
attaching the vault-floor structure, extruding the remaining thicknesses of the floors and subtracting
openings from the exterior walls as shown in Figure 31.
Figure 31 – Finalized 3D solid geometry as constructed in AutoCAD to be imported into DIANA FEA software

Dynamic characterisation of the bell tower of Sant Cugat Monastery
ADVANCED MASTERS IN STRUCTURAL ANALYSIS OF MONUMENTS AND HISTORICAL CONSTRUCTIONS 43
3.2.2 Connections
The bell tower is surrounded by the main body of the Church on the NE, SW and NW façades and
therefore, the connection between the bell tower and church must be modelled to allow for some load
transfer and movement at intersection points. Based on the drawings, it appears that the SW and NW
walls of the tower are connected to the main body of the Church through large cross-vaults intersecting
the tower between levels 4 and 5. However, on the NE façade, the tower appears to be connected to a
small, rectangular masonry substructure up to a height of 9.1 m and then by a smaller rectangular
substructure up another 5.8 m. Therefore, the connection points were modeled as solid bodies
integrated into the walls of the tower for implementation in the FEM software.
A brief assessment of the lateral connections between the church and the bell tower was conducted by
Professor Climent Molins of UPC on July 14th, 2020. This was achieved through the inspection of the
intrados’ of the vaults within the bell tower at levels 4 and 5. As depicted in Figure 32 and Figure 33,
cracks were observed at the intersections between the bell tower and the SW wall of the church at both
levels. Cracking indicates stress concentrations within the masonry, however, also indicates some form
of restraint introduced by the connecting vaults. Therefore, the impact of the lateral connections must
be accounted for in the FE models.
Figure 32 – Observed crack pattern at the intersection between the vault intrados and the SW wall of the church at Level 4 [36]

Dynamic characterisation of the bell tower of Sant Cugat Monastery
ADVANCED MASTERS IN STRUCTURAL ANALYSIS OF MONUMENTS AND HISTORICAL CONSTRUCTIONS 44
Figure 33 – Observed repaired cracks at intersection between the vault intrados and the SW wall at Level 5 [36]
Lastly, the foundation was assumed to be fixed where all surfaces meet the ground due to the lack of
information regarding subsurface conditions. However, due to the observed outward tilt of the tower,
flexible foundations were also considered in the modal analyses.
3.2.3 Outward Tilt of SE façade
An outward tilt of the bell tower of Sant Cugat Monastery has been observed and of concern as early as
the 19th century. In June 2019, the outward tilt of the bell tower was measured by the Department of
Urban Planning and Projects as shown in Table 9.

Dynamic characterisation of the bell tower of Sant Cugat Monastery
ADVANCED MASTERS IN STRUCTURAL ANALYSIS OF MONUMENTS AND HISTORICAL CONSTRUCTIONS 45
Table 9 – Results from June 2019 bell tower survey [38]
Position measured
from Edge Height (m) Inclination (%)
Displacement
(m)
Lower tower
North 15.4 0.63 0.10
East 31.40 1.34 0.42
South 31.37 1.50 0.47
West 16.2 0.46 0.07
Intermediate tower
North 5.85 0.45 0.03
East 5.85 1.00 0.06
South 5.85 0.50 0.03
West 5.85 1.10 0.06
Upper tower
North 3.19 1.00 0.03
East 3.19 1.46 0.05
South 3.19 1.00 0.03
West 3.19 0.63 0.02
From these results, it was concluded that the edges of the bell tower have inclinations varying between
0.50% and 1.50%, predominantly in the South and Southeast directions, resulting in a maximum
displacement of 42 to 47 cm with respect to the vertical at the highest point of the tower edges [38]. A
laser scan was also conducted on the SE façade of the church in July 2019 to verify the measured
displacements of the bell tower and to identify any displacement in the SE façade of the surrounding
church, the results of which are depicted in Figure 34 [39].
Figure 34 – Results from July 2019 laser scan of the SE façade of the Sant Cugat Basilica [39]

Dynamic characterisation of the bell tower of Sant Cugat Monastery
ADVANCED MASTERS IN STRUCTURAL ANALYSIS OF MONUMENTS AND HISTORICAL CONSTRUCTIONS 46
The laser scan confirmed the outward displacement of the tower, measuring a maximum inclination of
1.79% and lateral displacement of 52 cm, similar to the maximum displacement observed in the June
2019 survey. The laser scan confirmed that the SE church façade is characterized by a significant
inclination as well, varying between 0.34 % (0.04 m) and 2.50 % (0.30 m) along its length [39].
Both the survey and the laser scan conducted in 2019 confirm the outward displacement of the tower,
however, it is uncertain if the displacement of the bell tower is caused by poor connections with the
surrounding church structure, differential subsurface conditions, or a combination of both. Therefore, it
is recommended that dynamic testing be conducted to help identify the source of the displacement so
that the problem can be remediated, and the cultural asset may be conserved for future generations.
3.2.4 Limitations & Assumptions
Due to COVID-19, access to the Monastery was not possible and therefore all geometrical and structural
information was based solely on a review of existing documentation and therefore, may not be indicative
of the actual structure. For example, additional deadloads may exist within the bell tower that could not
be identified, nor could the identification of any damages or interventions be conducted. Therefore, it
was assumed that the drawings are accurate and that the structure is in relatively good condition
throughout.

Dynamic characterisation of the bell tower of Sant Cugat Monastery
ADVANCED MASTERS IN STRUCTURAL ANALYSIS OF MONUMENTS AND HISTORICAL CONSTRUCTIONS 47
4. EXPECTED MODAL PARAMETERS
Following the construction of the geometry of the bell tower, numerical modelling was conducted to
obtain its hypothetical dynamic properties and to be used for model calibration following dynamic testing.
Both a simplified beam and full solid model were created with various restraint scenarios to be compared
and to ensure accuracy of the more detailed solid model. The following subsections outline the
construction of the finite element models along with an analysis of their results.
4.1 Simplified Beam Element Estimation
Preliminary modal parameters of the bell tower at Sant Cugat Monastery were obtained through the
creation of a representative simplified beam model in finite element software DIANA FEA [17]. This was
achieved through the following procedure.
4.1.1 Geometry
Class I 3D beam elements were drawn in DIANA FEA to represent the bell tower by splitting the structure
into 18 critical cross-sections including hollow sections, solid floors and large openings as described in
Table 10 and Table 11.
Table 10 – Main sections of bell tower
Section Z (m) Height (m) Description
1 0 3.5 3.5 Opening at level 1
2 3.5 5.7 2.2 Above opening at level 1
3 5.7 6.7 1 Floor at level 2
4 6.7 9.1 2.4 Opening at level 2
5 9.1 11.3 2.2 Above opening at level 2
6 11.3 11.65 0.35 Floor at level 3
7 11.65 12.2 0.55 Connection on NE façade
8 12.2 13.83 1.63 Connection on NW façade
9 13.83 18.65 4.82 Below level 5
10 18.65 19.33 0.68 Floor at level 5
11 19.33 25.38 6.05 Between levels 5-6
12 25.38 25.84 0.46 Floor at level 6
13 25.84 32.338 6.498 Between levels 6-7
14 32.338 33.008 0.67 Top of main tower
15 33.008 37.9704 4.9624 Between levels 7-8
16 37.9704 38.659 0.6886 Top of level 8
17 38.659 41.3936 2.7346 Between levels 8-9
18 41.3936 42 0.6064 Top of bell tower

Dynamic characterisation of the bell tower of Sant Cugat Monastery
ADVANCED MASTERS IN STRUCTURAL ANALYSIS OF MONUMENTS AND HISTORICAL CONSTRUCTIONS 48
Table 11 – Section properties
Section Plan view Area (m2) Ixx (m4) Iyy (m4) Ixy (m4) It (m4/rad)
1
26.8 149.6 179.7 0.8956 14.41
2, 5, 7, 8
30.3 185.6 184.9 -0.506 277.3
3, 6
49.9 222.2 213.5 -0.6727 368.1
4
27.4 156.4 181.9 1.443 14.41
9, 11, 13
26.5 159.7 159.6 -0.9807 209.7
10, 12, 14
48.5 200.6 200.0 -0.5496 311.9
15
7.11 10.21 10.81 -0.0269 15.10
16
12.4 12.49 13.30 0 21.65
17
2.38 0.7481 0.7228 -0.0014 0.9780
18
3.05 0.7891 0.7582 0 1.3

Dynamic characterisation of the bell tower of Sant Cugat Monastery
ADVANCED MASTERS IN STRUCTURAL ANALYSIS OF MONUMENTS AND HISTORICAL CONSTRUCTIONS 49
For each section, the moment of inertia about X (Ix) and Y (Iy), the product moment of inertia (Ixy), the
torsional moment of inertia (It), and any eccentricities were inputted into the software, an example of
which is depicted in Figure 35.
Figure 35 – Section properties for Section 1
The area and moment of inertias were computed using AutoCAD command MASSPROP whereas the
torsional moment of inertias were computed by simplifying sections as rectangles, hollow rectangles or
C-channels and using a moment of inertia calculator [40]. Note that an eccentricity of -0.3 m in the
global Y direction was applied to sections 1 to 8 to align the structure as it is. The total height of the
beam model measures 42 m, identical to that of the 3D solid model.
4.1.2 Materials
The material properties were chosen as indicated in Table 12 and are based on the values obtained
from the literature review.
Table 12 – Material properties used in FE model
Material Class Material
Model
Young’s
Modulus (MPa)
Poisson’s
Ratio
Specific Weight
(kN/m3)
Masonry Concrete and
Masonry
Linear elastic
isotropic 2500 0.15 22

Dynamic characterisation of the bell tower of Sant Cugat Monastery
ADVANCED MASTERS IN STRUCTURAL ANALYSIS OF MONUMENTS AND HISTORICAL CONSTRUCTIONS 50
4.1.3 Loads
The only load considered was the self weight of the structure. This was computed by DIANA based on
the inputted mass densities and was imposed to the structure as a global load. The total load for analysis
was computed as indicated in Table 13.
Table 13 – Applied loads due to self weight as calculated in AutoCAD or DIANA FEA
Self Weight (kg) Applied Load (kN)
2 302 000 22 583
4.1.4 Boundary Conditions
The tower was assumed to be supported on the bottom surface and at the three lateral connections
between the bell tower and church. The base of the tower was assumed to be fully fixed and therefore
was modelled as such with the bottom face of the tower restrained from translation and rotation in all
directions. The connections between the three walls of the tower and the main church were more
complicated as they cannot be assumed to be fully fixed or fixed at all. In particular, it is hypothesized
that the SW and NE walls have little-to-no connection to the main body of the church due to the observed
outward tilt of the tower separate from the body of the main church. Therefore, the tower was modelled
with three different support variations:
A ) Cantilever fixed at the base: this restraint scenario represents the worst case, where there
is no lateral restraint provided by the adjacent NE, NW or SW walls. This is likely not the
case, however, was considered to obtain a Lower Limit for the dynamic properties.
B ) Fixed at the base and supported laterally on the interior connection surface: this
restraint scenario represents a situation where there is a rigid connection between the tower
and the intersecting church vault on the NW façade, but no additional lateral restraint
provided by the adjacent NE or SW walls. This is a more probabilistic scenario as it has
been hypothesized that the NE and SW walls are improperly connected to the tower. In
addition, this scenario will provide modal results that lie within the lower and upper limits.
C ) Fixed at the base and supported laterally on all three connection surfaces: this
restraint scenario represents the most retrain, where the tower is fully laterally supported by
the intersecting church bodies on the adjacent NE, NW and SW walls. This is almost
certainly not the case, however, will be considered to obtain an Upper Limit for the dynamic
properties.

Dynamic characterisation of the bell tower of Sant Cugat Monastery
ADVANCED MASTERS IN STRUCTURAL ANALYSIS OF MONUMENTS AND HISTORICAL CONSTRUCTIONS 51
Note that due to the two-dimensional nature of the simplified model, the restraints could not be applied
to surfaces and could only be applied to lines or nodes. The restraint scenarios that were analysed are
depicted in Figure 36.
Figure 36 – Support conditions from left to right: A: fixed at the base, B: fixed at the base and laterally restrained in global Y direction, C: fixed at base and restrained in global X and Y directions
4.1.5 Mesh
The mesh properties were assigned as depicted in Figure 37 using a 0.2 m mesh (209 elements), default
mesher type and linear interpolation. A smaller mesh size was implemented for comparison; however,
it was found that due to the simple nature of the model, the element size had a negligible impact on the
results (<0.5% difference between eigen frequencies). Therefore, the model with 0.2 m element size
was used for analysis of the results, similar to that of the 3D model.
Figure 37 - Mesh as defined in the FE model: top view (left), full view (right)
A B C

Dynamic characterisation of the bell tower of Sant Cugat Monastery
ADVANCED MASTERS IN STRUCTURAL ANALYSIS OF MONUMENTS AND HISTORICAL CONSTRUCTIONS 52
4.1.6 Linear Self Weight Analysis
A linear elastic analysis was conducted first to ensure the reaction forces were as expected for the self
weight of the structure. This was achieved using the “structural linear static” analysis tool in DIANA FEA
in which the Parallel Direct Sparse solution method was utilized with a convergence tolerance of 1e-08.
As seen in Table 14, the model was in equilibrium and in the correct order of magnitude.
Table 14 – Linear elastic self weight analysis results
Applied Load (kN) Sum of Reaction Forces (kN) % Difference
22 583 22 583 0
4.1.7 Linear Modal Response Analysis
The modal parameters (mode shapes, eigenfrequencies, global participation factors and mass
participation percentages) were identified using the “Structural Modal Response” analysis function in
DIANA FEA. This was achieved using the eigenvalue analysis parameters as indicated in Table 15.
Table 15 – Eigenvalue analysis parameters
Parameter Input
Stiffness Matrix linear elastic
Mass Matrix Type Consistent
Solver Method Implicitly restarted Arnoldi method
Solver Type Parallel direct
Number of Eigenfrequencies 30
Maximum # of Iterations 30
Convergence Criterion Tolerance 1e-06
4.2 Full Solid Element Estimation
To obtain a more accurate representation of the modal parameters of the bell tower of Sant Cugat
Monastery, a representative 3-dimensional solid finite element model was constructed in DIANA FEA.
This was achieved through the following procedure.
4.2.1 Geometry
The solid 3D geometry was imported from AutoCAD as a .iges file. This allowed for the solid elements
created in AutoCAD to be imported as 3D solid structural elements in DIANA FEA. Any changes that
needed to be made throughout the iterative procedure were conducted in AutoCAD and re-imported into
DIANA.

Dynamic characterisation of the bell tower of Sant Cugat Monastery
ADVANCED MASTERS IN STRUCTURAL ANALYSIS OF MONUMENTS AND HISTORICAL CONSTRUCTIONS 53
4.2.2 Materials
The material properties were chosen as indicated in Table 16 based on the findings from the literature
review.
Table 16 – Material properties used in FE model
Material Class Material Model
Young’s
Modulus
(MPa)
Poisson’s
Ratio
Specific
Weight
(kN/m3)
3D Surface
Interface Springs
(kN/m3)
Masonry Concrete and
Masonry
Linear elastic
isotropic 2500 0.15 22
250 – 1250000
Vault Infill Concrete and
Masonry
Linear elastic
isotropic 2500 0.15 18
4.2.3 Loads
The only load considered for both the analyses was the self weight of the structure. This was computed
by DIANA based on the inputted specific weights and was imposed to the structure as a global load.
The total load for analysis was computed as indicated in Table 17.
Table 17 – Applied loads due to self weight as calculated in AutoCAD or DIANA FEA
Self Weight (kg) Applied Load (kN)
2 288 854 22 446
4.2.4 Supports & Connections
The tower was supported on the bottom surface and at the three lateral connection surfaces between
the tower and the church. The base of the tower was assumed to be fully fixed and therefore was
modelled as such with the bottom face of the tower restrained from translation and rotation in all
directions. The connections between the three walls of the tower and the main church were more
complicated as they cannot be assumed to be fully fixed or fixed at all. In particular, it is hypothesized
that the SW and NE walls have little-to-no connection with the main body of the church due to the
observed outward tilt of the tower separate from the body of the main church. Therefore, the tower was
modelled with five different support scenarios to capture the range of possible dynamic properties of the
bell tower:
A ) Cantilever fixed at the base: this restraint scenario represents the worst case, where there
is no lateral restraint provided by the adjacent NE, NW or SW walls. This is likely not the
case, however, was considered to obtain a Lower Limit for the dynamic parameters.
B ) Fixed at the base and supported laterally on the interior connection surface: this
restraint scenario represents a situation where there is a rigid connection between the tower

Dynamic characterisation of the bell tower of Sant Cugat Monastery
ADVANCED MASTERS IN STRUCTURAL ANALYSIS OF MONUMENTS AND HISTORICAL CONSTRUCTIONS 54
and the intersecting church vault on the NW façade, but no additional lateral restraint
provided by the adjacent NE or SW walls. This is a more realistic scenario as it has been
hypothesized that the NE and SW walls are improperly connected to the tower. In addition,
this scenario will provide modal results that lie within the lower and upper limits.
C ) Fixed at the base and supported laterally on all three connection surfaces: this
restraint scenario represents the most restrained case, where the tower is fully laterally
supported by the intersecting church bodies on the adjacent NE, NW and SW walls. This is
likely not the case, however, was considered to obtain an Upper Limit for the dynamic
parameters.
D ) Fixed at the base, fixed laterally on the interior connection surface and supported
laterally with springs on the SW and NE connection surfaces: similar to scenario B, this
restraint scenario represents a situation where there is a rigid connection between the tower
and the intersecting church vault on the NW façade, however there is some lateral restraint
provided by the adjacent NE and SW walls. The additional lateral restraints are modeled
with boundary surfaces with reduced stiffnesses compared to the restraint provided by a
rigid support. This is a more realistic scenario compared to scenario B, as even if there is a
poor connection between the tower and the adjacent NE and SW walls, there is likely some
connection which can be modeled with the boundary surface.
E ) Fixed at the base and supported laterally with springs on all connection surfaces:
This restraint scenario is hypothesized to be the most likely as it is very unlikely that the
connections between the tower and the church, if any, are completely rigid. The reduced
rigidity was modeled by introducing boundary surfaces with reduced stiffness on the
adjacent NW, NE and SW walls.
The restraint scenarios that were analysed are depicted in Figure 38 to Figure 41.

Dynamic characterisation of the bell tower of Sant Cugat Monastery
ADVANCED MASTERS IN STRUCTURAL ANALYSIS OF MONUMENTS AND HISTORICAL CONSTRUCTIONS 55
Figure 38 - Support conditions from left to right: A: fixed at the base, B: fixed at the base and laterally restrained on the interior connection surface, C: fixed at base and laterally restrained on all three connection surfaces
Figure 39 – Plan view of support conditions from left to right: A, B and C
Figure 40 - Support conditions for Scenario D: fixed at the base, fixed laterally on the interior connection surface and supported laterally with springs on the SW and NE connection surfaces
A B C C
A B C
D D

Dynamic characterisation of the bell tower of Sant Cugat Monastery
ADVANCED MASTERS IN STRUCTURAL ANALYSIS OF MONUMENTS AND HISTORICAL CONSTRUCTIONS 56
Figure 41 - Support conditions for Scenario E: fixed at the base, supported laterally with springs on all connection surfaces
Scenario A can be considered the most flexible scenario, where there are no lateral restraints supporting
the tower. On the contrary, Scenario C is the most rigid case where there are fixed lateral restraints at
all connection surfaces. In reality, the dynamic properties will lie within this range, therefore, Scenarios
D and E were created with springs to simulate the real situation. The boundary springs are comprised
of structural plane interface elements with an associated stiffness applied perpendicular to the boundary
plane in kN/m3.
The spring stiffness along with the elastic modulus of the masonry are parameters that will need to be
updated using an iterative procedure following the dynamic testing. However, an expected range for the
spring stiffness was obtained by conducting an iterative sensitivity analysis of the first three global
modes (bending in X, bending in Y and torsion) and comparing the eigen frequencies to those obtained
from the first three restraint scenarios (A-C). Through this analysis, a range of spring constants was
obtained as shown in Table 18.
E E

Dynamic characterisation of the bell tower of Sant Cugat Monastery
ADVANCED MASTERS IN STRUCTURAL ANALYSIS OF MONUMENTS AND HISTORICAL CONSTRUCTIONS 57
Table 18 – Spring stiffness range for lateral restraints
Range
Description
Spring Stiffness
(kN/m3)
Mode Shape
Description
Scenario D – Eigen
frequency (Hz)
Scenario E – Eigen
frequency (Hz)
Low end – close
to Scenario A 500
Global bending about
X 2.19 1.08
Global bending about
Y 1.11 1.10
Global torsion 6.18 3.51
Average -
between Scenario
A and Scenario
B/C
50 000
Global bending about
X 2.19 1.59
Global bending about
Y 1.66 1.65
Global torsion 6.30 5.19
High end – close
to Scenario B/C 1 000 000
Global bending about
X 2.19 2.13
Global bending about
Y 2.08 2.16
Global torsion 6.58 6.61
Therefore when calibrating the model, spring stiffnesses ranging from 500 to 1 000 000 kN/m3 may be
considered until modal parameters match those obtained in the dynamic testing campaign. However,
for the sake of the analysis of the hypothetical model, the spring stiffness which produced results
between Scenarios A and B/C was considered (50 000 kN/m3).
4.2.5 Mesh
Two meshes were considered for increased accuracy and comparison of results. The mesh properties
were assigned as indicated in Table 19 and are depicted in Figure 42.
Table 19 – Mesh properties as defined in the FE model
Mesh Element Size [m] Mesher Type Mid-side node location # of elements
Coarse 0.3 Tetra/Triangle Linear interpolation 320 630
Fine 0.2 Tetra/Triangle Linear interpolation 978 067

Dynamic characterisation of the bell tower of Sant Cugat Monastery
ADVANCED MASTERS IN STRUCTURAL ANALYSIS OF MONUMENTS AND HISTORICAL CONSTRUCTIONS 58
Figure 42 – Model with coarse mesh (left) vs. fine mesh (right)
It was found that the modal frequencies between coarse and fine meshes were consistent, varying by
an average of only 2.1%. Therefore, the model was considered to be accurate and the fine mesh was
utilized for further analyses.
4.2.6 Linear Self Weight Analysis
A linear elastic analysis was conducted first to ensure the reaction forces were as expected for the self
weight of the structure. This was achieved using the “structural linear static” analysis tool in DIANA FEA
in which the Parallel Direct Sparse solution method was utilized with a convergence tolerance of 1e-08.
As can be seen in Table 20, the model was in equilibrium and in the correct order of magnitude.
Table 20 – Linear elastic reaction forces in the global Z direction
Applied Load (kN) Sum of Rection Forces (kN) % Difference
22 446 22 454 0.0375
4.2.7 Linear Modal Response Analysis
The modal parameters (mode shapes, eigenfrequencies, global participation factors and mass
participation percentages) were identified, with both fine and coarse meshes, using the “Structural Modal
Response” analysis function in DIANA FEA. This was achieved using the eigenvalue analysis
parameters as indicated in Table 21.

Dynamic characterisation of the bell tower of Sant Cugat Monastery
ADVANCED MASTERS IN STRUCTURAL ANALYSIS OF MONUMENTS AND HISTORICAL CONSTRUCTIONS 59
Table 21 – Eigenvalue analysis parameters
Parameter Input
Stiffness Matrix linear elastic
Mass Matrix Type consistent
Solver Method Implicitly restarted Arnoldi method
Solver Type Parallel direct
Number of Eigenfrequencies 30-70
Maximum # of Iterations 30
Convergence Criterion Tolerance 1e-06
4.3 Results & Analysis
The following section outlines the main results from both the static and dynamic analyses including the
comparison of the main modal parameters (mode shapes and frequencies) for the beam and solid
models and for each restraint scenario.
4.3.1 Linear Self Weight Analysis
First, a comparison of the applied load was conducted between the simplified beam model and full 3D
solid model, the results of which are provided in Table 22.
Table 22 – Linear elastic self weight analysis results
Model Applied Load (kN) Sum of Reaction
Forces (kN)
Simplified Beam 22 583 22 583
3D Solid 22 446 22 454
% Difference 0.6
From this comparison, it was found that the solid model had only 0.6 % less mass compared to the
simplified beam model. Therefore, the simplified model proved to be an accurate representation of the
bell tower.
4.3.2 Linear Modal Response Analysis
Further comparison was conducted between the first three corresponding global mode shapes of the
simplified beam model and the full 3D solid model as shown in Table 23 to Table 25. As can be observed,
the modal frequencies vary by less than 8% and therefore, the simplified model can be considered to
validate the 3D solid model for further analysis and for the dynamic characterisation of the Sant Cugat
bell tower.

Dynamic characterisation of the bell tower of Sant Cugat Monastery
ADVANCED MASTERS IN STRUCTURAL ANALYSIS OF MONUMENTS AND HISTORICAL CONSTRUCTIONS 60
Table 23 – Beam vs. solid – Scenario A: corresponding mode shapes
Simplified Beam Model 3D Solid Model %
Difference Mode
Frequency
(Hz) Mode Description Mode
Frequency
(Hz) Mode Description
1 1.13 1st global bending mode
about X axis 1 1.08
1st global bending mode
about X axis 4.5
2 1.17 1st global bending mode Y
axis 2 1.09
1st global bending mode
about Y axis 7.3
6 7.56 Global elongation and
torsion 6 7.04
Global elongation and
torsion, local bending of top
two tiers about XY axes
7.1
Table 24 – Beam vs. solid – Scenario B: corresponding mode shapes
Simplified Beam Model 3D Solid Model %
Difference Mode
Frequency
(Hz) Mode Description Mode
Frequency
(Hz) Mode Description
1 1.17 1st global bending mode
about Y axis 1 1.10
1st global bending mode
about Y axis 6.5
3 2.29 1st global bending mode
about X axis 2 2.16
1st global bending mode
about X axis 6.0
5 7.56 Global elongation and
torsion 6 7.05
Global elongation and
torsion, local bending of
top two tiers about Y axis
7.0
Table 25 – Beam vs. solid – Scenario C: corresponding mode shapes
Simplified Beam Model 3D Solid Model %
Difference Mode
Frequency
(Hz) Mode Description Mode
Frequency
(Hz) Mode Description
3 2.30 1st global bending mode
about X axis 1 2.17
1st global bending mode
about both X (more) and
Y axes
5.8
2 2.15 1st global bending mode
about Y axis 2 2.21
1st global bending mode
about both X and Y
(more) axes
-2.8
4 7.56 Global elongation and
torsion 6 7.09
Global elongation, local
bending of top two tiers
about Y axis
6.4
In addition, the first ten modal parameters between the simplified and full models were compared as
indicated in Table 26. See Appendix B for a depiction of each mode shape listed in Table 26.

Dynamic characterisation of the bell tower of Sant Cugat Monastery
ADVANCED MASTERS IN STRUCTURAL ANALYSIS OF MONUMENTS AND HISTORICAL CONSTRUCTIONS 61
Table 26 – Modal Frequency comparison between beam and solid models (brackets indicate the mode number)
Mode Shape Simplified Beam Model 3D Solid Model
Description Line Diagram 3D Diagram f (Sc. A)
[Hz]
f (Sc. B)
[Hz]
f (Sc. C)
[Hz]
f (Sc. A)
[Hz]
f (Sc. B)
[Hz]
f (Sc. D)
[Hz]
f (Sc. E)
[Hz]
f (Sc. C)
[Hz]
1st global
bending mode
about X axis
1.1256
(1)
2.2957
(3)
2.2958
(3)
1.0756
(1)
2.1624
(2)
2.1633
(2)
1.5796
(1)
2.1658
(1)
1st global
bending mode
about Y axis
1.1707
(2)
1.1707
(1)
2.1502
(2)
1.0886
(2)
1.0975
(1)
1.6526
(1)
1.6383
(2)
2.2109
(2)

Dynamic characterisation of the bell tower of Sant Cugat Monastery
ADVANCED MASTERS IN STRUCTURAL ANALYSIS OF MONUMENTS AND HISTORICAL CONSTRUCTIONS 62
Mode Shape Simplified Beam Model 3D Solid Model
Description Line Diagram 3D Diagram f (Sc. A)
[Hz]
f (Sc. B)
[Hz]
f (Sc. C)
[Hz]
f (Sc. A)
[Hz]
f (Sc. B)
[Hz]
f (Sc. D)
[Hz]
f (Sc. E)
[Hz]
f (Sc. C)
[Hz]
Global torsion
mode
6.1573
(5)
6.1566
(4) - -
6.0721
(4)
6.1927
(4)
5.1347
(3)
6.6020
(3)
2nd global
bending mode
about X axis
6.0309
(4) - -
4.4418
(4)
6.6314
(5)
6.6335
(5)
5.3498
(4)
6.6705
(4)
3rd global
bending mode
about Y axis,
global torsion
-
- - - 4.4574
(5) - -
5.7751
(5)
6.8807
(5)

Dynamic characterisation of the bell tower of Sant Cugat Monastery
ADVANCED MASTERS IN STRUCTURAL ANALYSIS OF MONUMENTS AND HISTORICAL CONSTRUCTIONS 63
Mode Shape Simplified Beam Model 3D Solid Model
Description Line Diagram 3D Diagram f (Sc. A)
[Hz]
f (Sc. B)
[Hz]
f (Sc. C)
[Hz]
f (Sc. A)
[Hz]
f (Sc. B)
[Hz]
f (Sc. D)
[Hz]
f (Sc. E)
[Hz]
f (Sc. C)
[Hz]
Global
elongation in Z
axis
7.5631
(6)
7.5592
(5)
7.5592
(4)
7.0420
(6)
7.0455
(6)
7.0496
(6)
7.0465
(6)
7.0926
(6)
Local bending
mode above
level 6 about Y
axis
- - 9.7533
(6)
7.2213
(7)
7.2493
(7)
7.9923
(7)
7.9812
(8) -
3rd global
bending mode
about X axis
- 10.178
(7)
10.179
(7) -
9.4400
(8)
9.4675
(8)
7.6198
(7)
9.4625
(7)

Dynamic characterisation of the bell tower of Sant Cugat Monastery
ADVANCED MASTERS IN STRUCTURAL ANALYSIS OF MONUMENTS AND HISTORICAL CONSTRUCTIONS 64
Mode Shape Simplified Beam Model 3D Solid Model
Description Line Diagram 3D Diagram f (Sc. A)
[Hz]
f (Sc. B)
[Hz]
f (Sc. C)
[Hz]
f (Sc. A)
[Hz]
f (Sc. B)
[Hz]
f (Sc. D)
[Hz]
f (Sc. E)
[Hz]
f (Sc. C)
[Hz]
Local bending
mode above
level 7 about X
axis
12.127
(9) - -
7.2799
(8) -
13.623
(11)
13.612
(12)
13.620
(10)
4th global
bending mode
about Y axis,
local torsion
above level 6
12.086
(8)
12.087
(8)
12.088
(8)
8.8469
(9)
9.6053
(9)
11.533
(9)
11.509
(11)
9.7927
(8)
Local bending
mode above
level 6 about Y
axis
12.337
(10)
12.376
(9) - - -
13.880
(12)
13.874
(13)
13.962
(11)

Dynamic characterisation of the bell tower of Sant Cugat Monastery
ADVANCED MASTERS IN STRUCTURAL ANALYSIS OF MONUMENTS AND HISTORICAL CONSTRUCTIONS 65
Mode Shape Simplified Beam Model 3D Solid Model
Description Line Diagram 3D Diagram f (Sc. A)
[Hz]
f (Sc. B)
[Hz]
f (Sc. C)
[Hz]
f (Sc. A)
[Hz]
f (Sc. B)
[Hz]
f (Sc. D)
[Hz]
f (Sc. E)
[Hz]
f (Sc. C)
[Hz]
Global torsion
mode -
- - - 9.9383
(10)
11.533
(10)
12.131
(10)
10.309
(9) -
4th global
bending mode
about X axis
-
- - - 10.330
(11) - -
10.982
(10) -

Dynamic characterisation of the bell tower of Sant Cugat Monastery
ADVANCED MASTERS IN STRUCTURAL ANALYSIS OF MONUMENTS AND HISTORICAL CONSTRUCTIONS 66
From this comparison, it can be concluded that the simplified beam model validifies the 3D solid model
as it has similar global mode shapes with corresponding frequencies varying by less than 8%. The
discrepancies between corresponding mode shape frequencies could be caused by several factors such
as the linear nature of the simplified model, the lack of openings, vaults and connection surfaces in the
simplified model, and the lack of surface restraints in the simplified model. Therefore, although the
simplified beam model validifies the 3D solid model, the 3D solid model should be utilized for the
dynamic characterisation of Sant Cugat Monastery as it is more accurate and is able to produce three-
dimensional global and local mode shapes.
In addition, it can be observed that eigenfrequencies tend to decrease with reduced stiffness at the
connection surfaces (Scenarios B-E). Therefore, when analysing the results from the dynamic testing,
lower eigenfrequencies likely indicate loss of stiffness at one or more of the connection surfaces. The
aim of the iterative model updating procedure is to identify the source of the observed flexibility.
4.4 Soil-Structure Interaction
In the previous subsections, the tower was assumed to be fully supported on the bottom surface with a
perfectly rigid connection between soil and structure. However, a rigid foundation is not necessarily the
case, especially since the outward tilt of the tower may be caused by subsurface soil settlement.
Therefore, this section examines the impact of a flexible foundation on the hypothetical dynamic
properties of the Sant Cugat bell tower. This was achieved through the implementation of reduced
stiffness at the base of both models and an iterative sensitivity analysis to obtain the expected range of
stiffness.
4.4.1 Simplified Beam Model
For the sensitivity analysis of the simplified beam model, the tower was modelled with two different
support scenarios to identify an appropriate range of stiffness:
A ) Cantilever fixed at the base: this restraint scenario represents the best case, where the
base node is fixed from translation and rotation in all directions. This is likely not the case,
however, was considered to obtain an Upper Limit for the dynamic parameters.
B ) Cantilever with reduced stiffness at the base: this restraint scenario represents a soil-
structure interface with reduced stiffness at the base of the structure implemented through
two discrete rotational boundary springs (one acting in the X axis and one in the Y axis) with
assigned stiffness. In this case, an additional restraint was implemented at the base node
to restrict translation and torsion.

Dynamic characterisation of the bell tower of Sant Cugat Monastery
ADVANCED MASTERS IN STRUCTURAL ANALYSIS OF MONUMENTS AND HISTORICAL CONSTRUCTIONS 67
Note that due to the two-dimensional nature of the simplified model, the restraints could not be applied
to surfaces and could only be applied to lines or nodes.
The dynamic properties from Scenario A can be considered the best-case scenario, where the soil-
structure interaction is perfectly fixed. However, it is probable that there is some flexibility/movement in
the foundation, therefore, Scenario B was created with springs to simulate this situation. The boundary
springs are comprised of discrete rotational boundary spring elements (SP1RO) located at the base
node with an associated stiffness applied in the X and Y directions in kNm/rad.
A range for the spring stiffness was obtained by conducting an iterative sensitivity analysis of the first
three global modes (bending in X, bending in Y and second global bending in Y) and comparing the
eigen frequencies to those obtained from Scenario A. Through this analysis, a range of spring constants
was obtained as shown in Table 27.
Table 27 – Spring stiffness range for soil-structure interaction
Range
Description
Spring Stiffness
(kNm/rad)
Mode Shape
Description
Scenario B – Eigen
frequency (Hz)
Low end – close
to fully flexible 1.75e+06
Global bending about
X 0.21160
Global bending about
Y 0.21186
2nd global bending
mode about Y 1.7205
Mid-range 1e+08
Global bending about
X 0.92925
Global bending about
Y 0.95466
2nd global bending
mode about Y 1.7221
High end – close
to Scenario A
(fully rigid)
1e+12
Global bending about
X 1.1255
Global bending about
Y 1.1707
2nd global bending
mode about Y 1.7236
Therefore, when calibrating the model, spring stiffnesses ranging from 1.75e+06 to 1e+12 kNm/rad may
be considered until modal parameters match those obtained in the dynamic testing campaign. However,
for the sake of the analysis of the hypothetical model, the spring stiffness which produced results in the
mid-range was considered (1e+08 kNm/rad). See Table 28 for a comparison of the first global
frequencies between Scenarios A and B.

Dynamic characterisation of the bell tower of Sant Cugat Monastery
ADVANCED MASTERS IN STRUCTURAL ANALYSIS OF MONUMENTS AND HISTORICAL CONSTRUCTIONS 68
Table 28 - Modal Frequency comparison between restraint scenarios for mid-range spring stiffness
Mode Description Sc. A: rigid
f [Hz]
Sc. B: flexible
f [Hz]
1st global bending
mode about X axis
1.1256
(1)
0.92925
(1)
1st global bending
mode about Y axis
1.1707
(2)
0.95466
(2)
2nd global bending
mode about Y
axis, global
torsion mode
1.7236
(3)
1.7221
(3)
As can be observed, the eigenfrequencies decrease with increased flexibility at the foundation.
Therefore, when analysing the results from the dynamic testing, lower eigenfrequencies may indicate
loss of stiffness at the soil-structure interaction, however, may also be indicative of loss of stiffness at
lateral connections surfaces. The aim of the iterative model updating procedure is to identify the source
of the observed flexibility.
4.4.2 Full 3D Solid Model
For the sensitivity analysis of the 3D solid model, the tower was modelled with three different support
scenarios to identify an appropriate range of stiffness:
A ) Cantilever fixed at the base: this restraint scenario represents the best case, where the
soil-structure interface is perfectly fixed. This is likely not the case, however, was considered
to obtain an Upper Limit for the dynamic parameters.

Dynamic characterisation of the bell tower of Sant Cugat Monastery
ADVANCED MASTERS IN STRUCTURAL ANALYSIS OF MONUMENTS AND HISTORICAL CONSTRUCTIONS 69
B ) Cantilever with reduced stiffness at the base: this restraint scenario represents a soil-
structure interface with uniform reduced stiffness across the base of the structure
implemented through a fixed boundary interface with reduced stiffness to represent
subsurface instability.
C ) Cantilever with reduced stiffness at the base and fixed hinges along the NW edge of
the foundation: this restraint scenario represents a situation where the northern edge of
the foundation is fully rigid however the remainder of the surface is subjected to reduced
stiffness. In this case, the northern edge is restrained from translation in all directions,
however, is free to rotate, whereas the base of the tower is modeled with a fixed boundary
interface with reduced stiffness to represent subsurface instability. This scenario was
examined as the tower is exhibiting outward lateral displacement in the SE direction,
indicating that soil settlement may be occurring past the NW edge of the tower’s foundation.
The restraint scenarios that were analysed are depicted in Figure 43 and Figure 44.
Figure 43 - Support conditions from left to right: A: cantilever fixed at the base, B: cantilever with reduced stiffness at the base, C: cantilever with reduced stiffness at the base and fixed hinges along the NW edge of the
foundation
A B C

Dynamic characterisation of the bell tower of Sant Cugat Monastery
ADVANCED MASTERS IN STRUCTURAL ANALYSIS OF MONUMENTS AND HISTORICAL CONSTRUCTIONS 70
Figure 44 – Plan view of support conditions from left to right: A, B and C
The boundary springs in Scenarios B and C are comprised of structural plane interface elements (T18IF)
with an associated stiffness applied perpendicular to the boundary plane in kN/m3, with a shear stiffness
assumed to be infinite (1+E28 kN/m3) for simplification. A range for the spring stiffness of the soil-
structure interaction was obtained by conducting an iterative sensitivity analysis of the first three global
modes (bending in X, bending in Y and torsion) and comparing the eigen freuquncies to those obtained
in Scenario A. Through this analysis, a range of spring constants was obtained as shown in Table 29.
Table 29 – Spring stiffness range of soil-structure interaction
Range
Description
Spring
Stiffness
(kN/m3)
Mode Shape Description Scenario B – Eigen
frequency (Hz)
Scenario C – Eigen
frequency (Hz)
Low end – close
to fully flexible 100
Global bending about X 0.020601 0.04467
Global bending about Y 0.022583 0.43707
2nd global bending mode
about Y and global torsion 2.8208 1.7827
Mid-range 100 000
Global bending about X 0.55904 0.73449
Global bending about Y 0.59260 0.65628
2nd global bending mode
about Y and global torsion 2.9032 1.9057
High end – close
to Scenario A
(fully rigid)
15 000 000
Global bending about X 1.0691 1.0700
Global bending about Y 1.0836 1.0839
2nd global bending mode
about Y and global torsion 3.4395 3.4423
Therefore, when calibrating the model, spring stiffnesses ranging from 100 to 15 000 000 kN/m3 may be
considered until modal parameters match those obtained in the dynamic testing campaign. However,
for the sake of the analysis of the hypothetical model, the spring stiffness which produced mid-range
results was considered (100 000 kN/m3). See Table 30 for a comparison of the first global frequencies
between Scenario A, B and C.
A B C

Dynamic characterisation of the bell tower of Sant Cugat Monastery
ADVANCED MASTERS IN STRUCTURAL ANALYSIS OF MONUMENTS AND HISTORICAL CONSTRUCTIONS 71
Table 30 – Modal Frequency comparison between restraint scenarios for mid-range spring stiffness
Mode
Description
Sc. A: rigid
f [Hz]
Sc. B: flexible
f [Hz]
Sc. C: supported on NW edge
f [Hz]
1st global bending
mode about X axis
1.0756
(1)
0.55904
(1)
0.73449
(2)
1st global bending
mode about Y axis
1.0886
(2)
0.59260
(2)
0.65628
(1)
2nd global bending
mode about Y axis,
global torsion mode
3.4293
(3)
2.9032
(3)
1.9057
(3)
Similar to the simplified beam model, the eigenfrequencies decrease with increased flexibility at the
foundation. Therefore, when analysing the results from the dynamic testing, lower eigenfrequencies may
indicate loss of stiffness at the soil-structure interaction, however, may also be indicative of loss of
stiffness at lateral connection surfaces. The aim of the iterative model updating procedure is to identify
the source of the observed flexibility.
4.5 FE Model for Dynamic Calibration
Following dynamic testing, it is recommended that the final numerical model for calibration has boundary
conditions and updating parameters as indicated in Table 31. Spring connections were chosen for all
connection surfaces to allow for the analysis of the rigidity of these connections.

Dynamic characterisation of the bell tower of Sant Cugat Monastery
ADVANCED MASTERS IN STRUCTURAL ANALYSIS OF MONUMENTS AND HISTORICAL CONSTRUCTIONS 72
Table 31 – Updating Parameters
Updating
Parameter
Estimated
Lower Limit Mid-range
Estimated
Upper Limit Location
Young’s
Modulus (E) 1 000 MPa [6] 2 500 MPa 7 500 MPa [6] All masonry
Soil-Structure
Interface (K1) 100 kN/m3
100 000
kN/m3
15 000 000
kN/m3
NE Lateral
Interface (K2) 10 kN/m3 50 000 kN/m3
5 000 000
kN/m3
NW Lateral
Interface (K3) 10 kN/m3 50 000 kN/m3
5 000 000
kN/m3
SW Lateral
Interface (K4) 10 kN/m3 50 000 kN/m3
5 000 000
kN/m3
FE Models for all three scenarios (lower limit, mid-range and upper limit) were created and compared
against one another for use in the model updating procedure. The first three global modal parameters
in both the X and Y directions were compared in Table 32.

Dynamic characterisation of the bell tower of Sant Cugat Monastery
ADVANCED MASTERS IN STRUCTURAL ANALYSIS OF MONUMENTS AND HISTORICAL CONSTRUCTIONS 73
Table 32 – Modal Frequency comparison between Upper and Lower limits
Mode
Description
Lower Limit:
f [Hz]
Mid-range:
f [Hz]
Upper Limit:
f [Hz]
1st global
bending mode
about X axis
0.038038
(1)
1.5371
(1)
3.7082
(2)
1st global
bending mode
about Y axis
0.050585
(2)
1.5703
(2)
3.6510
(1)
Global
elongation in
Z-axis
0.17193
(3)
4.4054
(3)
- -
2nd global
bending mode
about Y axis,
global torsion
mode
1.7900
(4)
5.0875
(4)
11.359
(3)

Dynamic characterisation of the bell tower of Sant Cugat Monastery
ADVANCED MASTERS IN STRUCTURAL ANALYSIS OF MONUMENTS AND HISTORICAL CONSTRUCTIONS 74
Mode
Description
Lower Limit:
f [Hz]
Mid-range:
f [Hz]
Upper Limit:
f [Hz]
2nd global
bending mode
about X axis
2.3667
(5)
5.1658
(5)
12.144
(6)
3rd global
bending mode
about Y axis,
global torsion
2.5200
(6)
5.8727
(6)
16.832
(8)
Global torsion
mode
6.1899
(10)
10.489
(9)
23.149
(9)
3rd global
bending mode
about X axis
6.2410
(11)
10.511
(10)
16.410
(7)
These models help identify the absolute upper and lower boundaries for the modal properties of the
Sant Cugat bell tower. As discussed previously, the eigenfrequencies decrease with increased flexibility,
therefore when analysing the results from the dynamic testing, lower eigenfrequencies may indicate loss
of stiffness at one or more of the connection surfaces. Therefore, the aim of the iterative model updating
procedure is to identify the source of the observed flexibility and subsequent source(s) of damage.

Dynamic characterisation of the bell tower of Sant Cugat Monastery
ADVANCED MASTERS IN STRUCTURAL ANALYSIS OF MONUMENTS AND HISTORICAL CONSTRUCTIONS 75
5. DYNAMIC TESTING PLAN
The information obtained from the state-of-the-art literature review and the analysis of the hypothetical
numerical models were used to design a robust dynamic testing plan for the bell tower of Sant Cugat
Monastery. The dynamic testing plan includes guidelines for data acquisition, modal parameter
identification, calibration of the FE model and computation of the possible dynamic amplification factors
induced by the ringing of the bells.
5.1 Data Acquisition
The following subsection outlines the logistics required for the dynamic testing campaign. This includes
the modal testing technique to be utilized, the identification of equipment to be used, the placement of
sensors and an outlined testing procedure.
5.1.1 Dynamic Testing: AVT
It is recommended that output-only, Ambient Vibration Testing (AVT) be utilized to obtain the
experimental modal parameters of the bell tower of Sant Cugat Monastery. This is recommended as
AVT is based solely on measurements of a structure’s response caused by ambient excitation sources
(i.e. traffic, wind, people) and without the use of artificial excitation. This is excellent for historical
constructions which are typically large, structurally complex and subject to multiple restrictions due to
their historic significance. In addition, OMA testing is typically more cost efficient than EMA which
requires the use of expensive equipment.
5.1.2 Required Equipment
The sensors and data acquisition system (DAQ) recommended to be used for the dynamic testing
campaign are indicated in Table 33 and Table 34. Piezoelectric accelerometers are recommended due
to their relatively low cost, high sensitivity, good signal-to-noise ratio, and no need for an external power
source. The DAQ is required to convert the response signals into discrete digital signals which can then
be processed and analysed by modal identification software.

Dynamic characterisation of the bell tower of Sant Cugat Monastery
ADVANCED MASTERS IN STRUCTURAL ANALYSIS OF MONUMENTS AND HISTORICAL CONSTRUCTIONS 76
Table 33 – Data acquisition equipment to be used
Model/ Name cRIO-9064 (Main Controller) NI 9234 NI 9230
Quantity 1 2 1
Max no. of channels depends on chosen modules 4 3
Max sampling rate [kHz] limited by module 51.2 12.8
Input range limited by module ± 5V ± 30V
Lower cut-off frequency (at -3dB) [Hz]
limited by module 0.5 0.1
Description Embedded Real-Time controller with reconfigurable FPGA.
Chassis can hold up to 4 modules.
Sound and Vibration
Input
Sound and Vibration
Input
Table 34 – Accelerometers to be used
Model / Name 356B18 393A03 393C 393B12
Quantity 2 1 1 2
Brand PCB Piezotronics PCB
Piezotronics PCB Piezotronics
PCB Piezotronics
Type Piezoelectric Piezoelectric Piezoelectric Piezoelectric
Uniaxial/ Triaxial Triaxial Uniaxial Uniaxial Uniaxial
Sensitivity [mV/g] 1000 1000 1000 10000
Mass [g] 25 210 885 210
Frequency Range [Hz] 0.5 to 3000 (±5%)
0.3 to 5000 (±10%)
0.5 to 2000 (±5%)
0.3 to 4000 (±10%)
0.025 to 800 (±5%) 0.01 to 1200 (±10%)
0.15 to 1000 (±5%)
0.10 to 2000 (±10%)
Resolution
Broadband Resolution
[g] 0.00005 0.00001 0.0001 0.000008
Spectral Noise (1 Hz)
[g/√Hz] 0.0000114 0.000002 - 0.0000013
Spectral Noise (100
Hz) 0.0000012 0.0000002 - 0.00000013
Effective Resolution
[g] 0.00005 0.00001 0.0001 0.000008
Measurement Range [g] ±5 ±5 ±2.5 ±0.5
Needs individual power source?
No No No No
5.1.3 Location of Accelerometers
To calibrate the FE model, dynamic testing must be conducted so that the modal properties obtained in
the hypothetical models can be compared with those obtained during the dynamic testing. Therefore, it
is critical that the accelerometers be placed in predetermined locations where large deformations are
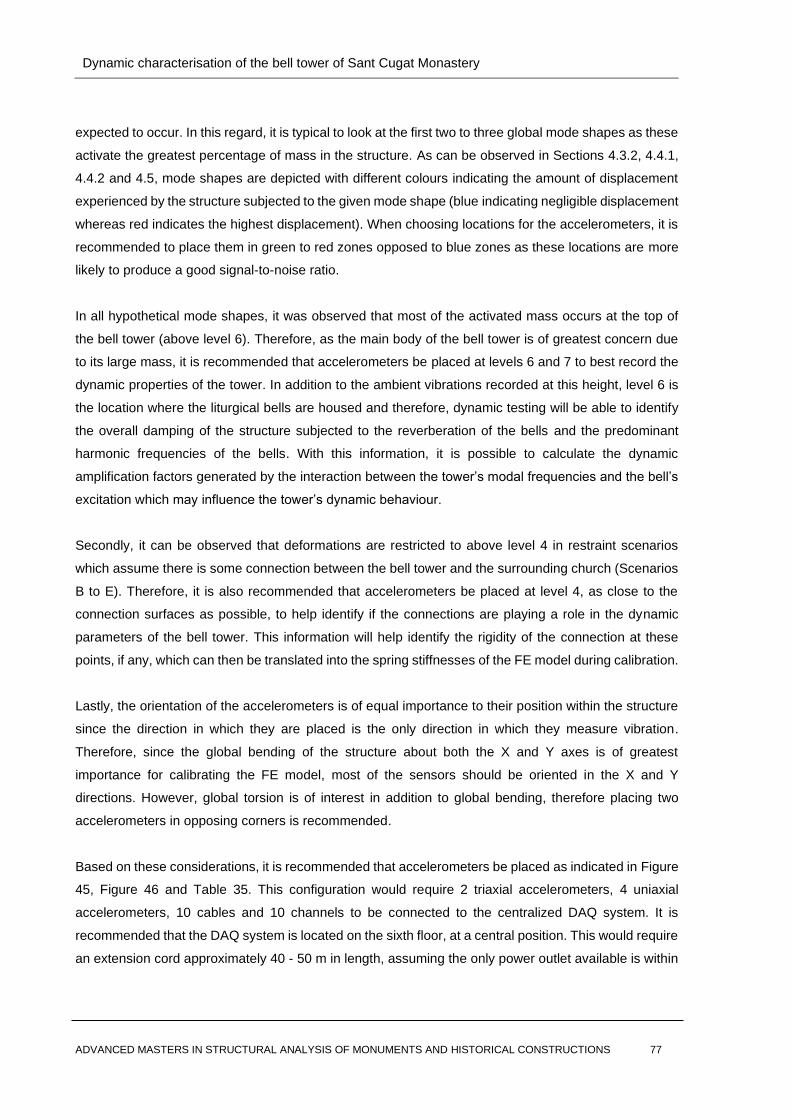
Dynamic characterisation of the bell tower of Sant Cugat Monastery
ADVANCED MASTERS IN STRUCTURAL ANALYSIS OF MONUMENTS AND HISTORICAL CONSTRUCTIONS 77
expected to occur. In this regard, it is typical to look at the first two to three global mode shapes as these
activate the greatest percentage of mass in the structure. As can be observed in Sections 4.3.2, 4.4.1,
4.4.2 and 4.5, mode shapes are depicted with different colours indicating the amount of displacement
experienced by the structure subjected to the given mode shape (blue indicating negligible displacement
whereas red indicates the highest displacement). When choosing locations for the accelerometers, it is
recommended to place them in green to red zones opposed to blue zones as these locations are more
likely to produce a good signal-to-noise ratio.
In all hypothetical mode shapes, it was observed that most of the activated mass occurs at the top of
the bell tower (above level 6). Therefore, as the main body of the bell tower is of greatest concern due
to its large mass, it is recommended that accelerometers be placed at levels 6 and 7 to best record the
dynamic properties of the tower. In addition to the ambient vibrations recorded at this height, level 6 is
the location where the liturgical bells are housed and therefore, dynamic testing will be able to identify
the overall damping of the structure subjected to the reverberation of the bells and the predominant
harmonic frequencies of the bells. With this information, it is possible to calculate the dynamic
amplification factors generated by the interaction between the tower’s modal frequencies and the bell’s
excitation which may influence the tower’s dynamic behaviour.
Secondly, it can be observed that deformations are restricted to above level 4 in restraint scenarios
which assume there is some connection between the bell tower and the surrounding church (Scenarios
B to E). Therefore, it is also recommended that accelerometers be placed at level 4, as close to the
connection surfaces as possible, to help identify if the connections are playing a role in the dynamic
parameters of the bell tower. This information will help identify the rigidity of the connection at these
points, if any, which can then be translated into the spring stiffnesses of the FE model during calibration.
Lastly, the orientation of the accelerometers is of equal importance to their position within the structure
since the direction in which they are placed is the only direction in which they measure vibration.
Therefore, since the global bending of the structure about both the X and Y axes is of greatest
importance for calibrating the FE model, most of the sensors should be oriented in the X and Y
directions. However, global torsion is of interest in addition to global bending, therefore placing two
accelerometers in opposing corners is recommended.
Based on these considerations, it is recommended that accelerometers be placed as indicated in Figure
45, Figure 46 and Table 35. This configuration would require 2 triaxial accelerometers, 4 uniaxial
accelerometers, 10 cables and 10 channels to be connected to the centralized DAQ system. It is
recommended that the DAQ system is located on the sixth floor, at a central position. This would require
an extension cord approximately 40 - 50 m in length, assuming the only power outlet available is within

Dynamic characterisation of the bell tower of Sant Cugat Monastery
ADVANCED MASTERS IN STRUCTURAL ANALYSIS OF MONUMENTS AND HISTORICAL CONSTRUCTIONS 78
the main body of the church. Due to accessibility constraints, all accelerometers are to be located on
the interior walls aside from those located above the roof at level 7.
Table 35 – Proposed accelerometer locations
Level Name Location Direction Number / type of
accelerometers
Approximate length
of cable required (m)
3 NS1 Interior SE wall at first stair
landing NW 1 uniaxial 1 x 15 m
4 NS2 Interior NW wall SE 1 uniaxial 1 x 10 – 15 m
4 EW1 Interior SW wall NE 1 uniaxial 1 x 10 – 15 m
6 NS3, EW2 Interior wall in E corner NW, SW 1 triaxial 2 x 3 - 5 m
6 EW3 Interior wall in W corner NE 1 uniaxial 1 x 3 - 5 m
7 NS4, EW4, Z1 Base of superimposed bell
structure on NE wall
SE, NE,
elevation 1 triaxial 3 x 10 – 15 m
Figure 45 – Proposed accelerometer locations – plan view

Dynamic characterisation of the bell tower of Sant Cugat Monastery
ADVANCED MASTERS IN STRUCTURAL ANALYSIS OF MONUMENTS AND HISTORICAL CONSTRUCTIONS 79
Figure 46 – Proposed accelerometer locations – section view

Dynamic characterisation of the bell tower of Sant Cugat Monastery
ADVANCED MASTERS IN STRUCTURAL ANALYSIS OF MONUMENTS AND HISTORICAL CONSTRUCTIONS 80
5.1.4 Testing Procedure
Following the identification of sensor locations, the date for the dynamic testing can be set. It is
recommended that testing be conducted on a calm day to avoid excessive noise caused by wind, traffic
and/or people as large amounts of noise often result in less accurate data. It is also recommended that
the sampling frequency be set between 100 and 2000 Hz to ensure that the bell harmonics are captured
in the recorded data.
Each test should have a duration equal to approximately 2000 times the highest natural period of interest
(lowest modal frequency). In the case of the Sant Cugat Monastery, the lowest modal frequency is 1.07
Hz from Scenario A, Mode 1. This results in a recommended sampling time of approximately 30 minutes
per acquisition. It is recommended that two acquisitions of 30 minutes be conducted, one during the
ringing of the clock bells and the other during the ringing of the liturgical bells. This way, the modal
properties of the bell tower and the predominant harmonics of the different bell ringing schemes may be
captured. Although it is not required to conduct a 30-minute test to obtain the modal properties of the
bells, it is recommended to ensure the first acquisition properly captured the modal parameters of the
bell tower.
Table 36 outlines the recommended procedure to be followed for the ambient vibration testing at the
bell tower of the Sant Cugat Monastery:
Table 36 – Recommended AVT testing procedure
Recommended
Schedule Item
Required Time
(h)
6:00 – 6:30 /
17:00 – 17:30 Set up data acquisition system (DAQ) and connect computer at Level 6. 0.5
6:30 – 7:30 /
17:30 – 18:30
Install accelerometers by gluing or screwing them to the walls at the identified
locations. Gluing them with a putty that can later be removed is recommended
to minimize the impact to the historic structure.
1
7:30 – 7:45 /
18:30 – 18:45
Obtain preliminary signal measurements to ensure the sensors are working, to
characterize the signal-to-noise ratio, and to obtain an approximate range for
the resonant frequencies involved. This can be achieved through a 5-minute
acquisition.
0.25
7:55 – 8:25 /
18:55 – 19:25
Acquisition #1: Conduct the test, ensuring the ringing of the clock bells (rung at
the hour and quarter hour) is captured within the measured duration. 0.5
8:45 – 9:15 /
19:45 – 20:15
Acquisition #2: Conducted during the ringing of the liturgical bells (before mass)
to compute all possible dynamic amplification factors. Mass is conducted at Sant
Cugat Monastery, Monday – Friday at 9:00 and 20:00.
0.5
9:15 – 9:45 /
20:15 – 20:45
After obtaining all data, conduct a quick modal analysis to ensure the
experimental results are sufficient for modal identification. 0.5
9:45 – 10:45 /
20:45 – 21:45 Clean up and removal of accelerometers. 1
Total Time 4.25

Dynamic characterisation of the bell tower of Sant Cugat Monastery
ADVANCED MASTERS IN STRUCTURAL ANALYSIS OF MONUMENTS AND HISTORICAL CONSTRUCTIONS 81
5.2 Modal Parameter Identification
Once the dynamic testing has been conducted, modal analysis software (such as ARTeMIS, [19]) may
be used to identify the main modal parameters through OMA identification techniques. Before
conducting the modal analysis, preliminary processing of the acceleration time-histories should be
carried out to refine the data such as: offset removal, averaging, decimation and high/low pass filters.
Following pre-processing, it is recommended that OMA be conducted with one or more identification
techniques in both the frequency and time domains to ensure that the experimental data is accurate.
For example, obtaining modal parameters using the Peak Picking and Enhanced Frequency Domain
Decomposition methods in the frequency domain will ensure that all modes are identified, even closely
spaced modes, noisy modes, and modes with low resolution. Stochastic Subspace Identification should
also be conducted in the time domain, to ensure precision. For all identification methods, it is
recommended to verify the automatic mode estimation to ensure the maximum number of stable modes
are identified according to the stabilization diagrams provided by the software.
The results obtained from the various methods should be compared using the Modal Assurance
Criterion (MAC) which correlates the two sets of modal vectors as discussed in Section 2.3.3.
5.3 Calibration of the Finite Element Model
The final step in dynamic characterisation is the calibration of the hypothetical numerical model. The
defined updating parameters (Young’s modulus, spring stiffnesses at lateral connections with the
adjacent Church, and soil-structure interaction springs) should be assessed through the comparison of
modal results between the FE model and the experimental OMA. This can be achieved through
iteratively modifying the updating parameters in the FE model until the differences in the main global
natural frequencies are minimized. The updating parameters for the Sant Cugat Bell Tower are indicated
in Table 37.
Table 37 – Updating Parameters
Updating Parameter Reference Value Estimated
Lower Limit
Estimated Upper
Limit
Young’s Modulus (E) 2 500 MPa 1 000 MPa [6] 7 500 MPa [6]
Soil-Structure Interface (K1) 100 000 kN/m3 100 kN/m3 10 000 000 kN/m3
NE Lateral Interface (K2) 50 000 kN/m3 10 kN/m3 5 000 000 kN/m3
NW Lateral Interface (K3) 50 000 kN/m3 10 kN/m3 5 000 000 kN/m3
SW Lateral Interface (K4) 50 000 kN/m3 10 kN/m3 5 000 000 kN/m3
When calibrating the model, it is recommended that the stiffness values be iteratively modified
downwards from the Upper Limit model until the numerical and experimental modal properties are in

Dynamic characterisation of the bell tower of Sant Cugat Monastery
ADVANCED MASTERS IN STRUCTURAL ANALYSIS OF MONUMENTS AND HISTORICAL CONSTRUCTIONS 82
alignment. Alternately, the Lower Limit model may be used as a reference. This way, the analyst need
only decrease or increase the updating parameters.
The model calibration can be achieved by using the experimental value of the first bending mode as a
reference and varying one updating parameter at a time until a satisfactory agreement between results
is achieved. This is followed by updating additional parameters to maximize the correlation between the
main mode shapes. Typically, the first parameter to be updated is Young’s modulus (E), followed by
lateral connections and soil-structure interaction.
It is recommended that the main global mode shapes be refined until the percentage error is less than
5% as computed using Eq. 14. At minimum, this should be the case for the first two global bending
modes.
||𝑓𝐹𝐸𝑀−𝑓𝐴𝑉𝑇|
𝑓𝐴𝑉𝑇| ∙ 100% (14)
The model should be further validated through the correlation of measured and predicted modal
displacements using the modal assurance criterion (MAC) as defined in Section 2.4.1. Before computing
the MAC, the experimental results must be converted to real valued ones since mode shapes cannot
be scaled in an absolute way using OMA [11]. This is achieved by scaling the experimental mode shapes
so that the mode shape vector component of one of the channels is equal to 1 and then transforming
the predicted mode shapes at the approximate points of the accelerometers in the FE model to the
simplified coordinate system [11]. See Figure 47 and Section 5.1.3 for the approximate locations of the
accelerometers.

Dynamic characterisation of the bell tower of Sant Cugat Monastery
ADVANCED MASTERS IN STRUCTURAL ANALYSIS OF MONUMENTS AND HISTORICAL CONSTRUCTIONS 83
Figure 47 – Approximate points to be selected for comparison with experimental displacements
Once the model has been calibrated, the cause of the lateral displacement of the bell tower may become
apparent through the analysis of the calibrated updating parameters. For example, if the modal
parameters are most accurate with weak lateral interface elements, this may indicate that there are poor
connections between the bell tower and the church that need to be strengthened. If the modal
parameters are most accurate with weak soil-structure interface elements, this may indicate that there
are poor subsurface conditions allowing for differential soil settlement of the bell tower and that further
geotechnical investigations should be conducted.
5.4 Computation of DAF
Lastly, it is recommended that the dynamic interaction between the bells and the supporting structure
be examined, especially since the traditional Spanish bells were replaced with Central European style
bells in the 1940s. Due to the high unbalance of the Central European system, the bells may exert
considerably more horizontal dynamic loads on the supporting structure compared to the Spanish bell
system. Therefore, if the dynamic amplification caused by the ringing of the new bells is substantial, the
lateral displacement currently exhibited by the bell tower may be intensified.
Therefore, following model calibration, the dynamic interaction between the bells and the tower should
be examined. This can be achieved through applying the time history of the bell forces as a dynamic
force to the calibrated FE model and analysing the modal results. The time history of the bells may be

Dynamic characterisation of the bell tower of Sant Cugat Monastery
ADVANCED MASTERS IN STRUCTURAL ANALYSIS OF MONUMENTS AND HISTORICAL CONSTRUCTIONS 84
extracted from AVT tests in which the bells were ringing or may be obtained in a laboratory setting. Once
the dynamic properties of both the bell tower and the bells have been identified, the dynamic
amplification factor (DAF) comparing the deformed shapes of corresponding mode shapes between
static and dynamic models may be computed for a given mode shape as follows:
𝐷𝐴𝐹 =𝑚𝑎𝑥𝑖𝑚𝑢𝑚 𝑑𝑒𝑓𝑜𝑟𝑚𝑎𝑡𝑖𝑜𝑛 𝑓𝑟𝑜𝑚 𝑑𝑦𝑛𝑎𝑚𝑖𝑐 𝑚𝑜𝑑𝑒𝑙
𝑚𝑎𝑥𝑖𝑚𝑢𝑚 𝑑𝑒𝑓𝑜𝑟𝑚𝑎𝑡𝑖𝑜𝑛 𝑓𝑟𝑜𝑚 𝑠𝑡𝑎𝑡𝑖𝑐 𝑚𝑜𝑑𝑒𝑙 (12)
Alternately, to evaluate the effect of the bell swinging on the modal parameters of the supporting tower,
the bell harmonics may be identified through modal identification procedures in the frequency domain
(see Section 2.3). If it is found that one of the predominant harmonics of the bells interacts with a natural
frequency of the tower, it is likely that there is a large DAF which could impact the stability of the structure
[3]. Therefore, once the dynamic properties of both the bell tower and the bells have been identified, the
DAF can be calculated through a parametric analysis considering the bell’s swing velocity, damping
factor ( 𝜉), harmonic component ( Ω𝑖), and the vibration frequencies ( 𝜔𝑗), as follows [14]:
𝐷𝐴𝐹𝑖𝑗 =1
√(1−(Ω𝑖𝜔𝑗
)
2
)
2
+(2𝜉(Ω𝑖𝜔𝑗
))
2 (13)
If a DAF greater than 1 is found to exist, actions should be implemented to prevent this interaction.
Mitigation measures may include changing the bell ringing scheme so as to not coincide with the natural
frequencies of the tower, reverting the bell system to the historic Spanish system which is proven to
induce less horizontal thrust to the supporting structure, or structural strengthening of the bell tower
itself.

Dynamic characterisation of the bell tower of Sant Cugat Monastery
ADVANCED MASTERS IN STRUCTURAL ANALYSIS OF MONUMENTS AND HISTORICAL CONSTRUCTIONS 85
6. CONCLUSIONS
Recent investigations have revealed that the bell tower of the Monastery of Sant Cugat could be
continuing to experience lateral displacement linked to an active deterioration mechanism. As such, it
was the objective of this dissertation to develop a robust procedure for the dynamic identification of the
bell tower with the aim to better understand its deterioration mechanisms. The dissertation included a
comprehensive literature review, the creation of a suitable numerical model, and a detailed dynamic
testing procedure to be conducted in the future.
6.1 Expected Modal Parameters
Following the literature review and historic survey, the geometry of the bell tower was obtained from
existing drawings, however, could not be confirmed on site due to COVID-19 restraints. With the
obtained geometry, numerical modelling was conducted to obtain the hypothetical dynamic properties
of the bell tower and to be used for model calibration following dynamic testing. Both a simplified beam
model and 3D solid model were created in DIANA FEA software to ensure accuracy. Mechanical
properties for the preliminary analyses were assumed for the masonry based on the literature review as
follows: Young’s modulus of 2500 MPa, Poisson’s ratio of 0.15 and mass density of 22 kN/m3. The
models considered the self-weight of the structure as the only load which amounted to approximately
22 500 kN. In addition, boundary surfaces with reduced stiffness were considered at lateral connection
points between the tower and the church, and at the soil-structure interface to ensure accurate
representation of the structure.
Both a coarse and fine mesh were analysed to ensure consistency of results and to validate the model.
For both models, a mesh element size of 0.2 m was chosen for the analysis of the results, resulting in
209 elements for the simplified beam model and 978 067 elements for the 3D solid model. The mesher
type was tetra/triangle as this produced the best results.
Following discretization, linear self-weight analysis was conducted to ensure the reaction forces were
as expected, followed by linear modal response analysis to obtain the modal parameters. Depending
on model complexity (beam vs. solid) and mesh density, the analyses took between 5 and 30 minutes
each to run and required almost 100% capacity of the memory and CPU power on a computer with a
64-bit operating system, i7-6700HQ Intel® Core and 16 GB RAM.
It was found that results between coarse and fine meshes varied by less than 2% for both models and
therefore, the models were considered valid and further analysis was conducted with the results
obtained from the fine mesh models. It was also concluded that the simplified beam model validifies the
3D solid model as it had similar global mode shapes with corresponding frequencies varying by less
than 8%. The discrepancies between corresponding mode shape frequencies could be caused by

Dynamic characterisation of the bell tower of Sant Cugat Monastery
ADVANCED MASTERS IN STRUCTURAL ANALYSIS OF MONUMENTS AND HISTORICAL CONSTRUCTIONS 86
several factors such as the 2D nature of the simplified model, the lack of openings, vaults and connection
surfaces in the simplified model, and the lack of surface restraints in the simplified model. Therefore,
although the simplified beam model validifies the full 3D solid model, the 3D model should be utilized
for the dynamic characterisation of Sant Cugat Monastery as it is more accurate and is able to produce
three-dimensional global and local mode shapes.
An iterative sensitivity analysis was conducted on the 3D solid model to obtain ranges of spring stiffness
for the boundary surfaces. Through this analysis, it was found that the lateral connection stiffnesses
may lie between 10 and 50 000 kN/m3 whereas, the stiffness of the soil-structure interface may vary
between 100 and 15 000 000 kN/m3.
From the analysis of the various restraint scenarios in the 3D solid model, it was observed that
eigenfrequencies tend to decrease with reduced stiffness at the boundary surfaces. Therefore, when
analysing the results from the dynamic testing, lower eigenfrequencies likely indicate loss of stiffness at
one or more of the connection surfaces. The aim of the iterative model updating procedure is to identify
the source of the observed flexibility. The model updating may be achieved following dynamic testing
through the analysis of three finalized 3D solid FE models representative of a fully fixed model, a fully
free (cantilever) model and a model lying within the two extremes. These may be compared against one
another and used to help identify the absolute upper and lower boundaries for the modal properties of
the Sant Cugat bell tower.
6.2 Dynamic Testing Plan
The information obtained from the literature review and the preliminary FE models was utilized to design
a robust dynamic testing campaign for the bell tower using AVT to obtain experimental modal
parameters. In the plan, AVT was chosen as it is excellent for historical constructions due to their
structural complexity and numerous restrictions instilled by their historical significance. Accelerometers
were recommended to be placed near the lateral connection surfaces and at the top of the tower to
measure global bending and torsion modes. Modal analysis software was recommended to identify the
experimental modal parameters through OMA identification techniques in both the frequency and time
domains.
Once the experimental modal parameters have been extracted, calibration of the hypothetical numerical
model can be achieved through the comparison of the hypothetical modal results and the experimental
results. This is followed by iterative modification of the defined updating parameters until convergence
is achieved. Once the model has been calibrated, the cause of the lateral displacement of the bell tower
may become apparent through the analysis of the updating parameters.

Dynamic characterisation of the bell tower of Sant Cugat Monastery
ADVANCED MASTERS IN STRUCTURAL ANALYSIS OF MONUMENTS AND HISTORICAL CONSTRUCTIONS 87
6.3 Future studies
Following the calibration of the FE model, additional studies are recommended to compliment and
validate the hypotheses made based on the findings.
Firstly, should a large dynamic amplification factor of the bell-structure interaction be computed, it is
recommended that mitigation measures be investigated to reduce the impact of bell ringing on the
structure. This may include actions such as changing the bell ringing scheme, reverting the bell system
to the historic Spanish system, or structural strengthening of the bell tower itself.
Secondly, a geotechnical survey beneath the bell tower and SE wall of the church is recommended to
better understand the subsurface conditions on which the structure lies. If a poor soil-structure interface
is concluded from the calibrated FE model, a geotechnical investigation may help confirm the
hypothesized poor subsurface conditions. Similarly, an investigation into the lateral connections
between the bell tower and the surrounding church walls should be conducted to identify if the bell tower
was properly integrated into the surrounding church. If weak lateral connection surfaces are found to
best calibrate the model, the poor connections may be validated through this study. Information on the
quality of connections may be obtained through non-destructive testing such as ground penetrating
radar, or destructive testing such as investigative openings.
Lastly, although the mechanical properties obtained from the calibrated FE model represent the global
linear behaviour of the structure, these properties may be used as baseline parameters for nonlinear
analyses that may be conducted to better understand stress distributions and/or seismic behaviour of
the tower. To achieve this, the calibrated FE model must be used in conjunction with additional material
testing since several nonlinear parameters must be obtained or assumed to conduct nonlinear analysis
due to the anisotropic, non-homogeneous nature of masonry.

Dynamic characterisation of the bell tower of Sant Cugat Monastery
ADVANCED MASTERS IN STRUCTURAL ANALYSIS OF MONUMENTS AND HISTORICAL CONSTRUCTIONS 88

Dynamic characterisation of the bell tower of Sant Cugat Monastery
ADVANCED MASTERS IN STRUCTURAL ANALYSIS OF MONUMENTS AND HISTORICAL CONSTRUCTIONS 89
REFERENCES
[1] Ajuntament de Sant Cugat Tourism Office, “Bell Tower,” 2017-2020. [Online]. Available:
https://www.visitsantcugat.cat/en/bell-tower/. [Accessed 30 05 2020].
[2] S. Ivorra, M. J. Palomo, G. Verdu and A. Zasso, “Dynamic Forces Produced by Swinging Bells,” Meccanica, vol.
41, pp. 47-62, 2006.
[3] S. Ivorra and F. J. Pallarés, “Dynamic investigations on a masonry bell tower,” Engineering Structures , vol. 28,
pp. 660-667, 2006.
[4] C. Gentile and A. Saisi, “Ambient vibration testing of historic masonry towers for structural identification and
damage assessment,” Construction and Building Materials, vol. 21, pp. 1311-1321, 2007.
[5] A. Bayraktar, T. Türker, B. Sevım, A. C. Altuni¸sik and F. Yildirim, “Modal Parameter Identification of Hagia
Sophia Bell-Tower via Ambient Vibration Test,” J Nondestruct Eval, vol. 28, pp. 37-47, 2009.
[6] S. Ivorra, F. J. Pallarés and J. M. Adam, “Masonry bell towers: dynamic considerations,” Structures and
Buildings, vol. 164, no. SB1, pp. 3-12, 2011.
[7] D. Foti, S. I. Chorro and M. F. Sabbà, “Dynamic Investigation of an Ancient Masonry Bell Tower with Operational
Modal Analysis,” The Open Construction and Building Technology Journal, vol. 6, pp. 384-391, 2012.
[8] D. Foti, M. Diaferio and N. I. Giannocaro, “Non-destructive characterization and identification of the modal
parameters of an old masonry tower,” Dept. of Sciences in Civil Engineering and Architecture, Politecnico di
Bari; Dept. of Engineering for Innovation, University of Salento, Bari, Italy; Lecce, Italy, 2014.
[9] N. Nisticò, S. Gambarelli, A. Fascetti and G. Quaranta, “Experimental Dynamic Testing and Numerical Modeling
of Historical Belfry,” INTERNATIONAL JOURNAL OF ARCHITECTURAL HERITAGE, vol. 10, no. 4, pp. 476-
485, 2016.
[10] F. Lorenzoni, M. R. Valluzzi, M. Salvalaggio, A. Minello and C. Modena, “Operational modal analysis for the
characterization of ancient water towers in Pompeii,” Procedia Engineering, vol. 199, pp. 3374-3379, 2017.
[11] M. Ferraioli, L. Miccoli, D. Abruzzese and A. Mandara, “Dynamic characterisation and seismic assessment of
medieval masonry towers,” Nat Hazards, vol. 86, pp. S489-S515, 2017.
[12] C. Molins and N. Makoond, “DYNAMIC BEHAVIOUR OF THE BELL TOWER OF LA SEU VELLA,” Departament
d'Enginyeria Civil i Ambiental, Universitat Politècnica de Catalunya, Barcelona, 2017.
[13] M. Ferraioli, L. Miccoli and D. Abruzzese, “Dynamic characterisation of a historic bell-tower using a sensitivity-
based technique for model tuning,” Journal of Civil Structural Health Monitoring, vol. 8, pp. 253-269, 2018.
[14] D. Bru, S. Ivorra, M. Betti, J. M. Adam and G. Bartoli, “Parametric dynamic interaction assessment between
bells and supporting slender masonry tower,” Mechanical Systems and Signal Processing, vol. 129, pp. 235-
249, 2019.

Dynamic characterisation of the bell tower of Sant Cugat Monastery
ADVANCED MASTERS IN STRUCTURAL ANALYSIS OF MONUMENTS AND HISTORICAL CONSTRUCTIONS 90
[15] M. Pavlovic, S. Trevisani and A. Cecchi, “A Procedure for the Structural Identification of Masonry Towers,”
Journal of Nondestructive Evaluation, vol. 38, no. 38, 2019.
[16] L. F. Ramos, M. G. Masciotta and F. Casarin, “SA4: Inspection and Diagnosis - Modal Testing,” SAHC, 2020.
[17] DIANA FEA BV, DIANA FEA v. 10.4, Delft, Netherlands: DIANA FEA, 2020.
[18] J. L. Lund, J. M. Wilson and A. R. Selby, “The dynamics of bell towers - a survey in northeast England,”
Transactions on the Built Environment, vol. 15, pp. 45-52, 1995.
[19] ARTeMIS Modal - Softwre for Operational Modal Analysis and Experimental Modal Analysis, Denmark:
Structural Vibration Solutions, 2020.
[20] E. Reynders, “System identification methods for (operational) modal analysis: review and comparison,” Archives
of Computational Methods in Engineering, vol. 19, no. 1, pp. 51-124, 2012.
[21] S. Chandra, “Modelling of Soil Behaviour,” Indian Institute of Technology Kanpur, 3 12 2014. [Online]. Available:
http://home.iitk.ac.in/~peeyush/mth426/Lec4_schandra.pdf. [Accessed 26 06 2020].
[22] J. Heyman and B. D. Threlfall, “INERTIA FORCES DUE TO BELL-RINGING,” Int. Z mech Sci., vol. 18, pp. 161-
164, 1976.
[23] A. Bru, Artist, Martiri de Sant Cugat. [Art]. Museu Nacional de Catalunya, 1502-1507.
[24] D. D'Ayala and E. Fodde, Structural Analysis of Historic Construction, Bath, UK: CRC Press, 2008, p. 353.
[25] Google, “Google Maps,” 2020. [Online]. Available:
https://www.google.com/maps/place/Monastery+of+Sant+Cugat/. [Accessed 30 05 2020].
[26] Patrimoni Cultural, Generalitat de Catalunya , “Monastery of Sant Cugat - five centuries of history,” 2020.
[Online]. Available: http://patrimoni.gencat.cat/en/collection/monastery-sant-cugat. [Accessed 30 05 2020].
[27] J. T. Bonell, “Descobrir Catalunya,” Premsa Catalana, Barcelona, 1994.
[28] A. Pladevall i Font and A. Navarro i Cossio, This is Catalonia: A Guide to Architectural Heritage, vol. 1,
Barcelona: Ministry of Culture, Generalitat de Catalunya, 2010.
[29] Generalitat de Catalunya, “Monastery of Sant Cugat del Vallès,” 2020. [Online]. Available:
http://invarquit.cultura.gencat.cat/Cerca/FitxaGeneral?index=0&consulta=MSUxK2N1Z2F0JTIrLTEl&codi=204.
[Accessed 30 05 2020].
[30] L. G. Ramonda, I. G. Roca, F. Isalberti and M. X. Gimeno, “Structural Analysis and Safety Assessment of the
Monastery's Church of Sant Cugat del Vallès,” Universitat Politècnica de Catalunya, Barcelona, 2015.
[31] “El monestir de Sant Cugat,” 1842.
[32] A. Damians, “Sant Cugat del Vallès Monastery, XII-XIV centuries,” Universitat de Barcelona, Sant Cugat del
Vallès, 1915.
[33] F. B. I. altarriba, “Monestir de Sant Cugat amb la font de la creu i una dona en primer pla,” Sant Cugat del
Vallès, 1890.
[34] “El monestir de Sant Cugat del Vallès des de l'exterior,” AFCEC, Sant Cugat del Vallès, 1920.

Dynamic characterisation of the bell tower of Sant Cugat Monastery
ADVANCED MASTERS IN STRUCTURAL ANALYSIS OF MONUMENTS AND HISTORICAL CONSTRUCTIONS 91
[35] “Inventory of Bells - Monastery of Sant Cugat - Sant Cugat del Vallès (Catalonia),” [Online]. Available:
http://campaners.com/php/campanar.php?numer=5708. [Accessed 03 June 2020 ].
[36] C. Molins, Sant Cugat , 2020.
[37] G. d. C. Department de Cultura, “As-found drawing set for the Sant Cugat Monastery,” Generalitat de Catalunya
, 1991.
[38] Tècnic Topograf Municipal, “Informe Tècnic: Monestir de Sant Cugat del Vallès,” Ajuntament de Sant Cugat,
Sant Cugat del Vallès , 2019.
[39] S. d. P. A. Direccio General del Patrimoni Cultural, “Desplom dels contraforts de la façana sud del monesti de
sant cugat,” Generalitat de Catalunya, 2019.
[40] SkyCiv Engineering, “Free Moment of Inertia Caluclator / Centroid Calculator,” 2015-2020. [Online]. Available:
https://skyciv.com/free-moment-of-inertia-calculator/. [Accessed 01 05 2020].

Dynamic characterisation of the bell tower of Sant Cugat Monastery
ADVANCED MASTERS IN STRUCTURAL ANALYSIS OF MONUMENTS AND HISTORICAL CONSTRUCTIONS 92

Dynamic characterisation of the bell tower of Sant Cugat Monastery
ADVANCED MASTERS IN STRUCTURAL ANALYSIS OF MONUMENTS AND HISTORICAL CONSTRUCTIONS 93
APPENDIX A – AS-FOUND DRAWING SET

Dynamic characterisation of the bell tower of Sant Cugat Monastery
ADVANCED MASTERS IN STRUCTURAL ANALYSIS OF MONUMENTS AND HISTORICAL CONSTRUCTIONS 94


Dynamic characterisation of the bell tower of Sant Cugat Monastery
ADVANCED MASTERS IN STRUCTURAL ANALYSIS OF MONUMENTS AND HISTORICAL CONSTRUCTIONS 103
APPENDIX B – MODE SHAPE COMPARISON

Dynamic characterisation of the bell tower of Sant Cugat Monastery
ADVANCED MASTERS IN STRUCTURAL ANALYSIS OF MONUMENTS AND HISTORICAL CONSTRUCTIONS 104

Dynamic characterisation of the bell tower of Sant Cugat Monastery
ADVANCED MASTERS IN STRUCTURAL ANALYSIS OF MONUMENTS AND HISTORICAL CONSTRUCTIONS 105
3D Solid Model - Restraint Scenarios Simplified Beam Model
A B C D E A B C
Plan View
Mode Shape
1st global bending
mode about X axis
1.0756 Hz (1) 2.1624 Hz (2) 2.1658 Hz (1) 2.1633 Hz (2) 1.5796 Hz (1) 1.1256 Hz (1) 2.2957 Hz (3) 2.2958 Hz (3)
1st global bending
mode about Y axis
1.0886 Hz (2) 1.0975 Hz (1) 2.2109 Hz (2) 1.6526 Hz (1) 1.6383 Hz (2) 1.1707 Hz (2) 1.1707 Hz (1) 2.1502 Hz (2)

Dynamic characterisation of the bell tower of Sant Cugat Monastery
ADVANCED MASTERS IN STRUCTURAL ANALYSIS OF MONUMENTS AND HISTORICAL CONSTRUCTIONS 106
Mode Shape 3D Solid Model - Restraint Scenarios Simplified Beam Model
A B C D E A B C
2nd global bending
mode about Y axis,
1st global torsion
mode
-
-
-
3.4293 Hz (3) 4.1201 Hz (3) 5.7341 Hz (3) 1.7236 Hz (3) 1.7236 Hz (2)
2nd global torsion
mode
-
-
6.0721 Hz (4) 6.6020 Hz (3) 6.1927 Hz (4) 5.1347 Hz (3) 6.1573 Hz (5) 6.1566 Hz (4)

Dynamic characterisation of the bell tower of Sant Cugat Monastery
ADVANCED MASTERS IN STRUCTURAL ANALYSIS OF MONUMENTS AND HISTORICAL CONSTRUCTIONS 107
Mode Shape 3D Solid Model - Restraint Scenarios Simplified Beam Model
A B C D E A B C
2nd global bending
mode about X axis
- -
4.4418 Hz (4) 6.6314 Hz (5) 6.6705 Hz (4) 6.6335 Hz (5) 5.3498 Hz (4) 6.0309 Hz (4)
3rd global bending
mode about Y axis,
global torsion
-
-
- - -
4.4574 Hz (5) 6.8807 Hz (5) 5.7751 Hz (5)

Dynamic characterisation of the bell tower of Sant Cugat Monastery
ADVANCED MASTERS IN STRUCTURAL ANALYSIS OF MONUMENTS AND HISTORICAL CONSTRUCTIONS 108
Mode Shape 3D Solid Model - Restraint Scenarios Simplified Beam Model
A B C D E A B C
1st global elongation
in Z, local bending of
top two tiers about
XY axes
7.0420 Hz (6) 7.0455 Hz (6) 7.0926 Hz (6) 7.0496 Hz (6) 7.0465 Hz (6) 7.5631 Hz (6) 7.5592 Hz (5) 7.5592 Hz (4)
Local bending mode
(above level 6)
about Y axis
-
- -
7.2214 Hz (7) 7.2493 Hz (7) 7.9923 Hz (7) 7.9812 Hz (8) 9.7533 Hz (6)

Dynamic characterisation of the bell tower of Sant Cugat Monastery
ADVANCED MASTERS IN STRUCTURAL ANALYSIS OF MONUMENTS AND HISTORICAL CONSTRUCTIONS 109
Mode Shape 3D Solid Model - Restraint Scenarios Simplified Beam Model
A B C D E A B C
3rd global bending
mode about X
-
-
9.4400 Hz (8) 9.4625 Hz (7) 9.4675 Hz (8) 7.6198 Hz (7) 10.178 Hz (7) 10.179 Hz (7)
Local bending mode
(above level 7)
about X axis
-
- -
7.2799 Hz (8) 13.620 Hz (10) 13.623 Hz (11) 13.612 Hz (12) 12.127 Hz (9)

Dynamic characterisation of the bell tower of Sant Cugat Monastery
ADVANCED MASTERS IN STRUCTURAL ANALYSIS OF MONUMENTS AND HISTORICAL CONSTRUCTIONS 110
Mode Shape 3D Solid Model - Restraint Scenarios Simplified Beam Model
A B C D E A B C
4th global bending
mode about Y axis,
local torsion above
level 6
8.8469 (9) 9.6053 (9) 9.7927 (8) 11.533 Hz (9) 11.509 Hz (11) 12.086 Hz (8) 12.087 Hz (8) 12.088 Hz (8)
Local bending
mode about Y axis
above level 6
- -
-
13.962 (11) 13.880 Hz (12) 13.874 Hz (13) 12.34 Hz (10) 12.376 Hz (9)

Dynamic characterisation of the bell tower of Sant Cugat Monastery
ADVANCED MASTERS IN STRUCTURAL ANALYSIS OF MONUMENTS AND HISTORICAL CONSTRUCTIONS 111
Mode Shape 3D Solid Model - Restraint Scenarios Simplified Beam Model
A B C D E A B C
3rd global torsion
mode
-
- - -
9.9383 (10) 11.533 (10) 12.131 Hz (10) 10.309 Hz (9)
4th global bending
mode about X axis
- - -
- - -
10.330 (11) 10.982 Hz (10)
Related Documents