Advanced Dashboarding Tips & Techniques Adding JavaScript Visualizations to Your Dashboards Karthik Subramanian | Function1 Thursday – Sept. 28 | Washington, DC

Welcome message from author
This document is posted to help you gain knowledge. Please leave a comment to let me know what you think about it! Share it to your friends and learn new things together.
Transcript

Advanced DashboardingTips & TechniquesAdding JavaScript Visualizationsto Your Dashboards
Karthik Subramanian | Function1
Thursday – Sept. 28 | Washington, DC

During the course of this presentation, we may make forward-looking statements regarding future events or the expected performance of the company. We caution you that such statements reflect our current expectations and estimates based on factors currently known to us and that actual events or results could differ materially. For important factors that may cause actual results to differ from those contained in our forward-looking statements, please review our filings with the SEC.
The forward-looking statements made in this presentation are being made as of the time and date of its live presentation. If reviewed after its live presentation, this presentation may not contain current or accurate information. We do not assume any obligation to update any forward looking statements we may make. In addition, any information about our roadmap outlines our general product direction and is subject to change at any time without notice. It is for informational purposes only and shall not be incorporated into any contract or other commitment. Splunk undertakes no obligation either to develop the features or functionality described or to include any such feature or functionality in a future release.
Splunk, Splunk>, Listen to Your Data, The Engine for Machine Data, Splunk Cloud, Splunk Light and SPL are trademarks and registered trademarks of Splunk Inc. in the United States and other countries. All other brand names, product names, or trademarks belong to their respective owners. © 2017 Splunk Inc. All rights reserved.
Forward-Looking Statements
THIS SLIDE IS REQUIRED FOR ALL 3 PARTY PRESENTATIONS.

▶ Founded in 2007; offices in Washington D.C., New York City, Toronto, and Chicago▶ One of Splunk’s premier professional services partners▶ More than 1,000 successful Splunk engagements spanning all industry verticals: Security,
Finance, Energy, E-Commerce, Government, Defense, Healthcare, Entertainment, Retail, and Education
▶ Services: Installation & Upgrades, Data Onboarding, Training, Dashboard & App Development, Products, Health Checks, Consulting
▶ Our team of Splunk experts is credited with designing the base architecture for some of the largest Splunk deployments to-date and have aided in developing the standard for enterprise class governance and data onboarding
About Function1www.function1.com

EnablingDevelopment
Mode
Creating a D3 Visualization
Creating a C3 Visualization
Intro/Roadmap

▶ /etc/system/local/web.conf• [settings]• minify_js = False• minify_css = False• js_no_cache = True• cacheEntriesLimit = 0• cacheBytesLimit = 0• enableWebDebug = True
Hint: If you do a lot of development, it’s very easy to put this file in an app and enable the app only when you’re developing code!
How to Enable Development Mode

▶ Turning off minification• JavaScript• CSS
▶ Turning off caching• JavaScript• All other objects, regardless of size or number
▶ Turning on debug endpoints• For example, splat logs
If you don’t turn these settings off when you’re finished with development, the web interface will be a lot slower!
Why Enable Development Mode?

Build a D3 Visualization
Donut Chart: Photo from d3js.org

▶ Create this file structure in /etc/apps/:
App/File Structure
▶ Run the following commands from• /etc/apps/<appname>/appserver/static/
visualizations/<visualization_name>:• $ npm install• $ npm install --save d3• $ npm install --save jquery• $ npm install --save underscore

Creating the Basics of visualization_source.js1. define([ 2. 'jquery', 3. 'underscore', 4. 'vizapi/SplunkVisualizationBase', 5. 'vizapi/SplunkVisualizationUtils', 6. 'd3' 7. ], 8. function( 9. $, 10. _, 11. SplunkVisualizationBase, 12. SplunkVisualizationUtils, 13. d3 14. ) { 15. 16. return SplunkVisualizationBase.extend({ 17. 18. initialize: function() { 19. this.$el = $(this.el); 20. 21. // Add a css selector class 22. this.$el.addClass('splunk-radial-meter'); 23. }, 24. 25. getInitialDataParams: function() { 26. return ({ 27. outputMode: SplunkVisualizationBase.ROW_MAJOR_OUTPUT_MODE, 28. count: 10000 29. }); 30. }, 31. 32. updateView: function(data, config) { // Cool stuff here later 33. 34. 35. } 36. }); 37. });

▶ Set the dependencies▶ Initialize the visualization▶ Provide a CSS Selector
What Those Basics Coded For

Writing the UpdateView Function1. updateView: function(data, config) { 2. 3. 4. // Check for empty data 5. if(data.rows.length < 1){ 6. return; 7. } 8. // Take the first data point 9. datum = data.rows[0][0]; 10. // Clear the div 11. this.$el.empty(); 12. 13. // Pick colors and value 14. var mainColor = 'green'; 15. var maxValue = 100; 16. 17. // Set height and width 18. var height = 220; 19. var width = 220; 20. 21. // Create a radial scale representing 75% of a circle 22. var scale = d3.scale.linear() 23. .domain([0, maxValue]) 24. .range([ - Math.PI * 0.75, Math.PI * 0.75]) 25. .clamp(true); 26. 27. // Define arc 28. var arc = d3.svg.arc() 29. .startAngle(function(d){ 30. return scale(0); 31. }) 32. .endAngle(function(d){ 33. return scale(d); 34. }) 35. .innerRadius(70) 36. .outerRadius(85); 37. 38. // SVG setup 39. var svg = d3.select(this.el).append('svg') 40. .attr('width', width) 41. .attr('height', height) 42. .style('background', 'white') 43. .append('g') 44. .attr('transform', 'translate(' + width / 2 + ',' + height / 2 + ')'); 45. 46. // Background arc 47. svg.append('path') 48. .datum(maxValue) 49. .attr('d', arc) 50. .style('fill', 'lightgray'); 51. 52. // Fill arc 53. svg.append('path') 54. .datum(datum) 55. .attr('d', arc)

▶ Make sure that it doesn't freeze if there's no data▶ Initialize it with the first data point▶ Setup our SVG▶ Setup the arc▶ Draw the arcs▶ Fill the arcs▶ Place text to show the gauge readings
What That Code Did

▶ .meter-center-text {▶ font-size: 50px;▶ font-weight: 200;▶ font-family: "Helvetica Neue", Helvetica, sans-serif;▶ }▶
▶ /* Center the SVG */▶ .splunk-radial-meter svg {▶ display: block;▶ margin: auto;▶ }
Adding CSS Stylesheets/appserver/static/visualizations/<visualization_name>/visualization.css

▶ default.meta (or local.meta):• [visualizations/<visualization_name>]• export = system
This lets other apps have access to the visualization!
Updating visualizations.conf and Setting the App Metadata to Share
▶ visualizations.conf:• [<visualization_name>]• label = My Visualization• description = ”I made this!”
This lets Splunk know that the visualization exists!

▶ From the /appserver/static/visualizations/<visualization_name>/ folder:• $ npm run build
▶ Run Splunk, use the visualization, and change settings/code as necessary
▶ You’ll need to recompile code when you change it, but no need to restart Splunk!
Compiling the Visualization
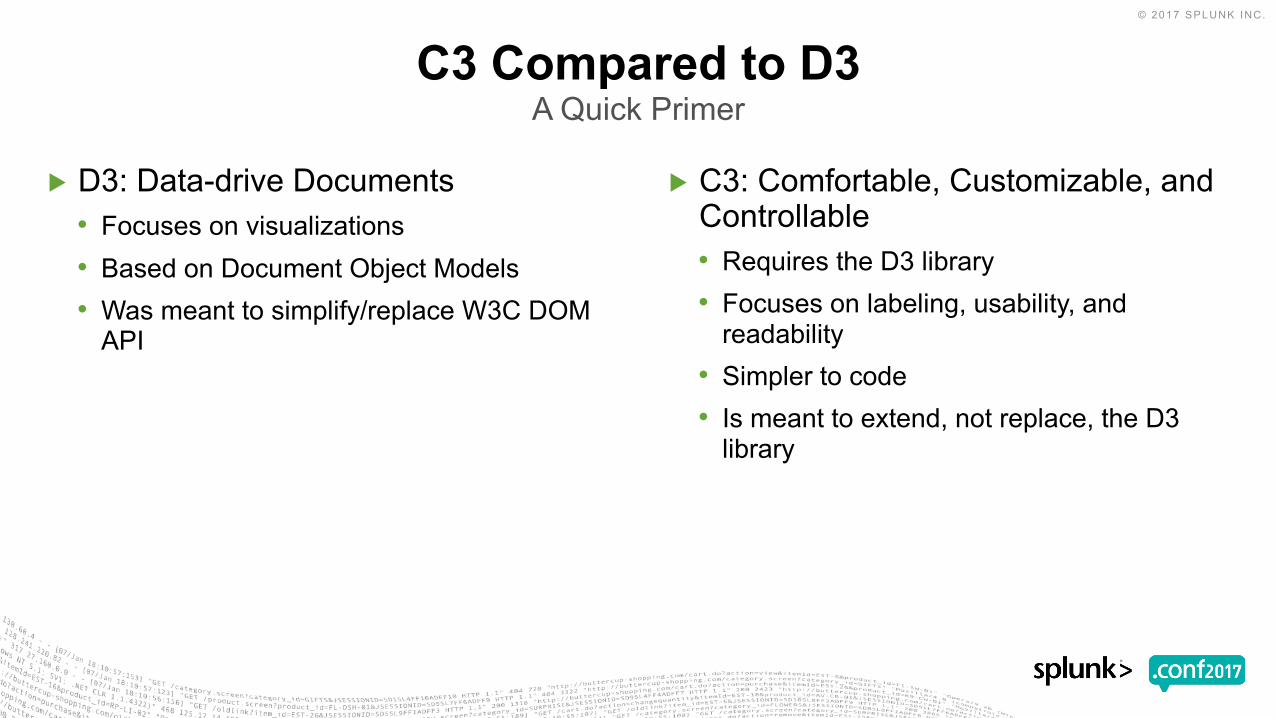
▶ D3: Data-drive Documents• Focuses on visualizations• Based on Document Object Models• Was meant to simplify/replace W3C DOM
API
▶ C3: Comfortable, Customizable, and Controllable• Requires the D3 library• Focuses on labeling, usability, and
readability• Simpler to code• Is meant to extend, not replace, the D3
library
C3 Compared to D3A Quick Primer

▶ Starting from previous file structure, we are adding two libraries and three files:• Libraries
• d3.js in /<app_name>/appserver/static/• c3.js in /<app_name>/appserver/static/
• Files• custom_view.xml in /<app_name>/default/data/ui/views/• customview.js in /<app_name>/appserver/static/• demoview.js in /<app_name>/appserver/static/
App/File Structure for C3 Visualization
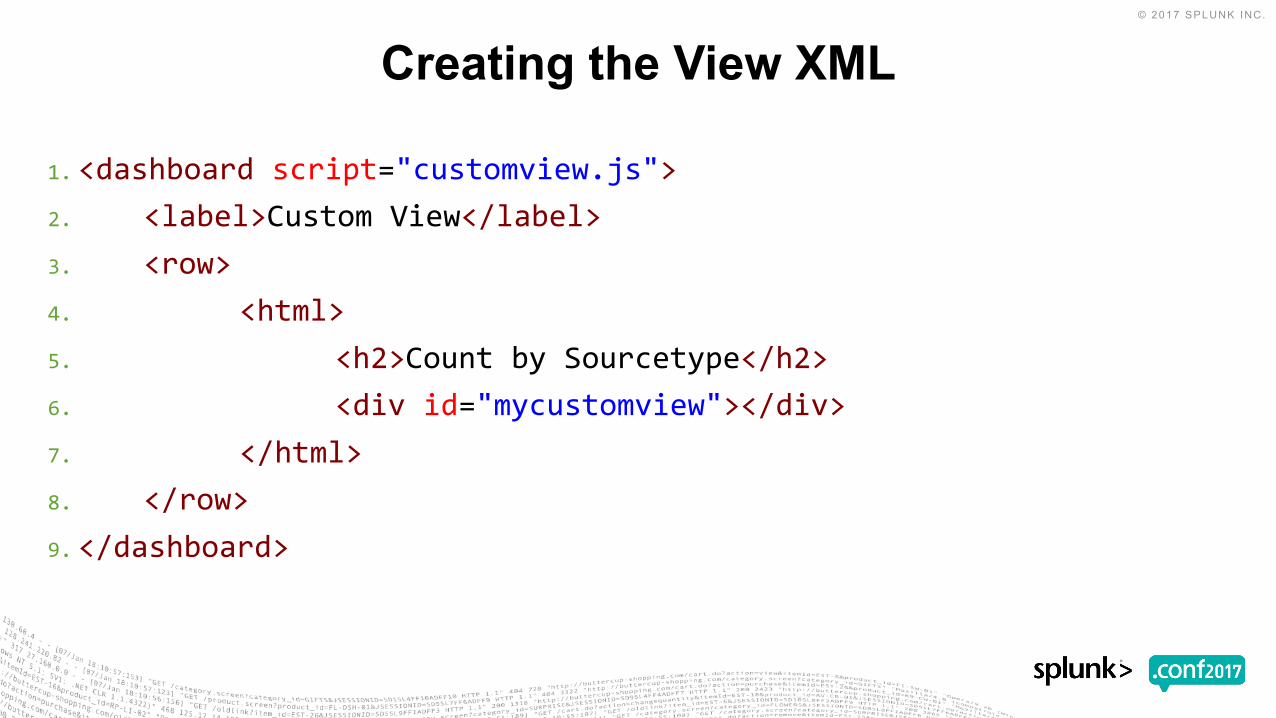
1. <dashboard script="customview.js">2. <label>Custom View</label>3. <row>4. <html>5. <h2>Count by Sourcetype</h2>6. <div id="mycustomview"></div>7. </html>8. </row>9. </dashboard>
Creating the View XML

▶ It’s a very simple Splunk dashboard with just one element▶ Uses an HTML element that has an id that we will bind to in the script▶ In use, you could add more elements or more dashboard panels in addition to
this one.
What That Code Means

Creating customview.js

▶ In the “require” statement at the top, it loads the “demoview” module, as well as other components such as the Splunk search manager. They are referenced in the function as “DemoView” and “SearchManager,” respectively.
▶ A “SearchManager” object is created, which contains the Splunk search which will power the custom visualization. A simple search here is used for example purposes.
▶ A “DemoView” object is created, which contains the visualization and then calls the “render” function to display it.
What That Code Means and Does

Creating demoview.js

▶ We want to make sure that C3 can find D3 when it is initializing▶ Without this function/configuration, C3 will be “undefined” in the code
• References to C3 will throw errors as it’s undefined
▶ This syntax is a CommonJS wrapper, and we have to load dependencies through require statements in the script
What That Code Means and Does

Creating demoview.js 2

▶ Define SplunkSimpleView as our base class for the custom views▶ Require dependencies:
• underscore.js• d3.js• c3.js
What That Code Means and Does

1. var DemoView = SimpleSplunkView.extend({2. //Object to hold the data for the visualization3. var chartData = {4. seriesData: [5. seriesDataArray6. ], 7. xTickValues: xTickValuesArray8. }
Creating demoview.js 3

▶ Extend the SplunkSimpleView to create a DemoView object▶ Create objects for our formatData and updateView functions
• seriesDataArray stores the count of the sourcetypes• xTickValuesArray stores the list of the sourcetypes
▶ Populate a chartData object• Note: seriesData is a 2D array because the C3 chart expects a 2D array for the data.columns
property
What That Code Means and Does

Creating demoview.js 41. // Override this method to put the Splunk data into the view 2. updateView: function(viz, chartData) { 3. 4. //create the chart object using the c3 generate function
5. var chart = c3.generate({
6. 7. //The div ID from the Splunk view
8. bindto: '#mycustomview',
9. data: {
10. //The data for the series, in this case the count of each sourcetype
11. columns: chartData.seriesData,
12. 13. //Create a bar chart from the “sourcetype” data series
14. types: {
15. sourcetype: 'bar'
16. }
17. },
18. 19. axis: {
20. x: {
21. //Setting the type of the x-axis
22. type: 'category',
23. 24. //Setting the x-axis labels
25. categories: chartData.xTickValues,
26. 27. //rotating the x-axis labels by 30 to better accommodate the length of some of the labels
28. tick: {
29. rotate: 30
30. }
31. }
32. }
33. });
34. }
35. });

▶ Puts Splunk data into the view▶ Creates the chart object using the c3.generate function▶ Binds to the div ID that we set in the customview.xml dashboard▶ Passes in the data
• Selects a bar chart• Sets the x-axis to a category (of sourcetypes)• Rotates the x-axis labels by 30 degrees so that certain long sourcetypes do not run into
each other
What That Code Means and Does

Development Mode D3 Visualizations C3 Visualizations
Conclusion/Roadmap


© 2017 SPLUNK INC.
Don't forget to rate this session in the .conf2017 mobile app
Thank You
Related Documents