Advanced Dashboard Design in OBI 11g Collaborate 2013 Session 726 Tim Vlamis Vlamis Software Solutions 816-781-2880 http://www.vlamis.com Copyright © 2013, Vlamis Software Solutions, Inc.

Welcome message from author
This document is posted to help you gain knowledge. Please leave a comment to let me know what you think about it! Share it to your friends and learn new things together.
Transcript

Advanced Dashboard Design
in OBI 11g
Collaborate 2013
Session 726
Tim Vlamis
Vlamis Software Solutions
816-781-2880
http://www.vlamis.com
Copyright © 2013, Vlamis Software Solutions, Inc.

Vlamis Software Solutions
• Vlamis Software founded in 1992 in Kansas City, Missouri
• Developed more than 200 Oracle BI systems
• Specializes in ORACLE-based: • Data Warehousing
• Business Intelligence
• Design and integrated BI and DW solutions
• Training and mentoring
• Expert presenter at major Oracle conferences
• www.vlamis.com (blog, papers, newsletters, services)
• Developer for IRI (former owners of Oracle OLAP)
• Co-author of book “Oracle Essbase & Oracle OLAP”
• Beta tester for OBIEE 11g
• Reseller for Simba and Nokia map data for OBIEE
• HOL Coordinator for BIWA Summit 2013
Copyright © 2013, Vlamis Software Solutions, Inc.

Tim Vlamis Bio
• 20+ years experience in business modeling and valuation,
forecasting, and scenario analyses
• Expert in principles and elements of design
• Expert in curriculum development and pedagogical theory
• Professional Certified Marketer (PCM) from AMA
• Active Member of NICO (Northwestern Institute on Complex
Systems)
• Adjunct Professor of Business Benedictine College
• MBA Kellogg School of Management (Northwestern)
• BA Economics Yale University
[email protected] 816-781-2880
Copyright © 2013, Vlamis Software Solutions, Inc.

Mark Your Calendars Now!
BIWA Summit 2014, Jan 14-16
Oracle HQ Conference Center
Business Intelligence, Warehousing and Analytics IOUG Special Interest Group

5 Copyright © 2012, Oracle and/or its affiliates. All rights reserved.
Join the community
• IOUG Oracle Spatial and Graph SIG
– Signup on the membership/interest list today
– Talk to board members (Steve Lytle & Steve Pierce)
– Email: [email protected]
– *Increased interest from business/BI communities
• SIG 2013 Events
– May 21-22: Location Intelligence & Oracle Spatial and Graph User
Conference, Washington DC
– Fall: Oracle OpenWorld San Francisco

Dashboard Definition
A Dashboard is a visual presentation
of current summary information
needed to manage and guide an
organization or activity.
Copyright © 2013, Vlamis Software Solutions, Inc.

BI Dashboards are Different
• No mechanical systems needed to move
indicators.
• Decisions are not typically made on a second-
to-second basis.
• Data selection and filtering are hugely
important.
• Dashboards are typically not single situation or
single person devices.
Copyright © 2013, Vlamis Software Solutions, Inc.

BI Dashboards
• Role-based.
• Data selection and filtering are extremely important.
• Dashboards support evidenced-based decision
making.
• Shared understanding of business situation is a key
benefit.
• Content may be individualized.
• Design should be standardized.
Copyright © 2013, Vlamis Software Solutions, Inc.

OBIEE Dashboard Overview
• Designed with columns and sections (containers).
• Presentation server is often separate from BI server.
• Dashboards are web-based and are viewed with
browsers.
• HTML, XML, and Java coding skills are useful, but not
required.
Copyright © 2013, Vlamis Software Solutions, Inc.

Dashboard Principles
• Promote user interactivity
• Prompts
• View and column selectors
• Hierarchical column drills
• Column sorts
• Guided navigation and action links
• Promote data transparency
• Prompts
• Filter views
• Narrative views
• Master detail linking
• Establish design guidelines for consistency
Copyright © 2013, Vlamis Software Solutions, Inc.

OBIEE Intro Demo
Copyright © 2013, Vlamis Software Solutions, Inc.

Copyright © 2013, Vlamis Software Solutions, Inc.
Good dashboards require
good analyses and good
visualizations!

Analysis Questions to ask
• What context is being provided?
• What comparison is being made?
• Is the data selection process transparent?
• What visualization methodology best illustrates the key
insights in this analysis?
• Are key insights exception related?
• Is a narrative explanation useful?
Copyright © 2013, Vlamis Software Solutions, Inc.

Dashboard Layout Guidelines
• Look and feel determined by
• Skins
• Styles
• Cosmetic formatting
• Understand visual prominence
1. Motion
2. Color
3. Size
4. Position
Copyright © 2013, Vlamis Software Solutions, Inc.

BI Dashboard Layout Guidelines
Copyright © 2013, Vlamis Software Solutions, Inc.

BI Dashboard Tips
• Minimize size of logos.
• Put prompts in a consistent place (top or left)
• Use DB Column position to align dashboard content.
• OBI resizes columns and sections depending on
analyses results.
• Don’t require complex parameters (>1) for navigation.
• Always provide navigation aids.
• Always organize catalog objects and directory
structures.
Copyright © 2013, Vlamis Software Solutions, Inc.

Prompts, Selection Steps, and Selectors
• Prompts promote user interactivity and transparency.
• Are a key sign of sophisticated and efficient
dashboards.
• Prompts act as filters (SQL “where” clause) and impact
query requests.
• Selection Steps edit presentations and do not impact
query requests.
• Column Selectors edit presentations and do not impact
query requests.
Copyright © 2013, Vlamis Software Solutions, Inc.

Four Types of Variables
• Presentation Variables • Allow for interaction with dashboard users. SampleApp is full of
them.
• Used with dashboard prompts or column prompts.
• Session Variables • Initialized when user logs in to OBI.
• Either system (name reserved by OBI) or non-system (developer designated)
• Useful for providing context (date, time, etc.)
• Request Variable • Used to overwrite the value of a session variable with a column
prompt.
• Repository Variable • Either dynamic or static.
• Set in OBI repository (.rpd file)
Copyright © 2013, Vlamis Software Solutions, Inc.

OBIEE Demo
Copyright © 2013, Vlamis Software Solutions, Inc.

Trellis Charts
• Trellis Layout of Smaller Charts in a grid with
Consistent Scales
• Great for finding structures / patterns in complex data
• Use 2D Layout to View Multidimensional
Data (like a timeline
–mental animation)
Copyright © 2013, Vlamis Software Solutions, Inc.

Trellis View - Simple
• Single type of inner visualization
• Common synchronized scale across all graphs
• Has scale showing by default (can turn off)
• Lots of graph types
• Vertical Bar
• Horizontal Bar
• Line
• Area
• Line-Bar
• Pie
• Scatter
• Bubble
Copyright © 2013, Vlamis Software Solutions, Inc.

Trellis View - Advanced
• Pivot table with numbers or graphs in cells
• Each microchart has its own scale and not shown
• Most often used to see trend lines
• No axis description, so across should be time
• Can have different visualizations for different measures
•Spark bar
•Spark line
•Spark area
•numbers
Copyright © 2013, Vlamis Software Solutions, Inc.

New Trellis Views
• Does not require Exalytics but need fast Pres Server
• Can display LOTS of data in compact form
• Capable of dense visualizations
• Great for snapshot of trending
• Great for comparing patterns across dimension values
• Two types
• Simple (shows full graphs per cell)
• Advanced (sparklines – no scales per cell, separate scales)
• Need to think what you’re trying to show on a trellis
Copyright © 2013, Vlamis Software Solutions, Inc.

• Integrated toolset in OBIEE
• Follows “Balanced Scorecard” methodology
• Enables corporate goals and objectives to be
monitored and managed
• Includes strategy maps, strategy trees, KPI watch lists,
and cause and effect maps
OBI Scorecard & Strategy Management
Copyright © 2013, Vlamis Software Solutions, Inc.

New Contribution Wheel Visualization
Copyright © 2013, Vlamis Software Solutions, Inc.
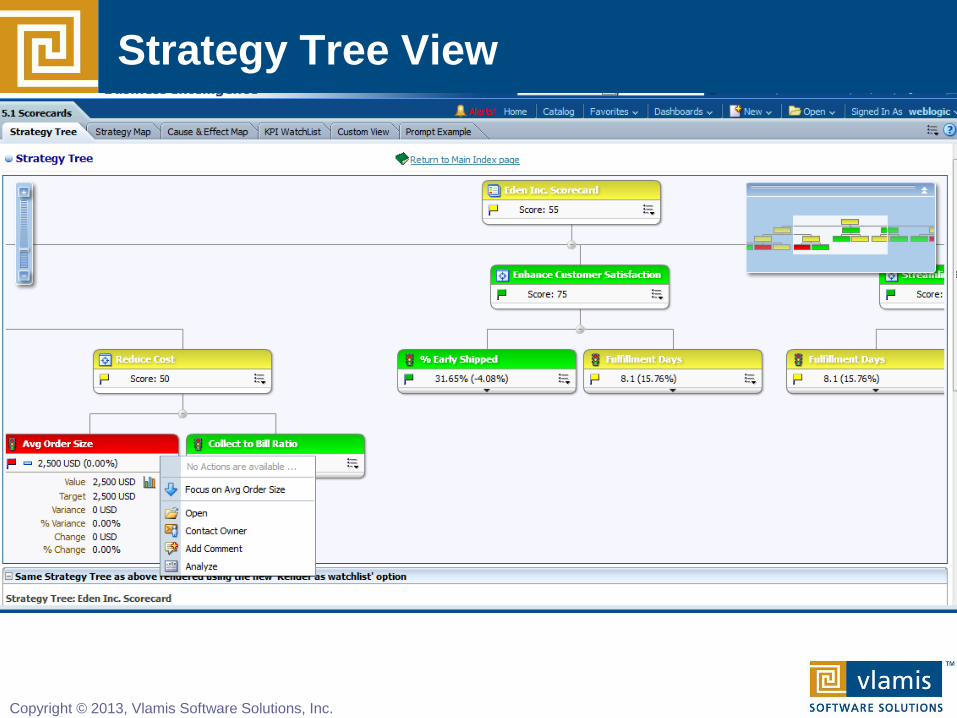
Strategy Tree View
Copyright © 2013, Vlamis Software Solutions, Inc.

Strategy Map View
Copyright © 2013, Vlamis Software Solutions, Inc.

Sparklines
Copyright © 2013, Vlamis Software Solutions, Inc.

Pivot Heat Map
Copyright © 2013, Vlamis Software Solutions, Inc.

Humans Think Spatially
Copyright © 2013, Vlamis Software Solutions, Inc.
Humans Think Spatially

Why Maps are Powerful
Copyright © 2013, Vlamis Software Solutions, Inc.
Maps convey dense, multi-
dimensional relationships in data
faster and more intuitively than any
other graphical display methodology.

What is Spatial Data?
Copyright © 2013, Vlamis Software Solutions, Inc.
• Business data that contains or describes location
• Street and postal address (customers, stores, factory, etc.)
• Sales data (sales territory, customer registration, etc.)
• Assets (cell towers, pipe lines, electrical transformers, etc.)
• Geographic features (roads, rivers, parks, etc.)
• Anything connected to a physical location

When Are Map Views Useful?
Copyright © 2013, Vlamis Software Solutions, Inc.
• Visualizing data related to geographic locations.
• Showing or detecting spatial relationships and patterns.
• Showing lots of data in a relatively small area.
• Drilling down from a (map) overview to a detailed report,
chart, or graph.
• When is location important? Can the dimension be
plotted on a map?

Map View Tips
Copyright © 2013, Vlamis Software Solutions, Inc.
• Think about what scale to use. Different map scales will
reveal different patterns and insights.
• Use Variable marker to display two measures on a map
at a point – size and color.
• Avoid overlapping shapes too much.
• Be aware of spatial distortions E.g. Texas is larger than
Connecticut.
• Look at color palette. www.colorbrewer2.org

Map Definitions
• FEATURE • Provide a spatial context: cities, highways, rivers, etc…
• Features of Interest: store location, postal boundaries, pipelines, etc…
• STYLE • Define rendering properties for features
• Can control fill color, border color, line thickness, line style and more
• THEME • Collection of features
• Typically associated with a spatial geometry layer
• County/state boundaries, major highways, etc…
• BASEMAP • A grouping of themes to create a map
• Maps can share themes
• When associating a theme with a map, can specify min scale and max scale (sometimes known as zoom control)
• MAP • Basemap with additional themes overlain
Copyright © 2013, Vlamis Software Solutions, Inc.

Map Interactivity in OBIEE 11g
• Display BI data on top of maps
• Color fill
• FOI point display
• Interact with other Dashboard Elements
• Drive map content with dashboard prompts
• Drive map content through drilling and navigation
• Drive other dashboard elements through map interactions
• Reveal additional information on maps through mouseovers
• Drill to map detail
Copyright © 2013, Vlamis Software Solutions, Inc.

Map View Formats
• Color Fill (choropleth)
• Percentile, Value,
Continuous binning
• Dashboard user run-time
slider
• Graphs – Bar, Pie
• Adjustable graph size
• Series by second dimension
• Bubble (variable sized)
• Min-Max size specification
• Color specification
• Variable Shape
• Circle, Triangle, Diamond
• Customizable
• Image
• Imported via MapViewer
• More can be added from
MapBuilder
• Custom Point Layer
• Uses Lat / Long
• Does not require a Layer Def
Copyright © 2013, Vlamis Software Solutions, Inc.

NAVTEQ Data
• NAVTEQ is the leading global provider of digital map, traffic and location data that enables navigation and location-based platforms around the world.
• NAVTEQ data is licensed direct or through a reseller.
• Licenses are use specific.
• NAVTEQ data resides inside your own Oracle Database.
• NAVTEQ publishes an ODF (Oracle Data Format) version of its data designed specifically for use in an Oracle Database.
Copyright © 2013, Vlamis Software Solutions, Inc.

Demo of Oracle BI 11g Maps
Copyright © 2013, Vlamis Software Solutions, Inc.

Extended Visualizations
• Use narrative views to run javascript visualizations.
• Use column formulas to run javascript visualizations.
Copyright © 2013, Vlamis Software Solutions, Inc.

Customizing OBI
• Why? • Many of the visuals in OBI contribute to the look and feel and
effectiveness of your dashboard
• Branding Elements
• Customization for different analyses
• How? • Two aspects:
• Personalization directly from the Browser
• Chart types / Colors
• Dashboard Look and Feel
• Skinning and Styling by Altering Configuration Files
• Change Logos
• Alter the color and style of elements
Copyright © 2013, Vlamis Software Solutions, Inc.

Customizing from the browser
Copyright © 2013, Vlamis Software Solutions, Inc.

Customize Existing Dashboard Pages
Copyright © 2013, Vlamis Software Solutions, Inc.

Customizing Skins and Styles
NOTE: Don’t attempt this without proper research
and always BACKUP your original directories
• Two directory trees of interest:
s_blafp (styles) --actual location may vary by installation
$BI_HOME/Oracle_BI1/bifoundation/web/app/res/s_blaf/…
Copyright © 2013, Vlamis Software Solutions, Inc.

Customizing Skins and Styles
• You can also set an env. variable
• Two directory trees of interest:
sk_blafp (skins) --actual location may vary by installation
$BI_HOME/Oracle_BI1/bifoundation/web/app/res/sk_blaf/…
Copyright © 2013, Vlamis Software Solutions, Inc.

Overview of Steps (read the whitepaper)
• Locate and BACKUP the s_blafp / sk_blafp directories
• Rename the “s_<name>” and “sk_<name>” directories for your mods
• Update the instanceconfig.xml with your “<name>”
example: <UI><DefaultSkin>name</DefaultSkin></UI>
<UI><DefaultStyle>name</DefaultStyle></UI>
• Make modifications to the images and .css files in your sk_<name> directory
• Once complete. Restart the Oracle BI Presentation Services and clear the browser cache to see the changes
Copyright © 2013, Vlamis Software Solutions, Inc.

Want to get your hands dirty? Take the
OBIEE Test Drive (free)
• Hosted on Amazon Web Services Cloud (AWS)
• Full dedicated OBIEE environment with a hands-on lab
• Provisioned within minutes of request
• Available for 5 hours before shutting down
• You access this with Remote Desktop (RDP)
• Tool to support –
• Experimentation
• Education www.vlamis.com/testdrive_registration
• Evaluation
• Demonstration
• MicroPOC
Copyright © 2013, Vlamis Software Solutions, Inc.

Oracle Test Drive
• Free to try out Oracle BI
• Go to www.vlamis.com/testdrive-registration/
• Runs off of Amazon AWS
• Hands-on Labs based on Collaborate 2012 HOLs
• Test Drives for:
• Oracle BI
• BI Publisher
• Microsoft Excel against Oracle OLAP
• Oracle Data Mining
• Once sign up, you have private instance for 5 hours
• Available now
Copyright © 2013, Vlamis Software Solutions, Inc.

Join Us at Our Collaborate 13 Presentations
IOUG Presentations
• Advanced Dashboard Design in OBI 11g
• Advanced OLAP: Making the Hard Stuff Easy
• Blazing BI: The Analytic Options to the Oracle Database
• Map Views and Geospatial Analytics in OBI 11g
• Mobile BI: Using BI When and Where You Need It
• Vlamis Process and Maturity Model: BI Project Best Practices
OAUG Presentations
• Data Visualization Best Practices in Oracle Business Intelligence Applications
• Mobile BI: Using When and Where You Need It
Copyright © 2013, Vlamis Software Solutions, Inc.

Thank You!
Thank You for Attending Session 726 Advanced
Dashboard Design in OBI 11g
Presenter Information
Tim Vlamis, Consultant
Vlamis Software Solutions, Inc.
816-781-2880
For more information go to www.vlamis.com
Copyright © 2013, Vlamis Software Solutions, Inc.
Related Documents