Adrian Simmons Lead author, Status Report for the Global Climate Observing System Consultant, European Centre for Medium-Range Weather Forecasts Surface winds and pressure AOPC, Zűrich, 17-20 March2015

Adrian Simmons Lead author, Status Report for the Global Climate Observing System Consultant, European Centre for Medium-Range Weather Forecasts Surface.
Dec 23, 2015
Welcome message from author
This document is posted to help you gain knowledge. Please leave a comment to let me know what you think about it! Share it to your friends and learn new things together.
Transcript
Adrian Simmons
Lead author, Status Report for the Global Climate Observing System
Consultant, European Centre for Medium-Range Weather Forecasts
Surface winds and pressure
AOPC, Zűrich, 17-20 March2015
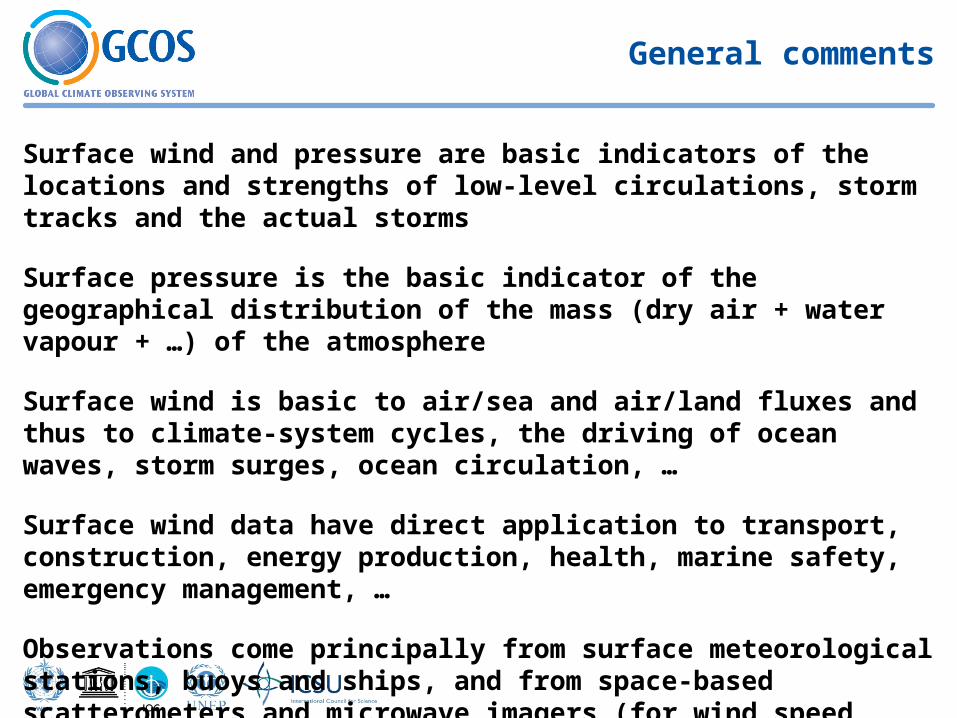
General comments
Surface wind and pressure are basic indicators of the locations and strengths of low-level circulations, storm tracks and the actual storms
Surface pressure is the basic indicator of the geographical distribution of the mass (dry air + water vapour + …) of the atmosphere
Surface wind is basic to air/sea and air/land fluxes and thus to climate-system cycles, the driving of ocean waves, storm surges, ocean circulation, …
Surface wind data have direct application to transport, construction, energy production, health, marine safety, emergency management, …
Observations come principally from surface meteorological stations, buoys and ships, and from space-based scatterometers and microwave imagers (for wind speed only)
Surface networks
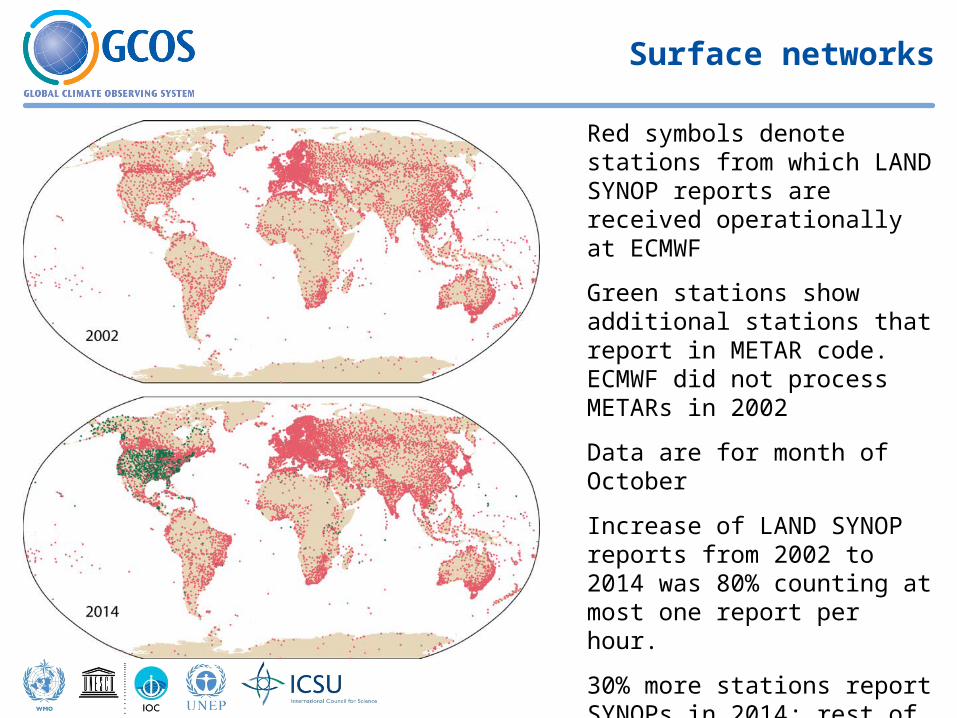
Red symbols denote stations from which LAND SYNOP reports are received operationally at ECMWF
Green stations show additional stations that report in METAR code. ECMWF did not process METARs in 2002
Data are for month of October
Increase of LAND SYNOP reports from 2002 to 2014 was 80% counting at most one report per hour.
30% more stations report SYNOPs in 2014; rest of increase is from more-frequent reporting.
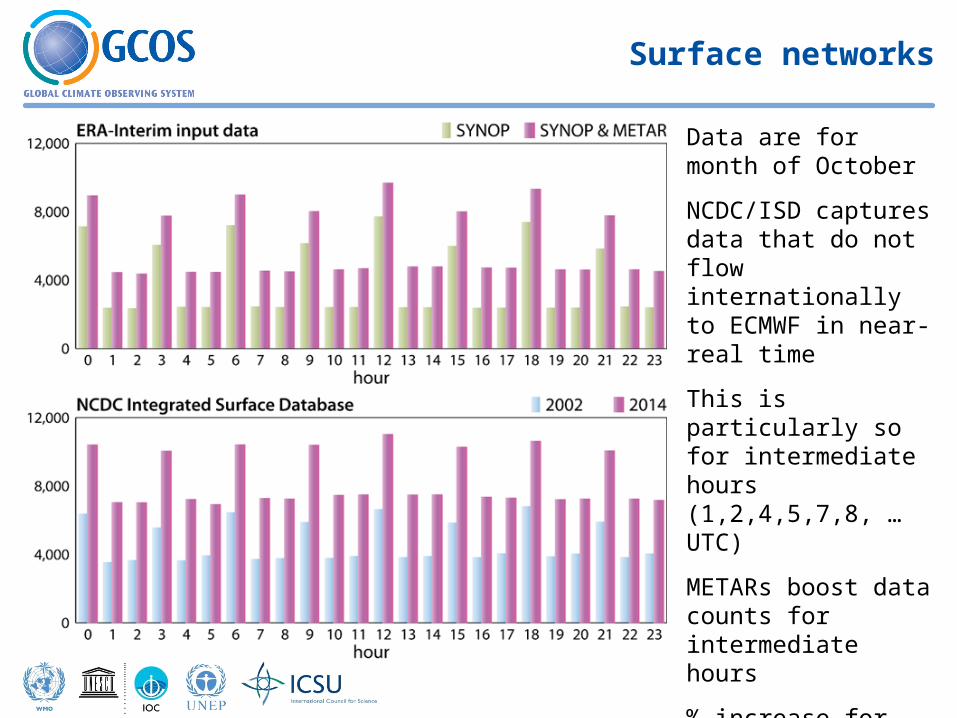
Data are for month of October
NCDC/ISD captures data that do not flow internationally to ECMWF in near-real time
This is particularly so for intermediate hours (1,2,4,5,7,8, … UTC)
METARs boost data counts for intermediate hours
% increase for ISD from 2002 to 2014 is larger for intermediate hours
Surface networks
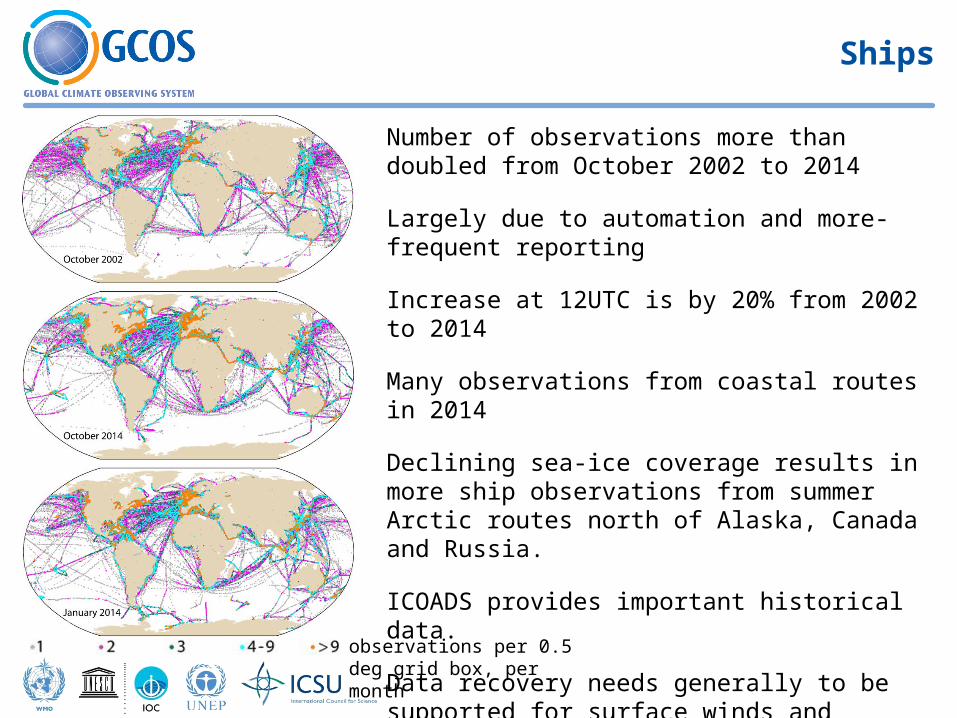
observations per 0.5 deg grid box, per month
Ships
Number of observations more than doubled from October 2002 to 2014
Largely due to automation and more-frequent reporting
Increase at 12UTC is by 20% from 2002 to 2014
Many observations from coastal routes in 2014
Declining sea-ice coverage results in more ship observations from summer Arctic routes north of Alaska, Canada and Russia.
ICOADS provides important historical data.
Data recovery needs generally to be supported for surface winds and pressure. Reanalysis is one user.
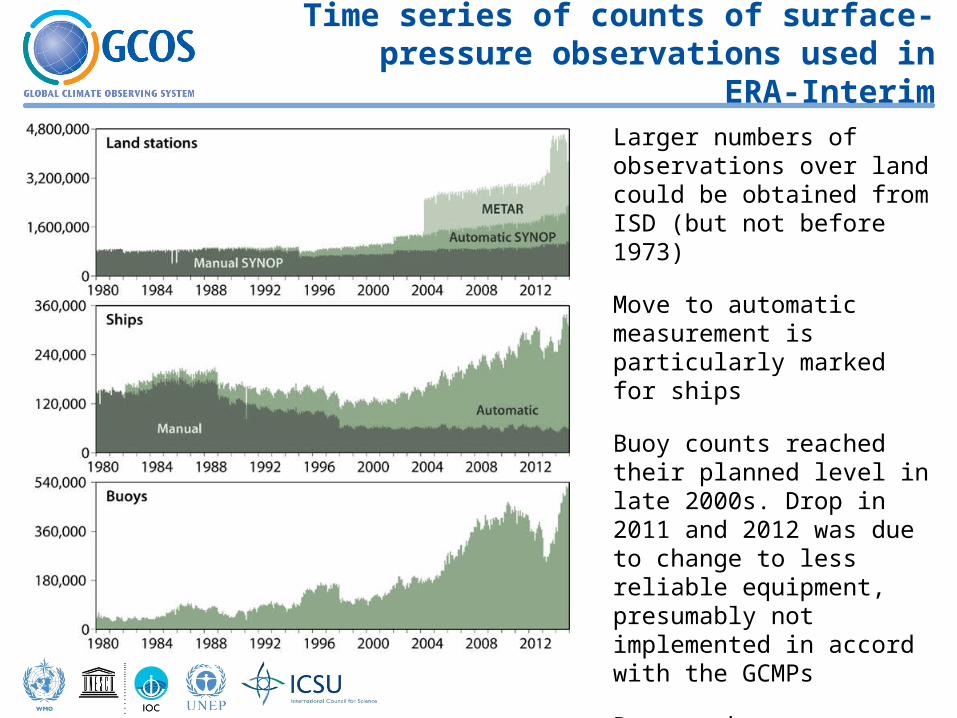
Time series of counts of surface-pressure observations used in ERA-Interim
Larger numbers of observations over land could be obtained from ISD (but not before 1973)
Move to automatic measurement is particularly marked for ships
Buoy counts reached their planned level in late 2000s. Drop in 2011 and 2012 was due to change to less reliable equipment, presumably not implemented in accord with the GCMPs
Buoy numbers now are higher than ever. Playing safe?
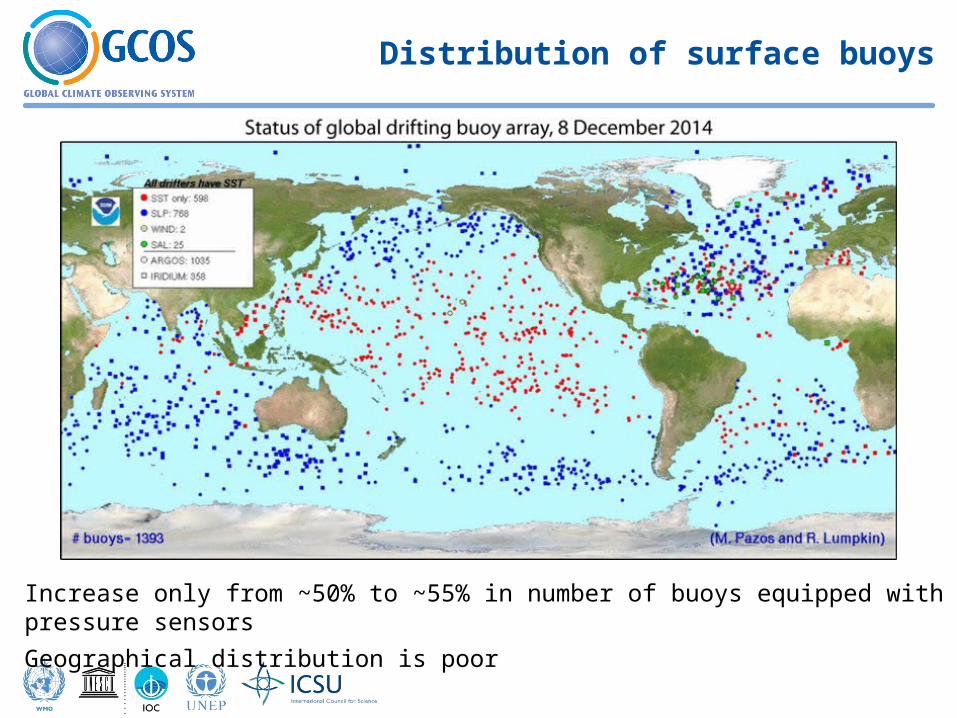
Increase only from ~50% to ~55% in number of buoys equipped with pressure sensors
Geographical distribution is poor
Distribution of surface buoys
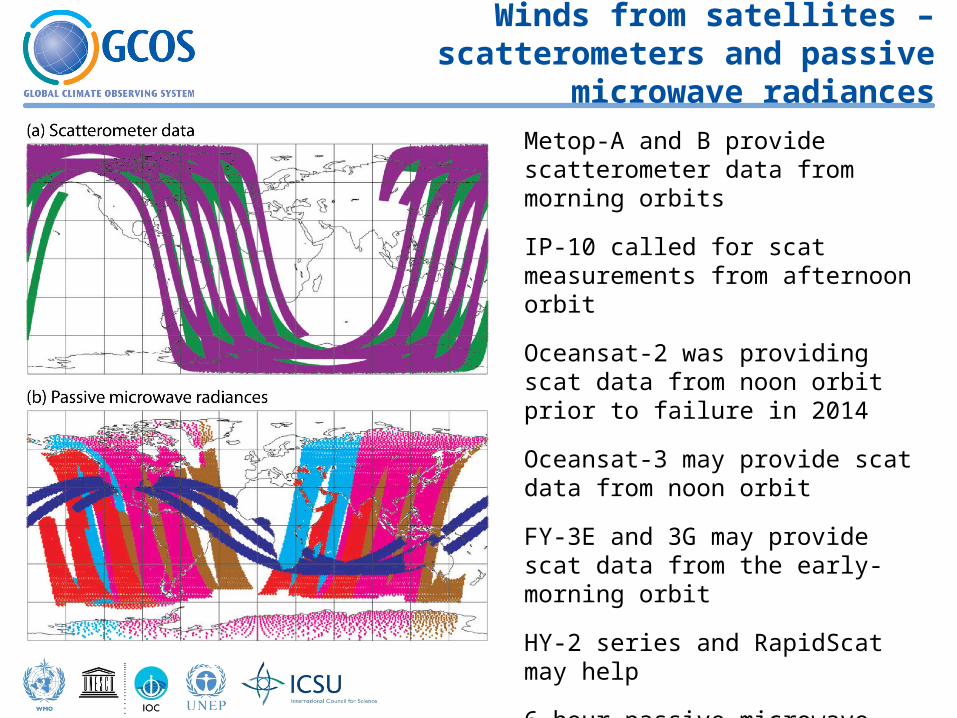
Winds from satellites – scatterometers and passive microwave radiances
Metop-A and B provide scatterometer data from morning orbits
IP-10 called for scat measurements from afternoon orbit
Oceansat-2 was providing scat data from noon orbit prior to failure in 2014
Oceansat-3 may provide scat data from noon orbit
FY-3E and 3G may provide scat data from the early-morning orbit
HY-2 series and RapidScat may help
6-hour passive microwave coverage from SSMI, SSMIS and TMI is shown; GPM-Core and AMSR-2 also provide data
Related Documents