Hindawi Publishing Corporation ISRN Meteorology Volume 2013, Article ID 971501, 18 pages http://dx.doi.org/10.1155/2013/971501 Research Article An Observing System Simulation Experiment for the Impact of MTG Candidate Infrared Sounding Mission on Regional Forecasts: System Development and Preliminary Results Hongli Wang, 1 Xiang-Yu Huang, 1 and Yongsheng Chen 1,2 1 National Center for Atmospheric Research, P.O. Box 3000, Boulder, CO 80307, USA 2 York University, Toronto, ON, Canada M3J 1P3 Correspondence should be addressed to Hongli Wang; [email protected] Received 11 February 2013; Accepted 1 March 2013 Academic Editors: R. Fraile, T. Georgiadis, K. Nakamura, and Z. Pu Copyright © 2013 Hongli Wang et al. is is an open access article distributed under the Creative Commons Attribution License, which permits unrestricted use, distribution, and reproduction in any medium, provided the original work is properly cited. An Observing System Simulation Experiment (OSSE) was designed and developed to assess the potential benefit of the Infrared Sounding on the Meteosat ird Generation (MTG-IRS) geostationary meteorological satellite system to regional forecasts. In the proposed OSSE framework, two different models, namely, the MM5 and WRF models, were used in a nature run and data assimila- tion experiments, respectively, to reduce the identical twin problem. e 5-day nature run, which included three convective storms that occurred during the period from 11 to 16 June 2002 over US Great Plains, was generated using MM5 with a 4 km. e simulated “conventional” observations and MTG-IRS retrieved temperature and humidity profiles, produced from the nature run, were then assimilated into the WRF model. Calibration experiments showed that assimilating real or simulated “conventional” observations yielded similar error statistics in analyses and forecasts, indicating that the developed OSSE system worked well. On average, the MTG-IRS retrieved profiles had positive impact on the analyses and forecasts. e analyses reduced the errors not only in the tem- perature and the humidity fields but in the horizontal wind fields as well. e forecast skills of these variables were improved up to 12 hours. e 18 h precipitation forecast accuracy was also increased. 1. Introduction Remotely sensed satellite observations play an important role in modern data assimilation and forecast systems [1, 2]. Sate- llite observations in the visible, infrared, and microwave spec- trum provide a wealth of information on the atmosphere states. e variational data assimilation technique has been pursued in research communities and operational centres, with the main focus on large scale and mesoscale forecast, to assimilate clear sky and cloudy radiance. For example, at the European Centre for Medium-Range Weather Forecasts (ECMWF), an all-sky approach [3] has been developed to assimilate Special Sensor Microwave/Imager (SSM/I) and Advanced Microwave Scanning Radiometer for the Earth Observing system (AMSR-E) data. At National Oceanic and Atmospheric Administration (NOAA), Weng et al. [4] developed a hybrid variational scheme to use observations from the Advanced Microwave Sounding Unit (AMSU) instruments. Until recently, more attention has been directed towards cloud-resolving scale data assimilation. Cloudy infrared radiance assimilation at convection-resolving scale using a 4-dimensional variational data assimilation system was studied by Vukicevic et al. [5, 6]. Overall their results indicate that the analyzed atmospheric fields are improved aſter assimilation. e European Organisation for the Exploitation of Mete- orological Satellites (EUMETSAT) is preparing for the next European operational geostationary meteorological satellite system named the Meteosat ird Generation (MTG). e MTG series will comprise six satellites, with the first space- craſt likely to be ready for launch in 2017. is program will provide space-acquired meteorological data until at least the late 2030s. Details can be found at the EUMETSAT web- site (http://www.eumetsat.int). Compared to the Meteosat Second Generation (MSG), the inclusion of an Infrared Sounding on the MTG (MTG-IRS) will be a new capability,

Welcome message from author
This document is posted to help you gain knowledge. Please leave a comment to let me know what you think about it! Share it to your friends and learn new things together.
Transcript
Hindawi Publishing CorporationISRNMeteorologyVolume 2013, Article ID 971501, 18 pageshttp://dx.doi.org/10.1155/2013/971501
Research ArticleAn Observing System Simulation Experiment for the Impact ofMTG Candidate Infrared Sounding Mission on RegionalForecasts: System Development and Preliminary Results
Hongli Wang,1 Xiang-Yu Huang,1 and Yongsheng Chen1,2
1 National Center for Atmospheric Research, P.O. Box 3000, Boulder, CO 80307, USA2 York University, Toronto, ON, Canada M3J 1P3
Correspondence should be addressed to Hongli Wang; [email protected]
Received 11 February 2013; Accepted 1 March 2013
Academic Editors: R. Fraile, T. Georgiadis, K. Nakamura, and Z. Pu
Copyright © 2013 Hongli Wang et al. This is an open access article distributed under the Creative Commons Attribution License,which permits unrestricted use, distribution, and reproduction in any medium, provided the original work is properly cited.
An Observing System Simulation Experiment (OSSE) was designed and developed to assess the potential benefit of the InfraredSounding on the Meteosat Third Generation (MTG-IRS) geostationary meteorological satellite system to regional forecasts. In theproposed OSSE framework, two different models, namely, theMM5 andWRFmodels, were used in a nature run and data assimila-tion experiments, respectively, to reduce the identical twin problem.The 5-day nature run, which included three convective stormsthat occurred during the period from 11 to 16 June 2002 over US Great Plains, was generated usingMM5with a 4 km.The simulated“conventional” observations and MTG-IRS retrieved temperature and humidity profiles, produced from the nature run, were thenassimilated into the WRF model. Calibration experiments showed that assimilating real or simulated “conventional” observationsyielded similar error statistics in analyses and forecasts, indicating that the developed OSSE system worked well. On average, theMTG-IRS retrieved profiles had positive impact on the analyses and forecasts.The analyses reduced the errors not only in the tem-perature and the humidity fields but in the horizontal wind fields as well. The forecast skills of these variables were improved up to12 hours. The 18 h precipitation forecast accuracy was also increased.
1. Introduction
Remotely sensed satellite observations play an important rolein modern data assimilation and forecast systems [1, 2]. Sate-llite observations in the visible, infrared, andmicrowave spec-trum provide a wealth of information on the atmospherestates. The variational data assimilation technique has beenpursued in research communities and operational centres,with the main focus on large scale and mesoscale forecast, toassimilate clear sky and cloudy radiance. For example, at theEuropean Centre for Medium-Range Weather Forecasts(ECMWF), an all-sky approach [3] has been developed toassimilate Special Sensor Microwave/Imager (SSM/I) andAdvanced Microwave Scanning Radiometer for the EarthObserving system (AMSR-E) data. At National Oceanic andAtmospheric Administration (NOAA), Weng et al. [4]developed a hybrid variational scheme to use observationsfrom the Advanced Microwave Sounding Unit (AMSU)
instruments. Until recently, more attention has been directedtowards cloud-resolving scale data assimilation. Cloudyinfrared radiance assimilation at convection-resolving scaleusing a 4-dimensional variational data assimilation systemwas studied by Vukicevic et al. [5, 6]. Overall their resultsindicate that the analyzed atmospheric fields are improvedafter assimilation.
The European Organisation for the Exploitation of Mete-orological Satellites (EUMETSAT) is preparing for the nextEuropean operational geostationary meteorological satellitesystem named the Meteosat Third Generation (MTG). TheMTG series will comprise six satellites, with the first space-craft likely to be ready for launch in 2017. This program willprovide space-acquired meteorological data until at least thelate 2030s. Details can be found at the EUMETSAT web-site (http://www.eumetsat.int). Compared to the MeteosatSecond Generation (MSG), the inclusion of an InfraredSounding on the MTG (MTG-IRS) will be a new capability,
2 ISRNMeteorology
which will support regional and convective-scale numericalweather prediction in Europe, through unprecedented detailon wind, temperature, and humidity, at high vertical, hori-zontal, and temporal resolution [7].
Assimilating theMTG-IRS observations into amesoscalemodel is expected to improve regional numerical weatherforecast skills. Recent studies suggest that the accurate rep-resentation of the low-level water vapor and temperatureis crucial for the quantitative precipitation forecast [8, 9].When realistic mesoscale details of the horizontal varia-tions in moisture and temperature are included, pronouncedimprovements in forecast skills for convective events can beachieved [10–13]. To evaluate such potentials, quantitativeanalyses of the added values of the IRS candidate mission forregional scale forecasts are performed by the means of theObserving System Simulation Experiment (OSSE).
The OSSE method is regarded as an efficient way to testthe impact of future observing systems and new data assimi-lation techniques on weather analysis and prediction [14–17].A typical OSSE system includes the following components:a nature run or “truth” run, simulated observations, anddata assimilation and forecast experiment to evaluate theimpact of simulated observations. The calibration of OSSEassesses the performance of OSSE by comparing the dataimpact of existing instruments to their simulated data impact[14]. The OSSE should reproduce the same/similar real dataimpact.
The OSSE system may overestimate benefit of the obser-vations when the same numerical weather model is used inthe nature run and forecast experiment (i.e., the identical twinproblem). To alleviate this problem, a model with differentphysics schemes is often used in regional OSSE to simulatemodel errors [16]. In this paper, we employed two differentmodels in nature run and data assimilation experiments tofurther reduce the identical twin problem in the regionalOSSE.The Pennsylvania State University/National Center forAtmospheric Research (NCAR) Mesoscale Model Version5 (MM5) was utilized to produce the nature run, whereasthe Weather Research and Forecasting (WRF) model wasused as the forecast model. The MM5 model and WRFmodel have different numerical solvers and different physicsparameterizations and grid sizes. Analyses (forecasts) fromdifferent datasets are employed to initialize initial and bound-ary conditions. It is expected that differences between twomodels can reasonably represent the model error. A pair ofcalibration experiments, that is, one assimilates real observa-tionswhile the other assimilates simulated observations, wereconducted to demonstrate the performance of the developedOSSE system.
This paper describes the framework design of the OSSEsystem and summarizes the preliminary results of the poten-tial benefit ofMTG-IRS on regional forecasts of three convec-tive storms occurred over the US Great Plains in June 2002.The OSSE system is characterized by a nature run using theMM5 model with convective system resolving grid size of4 km, (rapid update) cycling data assimilation and forecastexperiments using theWRFmodelwith 12 km resolution, anda pair of calibration experiments. The overview of selectedcases is in Section 2.The methodology and experiment setup
are described in Section 3. Section 4 presents the results of theOSSE. A summary and discussion are given in Section 5.
2. Overview of Selected Cases
Three convection cases that occurred between 11 and 16 June2002 during the International H
2O Project (IHOP 2002)
are selected. These three cases include dry line, convectivestorms, and a severe mesoscale convective system (MCS). On11 June 2002, a dry line formed in theOklahoma panhandle inthe late afternoon.Three storms developed on this particularday in regions close to the border of Colorado andOklahoma.On 12 June 2002, a northeast-to-southwest-oriented squallline from the Kansas and Oklahoma border to the TexasPanhandle was initiated at around 2100 UTC 12 June 2002. Atthe same time, isolated convections formed from the Kansasand Oklahoma border to Texas. They gradually strengthenedalongmost parts of the dry line, and a severe storm developednear a triple point that was formed by the dry line and acold air outflow. The 15-16 June case is a severe MCS thatoccurred over the US central and southern plains in the lateafternoon 15 June 2002. The MCS produced severe weatherincluding several tornadoes in southern Kansas, and a swathof wind damage reports through central Oklahoma south-ward through central Texas as it propagated south-southeast-ward.More detailed descriptions of three cases were reportedby Wechwerth et al. [13], Dawson and Xue [18], and Wanget al. [19].
3. Methodology and Experiment Design
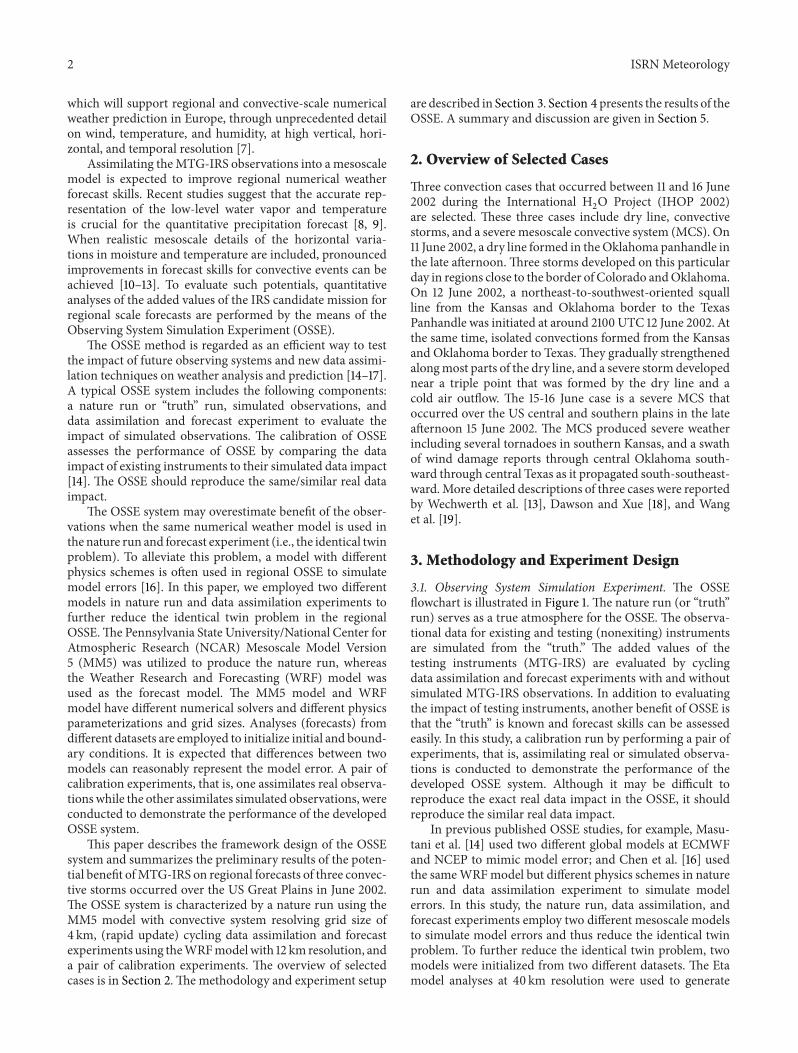
3.1. Observing System Simulation Experiment. The OSSEflowchart is illustrated in Figure 1. The nature run (or “truth”run) serves as a true atmosphere for the OSSE. The observa-tional data for existing and testing (nonexiting) instrumentsare simulated from the “truth.” The added values of thetesting instruments (MTG-IRS) are evaluated by cyclingdata assimilation and forecast experiments with and withoutsimulated MTG-IRS observations. In addition to evaluatingthe impact of testing instruments, another benefit of OSSE isthat the “truth” is known and forecast skills can be assessedeasily. In this study, a calibration run by performing a pair ofexperiments, that is, assimilating real or simulated observa-tions is conducted to demonstrate the performance of thedeveloped OSSE system. Although it may be difficult toreproduce the exact real data impact in the OSSE, it shouldreproduce the similar real data impact.
In previous published OSSE studies, for example, Masu-tani et al. [14] used two different global models at ECMWFand NCEP to mimic model error; and Chen et al. [16] usedthe sameWRFmodel but different physics schemes in naturerun and data assimilation experiment to simulate modelerrors. In this study, the nature run, data assimilation, andforecast experiments employ two different mesoscale modelsto simulate model errors and thus reduce the identical twinproblem. To further reduce the identical twin problem, twomodels were initialized from two different datasets. The Etamodel analyses at 40 km resolution were used to generate
ISRNMeteorology 3
MM5 4km nature run with ETA 40km analysis
Simulated observation
OBS
OBS
OBS
OBS
BGBG
BG
BGCycling assimilation runs
WRF 12km control run with NCEP GFS IC and LBC
11/12 12/12 13/12 14/12 15/12 16/12
24h FCST
Figure 1: Flowchart of experiments.
initial and boundary conditions for the nature run, while theNational Center for Environment Prediction (NCEP) GlobalForecast System (GFS) analyses and forecasts reduced to1∘× 1∘ resolution were used to generate initial and boundaryconditions for WRF model in the data assimilation experi-ments. Though it is not easy to verify how realistic the modelerror is since we do not know much on “true model error,”the above steps are expected to simulate model error in real-world data assimilation.
3.2. Models and Data Assimilation System. The MM5 modelversion 3.6 [20] and theWRFmodel [21] are employed in thenature run and data assimilation experiments, respectively.MM5 is a limited-area, nonhydrostatic, and terrain-followingsigma-coordinate model, which is designed to simulatemesoscale atmospheric circulation. MM5 uses leapfrog steptime differencing with an Asselin filter. TheWRFmodel pro-duces the background for the data assimilation experimentsand makes forecasts from the analyses. The WRF model isa nonhydrostatic, terrain-following mass vertical coordinatenumerical weather prediction and atmospheric simulationsystem. The model uses a third-order Runge-Kutta timeintegration, the third-to-fifth-order advection operators, andsplit-explicit fast wave integration scheme conserving bothmass and energy.
The data assimilation system is the WRF VariationalData Assimilation System (WRF-Var) [22, 23]. TheWRF-Vardeveloped atNCAR is a unified (global/regional,multimodel,3/4D-Var) model-space variational data assimilation system.A wide range of observation types, including conventionalobservations, radar, and satellite radiances, can be assimilatedin WRF-Var. The 3-dimensional component of WRF-Var(WRF 3D-Var) is employed in this study. A new observationtype named MTG-IRS is added into WRF 3D-Var to assimi-late retrievedMTG-IRS temperature and water vapor mixingratio profiles directly.
3.3. Experiment Setup
3.3.1. Nature Run. The model configuration for the naturerun in this study employs 505 × 505 grid points with 4 km
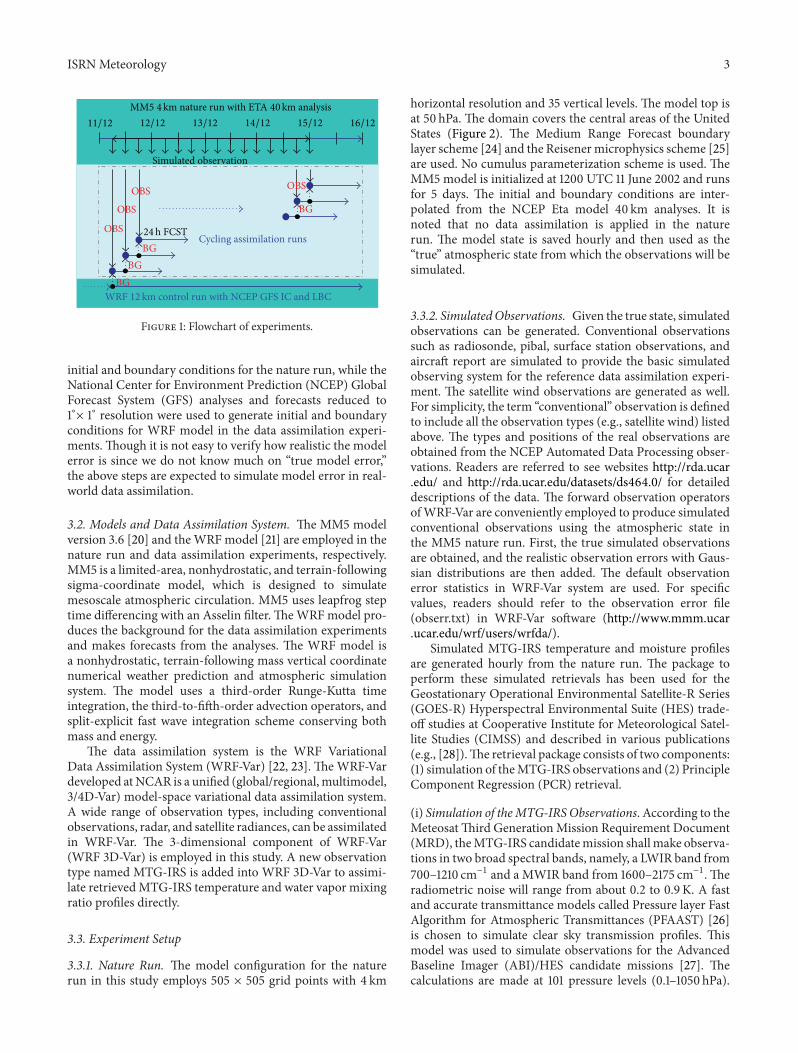
horizontal resolution and 35 vertical levels. The model top isat 50 hPa. The domain covers the central areas of the UnitedStates (Figure 2). The Medium Range Forecast boundarylayer scheme [24] and the Reisenermicrophysics scheme [25]are used. No cumulus parameterization scheme is used. TheMM5 model is initialized at 1200 UTC 11 June 2002 and runsfor 5 days. The initial and boundary conditions are inter-polated from the NCEP Eta model 40 km analyses. It isnoted that no data assimilation is applied in the naturerun. The model state is saved hourly and then used as the“true” atmospheric state from which the observations will besimulated.
3.3.2. SimulatedObservations. Given the true state, simulatedobservations can be generated. Conventional observationssuch as radiosonde, pibal, surface station observations, andaircraft report are simulated to provide the basic simulatedobserving system for the reference data assimilation experi-ment. The satellite wind observations are generated as well.For simplicity, the term “conventional” observation is definedto include all the observation types (e.g., satellite wind) listedabove. The types and positions of the real observations areobtained from the NCEP Automated Data Processing obser-vations. Readers are referred to see websites http://rda.ucar.edu/ and http://rda.ucar.edu/datasets/ds464.0/ for detaileddescriptions of the data. The forward observation operatorsofWRF-Var are conveniently employed to produce simulatedconventional observations using the atmospheric state inthe MM5 nature run. First, the true simulated observationsare obtained, and the realistic observation errors with Gaus-sian distributions are then added. The default observationerror statistics in WRF-Var system are used. For specificvalues, readers should refer to the observation error file(obserr.txt) in WRF-Var software (http://www.mmm.ucar.ucar.edu/wrf/users/wrfda/).
Simulated MTG-IRS temperature and moisture profilesare generated hourly from the nature run. The package toperform these simulated retrievals has been used for theGeostationary Operational Environmental Satellite-R Series(GOES-R) Hyperspectral Environmental Suite (HES) trade-off studies at Cooperative Institute for Meteorological Satel-lite Studies (CIMSS) and described in various publications(e.g., [28]).The retrieval package consists of two components:(1) simulation of theMTG-IRS observations and (2) PrincipleComponent Regression (PCR) retrieval.
(i) Simulation of theMTG-IRSObservations. According to theMeteosatThird GenerationMission Requirement Document(MRD), theMTG-IRS candidatemission shallmake observa-tions in two broad spectral bands, namely, a LWIR band from700–1210 cm−1 and a MWIR band from 1600–2175 cm−1. Theradiometric noise will range from about 0.2 to 0.9 K. A fastand accurate transmittance models called Pressure layer FastAlgorithm for Atmospheric Transmittances (PFAAST) [26]is chosen to simulate clear sky transmission profiles. Thismodel was used to simulate observations for the AdvancedBaseline Imager (ABI)/HES candidate missions [27]. Thecalculations are made at 101 pressure levels (0.1–1050 hPa).
4 ISRNMeteorology
Wyoming
NebraskaLowa
MissouriKansasColorado
New MexicoRo
cky m
ount
ain
Oklahoma Arkansas
Texas
−100
100
300
500
700
900
1100
1300
1500
1700
1900
2100
2300
2500
2700
2900
3100
110W 90W95W100W105W
40N
35N
30N
Figure 2: Model domain superposed with topography (unit: m) for bothMM5 andWRF.The states and Rocky mountains are also indicated.
The output from nature run is interpolated into these 101pressure levels and used as input to the transmittance model.The temperature and humidity retrievals are performed onthese 101 pressure levels.
(ii) PCR Retrieval. Once the radiances at top of atmospherein the MTG-IRS channels for a set of atmospheric conditionshave been calculated, they are inverted to get simulatedretrieval profiles of temperature, moisture, and the surfaceskin temperature.Thederivation of the regression coefficientsis done on a dataset extracted from the nature run. As with allstatistical regression methods, the accuracy of the retrievalsdepends upon the adopted training dataset. A training datasetwas sampled from the nature run every 6 hours such thata representative dataset was obtained. This means that thetraining dataset is not completely independent from thedataset used for the retrievals. However, it is important torealize that the PCR retrieval is the first step in the completeretrieval process. After the PCR retrieval, a nonlinear iterativephysical retrieval on the synthetic observations should beperformed. The objective of the PCR retrieval is therefore toprovide a starting point for the nonlinear iterative physicalretrieval, which is close to the final solution to reduce thenumber of iterations.
The radiance dataset calculated for the training datasetwas used to calculate empirical orthogonal functions (EOF)using a standard singular value decomposition of the covari-ancematrix. Values for the radiometric noise are added in thegeneration of the regression coefficients from a correlationof the EOFs with the training dataset. The actual PCR retri-eval is applied to the simulated MTG-IRS radiances. Firstthese radiances are projected onto the EOFs derived fromthe training dataset. Values for temperature, moisture, andsurface temperature are then obtained after the application ofthe regression relations. After the PCR retrieval, a nonlineariterative procedure is applied to the radiative transfer equa-tion to further improve the profiles [28].
Currently, the MTG-IRS retrieval algorithm can onlyprovide temperature and humidity profiles over the clear skyregions. In addition, the retrieval algorithm cannot deal withcomplicated land surfaces over the Rocky Mountains. Thus,there are no retrievals over the RockyMountain. But in otherclear sky regions in themodel domain, the retrieval algorithmworked well.
3.3.3. Data Assimilation and Forecast Experiment. TheMTG-IRS retrieved profiles are assimilated in the presence of othersimulated conventional observations to assess their added

ISRNMeteorology 5
Table 1: List of experiments.
Experiment Cycling period Resolution (km) Initial condition and assimilated dataNoDA
Nature No 4 ETA 40 km analysisControl No 12 GFS analysis and forecast, no observations
3DVarROP 6 h 12 Background (BG)+ real conventional observationsSOP-6hc 6 h 12 BG+ simulated conventional observations (SOP)SOP-RPtq-6hc 6 h 12 BG + SOP + retrieved profiles (RP) of temperature 𝑇 and humidity q (RPtq)SOP-RPq-6hc 6 h 12 BG + SOP + retrieved profiles of humidity (RPq)SOP-1hc 1 h 12 BG + SOPSOP-RPtq-1hc 1 h 12 BG + SOP + RPtqPOP 6 h 12 BG + perfect observation (POP)
values.The experiments are listed in Table 1 and illustrated inFigure 1. These experiments shall provide reasonable assess-ments of the added value of the MTG-IRS retrievals.
The simulated data with high spatial density are thinnedbefore data assimilation. Satellite winds are thinned to 36 kmgrids, and their errors are then assumed to be independent.The MTG-IRS retrievals have high horizontal error correla-tions, and they are thinned to 36 km grids for data assimi-lation. Vertical correlation in retrievals is not considered indata assimilation. However, retrievals are thinned to the 35vertical pressure levels in WRF model.
Note that in all the control and assimilation experiments,the initial and boundary conditions of the WRF model areinterpolated from the 1-degree resolutionNCEPGFS analysesand subsequent 5-day forecasts at 0000UTC 11 June 2002.Thephysics schemes chosen in the WRF simulations include theNoah land surface model, the WSM6 microphysics scheme[29] and the Grell scheme [30] for cumulus parameterization.The WRF model domain covers the same area as MM5.Limited by the available computational resources, all theexperiments are conducted at 12 km resolution. We con-ducted several data assimilation and forecast experiments at4 km at 18 Z to show the sensitivity to model resolutions.We found that high-resolution simulations only slightlyincrease precipitation forecast skill. We also found thatsynoptic forcing plays an important role in this case. That isperhaps the reason that the above experiments did not showsignificant sensitivity to resolutions. It is reasonable to believethat the general conclusions drawn here also apply to 4 kmresolution.
The background error covariance is generated by theNationalMeteorological Center (NMC)method [31]. Specifi-cally, a set of cold-start forecasts is initialized from the NCEPGFS analyses and subsequent forecasts at 0000 UTC and1200 UTC every day from 5 June 2002 to 19 June 2002. Thedifferences of 24 h and 12 h forecasts are used to derive thebackground error covariance.
The control run is performed without data assimilation.In the control experiment, theWRFmodel is initialized fromthe GFS analysis at 0000 UTC 11 June 2002 and integrated for5.5 days. Its 18 h forecast valid at 1800UTC 11 June 2002 servesas the background (BG) fields for the first cycle of other dataassimilation experiments. The control run also serves as the
benchmark for intercomparison with other experiments withobservations assimilated.
The added value of MTG-IRS retrievals is assessed ina cycling data assimilation and forecast mode. In a cyclingmode, a previous forecast is used as the first guess for thecurrent analysis.The data assimilation experiments, SOP-6hcand SOP-1hc, in which only simulated conventional observa-tions are assimilated, are references experiment for quantify-ingMTG-IRS data impact. To validate the performance of thedesigned OSSE, we also conducted an experiment, ROP, inwhich the real conventional observations are assimilated. InOSSE, the assimilation of real observations will yield similarerror statistics in analyses and forecasts compared to theassimilation of corresponding simulated observations.
To assess the added value of the retrieved MTG-IRS tem-perature and moisture profiles, the simulated conventionalobservations are assimilated in all data assimilation experi-ments. For example, in the experiment SOP-RPq-6hc, onlythe MTG-IRS humidity profiles are assimilated in additionto the simulated conventional data every 6 hours, while theexperiment SOP-RPtq-6hc uses both MTG-IRS temperatureand humidity profiles. The experiment SOP-RPtq-1hc is thesame as SOP-RPtq-6hc except the assimilation cycling periodis 1 hour instead of 6 hours.
The POP experiment is designed to assess the maxi-mum impact of the perfect observations. The temperature,moisture, and wind profiles obtained directly from the truthat every 36 km × 36 km grid point are assimilated in thisexperiment.
3.3.4. Verification. To objectively evaluate the impacts ofMTG-IRS data on the regional scale analysis and forecast,traditional skill scores such as the root-mean-square (RMS)error between an experiment and the “truth” are computed.
The impact on precipitation forecast is quantified in termsof EquitableThreat Score (ETS) and frequency bias. The ETSis defined as
ETS =(hits − hitsrandom)
(hits +misses + false alarms − hitsrandom), (1)
where
hitsrandom =(hits +misses) (hits + false alarms)
Nobs. (2)
6 ISRNMeteorology
0600 UTC 12 Jun
46∘N
44∘N
42∘N
40∘N
38∘N
36∘N
34∘N
32∘N
30∘N
28∘N
108∘W 104
∘W 100∘W 96
∘W
(a)
45N
40N
35N
30N
25N
105W 100W 95W 90W110W
0600 UTC 12 Jun
(b)
46∘N
44∘N
42∘N
40∘N
38∘N
36∘N
34∘N
32∘N
30∘N
28∘N
108∘W 104
∘W 100∘W 96
∘W
0600 UTC 13 Jun
(c)
105W 100W 95W 90W110W
45N
40N
35N
30N
25N
0600 UTC 13 Jun
(d)
46∘N
44∘N
42∘N
40∘N
38∘N
36∘N
34∘N
32∘N
30∘N
28∘N
108∘W 104
∘W 100∘W 96
∘W
50
10
15
20
25
30
35
50
75
100
125
150
175
0600 UTC 16 Jun
(e)1 10 25 50 75 100
45N
40N
35N
30N
25N
105W 100W 95W 90W110W
0600 UTC 16 Jun
(f)
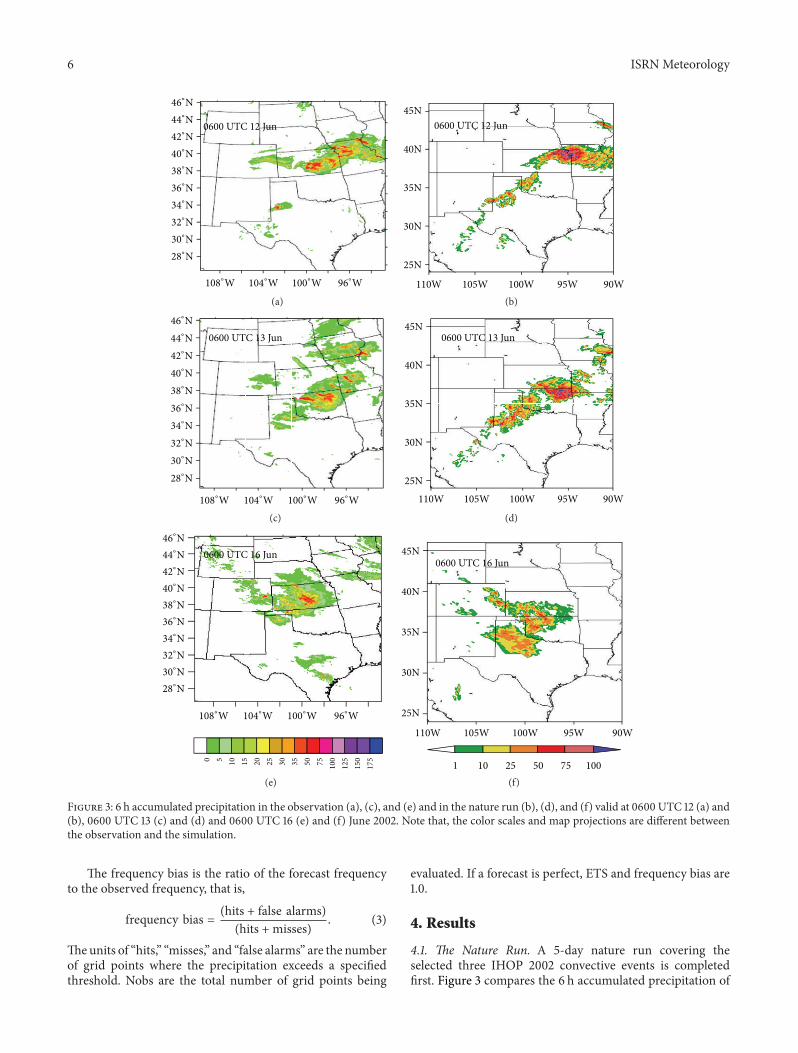
Figure 3: 6 h accumulated precipitation in the observation (a), (c), and (e) and in the nature run (b), (d), and (f) valid at 0600 UTC 12 (a) and(b), 0600 UTC 13 (c) and (d) and 0600 UTC 16 (e) and (f) June 2002. Note that, the color scales and map projections are different betweenthe observation and the simulation.
The frequency bias is the ratio of the forecast frequencyto the observed frequency, that is,
frequency bias = (hits + false alarms)(hits +misses)
. (3)
Theunits of “hits,” “misses,” and “false alarms” are the numberof grid points where the precipitation exceeds a specifiedthreshold. Nobs are the total number of grid points being
evaluated. If a forecast is perfect, ETS and frequency bias are1.0.
4. Results
4.1. The Nature Run. A 5-day nature run covering theselected three IHOP 2002 convective events is completedfirst. Figure 3 compares the 6 h accumulated precipitation of
ISRNMeteorology 7
1118
1200
1206
1212
1218
1118
1200
1206
1212
1218
BiasRMS
−1 0 1 2 3
100
200
300
400
500
600
700
800
9001000
(a)
1118
1200
1206
1212
1218
1118
1200
1206
1212
1218
BiasRMS
−1 0 1 2 3
100
200
300
400
500
600
700
8009001000
(b)
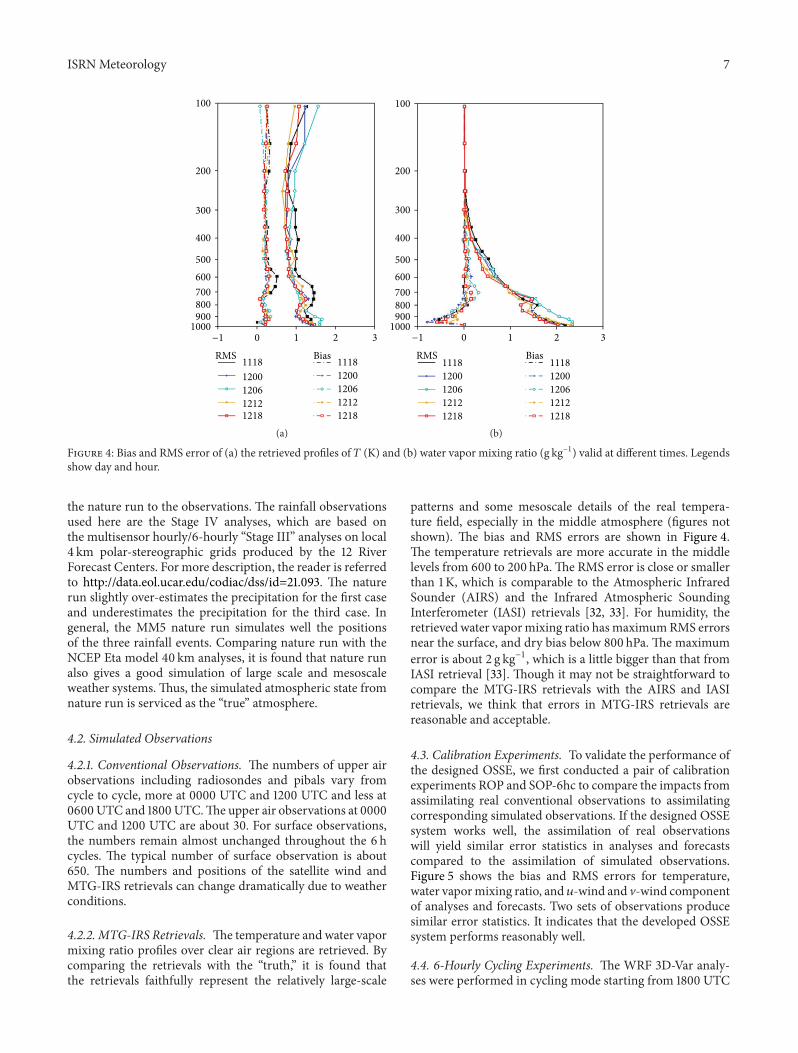
Figure 4: Bias and RMS error of (a) the retrieved profiles of 𝑇 (K) and (b) water vapor mixing ratio (g kg−1) valid at different times. Legendsshow day and hour.
the nature run to the observations. The rainfall observationsused here are the Stage IV analyses, which are based onthe multisensor hourly/6-hourly “Stage III” analyses on local4 km polar-stereographic grids produced by the 12 RiverForecast Centers. For more description, the reader is referredto http://data.eol.ucar.edu/codiac/dss/id=21.093. The naturerun slightly over-estimates the precipitation for the first caseand underestimates the precipitation for the third case. Ingeneral, the MM5 nature run simulates well the positionsof the three rainfall events. Comparing nature run with theNCEP Eta model 40 km analyses, it is found that nature runalso gives a good simulation of large scale and mesoscaleweather systems. Thus, the simulated atmospheric state fromnature run is serviced as the “true” atmosphere.
4.2. Simulated Observations
4.2.1. Conventional Observations. The numbers of upper airobservations including radiosondes and pibals vary fromcycle to cycle, more at 0000 UTC and 1200 UTC and less at0600UTC and 1800UTC.The upper air observations at 0000UTC and 1200 UTC are about 30. For surface observations,the numbers remain almost unchanged throughout the 6 hcycles. The typical number of surface observation is about650. The numbers and positions of the satellite wind andMTG-IRS retrievals can change dramatically due to weatherconditions.
4.2.2. MTG-IRS Retrievals. The temperature and water vapormixing ratio profiles over clear air regions are retrieved. Bycomparing the retrievals with the “truth,” it is found thatthe retrievals faithfully represent the relatively large-scale
patterns and some mesoscale details of the real tempera-ture field, especially in the middle atmosphere (figures notshown). The bias and RMS errors are shown in Figure 4.The temperature retrievals are more accurate in the middlelevels from 600 to 200 hPa.The RMS error is close or smallerthan 1 K, which is comparable to the Atmospheric InfraredSounder (AIRS) and the Infrared Atmospheric SoundingInterferometer (IASI) retrievals [32, 33]. For humidity, theretrieved water vapormixing ratio hasmaximumRMS errorsnear the surface, and dry bias below 800 hPa. The maximumerror is about 2 g kg−1, which is a little bigger than that fromIASI retrieval [33]. Though it may not be straightforward tocompare the MTG-IRS retrievals with the AIRS and IASIretrievals, we think that errors in MTG-IRS retrievals arereasonable and acceptable.
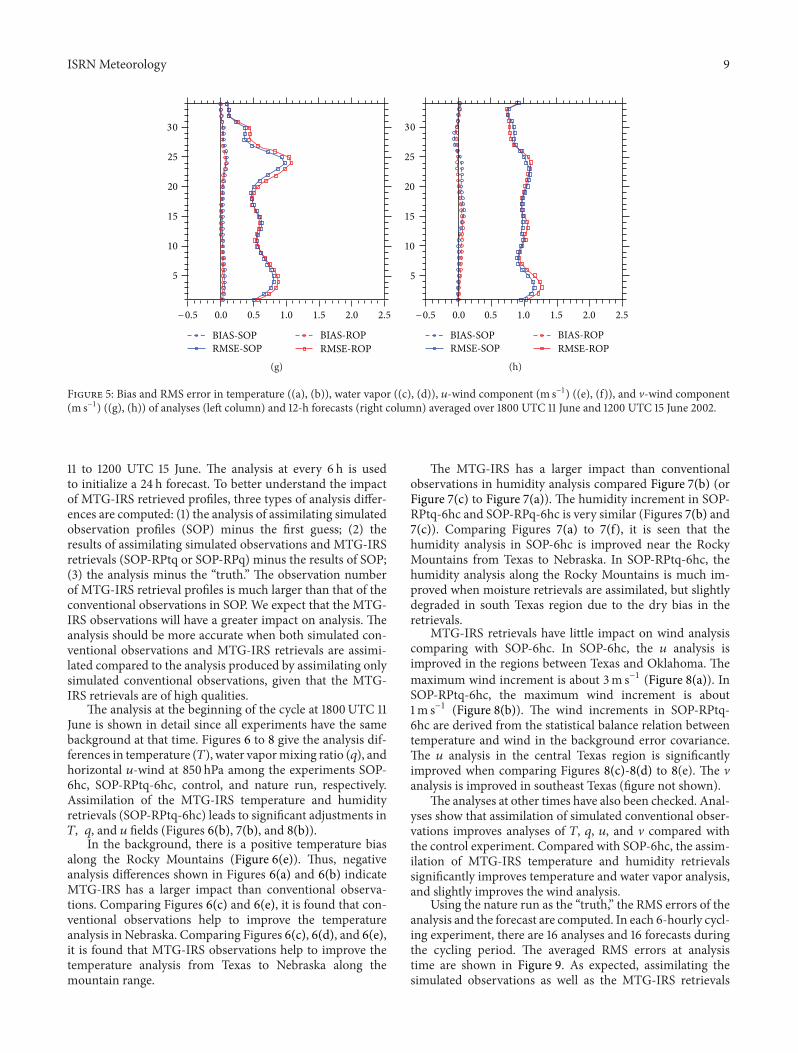
4.3. Calibration Experiments. To validate the performance ofthe designed OSSE, we first conducted a pair of calibrationexperiments ROP and SOP-6hc to compare the impacts fromassimilating real conventional observations to assimilatingcorresponding simulated observations. If the designed OSSEsystem works well, the assimilation of real observationswill yield similar error statistics in analyses and forecastscompared to the assimilation of simulated observations.Figure 5 shows the bias and RMS errors for temperature,water vapormixing ratio, and 𝑢-wind and V-wind componentof analyses and forecasts. Two sets of observations producesimilar error statistics. It indicates that the developed OSSEsystem performs reasonably well.
4.4. 6-Hourly Cycling Experiments. The WRF 3D-Var analy-ses were performed in cycling mode starting from 1800 UTC

8 ISRNMeteorology
30
25
20
15
10
−0.4 0.0 0.4 0.8 1.2 1.6 2.0
5
BIAS-SOPRMSE-SOP RMSE-ROP
BIAS-ROP
(a)
30
25
20
15
10
5
−0.4 0.0 0.4 0.8 1.2 1.6 2.0
BIAS-SOPRMSE-SOP RMSE-ROP
BIAS-ROP
(b)
30
25
20
15
10
5
−0.3 0.0 0.3 0.6 0.9 1.2 1.5
BIAS-SOPRMSE-SOP RMSE-ROP
BIAS-ROP
(c)
30
25
20
15
10
5
−0.3 0.0 0.3 0.6 0.9 1.2 1.5
BIAS-SOPRMSE-SOP RMSE-ROP
BIAS-ROP
(d)
30
25
20
15
10
5
BIAS-SOPRMSE-SOP RMSE-ROP
BIAS-ROP
−0.5 0.0 0.5 1.0 1.5 2.0 2.5
(e)
30
25
20
15
10
5
BIAS-SOPRMSE-SOP RMSE-ROP
BIAS-ROP
−0.5 0.0 0.5 1.0 1.5 2.0 2.5
(f)
Figure 5: Continued.
ISRNMeteorology 9
30
25
20
15
10
5
−0.5 0.0 0.5 1.0 1.5 2.0 2.5
BIAS-SOPRMSE-SOP RMSE-ROP
BIAS-ROP
(g)
30
25
20
15
10
5
−0.5 0.0 0.5 1.0 1.5 2.0 2.5
BIAS-SOPRMSE-SOP RMSE-ROP
BIAS-ROP
(h)
Figure 5: Bias and RMS error in temperature ((a), (b)), water vapor ((c), (d)), 𝑢-wind component (m s−1) ((e), (f)), and V-wind component(m s−1) ((g), (h)) of analyses (left column) and 12-h forecasts (right column) averaged over 1800 UTC 11 June and 1200 UTC 15 June 2002.
11 to 1200 UTC 15 June. The analysis at every 6 h is usedto initialize a 24 h forecast. To better understand the impactof MTG-IRS retrieved profiles, three types of analysis differ-ences are computed: (1) the analysis of assimilating simulatedobservation profiles (SOP) minus the first guess; (2) theresults of assimilating simulated observations and MTG-IRSretrievals (SOP-RPtq or SOP-RPq) minus the results of SOP;(3) the analysis minus the “truth.” The observation numberof MTG-IRS retrieval profiles is much larger than that of theconventional observations in SOP. We expect that the MTG-IRS observations will have a greater impact on analysis. Theanalysis should be more accurate when both simulated con-ventional observations and MTG-IRS retrievals are assimi-lated compared to the analysis produced by assimilating onlysimulated conventional observations, given that the MTG-IRS retrievals are of high qualities.
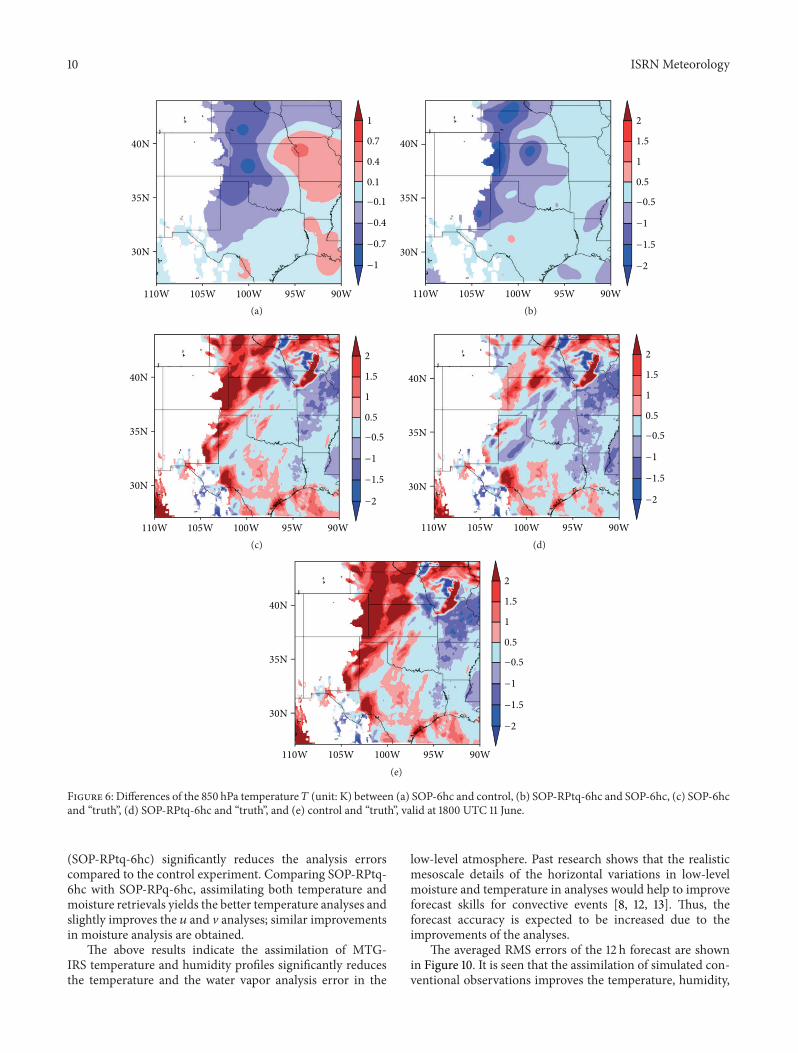
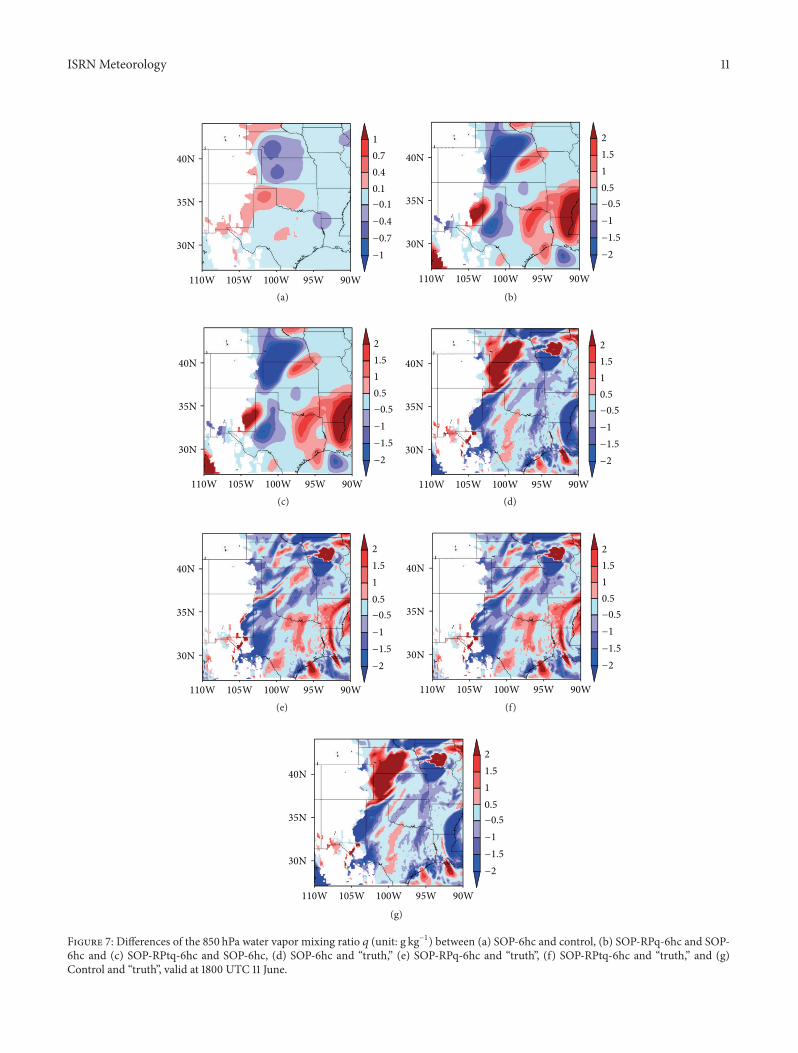
The analysis at the beginning of the cycle at 1800UTC 11June is shown in detail since all experiments have the samebackground at that time. Figures 6 to 8 give the analysis dif-ferences in temperature (𝑇), water vapormixing ratio (𝑞), andhorizontal 𝑢-wind at 850 hPa among the experiments SOP-6hc, SOP-RPtq-6hc, control, and nature run, respectively.Assimilation of the MTG-IRS temperature and humidityretrievals (SOP-RPtq-6hc) leads to significant adjustments in𝑇, 𝑞, and 𝑢 fields (Figures 6(b), 7(b), and 8(b)).
In the background, there is a positive temperature biasalong the Rocky Mountains (Figure 6(e)). Thus, negativeanalysis differences shown in Figures 6(a) and 6(b) indicateMTG-IRS has a larger impact than conventional observa-tions. Comparing Figures 6(c) and 6(e), it is found that con-ventional observations help to improve the temperatureanalysis in Nebraska. Comparing Figures 6(c), 6(d), and 6(e),it is found that MTG-IRS observations help to improve thetemperature analysis from Texas to Nebraska along themountain range.
The MTG-IRS has a larger impact than conventionalobservations in humidity analysis compared Figure 7(b) (orFigure 7(c) to Figure 7(a)). The humidity increment in SOP-RPtq-6hc and SOP-RPq-6hc is very similar (Figures 7(b) and7(c)). Comparing Figures 7(a) to 7(f), it is seen that thehumidity analysis in SOP-6hc is improved near the RockyMountains from Texas to Nebraska. In SOP-RPtq-6hc, thehumidity analysis along the Rocky Mountains is much im-proved when moisture retrievals are assimilated, but slightlydegraded in south Texas region due to the dry bias in theretrievals.
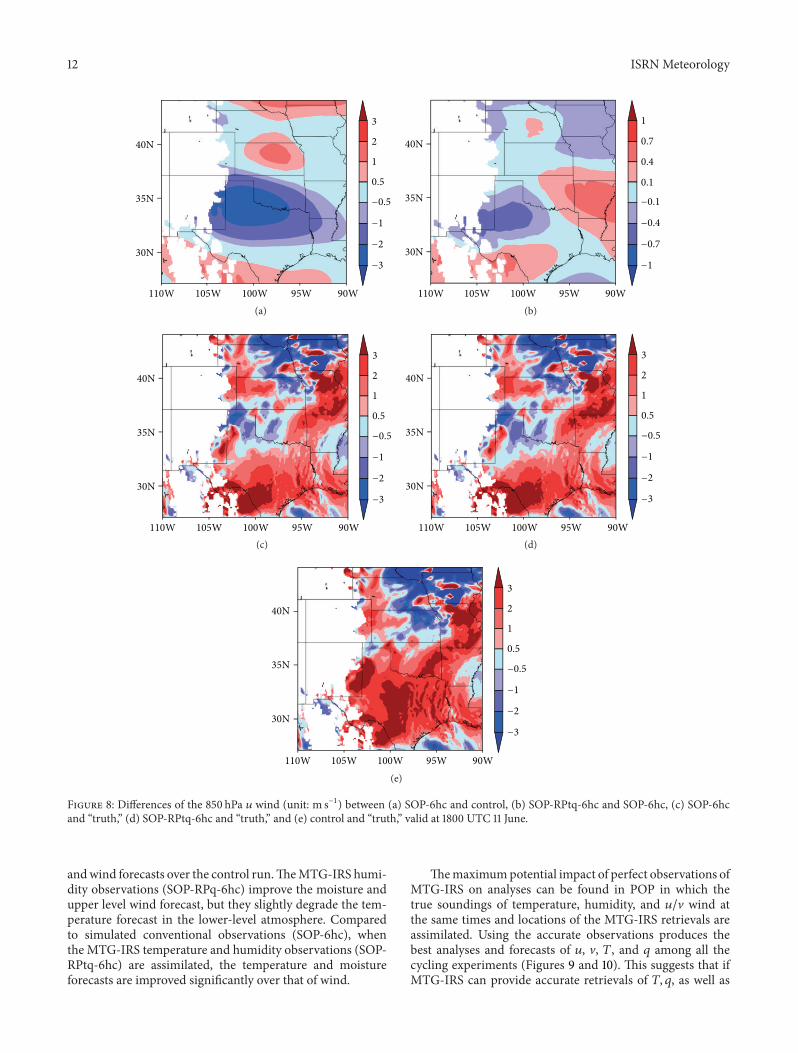
MTG-IRS retrievals have little impact on wind analysiscomparing with SOP-6hc. In SOP-6hc, the 𝑢 analysis isimproved in the regions between Texas and Oklahoma. Themaximum wind increment is about 3m s−1 (Figure 8(a)). InSOP-RPtq-6hc, the maximum wind increment is about1m s−1 (Figure 8(b)). The wind increments in SOP-RPtq-6hc are derived from the statistical balance relation betweentemperature and wind in the background error covariance.The 𝑢 analysis in the central Texas region is significantlyimproved when comparing Figures 8(c)-8(d) to 8(e). The Vanalysis is improved in southeast Texas (figure not shown).
The analyses at other times have also been checked. Anal-yses show that assimilation of simulated conventional obser-vations improves analyses of 𝑇, 𝑞, 𝑢, and V compared withthe control experiment. Compared with SOP-6hc, the assim-ilation of MTG-IRS temperature and humidity retrievalssignificantly improves temperature and water vapor analysis,and slightly improves the wind analysis.
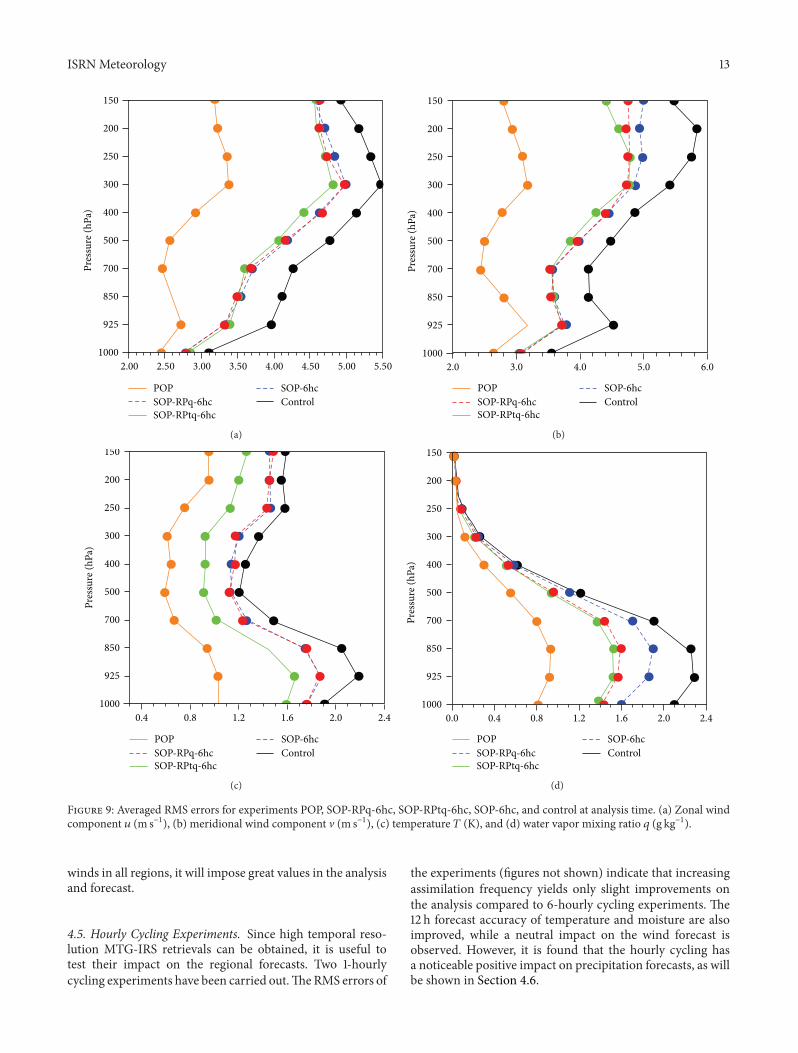
Using the nature run as the “truth,” the RMS errors of theanalysis and the forecast are computed. In each 6-hourly cycl-ing experiment, there are 16 analyses and 16 forecasts duringthe cycling period. The averaged RMS errors at analysistime are shown in Figure 9. As expected, assimilating thesimulated observations as well as the MTG-IRS retrievals
10 ISRNMeteorology
40N
35N
30N
110W 105W 100W 95W 90W
1
0.7
0.4
0.1
−0.1
−0.4
−0.7
−1
(a)
40N
35N
30N
110W 105W 100W 95W 90W
2
1.5
1
0.5
−0.5
−1
−1.5
−2
(b)
40N
35N
30N
110W 105W 100W 95W 90W
2
1.5
1
0.5
−0.5
−1
−1.5
−2
(c)
40N
35N
30N
110W 105W 100W 95W 90W
2
1.5
1
0.5
−0.5
−1
−1.5
−2
(d)
2
1.5
1
0.5
−0.5
−1
−1.5
−2
40N
35N
30N
110W 105W 100W 95W 90W(e)
Figure 6: Differences of the 850 hPa temperature 𝑇 (unit: K) between (a) SOP-6hc and control, (b) SOP-RPtq-6hc and SOP-6hc, (c) SOP-6hcand “truth”, (d) SOP-RPtq-6hc and “truth”, and (e) control and “truth”, valid at 1800 UTC 11 June.
(SOP-RPtq-6hc) significantly reduces the analysis errorscompared to the control experiment. Comparing SOP-RPtq-6hc with SOP-RPq-6hc, assimilating both temperature andmoisture retrievals yields the better temperature analyses andslightly improves the 𝑢 and V analyses; similar improvementsin moisture analysis are obtained.
The above results indicate the assimilation of MTG-IRS temperature and humidity profiles significantly reducesthe temperature and the water vapor analysis error in the
low-level atmosphere. Past research shows that the realisticmesoscale details of the horizontal variations in low-levelmoisture and temperature in analyses would help to improveforecast skills for convective events [8, 12, 13]. Thus, theforecast accuracy is expected to be increased due to theimprovements of the analyses.
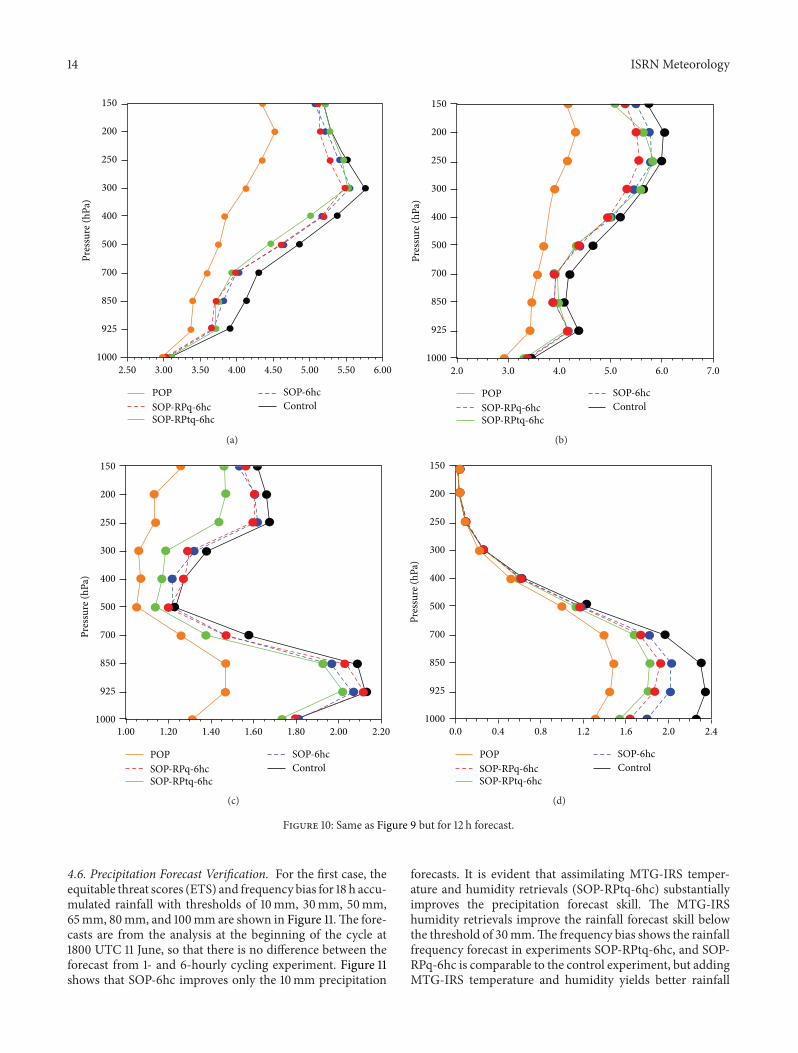
The averaged RMS errors of the 12 h forecast are shownin Figure 10. It is seen that the assimilation of simulated con-ventional observations improves the temperature, humidity,
ISRNMeteorology 11
40N
35N
30N
110W 105W 100W 95W 90W
1
0.7
0.4
0.1
−0.1
−0.4
−0.7
−1
(a)
40N
35N
30N
110W 105W 100W 95W 90W
2
1.5
1
0.5
−0.5
−1
−1.5
−2
(b)
40N
35N
30N
110W 105W 100W 95W 90W
2
1.5
1
0.5
−0.5
−1
−1.5
−2
(c)
40N
35N
30N
110W 105W 100W 95W 90W
2
1.5
1
0.5
−0.5
−1
−1.5
−2
(d)
40N
35N
30N
110W 105W 100W 95W 90W
2
1.5
1
0.5
−0.5
−1
−1.5
−2
(e)
40N
35N
30N
110W 105W 100W 95W 90W
2
1.5
1
0.5
−0.5
−1
−1.5
−2
(f)
40N
35N
30N
110W 105W 100W 95W 90W
2
1.5
1
0.5
−0.5
−1
−1.5
−2
(g)
Figure 7: Differences of the 850 hPa water vapor mixing ratio 𝑞 (unit: g kg−1) between (a) SOP-6hc and control, (b) SOP-RPq-6hc and SOP-6hc and (c) SOP-RPtq-6hc and SOP-6hc, (d) SOP-6hc and “truth,” (e) SOP-RPq-6hc and “truth”, (f) SOP-RPtq-6hc and “truth,” and (g)Control and “truth”, valid at 1800 UTC 11 June.
12 ISRNMeteorology
40N
35N
30N
110W 105W 100W 95W 90W
3
2
1
0.5
−0.5
−1
−2
−3
(a)
1
40N
35N
30N
110W 105W 100W 95W 90W
0.7
0.4
0.1
−0.1
−0.4
−0.7
−1
(b)
40N
35N
30N
110W 105W 100W 95W 90W
3
2
1
0.5
−0.5
−1
−2
−3
(c)
40N
35N
30N
110W 105W 100W 95W 90W
3
2
1
0.5
−0.5
−1
−2
−3
(d)
40N
35N
30N
110W 105W 100W 95W 90W
3
2
1
0.5
−0.5
−1
−2
−3
(e)
Figure 8: Differences of the 850 hPa 𝑢 wind (unit: m s−1) between (a) SOP-6hc and control, (b) SOP-RPtq-6hc and SOP-6hc, (c) SOP-6hcand “truth,” (d) SOP-RPtq-6hc and “truth,” and (e) control and “truth,” valid at 1800 UTC 11 June.
andwind forecasts over the control run.TheMTG-IRS humi-dity observations (SOP-RPq-6hc) improve the moisture andupper level wind forecast, but they slightly degrade the tem-perature forecast in the lower-level atmosphere. Comparedto simulated conventional observations (SOP-6hc), whenthe MTG-IRS temperature and humidity observations (SOP-RPtq-6hc) are assimilated, the temperature and moistureforecasts are improved significantly over that of wind.
Themaximumpotential impact of perfect observations ofMTG-IRS on analyses can be found in POP in which thetrue soundings of temperature, humidity, and 𝑢/V wind atthe same times and locations of the MTG-IRS retrievals areassimilated. Using the accurate observations produces thebest analyses and forecasts of 𝑢, V, 𝑇, and 𝑞 among all thecycling experiments (Figures 9 and 10). This suggests that ifMTG-IRS can provide accurate retrievals of 𝑇, 𝑞, as well as
ISRNMeteorology 13
150
200
250
300
400
500
700
850
925
1000
2.00 2.50 3.00 3.50 4.00 4.50 5.00 5.50
Pres
sure
(hPa
)
POPSOP-RPq-6hcSOP-RPtq-6hc
SOP-6hcControl
(a)
150
200
250
300
400
500
700
850
925
1000
Pres
sure
(hPa
)
POPSOP-RPq-6hcSOP-RPtq-6hc
SOP-6hcControl
2.0 3.0 4.0 5.0 6.0
(b)150
200
250
300
400
500
700
850
925
1000
Pres
sure
(hPa
)
POPSOP-RPq-6hcSOP-RPtq-6hc
SOP-6hcControl
0.4 0.8 1.2 1.6 2.0 2.4
(c)
150
200
250
300
400
500
700
850
925
1000
Pres
sure
(hPa
)
POPSOP-RPq-6hcSOP-RPtq-6hc
SOP-6hcControl
0.40.0 0.8 1.2 1.6 2.0 2.4
(d)
Figure 9: Averaged RMS errors for experiments POP, SOP-RPq-6hc, SOP-RPtq-6hc, SOP-6hc, and control at analysis time. (a) Zonal windcomponent 𝑢 (m s−1), (b) meridional wind component V (m s−1), (c) temperature 𝑇 (K), and (d) water vapor mixing ratio 𝑞 (g kg−1).
winds in all regions, it will impose great values in the analysisand forecast.
4.5. Hourly Cycling Experiments. Since high temporal reso-lution MTG-IRS retrievals can be obtained, it is useful totest their impact on the regional forecasts. Two 1-hourlycycling experiments have been carried out.TheRMS errors of
the experiments (figures not shown) indicate that increasingassimilation frequency yields only slight improvements onthe analysis compared to 6-hourly cycling experiments. The12 h forecast accuracy of temperature and moisture are alsoimproved, while a neutral impact on the wind forecast isobserved. However, it is found that the hourly cycling hasa noticeable positive impact on precipitation forecasts, as willbe shown in Section 4.6.
14 ISRNMeteorology
POPSOP-RPq-6hcSOP-RPtq-6hc
SOP-6hcControl
150
200
250
300
400
500
700
850
925
1000
Pres
sure
(hPa
)
2.50 3.00 3.50 4.00 4.50 5.00 5.50 6.00
(a)
150
200
250
300
400
500
700
850
925
1000
Pres
sure
(hPa
)
POPSOP-RPq-6hcSOP-RPtq-6hc
SOP-6hcControl
2.0 3.0 4.0 5.0 7.06.0
(b)
1.00 1.20 1.40 1.60 1.80 2.00 2.20
150
200
250
300
400
500
700
850
925
1000
Pres
sure
(hPa
)
POPSOP-RPq-6hcSOP-RPtq-6hc
SOP-6hcControl
(c)
150
200
250
300
400
500
700
850
925
1000
Pres
sure
(hPa
)
POPSOP-RPq-6hcSOP-RPtq-6hc
SOP-6hcControl
0.40.0 0.8 1.2 1.6 2.0 2.4
(d)
Figure 10: Same as Figure 9 but for 12 h forecast.
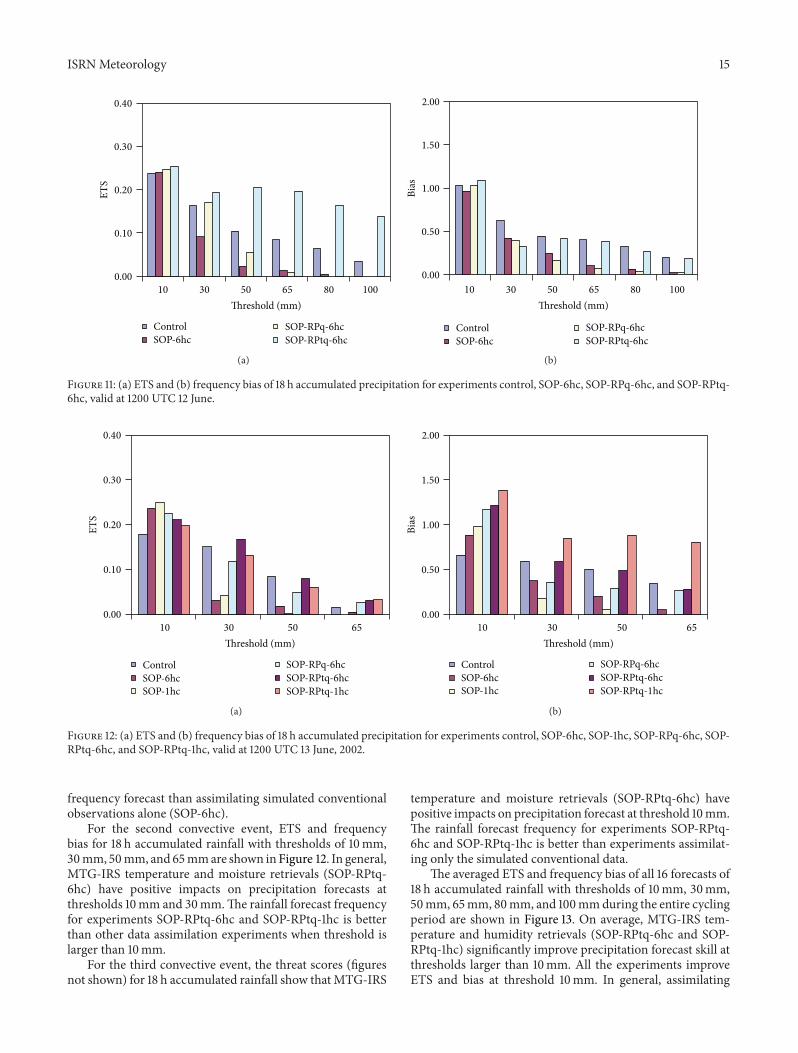
4.6. Precipitation Forecast Verification. For the first case, theequitable threat scores (ETS) and frequency bias for 18 h accu-mulated rainfall with thresholds of 10mm, 30mm, 50mm,65mm, 80mm, and 100mm are shown in Figure 11.The fore-casts are from the analysis at the beginning of the cycle at1800 UTC 11 June, so that there is no difference between theforecast from 1- and 6-hourly cycling experiment. Figure 11shows that SOP-6hc improves only the 10mm precipitation
forecasts. It is evident that assimilating MTG-IRS temper-ature and humidity retrievals (SOP-RPtq-6hc) substantiallyimproves the precipitation forecast skill. The MTG-IRShumidity retrievals improve the rainfall forecast skill belowthe threshold of 30mm.The frequency bias shows the rainfallfrequency forecast in experiments SOP-RPtq-6hc, and SOP-RPq-6hc is comparable to the control experiment, but addingMTG-IRS temperature and humidity yields better rainfall
ISRNMeteorology 15
ControlSOP-6hc
SOP-RPq-6hcSOP-RPtq-6hc
10 30 50 65 80 100
Threshold (mm)
0.40
0.30
0.20
0.10
0.00
ETS
(a)
2.00
1.50
1.00
0.50
0.00
Bias
10 30 50 65 80 100
Threshold (mm)
ControlSOP-6hc
SOP-RPq-6hcSOP-RPtq-6hc
(b)
Figure 11: (a) ETS and (b) frequency bias of 18 h accumulated precipitation for experiments control, SOP-6hc, SOP-RPq-6hc, and SOP-RPtq-6hc, valid at 1200 UTC 12 June.
ControlSOP-6hcSOP-1hc
SOP-RPq-6hcSOP-RPtq-6hcSOP-RPtq-1hc
0.40
0.30
0.20
0.10
0.00
10 30 50 65
Threshold (mm)
ETS
(a)
ControlSOP-6hcSOP-1hc
SOP-RPq-6hcSOP-RPtq-6hcSOP-RPtq-1hc
30 50 65
Threshold (mm)10
2.00
1.50
1.00
0.50
0.00
Bias
(b)
Figure 12: (a) ETS and (b) frequency bias of 18 h accumulated precipitation for experiments control, SOP-6hc, SOP-1hc, SOP-RPq-6hc, SOP-RPtq-6hc, and SOP-RPtq-1hc, valid at 1200 UTC 13 June, 2002.
frequency forecast than assimilating simulated conventionalobservations alone (SOP-6hc).
For the second convective event, ETS and frequencybias for 18 h accumulated rainfall with thresholds of 10mm,30mm, 50mm, and65mmare shown in Figure 12. In general,MTG-IRS temperature and moisture retrievals (SOP-RPtq-6hc) have positive impacts on precipitation forecasts atthresholds 10mm and 30mm.The rainfall forecast frequencyfor experiments SOP-RPtq-6hc and SOP-RPtq-1hc is betterthan other data assimilation experiments when threshold islarger than 10mm.
For the third convective event, the threat scores (figuresnot shown) for 18 h accumulated rainfall show thatMTG-IRS
temperature and moisture retrievals (SOP-RPtq-6hc) havepositive impacts on precipitation forecast at threshold 10mm.The rainfall forecast frequency for experiments SOP-RPtq-6hc and SOP-RPtq-1hc is better than experiments assimilat-ing only the simulated conventional data.
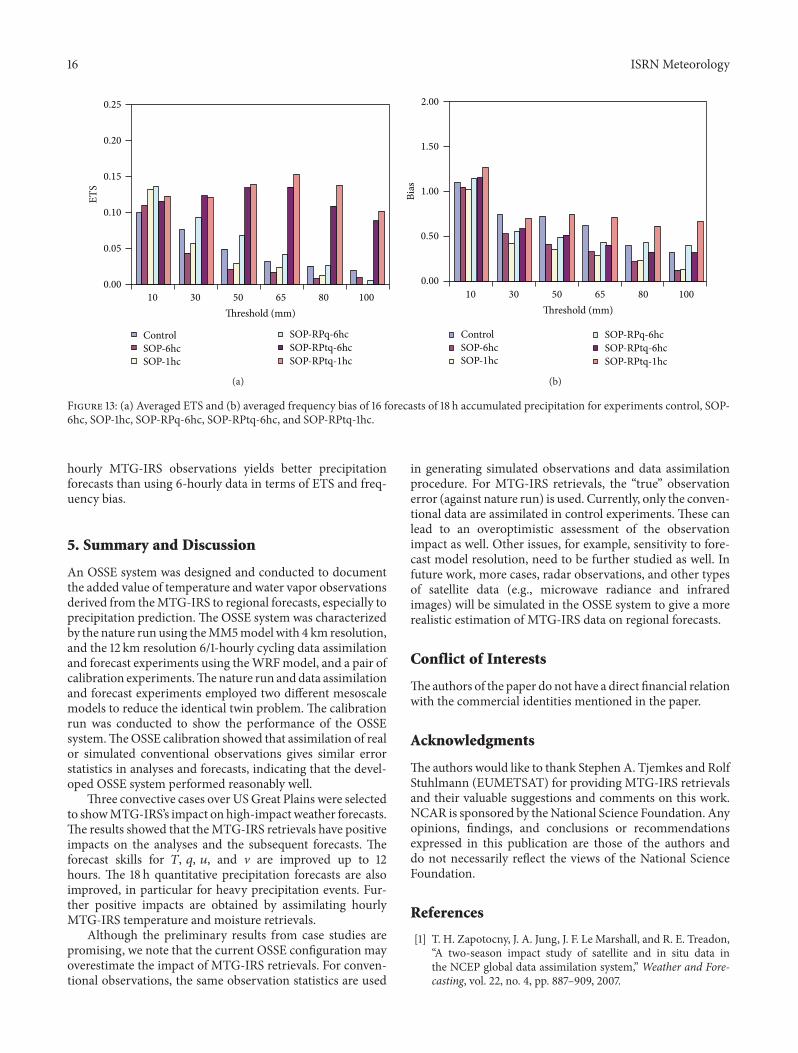
The averaged ETS and frequency bias of all 16 forecasts of18 h accumulated rainfall with thresholds of 10mm, 30mm,50mm, 65mm, 80mm, and 100mmduring the entire cyclingperiod are shown in Figure 13. On average, MTG-IRS tem-perature and humidity retrievals (SOP-RPtq-6hc and SOP-RPtq-1hc) significantly improve precipitation forecast skill atthresholds larger than 10mm. All the experiments improveETS and bias at threshold 10mm. In general, assimilating
16 ISRNMeteorology
ControlSOP-6hcSOP-1hc
SOP-RPq-6hcSOP-RPtq-6hcSOP-RPtq-1hc
Threshold (mm)10 30 50 65 80 100
0.25
0.20
0.15
0.10
0.05
0.00
ETS
(a)
ControlSOP-6hcSOP-1hc
SOP-RPq-6hcSOP-RPtq-6hcSOP-RPtq-1hc
Threshold (mm)10 30 50 65 80 100
2.00
1.50
1.00
0.50
0.00
Bias
(b)
Figure 13: (a) Averaged ETS and (b) averaged frequency bias of 16 forecasts of 18 h accumulated precipitation for experiments control, SOP-6hc, SOP-1hc, SOP-RPq-6hc, SOP-RPtq-6hc, and SOP-RPtq-1hc.
hourly MTG-IRS observations yields better precipitationforecasts than using 6-hourly data in terms of ETS and freq-uency bias.
5. Summary and Discussion
An OSSE system was designed and conducted to documentthe added value of temperature and water vapor observationsderived from theMTG-IRS to regional forecasts, especially toprecipitation prediction.The OSSE system was characterizedby the nature run using theMM5model with 4 km resolution,and the 12 km resolution 6/1-hourly cycling data assimilationand forecast experiments using theWRFmodel, and a pair ofcalibration experiments.Thenature run anddata assimilationand forecast experiments employed two different mesoscalemodels to reduce the identical twin problem. The calibrationrun was conducted to show the performance of the OSSEsystem.TheOSSE calibration showed that assimilation of realor simulated conventional observations gives similar errorstatistics in analyses and forecasts, indicating that the devel-oped OSSE system performed reasonably well.
Three convective cases over USGreat Plains were selectedto showMTG-IRS’s impact on high-impact weather forecasts.The results showed that theMTG-IRS retrievals have positiveimpacts on the analyses and the subsequent forecasts. Theforecast skills for 𝑇, 𝑞, 𝑢, and V are improved up to 12hours. The 18 h quantitative precipitation forecasts are alsoimproved, in particular for heavy precipitation events. Fur-ther positive impacts are obtained by assimilating hourlyMTG-IRS temperature and moisture retrievals.
Although the preliminary results from case studies arepromising, we note that the current OSSE configuration mayoverestimate the impact of MTG-IRS retrievals. For conven-tional observations, the same observation statistics are used
in generating simulated observations and data assimilationprocedure. For MTG-IRS retrievals, the “true” observationerror (against nature run) is used. Currently, only the conven-tional data are assimilated in control experiments. These canlead to an overoptimistic assessment of the observationimpact as well. Other issues, for example, sensitivity to fore-cast model resolution, need to be further studied as well. Infuture work, more cases, radar observations, and other typesof satellite data (e.g., microwave radiance and infraredimages) will be simulated in the OSSE system to give a morerealistic estimation of MTG-IRS data on regional forecasts.
Conflict of Interests
Theauthors of the paper do not have a direct financial relationwith the commercial identities mentioned in the paper.
Acknowledgments
The authors would like to thank Stephen A. Tjemkes and RolfStuhlmann (EUMETSAT) for providing MTG-IRS retrievalsand their valuable suggestions and comments on this work.NCAR is sponsored by theNational Science Foundation. Anyopinions, findings, and conclusions or recommendationsexpressed in this publication are those of the authors anddo not necessarily reflect the views of the National ScienceFoundation.
References
[1] T. H. Zapotocny, J. A. Jung, J. F. Le Marshall, and R. E. Treadon,“A two-season impact study of satellite and in situ data inthe NCEP global data assimilation system,” Weather and Fore-casting, vol. 22, no. 4, pp. 887–909, 2007.

ISRNMeteorology 17
[2] D. P. Dee, S.M. Uppala, A. J. Simmons, P. Berrisford, and P. Poli,“The ERA-Interim reanalysis: configuration and performanceof the data assimilation system,” Quarterly Journal of the RoyalMeteorological Society, vol. 137, pp. 553–597, 2011.
[3] P. Bauer, A. J. Geer, P. Lopez, and D. Salmond, “Direct 4D-Var assimilation of all-sky radiances. Part I: implementation,”Quarterly Journal of the Royal Meteorological Society, vol. 136,no. 652, pp. 1868–1885, 2010.
[4] F. Weng, T. Zhu, and B. Yan, “Satellite data assimilation innumerical weather prediction models. Part II: uses of rain-affected radiances from microwave observations for hurricanevortex analysis,” Journal of the Atmospheric Sciences, vol. 64, no.11, pp. 3910–3925, 2007.
[5] T. Vukicevic, T. Greenwald, M. Zupanski, D. Zupanski, T.Vonder Haar, and A. S. Jones, “Mesoscale cloud state estimationfrom visible and infrared satellite radiances,” Monthly WeatherReview, vol. 132, no. 12, pp. 3066–3077, 2004.
[6] T. Vukicevic, M. Sengupta, A. S. Jones, and T. Vonder Haar,“Cloud-resolving satellite data assimilation: information con-tent of IR window observations and uncertainties in estima-tion,” Journal of the Atmospheric Sciences, vol. 63, no. 3, pp. 901–919, 2006.
[7] S. Tjemkes, J. Grandell, R. Borde, and R. Stuhlmann, “Capa-bilities of the MTG-IRS candidate candidate mission to depicthorizontal moisture structures in Fourier transform spec-troscopy/hyperspectral imaging and sounding of the environ-ment,” OSA Technical Digest Series (CD) (Optical Society ofAmerica, 2007), paper JWA13, 2007.
[8] N. A. Crook, “Sensitivity of moist convection forced by bound-ary layer processes to low-level thermodynamic fields,”MonthlyWeather Review, vol. 124, no. 8, pp. 1767–1785, 1996.
[9] M. Xue and W. J. Martin, “A high-resolution modeling study ofthe 24 May 2002 dryline case during IHOP. Part II: horizontalconvective rolls and convective initiation,” Monthly WeatherReview, vol. 134, no. 1, pp. 172–191, 2006.
[10] S. E. Koch, A. Aksakal, and J. T. McQueen, “The influence ofmesoscale humidity and evapotranspiration fields on a modelforecast of a cold-frontal squall line,”Monthly Weather Review,vol. 125, pp. 384–409, 1997.
[11] D. B. Parsons, M. A. Shapiro, and E. Miller, “The mesoscalestructure of a nocturnal dryline andof a frontal-drylinemerger,”Monthly Weather Review, vol. 128, no. 11, pp. 3824–3838, 2000.
[12] T. M.Weckwerth, “The effect of small-scale moisture variabilityon thunderstorm initiation,”Monthly Weather Review, vol. 128,no. 12, pp. 4017–4030, 2000.
[13] T. M. Weckwerth, D. B. Parsons, S. E. Koch et al., “An overviewof the International H
2O project (IHOP 2002) and some
preliminary highlights,” Bulletin of the American MeteorologicalSociety, vol. 85, no. 2, pp. 253–277.
[14] M. Masutani, J. S. Woollen, S. J. Lord et al., “Observingsystem simulation experiments at the National Centers forEnvironmental Prediction,” Journal of Geophysical Research, vol.115, no. D7, Article ID D07101, 2010.
[15] L. Zhang and Z. Pu, “An Observing System Simulation Exper-iment (OSSE) to assess the impact of Doppler wind lidar(DWL)measurements on the numerical simulation of a tropicalcyclone,” Advances in Meteorology, vol. 2010, Article ID 743863,14 pages, 2010.
[16] S.-H. Chen, J.-Y. Chen, W.-Y. Chang, P.-L. Lin, P.-H. Lin,and W.-Y. Sun, “Observing system simulation experiment:
development of the system and preliminary results,” Journal ofGeophysical Research, vol. 116, Article ID D13202, 2011.
[17] X.-Y. Huang, F. Gao, N. Jacobs, and H. Wang, “Assimilation ofwind speed and direction observations: a new formulation andresults from idealized experiments,” Tellus A, vol. 65, Article ID19936, 2013.
[18] D. T.Dawson andM.Xue, “Numerical forecasts of the 15-16 June2002 southern plains mesoscale convective system: impact ofmesoscale data and cloud analysis,” Monthly Weather Review,vol. 134, no. 6, pp. 1607–1629, 2006.
[19] H.Wang, J. Sun, X. Zhang, X.-Y. Huang, and T. Auligne, “Radardata assimilation with WRF 4D-Var: part I. System develop-ment and preliminary testing,”Monthly Weather Review, 2013.
[20] J. Dudhia, “A nonhydrostatic version of the Penn State-NCARmesoscale model: validation tests and simulation of an Atlanticcyclone and cold front,”MonthlyWeather Review, vol. 121, no. 5,pp. 1493–1513, 1993.
[21] W. C. Skamarock, J. B. Klemp, J. Dudhia et al., “A description ofthe advanced research WRF version 3,” NCAR Tech. Note TN-475+STR, 2008.
[22] D. M. Barker, W. Huang, Y.-R. Guo, A. J. Bourgeois, and Q. N.Xiao, “A three-dimensional variational data assimilation systemfor MM5: implementation and initial results,”Monthly WeatherReview, vol. 132, pp. 897–914, 2004.
[23] X. Y. Huang, Q. Xiao, D. M. Barker et al., “Four-dimensionalvariational data assimilation forWRF: formulation and prelim-inary results,”Monthly Weather Review, vol. 137, no. 1, pp. 299–314, 2009.
[24] S. Y. Hong and H. L. Pan, “Nonlocal boundary layer verticaldiffusion in a medium-range forecast model,”Monthly WeatherReview, vol. 124, no. 10, pp. 2322–2339, 1996.
[25] J. Reisner, R. M. Rasmussen, and R. T. Bruintjes, “Explicitforecasting of supercooled liquid water in winter storms usingthe MM5 mesoscale model,” Quarterly Journal of the RoyalMeteorological Society, vol. 124, no. 548, pp. 1071–1107, 1998.
[26] S. Hannon, L. L. Strow, and W. W. McMillan, “Atmosphericinfrared fast transmittance models: a comparison of twoapproaches,” in Optical Spectroscopic Techniques and Instru-mentation for Atmospheric and Space Research II, vol. 2830 ofProceedings of SPIE, pp. 94–105, 1996.
[27] T. J. Schmit, M. M. Gunshor, W. P. Menzel, J. J. Gurka, J.Li, and A. S. Bachmeier, “Introducing the next-generationadvanced baseline imager onGOES-R,”Bulletin of the AmericanMeteorological Society, vol. 86, no. 8, pp. 1079–1096, 2005.
[28] J. Li, W. W. Wolf, W. P. Menzel, W. Zhang, H. L. Huang, and T.H. Achtor, “Global soundings of the atmosphere from ATOVSmeasurements: the algorithm and validation,” Journal of AppliedMeteorology, vol. 39, no. 8, pp. 1248–1268, 2000.
[29] S.-Y. Hong and J.-O. Lim, “The WRF single-moment micro-physics scheme (WSM6),” Journal of the Korean MeteorologicalSociety, vol. 42, pp. 129–151, 2006.
[30] G. A. Grell andD. Devenyi, “A generalized approach to parame-terizing convection combining ensemble and data assimilationtechniques,” Geophysical Research Letters, vol. 29, no. 14, article1693, 2002.
[31] D. F. Parrish and J. C. Derber, “The National Meteorologi-cal Center’s spectral statistical-interpolation analysis system,”Monthly Weather Review, vol. 120, no. 8, pp. 1747–1763, 1992.
[32] M. T. Chahine, H. Aumann, L. Goldberg et al., “AIRS-teamretrieval for core products and geophysical parameters, Level

18 ISRNMeteorology
2, Algorithm Theoretical Basis Document Version 2.2,” NASA,2001.
[33] G. Masiello, C. Serio, and P. Antonelli, “Inversion for atmo-spheric thermodynamical parameters of IASI data in theprincipal components space,” Quarterly Journal of the RoyalMeteorological Society, vol. 138, pp. 103–117, 2012.

Submit your manuscripts athttp://www.hindawi.com
Hindawi Publishing Corporationhttp://www.hindawi.com Volume 2014
ClimatologyJournal of
EcologyInternational Journal of
Hindawi Publishing Corporationhttp://www.hindawi.com Volume 2014
EarthquakesJournal of
Hindawi Publishing Corporationhttp://www.hindawi.com Volume 2014
Hindawi Publishing Corporationhttp://www.hindawi.com
Applied &EnvironmentalSoil Science
Volume 2014
Mining
Hindawi Publishing Corporationhttp://www.hindawi.com Volume 2014
Journal of
Hindawi Publishing Corporation http://www.hindawi.com Volume 2014
International Journal of
Geophysics
OceanographyInternational Journal of
Hindawi Publishing Corporationhttp://www.hindawi.com Volume 2014
Journal of Computational Environmental SciencesHindawi Publishing Corporationhttp://www.hindawi.com Volume 2014
Journal ofPetroleum Engineering
Hindawi Publishing Corporationhttp://www.hindawi.com Volume 2014
GeochemistryHindawi Publishing Corporationhttp://www.hindawi.com Volume 2014
Journal of
Atmospheric SciencesInternational Journal of
Hindawi Publishing Corporationhttp://www.hindawi.com Volume 2014
OceanographyHindawi Publishing Corporationhttp://www.hindawi.com Volume 2014
Advances in
Hindawi Publishing Corporationhttp://www.hindawi.com Volume 2014
MineralogyInternational Journal of
Meteorology
Hindawi Publishing Corporationhttp://www.hindawi.com Volume 2014
Advances in
The Scientific World JournalHindawi Publishing Corporation http://www.hindawi.com Volume 2014
Paleontology JournalHindawi Publishing Corporationhttp://www.hindawi.com Volume 2014
ScientificaHindawi Publishing Corporationhttp://www.hindawi.com Volume 2014
Hindawi Publishing Corporationhttp://www.hindawi.com
Volume 2014
Geological ResearchJournal of
Hindawi Publishing Corporationhttp://www.hindawi.com Volume 2014
Geology Advances in
Related Documents