© 2016 Adobe Systems Incorporated. All Rights Reserved. ADOBE DIGITAL ECONOMY PROJECT OCTOBER 2016 UPDATE

Welcome message from author
This document is posted to help you gain knowledge. Please leave a comment to let me know what you think about it! Share it to your friends and learn new things together.
Transcript

© 2016 Adobe Systems Incorporated. All Rights Reserved.
ADOBE DIGITAL ECONOMY PROJECTOCTOBER 2016 UPDATE
© 2016 Adobe Systems Incorporated. All Rights Reserved.© 2016 Adobe Systems Incorporated. All Rights Reserved.
Main takeaways: October
2
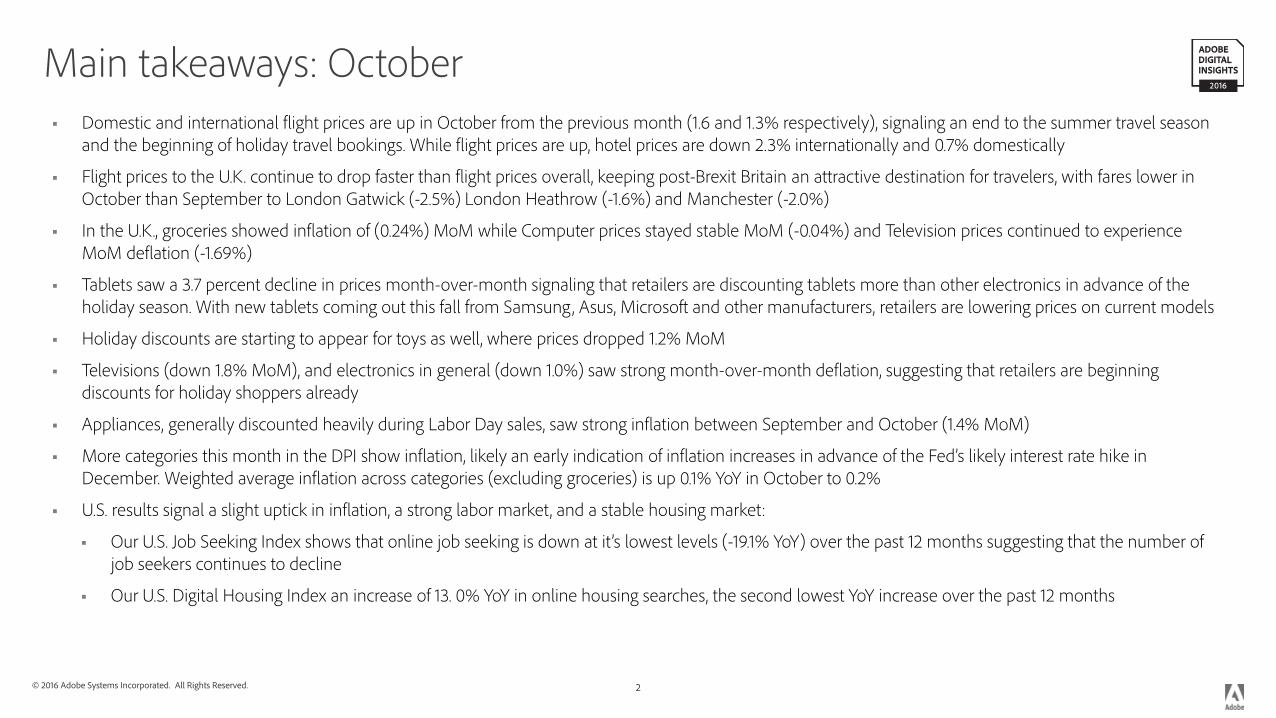
Domestic and international flight prices are up in October from the previous month (1.6 and 1.3% respectively), signaling an end to the summer travel season and the beginning of holiday travel bookings. While flight prices are up, hotel prices are down 2.3% internationally and 0.7% domestically
Flight prices to the U.K. continue to drop faster than flight prices overall, keeping post-Brexit Britain an attractive destination for travelers, with fares lower in October than September to London Gatwick (-2.5%) London Heathrow (-1.6%) and Manchester (-2.0%)
In the U.K., groceries showed inflation of (0.24%) MoM while Computer prices stayed stable MoM (-0.04%) and Television prices continued to experience MoM deflation (-1.69%)
Tablets saw a 3.7 percent decline in prices month-over-month signaling that retailers are discounting tablets more than other electronics in advance of the holiday season. With new tablets coming out this fall from Samsung, Asus, Microsoft and other manufacturers, retailers are lowering prices on current models
Holiday discounts are starting to appear for toys as well, where prices dropped 1.2% MoM
Televisions (down 1.8% MoM), and electronics in general (down 1.0%) saw strong month-over-month deflation, suggesting that retailers are beginning discounts for holiday shoppers already
Appliances, generally discounted heavily during Labor Day sales, saw strong inflation between September and October (1.4% MoM)
More categories this month in the DPI show inflation, likely an early indication of inflation increases in advance of the Fed’s likely interest rate hike in December. Weighted average inflation across categories (excluding groceries) is up 0.1% YoY in October to 0.2%
U.S. results signal a slight uptick in inflation, a strong labor market, and a stable housing market:
Our U.S. Job Seeking Index shows that online job seeking is down at it’s lowest levels (-19.1% YoY) over the past 12 months suggesting that the number of job seekers continues to decline
Our U.S. Digital Housing Index an increase of 13. 0% YoY in online housing searches, the second lowest YoY increase over the past 12 months

© 2016 Adobe Systems Incorporated. All Rights Reserved.© 2016 Adobe Systems Incorporated. All Rights Reserved.
Adobe Digital Insights Background
Based on analysis of aggregated and anonymous data from Adobe Marketing Cloud:• Adobe Analytics and Adobe Mobile Services
Thousands of brands worldwide including two thirds of Fortune 50 companies rely on Adobe Marketing Cloud:• $7.50 of every $10 spent online with top 500 U.S. retailers go through Adobe Marketing Cloud **• Adobe Marketing Cloud powers:
• 20 of the top 30 U.S. employers• 9 of 10 largest hotel groups• 7 of 10 largest airlines
** Latest IR Top 500 Report 2015
3
AdobeAnalytics
AdobeMobile Services

© 2016 Adobe Systems Incorporated. All Rights Reserved.© 2016 Adobe Systems Incorporated. All Rights Reserved.
Economist Advisors
4
Austan Goolsbee, University of Chicago Robert P. Gwinn Professor of Economics at The University of Chicago's Booth School of Business
Formerly served as President Obama’s Chairman of the Council of Economic Advisers
The youngest member of the cabinet of President Obama
Pete Klenow, Stanford University Professor, Department of Economics, Stanford University
Currently Visiting Scholar, Federal Reserve Bank of San Francisco
Member of editorial boards for Econometrica, American Economic Review, Quarterly Journal of Economics and others
© 2016 Adobe Systems Incorporated. All Rights Reserved.© 2016 Adobe Systems Incorporated. All Rights Reserved. 5
Digital Price Index(DPI)
Job Seeking Index(JSI)
Digital Housing Index(DHI)

© 2016 Adobe Systems Incorporated. All Rights Reserved.© 2016 Adobe Systems Incorporated. All Rights Reserved. 6
Digital Price Index(DPI)
© 2016 Adobe Systems Incorporated. All Rights Reserved.© 2016 Adobe Systems Incorporated. All Rights Reserved.
Methodology – U.K.
7
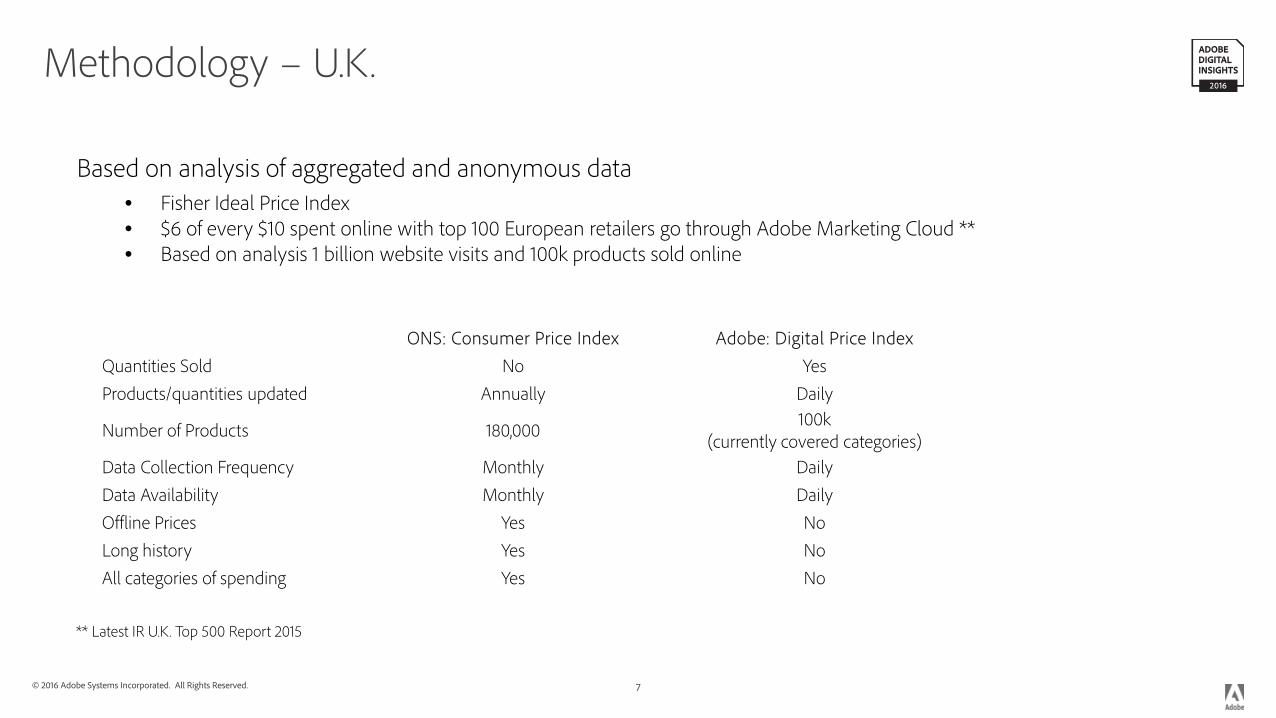
Based on analysis of aggregated and anonymous data• Fisher Ideal Price Index• $6 of every $10 spent online with top 100 European retailers go through Adobe Marketing Cloud **• Based on analysis 1 billion website visits and 100k products sold online
ONS: Consumer Price Index Adobe: Digital Price IndexQuantities Sold No YesProducts/quantities updated Annually Daily
Number of Products 180,000 100k(currently covered categories)
Data Collection Frequency Monthly DailyData Availability Monthly DailyOffline Prices Yes NoLong history Yes NoAll categories of spending Yes No
** Latest IR U.K. Top 500 Report 2015

© 2016 Adobe Systems Incorporated. All Rights Reserved.© 2016 Adobe Systems Incorporated. All Rights Reserved.
Adobe DPI in the United Kingdom
8
• Our Digital Price Index in the U.K. for groceries shows that grocery prices have deflated by 2.3% YoY in October. Prices increased 0.24% between September and October, the second biggest increase in food prices in the U.K over the past 12 months
• For computers, we see YoY deflation of 11.9%. Deflation in this category continues to slow, as deflation is nearly zero this month at -0.04%, down from -0.34% in September and -0.77% in October.
• Similarly TV prices in the UK continue to fall; the DPI shows YoY deflation of 22.7% between October 2015 to October 2016. Prices are declining faster this month (down 1.69% in October) than they were between August and September (down 1.34%) suggesting that Brexit impacts on durables imports have yet to be realized

© 2016 Adobe Systems Incorporated. All Rights Reserved.© 2016 Adobe Systems Incorporated. All Rights Reserved.
Methodology – U.S.
9
Based on analysis of aggregated and anonymous data• Fisher Ideal Price Index• Adobe measures 80% of all online transactions from top 100 U.S. retailers ** • $7.50 of every $10 spent online with top 500 U.S. retailers go through Adobe Marketing Cloud **• Based on analysis of 15 billion website visits and 2.2 million products sold online
BLS: Consumer Price Index BEA: Personal Consumption Expenditures Adobe: Digital Price Index
Quantities Sold No No YesProducts/quantities updated Every 2 years Monthly Daily
Number of Products 83 thousand (all categories) 83 thousand (all categories) 2.2 million (currently covered categories)
Data Collection Frequency Bi-Monthly Monthly DailyData Availability Monthly Monthly DailyOffline Prices Yes Yes NoLong history Yes Yes NoAll categories of spending Yes Yes NoIndex Type Laspeyeres Fisher Ideal Fisher Ideal
** Latest IR Top 500 Report 2015
© 2016 Adobe Systems Incorporated. All Rights Reserved.© 2016 Adobe Systems Incorporated. All Rights Reserved.
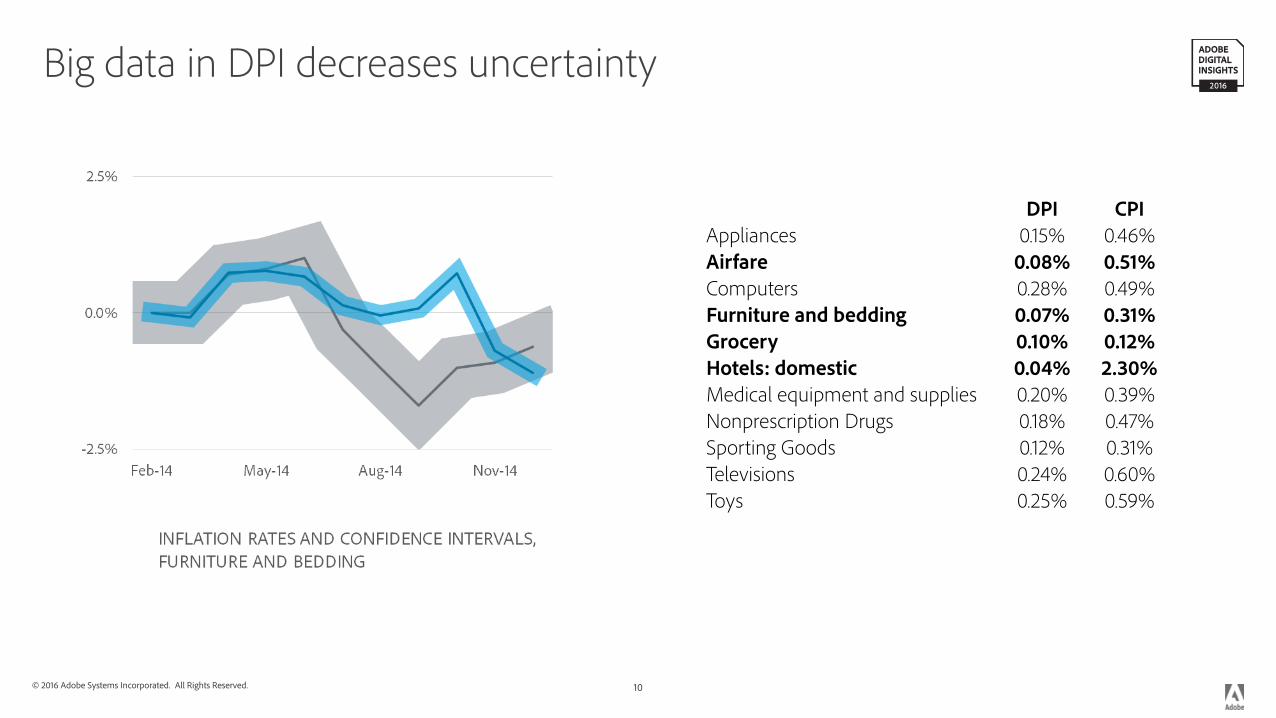
Big data in DPI decreases uncertainty
10
DPI CPIAppliances 0.15% 0.46%Airfare 0.08% 0.51%Computers 0.28% 0.49%Furniture and bedding 0.07% 0.31%Grocery 0.10% 0.12%Hotels: domestic 0.04% 2.30%Medical equipment and supplies 0.20% 0.39%Nonprescription Drugs 0.18% 0.47%Sporting Goods 0.12% 0.31%Televisions 0.24% 0.60%Toys 0.25% 0.59%

© 2016 Adobe Systems Incorporated. All Rights Reserved.© 2016 Adobe Systems Incorporated. All Rights Reserved.
Inflation rates by price ranges
11
• Televisions have seen higher-ticket items deflate faster than lower-ticket items
• In computers, models priced above $1,200 showing the least deflation in the category
• Price bins are determined based on the price the product had when originally launched (first price).

© 2016 Adobe Systems Incorporated. All Rights Reserved.© 2016 Adobe Systems Incorporated. All Rights Reserved.
The Importance of detail: Black Friday
12
• DPI captures the effect of major discount holidays like Black Friday and Cyber Monday because it measures quantities and does so in real-time
• Lowest prices for TVs in 2015 were Thanksgiving and Black Friday
• Data demonstrates retailers trying to start sales earlier – the Sunday and Monday before Thanksgiving saw low prices

© 2016 Adobe Systems Incorporated. All Rights Reserved.© 2016 Adobe Systems Incorporated. All Rights Reserved.
Measuring rapidly shifting consumer preferences
13
• Electronics see an average of 77% of online spend on new* products**
• 17% of monthly online spend for groceries on new products
* Products that have been available for 1 year or less** A product is defined as an item for purchase which has an unique identifier (such as a SKU)

© 2016 Adobe Systems Incorporated. All Rights Reserved.© 2016 Adobe Systems Incorporated. All Rights Reserved.
September 2016 Recap
14
MoM: August to September
MoM: August to September
Difference (percentage)
Same Sign?
YoY: Cumulative September 2015-2016
YoY: Cumulative September 2015-2016
Difference (percentage)
Same Sign?
DPI CPI DPI vs. CPI DPI vs. CPI DPI CPI DPI vs. CPI DPI vs. CPIAppliances -1.5% -0.3% -1.2% Yes -6.1% -3.7% -2.4% YesComputers 1.4% -0.3% 1.7% No -10.2% -7.6% -2.6% YesDomestic Hotels -0.3% -2.7% 2.4% Yes 1.0% 3.0% -2.0% YesFlights 1.3% -0.2% 1.5% No -3.1% -2.9% -0.2% YesFurniture and bedding -0.1% 0.2% -0.3% No -3.4% -3.2% -0.2% YesGrocery 0.2% 0.0% 0.2% Yes -1.0% -2.2% 1.2% YesMedical equipment and supplies 0.3% -0.7% 1.0% No -0.9% -0.6% -0.3% YesNonprescription Drugs 0.1% 0.8% -0.7% Yes 0.2% -0.5% 0.7% NoSporting Goods -0.4% -0.3% -0.1% Yes -5.5% -2.2% -3.3% YesTelevisions -1.0% -3.0% 2.0% Yes -20.8% -21.9% 1.1% YesToys -0.8% -1.4% 0.6% Yes -6.0% -9.0% 3.0% Yes

© 2016 Adobe Systems Incorporated. All Rights Reserved.© 2016 Adobe Systems Incorporated. All Rights Reserved.
October 2016 Summary
15
• Main deflation in September:• Tablets, international hotels, televisions,
electronics
• Main inflation in September:• Domestic flights, international flights,
appliances
YoY MoM
Appliances -6.2% 1.4%Computers -9.9% 0.5%Electronics -10.9% -1.0%Flights -2.9% 1.5%Domestic Flights -5.5% 1.6%Intl Flights 1.1% 1.3%Furniture and bedding -3.1% 0.2%Grocery -0.9% 0.0%Domestic Hotels 2.9% -0.7%Intl Hotels -3.4% -2.3%Medical equipment and supplies -1.0% 0.8%Nonprescription Drugs -0.1% 0.3%Sporting Goods -4.9% -0.1%Tablet -22.5% -3.7%Televisions -21.9% -1.8%Toys -6.0% -1.2%Weighted Average Inflation* -1.7% 0.1%Weighted Aggregate Inflation, Less Grocery** -3.4% 0. 2%
* Weighted average inflation is calculated using CPI-U relative component weights (2014-2015) across the shared categories in the DPI and the CPI ** Grocery is a large component of the CPI weights, so changes in grocery prices drive the majority of weighted average inflation.

© 2016 Adobe Systems Incorporated. All Rights Reserved.© 2016 Adobe Systems Incorporated. All Rights Reserved.
Appliances
16
• Adobe DPI shows cumulative deflation of -6.2% YoY (October 2015 to October 2016)
• Main YoY price decreases for Appliances priced between $600 and $1000
• For October 2016, prices increased 1.4% vs September 2016 MoM between $600 and $1000:-6.9 , between $0 and $200:-3.2
METHODOLOGY:
• The data used contains transactions for ~110 K products• Products include large appliances such as fridges, ovens, washers, dryers as well as smaller appliances such as vacuums, mixers, blenders etc.

© 2016 Adobe Systems Incorporated. All Rights Reserved.© 2016 Adobe Systems Incorporated. All Rights Reserved.
Airfare
17
• Adobe DPI shows cumulative deflation of -2.9% YoY (October 2015 to October 2016)
• For October 2016, prices increased 1.5% vs September 2016 MoM
METHODOLOGY:
• The data used contains transactions for ~370 K flight routes• Includes associated fees, where applicable

© 2016 Adobe Systems Incorporated. All Rights Reserved.© 2016 Adobe Systems Incorporated. All Rights Reserved.
Airfare: domestic
18
• Adobe DPI shows cumulative deflation of -5.5% YoY (October 2015 to October 2016)
• For October 2016, prices increased 1.6% vs September 2016 MoM
METHODOLOGY:
• The data used contains transactions for ~370 K flight routes• Includes associated fees, where applicable

© 2016 Adobe Systems Incorporated. All Rights Reserved.© 2016 Adobe Systems Incorporated. All Rights Reserved.
Airfare: international
19
• Adobe DPI shows cumulative inflation of 1.1% YoY (October 2015 to October 2016)
• Flight prices showed continued decline to Europe (-1.9% MoM) and Oceania (-1.7%)
• Largest price increases were to South America (5.9% MoM)
• For October 2016, prices increased 1.3% vs September 2016 MoM
METHODOLOGY:
• The data used contains transactions for ~370 K flight routes• Includes associated fees, where applicable

© 2016 Adobe Systems Incorporated. All Rights Reserved.© 2016 Adobe Systems Incorporated. All Rights Reserved.
Electronics
20
• Adobe DPI shows cumulative deflation of -10.9% YoY (October 2015 to October 2016)
• Main YoY price decreases for Electronics priced between $200 and $500
• For October 2016, prices decreased -1.0% vs September 2016 MoM between $200 and $500:-12.5 , between $0 and $200:-6.0
METHODOLOGY:
• The data used contains transactions for ~1 M products• Products span across dozens of different categories such as televisions, laptops, Blu-ray players, desktops, tablets, wearables, headphones, video games, printers etc..

© 2016 Adobe Systems Incorporated. All Rights Reserved.© 2016 Adobe Systems Incorporated. All Rights Reserved.
Electronics: computers
21
• Adobe DPI shows cumulative deflation of -9.9% YoY (October 2015 to October 2016)
• Main YoY price decreases for Computers priced between $700 and $1200
• For October 2016, prices increased 0.5% vs September 2016 MoM between $700 and $1200:-14.3 , greater than $1600:-1.3
METHODOLOGY:
• The data used contains transactions for ~1 M products• Products span across dozens of different categories such as televisions, laptops, Blu-ray players, desktops, tablets, wearables, headphones, video games, printers etc..

© 2016 Adobe Systems Incorporated. All Rights Reserved.© 2016 Adobe Systems Incorporated. All Rights Reserved.
Electronics: televisions
22
• Adobe DPI shows cumulative deflation of -21.9% YoY (October 2015 to October 2016)
• Main YoY price decreases for Televisions priced greater than $2000
• For October 2016, prices decreased -1.8% vs September 2016 MoM greater than $2000:-30.6 , between $300 and $600:-15.8
METHODOLOGY:
• The data used contains transactions for ~1 M products• Products span across dozens of different categories such as televisions, laptops, Blu-ray players, desktops, tablets, wearables, headphones, video games, printers etc..

© 2016 Adobe Systems Incorporated. All Rights Reserved.© 2016 Adobe Systems Incorporated. All Rights Reserved.
Electronics: tablets
23
• Adobe DPI shows cumulative deflation of -22.5% YoY (October 2015 to October 2016)
• Main YoY price decreases for Tablets priced between $550 and $900
• For October 2016, prices decreased -3.7% vs September 2016 MoM between $550 and $900:-25.9 , greater than $900:-12.7
METHODOLOGY:
• The data used contains transactions for ~1 M products• Products span across dozens of different categories such as televisions, laptops, Blu-ray players, desktops, tablets, wearables, headphones, video games, printers etc..

© 2016 Adobe Systems Incorporated. All Rights Reserved.© 2016 Adobe Systems Incorporated. All Rights Reserved.
Furniture and Bedding
24
• Adobe DPI shows cumulative deflation of -3.1% YoY (October 2015 to October 2016)
• Main YoY price decreases for Furniture and bedding priced between $150 and $250
• For October 2016, prices increased 0.2% vs September 2016 MoM between $150 and $250:-5.0 , greater than $750:-2.1
METHODOLOGY:
• The data used contains transactions for ~173 K products• Products include interior and exterior furniture, mattresses and other bedding products

© 2016 Adobe Systems Incorporated. All Rights Reserved.© 2016 Adobe Systems Incorporated. All Rights Reserved.
Groceries
25
• Adobe DPI shows cumulative deflation of -0.9% YoY (October 2015 to October 2016)
• For October 2016, prices increased 0.0% vs September 2016 MoM
METHODOLOGY:
• Our dataset covers an estimated 30-40% of all online grocery purchases. It contains transactions for ~195k products• The mix of grocery products bought online is not the same as offline – the top category for online shopping is drinks (nonalcoholic), while for offline shopping it is meat

© 2016 Adobe Systems Incorporated. All Rights Reserved.© 2016 Adobe Systems Incorporated. All Rights Reserved.
Hotels: domestic
26
METHODOLOGY:
• The data used contains transactions for ~250 K hotel properties• Includes associated fees, where applicable
• Adobe DPI shows cumulative inflation of 2.9% YoY (October 2015 to October 2016)
• For October 2016, prices decreased -0.7% vs September 2016 MoM
© 2016 Adobe Systems Incorporated. All Rights Reserved.© 2016 Adobe Systems Incorporated. All Rights Reserved.
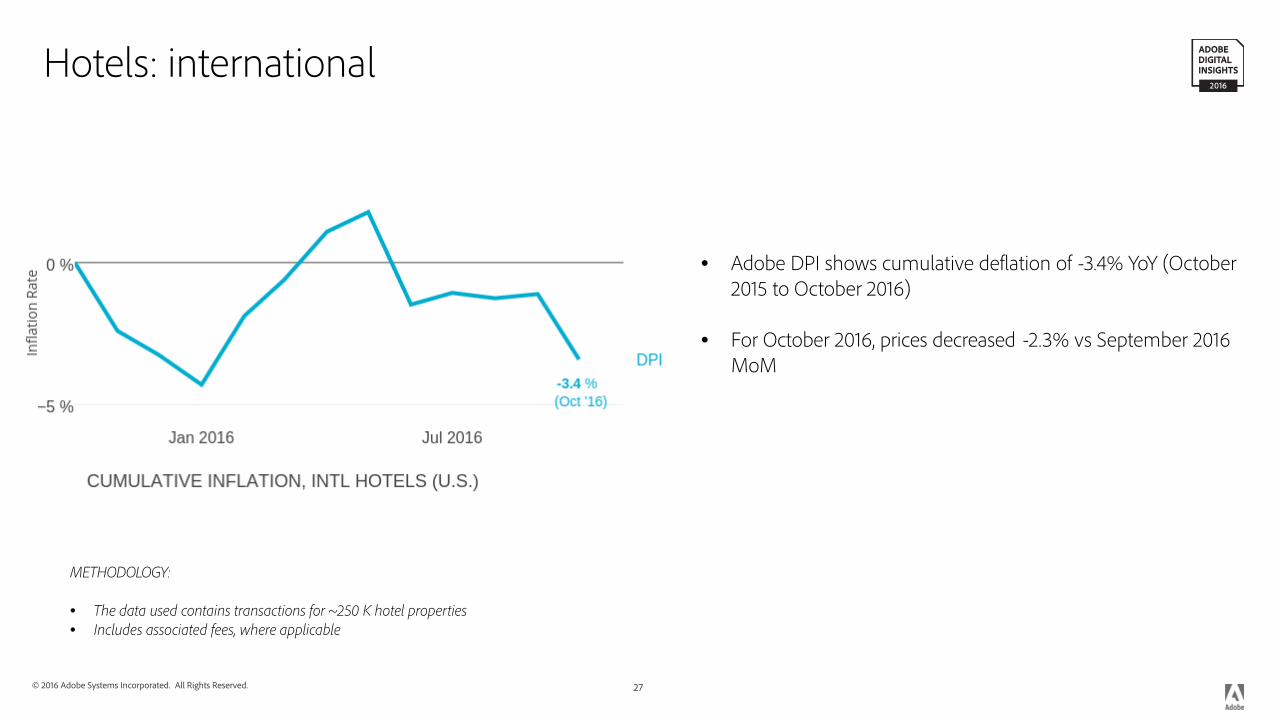
Hotels: international
27
METHODOLOGY:
• The data used contains transactions for ~250 K hotel properties• Includes associated fees, where applicable
• Adobe DPI shows cumulative deflation of -3.4% YoY (October 2015 to October 2016)
• For October 2016, prices decreased -2.3% vs September 2016 MoM

© 2016 Adobe Systems Incorporated. All Rights Reserved.© 2016 Adobe Systems Incorporated. All Rights Reserved.
Medical Equipment and Supplies
28
• Adobe DPI shows cumulative deflation of -1.0% YoY (October 2015 to October 2016)
• Main YoY price decreases for Medical equipment and supplies priced between $45 and $135
• Main YoY price increases for Medical equipment and supplies priced between $0 and $10
• For October 2016, prices increased 0.8% vs September 2016 MoM between $45 and $135:-4.2 , between $0 and $10:0.6
METHODOLOGY:
• The data used contains transactions for 6,000 products• ” includes supportive and convalescent equipment, dressings and first aid kits, and medical equipment for general use

© 2016 Adobe Systems Incorporated. All Rights Reserved.© 2016 Adobe Systems Incorporated. All Rights Reserved.
Nonprescription drugs
29
• Adobe DPI shows cumulative deflation of -0.1% YoY (October 2015 to October 2016)
• Main YoY price decreases for Nonprescription Drugs priced greater than $40
• Main YoY price increases for Nonprescription Drugs priced between $15 and $25
• For October 2016, prices increased 0.3% vs September 2016 MoM greater than $40:-0.8 , between $15 and $25:0.9
METHODOLOGY:
• The data used contains transactions for 16 K products• Includes all non-prescription medicines taken by swallowing, applying on your skin (such as topicals), inhaling, as suppositories, or enemas.

© 2016 Adobe Systems Incorporated. All Rights Reserved.© 2016 Adobe Systems Incorporated. All Rights Reserved.
Sporting Goods
30
• Adobe DPI shows cumulative deflation of -4.9% YoY (October 2015 to October 2016)
• Main YoY price decreases for Sporting Goods priced between $40 and $100
• For October 2016, prices decreased -0.1% vs September 2016 MoM between $40 and $100:-7.3 , between $0 and $40:-3.7
METHODOLOGY:
• The data used contains transactions for ~300 K products• Products include small equipment and accessories (balls, gloves, uniforms) as well as large equipment such as treadmills, weightlifting tools etc.

© 2016 Adobe Systems Incorporated. All Rights Reserved.© 2016 Adobe Systems Incorporated. All Rights Reserved.
Toys
31
• Adobe DPI shows cumulative deflation of -6.0% YoY (October 2015 to October 2016)
• Main YoY price decreases for Toys priced between $0 and $30
• For October 2016, prices decreased -1.2% vs September 2016 MoM between $0 and $30:-7.7 , greater than $300:-0.3
METHODOLOGY:
• The data used contains transactions for ~249 K products• Products include toys, games as well as playground equipment

© 2016 Adobe Systems Incorporated. All Rights Reserved.© 2016 Adobe Systems Incorporated. All Rights Reserved. 32
Job Seeking Index(JSI)
© 2016 Adobe Systems Incorporated. All Rights Reserved.© 2016 Adobe Systems Incorporated. All Rights Reserved.
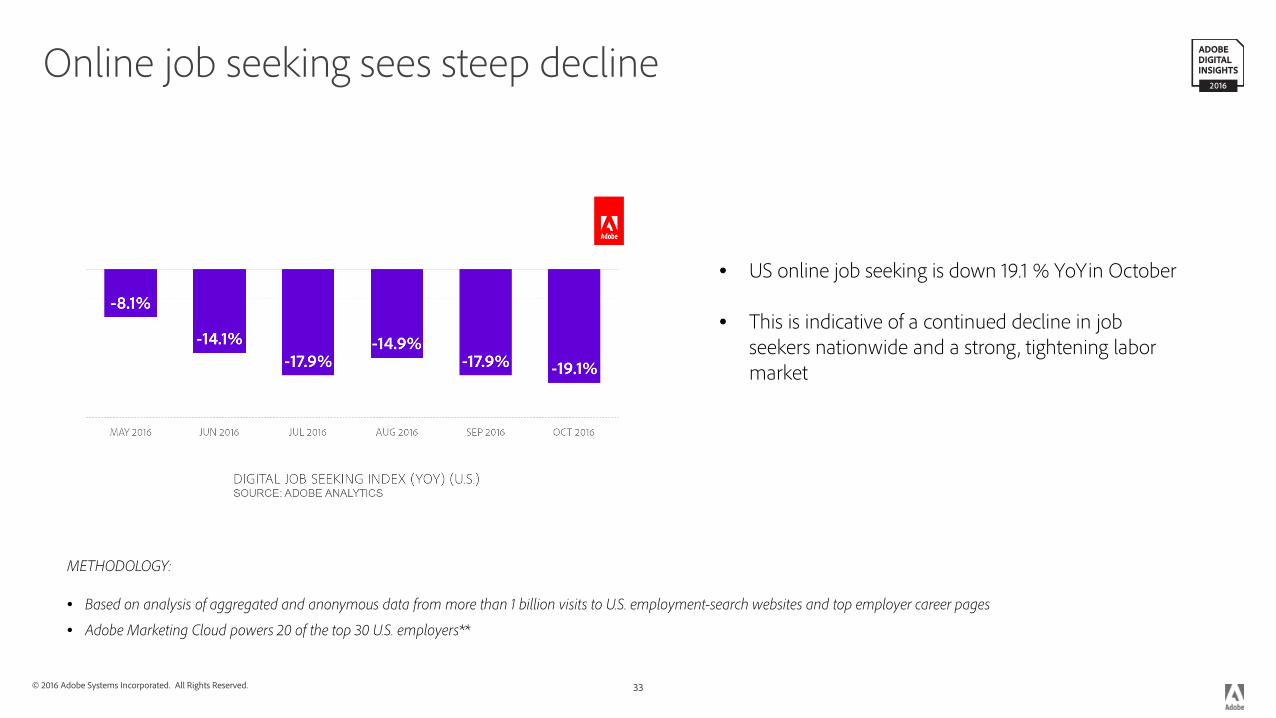
Online job seeking sees steep decline
33
METHODOLOGY:
• Based on analysis of aggregated and anonymous data from more than 1 billion visits to U.S. employment-search websites and top employer career pages
• Adobe Marketing Cloud powers 20 of the top 30 U.S. employers**
• US online job seeking is down 19.1 % YoY in October
• This is indicative of a continued decline in job seekers nationwide and a strong, tightening labor market

© 2016 Adobe Systems Incorporated. All Rights Reserved.© 2016 Adobe Systems Incorporated. All Rights Reserved. 34
Digital Housing Index(DHI)

© 2016 Adobe Systems Incorporated. All Rights Reserved.© 2016 Adobe Systems Incorporated. All Rights Reserved.
Online housing search growth rises
35
METHODOLOGY:
• Based on analysis of aggregated and anonymous data from more than 2 billion visits to U.S. housing search websites
Online search for purchases and rentals is up 13.0% YoY in October, revealing a stronger housing market to the previous fall, though the increase in searches YoY is down compared to September

© 2016 Adobe Systems Incorporated. All Rights Reserved.
Appendix
36

© 2016 Adobe Systems Incorporated. All Rights Reserved.© 2016 Adobe Systems Incorporated. All Rights Reserved.
Digital Price Index: Fisher Ideal Price Index
∑𝑖𝑖=1𝑛𝑛 𝑃𝑃𝑖𝑖𝑖𝑖𝑈𝑈𝑖𝑖𝑖𝑖−1∑𝑖𝑖=1𝑛𝑛 𝑃𝑃𝑖𝑖𝑖𝑖−1𝑈𝑈𝑖𝑖𝑖𝑖−1
∗∑𝑖𝑖=1𝑛𝑛 𝑃𝑃𝑖𝑖𝑖𝑖𝑈𝑈𝑖𝑖𝑖𝑖∑𝑖𝑖=1𝑛𝑛 𝑃𝑃𝑖𝑖𝑖𝑖−1𝑈𝑈𝑖𝑖𝑖𝑖
• The Fisher Ideal Price Index uses quantities purchased on the current period (month) and a previous period (previous month) to determine actual consumer’s preferences. Instead of assuming that consumers preferences for what goods to buy are constant over a certain number of years, it is able to account for the fact that they are constantly changing what they buy.
𝐹𝐹𝐹𝐹𝐹𝐹𝐹𝐹𝐹𝐹𝐹 𝜋𝜋𝑖𝑖 =

© 2016 Adobe Systems Incorporated. All Rights Reserved.© 2016 Adobe Systems Incorporated. All Rights Reserved.
Methodology Comparison: Fisher, Laspeyres and Paasche

© 2016 Adobe Systems Incorporated. All Rights Reserved.
Related Documents


