RESEARCH Open Access Adipose tissue stearoyl-CoA desaturase 1 index is increased and linoleic acid is decreased in obesity-prone rats fed a high-fat diet Jonathan Cedernaes 1* , Johan Alsiö 1,2 , Åke Västermark 1 , Ulf Risérus 3 and Helgi B Schiöth 1 Abstract Background: Fatty acid (FA) composition and desaturase indices are associated with obesity and related metabolic conditions. However, it is unclear to what extent desaturase activity in different lipid fractions contribute to obesity susceptibility. Our aim was to test whether desaturase activity and FA composition are linked to an obese phenotype in rats that are either obesity prone (OP) or resistant (OR) on a high-fat diet (HFD). Methods: Two groups of Sprague–Dawley rats were given ad libitum (AL-HFD) or calorically restricted (HFD-paired; pair fed to calories consumed by chow-fed rats) access to a HFD. The AL-HFD group was categorized into OP and OR sub-groups based on weight gain over 5 weeks. Five different lipid fractions were examined in OP and OR rats with regard to proportions of essential and very long-chain polyunsaturated FAs: linoleic acid (LA), alpha-linolenic acid, eicosapentaenoic acid, docosahexaenoic acid and the stearoyl-CoA desaturase 1 (SCD-1) product 16:1n-7. FA ratios were used to estimate activities of the delta-5-desaturase (20:4n-6/20:3n-6), delta-6-desaturase (18:3n-6/18:2n-6), stearoyl-CoA desaturase 1 (SCD-1; 16:1n-7/16:0, SCD-16 and 18:1n-9/18:0, SCD-18), de novo lipogenesis (16:0/18:2n-6) and FA elongation (18:0/16:0). Fasting insulin, glucose, adiponectin and leptin concentrations were measured in plasma. Results: After AL-HFD access, OP rats had a significantly higher SCD-16 index and 16:1n-7 proportion, but a significantly lower LA proportion, in subcutaneous adipose tissue (SAT) triacylglycerols, as well as significantly higher insulin and leptin concentrations, compared with OR rats. No differences were found between the two phenotypes in liver (phospholipids; triacylglycerols) or plasma (cholesterol esters; phospholipids) lipid fractions or for plasma glucose or adiponectin concentrations. For the desaturase indices of the HFD-paired rats, the only significant differences compared with the OP or OR rats were higher SCD-16 and SCD-18 indices in SAT triacylglycerols in OP compared with HFD-paired rats. Conclusion: The higher SCD-16 may reflect higher SCD-1 activity in SAT, which in combination with lower LA proportions may reflect higher insulin resistance and changes in SAT independent of other lipid fractions. Whether a lower SCD-16 index protects against diet-induced obesity is an interesting possibility that warrants further investigation. Keywords: Desaturase, Diet-induced obesity, Fatty acid composition, High-fat diet, Linoleic acid, Obesity prone, Obesity resistant, Subcutaneous adipose tissue, SCD-1, Stearoyl-CoA desaturase * Correspondence: [email protected] 1 Department of Neuroscience, Uppsala University, BMC, Uppsala, SE 75124, Sweden Full list of author information is available at the end of the article © 2013 Cedernaes et al.; licensee BioMed Central Ltd. This is an Open Access article distributed under the terms of the Creative Commons Attribution License (http://creativecommons.org/licenses/by/2.0), which permits unrestricted use, distribution, and reproduction in any medium, provided the original work is properly cited. Cedernaes et al. Lipids in Health and Disease 2013, 12:2 http://www.lipidworld.com/content/12/1/2

Welcome message from author
This document is posted to help you gain knowledge. Please leave a comment to let me know what you think about it! Share it to your friends and learn new things together.
Transcript
RESEARCH Open Access
Adipose tissue stearoyl-CoA desaturase 1 index isincreased and linoleic acid is decreased inobesity-prone rats fed a high-fat dietJonathan Cedernaes1*, Johan Alsiö1,2, Åke Västermark1, Ulf Risérus3 and Helgi B Schiöth1
Abstract
Background: Fatty acid (FA) composition and desaturase indices are associated with obesity and related metabolicconditions. However, it is unclear to what extent desaturase activity in different lipid fractions contribute to obesitysusceptibility. Our aim was to test whether desaturase activity and FA composition are linked to an obesephenotype in rats that are either obesity prone (OP) or resistant (OR) on a high-fat diet (HFD).
Methods: Two groups of Sprague–Dawley rats were given ad libitum (AL-HFD) or calorically restricted (HFD-paired;pair fed to calories consumed by chow-fed rats) access to a HFD. The AL-HFD group was categorized into OP andOR sub-groups based on weight gain over 5 weeks. Five different lipid fractions were examined in OP and OR ratswith regard to proportions of essential and very long-chain polyunsaturated FAs: linoleic acid (LA), alpha-linolenicacid, eicosapentaenoic acid, docosahexaenoic acid and the stearoyl-CoA desaturase 1 (SCD-1) product 16:1n-7. FAratios were used to estimate activities of the delta-5-desaturase (20:4n-6/20:3n-6), delta-6-desaturase (18:3n-6/18:2n-6),stearoyl-CoA desaturase 1 (SCD-1; 16:1n-7/16:0, SCD-16 and 18:1n-9/18:0, SCD-18), de novo lipogenesis (16:0/18:2n-6)and FA elongation (18:0/16:0). Fasting insulin, glucose, adiponectin and leptin concentrations were measured in plasma.
Results: After AL-HFD access, OP rats had a significantly higher SCD-16 index and 16:1n-7 proportion, but asignificantly lower LA proportion, in subcutaneous adipose tissue (SAT) triacylglycerols, as well as significantly higherinsulin and leptin concentrations, compared with OR rats. No differences were found between the two phenotypes inliver (phospholipids; triacylglycerols) or plasma (cholesterol esters; phospholipids) lipid fractions or for plasma glucoseor adiponectin concentrations. For the desaturase indices of the HFD-paired rats, the only significant differencescompared with the OP or OR rats were higher SCD-16 and SCD-18 indices in SAT triacylglycerols in OP compared withHFD-paired rats.
Conclusion: The higher SCD-16 may reflect higher SCD-1 activity in SAT, which in combination with lower LAproportions may reflect higher insulin resistance and changes in SAT independent of other lipid fractions. Whether alower SCD-16 index protects against diet-induced obesity is an interesting possibility that warrants further investigation.
Keywords: Desaturase, Diet-induced obesity, Fatty acid composition, High-fat diet, Linoleic acid, Obesity prone, Obesityresistant, Subcutaneous adipose tissue, SCD-1, Stearoyl-CoA desaturase
* Correspondence: [email protected] of Neuroscience, Uppsala University, BMC, Uppsala, SE 75124,SwedenFull list of author information is available at the end of the article
© 2013 Cedernaes et al.; licensee BioMed Central Ltd. This is an Open Access article distributed under the terms of theCreative Commons Attribution License (http://creativecommons.org/licenses/by/2.0), which permits unrestricted use,distribution, and reproduction in any medium, provided the original work is properly cited.
Cedernaes et al. Lipids in Health and Disease 2013, 12:2http://www.lipidworld.com/content/12/1/2
BackgroundObesity is a serious health concern that is increasing atan unprecedented rate worldwide. Excess intake of high-energy, highly palatable food may in turn result in adecreased metabolic response to increased fat intake, pro-moting a vicious cycle of weight gain [1]. However, evenwhen presented with a high-energy diet, not all individualsbecome obese [2]. Thus, some are seemingly resistant to anobesity-inducing environment. Understanding the under-lying mechanisms of this phenomenon is one of the centralquestions in the study of food intake regulation [3]. Just ashumans differ in their susceptibility to diet-inducedweight gain, individual animals within certain rodentstrains also show different responses to excess energyintake [4-6]. On an ad libitum high-fat diet (HFD),the outbred Sprague–Dawley strain of rats can be dividedinto obesity-prone (OP) and obesity-resistant (OR) pheno-types to model human diet-induced obesity (DIO) [7,8].This two-phenotype model can be useful for elucidatingmechanisms that drive DIO, and to identify physiologicaland biochemical differences between the two groups.Compared with their OR counterparts, OP rats show a
more adverse metabolic risk profile as well as lower energyexpenditure on a HFD [9,10], and a proadipogenic expres-sion profile [11-13]. In addition, OP rats also have lowerrelative fat oxidation and fat oxidation enzyme expression[14-17]. However, the mechanisms behind these observeddifferences in DIO are still unclear, and further studies areneeded to assess other potential metabolic and biochemicalfactors of importance.Although OP/OR Sprague–Dawley rats represent key
models for the study of differential susceptibility to DIO,the contribution of desaturase activities and fatty acid (FA)composition in various lipid fractions to these phenotypeshas not been evaluated. Some differences in FA compos-ition have been found between OP and OR animals, butthe data are limited to a few FAs and lipid fractions [13],and not all desaturase indices have been studied.Accumulating data suggest that the FA profile in plasma
and metabolic tissues associates strongly with obesity andinsulin resistance [18,19]. An altered FA metabolism anddesaturase activity have been shown to be involved inbody fat storage and oxidation [20,21]. Certain FAs andtheir ratios can also be utilized as important risk markersfor various diseases and desaturase indices have beenclosely linked to several obesity-related conditions [22-26].Especially, SCD-16 and D6D have been found to correlatepositively with obesity and development of the metabolicsyndrome [19,24,27]. The desaturase indices are FAproduct-to-precursor ratios that have been used to indi-rectly calculate the activities of the enzymes responsiblefor desaturating FAs [28]. By inserting double bonds intothe FA carbon chains, desaturases convert saturated intounsaturated FAs, which in turn are substrates for various
lipids and participate in signal transduction and foodintake regulation [29,30]. The three desaturases, Δ5- (D5D),Δ6- (D6D) and, especially, the Δ9-desaturase (also knownas stearoyl-CoA-desaturase or SCD-1), have been exten-sively studied (for review see Bjermo & Risérus [31]).SCD-1 is increased by saturated FAs and depressed by poly-unsaturated FAs. Since high SCD-1 activity is associatedwith decreased fat oxidation and increased FA synthesis,and since an SCD-1 knockout leads to resistance to DIO,SCD-1 has been proposed as a potential target in thetreatment of obesity [31,32].Given the role for FA composition and desaturases in
pathophysiology and metabolism we aimed to investigatethese factors in response to HFD-induced weight gain.Potential differences between the OP and OR phenotypesin desaturase indices and biochemically important FAs,were investigated in five lipid fractions involved in FAhandling and metabolism: subcutaneous adipose tissuetriacylglycerols (SAT-TG), liver phospholipids (liver PL),liver triacylglycerols (liver TG), plasma cholesterol esters(PL-CE) and plasma phospholipids (PL-PL). In order toinfer the impact of diet versus metabolic differences, wechose to study three groups: an ad libitum HFD group ofrats divided into OP and OR, and a calorically restrictedHFD group as control.
ResultsWe used two dietary groups divided into a total of three ex-perimental groups. One group of rats had ad libitum accessto a HFD (AL-HFD, n = 24); a HFD-paired group (n = 10)were fed the HFD but were calorically restricted to followthe weight trajectory of male Sprague–Dawley rats fedregular chow. The rats in the AL-HFD group were furtherdivided into either obesity-prone (OP, n = 12) or obesity-resistant (OP, n = 12), based on a median split of the gain inbody weight (dBw) on the HFD after the 5-week experi-ment. There was no significant difference in initial bodyweight between the three groups.After five weeks on a HFD, the obesity-prone (220.8 ±
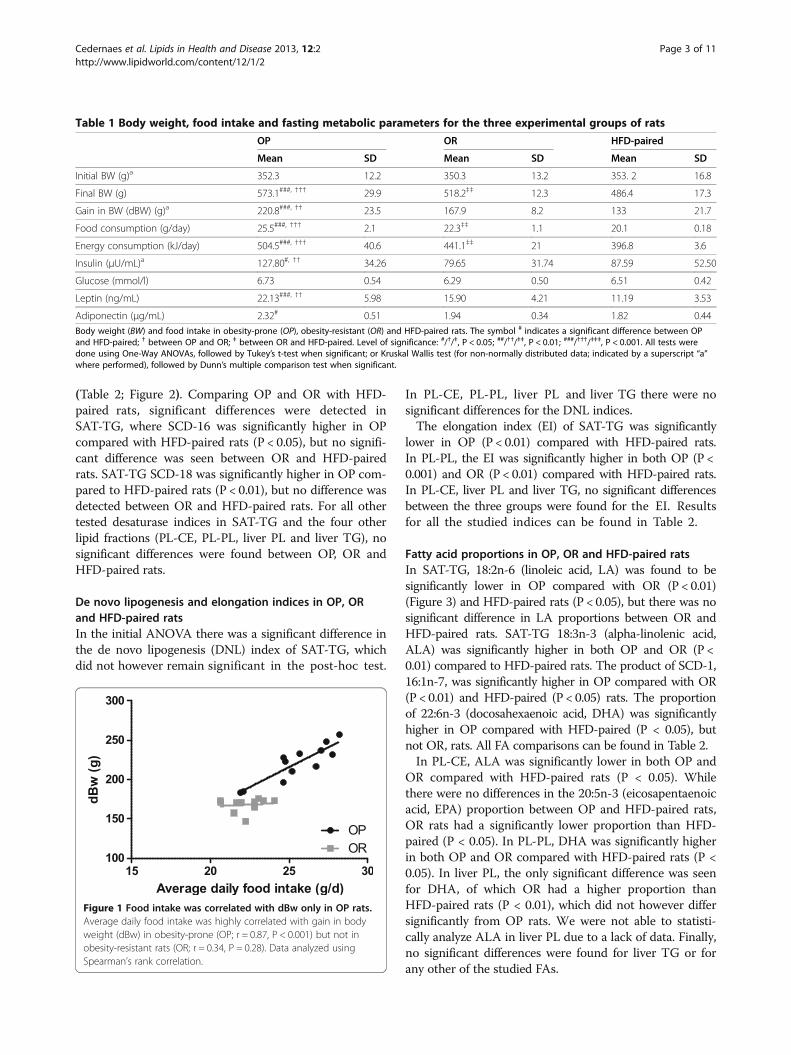
23.5 g; P <0.001) and obesity-resistant (167.9 ± 8.2 g; P< 0.01) rats had gained significantly more weight than thecalorically restricted HFD-paired (133.2 ± 21.7 g) group(Table 1). Cumulatively over the five-week period, OP ratsate more than OR rats (P < 0.001, data not shown). Averagedaily food intake was highly correlated with dBw in OP (r= 0.87, P < 0.001) but not in OR rats (r = 0.33, P = 0.28)(Figure 1). Food efficiency (dBw/average daily food intakein grams) was significantly higher (P < 0.001) in OP (8.65 ±0.43) than in OR rats (7.56 ± 0.48).
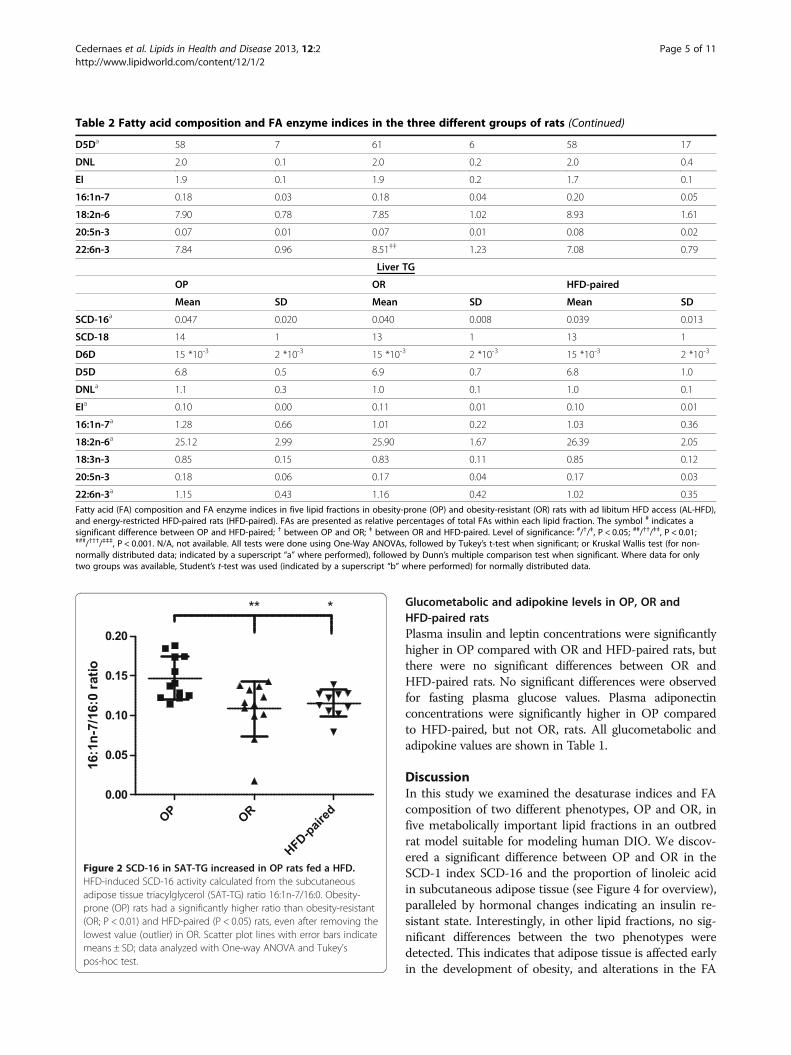
Desaturase indices in OP, OR and HFD-paired ratsComparing the desaturase indices of OP and OR, wefound a significant difference for SCD-16 in SAT-TG, withOP rats having a higher index than OR rats (P < 0.01)
Cedernaes et al. Lipids in Health and Disease 2013, 12:2 Page 2 of 11http://www.lipidworld.com/content/12/1/2
(Table 2; Figure 2). Comparing OP and OR with HFD-paired rats, significant differences were detected inSAT-TG, where SCD-16 was significantly higher in OPcompared with HFD-paired rats (P < 0.05), but no signifi-cant difference was seen between OR and HFD-pairedrats. SAT-TG SCD-18 was significantly higher in OP com-pared to HFD-paired rats (P < 0.01), but no difference wasdetected between OR and HFD-paired rats. For all othertested desaturase indices in SAT-TG and the four otherlipid fractions (PL-CE, PL-PL, liver PL and liver TG), nosignificant differences were found between OP, OR andHFD-paired rats.
De novo lipogenesis and elongation indices in OP, ORand HFD-paired ratsIn the initial ANOVA there was a significant difference inthe de novo lipogenesis (DNL) index of SAT-TG, whichdid not however remain significant in the post-hoc test.
In PL-CE, PL-PL, liver PL and liver TG there were nosignificant differences for the DNL indices.The elongation index (EI) of SAT-TG was significantly
lower in OP (P < 0.01) compared with HFD-paired rats.In PL-PL, the EI was significantly higher in both OP (P <0.001) and OR (P < 0.01) compared with HFD-paired rats.In PL-CE, liver PL and liver TG, no significant differencesbetween the three groups were found for the EI. Resultsfor all the studied indices can be found in Table 2.
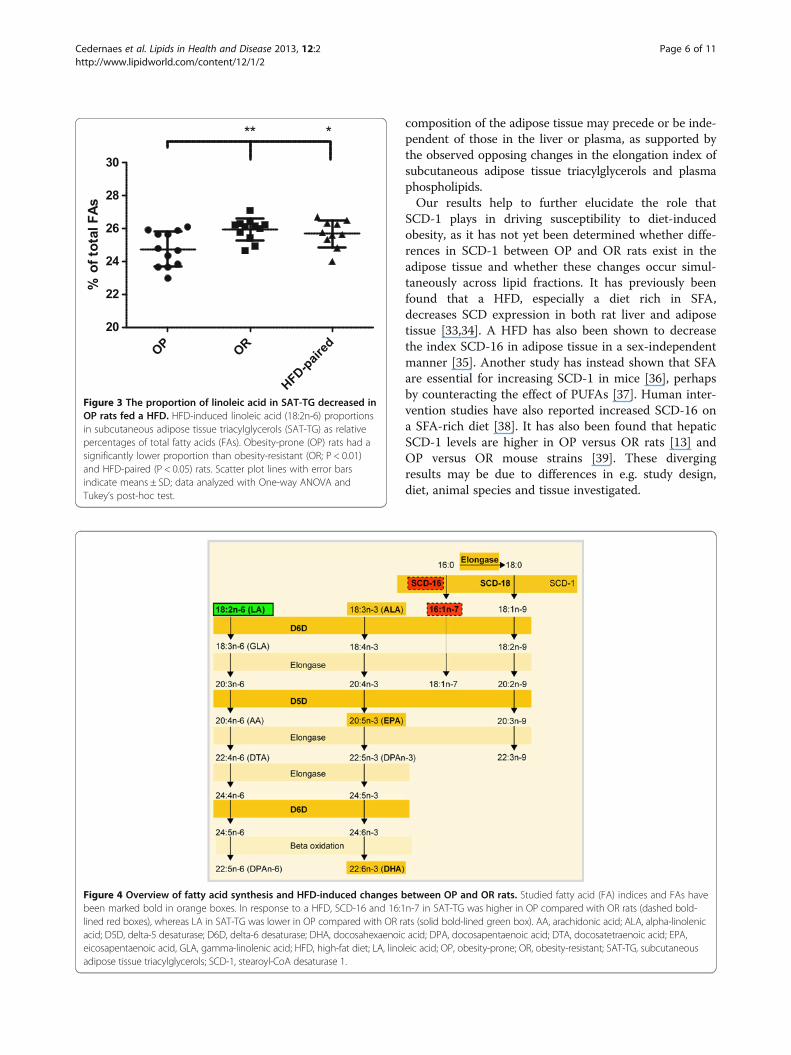
Fatty acid proportions in OP, OR and HFD-paired ratsIn SAT-TG, 18:2n-6 (linoleic acid, LA) was found to besignificantly lower in OP compared with OR (P < 0.01)(Figure 3) and HFD-paired rats (P < 0.05), but there was nosignificant difference in LA proportions between OR andHFD-paired rats. SAT-TG 18:3n-3 (alpha-linolenic acid,ALA) was significantly higher in both OP and OR (P <0.01) compared to HFD-paired rats. The product of SCD-1,16:1n-7, was significantly higher in OP compared with OR(P < 0.01) and HFD-paired (P < 0.05) rats. The proportionof 22:6n-3 (docosahexaenoic acid, DHA) was significantlyhigher in OP compared with HFD-paired (P < 0.05), butnot OR, rats. All FA comparisons can be found in Table 2.In PL-CE, ALA was significantly lower in both OP and
OR compared with HFD-paired rats (P < 0.05). Whilethere were no differences in the 20:5n-3 (eicosapentaenoicacid, EPA) proportion between OP and HFD-paired rats,OR rats had a significantly lower proportion than HFD-paired (P < 0.05). In PL-PL, DHA was significantly higherin both OP and OR compared with HFD-paired rats (P <0.05). In liver PL, the only significant difference was seenfor DHA, of which OR had a higher proportion thanHFD-paired rats (P < 0.01), which did not however differsignificantly from OP rats. We were not able to statisti-cally analyze ALA in liver PL due to a lack of data. Finally,no significant differences were found for liver TG or forany other of the studied FAs.
Table 1 Body weight, food intake and fasting metabolic parameters for the three experimental groups of rats
OP OR HFD-paired
Mean SD Mean SD Mean SD
Initial BW (g)a 352.3 12.2 350.3 13.2 353. 2 16.8
Final BW (g) 573.1###, ††† 29.9 518.2‡‡ 12.3 486.4 17.3
Gain in BW (dBW) (g)a 220.8###, †† 23.5 167.9 8.2 133 21.7
Food consumption (g/day) 25.5###, ††† 2.1 22.3‡‡ 1.1 20.1 0.18
Energy consumption (kJ/day) 504.5###, ††† 40.6 441.1‡‡ 21 396.8 3.6
Insulin (μU/mL)a 127.80#, †† 34.26 79.65 31.74 87.59 52.50
Glucose (mmol/l) 6.73 0.54 6.29 0.50 6.51 0.42
Leptin (ng/mL) 22.13###, †† 5.98 15.90 4.21 11.19 3.53
Adiponectin (μg/mL) 2.32# 0.51 1.94 0.34 1.82 0.44Body weight (BW) and food intake in obesity-prone (OP), obesity-resistant (OR) and HFD-paired rats. The symbol # indicates a significant difference between OPand HFD-paired; † between OP and OR; ‡ between OR and HFD-paired. Level of significance: #/†/‡, P < 0.05; ##/††/‡‡, P < 0.01; ###/†††/‡‡‡, P < 0.001. All tests weredone using One-Way ANOVAs, followed by Tukey’s t-test when significant; or Kruskal Wallis test (for non-normally distributed data; indicated by a superscript “a”where performed), followed by Dunn’s multiple comparison test when significant.
Figure 1 Food intake was correlated with dBw only in OP rats.Average daily food intake was highly correlated with gain in bodyweight (dBw) in obesity-prone (OP; r = 0.87, P < 0.001) but not inobesity-resistant rats (OR; r = 0.34, P = 0.28). Data analyzed usingSpearman’s rank correlation.
Cedernaes et al. Lipids in Health and Disease 2013, 12:2 Page 3 of 11http://www.lipidworld.com/content/12/1/2
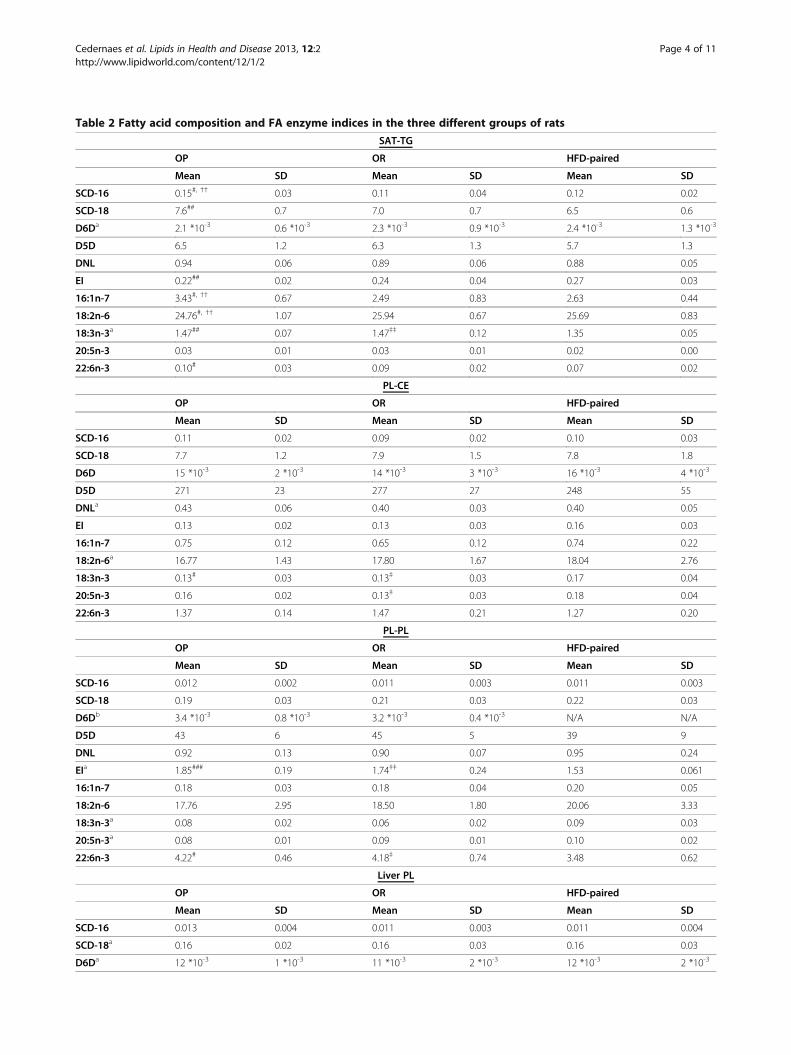
Table 2 Fatty acid composition and FA enzyme indices in the three different groups of rats
SAT-TG
OP OR HFD-paired
Mean SD Mean SD Mean SD
SCD-16 0.15#, †† 0.03 0.11 0.04 0.12 0.02
SCD-18 7.6## 0.7 7.0 0.7 6.5 0.6
D6Da 2.1 *10-3 0.6 *10-3 2.3 *10-3 0.9 *10-3 2.4 *10-3 1.3 *10-3
D5D 6.5 1.2 6.3 1.3 5.7 1.3
DNL 0.94 0.06 0.89 0.06 0.88 0.05
EI 0.22## 0.02 0.24 0.04 0.27 0.03
16:1n-7 3.43#, †† 0.67 2.49 0.83 2.63 0.44
18:2n-6 24.76#, †† 1.07 25.94 0.67 25.69 0.83
18:3n-3a 1.47## 0.07 1.47‡‡ 0.12 1.35 0.05
20:5n-3 0.03 0.01 0.03 0.01 0.02 0.00
22:6n-3 0.10# 0.03 0.09 0.02 0.07 0.02
PL-CE
OP OR HFD-paired
Mean SD Mean SD Mean SD
SCD-16 0.11 0.02 0.09 0.02 0.10 0.03
SCD-18 7.7 1.2 7.9 1.5 7.8 1.8
D6D 15 *10-3 2 *10-3 14 *10-3 3 *10-3 16 *10-3 4 *10-3
D5D 271 23 277 27 248 55
DNLa 0.43 0.06 0.40 0.03 0.40 0.05
EI 0.13 0.02 0.13 0.03 0.16 0.03
16:1n-7 0.75 0.12 0.65 0.12 0.74 0.22
18:2n-6a 16.77 1.43 17.80 1.67 18.04 2.76
18:3n-3 0.13# 0.03 0.13‡ 0.03 0.17 0.04
20:5n-3 0.16 0.02 0.13‡ 0.03 0.18 0.04
22:6n-3 1.37 0.14 1.47 0.21 1.27 0.20
PL-PL
OP OR HFD-paired
Mean SD Mean SD Mean SD
SCD-16 0.012 0.002 0.011 0.003 0.011 0.003
SCD-18 0.19 0.03 0.21 0.03 0.22 0.03
D6Db 3.4 *10-3 0.8 *10-3 3.2 *10-3 0.4 *10-3 N/A N/A
D5D 43 6 45 5 39 9
DNL 0.92 0.13 0.90 0.07 0.95 0.24
EIa 1.85### 0.19 1.74‡‡ 0.24 1.53 0.061
16:1n-7 0.18 0.03 0.18 0.04 0.20 0.05
18:2n-6 17.76 2.95 18.50 1.80 20.06 3.33
18:3n-3a 0.08 0.02 0.06 0.02 0.09 0.03
20:5n-3a 0.08 0.01 0.09 0.01 0.10 0.02
22:6n-3 4.22# 0.46 4.18‡ 0.74 3.48 0.62
Liver PL
OP OR HFD-paired
Mean SD Mean SD Mean SD
SCD-16 0.013 0.004 0.011 0.003 0.011 0.004
SCD-18a 0.16 0.02 0.16 0.03 0.16 0.03
D6Da 12 *10-3 1 *10-3 11 *10-3 2 *10-3 12 *10-3 2 *10-3
Cedernaes et al. Lipids in Health and Disease 2013, 12:2 Page 4 of 11http://www.lipidworld.com/content/12/1/2
Glucometabolic and adipokine levels in OP, OR andHFD-paired ratsPlasma insulin and leptin concentrations were significantlyhigher in OP compared with OR and HFD-paired rats, butthere were no significant differences between OR andHFD-paired rats. No significant differences were observedfor fasting plasma glucose values. Plasma adiponectinconcentrations were significantly higher in OP comparedto HFD-paired, but not OR, rats. All glucometabolic andadipokine values are shown in Table 1.
DiscussionIn this study we examined the desaturase indices and FAcomposition of two different phenotypes, OP and OR, infive metabolically important lipid fractions in an outbredrat model suitable for modeling human DIO. We discov-ered a significant difference between OP and OR in theSCD-1 index SCD-16 and the proportion of linoleic acidin subcutaneous adipose tissue (see Figure 4 for overview),paralleled by hormonal changes indicating an insulin re-sistant state. Interestingly, in other lipid fractions, no sig-nificant differences between the two phenotypes weredetected. This indicates that adipose tissue is affected earlyin the development of obesity, and alterations in the FA
Table 2 Fatty acid composition and FA enzyme indices in the three different groups of rats (Continued)
D5Da 58 7 61 6 58 17
DNL 2.0 0.1 2.0 0.2 2.0 0.4
EI 1.9 0.1 1.9 0.2 1.7 0.1
16:1n-7 0.18 0.03 0.18 0.04 0.20 0.05
18:2n-6 7.90 0.78 7.85 1.02 8.93 1.61
20:5n-3 0.07 0.01 0.07 0.01 0.08 0.02
22:6n-3 7.84 0.96 8.51‡‡ 1.23 7.08 0.79
Liver TG
OP OR HFD-paired
Mean SD Mean SD Mean SD
SCD-16a 0.047 0.020 0.040 0.008 0.039 0.013
SCD-18 14 1 13 1 13 1
D6D 15 *10-3 2 *10-3 15 *10-3 2 *10-3 15 *10-3 2 *10-3
D5D 6.8 0.5 6.9 0.7 6.8 1.0
DNLa 1.1 0.3 1.0 0.1 1.0 0.1
EIa 0.10 0.00 0.11 0.01 0.10 0.01
16:1n-7a 1.28 0.66 1.01 0.22 1.03 0.36
18:2n-6a 25.12 2.99 25.90 1.67 26.39 2.05
18:3n-3 0.85 0.15 0.83 0.11 0.85 0.12
20:5n-3 0.18 0.06 0.17 0.04 0.17 0.03
22:6n-3a 1.15 0.43 1.16 0.42 1.02 0.35
Fatty acid (FA) composition and FA enzyme indices in five lipid fractions in obesity-prone (OP) and obesity-resistant (OR) rats with ad libitum HFD access (AL-HFD),and energy-restricted HFD-paired rats (HFD-paired). FAs are presented as relative percentages of total FAs within each lipid fraction. The symbol # indicates asignificant difference between OP and HFD-paired; † between OP and OR; ‡ between OR and HFD-paired. Level of significance: #/†/‡, P < 0.05; ##/††/‡‡, P < 0.01;###/†††/‡‡‡, P < 0.001. N/A, not available. All tests were done using One-Way ANOVAs, followed by Tukey’s t-test when significant; or Kruskal Wallis test (for non-normally distributed data; indicated by a superscript “a” where performed), followed by Dunn’s multiple comparison test when significant. Where data for onlytwo groups was available, Student’s t-test was used (indicated by a superscript “b” where performed) for normally distributed data.
Figure 2 SCD-16 in SAT-TG increased in OP rats fed a HFD.HFD-induced SCD-16 activity calculated from the subcutaneousadipose tissue triacylglycerol (SAT-TG) ratio 16:1n-7/16:0. Obesity-prone (OP) rats had a significantly higher ratio than obesity-resistant(OR; P < 0.01) and HFD-paired (P < 0.05) rats, even after removing thelowest value (outlier) in OR. Scatter plot lines with error bars indicatemeans ± SD; data analyzed with One-way ANOVA and Tukey’spos-hoc test.
Cedernaes et al. Lipids in Health and Disease 2013, 12:2 Page 5 of 11http://www.lipidworld.com/content/12/1/2
composition of the adipose tissue may precede or be inde-pendent of those in the liver or plasma, as supported bythe observed opposing changes in the elongation index ofsubcutaneous adipose tissue triacylglycerols and plasmaphospholipids.Our results help to further elucidate the role that
SCD-1 plays in driving susceptibility to diet-inducedobesity, as it has not yet been determined whether diffe-rences in SCD-1 between OP and OR rats exist in theadipose tissue and whether these changes occur simul-taneously across lipid fractions. It has previously beenfound that a HFD, especially a diet rich in SFA,decreases SCD expression in both rat liver and adiposetissue [33,34]. A HFD has also been shown to decreasethe index SCD-16 in adipose tissue in a sex-independentmanner [35]. Another study has instead shown that SFAare essential for increasing SCD-1 in mice [36], perhapsby counteracting the effect of PUFAs [37]. Human inter-vention studies have also reported increased SCD-16 ona SFA-rich diet [38]. It has also been found that hepaticSCD-1 levels are higher in OP versus OR rats [13] andOP versus OR mouse strains [39]. These divergingresults may be due to differences in e.g. study design,diet, animal species and tissue investigated.
Figure 3 The proportion of linoleic acid in SAT-TG decreased inOP rats fed a HFD. HFD-induced linoleic acid (18:2n-6) proportionsin subcutaneous adipose tissue triacylglycerols (SAT-TG) as relativepercentages of total fatty acids (FAs). Obesity-prone (OP) rats had asignificantly lower proportion than obesity-resistant (OR; P < 0.01)and HFD-paired (P < 0.05) rats. Scatter plot lines with error barsindicate means ± SD; data analyzed with One-way ANOVA andTukey’s post-hoc test.
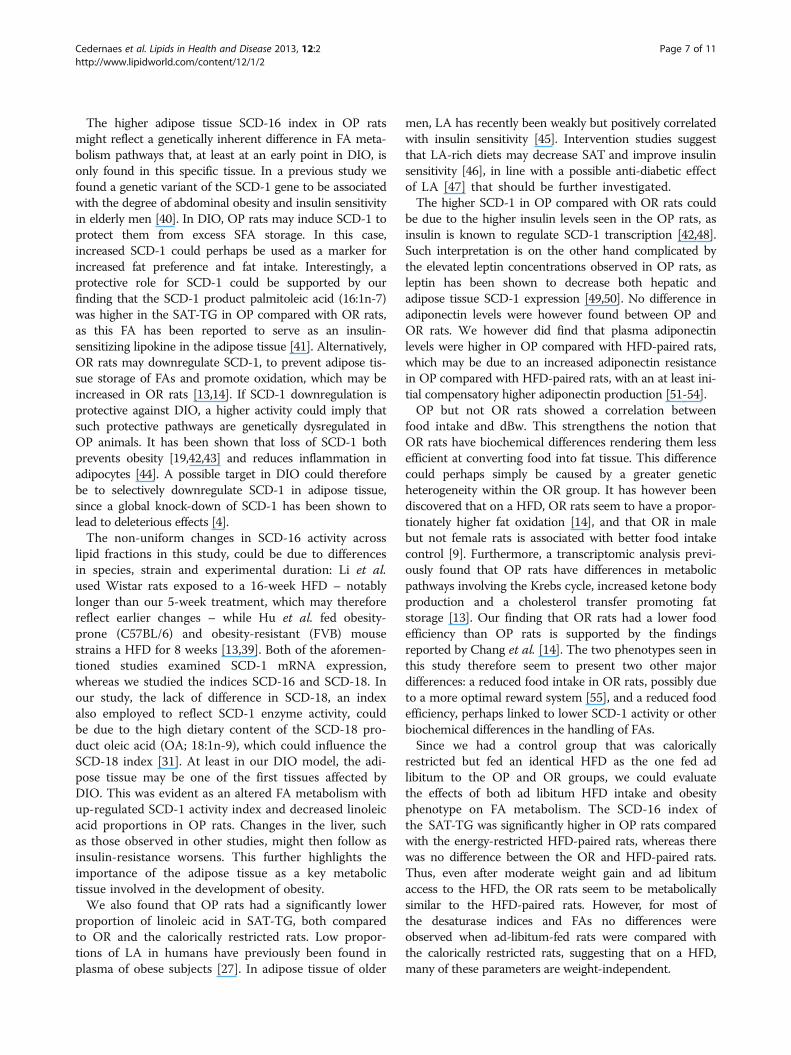
Figure 4 Overview of fatty acid synthesis and HFD-induced changes between OP and OR rats. Studied fatty acid (FA) indices and FAs havebeen marked bold in orange boxes. In response to a HFD, SCD-16 and 16:1n-7 in SAT-TG was higher in OP compared with OR rats (dashed bold-lined red boxes), whereas LA in SAT-TG was lower in OP compared with OR rats (solid bold-lined green box). AA, arachidonic acid; ALA, alpha-linolenicacid; D5D, delta-5 desaturase; D6D, delta-6 desaturase; DHA, docosahexaenoic acid; DPA, docosapentaenoic acid; DTA, docosatetraenoic acid; EPA,eicosapentaenoic acid, GLA, gamma-linolenic acid; HFD, high-fat diet; LA, linoleic acid; OP, obesity-prone; OR, obesity-resistant; SAT-TG, subcutaneousadipose tissue triacylglycerols; SCD-1, stearoyl-CoA desaturase 1.
Cedernaes et al. Lipids in Health and Disease 2013, 12:2 Page 6 of 11http://www.lipidworld.com/content/12/1/2
The higher adipose tissue SCD-16 index in OP ratsmight reflect a genetically inherent difference in FA meta-bolism pathways that, at least at an early point in DIO, isonly found in this specific tissue. In a previous study wefound a genetic variant of the SCD-1 gene to be associatedwith the degree of abdominal obesity and insulin sensitivityin elderly men [40]. In DIO, OP rats may induce SCD-1 toprotect them from excess SFA storage. In this case,increased SCD-1 could perhaps be used as a marker forincreased fat preference and fat intake. Interestingly, aprotective role for SCD-1 could be supported by ourfinding that the SCD-1 product palmitoleic acid (16:1n-7)was higher in the SAT-TG in OP compared with OR rats,as this FA has been reported to serve as an insulin-sensitizing lipokine in the adipose tissue [41]. Alternatively,OR rats may downregulate SCD-1, to prevent adipose tis-sue storage of FAs and promote oxidation, which may beincreased in OR rats [13,14]. If SCD-1 downregulation isprotective against DIO, a higher activity could imply thatsuch protective pathways are genetically dysregulated inOP animals. It has been shown that loss of SCD-1 bothprevents obesity [19,42,43] and reduces inflammation inadipocytes [44]. A possible target in DIO could thereforebe to selectively downregulate SCD-1 in adipose tissue,since a global knock-down of SCD-1 has been shown tolead to deleterious effects [4].The non-uniform changes in SCD-16 activity across
lipid fractions in this study, could be due to differencesin species, strain and experimental duration: Li et al.used Wistar rats exposed to a 16-week HFD – notablylonger than our 5-week treatment, which may thereforereflect earlier changes – while Hu et al. fed obesity-prone (C57BL/6) and obesity-resistant (FVB) mousestrains a HFD for 8 weeks [13,39]. Both of the aforemen-tioned studies examined SCD-1 mRNA expression,whereas we studied the indices SCD-16 and SCD-18. Inour study, the lack of difference in SCD-18, an indexalso employed to reflect SCD-1 enzyme activity, couldbe due to the high dietary content of the SCD-18 pro-duct oleic acid (OA; 18:1n-9), which could influence theSCD-18 index [31]. At least in our DIO model, the adi-pose tissue may be one of the first tissues affected byDIO. This was evident as an altered FA metabolism withup-regulated SCD-1 activity index and decreased linoleicacid proportions in OP rats. Changes in the liver, suchas those observed in other studies, might then follow asinsulin-resistance worsens. This further highlights theimportance of the adipose tissue as a key metabolictissue involved in the development of obesity.We also found that OP rats had a significantly lower
proportion of linoleic acid in SAT-TG, both comparedto OR and the calorically restricted rats. Low propor-tions of LA in humans have previously been found inplasma of obese subjects [27]. In adipose tissue of older
men, LA has recently been weakly but positively correlatedwith insulin sensitivity [45]. Intervention studies suggestthat LA-rich diets may decrease SAT and improve insulinsensitivity [46], in line with a possible anti-diabetic effectof LA [47] that should be further investigated.The higher SCD-1 in OP compared with OR rats could
be due to the higher insulin levels seen in the OP rats, asinsulin is known to regulate SCD-1 transcription [42,48].Such interpretation is on the other hand complicated bythe elevated leptin concentrations observed in OP rats, asleptin has been shown to decrease both hepatic andadipose tissue SCD-1 expression [49,50]. No difference inadiponectin levels were however found between OP andOR rats. We however did find that plasma adiponectinlevels were higher in OP compared with HFD-paired rats,which may be due to an increased adiponectin resistancein OP compared with HFD-paired rats, with an at least ini-tial compensatory higher adiponectin production [51-54].OP but not OR rats showed a correlation between
food intake and dBw. This strengthens the notion thatOR rats have biochemical differences rendering them lessefficient at converting food into fat tissue. This differencecould perhaps simply be caused by a greater geneticheterogeneity within the OR group. It has however beendiscovered that on a HFD, OR rats seem to have a propor-tionately higher fat oxidation [14], and that OR in malebut not female rats is associated with better food intakecontrol [9]. Furthermore, a transcriptomic analysis previ-ously found that OP rats have differences in metabolicpathways involving the Krebs cycle, increased ketone bodyproduction and a cholesterol transfer promoting fatstorage [13]. Our finding that OR rats had a lower foodefficiency than OP rats is supported by the findingsreported by Chang et al. [14]. The two phenotypes seen inthis study therefore seem to present two other majordifferences: a reduced food intake in OR rats, possibly dueto a more optimal reward system [55], and a reduced foodefficiency, perhaps linked to lower SCD-1 activity or otherbiochemical differences in the handling of FAs.Since we had a control group that was calorically
restricted but fed an identical HFD as the one fed adlibitum to the OP and OR groups, we could evaluatethe effects of both ad libitum HFD intake and obesityphenotype on FA metabolism. The SCD-16 index ofthe SAT-TG was significantly higher in OP rats comparedwith the energy-restricted HFD-paired rats, whereas therewas no difference between the OR and HFD-paired rats.Thus, even after moderate weight gain and ad libitumaccess to the HFD, the OR rats seem to be metabolicallysimilar to the HFD-paired rats. However, for most ofthe desaturase indices and FAs no differences wereobserved when ad-libitum-fed rats were compared withthe calorically restricted rats, suggesting that on a HFD,many of these parameters are weight-independent.
Cedernaes et al. Lipids in Health and Disease 2013, 12:2 Page 7 of 11http://www.lipidworld.com/content/12/1/2
It should be noted that the diets used to induce DIOmore than often differ between different studies [21],thus complicating comparisons between studies. The FAcomposition of the diet could mask potential differencesin FA composition between OP and OR rats that wouldhave been seen if the animals had been given a differentdiet. However, on the other hand, both the calorie-restricted and the ad libitum groups received the samediet, making the results more attributable to metabolicdifferences. To elucidate what drives the OP and ORphenotypes, initial measurements of the FA compositionwould have been valuable. Such data could have pro-vided additional predictive markers for susceptibility toDIO; some of which, e.g. plasma-derived FA, could beeasily measurable in human subjects. E.g. SCD-1 isknown to be correlated with markers of obesity [27], butit is still unknown whether these pathological changesare caused by SCD-1 per se, or if it is a marker of or per-haps even a compensatory mechanism for these ongoingprocesses [31]. Furthermore, the adipose tissue analyzedherein was derived from the inguinal fat depot, and doesnot necessarily reflect other adipose tissue depots, asreported by other researchers [35,56].
ConclusionIn this experiment we demonstrate that obesity-pronerats have a significantly higher SCD-16 index, signifi-cantly higher proportions of the SCD-1 product 16:1n-7,but a lower proportion of LA in adipose tissue. Thesechanges are largely independent of weight gain and seemto appear before any changes in the plasma or liver tissue,and are paralleled by hormonal changes indicating insulinresistance with possible compensatory changes. Whether alower SCD-16 index protects against DIO is an interestingpossibility that warrants further investigation.
MethodsThirty-four male outbred Sprague–Dawley rats (ScanburB&K, Sollentuna, Sweden) were used in this study. Atthe start of the experiments the rats were 8 weeks oldand weighed 352 ± 12 g (mean ± SD). The rats werehoused one per cage, in standard macrolon cages (typeIV), which had a wood chip bedding and a woodenhouse as enrichment. All rats had free access to water.Ambient temperature (21-22°C) and humidity (40–50%)were kept constant and a 12-h-light cycle with lights onat 07:00 was used. The rats were allowed one week ofadaptation to the animal facility conditions before onsetof the experiments. The rats were then randomly dividedinto two dietary groups. One group of rats were fed aHFD ad libitum (AL-HFD, n = 24); the control group(HFD-paired, n = 10) were fed the HFD but were caloric-ally restricted to follow the weight trajectory of maleSprague–Dawley rats with ad libitum access to regular
chow. The HFD (D12451, ResearchDiets) contained 19.79kJ (4.73 kcal)/g (20% protein, 35% carbohydrates and 45%fat by energy; see Table 3 for composition). During the fiveweeks of access to the diets, food intake and body weightwere measured daily during the first week and thereafterthree times a week. After the five-week dietary intervention,the rats were fasted for three hours and were then killed bydecapitation, at which point trunk blood was collected.Plasma was isolated by centrifugation and stored at −80°Cuntil analyzed. Liver tissue and subcutaneous adipose tissue(SAT) from the inguinal region were isolated and stored at−80°C. Note that data from a subset of these rats have pre-viously been analyzed and published [56].
Analysis of fatty acid compositionGas chromatography was used as previously describedby Boberg et al. [57] to analyze the FA compositionof five different lipid fractions: subcutaneous adiposetissue triacylglycerols (SAT-TG), plasma cholesterolesters (PL-CE), plasma phospholipids (PL-PL), liverphospholipids (liver PL) and liver triacylglycerols(liver TG).For the SAT and liver tissue, each tissue (5-25 mg of
SAT; 40–50 mg of liver tissue) was extracted in 2.5 mlmethanol and 5.0 ml chloroform (containing 0.005%butylated hydroxytoluene as an antioxidant). 7.5 ml0.2 mol/l sodium dihydrogen phosphate (Na2H2PO4)was added and the extract was left at +4°C over night.Both the liver and SAT chloroform phases were evapo-rated to dryness under nitrogen. The SAT lipid esters
Table 3 Dietary composition of the experimental diet
Composition by weight (g/kg)
Casein, 80 Mesh 233
L-Cystine 3.5
Corn Starch 84.8
Maltodextrin 116.5
Sucrose 201.4
Cellulose, BW200 58.3
Soybean Oil 29.1
Lard 206.8
Mineral Mix S10026 11.7
DiCalcium Phosphate 15.1
Calcium Carbonate 6.4
Potassium Citrate, 1 H2O 19.2
Vitamin Mix V10001 11.7
Choline Bitartrate 2.3
FD&C Red Dye #40 0.06
FA profile (% of total FAs)
Saturated 36.3
Monounsaturated 45.3
Polyunsaturated 18.5
Cedernaes et al. Lipids in Health and Disease 2013, 12:2 Page 8 of 11http://www.lipidworld.com/content/12/1/2
were transmethylated at 60°C overnight after addition of2 ml of 5% H2SO4 in methanol.For lipid extraction from plasma, 2.5 ml of methanol
was added to 0.5 ml of plasma. After thorough mixing ofthe extract, 5.0 ml Chloroform (containing 0.005% buty-lated hydroxytoluene as an antioxidant) and 7.5 ml of0.2 mM sodium dihydrogen phosphate (Na2H2PO4) wereadded and were left at + 4°C over night. The chloroformphase was evaporated to dryness under nitrogen and thelipid residue was dissolved in 200–300 μl chloroform.For the plasma and liver lipid fractions, the lipid esters
(triacylglycerols and phospholipids from liver; cholesterolesters and phospholipids from plasma) were separated bythin-layer chromatography (TLC). The chloroform solu-tion was applied to the adsorbent (Silica gel 60G, Merck)containing POPOP as a fluorescent agent. The TLC plateswere eluted at room temperature with the solvent systempetroleum benzine/diethyl ether/acetic acid (81:18:1, byvol). The lipid fractions were visualized in UV light andthe spots were scraped off into vials and the lipid esterswere transmethylated at 60°C overnight after addition of 2ml 5% H2SO4 in methanol.For all five lipid fractions, the methyl esters were
extracted into 3 ml of petroleum ether containing 0.005%butylated hydroxytolvene after addition of 1.5 ml distilledwater. The phases were separated after thorough mixingand centrifugation at 1500 × g for 10 min. The petroleumether phase was pipetted off and the solvent was evapo-rated under nitrogen. The methyl esters were then redis-solved in Uvasol, grade hexane.The FA methyl esters from the five different fractions
were separated by gas chromatography (GC) on a 30-mglass capillary column coated with Thermo TR-FAME(Thermo Electron Corporation, USA), with helium gas as acarrier gas. An Agilent Technologies system consisting ofmodel GC 6890N, autosampler 7683 and Agilent Chem-Station was used. The temperature was programmed to150–260°C. The FAs were identified by comparing eachpeak’s retention time with FA methyl ester standard NuCheck Prep (Elysian, MN, USA) and are expressed as rela-tive percentages of total FAs. Due to low proportions, notall FAs were quantifiable in all samples.
Glucometabolic and adipokine analysesPlasma insulin and glucose were analyzed with vali-dated in-house methods, whereas plasma adiponectinand leptin were measured with RIA kits according tothe manufacturer's instructions (Millipore AB, Solna,Sweden).
Statistical analysesTo minimize the number of statistical tests, we chose tolimit our statistical tests of FAs to the indices for desa-turases (SCD-16 (16:1n-7/16:0), SCD-18 (18:1n-9/18:0),
D6D (18:3n-6/18:2n-6), D5D (20:4n-6/20:3n-6), de novolipogenesis (DNL; 16:0/18:2n-6) and elongation (EI, 18:0/16:0), and important polyunsaturated FAs with bioactiveproperties, i.e. essential n-6 (18:2n-6, LA), and n-3 (18:3n-3,ALA) FAs as well as very long chain n-3 FAs (20:5n-3, EPA;22:6n-3, DHA). We also investigated the proportions of theSCD-16 product, 16:1n-7 (palmitoleate), since 16:1n-7 hasbeen proposed as an adipokine [41].GraphPad Prism v 5.02 (GraphPad Software Inc., San
Diego, CA) was used for all statistical calculations.Kolmogorov-Smirnov’s test of normality was first usedto determine whether data was normally distributed.The following parameters were found to be non-normally distributed in OP rats: SAT-TG D6D; PL-CEDNL index and EI; liver PL SCD-18, D6D and D5D; andliver TG SCD-16, DNL index, EI, 16:1n-7, and LA. In ORrats the non-normally distributed parameters were: dBw;SAT-TG D6D; PL-CE LA; and PL-PL EI. In HFD-pairedrats the non-normally distributed parameters were: initialbody weight; plasma insulin concentrations; SAT-TG D6Dand ALA; PL-PL ALA and EPA; and liver TG DHA. To de-tect differences between the three different groups, theinvestigated normally and non-normally distributed para-meters were analyzed using, respectively, One-way ANOVAor Kruskal-Wallis ANOVA. For significant ANOVAs, weproceeded with post-hoc tests to find significant group dif-ferences: for One-way ANOVA, Tukey’s test was used; forKruskal-Wallis, Dunn’s test was used. When only twogroups were compared, the Student’s t-test was used fornormally distributed data. For correlations, non-normallydistributed data was analyzed using Spearman’s rankcorrelation. Values were considered significant at theP < 0.05 level and are presented as means ± SD.
Ethical statementThe Ethical Committee for Animal Experiments in Uppsalaapproved the experiments and procedures. Animal careprocedures followed guidelines of EU (Convention ETS123and Directive86/609/EEC) and Swedish (Animal WelfareAct SFS1998:56) legislation on animal experiments.
AbbreviationsAL-HFD: Ad libitum high-fat diet; ALA: Alpha-linolenic acid; LA: Linoleic acid;D5D: Delta-5 desaturase; D6D: Delta-6 desaturase; DHA: Docosahexaenoicacid; dBw: Difference (gain) in body weight; DNL: De novo lipogenesis(index); EI: Elongation index; EPA: Eicosapentaenoic acid; FA: Fatty acid;HFD: High-fat diet; LA: Linoleic acid; OP: Obesity prone; OR: Obesity resistant;PL-CE: Plasma cholesterol esters; PL: Phospholipids; PL-PL: Plasmaphospholipids; SAT-TG: Subcutaneous adipose tissue triacylglycerols;SCD: Stearoyl-CoA desaturase; SCD-1: Stearoyl-CoA desaturase 1;TG: Triacylglycerols.
Competing interestsThe authors declare that they have no competing interests.
Authors’ contributionsJ. C. was responsible for analyzing and interpreting the data and writing themanuscript; J. A. was responsible for planning and conducting the
Cedernaes et al. Lipids in Health and Disease 2013, 12:2 Page 9 of 11http://www.lipidworld.com/content/12/1/2
experiment, analyzing the data, and writing the manuscript; Å. V. wasresponsible for analyzing the data, and writing the manuscript; U. R. wasresponsible for interpreting the data and writing the manuscript; H. B. S. wasresponsible for planning the study, interpreting the data and writing themanuscript. All authors read and approved the final manuscript.
AcknowledgmentsThis study and UR were supported by the Swedish Research Council (VR,medicine), Svenska Läkaresällskapet, Åhlén Foundation, The Novo NordiskFoundation, Swedish Royal Academy of Sciences, Borgströms Stiftelse andMagnus Bergvall Foundation. Special thanks to Marcus Sällman Almén for hisexpert input on the statistical analyses, to Colin Chapman for proofing themanuscript, to Siv Tengblad for FA analyses, to Anna-Lena Hulting forplasma analysis of hormone levels and to Ulrika Pettersson for help with thedissection of the adipose tissue.
Author details1Department of Neuroscience, Uppsala University, BMC, Uppsala, SE 75124,Sweden. 2Department of Psychology, University of Cambridge, Cambridge,UK. 3Department of Public Health and Caring Sciences, Clinical Nutrition andMetabolism, Uppsala University, Uppsala, Sweden.
Received: 13 September 2012 Accepted: 5 January 2013Published: 8 January 2013
References1. Bessesen DH, Bull S, Cornier MA: Trafficking of dietary fat and resistance
to obesity. Physiol Behav 2008, 94:681–688.2. Blundell JE, Stubbs RJ, Golding C, Croden F, Alam R, Whybrow S, Le Noury J,
Lawton CL: Resistance and susceptibility to weight gain: individualvariability in response to a high-fat diet. Physiol Behav 2005, 86:614–622.
3. Flatt JP: What do we most need to learn about food intake regulation?Obes Res 1998, 6:307–310.
4. Pickering C, Alsio J, Hulting AL, Schioth HB: Withdrawal from free-choicehigh-fat high-sugar diet induces craving only in obesity-prone animals.Psychopharmacology (Berl) 2009, 204:431–443.
5. Schemmel R, Mickelsen O, Gill JL: Dietary obesity in rats: Body weight andbody fat accretion in seven strains of rats. J Nutr 1970, 100:1041–1048.
6. West DB, Boozer CN, Moody DL, Atkinson RL: Dietary obesity in nineinbred mouse strains. Am J Physiol 1992, 262:R1025–R1032.
7. Levin BE, Triscari J, Hogan S, Sullivan AC: Resistance to diet-inducedobesity: food intake, pancreatic sympathetic tone, and insulin. Am JPhysiol 1987, 252:R471–R478.
8. Levin BE, Triscari J, Sullivan AC: Relationship between sympathetic activityand diet-induced obesity in two rat strains. Am J Physiol 1983,245:R364–R371.
9. Jackman MR, MacLean PS, Bessesen DH: Energy expenditure in obesity-prone and obesity-resistant rats before and after the introduction of ahigh-fat diet. Am J Physiol Regul Integr Comp Physiol 2010,299:R1097–R1105.
10. Dobrian AD, Davies MJ, Prewitt RL, Lauterio TJ: Development ofhypertension in a rat model of diet-induced obesity. Hypertension 2000,35:1009–1015.
11. Perez-Echarri N, Noel-Suberville C, Redonnet A, Higueret P, Martinez JA,Moreno-Aliaga MJ: Role of adipogenic and thermogenic genes insusceptibility or resistance to develop diet-induced obesity in rats.J Physiol Biochem 2007, 63:317–327.
12. Wang X, Choi JW, Joo JI, Kim DH, Oh TS, Choi DK, Yun JW: Differentialexpression of liver proteins between obesity-prone and obesity-resistantrats in response to a high-fat diet. Br J Nutr 2011, 106:612–626.
13. Li H, Xie Z, Lin J, Song H, Wang Q, Wang K, Su M, Qiu Y, Zhao T, Song K,et al: Transcriptomic and metabonomic profiling of obesity-prone andobesity-resistant rats under high fat diet. J Proteome Res 2008,7:4775–4783.
14. Chang S, Graham B, Yakubu F, Lin D, Peters JC, Hill JO: Metabolicdifferences between obesity-prone and obesity-resistant rats. Am JPhysiol 1990, 259:R1103–R1110.
15. Ji H, Friedman MI: Reduced capacity for fatty acid oxidation in rats withinherited susceptibility to diet-induced obesity. Metabolism 2007,56:1124–1130.
16. Ji H, Outterbridge LV, Friedman MI: Phenotype-based treatment of dietaryobesity: differential effects of fenofibrate in obesity-prone and obesity-resistant rats. Metabolism 2005, 54:421–429.
17. Jackman MR, Kramer RE, MacLean PS, Bessesen DH: Trafficking of dietaryfat in obesity-prone and obesity-resistant rats. Am J Physiol EndocrinolMetab 2006, 291:E1083–E1091.
18. Abu-Elheiga L, Matzuk MM, Abo-Hashema KA, Wakil SJ: Continuous fattyacid oxidation and reduced fat storage in mice lacking acetyl-CoAcarboxylase 2. Science 2001, 291:2613–2616.
19. Ntambi JM, Miyazaki M, Stoehr JP, Lan H, Kendziorski CM, Yandell BS, SongY, Cohen P, Friedman JM, Attie AD: Loss of stearoyl-CoA desaturase-1function protects mice against adiposity. Proc Natl Acad Sci U S A 2002,99:11482–11486.
20. Moussavi N, Gavino V, Receveur O: Could the quality of dietary fat, andnot just its quantity, be related to risk of obesity? Obesity (Silver Spring)2008, 16:7–15.
21. Hariri N, Thibault L: High-fat diet-induced obesity in animal models.Nutr Res Rev 2010, 23:270–299.
22. Kawashima A, Sugawara S, Okita M, Akahane T, Fukui K, Hashiuchi M,Kataoka C, Tsukamoto I: Plasma fatty acid composition, estimateddesaturase activities, and intakes of energy and nutrient in Japanesemen with abdominal obesity or metabolic syndrome. J Nutr Sci Vitaminol(Tokyo) 2009, 55:400–406.
23. Vessby B, Gustafsson IB, Tengblad S, Boberg M, Andersson A: Desaturationand elongation of Fatty acids and insulin action. Ann N Y Acad Sci 2002,967:183–195.
24. Warensjo E, Riserus U, Vessby B: Fatty acid composition of serum lipidspredicts the development of the metabolic syndrome in men.Diabetologia 2005, 48:1999–2005.
25. Warensjo E, Sundstrom J, Vessby B, Cederholm T, Riserus U: Markers ofdietary fat quality and fatty acid desaturation as predictors of total andcardiovascular mortality: a population-based prospective study. Am J ClinNutr 2008, 88:203–209.
26. Kotronen A, Seppanen-Laakso T, Westerbacka J, Kiviluoto T, Arola J,Ruskeepaa AL, Oresic M, Yki-Jarvinen H: Hepatic stearoyl-CoA desaturase(SCD)-1 activity and diacylglycerol but not ceramide concentrations areincreased in the nonalcoholic human fatty liver. Diabetes 2009,58:203–208.
27. Warensjo E, Ohrvall M, Vessby B: Fatty acid composition and estimateddesaturase activities are associated with obesity and lifestyle variables inmen and women. Nutr Metab Cardiovasc Dis 2006, 16:128–136.
28. Peter A, Cegan A, Wagner S, Lehmann R, Stefan N, Konigsrainer A,Konigsrainer I, Haring HU, Schleicher E: Hepatic lipid composition andstearoyl-coenzyme A desaturase 1 mRNA expression can be estimatedfrom plasma VLDL fatty acid ratios. Clin Chem 2009, 55:2113–2120.
29. Sampath H, Ntambi JM: Polyunsaturated fatty acid regulation of geneexpression. Nutr Rev 2004, 62:333–339.
30. Jump DB, Botolin D, Wang Y, Xu J, Christian B, Demeure O: Fatty acidregulation of hepatic gene transcription. J Nutr 2005, 135:2503–2506.
31. Bjermo H, Riserus U: Role of hepatic desaturases in obesity-relatedmetabolic disorders. Curr Opin Clin Nutr Metab Care 2010, 13:703–708.
32. Flowers MT, Ntambi JM: Stearoyl-CoA desaturase and its relation to high-carbohydrate diets and obesity. Biochim Biophys Acta 2009, 1791:85–91.
33. Kakuma T, Lee Y, Unger RH: Effects of leptin, troglitazone, and dietary faton stearoyl CoA desaturase. Biochem Biophys Res Commun 2002,297:1259–1263.
34. Qiu J, Cheng R, Zhou XY, Zhu JG, Zhu C, Qin DN, Kou CZ, Guo XR: Geneexpression profiles of adipose tissue of high-fat diet-induced obese ratsby cDNA microarrays. Mol Biol Rep 2010, 37:3691–3695.
35. Estrany ME, Proenza AM, Llado I, Gianotti M: Isocaloric intake of a high-fatdiet modifies adiposity and lipid handling in a sex dependent manner inrats. Lipids Health Dis 2011, 10:52.
36. Sampath H, Miyazaki M, Dobrzyn A, Ntambi JM: Stearoyl-CoA desaturase-1mediates the pro-lipogenic effects of dietary saturated fat. J Biol Chem2007, 282:2483–2493.
37. Ntambi JM, Miyazaki M: Recent insights into stearoyl-CoA desaturase-1.Curr Opin Lipidol 2003, 14:255–261.
38. Warensjo E, Riserus U, Gustafsson IB, Mohsen R, Cederholm T, Vessby B:Effects of saturated and unsaturated fatty acids on estimated desaturaseactivities during a controlled dietary intervention. Nutr Metab CardiovascDis 2008, 18:683–690.
Cedernaes et al. Lipids in Health and Disease 2013, 12:2 Page 10 of 11http://www.lipidworld.com/content/12/1/2
39. Hu CC, Qing K, Chen Y: Diet-induced changes in stearoyl-CoA desaturase1 expression in obesity-prone and -resistant mice. Obes Res 2004,12:1264–1270.
40. Warensjo E, Ingelsson E, Lundmark P, Lannfelt L, Syvanen AC, Vessby B,Riserus U: Polymorphisms in the SCD1 gene: associations with body fatdistribution and insulin sensitivity. Obesity (Silver Spring) 2007,15:1732–1740.
41. Cao H, Gerhold K, Mayers JR, Wiest MM, Watkins SM, Hotamisligil GS:Identification of a lipokine, a lipid hormone linking adipose tissue tosystemic metabolism. Cell 2008, 134:933–944.
42. Cohen P, Miyazaki M, Socci ND, Hagge-Greenberg A, Liedtke W, Soukas AA,Sharma R, Hudgins LC, Ntambi JM, Friedman JM: Role for stearoyl-CoAdesaturase-1 in leptin-mediated weight loss. Science 2002, 297:240–243.
43. Flowers JB, Rabaglia ME, Schueler KL, Flowers MT, Lan H, Keller MP, NtambiJM, Attie AD: Loss of stearoyl-CoA desaturase-1 improves insulinsensitivity in lean mice but worsens diabetes in leptin-deficient obesemice. Diabetes 2007, 56:1228–1239.
44. Liu X, Miyazaki M, Flowers MT, Sampath H, Zhao M, Chu K, Paton CM, JooDS, Ntambi JM: Loss of Stearoyl-CoA desaturase-1 attenuates adipocyteinflammation: effects of adipocyte-derived oleate. Arterioscler Thromb VascBiol 2010, 30:31–38.
45. Iggman D, Arnlov J, Vessby B, Cederholm T, Sjogren P, Riserus U: Adiposetissue fatty acids and insulin sensitivity in elderly men. Diabetologia 2010,53:850–857.
46. Summers LK, Fielding BA, Bradshaw HA, Ilic V, Beysen C, Clark ML, MooreNR, Frayn KN: Substituting dietary saturated fat with polyunsaturated fatchanges abdominal fat distribution and improves insulin sensitivity.Diabetologia 2002, 45:369–377.
47. Riserus U, Willett WC, Hu FB: Dietary fats and prevention of type 2diabetes. Prog Lipid Res 2009, 48:44–51.
48. Hodson L, Fielding BA: Stearoyl-CoA desaturase: rogue or innocentbystander? Prog Lipid Res 2012, 52:15–42.
49. Lin J, Choi YH, Hartzell DL, Li C, Della-Fera MA, Baile CA: CNS melanocortinand leptin effects on stearoyl-CoA desaturase-1 and resistin expression.Biochem Biophys Res Commun 2003, 311:324–328.
50. Zhang W, Della-Fera MA, Hartzell DL, Hausman D, Baile CA: Adipose tissue geneexpression profiles in ob/ob mice treated with leptin. Life Sci 2008, 83:35–42.
51. Mullen KL, Pritchard J, Ritchie I, Snook LA, Chabowski A, Bonen A, Wright D,Dyck DJ: Adiponectin resistance precedes the accumulation of skeletalmuscle lipids and insulin resistance in high-fat-fed rats. Am J Physiol RegulIntegr Comp Physiol 2009, 296:R243–R251.
52. Oana F, Takeda H, Hayakawa K, Matsuzawa A, Akahane S, Isaji M, AkahaneM: Physiological difference between obese (fa/fa) Zucker rats and leanZucker rats concerning adiponectin. Metabolism 2005, 54:995–1001.
53. Perez-Echarri N, Perez-Matute P, Martinez JA, Marti A, Moreno-Aliaga MJ: Serumand gene expression levels of leptin and adiponectin in rats susceptible orresistant to diet-induced obesity. J Physiol Biochem 2005, 61:333–342.
54. Bullen JW Jr, Bluher S, Kelesidis T, Mantzoros CS: Regulation of adiponectinand its receptors in response to development of diet-induced obesity inmice. Am J Physiol Endocrinol Metab 2007, 292:E1079–E1086.
55. Alsio J, Olszewski PK, Norback AH, Gunnarsson ZE, Levine AS, Pickering C,Schioth HB: Dopamine D1 receptor gene expression decreases in thenucleus accumbens upon long-term exposure to palatable food anddiffers depending on diet-induced obesity phenotype in rats.Neuroscience 2010, 171:779–787.
56. Caesar R, Manieri M, Kelder T, Boekschoten M, Evelo C, Muller M, Kooistra T,Cinti S, Kleemann R, Drevon CA: A combined transcriptomics andlipidomics analysis of subcutaneous, epididymal and mesenteric adiposetissue reveals marked functional differences. PLoS One 2010, 5:e11525.
57. Boberg M, Croon LB, Gustafsson IB, Vessby B: Platelet fatty acidcomposition in relation to fatty acid composition in plasma and toserum lipoprotein lipids in healthy subjects with special reference to thelinoleic acid pathway. Clin Sci (Lond) 1985, 68:581–587.
doi:10.1186/1476-511X-12-2Cite this article as: Cedernaes et al.: Adipose tissue stearoyl-CoAdesaturase 1 index is increased and linoleic acid is decreased inobesity-prone rats fed a high-fat diet. Lipids in Health and Disease 201312:2.
Submit your next manuscript to BioMed Centraland take full advantage of:
• Convenient online submission
• Thorough peer review
• No space constraints or color figure charges
• Immediate publication on acceptance
• Inclusion in PubMed, CAS, Scopus and Google Scholar
• Research which is freely available for redistribution
Submit your manuscript at www.biomedcentral.com/submit
Cedernaes et al. Lipids in Health and Disease 2013, 12:2 Page 11 of 11http://www.lipidworld.com/content/12/1/2
Related Documents