ADAPTIVE RANKING OF FACIAL ATTRACTIVENESS Chong Cao 1 , Iljung Sam Kwak 2 , Serge Belongie 3 , David Kriegman 2 and Haizhou Ai 1 1 Department of Computer Science and Technology, Tsinghua University, Beijing 2 Department of Computer Science and Engineering, University of Califonia, San Diego 3 Department of Computer Science, Cornell University and Cornell NYC Tech ABSTRACT As humans, we love to rank things. Top ten lists exist for everything from movie stars to scary animals. Ambiguities (i.e., ties) naturally occur in the process of ranking when peo- ple feel they cannot distinguish two items. Human reported rankings derived from star ratings abound on recommenda- tion websites such as Yelp and Netflix. However, those web- sites differ in star precision which points to the need for rank- ing systems that adapt to an individual user’s preference sensi- tivity. In this work we propose an adaptive system that allows for ties when collecting ranking data. Using this system, we propose a framework for obtaining computer-generated rank- ings. We test our system and a computer-generated ranking method on the problem of evaluating human attractiveness. Extensive experimental evaluations and analysis demonstrate the effectiveness and efficiency of our work. Index Terms— ranking, rating, adaptive methods, facial attractiveness 1. INTRODUCTION With the growth of social media, people are increasingly will- ing to provide and avail themselves of recommendations on the Internet. An example of image ranking occurs in the pro- cess of image search. In this case, similarity to a query is based on the output of a classifier, where the more similar the image is, the higher the rank. We often would like computer generated rankings to reflect human preferences and many ranking tasks have compared their outputs to human results [1, 2]. Collecting human rankings, however, is a difficult task. In order to obtain a full ranking of a set of images, a user must consider all pairs of images [3, 4], which is extremely time consuming and tedious. In addition to the large number of comparisons, there are often cases where humans are unable or unwilling to assert a preference between two images. In past crowd sourced experiments, researchers have sometimes provided an “I don’t know” option. This allows users to con- fer equality or ambiguity to pairs of images. We investigate this equality in rankings using harvested image ratings from users. Although not widely used in com- puter vision, user ratings are prevalent throughout the Inter- X Time X Equivalence Sensitivity (a) Time Equivalence X Sensitivity (b) X Time X Equivalence X Sensitivity (c) Fig. 1. In order to rank images, practitioners have generally used two different techniques to collect user preferences. Rat- ing methods (a) require users to assign a score to each item. Pairwise comparison (b) asks users to declare a preference between all possible pairs of items. Our adaptive ranking method asks the user to divide the items into better/worse cat- egories recursively until the user deems all items in a category equal in rank. net for recommendations and surveys. An early and influ- ential work that collects user preferences using rankings is [5], where the users are asked to answer each question with one of the five responses: Strongly Approve, Approve, Un- decided, Disapprove, and Strongly Disapprove. Sites such as Yelp and Netflix allow users to rate restaurants and movies from one to five stars. However the two sites use different star conventions. Yelp allows for half stars whereas Netflix allows for tenths of a star. Additionally, movies have also been rated as number of thumbs and even a scale from one to one hundred. The varying levels of precision allow users freedom to be more specific in their ratings, but it does com- plicate the choice of the number of bins to use. Additionally it is unlikely that all individuals are equally sensitive to the topic being rated. A wine connoisseur may rate wine on a far more precise scale than someone who is unfamiliar with wine. As for learning and predicting a ranking list, the most widely used method is based on Support Vector Machines (SVM) [1, 2, 7]. These ranking techniques ignore equivalent relationships [8, 9]. In [10], an improved RankSVM is pre-

Welcome message from author
This document is posted to help you gain knowledge. Please leave a comment to let me know what you think about it! Share it to your friends and learn new things together.
Transcript

ADAPTIVE RANKING OF FACIAL ATTRACTIVENESS
Chong Cao1, Iljung Sam Kwak2, Serge Belongie3, David Kriegman2 and Haizhou Ai1
1Department of Computer Science and Technology, Tsinghua University, Beijing2Department of Computer Science and Engineering, University of Califonia, San Diego
3Department of Computer Science, Cornell University and Cornell NYC Tech
ABSTRACT
As humans, we love to rank things. Top ten lists exist foreverything from movie stars to scary animals. Ambiguities(i.e., ties) naturally occur in the process of ranking when peo-ple feel they cannot distinguish two items. Human reportedrankings derived from star ratings abound on recommenda-tion websites such as Yelp and Netflix. However, those web-sites differ in star precision which points to the need for rank-ing systems that adapt to an individual user’s preference sensi-tivity. In this work we propose an adaptive system that allowsfor ties when collecting ranking data. Using this system, wepropose a framework for obtaining computer-generated rank-ings. We test our system and a computer-generated rankingmethod on the problem of evaluating human attractiveness.Extensive experimental evaluations and analysis demonstratethe effectiveness and efficiency of our work.
Index Terms— ranking, rating, adaptive methods, facialattractiveness
1. INTRODUCTION
With the growth of social media, people are increasingly will-ing to provide and avail themselves of recommendations onthe Internet. An example of image ranking occurs in the pro-cess of image search. In this case, similarity to a query isbased on the output of a classifier, where the more similar theimage is, the higher the rank. We often would like computergenerated rankings to reflect human preferences and manyranking tasks have compared their outputs to human results[1, 2]. Collecting human rankings, however, is a difficult task.In order to obtain a full ranking of a set of images, a user mustconsider all pairs of images [3, 4], which is extremely timeconsuming and tedious. In addition to the large number ofcomparisons, there are often cases where humans are unableor unwilling to assert a preference between two images. Inpast crowd sourced experiments, researchers have sometimesprovided an “I don’t know” option. This allows users to con-fer equality or ambiguity to pairs of images.
We investigate this equality in rankings using harvestedimage ratings from users. Although not widely used in com-puter vision, user ratings are prevalent throughout the Inter-
X� TimeX� Equivalence� Sensitivity
(a)
� Time� EquivalenceX� Sensitivity
(b)
X� TimeX� EquivalenceX� Sensitivity
(c)
Fig. 1. In order to rank images, practitioners have generallyused two different techniques to collect user preferences. Rat-ing methods (a) require users to assign a score to each item.Pairwise comparison (b) asks users to declare a preferencebetween all possible pairs of items. Our adaptive rankingmethod asks the user to divide the items into better/worse cat-egories recursively until the user deems all items in a categoryequal in rank.
net for recommendations and surveys. An early and influ-ential work that collects user preferences using rankings is[5], where the users are asked to answer each question withone of the five responses: Strongly Approve, Approve, Un-decided, Disapprove, and Strongly Disapprove. Sites such asYelp and Netflix allow users to rate restaurants and moviesfrom one to five stars. However the two sites use differentstar conventions. Yelp allows for half stars whereas Netflixallows for tenths of a star. Additionally, movies have alsobeen rated as number of thumbs and even a scale from oneto one hundred. The varying levels of precision allow usersfreedom to be more specific in their ratings, but it does com-plicate the choice of the number of bins to use. Additionallyit is unlikely that all individuals are equally sensitive to thetopic being rated. A wine connoisseur may rate wine on afar more precise scale than someone who is unfamiliar withwine.
As for learning and predicting a ranking list, the mostwidely used method is based on Support Vector Machines(SVM) [1, 2, 7]. These ranking techniques ignore equivalentrelationships [8, 9]. In [10], an improved RankSVM is pre-

(a) (b) (c) (d)Fig. 2. Our system can be divided into four parts. (a) Human labeling process: We ask the users to rank all the images in ahierarchical manner. The ranking list forms a tree where each node represents a group of unlabeled pictures. As the systembuilds a ranking tree, the users are asked to divide each unlabeled node into better and worse groups until they can’t make adecision. Pictures in the same leaf node are equally attractive to the user. (b) Feature selection: Each image is representedby a set of facial attributes [6]. (c) We train a tree structured classifier that combines multiple linear SVM classifiers, whichcorresponds to the user ranking tree shown in (a). (d) For a new set of images, we put them in the tree-structured SVM classifierand estimate the attractiveness ranking.
sented to handle equivalence in relative comparisons. Whendealing with large-scale data in web content classification, hi-erarchical classification is a widely used method. A decisiontree is built to hierarchically classify an item into its corre-sponding category [11–13], which takes the different impor-tance of hierarchical categories into consideration.
In this paper we investigate image ranking as a method ofcollecting user preferences. This method collects preferencesin a hierarchical manner that adapts to different user sensitiv-ity levels. At each iteration, a user is asked to split images intobetter or worse categories until the user is no longer able tosplit them. This method has no pre-specified number of binsand allows users to be as precise as they desire for images thatthey care about, and imprecise for images that they don’t. Wetest our method on facial attractiveness.
Past work in measuring facial attractiveness collected hu-man preferences through ratings [1, 14, 15] or pairwise com-parisons [2]. However, as mentioned previously, ratings can-not capture the sensitivity of each user’s preferences, there-fore it may not be the best method of collecting user data.On the other hand, pairwise comparisons are time consumingand cannot handle the case when users do not have a pref-erence. We avoid the difficulties of previous data collectiontechniques by building an adaptive ranking system that allowsusers to rate images into any number of bins. Figure 1 com-pares different ranking methods in terms of time consumed,ability to handle ties and adaptivity to different user sensitiv-ity levels.
We also focus on a slightly different aspect of facial attrac-tiveness. Rather than sorting a gallery of different individuals,we ask users to sort a collection of photos of a single individ-ual. User profiles for many websites allow users to providea photo of themselves. For dating services, it would be idealto put a user’s most attractive photo. For these sites, it maybe desirable to present a different version of the user based
on different visitor preferences. In [16], the authors define aset of beauty-related attributes (i.e. shape of face, eyes andlip) and beauty attributes (i.e. hairstyle, make-up), and train asuper-graphs recommendation model between them. Given afacial image, they infer the most compatible beauty attributesand synthesize a beautiful facial image. The idea is quite sim-ilar to our work, but our goal is finding the relationship be-tween facial attributes and attractiveness.
2. METHODS
The framework of our system is shown in Figure 2. We firstpresent how to collect an adaptive ranking list from humansby recursive better vs. worse division, as shown in Figure 2(a).Then we show how to use a hierarchical-SVM to learn theranking list in Figure 2(b) and (c), and to make predictions ona new set of images in Figure 2(d).
2.1. Human labeling process
To allow for different binnings from different users, we use ahierarchical labeling system to collect rankings. We ask theuser to keep dividing the images into better vs. worse cate-gories until they can no longer differentiate the images. Werepresent our ranking results as a tree, where the root nodecontains all the pictures. As shown in Figure 2(a), pictures inthe left child node are more attractive than those in the rightchild node. Leaf nodes are formed when a user is unable todecide which images are more or less attractive. We ask theuser to continue splitting nodes recursively until all the pic-tures in the root node are put in one leaf node.
Let V represent the set of labels. Here the labels inV are nodes in a hierarchical classification tree T . V ∈{0, 1, . . . N − 1} where N = |V| and 0 is the root of the tree.For each node v ∈ V , A(v) denotes the set of ancestors of v,D(v) the set of descendants of v and C(v) the set of children

of v. For convenience, we denote D+(v) = D(v) ∪ v, lc(v)the left child of v and rc(v) the right child of v. We definea node v as a leaf node when C(v) = ∅. We also define acomparative relation between nodes:
u ≺ v, when ∃w ∈ A(u) ∩A(v),
s.t. u ∈ D+(lc(w)), v ∈ D+(rc(w))(1)
In the human labeling procedure, we want the user to assigna label yk for each image Ik, k ∈ {1, 2, . . . ,m}, and m is thenumber of images we need to label. At the beginning of ourranking process, we assign all the images with label 0, namelyputting them in the root node yk = 0. Then, as the user iter-atively divides the images into better and worse, we assign acorresponding node label for each picture, until all the imagesare labeled with a leaf node. As shown in Equation 1, we cansee the comparative relation between two labels yk and yl isthe same as the relation of attractiveness between two imagesIk and Il, namely:
Ik ≺ Il, when yk ≺ yl
Ik ∼ Il, when yk = yl(2)
Algorithm 1 illustrates the recursive data collection process indetail. In order to rank a set of pictures, we simply put all thepictures in the root node 0 and call the function DIVIDE(0) torecursively show users a set of unlabeled images and ask fortheir responses.
Algorithm 1 Human labeling process1: procedure DIVIDE(v)2: if can’t decide then3: return4: else5: for each Ik, k ∈ {1, . . .m} and yk is v do6: if Ik is more attractive then7: set yk = lc(v)8: else9: set yk = rc(v)
10: end if11: end for12: DIVIDE(lc(v))13: DIVIDE(rc(v))14: end if15: end procedure
2.2. Learning the Hierarchical-SVM
In this section we describe our learning algorithm for theadaptive ranking tree. In [10], the authors use RankSVM withequivalent classes to rank images. The classifier is trainedwith labeled pairs of images. Each pair of images belongs ei-ther to a set of ordered images, or equivalent images. Theytrain a ranking function that can maximize the distance be-tween an ordered pair of images and minimize the distance
between an equivalent pair. However, their formulation trainson a set of pairwise comparisons and is not able to take fulladvantage of the ranking tree we build.
Given a set of images Ik, k ∈ {1, 2, . . . ,m} and the hi-erarchical ranking tree T , as described before, our goal is tolearn a function r(Ik) that maps an image to a rank. At eachnode in the tree, the user is asked to label a subset of the im-ages as better or worse, and these labeled images will be usedto train a hierarchical set of binary SVMs. This hierarchicalset of classifiers will rank a set of input images as shown inFigure 1.
Here we use facial attributes [6] to describe faces. LetX ⊂ Rn represent the feature domain. After we collecta ranking result from a user, we run the attribute classifierand get a set of attribute vectors (x1, y1), . . . (xm, ym), whereeach xk ∈ X and yk ∈ Y . Our goal is to learn a classifica-tion function f : X → Y . The hierarchical classification treetrains a vector ωv ∈ Rn at each node v, and classifier functionf(x) finds the class label y for an input x recursively.
In other words, we find the label for an input by sequen-tially classifying it into better or worse categories till a leafnode is reached. In that way, the task of learning f(x) re-duces to an optimization problem of learning a set of vectorsωu:
minimize 12‖ωu‖2 s.t. yk(ω>
u xk − b) ≥ 1u ∈ {0, . . . N − 1} and C(u) 6= Φ,
xk ∈ Rn, yk =
{1, yk ∈ D+(lc(u))−1, yk ∈ D+(rc(u))
(3)
In this way, our method creates a ranking list that has a sim-ilar structure as the training list adapted to the user’s rankingsensitivity.
2.3. Associating new individuals
The adaptive ranking tree captures a user’s preference over aset of images. In our work, all of the images in the set depictthe same individual. We are able to use this information topredict a user’s preference for another individual. However,this is not as straightforward as simply applying the trainedhierarchical-SVM. A user may have certain preferences perindividual. For example, one might think Angelina Jolie looksbetter with curly hair while Avril Lavigne looks better withstraight hair.
In order to handle this, we create ranking trees for im-ages of multiple individuals. These trees represent a galleryof preferences. Then for a new individual to rank, we findthe most similar image in our gallery and use a vote to de-cide with whom we are going to associate the new individual.Here we simply use the Pearson product-moment correlationcoefficient [17] of attributes to measure similarity betweentwo images. We then use this associated person’s hierarchi-cal SVM classifier to predict rankings of pictures of the newperson.

3. EXPERIMENTS
In order to verify our method, we first must determine whatmakes a good ranking list. As we have mentioned earlier, afull ranking can be ambiguous and a star rating system maynot meet different user’s needs. The goal of this paper isto find a way to capture a user’s ranking preference that al-lows the most flexibility and accuracy. We run experimentson a subset of the PubFig dataset [6] and compare differenttechniques for collecting ranking lists from Amazon Mechan-ical Turk (AMT) workers. The PubFig dataset contains 200celebrities and on average 297 images for each celebrity. Eachimage is labeled with 65 attribute scores obtained from at-tribute classifiers (e.g. hair color, hair style, eyebrow style).For this set of experiments we test to see how consistent usersare at ranking the same set of images and how well an algo-rithm trained on user data predicts the ranking for a differentset of images for the same subject. We also use the rankingmethod we proposed to predict the attractiveness ranking ofunseen individuals. We compared this result to the RankSVMmethod with equivalent classes [10]. We show that our rank-ing method is more accurate and preserves the user’s rankingsensitivity.
3.1. Consistency and informativeness of different rankinglists
Intuitively, we feel that users will be more consistent at rank-ing with a smaller number of bins. It should be easier for auser to rank images into better and worse, than to rank theminto 10 bins. Even more trivially, to be consistent 100% of thetime, we could ask users to rank images into one bin. How-ever this kind of ranking is not informative of the user’s pref-erences at all. In addition to consistency, it is important toconsider the informativeness captured in a ranking. A simpleway to do this is to compute the ratio of equal pairs to all pairs.Suppose a ranking list R has L bins, {Bk|k ∈ {1, . . . L}},and the kth bin contains nk images, |Bk| = nk. Here wedefine the informativeness of such a ranking list as:
informativeness(R) = 1−∑L
k=1
(nk
2
)(∑Lk=1 nk
2
) (4)
For example, if all m images have been ranked into one bin,all pairs of images would have equal rank. Then the ratio of
equal pairs to all pairs is 1− (m2 )
(m2 )
= 0. If we have a unique bin
for each image, then no pairs have equal ranking. In this waythe ratio is 1 − 0
(m2 )
= 1. In general, the larger the number
of bins employed by a user, the more informative the rankingis. Figure 1 shows the relationship between bin numbers andinformativeness.
We test our ranking method on AMT. In our experiment,we ask a user to rank a set of images of a celebrity. We askthem to do this twice to measure the user’s ability to replicatehis or her original ranking. Each set contains 24 pictures of
Fig. 3. Relationship between informativeness and number ofbins. Red line is the highest informativeness a ranking canprovide with a certain number of bins and blue line is thelowest (distribution of bins also influences the informative-ness). We see that informativeness increases as the numberof bins increases. Although an individual can always rate im-ages with one bin with high consistency, there is no informa-tiveness in such a rating scheme.
a celebrity. After the user finishes ranking the set of imagesfor the first time, we ask the user to take a break and return torank the same set of images. In order to prevent the user fromeasily memorizing the images, we change the order of im-ages. We randomly select five celebrities (4 females, 1 male)from the PubFig dataset for this experiment. We choose touse more female celebrities since they exhibited greater vari-ability in facial attributes and expressions. We have 150 AMTworkers do our experiments and each set of images is rankedby 30 unique AMT workers. Each worker is asked to rank theimages in one of five different ways: 2-bin (namely good andbad), 5-bin (one to five star rating), 10-bin (one to ten star rat-ing), pairwise comparison (compare each pair of images andsee which one is better), and our hierarchical ranking method.We use the Spearman’s footrule distance [18] to evaluate theinter-user consistency and intra-user difference of our rank-ing. Ranked ties are assigned a rank equal to the average oftheir positions in the ascending order of the values. With thisdistance, the lower the score, the more similar the two rank-ing lists are and the more consistent the user is at ranking theimages.
As shown in Table 1, we can find that the distance be-tween two rounds of rankings of the same user is far lessthan the distance between two rankings from different users,as one would expect since facial attractiveness is subjective.The intra-user difference for the 2-bin ranking method is obvi-ously smaller than other methods, which indicates users tendto have a similar preference if they only divide a large set ofpictures into better vs. worse. As they go into finer compari-son, the difference between users’ preferences will grow. Wedesire a ranking method that is both informative and consis-tent with the users. We can see that our hierarchical rankinglist can maintain consistency comparable to the 2-bin rankingwith an effective bin count of 16.8, thereby providing consid-
2-bin 5-bin 10-bin pair hierarchicalinter-cons 3.61 5.16 5.51 6.83 3.75intra-dif 5.05 6.88 7.17 7.71 6.73bin num 2.00 4.58 7.85 24 16.8time (s) 54.29 124.33 129.67 683.30 189.90
Table 1. Results comparing different ranking approaches.Each column represents a different ranking method. From leftto right: 2-bin rating (divide the images into better vs. worse),5-bin rating (rate the images from 1 to 5 stars), 10-bin rating(rate the images from 1 to 10 stars), pairwise comparison andour hierarchical ranking method. Each row is a measurementwe use to evaluate those methods. From top to bottom wehave: average inter-user consistency, average intra-user dif-ference, average number of bins in the result ranking list andaverage time consumed for ranking 24 images. The inter-userconsistency and intra-user difference is measured with Spear-man’s footrule distance. The smaller the distance, the moresimilar the two ranking lists.
erably more informativeness than the 2-bin, 5-bin and 10-binranking method. Although we require the AMT workers torate the picture from one to five or one to ten, they are notusing all of the scores we provide. On average, only 4.58 outof 5 and 7.85 out of 10 scores are used. That is partly becauserating system with a fixed number of bins doesn’t meet every-one’s attractiveness sensitivity. From the time comparison ofthe different ranking methods, we can see 2-bin ranking takesthe least time and pairwise comparison takes far more timethan other ranking methods. This echoes the observation in[2], that pairwise comparison is very time consuming.
3.2. Predicting a user’s preference
When using a ranking method to predict a user-personalizedranking list, we consider two aspects. The first one is theaccuracy of our method, which could be evaluated by usingthe Spearman’s footrule distance between the prediction re-sult and the human labeled ground truth. The other aspectis how well our prediction result matches the user’s sensitiv-ity of ranking. We evaluate this by comparing the number ofleaves in the tree and the number of bins in the prediction re-sult. We desire a ranking list that is as consistent as possible,and has a similar number of bins as the human-labeled groundtruth.
To test our hierarchical ranking method, we run experi-ments with 20 different celebrities’ photos sets (16 females,4 males). There are 48 images for each celebrity. We splitthe images into two groups, 24 for training and 24 for testing.We collect hierarchical ranking lists from 150 different AMTworkers.
We compare our methods with improved RankSVM [10].Results are shown in Table 2. We can see the hierarchicalSVM method performs better in accuracy, and on average itresults in 11.4 bins, which is more similar to the human la-
beled average of 18.6 bins than the RankSVM result with 6.84bins. We also provide some visualized results in Figure 5.
Hierarchical Rank-SVMSP DP DP(R) SP DP DP(R)
Distance 6.21 6.84 7.62 7.07 7.55 7.75NoB in P 11.4 10.4 8.12 6.84 6.52 6.60
NoB in HLD 18.6 18.0 18.0 18.6 18.0 18.0
Table 2. Results comparing our hierarchical-SVM approachto RankSVM with equivalence. Here, SP means “Same Per-son.” DP means “Different Person.” H means “HierarchicalSVM.” R means “RankSVM.” The (R) indicates the use of arandom associated person. NoB means “Number of Bins.” Pmeans “Prediction” and HLD means “Human labeled data.”The distance between two ranking lists is measured withSpearman’s footrule distance. We desire a small distance, in-dicating a result similar to the human labeled ranked lists.
3.3. Find the Associated Individuals
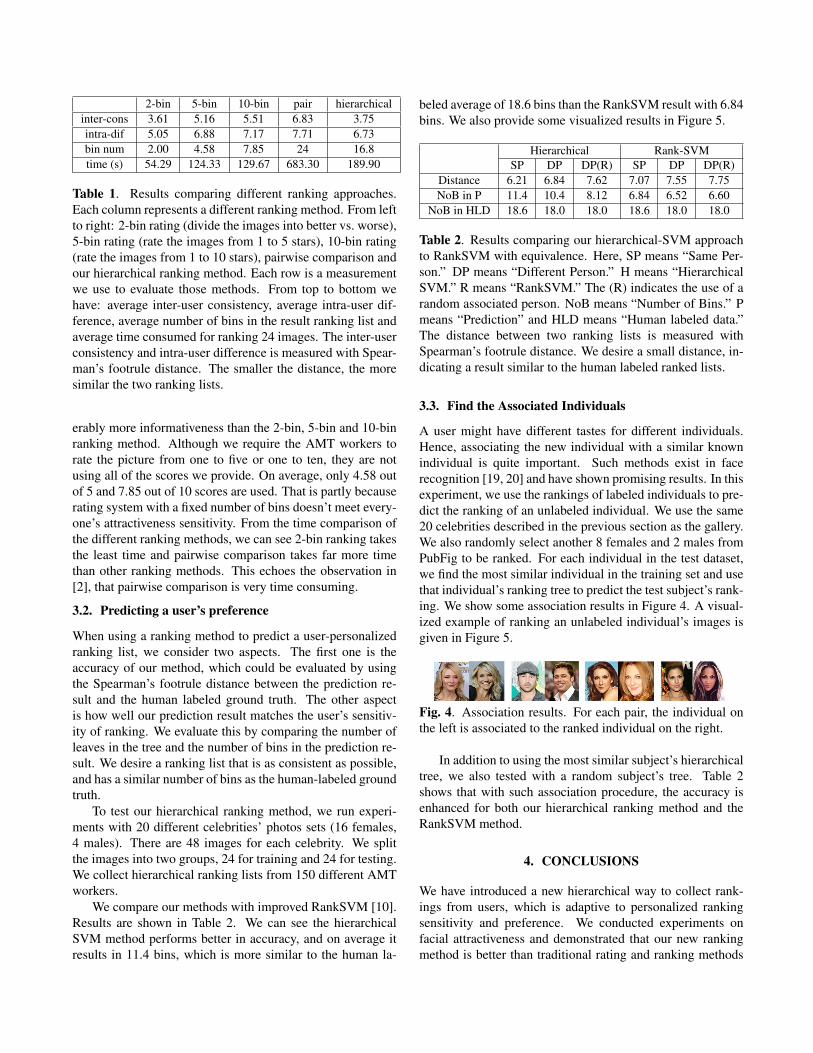
A user might have different tastes for different individuals.Hence, associating the new individual with a similar knownindividual is quite important. Such methods exist in facerecognition [19, 20] and have shown promising results. In thisexperiment, we use the rankings of labeled individuals to pre-dict the ranking of an unlabeled individual. We use the same20 celebrities described in the previous section as the gallery.We also randomly select another 8 females and 2 males fromPubFig to be ranked. For each individual in the test dataset,we find the most similar individual in the training set and usethat individual’s ranking tree to predict the test subject’s rank-ing. We show some association results in Figure 4. A visual-ized example of ranking an unlabeled individual’s images isgiven in Figure 5.
Fig. 4. Association results. For each pair, the individual onthe left is associated to the ranked individual on the right.
In addition to using the most similar subject’s hierarchicaltree, we also tested with a random subject’s tree. Table 2shows that with such association procedure, the accuracy isenhanced for both our hierarchical ranking method and theRankSVM method.
4. CONCLUSIONS
We have introduced a new hierarchical way to collect rank-ings from users, which is adaptive to personalized rankingsensitivity and preference. We conducted experiments onfacial attractiveness and demonstrated that our new rankingmethod is better than traditional rating and ranking methods
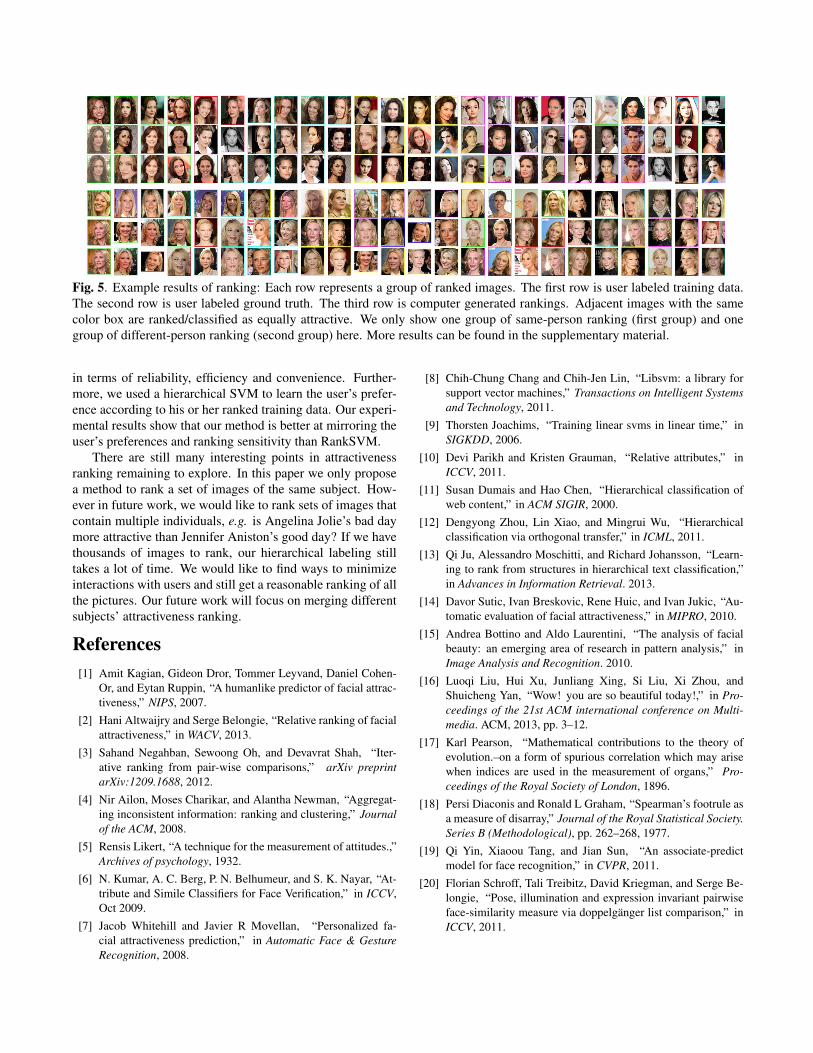
Fig. 5. Example results of ranking: Each row represents a group of ranked images. The first row is user labeled training data.The second row is user labeled ground truth. The third row is computer generated rankings. Adjacent images with the samecolor box are ranked/classified as equally attractive. We only show one group of same-person ranking (first group) and onegroup of different-person ranking (second group) here. More results can be found in the supplementary material.
in terms of reliability, efficiency and convenience. Further-more, we used a hierarchical SVM to learn the user’s prefer-ence according to his or her ranked training data. Our experi-mental results show that our method is better at mirroring theuser’s preferences and ranking sensitivity than RankSVM.
There are still many interesting points in attractivenessranking remaining to explore. In this paper we only proposea method to rank a set of images of the same subject. How-ever in future work, we would like to rank sets of images thatcontain multiple individuals, e.g. is Angelina Jolie’s bad daymore attractive than Jennifer Aniston’s good day? If we havethousands of images to rank, our hierarchical labeling stilltakes a lot of time. We would like to find ways to minimizeinteractions with users and still get a reasonable ranking of allthe pictures. Our future work will focus on merging differentsubjects’ attractiveness ranking.
References[1] Amit Kagian, Gideon Dror, Tommer Leyvand, Daniel Cohen-
Or, and Eytan Ruppin, “A humanlike predictor of facial attrac-tiveness,” NIPS, 2007.
[2] Hani Altwaijry and Serge Belongie, “Relative ranking of facialattractiveness,” in WACV, 2013.
[3] Sahand Negahban, Sewoong Oh, and Devavrat Shah, “Iter-ative ranking from pair-wise comparisons,” arXiv preprintarXiv:1209.1688, 2012.
[4] Nir Ailon, Moses Charikar, and Alantha Newman, “Aggregat-ing inconsistent information: ranking and clustering,” Journalof the ACM, 2008.
[5] Rensis Likert, “A technique for the measurement of attitudes.,”Archives of psychology, 1932.
[6] N. Kumar, A. C. Berg, P. N. Belhumeur, and S. K. Nayar, “At-tribute and Simile Classifiers for Face Verification,” in ICCV,Oct 2009.
[7] Jacob Whitehill and Javier R Movellan, “Personalized fa-cial attractiveness prediction,” in Automatic Face & GestureRecognition, 2008.
[8] Chih-Chung Chang and Chih-Jen Lin, “Libsvm: a library forsupport vector machines,” Transactions on Intelligent Systemsand Technology, 2011.
[9] Thorsten Joachims, “Training linear svms in linear time,” inSIGKDD, 2006.
[10] Devi Parikh and Kristen Grauman, “Relative attributes,” inICCV, 2011.
[11] Susan Dumais and Hao Chen, “Hierarchical classification ofweb content,” in ACM SIGIR, 2000.
[12] Dengyong Zhou, Lin Xiao, and Mingrui Wu, “Hierarchicalclassification via orthogonal transfer,” in ICML, 2011.
[13] Qi Ju, Alessandro Moschitti, and Richard Johansson, “Learn-ing to rank from structures in hierarchical text classification,”in Advances in Information Retrieval. 2013.
[14] Davor Sutic, Ivan Breskovic, Rene Huic, and Ivan Jukic, “Au-tomatic evaluation of facial attractiveness,” in MIPRO, 2010.
[15] Andrea Bottino and Aldo Laurentini, “The analysis of facialbeauty: an emerging area of research in pattern analysis,” inImage Analysis and Recognition. 2010.
[16] Luoqi Liu, Hui Xu, Junliang Xing, Si Liu, Xi Zhou, andShuicheng Yan, “Wow! you are so beautiful today!,” in Pro-ceedings of the 21st ACM international conference on Multi-media. ACM, 2013, pp. 3–12.
[17] Karl Pearson, “Mathematical contributions to the theory ofevolution.–on a form of spurious correlation which may arisewhen indices are used in the measurement of organs,” Pro-ceedings of the Royal Society of London, 1896.
[18] Persi Diaconis and Ronald L Graham, “Spearman’s footrule asa measure of disarray,” Journal of the Royal Statistical Society.Series B (Methodological), pp. 262–268, 1977.
[19] Qi Yin, Xiaoou Tang, and Jian Sun, “An associate-predictmodel for face recognition,” in CVPR, 2011.
[20] Florian Schroff, Tali Treibitz, David Kriegman, and Serge Be-longie, “Pose, illumination and expression invariant pairwiseface-similarity measure via doppelganger list comparison,” inICCV, 2011.
Related Documents


