Ranking and Classifying Attractiveness of Photos in Folksonomies Jose San Pedro University of Sheffield 211 Portobello Street Sheffield S1 4DP, UK [email protected] Stefan Siersdorfer L3S Research Center. University of Hannover. Appelstr. 9a 30167 Hannover, Germany [email protected] ABSTRACT Web 2.0 applications like Flickr, YouTube, or Del.icio.us are increasingly popular online communities for creating, editing and sharing content. The growing size of these folksonomies poses new challenges in terms of search and data mining. In this paper we introduce a novel methodology for auto- matically ranking and classifying photos according to their attr activenes s for folkson omy members. T o this end, we exploit image features known for having significant effects on the visua l quali ty perceiv ed by huma ns (e.g. sharp ness and colorfulness) as well as textual meta data, in what is a multi-modal appro ach. Using feedb ack and annot ation s av ailable in the We b 2.0 photo sharin g system Flickr, we assign relevance values to the photos and train classification and regression models based on these relevance assignments. With the resulting machine learning models we categorize and rank photos accordi ng to their attracti vene ss. Appli - cations include enhanced ranking functions for search and reco mmender methods for attractive cont ent . Large scale exper imen ts on a colle ction of Flic kr photo s demo nstrate the viability of our approach. Categories and Subject Descriptors H.4.m [Information Systems Applications]: Misc ella - neo us; H.3 .5 [ Information Syste ms]: INFORMATION STORAGE AND RETRIEVAL—On-line Information Ser- vices General Terms Algorithms Keywords image analysis, attractiveness features, photo appeal, web 2.0, classification, ranking, folksonomy feedback 1. INTRODUCTION Popularity and data volume of modern Web 2.0 content sharing applications originate in their ease of operation for even unexperienced users, suitable mechanisms for support- ing collaboration, and attr activeness of share d annot ated material (images in Flickr, videos in YouTube, bookmarks in del.icio.us, etc.). Copyright is held by the International World Wide Web Conference Com- mittee (IW3C2). Distrib ution of these papers is limited to classroom use, and personal use by others. WWW 2009 , April 20–24, 2009, Madrid, Spain. ACM 978-1-60558-487-4/09/04. The rapid increase in size of online communities and the availability of large amounts of shared data make discoveri ng relevant content and finding related users a difficult task. For instance, thousands of new photos are uploaded to Flickr every minu te making effective automatic content filte ring techniques a necessity. Flickr photos are accompanied by a variety of meta data such as tags, number of views, user comments, upload date, etc. The Flic kr search interfa ce exploit s the explicit and impli cit ratings in the meta data to infer rankings. For in- stance, the number of views is an indicator for the popularity of a photo, the upload date and the date a photo was taken at is an indicator for the recency of the content, and adding a photo to one’s favorite list is probably the most direct posi- tive relevance assignment in Flickr, and is an explicit expres- sion of interest in the photo. However, for recently uploaded photos community feedback in any form might not yet be av aila ble. F urthe rmor e, man y photo s are just spars ely an- notated which might prevent text-based search and mining methods from retrieving this potentially attractive content. Visual attractiveness is a highly subjective concept which has rece ive d exte nsiv e int eres t from the research commu- nit y . Sema nti c aspect s are not critical, as the prese nce of certain concepts in a picture does not necessarily correlate with its appeal for viewe rs. The artis tic componen t has a major role in the perception of the aesthetics of images, and low-level features can provide a better insight on this aspect of photos. Metrics such as sharpness, an overall value of the granulari ty of the image, or colorfulness, whic h meas ures the diversity of spectrum contained in the image, have been shown to provide high correlation with the human percep- tion of attractiveness ([24]). In this paper we focus on a methodology for automatically classifying and ranking photos according to their attractive- ness. We exploit the vast amount of social feedback available in Web 2.0 applications, more specifically in Flickr, to obtain a training set of photos considered as more or less attrac- tive by the community. This allows us to build classification and regression models based on multi-modal visual and tex- tual features, and to apply them to identify new attractive cont ent . In a wide r system cont ext, such techni ques can be useful to enhance ranking functions for photo search, and, more generally , to complement mining and retriev al methods based on text, other meta data and social dimensions. The rest of this paper is organized as follows: In Section 2 we discuss related work on image features, visual attractive- ness , folksonomy minin g, and machin e lear ning. Secti on 3 pro vides an overview of image attribu tes commonly asso- WWW 2009 MADRID! Track: Social Networks and Web 2.0 / Session: Photos and Web 2.0 771

Welcome message from author
This document is posted to help you gain knowledge. Please leave a comment to let me know what you think about it! Share it to your friends and learn new things together.
Transcript
8/12/2019 Ranking and Classifying Attractiveness of Photos
http://slidepdf.com/reader/full/ranking-and-classifying-attractiveness-of-photos 1/10
Ranking and Classifying Attractiveness of Photos inFolksonomies
Jose San PedroUniversity of Sheffield211 Portobello StreetSheffield S1 4DP, UK
Stefan SiersdorferL3S Research Center. University of Hannover.
Appelstr. 9a30167 Hannover, Germany
ABSTRACT
Web 2.0 applications like Flickr, YouTube, or Del.icio.us areincreasingly popular online communities for creating, editingand sharing content. The growing size of these folksonomiesposes new challenges in terms of search and data mining.In this paper we introduce a novel methodology for auto-matically ranking and classifying photos according to theirattractiveness for folksonomy members. To this end, we
exploit image features known for having significant effectson the visual quality perceived by humans (e.g. sharpnessand colorfulness) as well as textual meta data, in what isa multi-modal approach. Using feedback and annotationsavailable in the Web 2.0 photo sharing system Flickr, weassign relevance values to the photos and train classificationand regression models based on these relevance assignments.With the resulting machine learning models we categorizeand rank photos according to their attractiveness. Appli-cations include enhanced ranking functions for search andrecommender methods for attractive content. Large scaleexperiments on a collection of Flickr photos demonstratethe viability of our approach.
Categories and Subject Descriptors
H.4.m [Information Systems Applications]: Miscella-neous; H.3.5 [Information Systems]: INFORMATIONSTORAGE AND RETRIEVAL—On-line Information Ser-
vices
General Terms
Algorithms
Keywords
image analysis, attractiveness features, photo appeal, web2.0, classification, ranking, folksonomy feedback
1. INTRODUCTIONPopularity and data volume of modern Web 2.0 contentsharing applications originate in their ease of operation foreven unexperienced users, suitable mechanisms for support-ing collaboration, and attractiveness of shared annotatedmaterial (images in Flickr, videos in YouTube, bookmarksin del.icio.us, etc.).
Copyright is held by the International World Wide Web Conference Com-mittee (IW3C2). Distribution of these papers is limited to classroom use,and personal use by others.WWW 2009 , April 20–24, 2009, Madrid, Spain.ACM 978-1-60558-487-4/09/04.
The rapid increase in size of online communities and theavailability of large amounts of shared data make discoveringrelevant content and finding related users a difficult task.For instance, thousands of new photos are uploaded to Flickrevery minute making effective automatic content filteringtechniques a necessity.
Flickr photos are accompanied by a variety of meta datasuch as tags, number of views, user comments, upload date,etc. The Flickr search interface exploits the explicit and
implicit ratings in the meta data to infer rankings. For in-stance, the number of views is an indicator for the popularityof a photo, the upload date and the date a photo was takenat is an indicator for the recency of the content, and addinga photo to one’s favorite list is probably the most direct posi-tive relevance assignment in Flickr, and is an explicit expres-sion of interest in the photo. However, for recently uploadedphotos community feedback in any form might not yet beavailable. Furthermore, many photos are just sparsely an-notated which might prevent text-based search and miningmethods from retrieving this potentially attractive content.
Visual attractiveness is a highly subjective concept whichhas received extensive interest from the research commu-nity. Semantic aspects are not critical, as the presence of
certain concepts in a picture does not necessarily correlatewith its appeal for viewers. The artistic component has amajor role in the perception of the aesthetics of images, andlow-level features can provide a better insight on this aspectof photos. Metrics such as sharpness, an overall value of thegranularity of the image, or colorfulness, which measuresthe diversity of spectrum contained in the image, have beenshown to provide high correlation with the human percep-tion of attractiveness ([24]).
In this paper we focus on a methodology for automaticallyclassifying and ranking photos according to their attractive-ness. We exploit the vast amount of social feedback availablein Web 2.0 applications, more specifically in Flickr, to obtaina training set of photos considered as more or less attrac-tive by the community. This allows us to build classification
and regression models based on multi-modal visual and tex-tual features, and to apply them to identify new attractivecontent. In a wider system context, such techniques can beuseful to enhance ranking functions for photo search, and,more generally, to complement mining and retrieval methodsbased on text, other meta data and social dimensions.
The rest of this paper is organized as follows: In Section 2we discuss related work on image features, visual attractive-ness, folksonomy mining, and machine learning. Section 3provides an overview of image attributes commonly asso-
WWW 2009 MADRID! Track: Social Networks and Web 2.0 / Session: Photos and Web 2.0
771

8/12/2019 Ranking and Classifying Attractiveness of Photos
http://slidepdf.com/reader/full/ranking-and-classifying-attractiveness-of-photos 2/10
ciated to the human perception of visual quality, and re-views methods to compute their values. We provide a shortoverview of classification and regression techniques in Sec-tion 4, and explain how we can apply these techniques inthe context of photo attractiveness detection. In Section 5we provide the results of the evaluation of our automatic at-tractiveness detection methods for classification and rankingof photos in Flickr. We conclude and show directions of ourfuture work in Section 6.
2. RELATED WORKThe determination of image quality metrics has received
significant research interest under very diverse lines of work.The analysis of human perception of color signals is the ba-sis for an important number of image transformation tech-niques, as it provides a mechanism to assess visual qualityat a perceptual level, i.e. as it is perceived by a human ob-server. This is a common requirement for the evaluation of image compression algorithms [32], but also has applicationsin image enhancement techniques [12] and unsupervised cal-ibration systems for image capturing gear (e.g. auto-focussystems [30]). Classic metrics such as PSNR and MSE [33]model quality degradation as a measure of the difference
between a baseline image and a variation. They performpoorly as objective quality metrics, as they neglect the per-ceptual impairments associated to the absolute changes insignal values. In the scope of this paper we are interested inquantitative metrics of perceived image quality rather thanvisual fidelity.
Savakis et al. present a subjective evaluation of the sig-nificance of different visual aspects for the determination of the overall appeal of natural images, in this case consumerphotographs [24]. Their results show that, while the mainfactors are related to the presence of determinate concepts(e.g. people) and artistic value (e.g. composition), somespecific objective measures of visual features provide signif-icant correlation to human judgements. These results aresupported by the work of Winkler [31] and Wee et al. [30],who propose ways to quantify sharpness and colorfulness of images and conduct extensive subjective experiments show-ing the properties of these features as effective indicatorsof image appeal. Additional metrics such as exposure [25],contrast [33, 22], or texture features [20] have also been usedwith varying levels of success to provide metrics of image ap-peal. These metrics have been exploited for image retrievaland management applications, e.g. detection and removalof undesirable images from photo collections [25].
However, few works have focused on providing accuratestatistical models combining multiple features to predict theattractiveness of images. Kalenova et al. [16] propose anunsupervised model for spectral image quality characteriza-tion, and considers a very restricted set of only 5 images for
its evaluation. In [26], a method for classification using vi-sual features is presented but its effectiveness is not shownas evaluation is omitted. In contrast, our work considers alarge set of images from the popular Web 2.0 site Flickr,allowing to build robust classifiers and ranking models, andcombines two different modalities: visual (content-based)and text (meta data) features. In addition, we conduct alarge scale evaluation to assess the viability of our approach.
Schmitz et al. have formalized folksonomies and discussthe use of association rule mining for analyzing and struc-turing them in [27]. Work on folksonomy-based web col-
laboration systems includes [5], [9], and [18] which providegood overviews of social bookmarking tools with special em-phasis on folksonomies. A node ranking procedure for folk-sonomies, the FolkRank algorithm, has been introduced in[11]. FolkRank operates on a tripartite graph of users, re-sources and items, and generates a ranking of tags for agiven user. Another procedure is the Markov Clustering al-gorithm (MCL) in which a renormalization-like scheme isused in order to detect communities of nodes in weighted
networks [29]. A PageRank-like algorithm based on visuallinks between images is used to improve the ranking func-tion for photo search in [13]. However, none of these thesearticles are using a combination of community feedback andvisual features to classify and rank attractiveness.
There is a plethora of work on classification using a vari-ety of probabilistic and discriminative models [4] and learn-ing regression and ranking functions is well known in theliterature [28, 23, 2]. The popular SVM Light softwarepackage [15] provides various kinds of parameterizations andvariations of SVM training (e.g., binary classification, SVMregression and ranking, transductive SVMs, etc.). In thispaper we will apply these techniques, in what is a novel con-text, to automatic image attractiveness assignment.
To the best of our knowledge, our paper is the first to ap-ply and evaluate automatic classification and ranking meth-ods for photo attractiveness based on visual features andtextual meta data. Furthermore, we are the first to pro-pose gathering large training and evaluation sets for photoattractiveness based on community feedback in a Web 2.0content sharing environment.
3. ATTRACTIVENESS FEATURES
FOR IMAGESImage attractiveness is a very subjective concept influ-
enced by a wide number of factors. In previous studies, ithas been shown that high level semantic attributes, such as
people expressions or picture composition, are the most rel-evant when determining the overall appeal of a photo [24].The current limitations in semantic understanding of imagesprevent automatic methods from taking advantage of themfor the establishment of models. However, there are a num-ber of other attributes which also influence the perceptionof image attractiveness and that can b e measured. This isillustrated in Figure 1, where pairs of semantically affine pic-tures with varying appeal levels are depicted, showing howsemantic properties could just be insufficient for the correctclassification of pictures in terms of their attractiveness. Inthis section we introduce image features available from thecontent and its associated meta data that we use later forthe training of models for image attractiveness classification.
3.1 Visual FeaturesIt is widely accepted that human perception of images is
mainly influenced by two factors, namely color distributionand coarseness of the patterns contained [12]. These arecomplex concepts which convey multiple orthogonal aspectsthat have to be considered individually. Figure 1 shows sev-eral examples. For the same semantic concepts (columns inthe figure), very different perceptions of image quality canbe perceived. The images in the upper row are generallyperceived as more appealing, mainly because of their higher
WWW 2009 MADRID! Track: Social Networks and Web 2.0 / Session: Photos and Web 2.0
772

8/12/2019 Ranking and Classifying Attractiveness of Photos
http://slidepdf.com/reader/full/ranking-and-classifying-attractiveness-of-photos 3/10
Figure 1: “Attractive” (upper row) vs. “Unattractive” (lower row) images: Each column represents the samesemantic concept (animal, landscape, portrait, flower) but differences in appeal-related visual attributes.
artistic value. Even though artistic quality cannot be quan-titatively computed, it correlates to certain visual featuresof images, assigning more optimal values to them. For in-stance, appealing images tend to have higher colorfulness(column 2), increased contrast (column 3) and sharpness.In this section, we review some of the most relevant visualaspects which we intend to use as image quality indicators.
3.1.1 Color
Color is the pillar of the human vision system. It canbe expressed in absolute terms as coordinates in a specificcolor space. Different color spaces have been defined to suitthe requirements of different color-dependent applications.
In this section we make use of some of them to establishcolor attributes of the image. In addition to the well-knownsRGB, we also refer to the HSV (Hue-Saturation-Value) andHSL (Hue-Saturation-Lightness) color spaces, which pro-vide a more intuitive representation of colors for humans[1]. The YUV (Luma-Chrominance) color space is also usedas it maps luminance intensity (brightness) directly as theY coordinate. Finally, the CIEL∗u∗v∗ color space [1] is themost comprehensive color model, capable of describing thecomplete visible spectrum. It provides an interesting colordecomposition with two chromaticity components, u and v .
The following attributes are commonly used to character-ize the color present in images:Brightness The brightness of a color is a measure of theamplitude of its light wave, or intensity. Even though it
is a very simple attribute, it has been effectively used forfiltering poorly exposed photos [25]. For images in the YUVcolor space, it can be straightforwardly determined as theaverage of the luminance values, Y , of the complete sequenceof pixels,
Y = 1
N
Xx,y
Y xy (1)
where Y xy denotes the luminance value of pixel (x, y) andN denotes the size of the image.
Saturation: The saturation of a color is a measure of itsvividness. It is defined as the difference of intensity of thedifferent light wavelengths that compose the color. In theCIEL∗u∗v∗ space, saturation is defined by the expression
S uv = 13p
(u′ − u′0
)2 + (v′ − v′0
)2 (2)
where u′ and v ′ are the chromaticity coordinates of the con-sidered color, and u′0 and v′0 are the corresponding (u′, v′)coordinates for the white reference color chosen. In othercolor spaces, including HSV and HSL, various correlates of saturation are directly mapped into their coordinates. Ac-cording to the definition of HSV, saturation can be estab-lished using
S = max(R,G,B) − min(R,G,B) (3)
where R, G and B are the coordinates of the color the sRGBcolor space.Colorfulness: The colorfulness of a color is a measure of itsdifference against grey. When considering the pixels of animage altogether, the individual distance between pixel col-ors is also taken into account. Winkler [31] proposes to com-pute the colorfulness index using the distribution of chromavalues. A more efficient method for images coded in thesRGB color space is described by Hasler [10]. The opponentcolor space is defined as
rg = R − G,
yb = 1
2 (R + G) − B
and colorfulness can be obtained using
Cf = σrgyb + 0.3 · µrgyb, (4)
σrgyb =q
σ2rg + σ2
yb, (5)
µrgyb =q
µ2rg + µ2
yb (6)
Naturalness: This highly subjective concept aims at pro-viding a measure of the degree of correspondence between
WWW 2009 MADRID! Track: Social Networks and Web 2.0 / Session: Photos and Web 2.0
773

8/12/2019 Ranking and Classifying Attractiveness of Photos
http://slidepdf.com/reader/full/ranking-and-classifying-attractiveness-of-photos 4/10
images and human perception of reality. It condenses manyaspects of perceived color attributes, such as colorfulness ordynamic range. Huang et al. propose a method to obtaina quantitative value [12]. Considering colors are in the HSLcolor space, they use pixels with 20 ≤ L ≤ 80 and S > 0.1.These are grouped according to their hue (H coordinate)value in three sets: ’A - Skin’, ’B - Grass’ and ’C - Sky’.Average saturation values for each group, µS , are used tocompute local naturalness indexes using the following ex-
pressions:
N Skin = e−0.5
µAS−0.76
0.52
!2
, if 25 ≤ hue ≤ 70
N Grass = e−0.5
µBS−0.81
0.53
!2
, if 95 ≤ hue ≤ 135
N Sky = e−0.5
µCS−0.43
0.22
!2
, if 185 ≤ hue ≤ 260
The final naturalness index is given by the expression:
N =Xi
ωiN i, i ∈ {’Skin’, ’Grass’, ’Sky’} (7)
where ωi denotes the proportion of pixels of group i in theimage.Contrast: As introduced above, color perception dependsheavily on the relation of local luminance variations to thesurrounding luminance. Contrast measures this relative vari-ation of luminance. Multiple definitions for computing thecontrast index have been proposed. Weber’s definition pro-vides a simple way to obtain contrast for simple periodicpatterns as:
C W =
∆L
L (8)
The RMS-contrast is commonly used to determine contrastin a way which allows to be compared between independent
images:
C rms =
1
n − 1
nXi=1
(xi − x)2 (9)
3.1.2 Coarseness
Coarseness, on the other hand, represents the degree of detail contained in an image. It mainly depends on thequality of the capturing gear and the photographer, andclosely relates to the notions of resolution (number of pixelsper inch) and acutance (maximum color change ratio perinch). The most commonly used metric to determine thecoarseness of images is sharpness. Sharpness measures theclarity and level of detail of an image. Its importance in
the final appearance of a photo has been repeatedly empha-sized by professional photographers and studies on imageappeal [24]. Sharpness can be determined as a function of its Laplacian, normalized by the local average luminance inthe surroundings of each pixel:
Sh =Xx,y
L(x, y)
µxy
, with L(x, y) = ∂ 2I
∂x2 +
∂ 2I
∂y2 (10)
where µxy denotes the average luminance around pixel (x,y).
3.2 Text FeaturesIn addition to visual features, the textual annotation of
images available in Web 2.0 folksonomies such as Flickrcan provide additional clues on the attractiveness of photos.This holds partly due to correlations of topics with appeal-ing image content. As an illustrative example we computeda ranked list of tags from a set of 12,000 photos with morethan 5 favorite assignments (“attractive”) and another set of the same size containing photos without any favorite assign-ments (“unattractive”). For ranking the tags, we used theMutual Information (MI) measure [21, 19] from informationtheory which can be interpreted as a measure of how muchthe joint distribution of features X i (terms in our case) de-viate from a hypothetical distribution in which features andcategories (“attractive” and “unattractive”) are independentof each other.
Table 1 shows the top-50 terms extracted for each cat-egory. Obviously many of the “attractive” photos containnature motives (e.g., sunset , flower , animals ), have tagsrelating to photo technology (canon , nikon , hdr ), empha-size artistic aspects and colors (blackandwhite , green , red ,etc.) and contain positive statements (supershot , colorpho-toaward ). “Unattractive” photos, on the other hand, are of-
ten about family occasions (e.g., birthday , wedding , family ,dad ) as well as other private events and activities (gradua-tion , party , weekend , trip, camping ) which are of importancefor a small circle of friends and family members but lessinteresting for a larger community of Flickr users; further-more, the technical quality of some of these photos might beaffected by their amateur character.
4. CLASSIFICATION AND REGRESSION
MODELS FOR IMAGE ATTRACTIVENESSIn the previous section, we have seen how feature repre-
sentations of photos can be obtained using analysis of vi-sual content and textual annotations. In this section, weprovide a short review of specific classification and regres-sion techniques known from the machine learning literature,and show how these techniques can be applied to our sce-nario. We use classification models to automatically cate-gorize photos as attractive or unattractive, and regressionmodels to obtain lists of photos ranked by their attractive-ness.
4.1 Classifying AttractivenessIn order to classify photos into categories “attractive” or
“unattractive” we use a supervised learning paradigm whichis based on training items (photos in our case) that needto be provided for each category. Both training and testitems, which are later given to the classifier, are representedas multi dimensional feature vectors. These vectors can be
constructed using tf or tf · idf weights of tags and the vi-sual features described in Section 3). Photos labeled as “at-tractive” or “unattractive” are used to train a classificationmodel, using probabilistic (e.g., Naive Bayes) or discrimina-tive models (e.g., SVMs).
How can we obtain sufficiently large training sets of “at-tractive” or “unattractive” photos? We are aware that theconcept of appeal lies in the eye of the beholder, and is highlysubjective and problematic. However, the amount of com-munity feedback in Flickr results in large annotated photosets which hopefully helps to average out noise in various
WWW 2009 MADRID! Track: Social Networks and Web 2.0 / Session: Photos and Web 2.0
774

8/12/2019 Ranking and Classifying Attractiveness of Photos
http://slidepdf.com/reader/full/ranking-and-classifying-attractiveness-of-photos 5/10
Table 1: Top-50 terms according to their MI values for attractive vs. unattractive photos in FlickrTerms for Attractive photos
abigfave green diamondclassphotographer clouds colorphotoawardnaturesfinest impressedbeauty sunset blueribbonwinner filmnature red flowers pink seaflower sky art black hdrmacro supershot light woman coolestblue aplusphoto explore soe street
bw canon flickrdiamond night beachanawesomeshot water blackandwhite landscape animalnikon white color bravo sunportrait girl yellow superbmasterpiece garden
Terms for Unattractive photos2007 camping madagascar memorial racewedding festival memorialday matt mtgraduation may prague pics dad2006 canyon china vietnam 2party ubc cycling 2003 weekendtrip ubcaagrad07s cruise urlaubvacation kenyahoneymoon tour kollegstufenfahrt kreuzfahrtcruise partvacation family birthday commencement ian2005 bbq drinking mvmarcopolo regatta
07 softball vegas grand bermuda
forms and, thus, reflects to a certain degree the“democratic”view of a community. To this end we considered distinctthresholds for the minimum number of favorite assignmentsNumFav for photos; in Section 5 we will see that favoritesare highly correlated with other kinds of community feed-back such as number of comments or views. Formally, weobtain a set {( p1, l1), . . . ( pn, ln)} of photo vectors pi labeledby li with li = 1 if NumFav lies above a threshold (“posi-tive” examples), li = −1 otherwise (“negative” examples).
Linear support vector machines (SVMs) construct a hy-perplane w ·x + b = 0 that separates the set of positive train-ing examples from a set of negative examples with maximum
margin. This training requires solving a quadratic optimiza-tion problem whose empirical performance is somewhere be-tween linear and quadratic in the number of training items[3]. In real life, the classes in the training data are not al-ways separable. To handle the general case where a singlehyperplane may not be able to correctly separate all train-ing points, slack variables are introduced in order to relaxthe constraints of the optimization problem. For a new,previously unseen, photo p the SVM merely needs to testwhether it lies on the “positive” side or the “negative” sideof the separating hyperplane. The decision simply requirescomputing a scalar product of the vectors w and p. SVMshave been shown to perform very well for various classifica-tion tasks (see, e.g., [7, 14]). Other discriminative classifiers(e.g., based on Fisher discriminants) trade off some accuracyfor speed [6], but we restrict ourselves to linear SVMs.
4.2 Regression Models for AttractivenessTo learn a regression model we consider training sets
{( p1, r1), . . . , ( pn, rn)} of photo vectors pi along with rele-vance values ri ∈ R instead of the category labels used forclassification. We are considering the number of favorite as-signments NumFav for a photo pi as relevance value, andfeature vector representations of photos as described in theprevious subsection on classification.
SV-ǫ regression [28] computes a function f ( x) that hasa deviation ≤ ǫ from the target relevance values ri of thetraining data with a minimum value for ǫ and at the sametime is as “flat” as possible. For a family of linear functions w·x+b “flatness”means that || w|| is minimized which resultsin the following optimization problem:
minimize 1
2|| w||2 (11)
subject to
ri − w pi − b ≤ ǫ
w pi + b − ri ≤ ǫ (12)
Similar to the classification scenario, slack variables can be
introduced if the constraints of the optimization problemcannot be met. By means of the learned regression functionf , relevance values f ( p) can be assigned to vector represen-tations p of new test photos, resulting in a list of photosranked according to their attractiveness.
5. EXPERIMENTSIn this section, we present the results of our evaluation
for automatic detection of photo attractiveness. First, wedescribe our strategy for gathering a photo collection fromFlickr, and elaborate on the characteristics of our data set.Then, we present the outcome of our two-fold evaluationmethodology: 1) We examine the influence of the enhancedphoto representations on automatic classification of photo
attractiveness. 2) We apply regression models to obtainrankings of photos according to their attractiveness.
5.1 DataWe gathered a sample of photos from Flickr uploaded in
the time between June 1 and 7, 2007. We used the FlickrAPI to query for photos uploaded in 20 minutes time in-tervals. In this way, we obtained a total of 2.2 M photosin medium size from 185 k users (note that this is justthe subset of photos provided by the Flickr API, the ac-tual amount of uploaded photos during that time is larger).
WWW 2009 MADRID! Track: Social Networks and Web 2.0 / Session: Photos and Web 2.0
775

8/12/2019 Ranking and Classifying Attractiveness of Photos
http://slidepdf.com/reader/full/ranking-and-classifying-attractiveness-of-photos 6/10
100
1000
10000
100000
1e+06
1e+07
>2020191817161514131211109876543210
N o
o f P h o t o s
Favorite Assignments
Distribution of favorite assignments
Figure 2: Distribution of favorite assignments
The relatively short time frame of one week (compared tothe existence of Flickr) guarantees that for all photos, therewas roughly the same chance to obtain community feedback.For each photo, we extracted the number of times the photowas assigned to favorite lists. Figure 2 shows the distribu-tion of the number favorite assignments for these photos.Since adding a photo to one’s favorite list is probably the
most direct positive assessment, we used the number of fa-vorites as relevance values for building and testing machinelearning models. This is also justified by the high correlationof the number of favorite assignments with other importantindicators of community interest. We computed the correla-tion with the number of views/comments and obtained thefollowing values for Kendall’s Tau-b: 0.688 for views, 0.767for comments.
Positive examples were selected using all the photos withat least 2 favorite assignments. We deliberately dismissedphotos with just 1 favorite assignment as they do not providesufficient evidence of social agreement. This resulted in a setof 35,000 photos. In addition we chose a random sample of 40,000 photos without any favorite assignments as the set of
negative examples.5.2 Results
In Section 3, we have presented different methods for ex-tracting visual features and textual features, resulting inenhanced combined feature representations of photos. Ma-chine learning algorithms described in Section 4 make useof this feature information to generate models, and to auto-matically organize the data. In this section, we show resultsfor classification as well as ranking.
5.2.1 Classification of Attractive Photos
Classifying data into thematic categories usually follows asupervised learning paradigm and is based on training itemsthat need to be provided for each topic. We used the SVM-
light [15] implementation of linear support vector machines(SVMs) with standard parameterization in our experiments,as this has been shown to perform well for various classifi-cation tasks (see, e.g.,[8, 14]).
We performed different series of binary classification ex-periments of Flickr photos into the classes “attractive” and“unattractive”. We are aware that the concept of appeal ishighly subjective and difficult to capture. However, the largeamount of community feedback in Flickr allows for a largescale evaluation which hopefully helps to average out noiseand reflects, to a certain degree, the view of the community.
For our classification experiments, we considered differentlevels of restrictiveness for the class “attractive”; to this endwe considered distinct thresholds for the minimum numberof favorite assignments for a photos (NumFav ≥ 2, 5, 10and 20) to be considered as “attractive”; photos withoutany favorite assignments were considered to belong to thecategory “unattractive”. We considered different amountsof randomly chosen “attractive” training photos (T = 500,2000, 8000, 20000) as positive examples (where that number
of training photos and at least 1000 test photos where avail-able), and the same amount of randomly chosen “unattrac-tive” photos as negative samples. For testing the modelsbased on these training sets we used the disjoint sets of re-maining “attractive” photos with same minimum number of assigned favorites and a randomly selected disjoint subset of negative samples of the same size.
We compared the following methods for producing visualfeatures from photos, introduced in Section 3, and build (1-dimensional) feature vectors for classification:
1. brightness: computed using equation (1).2. contrast: computed using equation (9)3. RGB contrast: computed using the straightforward
extension of equation (9) into the three-dimensional
RGB color space.4. saturation: computed as the average of saturation
values across the complete sequence of pixels as definedby equation (3)
5. saturation variation: computed as the standard de-viation of the distribution of values used for saturation.
6. colorfulness: computed using equation (4)7. sharpness: computed using equation (10)8. sharpness variation: computed as the standard de-
viation of the distribution of values used for sharpness.9. naturalness: computed using equation (7)
In addition, we studied the following higher dimensionalcombined feature vectors:
1. text: feature vectors based on the tag representationof the photos using tf weighting
2. visual: 9-dimensional feature vectors combining thevisual features described above
3. text+visual: combination vector obtained from thetextual and visual features
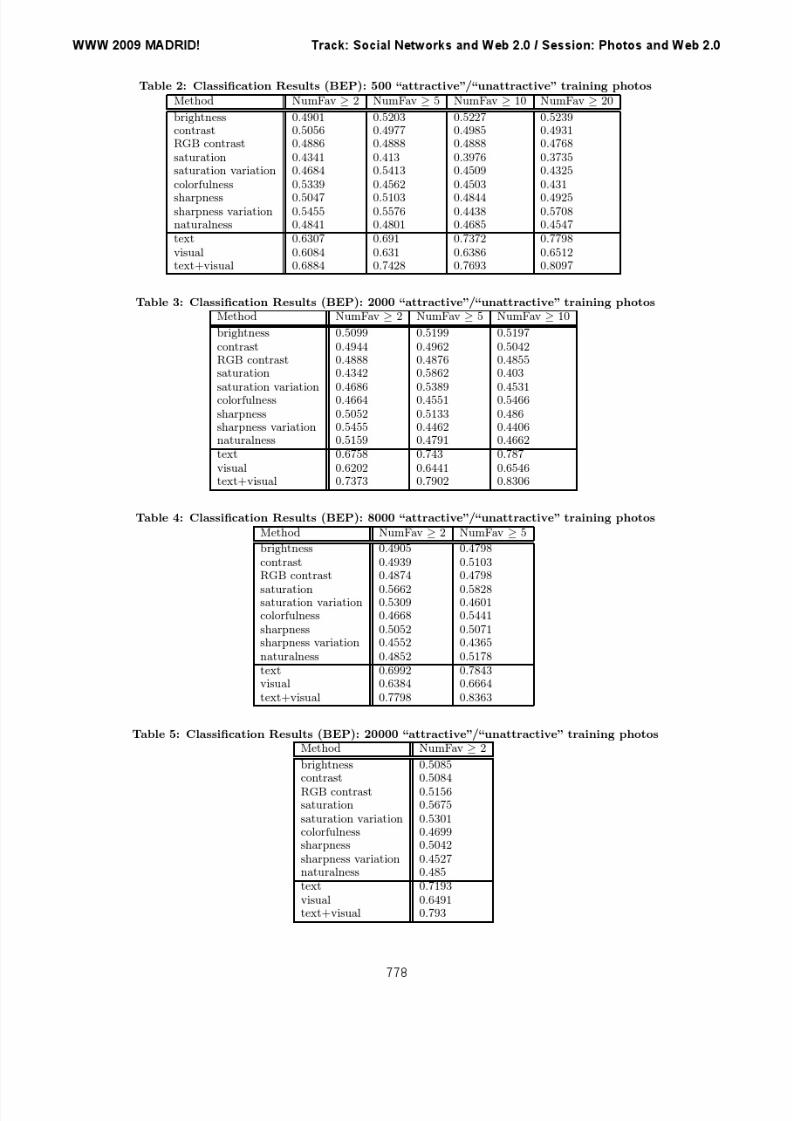
Our quality measures are the precision-recall curves aswell as the precision-recall break-even points (BEPs) forthese curves (i.e. precision/recall at the point where pre-cision equals recall which is also equal to the F1 measure,the harmonic mean of precision and recall in that case). Theresults for the BEP values are shown in Tables 2 through 5.The detailed precision-recall curves for the example case of T=8,000 training photos and minimum number of favoriteassignments NumFav=5 are shown in Figure 3. The mainobservations are:
• The combination vectors obtained from textual and vi-sual features (text+visual) provide the best perfor-mance. For instance, the configuration with T=8000positive/negative training photos and minimum Num-Fav =5, leads to a BEP of 0.8363. Consistently, similarobservations can be made for all examined configura-tions.
• Attractiveness classification based just on textual fea-tures (text) performs surprisingly well, e.g., BEP =
WWW 2009 MADRID! Track: Social Networks and Web 2.0 / Session: Photos and Web 2.0
776

8/12/2019 Ranking and Classifying Attractiveness of Photos
http://slidepdf.com/reader/full/ranking-and-classifying-attractiveness-of-photos 7/10
0.7843 for T=8000 and NumFav ≥ 5. This can beexplained by a higher interest in certain topics (e.g.woman, car), topic correlation with high technical qual-ity of the pictures (e.g. nature motives, photos an-notated by camera-related terms), or, in some cases,quality assignments in tags (e.g. “awesomephoto”).
• Although classification using a combination of all vi-sual features (visual) is outperformed by classifica-tion with textual features (BEP = 0.6664 for T=8000
and NumFav ≥ 5) trading recall against precision stillleads to applicable results. For instance, we obtainprec=0.7975 for recall=0.3, and prec=0.8472 for re-call=0.1; this is useful for finding candidates of attrac-tive photos in large photo sets. Furthermore, classifiersbased on visual features have the additional advantagethat they can be applied in a more flexible way and ina broader context, e.g., in the absence of textual an-notations or in personal photo collections.
We have also studied each of the visual features individ-ually. As expected, each of these features alone proves lesspowerful than their combination. BEPs are typically around0.5; however, the precision-recall curves reveal in most casesa clear increase of precision with decreasing recall and thus
show that these features are indeed indicators of photo at-tractiveness. The much higher performance of the combinedvisual features indicates more complex patterns and rela-tionships between the visual dimensions. Classification re-sults tend to improve, as expected, with increasing numberof training photos. Furthermore, the classification perfor-mance increases with higher thresholds for the number of favorite assignments for which a photo is considered as “at-tractive”.
5.2.2 Ranking by Attractiveness
Ranking algorithms order a set of objects, Flickr photos inour case, according to their relevance values. For our exper-iments we chose SVM Regression using the SVMlight [15]implementation with standard parameterization for regres-sion. For training the regression model, we randomly se-lected 20,000 photos with more than 2 favorites and the samenumber of photos with 0 favorites. We tested the model onthe remaining (disjoint) set of photos with NumFav ≥2 andon a disjoint set of the same size containing photos with nofavorite assignments.
The list of test photos in descending order of their numberof favorite assignments was considered as ground truth forour experiments. We compared the order of the automati-cally generated rankings using Kendall’s Tau-b [17]:
τ b = P − Qp
(P + Q + T 1)(P + Q + T 2)(13)
where P is the number of concordant pairs, Q is the number
of discordant pairs in the lists, T 1 is the number of pairs tiedin the first but not in the second list, and T 2 is the numberof pairs tied in the second but not in the first list. Values forτ b can range from -1 to 1. We have chosen the Tau-b versionin order to avoid a systematic advantage of our methods dueto many ties produced by the high number of photos withsame numFav value.
We constructed feature vectors based on tags (text), sin-gle visual features, all visual features (visual) and their com-bination (text+visual) in the same way as for the classifi-cation experiments described in the previous Section 5.2.1.
Table 6: Ranking using Regression (Kendall’s Tau-b): 40000 training photos
Method Kendall’s Tau-b
brightness 0.0006contrast -0.0172RGB contrast 0.0288saturation 0.1064saturation variation 0.0472
colorfulness -0.0497sharpness 0.0007sharpness variation -0.0914naturalness 0.0143text 0.3629visual 0.2523text+visual 0.4841
The results of the comparison are shown in Table 6. Themain observations are very similar to the ones obtained forthe classification scenario:
• The combination vectors obtained from textual andvisual features (text+visual) provide the best rank-
ing performance (τ b = 0.4841). This value illustratesa remarkable correlation of our model with the actualcommunity feedback, proving the viability of our pro-posed multi-modal approach.
• Ranking using a combination of all visual features ( vi-sual) is outperformed by ranking with textual fea-tures. However, ranking with only visual features stillproduces promising results and can be useful for casesand applications where no or insufficient textual photoannotation is available.
6. CONCLUSIONS AND FUTURE WORKIn this paper, we have shown that community feedback in
social sharing systems in combination with a multi-modalimage representation based on textual annotation and vi-sual features can be used for automatic assignment of photoattractiveness values. More specifically, in what is a novelapproach, we have used favorite assignments in the photosharing environment Flickr to obtain training data and aground truth for a community-based notion of “attractive-ness”. We used textual as well as various visual features forconstructing vector representation of photos and for buildingclassification and regression models. Our classification andranking experiments show the best performance for a hybridcombination of tags and visual information. However, theapproach of using only visual features shows applicable re-sults as well, and has the advantage of a higher flexibility inthe sense that it can be applied in scenarios where no textual
meta annotation is available (e.g. personal photo collectionsor photos without annotations on the web).
We plan to extend and generalize this work to considervarious kinds of resources in folksonomies such as still andmoving pictures (Youtube) or text (del.icio.us), and use dif-ferent content and meta data analysis techniques to obtainappropriate ob ject representations. The extension of thiswork to moving pictures presents several challenges. Per-ceived quality in this scenario cannot be directly obtainedfrom the analysis of independent frames, as the inherent re-dundant nature of videos is used by the human brain to
WWW 2009 MADRID! Track: Social Networks and Web 2.0 / Session: Photos and Web 2.0
777
8/12/2019 Ranking and Classifying Attractiveness of Photos
http://slidepdf.com/reader/full/ranking-and-classifying-attractiveness-of-photos 8/10

8/12/2019 Ranking and Classifying Attractiveness of Photos
http://slidepdf.com/reader/full/ranking-and-classifying-attractiveness-of-photos 9/10
0
0.2
0.4
0.6
0.8
1
0 0.2 0.4 0.6 0.8 1
P r e c i s i o n
Recall
brightness
BEP
0
0.2
0.4
0.6
0.8
1
0 0.2 0.4 0.6 0.8 1
P r e c i s i o n
Recall
contrast
BEP
0
0.2
0.4
0.6
0.8
1
0 0.2 0.4 0.6 0.8 1
P r e c i s i o n
Recall
RGB contrast
BEP
0
0.2
0.4
0.6
0.8
1
0 0.2 0.4 0.6 0.8 1
P r e c i s i o n
Recall
saturation
BEP
0
0.2
0.4
0.6
0.8
1
0 0.2 0.4 0.6 0.8 1
P r e c i s i o n
Recall
saturation variation
BEP
0
0.2
0.4
0.6
0.8
1
0 0.2 0.4 0.6 0.8 1
P r e c i s i o n
Recall
colorfulness
BEP
0
0.2
0.4
0.6
0.8
1
0 0.2 0.4 0.6 0.8 1
P r e c i s i o n
Recall
sharpness
BEP
0
0.2
0.4
0.6
0.8
1
0 0.2 0.4 0.6 0.8 1
P r e c i s i o n
Recall
sharpness variation
BEP
0
0.2
0.4
0.6
0.8
1
0 0.2 0.4 0.6 0.8 1
P r e c i s i o n
Recall
naturalness
BEP
0
0.2
0.4
0.6
0.8
1
0 0.2 0.4 0.6 0.8 1
P r e c i s i o n
Recall
textBEP
0
0.2
0.4
0.6
0.8
1
0 0.2 0.4 0.6 0.8 1
P r e c i s i o n
Recall
visualBEP
0
0.2
0.4
0.6
0.8
1
0 0.2 0.4 0.6 0.8 1
P r e c i s i o n
Recall
text+visualBEP
Figure 3: Precision-recall curves for visual and textual dimensions and their combination (8000 trainingphotos per class, numFav≥5)
produce an improved version which is what we ultimatelysense. For the case of text documents, besides a simpleBag-of-Words approach which would capture correlationswith attractive topics, stylometric features based on sen-tence structure, vocabulary distributions and linguistic con-stituents might provide additional clues about the attrac-tiveness of longer texts. Furthermore, we intend to intro-duce more accurate computations of the described visualattributes, e.g. eigenvalues-based sharpness detection, as
well as additional features, such as texture descriptors. Inaddition, besides an aggregated community-based percep-tion of attractiveness, we would like to study recommendermechanisms taking individual user contexts and preferencesinto account to provide personalized results.
We think that the proposed techniques have direct appli-cations to search improvement, where automatically com-puted “attractiveness” can, besides other criteria, be takeninto account to improve relevance assignments and rankings.
WWW 2009 MADRID! Track: Social Networks and Web 2.0 / Session: Photos and Web 2.0
779

8/12/2019 Ranking and Classifying Attractiveness of Photos
http://slidepdf.com/reader/full/ranking-and-classifying-attractiveness-of-photos 10/10
In this connection, integration and user evaluation within awider system context and encompassing additional comple-mentary retrieval and mining methods is of high practicalimportance.
7. ACKNOWLEDGEMENTSThis research was partially funded by the EU Marie Curie
ToK Grant Memoir (MTKD-CT-2005-030008), and the Large-
Scale Integrating EU Project LivingKnowledge .
8. REFERENCES[1] J. Bigun. Vision with Direction: A Systematic
Introduction to Image Processing and Computer Vision . Springer-Verlag, Secaucus, NJ, USA, 2005.
[2] C. Burges, T. Shaked, E. Renshaw, A. Lazier,M. Deeds, N. Hamilton, and G. Hullender. Learning torank using gradient descent. In ICML, pages 89–96,New York, NY, USA, 2005. ACM.
[3] C. J. C. Burges. A tutorial on support vectormachines for pattern recognition. Data Mining and Knowledge Discovery , 2(2):121–167, 1998.
[4] S. Chakrabarti. Mining the Web: Discovering
Knowledge from Hypertext Data . Morgan-Kauffman,2002.
[5] M. Dubinko, R. Kumar, J. Magnani, J. Novak,P. Raghavan, and A. Tomkins. Visualizing tags overtime. In Proc. 15th Int. WWW Conference , May 2006.
[6] R. Duda, P. Hart, and D. Stork. Pattern Classification . Wiley, 2000.
[7] S. Dumais and H. Chen. Hierarchical classification of web content. In SIGIR ’00 , pages 256–263, New York,NY, USA, 2000. ACM.
[8] S. Dumais, J. Platt, D. Heckerman, and M. Sahami.Inductive learning algorithms and representations fortext categorization. In CIKM’98 , pages 148–155,Maryland, United States, 1998. ACM Press.
[9] T. Hammond, T. Hannay, B. Lund, and J. Scott.Social Bookmarking Tools (I): A General Review.D-Lib Magazine , 11(4), April 2005.
[10] S. Hasler and S. Susstrunk. Measuring colorfulness inreal images. volume 5007, pages 87–95, 2003.
[11] A. Hotho, R. Jaschke, C. Schmitz, and G. Stumme.Information Retrieval in Folksonomies: Search andRanking. In The Semantic Web: Research and Applications , volume 4011 of LNAI , pages 411–426,Heidelberg, 2006. Springer.
[12] K. Q. Huang, Q. Wang, and Z. Y. Wu. Natural colorimage enhancement and evaluation algorithm basedon human visual system. Comput. Vis. Image Underst., 103(1):52–63, 2006.
[13] Y. Jing and S. Baluja. Pagerank for product imagesearch. In WWW , pages 307–316, New York, NY,USA, 2008. ACM.
[14] T. Joachims. Text categorization with Support VectorMachines: Learning with many relevant features.ECML, 1998.
[15] T. Joachims. Making large-scale support vector machine learning practical , pages 169–184. MIT Press,Cambridge, MA, USA, 1999.
[16] D. Kalenova, P. Toivanen, and V. Bochko. Preferentialspectral image quality model. pages 389–398. 2005.
[17] W. H. Kruskal. Ordinal measures of association.Journal of the American Statistical Association ,53(284):814–861, 1958.
[18] B. Lund, T. Hammond, M. Flack, and T. Hannay.Social Bookmarking Tools (II): A Case Study -Connotea. D-Lib Magazine , 11(4), 2005.
[19] W. Madison, Y. Yang, and J. Pedersen. Acomparative study on feature selection in textcategorization. In ICML, 1997.
[20] B. S. Manjunath and W. Y. Ma. Texture features forbrowsing and retrieval of image data. Pattern Analysis and Machine Intelligence, IEEE Transactions on ,18(8):837–842, 1996.
[21] C. Manning and H. Schuetze. Foundations of Statistical Natural Language Processing . MIT Press,1999.
[22] E. Peli. Contrast in complex images. Journal of the Optical Society of America , 7:2032–2040, 1990.
[23] M. Richardson, A. Prakash, and E. Brill. Beyondpagerank: machine learning for static ranking. InWWW’06 , pages 707–715, NY, USA, 2006. ACM.
[24] A. E. Savakis, S. P. Etz, and A. C. Loui. Evaluation of image appeal in consumer photography. In B. E.
Rogowitz and T. N. Pappas, editors, SPIE Conference Series , volume 3959, pages 111–120, June 2000.
[25] A. E. Savakis and A. C. Loui. Method For Automatically Detecting Digital Images that are Undesirable for Placing in Albums , volume US6535636. March 2003.
[26] A. E. Savakis and R. Mehrotra. Retrieval andbrowsing of database images based on image emphasisand appeal. US 6847733 , 2005.
[27] C. Schmitz, A. Hotho, R. Jaeschke, and G. Stumme.Mining Association Rules in Folksonomies. In Data Science and Classification , pages 261–270. SpringerBerlin Heidelberg, 2006.
[28] A. J. Smola and B. Scholkopf. A tutorial on support
vector regression. Statistics and Computing ,14(3):199–222, Kluwer Academic Publishers, 2004.
[29] S. van Dongen. A cluster algorithm for graphs.National Research Institute for Mathematics and Computer Science in the Netherlands, Amsterdam,Technical Report INS-R0010 , 2000.
[30] C. Y. Wee and R. Paramesran. Measure of imagesharpness using eigenvalues. Inf. Sci.,177(12):2533–2552, 2007.
[31] S. Winkler. Visual fidelity and perceived quality:Towards comprehensive metrics. In in Proc. SPIE ,volume 4299, pages 114–125, 2001.
[32] S. Winkler and C. Faller. Perceived audiovisualquality of low-bitrate multimedia content. Multimedia,
IEEE Transactions on , 8(5):973–980, 2006.[33] S. Yao, W. Lin, S. Rahardja, X. Lin, E. P. Ong, Z. K.
Lu, and X. K. Yang. Perceived visual quality metricbased on error spread and contrast. In Circuits and Systems, 2005. ISCAS 2005. IEEE International Symposium on , pages 3793–3796 Vol. 4, 2005.
WWW 2009 MADRID! Track: Social Networks and Web 2.0 / Session: Photos and Web 2.0
780
Related Documents


![Ranking and Classifying Attractiveness of Photos in ... · image compression algorithms [32], but also has applications in image enhancement techniques [12] and unsupervised cal-ibration](https://static.cupdf.com/doc/110x72/5ff37e8bd20cdb25fe395567/ranking-and-classifying-attractiveness-of-photos-in-image-compression-algorithms.jpg)