North Carolina State University Adaptive Parameter Identification and State-of-Charge Estimation of Lithium- Ion Batteries Paper accepted to be presented at the 38th Annual Conference of the IEEE Industrial Electronics Society in Montreal, Canada, Oct. 25-28, 2012 Authors: Habiballah Rahimi Eichi, Mo-Yuen Chow

Welcome message from author
This document is posted to help you gain knowledge. Please leave a comment to let me know what you think about it! Share it to your friends and learn new things together.
Transcript

North Carolina State University
Adaptive Parameter
Identification
and State-of-Charge
Estimation of Lithium-
Ion Batteries Paper accepted to be presented at the 38th Annual Conference of the IEEE Industrial Electronics Society in Montreal, Canada, Oct. 25-28, 2012
Authors: Habiballah Rahimi Eichi, Mo-Yuen Chow

Abstract—Estimation of the State of Charge (SOC) is a
fundamental need for the battery, which is the most important energy storage in Electric Vehicles (EVs) and the Smart Grid. Regarding those applications, the SOC estimation algorithm is expected to be accurate and easy to implement. In this paper, after considering a resistor-capacitor (RC) circuit-equivalent model for the battery, the nonlinear relationship between the Open Circuit Voltage (VOC) and the SOC is described in a look-up table obtained from experimental tests. Assuming piecewise linearity for the V OC -SOC curve in small time steps, a parameter identification technique is applied to the real current and voltage data to estimate and update the parameters of the battery at each step. Subsequently, a reduced-order linear observer is designed for this continuously updating model to estimate the SOC as one of the states of the battery system. In designing the observer, a mixture of Coulomb counting and VOC algorithm is combined with the adaptive parameter-updating approach and increases the accuracy to less than 5% error. This paper also investigates the correlation between the SOC estimation error and the observability criterion for the battery model, which is directly related to the slope of the VOC- SOC curve.
Index Terms—Battery Parameter Estimation, Parameter
Identification, State Observer Design, State-of-Charge, VOC-Based SOC Estimation
I. INTRODUCTION
Today, the battery is receiving a vast amount of attention as the most important energy storage device in Electric Vehicles (EVs) and the rapidly growing Smart Grid. Different new technologies have been developed to improve the energy and power density of the batteries. Su et al. [1] have presented a survey on the future goals of battery technology and recent achievements toward those goals. While these technologies are bringing considerable diversity to the characteristics and dynamics of the battery, the cost-efficiency and reliability of the battery relies on algorithms to accurately model the battery dynamics and monitor its states while it is in use in a vehicle or grid. The “state” here refers to the battery State-of-Charge (SOC), State-of-Health (SOH), and State-of-Life (SOL), which are very important indicators to consider in optimizing the functionality and life-time of the battery and avoiding permanent damage. The SOC, which we emphasize in this paper, is the percentage of the rated capacity of the battery that the remaining capacity represents.
Among different approaches proposed so far to estimate the SOC, some are based on detailed electrochemical equations in the battery [2]. Despite their accuracy, these methods are hard to
implement due to complicated partial differential equations. Similarly, the frequency-based methods that use electro-chemical impedance spectroscopy (EIS) [3] are offline methods and not suitable to be applied to a battery pack while it is in use in a plug-in hybrid electric vehicle (PHEV)/plug-in electric vehicle (PEV). However, other approaches such as Coulomb counting (Ah counting) [4], which can easily be implemented by integrating the battery current, suffer from initial SOC estimation and cumulative error. Estimating the SOC based on the VOC is another method that can be implemented simply by a look-up table, but an accurate measurement of the VOC is a challenge due to the battery dynamics. To consider these dynamics, a resistor-capacitor (RC) equivalent model has been proposed. To overcome the inaccuracy of the model, adaptive and nonlinear methods, such as an extended Kalman filter [5] and a sliding-mode observer [6], are deployed. Although these complex methods lead to precise and robust results, the implementation of the algorithms is very complicated. Table I provides a comparative list of the aforementioned approaches and compares the advantages and drawbacks of each method.
TABLE I: COMPARISON OF SOC ESTIMATION APPROACHES
Approach Pros Cons Electrochemical approaches
Accurate Difficult to implement in situ
Ah counting (Coulomb counting )
Easy to implement
1) Dependent on the initial SOC 2) Not suitable in PEVs with frequent charging/ discharging profiles due to the need of accurate initial conditions
Open Circuit Voltage (VOC) measurement
Does not need an algorithm to implement
Needs the battery to be in the resting mode for a long time
Extended Kalman filter
1) Accurate 2) Deals with white noise
1) Large computational time and memory 2) Complicated algorithm to implement
Sliding-mode observer
1) Accurate 2) Deals with system-modeling errors
1) Nonlinear 2) Not easy to implement
The method that we use in this paper to estimate the SOC is based on an equivalent RC model of the battery. In addition, we assume that the nonlinear relationship between VOC and SOC can be mapped to several piecewise linear parts with
Adaptive Parameter Identification and State-of-Charge Estimation of
Lithium-Ion Batteries Habiballah Rahimi-Eichi, Student Member, IEEE, and Mo-Yuen Chow, Fellow, IEEE
Department of Electrical and Computer Engineering, North Carolina State University, NC, USA Emails: [email protected], [email protected]
varying parameters. Accordingly, the battery model can be considered as a Linear Time-Varying (LTV) system with current (iL) as the input and terminal voltage (vT) as the output. Afterward, an online adaptive identification algorithm is employed to identify the battery model parameters at each time step. With this continuously updating model, a reduced-order observer is designed to estimate the SOC as one of the states of the system. This type of approach benefits from two advantages of the other methods: 1) Since we use a linear identification method and a linear observer, the algorithm is easy to implement; 2) Continuously updating the parameters of the battery model improves the accuracy of SOC estimation for its updated operating conditions.
The remainder of this paper is as follows: In section II, we explain the equivalent RC circuit to model the battery characteristics. In section III, we describe the online identification technique to update the parameters of the model. In section IV, the observer structure to estimate the SOC of the battery is proposed. Section V discusses the results of applying the proposed algorithms to the experimental data and compares the outcomes to the ones obtained from the experiments. Section VI concludes the paper.
II. BATTERY MODELING
Different equivalent circuits have been proposed to model the dynamics of the battery. Based on the expected accuracy, different components can be added to the model to represent various characteristics of the battery. However, embedding several components into the model creates a large amount of complexity and a system with a higher order. Therefore, considering the details in the model is a trade-off between accuracy and complexity. In the following paragraphs, we describe some of the battery characteristics that are considered in the battery model for this paper.
A. Linear Model with Internal Resistance
A typical battery can be modeled by a large capacitor. A capacitor can store a large amount of electrical energy in the charging mode and release it in discharging mode. Since this charging/discharging is a chemical process with electrolytes and inter-phase resistance, as shown in Figure 1, a small resistor, R, is considered in series with a capacitor, QR. This small resistor is called the internal resistor of the battery and changes with the SOC, the ambient temperature, and the aging effect of the battery.
Figure 1. Battery linear model with internal resistance
B. Relaxation Effect
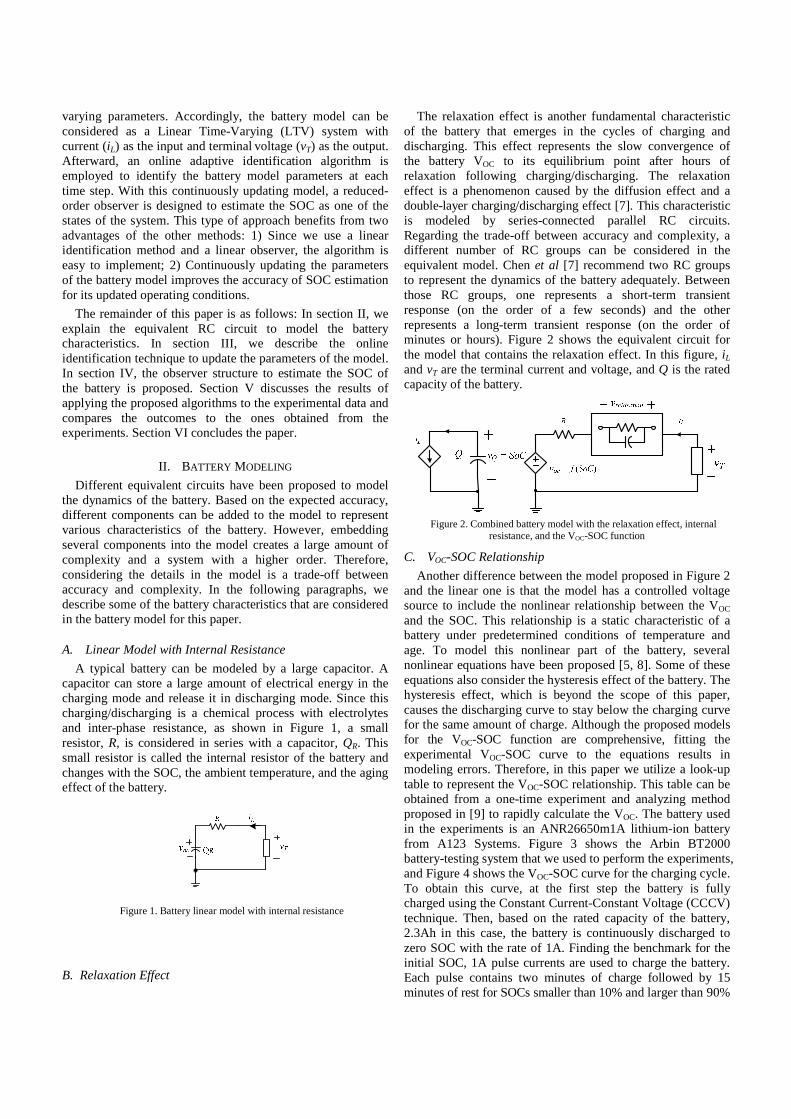
The relaxation effect is another fundamental characteristic of the battery that emerges in the cycles of charging and discharging. This effect represents the slow convergence of the battery VOC to its equilibrium point after hours of relaxation following charging/discharging. The relaxation effect is a phenomenon caused by the diffusion effect and a double-layer charging/discharging effect [7]. This characteristic is modeled by series-connected parallel RC circuits. Regarding the trade-off between accuracy and complexity, a different number of RC groups can be considered in the equivalent model. Chen et al [7] recommend two RC groups to represent the dynamics of the battery adequately. Between those RC groups, one represents a short-term transient response (on the order of a few seconds) and the other represents a long-term transient response (on the order of minutes or hours). Figure 2 shows the equivalent circuit for the model that contains the relaxation effect. In this figure, iL and vT are the terminal current and voltage, and Q is the rated capacity of the battery.
Figure 2. Combined battery model with the relaxation effect, internal
resistance, and the VOC-SOC function
C. VOC-SOC Relationship
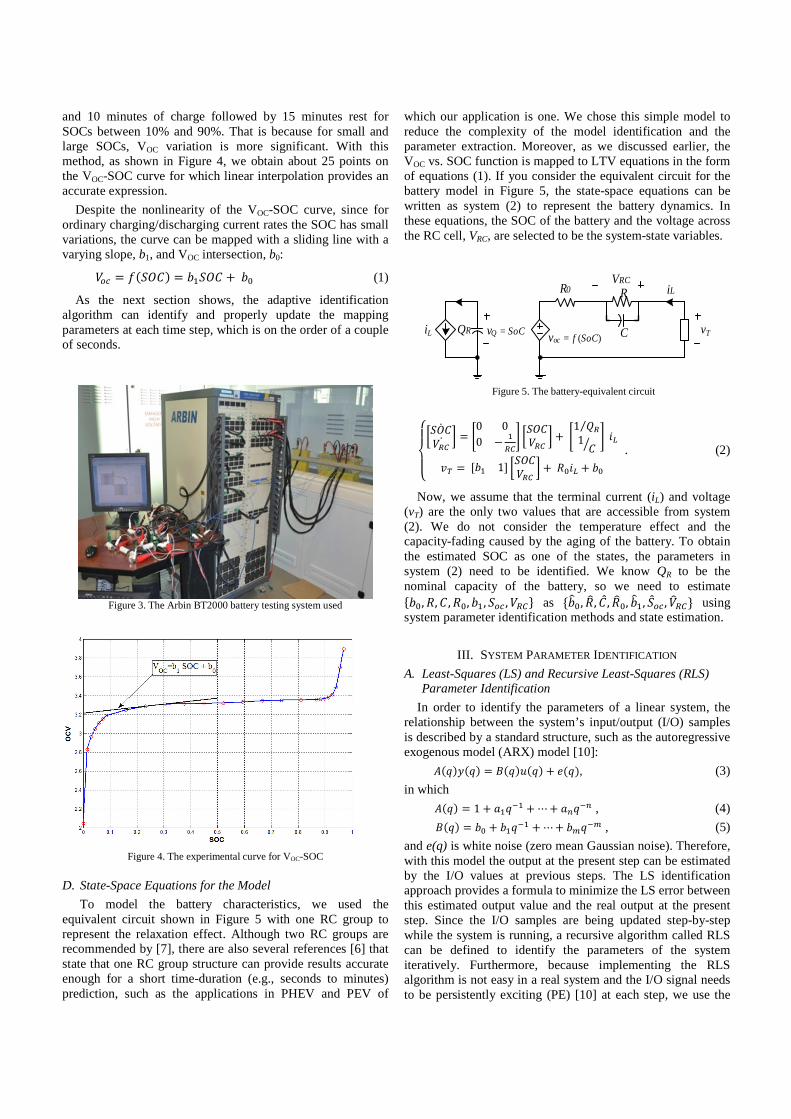
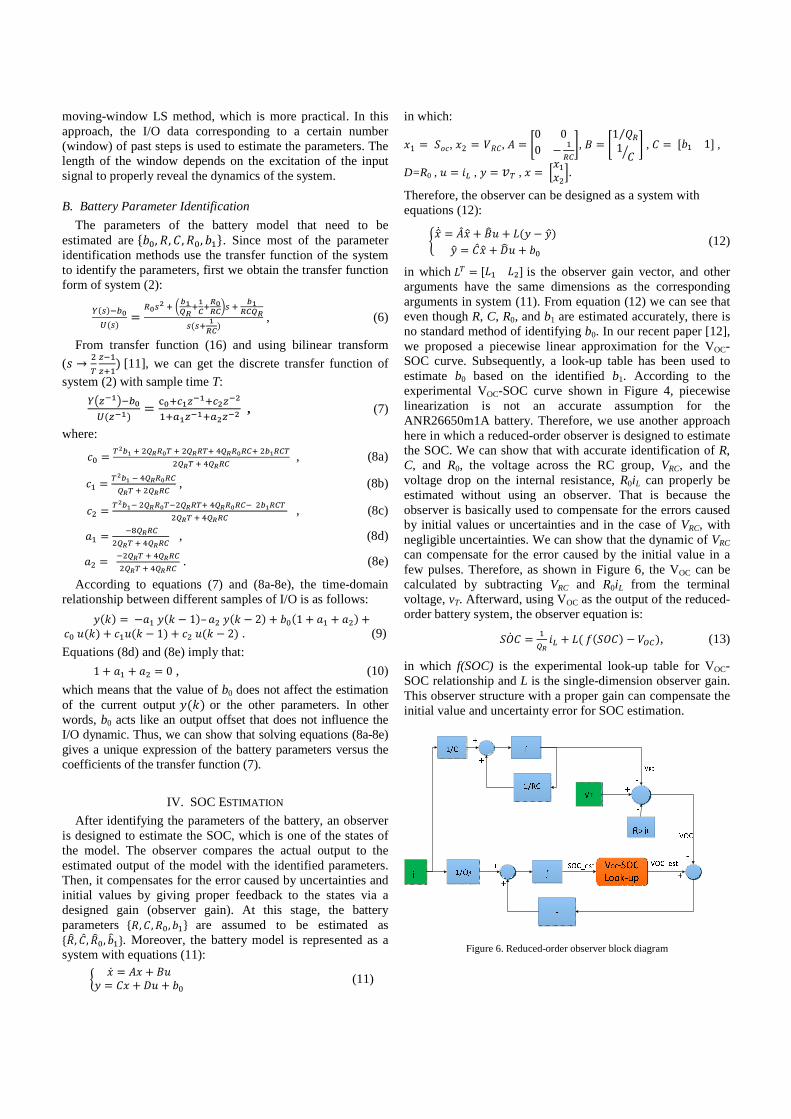
Another difference between the model proposed in Figure 2 and the linear one is that the model has a controlled voltage source to include the nonlinear relationship between the VOC and the SOC. This relationship is a static characteristic of a battery under predetermined conditions of temperature and age. To model this nonlinear part of the battery, several nonlinear equations have been proposed [5, 8]. Some of these equations also consider the hysteresis effect of the battery. The hysteresis effect, which is beyond the scope of this paper, causes the discharging curve to stay below the charging curve for the same amount of charge. Although the proposed models for the VOC-SOC function are comprehensive, fitting the experimental VOC-SOC curve to the equations results in modeling errors. Therefore, in this paper we utilize a look-up table to represent the VOC-SOC relationship. This table can be obtained from a one-time experiment and analyzing method proposed in [9] to rapidly calculate the VOC. The battery used in the experiments is an ANR26650m1A lithium-ion battery from A123 Systems. Figure 3 shows the Arbin BT2000 battery-testing system that we used to perform the experiments, and Figure 4 shows the VOC-SOC curve for the charging cycle. To obtain this curve, at the first step the battery is fully charged using the Constant Current-Constant Voltage (CCCV) technique. Then, based on the rated capacity of the battery, 2.3Ah in this case, the battery is continuously discharged to zero SOC with the rate of 1A. Finding the benchmark for the initial SOC, 1A pulse currents are used to charge the battery. Each pulse contains two minutes of charge followed by 15 minutes of rest for SOCs smaller than 10% and larger than 90%
and 10 minutes of charge followed by 15 minutes rest for SOCs between 10% and 90%. That is because for small and large SOCs, VOC variation is more significant. With this method, as shown in Figure 4, we obtain about 25 points on the VOC-SOC curve for which linear interpolation provides an accurate expression.
Despite the nonlinearity of the VOC-SOC curve, since for ordinary charging/discharging current rates the SOC has small variations, the curve can be mapped with a sliding line with a varying slope, b1, and VOC intersection, b0:
��� � ���� � ���� �� (1)
As the next section shows, the adaptive identification algorithm can identify and properly update the mapping parameters at each time step, which is on the order of a couple of seconds.
Figure 3. The Arbin BT2000 battery testing system used
Figure 4. The experimental curve for VOC-SOC
D. State-Space Equations for the Model
To model the battery characteristics, we used the equivalent circuit shown in Figure 5 with one RC group to represent the relaxation effect. Although two RC groups are recommended by [7], there are also several references [6] that state that one RC group structure can provide results accurate enough for a short time-duration (e.g., seconds to minutes) prediction, such as the applications in PHEV and PEV of
which our application is one. We chose this simple model to reduce the complexity of the model identification and the parameter extraction. Moreover, as we discussed earlier, the VOC vs. SOC function is mapped to LTV equations in the form of equations (1). If you consider the equivalent circuit for the battery model in Figure 5, the state-space equations can be written as system (2) to represent the battery dynamics. In these equations, the SOC of the battery and the voltage across the RC cell, VRC, are selected to be the system-state variables.
vT
R0 iL
voc = f (SoC)iL QR vQ = SoC
R
C
VRC
Figure 5. The battery-equivalent circuit
������������� � � �0 00 � ���� ������ � �1 ��⁄1 �!"
#$ � %�� 1& ������ � '�!" �� . (2)
Now, we assume that the terminal current (iL) and voltage (vT) are the only two values that are accessible from system (2). We do not consider the temperature effect and the capacity-fading caused by the aging of the battery. To obtain the estimated SOC as one of the states, the parameters in system (2) need to be identified. We know QR to be the nominal capacity of the battery, so we need to estimate (��, ', , '�, ��, ��� , ���* as (�+�, '+, ,, '+�, �+�, �,�� , �+��* using system parameter identification methods and state estimation.
III. SYSTEM PARAMETER IDENTIFICATION
A. Least-Squares (LS) and Recursive Least-Squares (RLS) Parameter Identification
In order to identify the parameters of a linear system, the relationship between the system’s input/output (I/O) samples is described by a standard structure, such as the autoregressive exogenous model (ARX) model [10]: -�./�. � 0�.1�. 2�., (3)
in which -�. � 1 3�.4� ⋯ 36.46 , (4) 0�. � �� ��.4� ⋯ �7.47 , (5)
and e(q) is white noise (zero mean Gaussian noise). Therefore, with this model the output at the present step can be estimated by the I/O values at previous steps. The LS identification approach provides a formula to minimize the LS error between this estimated output value and the real output at the present step. Since the I/O samples are being updated step-by-step while the system is running, a recursive algorithm called RLS can be defined to identify the parameters of the system iteratively. Furthermore, because implementing the RLS algorithm is not easy in a real system and the I/O signal needs to be persistently exciting (PE) [10] at each step, we use the
moving-window LS method, which is more practical. In this approach, the I/O data corresponding to a certain number (window) of past steps is used to estimate the parameters. The length of the window depends on the excitation of the input signal to properly reveal the dynamics of the system.
B. Battery Parameter Identification
The parameters of the battery model that need to be estimated are (��, ', , '�, ��*. Since most of the parameter identification methods use the transfer function of the system to identify the parameters, first we obtain the transfer function form of system (2):
8�94:;<�9 = �;9=>?@ABC>
AD>C;CDE9> @ACDBC
9�9> ACD
, (6)
From transfer function (16) and using bilinear transform
(F → H$I4�I>�[11], we can get the discrete transfer function of
system (2) with sample time T:
8JIKAL4:;<�IKA = M;>�AIKA>�=IK=
�>NAIKA>N=IK= , (7)
where:
O� = $=:A>HPC�;$>HPC�$>QPC�;��>H:A��$HPC$>QPC�� , (8a)
O� = $=:A4QPC�;��PC$>HPC�� , (8b)
OH = $=:A4HPC�;$4HPC�$>QPC�;��4H:A��$HPC$>QPC�� , (8c)
3� = 4RPC��HPC$>QPC�� , (8d)
3H =4HPC$>QPC��HPC$>QPC�� . (8e)
According to equations (7) and (8a-8e), the time-domain relationship between different samples of I/O is as follows:
/�S = −3�/�S − 1–3H/�S − 2 + ���1 + 3� + 3H +O�1�S + O�1�S − 1 + OH1�S − 2 . (9)
Equations (8d) and (8e) imply that:
1 + 3� + 3H = 0 , (10)
which means that the value of b0 does not affect the estimation of the current output /�S or the other parameters. In other words, b0 acts like an output offset that does not influence the I/O dynamic. Thus, we can show that solving equations (8a-8e) gives a unique expression of the battery parameters versus the coefficients of the transfer function (7).
IV. SOC ESTIMATION
After identifying the parameters of the battery, an observer is designed to estimate the SOC, which is one of the states of the model. The observer compares the actual output to the estimated output of the model with the identified parameters. Then, it compensates for the error caused by uncertainties and initial values by giving proper feedback to the states via a designed gain (observer gain). At this stage, the battery parameters (', , '�, ��* are assumed to be estimated as ('+, ,, '+�, �+�*. Moreover, the battery model is represented as a system with equations (11):
V W� = -W + 01/ = W + X1 + �� (11)
in which:
W1 = �YO, W2 = �', - = �0 00 − �
���, 0 = �1 ��⁄1 � , = %�� 1& ,
D=R0 , 1 = !" , / = #$ , W = ZW�WH[. Therefore, the observer can be designed as a system with equations (12):
\W]� = -,W] + 0+1 + ^�/ − /]/] = ,W] + X_1 + �� (12)
in which ̂ $ = %^� ^H& is the observer gain vector, and other arguments have the same dimensions as the corresponding arguments in system (11). From equation (12) we can see that even though R, C, R0, and b1 are estimated accurately, there is no standard method of identifying b0. In our recent paper [12], we proposed a piecewise linear approximation for the VOC-SOC curve. Subsequently, a look-up table has been used to estimate b0 based on the identified b1. According to the experimental VOC-SOC curve shown in Figure 4, piecewise linearization is not an accurate assumption for the ANR26650m1A battery. Therefore, we use another approach here in which a reduced-order observer is designed to estimate the SOC. We can show that with accurate identification of R, C, and R0, the voltage across the RC group, VRC, and the voltage drop on the internal resistance, R0iL can properly be estimated without using an observer. That is because the observer is basically used to compensate for the errors caused by initial values or uncertainties and in the case of VRC, with negligible uncertainties. We can show that the dynamic of VRC can compensate for the error caused by the initial value in a few pulses. Therefore, as shown in Figure 6, the VOC can be calculated by subtracting VRC and R0iL from the terminal voltage, vT. Afterward, using VOC as the output of the reduced-order battery system, the observer equation is:
��� = �PC !" + ^����� − �̀ �, (13)
in which f(SOC) is the experimental look-up table for VOC-SOC relationship and L is the single-dimension observer gain. This observer structure with a proper gain can compensate the initial value and uncertainty error for SOC estimation.
Figure 6. Reduced-order observer block diagram

V. RESULTS AND DISCUSSION
To verify the effectiveness and performance of the proposed method, we apply the identification algorithm and consequently the SOC estimation algorithm to the data obtained from actual experiments on the ANR26650m1A lithium-ion battery. This is a nano-phosphate lithium-ion battery and can be used in portable high power density devices, grid stabilization energy storage, and commercial truck and bus HEVs. The operating voltage for this battery is 3.0V and the recommended discharge and charge cutoff voltages are 2.0V and 3.8V, respectively. As discussed in section II, the Arbin BT2000 battery testing system (Figure 3) is used to implement and perform the experiments. The initial phase for the pulse-charging experiment that we need for this part is the same as in the previous experiment. The CCCV process is used to fully charge the battery and check for 100% SOC. After that, the battery is discharged with a constant current rate of 1A to its 15% SOC. Following a long (more than one hour) rest, the battery is charged with sequential pulses of 10 minutes charge with 1A current rate and 10 minutes rest. The testing system logs the battery measured data, which are terminal current, terminal voltage, and the battery surface temperature to the PC with the sample rate of one second and record them in a Microsoft Excel file. Since this paper does not examine the temperature effect on the battery parameters and performance, we import the recorded current and voltage (Figure 7) to MATLAB/SIMULINK to apply the algorithms.
Using current and voltage data as inputs to the identification algorithm described in section III, the parameters of the battery are estimated and shown in Figure 8. The results show that R0, R, and C have a slight change for different values of SOC. These changes show that even with an accurate VOC-SOC model, a battery model with fixed parameters cannot express the precise dynamic of the real battery. Online identification and updating of the parameters is more effective in enhancing the accuracy, considering the fact that the battery parameters also change with charging/discharging rate, aging, and temperature. Moreover, the last graph in Figure 8 shows the significant change of b1 with an expected SOC because it is basically the slope of the curve in Figure 4. We can see from this graph that although the slope starts from values greater than one, it also goes to very small values (around 0.2) when the VOC-SOC relationship in Figure 4 is close to flat.
Since in system (11) the A matrix is already in the canonical form, the observability criterion (index) is defined as non-zero columns for the matrix [13]
Cn = C = [1 b1]. (14)
Therefore, when b1 is close to zero, the system is in a weak observability condition. The impact of observability on the SOC estimation error can be seen in the results shown in Figures 9 and 10. Figure 9 compares the estimated SOC obtained from our proposed approach to the SOC calculated by Ah counting. The Ah counting method is considered to be a benchmark because in this case the initial SOC is known and, with the smooth charging current, the accumulative error is negligible. We can see in Figure 9 that the estimation error does not exceed 5%, and for some regions it is close to zero. To investigate the reason for a larger error in the time between 3,000 and 7,000 seconds, Figure 10 shows the SOC estimation
error and on the same plot the identified b1, the slope of VOC-SOC curve. We can see from this plot that as soon as the b1 value significantly decreases, the estimation error starts to increase and vice versa.
Figure 7. Battery terminal voltage and current
Figure 8. Battery identified parameters
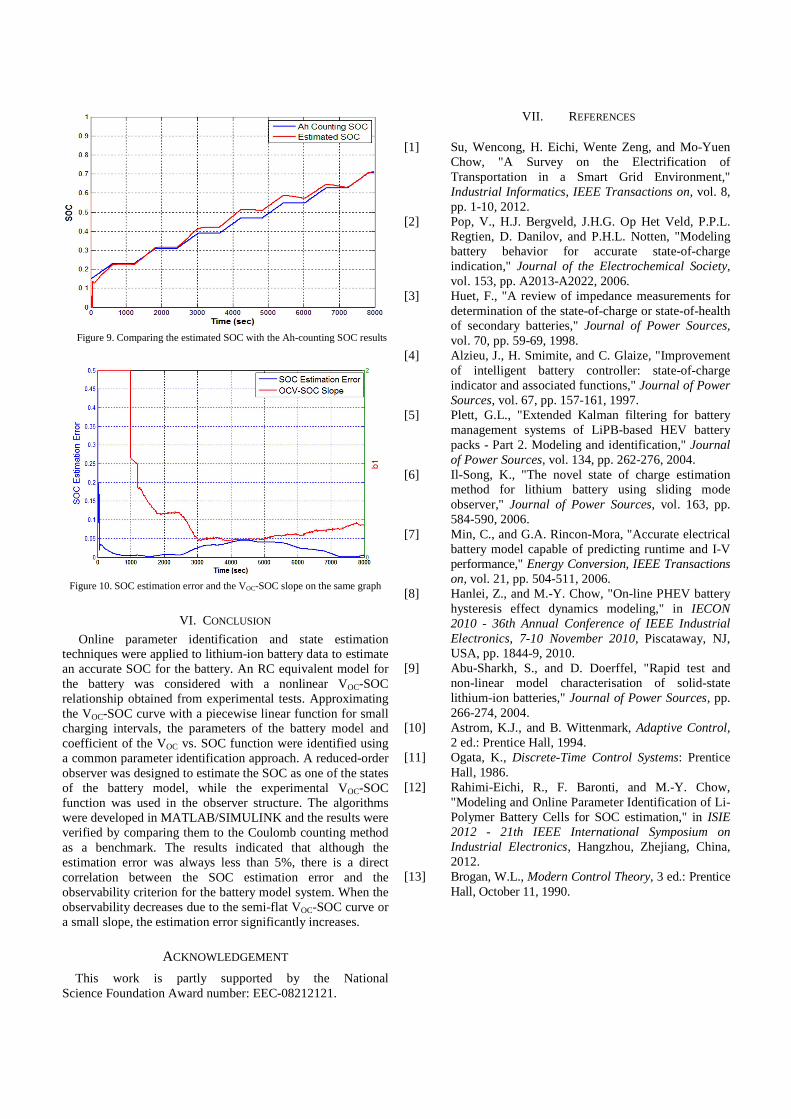
Figure 9. Comparing the estimated SOC with the Ah-counting SOC results
Figure 10. SOC estimation error and the VOC-SOC slope on the same graph
VI. CONCLUSION
Online parameter identification and state estimation techniques were applied to lithium-ion battery data to estimate an accurate SOC for the battery. An RC equivalent model for the battery was considered with a nonlinear VOC-SOC relationship obtained from experimental tests. Approximating the VOC-SOC curve with a piecewise linear function for small charging intervals, the parameters of the battery model and coefficient of the VOC vs. SOC function were identified using a common parameter identification approach. A reduced-order observer was designed to estimate the SOC as one of the states of the battery model, while the experimental VOC-SOC function was used in the observer structure. The algorithms were developed in MATLAB/SIMULINK and the results were verified by comparing them to the Coulomb counting method as a benchmark. The results indicated that although the estimation error was always less than 5%, there is a direct correlation between the SOC estimation error and the observability criterion for the battery model system. When the observability decreases due to the semi-flat VOC-SOC curve or a small slope, the estimation error significantly increases.
ACKNOWLEDGEMENT
This work is partly supported by the National Science Foundation Award number: EEC-08212121.
VII. REFERENCES [1] Su, Wencong, H. Eichi, Wente Zeng, and Mo-Yuen
Chow, "A Survey on the Electrification of Transportation in a Smart Grid Environment," Industrial Informatics, IEEE Transactions on, vol. 8, pp. 1-10, 2012.
[2] Pop, V., H.J. Bergveld, J.H.G. Op Het Veld, P.P.L. Regtien, D. Danilov, and P.H.L. Notten, "Modeling battery behavior for accurate state-of-charge indication," Journal of the Electrochemical Society, vol. 153, pp. A2013-A2022, 2006.
[3] Huet, F., "A review of impedance measurements for determination of the state-of-charge or state-of-health of secondary batteries," Journal of Power Sources, vol. 70, pp. 59-69, 1998.
[4] Alzieu, J., H. Smimite, and C. Glaize, "Improvement of intelligent battery controller: state-of-charge indicator and associated functions," Journal of Power Sources, vol. 67, pp. 157-161, 1997.
[5] Plett, G.L., "Extended Kalman filtering for battery management systems of LiPB-based HEV battery packs - Part 2. Modeling and identification," Journal of Power Sources, vol. 134, pp. 262-276, 2004.
[6] Il-Song, K., "The novel state of charge estimation method for lithium battery using sliding mode observer," Journal of Power Sources, vol. 163, pp. 584-590, 2006.
[7] Min, C., and G.A. Rincon-Mora, "Accurate electrical battery model capable of predicting runtime and I-V performance," Energy Conversion, IEEE Transactions on, vol. 21, pp. 504-511, 2006.
[8] Hanlei, Z., and M.-Y. Chow, "On-line PHEV battery hysteresis effect dynamics modeling," in IECON 2010 - 36th Annual Conference of IEEE Industrial Electronics, 7-10 November 2010, Piscataway, NJ, USA, pp. 1844-9, 2010.
[9] Abu-Sharkh, S., and D. Doerffel, "Rapid test and non-linear model characterisation of solid-state lithium-ion batteries," Journal of Power Sources, pp. 266-274, 2004.
[10] Astrom, K.J., and B. Wittenmark, Adaptive Control, 2 ed.: Prentice Hall, 1994.
[11] Ogata, K., Discrete-Time Control Systems: Prentice Hall, 1986.
[12] Rahimi-Eichi, R., F. Baronti, and M.-Y. Chow, "Modeling and Online Parameter Identification of Li-Polymer Battery Cells for SOC estimation," in ISIE 2012 - 21th IEEE International Symposium on Industrial Electronics, Hangzhou, Zhejiang, China, 2012.
[13] Brogan, W.L., Modern Control Theory, 3 ed.: Prentice Hall, October 11, 1990.
Related Documents