Project co-funded by the European Commission within the Sixth Framework Programme (2002-2006) Dissemination Level PU Public (once status is accepted by EC DG RTD) Project No: 018476-GOCE Project acronym: ADAM Project title: ADAM Adaptation and Mitigation Strategies: Supporting European Climate Policy Instrument: Integrated Project (IP) Thematic Priority: Global Change and Ecosystems Deliverable D3 of work package M1 (code D-M1.3) ADAM 2-degree scenario for Europe – policies and impacts Due date of deliverable: April 30 th 2009 Actual submission date: July 31 st 2009 Start date of project: March 1 st 2006 Duration: 41 months Organisation name of lead contractor for this deliverable: Fraunhofer Institute Systems and Innovation Research (Fraunhofer-ISI) Eberhard Jochem and Wolfgang Schade, work package leaders of M1 Revision: Final 1.1

Welcome message from author
This document is posted to help you gain knowledge. Please leave a comment to let me know what you think about it! Share it to your friends and learn new things together.
Transcript
Project co-funded by the European Commission within the Sixth Framework Programme (2002-2006)
Dissemination Level PU Public (once status is accepted by EC DG RTD)
Project No: 018476-GOCE Project acronym: ADAM
Project title: ADAM Adaptation and Mitigation Strategies: Supporting European Climate Policy
Instrument: Integrated Project (IP)
Thematic Priority: Global Change and Ecosystems
Deliverable D3 of work package M1 (code D-M1.3)
ADAM 2-degree scenario for Europe – policies and impacts
Due date of deliverable: April 30th 2009
Actual submission date: July 31st 2009
Start date of project: March 1st 2006 Duration: 41 months
Organisation name of lead contractor for this deliverable:
Fraunhofer Institute Systems and Innovation Research (Fraunhofer-ISI)
Eberhard Jochem and Wolfgang Schade, work package leaders of M1
Revision: Final 1.1


ADAM Adaptation and Mitigation Strategies:
Supporting European Climate Policy
Work package leader:
ISI Fraunhofer Institute Systems and Innovation Research, Karlsruhe, Germany
Partners:
PSI Paul Scherrer Institute Villigen, Switzerland
CEPE Centre for Energy Policy and Economics ETH Zurich, Switzerland
CNRS-LEPII
Laboratoire d’Economie de la Production et de l’Intégration Internationale
UMR 5252 CNRS – UPMF, Grenoble, France
ENERDATA
Grenoble, France
BSR BSR Sustainability GmbH – Büro für Sozialverträgliche Ressourcennutzung, Karlsruhe, Germany
Alterra
Wageningen University and Research Centre concern, The Netherlands


ADAM Deliverable D-M1.3 v
ADAM Adaptation and Mitigation Strategies: Supporting European Climate Policy
Deliverable information:
Deliverable no: 3 (D-M1.3) Workpackage no: M1
Title: ADAM 2-degree scenario for Europe – policies and impacts
Authors: Wolfgang Schade, Eberhard Jochem, Terry Barker, Giacomo Catenazzi, Wolfgang Eichhammer, Tobias Fleiter, Anne Held, Nicki Helfrich, Martin Jakob, Patrick Cri-qui, Silvana Mima, Laura Quandt, Anja Peters, Mario Ragwitz, Ulrich Reiter, Felix Reitze, Mart-Jan Schelhaas, Serban Scrieciu, Hal Turton
Version: 1.1 Date of publication: 31.07.2009
This document should be referenced as:
Schade, W., Jochem, E., Barker, T., Catenazzi, G., Eichhammer, W., Fleiter, T., Held, A., Helfrich, N., Jakob, M., Criqui, P., Mima, S., Quandt, L., Peters, A., Ragwitz, M., Reiter, U., Reitze, F., Schelhaas, M., Scrieciu, S., Turton, H. (2009): ADAM 2-degree scenario for Europe – policies and impacts. Deliverable D-M1.3 of ADAM (Adaptation and Mitigation Strategies: Supporting European Climate Policy). Project co-funded by European Commission 6th RTD Programme. Karlsruhe, Germany.
Project information: Project acronym: ADAM Project name: Adaptation and Mitigation Strategies: Supporting European Climate Policy Contract no: 018476-GOCE Duration: 01.03.2006 – 31.07.2009 Commissioned by: European Commission – DG RTD – 6th Research Framework Programme. Lead partner: UEA – University of East Anglia, Norwich, United Kingdom. Partners of M1: ISI, Germany; PSI, Switzerland; CEPE, Switzerland; BSR, Germany; ENERDATA,
France; CNERS-LEPII, France; ALTERRA, The Netherlands Website: http://www.adamproject.eu/
Document control information: Status: Restricted Distribution: ADAM partners, European Commission Availability: Public (only once status above is accepted) Filename: ADAM_M1_D3_two_degree_scenario.pdf Quality assurance: Gillian Bowman-Köhler, Imke Gries, Jonathan Köhler, Renate Schmitz,
Irmgard Sieb, Monika Silbereis External review Nico Bauer, PIK Coordinator`s review: Wolfgang Schade, Eberhard Jochem Signature: Date:


ADAM Deliverable D-M1.3 vii
Table of Contents
Executive Summary ...................................................................................................... 01
1 Introduction .............................................................................................................. 1
1.1 Climate policy: past and future ............................................................... 2 1.1.1 Current international climate policy: Kyoto Protocol and EU-ETS ....... 2 1.1.2 Future climate policy: Post-Kyoto developments ................................... 3 1.1.3 Related policy framework in the EU and Member States ....................... 4
1.2 Approach of work package Mitigation M1 ............................................. 6
1.3 Issues of mitigation analysis in Europe ................................................... 8
1.4 Objectives and scenarios of this deliverable ........................................... 9
1.5 Structure of this deliverable .................................................................. 10
2 Scenarios and macroeconomic assumptions ........................................................ 11
2.1 Definition of Scenarios ......................................................................... 11
2.2 Demographic and economic conditions ................................................ 13
2.3 Energy prices ......................................................................................... 17
3 Methodological issues analysing mitigation options ........................................... 19
3.1 The ADAM hybrid model system (HMS) ............................................ 19 3.1.1 Linking top-down and bottom-up models ............................................. 19 3.1.2 Integration of models to form the ADAM-HMS .................................. 20 3.1.3 Brief description of the single models................................................... 23 3.1.3.1 ASTRA macro-economic model ........................................................... 23 3.1.3.2 RESIDENT model ................................................................................ 23 3.1.3.3 SERVE model ....................................................................................... 24 3.1.3.4 ISIndustry model ................................................................................... 24 3.1.3.5 ASTRA transport model ....................................................................... 25 3.1.3.6 PowerAce-ResInvest model .................................................................. 25 3.1.3.7 EuroMM model ..................................................................................... 25

viii ADAM Deliverable D-M1.3
3.1.3.8 EFISCEN model ................................................................................... 26 3.1.3.9 MATEFF model .................................................................................... 27 3.1.3.10 POLES model ....................................................................................... 27
3.2 Data exchange system ........................................................................... 28 3.2.1 Virtual Model Server – automated data exchange ................................ 28 3.2.1.1 Technical details ................................................................................... 29 3.2.1.2 Design philosophy ................................................................................ 29 3.2.1.3 Functionality ......................................................................................... 30 3.2.2 Data flow between models .................................................................... 31
3.3 Simulation and convergence of the models in ADAM-HMS ............... 32
4 The integrated global energy model POLES and its projections for the Reference and 2°C scenarios ................................................................................. 34
4.1 Assumptions and methods of the Reference Scenario .......................... 35 4.1.1 Major assumptions ................................................................................ 35 4.1.1.1 Population and economic growth in ADAM projections ..................... 35 4.1.1.2 World fossil fuel resources ................................................................... 39 4.1.1.3 The geo-political and climate policy context ........................................ 40 4.1.2 Methods used to reflect the impact of climate change .......................... 42 4.1.2.1 Modelling the impacts of climate change on heating demand .............. 42 4.1.2.2 Results ................................................................................................... 44 4.1.2.3 Modelling the impacts of climate change on cooling demand ............. 45 4.1.2.4 Data ....................................................................................................... 46 4.1.2.5 Results ................................................................................................... 47
4.2 Energy balances and emission profiles in the 2°C projections ............. 47 4.2.1 Primary energy balance ......................................................................... 47 4.2.2 The development of electricity generation ........................................... 50 4.2.3 Hydrogen production ............................................................................ 55 4.2.4 Trends in final energy demand ............................................................. 57 4.2.5 GHG emissions ..................................................................................... 61
4.3 Assumptions and results for the POLES model – the 2°C scenarios ................................................................................................ 65

ADAM Deliverable D-M1.3 ix
4.3.1 Assumptions and methods for the 2°C scenarios .................................. 65 4.3.2 Results of the 2°C scenario to 2050 ...................................................... 68 4.3.2.1 Impact on energy supply and demand ................................................... 68 4.3.2.2 Technological changes induced by the scenario ................................... 75
4.4 Conclusions on policies and reduction strategies by POLES ............... 85
5 Forest and basic materials sector ......................................................................... 87
5.1 Forest sector .......................................................................................... 87 5.1.1 Target of analysis .................................................................................. 87 5.1.2 Assumptions and model rationale ......................................................... 87 5.1.3 Results ................................................................................................... 89 5.1.4 Conclusions ........................................................................................... 91
5.2 Assumptions and results of the MATEFF model – Reference and 2°C Scenario - 2000 to 2050 .......................................................... 92
5.2.1 Assumptions about the demand of energy-intensive products .............. 93 5.2.1.1 Reference Scenario – 2000 to 2050 ...................................................... 93 5.2.1.2 Assumptions about material efficiency in the 2°C Scenario –
2000 to 2050 .......................................................................................... 98 5.2.2 Production changes in energy-intensive products ............................... 100 5.2.2.1 Reference Scenario – 2000 to 2050 .................................................... 100 5.2.2.2 2°C Scenario - 2000 to 2050 ............................................................... 103 5.2.3 Remarks on data availability ............................................................... 105
5.3 Wood fuel demand in Europe in the Reference and 2°C Scenario, 2000 to 2050 ........................................................................ 107
5.3.1 The Reference Scenario ...................................................................... 107 5.3.1.1 Assumptions on the Reference Scenario ............................................. 107 5.3.1.2 Results of the Reference Scenario ....................................................... 109 5.3.2 The 2°C Scenario ................................................................................ 112 5.3.2.1 Assumptions of the 2° C Scenario ...................................................... 112 5.3.2.2 Results 2°C Scenario: firewood, pellet and chip demand ................... 114

x ADAM Deliverable D-M1.3
6 Residential sector in Europe ............................................................................... 119
6.1 Challenges and objectives of the analysis ........................................... 119
6.2 Methodology and assumptions ........................................................... 120 6.2.1 Buildings ............................................................................................. 121 6.2.1.1 Energy efficiency of heating in residential buildings ......................... 121 6.2.1.2 Substitution of fossil fuels .................................................................. 123 6.2.1.3 Impact of adaptation ........................................................................... 124 6.2.1.4 Cost of mitigation and adaptation ....................................................... 125 6.2.2 Energy efficiency of non-heating uses and of electrical
appliances ............................................................................................ 127 6.2.2.1 Hot water, cooking and lighting .......................................................... 127 6.2.2.2 Electrical appliances ........................................................................... 128 6.2.2.3 Cost of mitigation and adaptation ....................................................... 129
6.3 Results of the Reference and of the variants of the 2°C Scenario ...... 129 6.3.1 Energy savings in residential sector .................................................... 130 6.3.2 Changes of cost and investments ........................................................ 136
6.4 Policy conclusions .............................................................................. 139
7 The service (tertiary) and the primary sectors in Europe ............................... 141
7.1 Challenges and objectives of the analysis ........................................... 141
7.2 Methodology and assumptions ........................................................... 142 7.2.1 Heating and fuel energy demand ........................................................ 144 7.2.1.1 Energy efficiency for heating in the service and the primary
sector ................................................................................................... 144 7.2.1.2 Fuel shares in the service sector .......................................................... 146 7.2.2 Electricity demand in the service and the primary sectors ................. 147
7.3 Results for the Reference (adaptation) and the 2°C mitigation scenarios .............................................................................................. 148
7.3.1 Energy demand and energy-efficiency gains in the service and primary sectors .................................................................................... 148
7.3.2 Changes in costs and investments ....................................................... 155
7.4 Conclusions and policy recommendations .......................................... 157

ADAM Deliverable D-M1.3 xi
8 Basic products and other manufacturing industry sectors .............................. 161
8.1 Target of analysis ................................................................................ 161
8.2 Technologies and assumptions ............................................................ 163 8.2.1 Cross-cutting technologies electricity ................................................. 163 8.2.2 Cross-cutting technologies heat and steam ......................................... 169 8.2.3 Process-specific technologies .............................................................. 175 8.2.4 Carbon Capture and Storage ............................................................... 177
8.3 Model rationale and limits .................................................................. 178
8.4 Results of scenarios ............................................................................. 181
8.5 Conclusion on policies to achieve changes in industry sector ............ 184
9 Transport sector in Europe ................................................................................. 190
9.1 Target of analysis ................................................................................ 190
9.2 Policies, technology trends and model rationale of ASTRA .............. 192 9.2.1 Model rationale of the ASTRA transport model ................................. 192 9.2.2 Transport technology trends ................................................................ 197 9.2.3 Policy options for passenger cars ........................................................ 198 9.2.3.1 Energy / CO2 labelling of new passenger vehicles ............................. 198 9.2.3.2 CO2 based annual vehicle circulation tax ............................................ 200 9.2.3.3 Feebates on new passenger vehicles ................................................... 202 9.2.4 Policy choices for transport in the EU ................................................ 205
9.3 Results of scenarios ............................................................................. 208 9.3.1 Overview of the Transport Reference Scenario .................................. 208 9.3.2 Transport in the 2°C scenarios ............................................................ 211 9.3.3 Mitigation investments in the transport sector .................................... 219 9.3.4 Impact of policies in the 2°C scenarios ............................................... 221
9.4 Conclusions about policies to achieve changes in transport sector ..... 227
10 Renewables sector in Europe .............................................................................. 229
10.1 Target of the analysis .......................................................................... 229

xii ADAM Deliverable D-M1.3
10.2 Basic assumptions on technologies ..................................................... 230
10.3 The potential contribution of renewable energy sources to mitigating climate change in centralised installations ........................ 230
10.3.1 Assumptions for electricity generation by renewables - 2° Scenario ............................................................................................... 230
10.3.2 Results for electricity generation by renewables in Europe – Base Case Scenario and 2° Scenario 2000 to 2050............................. 234
10.3.2.1 Wind onshore ...................................................................................... 237 10.3.2.2 Wind offshore ..................................................................................... 238 10.3.2.3 Solar energy ........................................................................................ 239 10.3.2.4 Geothermal energy .............................................................................. 241 10.3.2.5 Hydroenergy ....................................................................................... 242 10.3.2.6 Solid biomass ...................................................................................... 243 10.3.2.7 Biowaste .............................................................................................. 245 10.3.2.8 Biogas ................................................................................................. 246 10.3.2.9 Primary use of all biomass types ........................................................ 247 10.3.2.10 Ocean energy ...................................................................................... 248 10.3.2.11 The use of biomass in district heating plants and CHP-plants ............ 248 10.3.3 Mitigation costs in the renewables sector ........................................... 249
10.4 Conclusions on policies to achieve changes in the renewables sector ................................................................................................... 251
11 Conversion sector in Europe ............................................................................... 253
11.1 Target of analysis ................................................................................ 253
11.2 Policies / Technologies / Assumptions and model rationale / limits for EuroMM .............................................................................. 253
11.3 Results of scenarios ............................................................................. 254 11.3.1 Electricity generation .......................................................................... 254 11.3.2 Other energy conversion ..................................................................... 257 11.3.3 Primary energy demand ...................................................................... 258 11.3.4 Emissions ............................................................................................ 259 11.3.5 Investment costs .................................................................................. 260

ADAM Deliverable D-M1.3 xiii
11.4 Conclusion on policies to achieve sectoral changes ........................... 262
12 Synthesis of sectoral analysis in Europe ............................................................ 264
12.1 Comparison of common framework variables .................................... 264
12.2 Overview comparing the energy and emission trends of ADAM-HMS and POLES ................................................................... 268
12.3 Comparison of residential and service sectors: POLES and three bottom-up models of the ADAM-HMS ..................................... 273
12.4 Comparison of industry sector: POLES and ISIndustry ..................... 278
12.5 Comparison of transport sector: POLES and ASTRA ........................ 280 12.5.1 Transport fuel consumption ................................................................ 280 12.5.2 Car Fleets ............................................................................................ 282
12.6 Comparison of renewables sector: POLES and PowerACE-ResInvest ............................................................................................. 284
12.6.1 General comparison of modelling approach and assumptions ............ 284 12.6.2 Specific comparison of the 2° Scenario results ................................... 285
12.7 Comparison of conversion sector: POLES and EuroMM ................... 288 12.7.1 Primary energy .................................................................................... 289 12.7.2 Electricity generation .......................................................................... 290
12.8 Summary of bottom-up analysis ......................................................... 292 12.8.1 The ADAM-HMS storyline of the 2°C scenario ................................. 292 12.8.2 The POLES storyline of the 2°C scenario ........................................... 294 12.8.3 Policy conclusions from the bottom-up analyses ................................ 294
13 Macro-economic impacts of climate policy in the EU....................................... 296
13.1 Structure of economic models of ASTRA .......................................... 296
13.2 Feeding the bottom-up impulses into the ASTRA model ................... 302
13.3 Macro-economic cost and investment impulses of mitigation in Europe ................................................................................................. 306
13.4 Macro-economic impacts of 2-degree scenarios in Europe ................ 312
13.5 Conclusions of the macro-economic assessment ................................ 321

xiv ADAM Deliverable D-M1.3
14 The Effects of the Financial Crisis on Baseline Simulations with Implications for Climate Policy Modelling: An Analysis Using the Global Model E3MG, 2008-2012 ........................................................................ 323
14.1 Introduction ......................................................................................... 323
14.2 The financial crisis and the climate crisis: common traits .................. 325
14.3 Modelling the financial crisis .............................................................. 326 14.3.1 Our E3MG modelling approach .......................................................... 326 14.3.2 Scenarios simulating the financial crisis ............................................. 328
14.4 Impacts of the financial crisis and recession ....................................... 330
14.5 Discussion and conclusions on macro-economic level ....................... 337
14.6 Impacts of economic crisis on sectoral level ...................................... 338 14.6.1 Impact of crisis on residential sector .................................................. 338 14.6.2 Impact of crisis on services sector ...................................................... 340 14.6.3 Impact of crisis on industry sector ...................................................... 340 14.6.4 Impact of crisis on transport sector ..................................................... 341 14.6.5 Impact of crisis on energy conversion sector ...................................... 342
14.7 Conclusion on impacts of crisis on the sectoral level ......................... 343
15 Conclusions and policy recommendations ......................................................... 345
15.1 Conclusions and recommendations on the methodology .................... 345
15.2 Conclusions from the bottom-up analyses .......................................... 346
15.3 Economic impact of mitigation in Europe .......................................... 348
15.4 Impact of the economic crisis on climate policy ................................ 349
15.5 Policy suggestions ............................................................................... 350
16 Annexes ................................................................................................................. 359
16.1 Details of the Virtual Model Server (VMS) ....................................... 359 16.1.1 Virtual Model Server – automated data exchange .............................. 359 16.1.1.1 Technical details ................................................................................. 360 16.1.1.2 Design philosophy .............................................................................. 360

ADAM Deliverable D-M1.3 xv
16.1.1.3 Functionality ....................................................................................... 360 16.1.2 Data flow between models .................................................................. 365
16.2 Detailed Results from the MATEFF model ........................................ 370 16.2.1 Assumptions of the Reference Scenario – 2000 to 2050 .................... 370 16.2.2 Production changes in energy-intensive products - Reference
Scenario 2000 to 2050 ......................................................................... 377 16.2.3 Production in energy-intensive products - 2°C Scenario – 2000
to 2050 ................................................................................................. 384
16.3 Economic sectors used in the ASTRA model ..................................... 390
17 References ............................................................................................................. 393

xvi ADAM Deliverable D-M1.3
List of Tables Table 2-1: Population development in EU27+2 countries until 2050
(all scenarios) ................................................................................... 14
Table 2-2: GDP development in EU27+2 countries until 2050 (Reference Scenario) ....................................................................... 15
Table 3-1: Data flow between models – high level overview ........................... 31
Table 4-1: World population and economic growth in ADAM projections ........................................................................................ 35
Table 4-2: Europe, EU27+Nor+Switz – GDP (in G$2005) .............................. 37
Table 4-3: Europe, EU27+Nor+Switz, 4 areas – Population ............................ 38
Table 4-4: Per capita GDP, by world region ($2005/year PPP) ........................ 39
Table 4-5: Europe energy self-sufficiency ratio ................................................ 50
Table 4-6: Electricity generation by country in Europe (TWh) ........................ 51
Table 4-7: The share of thermal generation in total electricity generation ........................................................................................ 52
Table 4-8: EU27+Nor+Switz electricity generation by technology .................. 52
Table 4-9: The share of renewable electricity generation by country ............... 53
Table 4-10: Nuclear electricity generation by European country ....................... 55
Table 4-11: Final energy consumption by European country ............................. 58
Table 4-12: Final electricity consumption by European country ........................ 59
Table 4-13: CO2 emissions by European country (MtCO2) ................................ 63
Table 5-1: Division of European countries into four regions ............................ 88
Table 5-2: Total carbon sink in the forest (biomass plus soil, Tg C/yr) per region and for total Europe, 2010 to 2050 ................................. 90
Table 5-3: Production changes (in %) of electrical and oxygen steel in EU27 + Norway, Switzerland and Turkey compared to the Reference Scenario, 2000 – 2050 .................................................... 98
Table 5-4: Production changes (in %) of aluminium in EU27 + Norway, Switzerland and Turkey compared to the Reference Scenario, 2000 – 2050 .................................................... 99

ADAM Deliverable D-M1.3 xvii
Table 5-5: Production changes (in %) of cement in EU27 + Norway, Switzerland and Turkey compared to the Reference Scenario, 2000 – 2050 ...................................................................... 99
Table 5-6: Production changes of paper (in %) in EU27 + Norway, Switzerland and Turkey compared to the Reference Scenario, 2000 – 2050 ...................................................................... 99
Table 5-7: Production changes of glass (in %) in EU27 + Norway, Switzerland and Turkey compared to the Reference Scenario, 2000 – 2050 .................................................................... 100
Table 5-8: Production of crude steel (oxygen steel + electrical steel) in Europe in 1000 tonnes, Reference Scenario, 2000 – 2050 ............ 101
Table 5-9: Total production of aluminium (primary + secondary) in Europe in 1000 tonnes, Reference Scenario, 2000 – 2050 ............ 102
Table 5-10: Production of crude steel (oxygen steel + electrical steel) in Europe in 1000 tonnes, 2°C Scenario, 2000 – 2050 ...................... 103
Table 5-11: Production of aluminium (primary aluminium + secondary aluminium) in Europe in 1000 tonnes, 2°C Scenario, 2000 – 2050 ................................................................................................ 104
Table 5-12: Roundwood availability in EU27 (including forest residues), Reference Scenario, 2005 - 2050 ................................... 108
Table 5-13: Fuelwood demand in EU27+2 in the Reference Scenario ............. 110
Table 5-14: Gross calorific value of different kinds of wood (in kWh/kg) ......................................................................................... 114
Table 5-15: Total fuelwood demand (firewood, wood pellets, woodchips), all sectors in EU-27 + 2 in PJ – Comparison of the Base Case Scenario and the 2 °C Scenario, 2015 – 2050 ........ 115
Table 6-1: Changes in the fuel shares of heating energies of residential buildings in Europe in the two variants of the 2°C Scenario, 2005 to 2050 .................................................................................. 124
Table 6-2: Investment cost (in Euro per square metre) of a replaced heating system for hot water generation and for different types of buildings ........................................................................... 126
Table 6-3: Yearly efficiency improvement for non heating uses and electrical appliances EU15 +2 and New Member States, Reference and 2°C Scenario, 2020 to 2050 ................................... 127

xviii ADAM Deliverable D-M1.3
Table 6-4: Yearly electricity demand of selected appliances (in MJ per year) of the present stock, standard new appliances and currently most efficient (top-ten) appliances, and relative improvement replacing old appliances by standard and top ten appliances, Europe, 2005 ......................................................... 128
Table 6-5: Assumed payback time to calculate applicable investment cost for energy-efficient electrical appliances and investments (in € per saved MJ per year); Europe, 2010 to 2050 ............................................................................................... 129
Table 6-6: Final Energy demand for space heating in the residential sector in PJ, European regions, Reference and 2°C Scenario, 2005 to 2050 .................................................................. 130
Table 6-7: Electricity demand for electric appliances, European regions and EU27+2, Reference and 2°C Scenario, 2005 to 2050 ............................................................................................... 131
Table 6-8: Electric demand for cooling and ventilation, European regions, Reference and 2°C Scenario, 2005 to 2050 ..................... 132
Table 6-9: Fuels demand in the residential sector, European countries and EU27+2, Reference Scenario and 2°C Scenario, 2005 to 2050 ........................................................................................... 133
Table 6-10: Electricity demand in the residential sector, European countries and EU27+2, Reference Scenario and 2°C Scenario, 2005 to 2050 .................................................................. 134
Table 6-11: Fuels demand by different energy carriers in the residential sector in PJ, EU27 + 2, Reference Scenario and 2°C Scenario, 2005 to 2050 .................................................................. 135
Table 6-12: Fuels and electricity costs of the residential sector, in billion EUR, Reference Scenario, European region and EU27-2, 2005 to 2050 .................................................................... 137
Table 6-13: Yearly investment for adaptation in billion €/a, residential sector, Reference and 2°C Scenario, European regions and EU27+2, 2020-2050 ...................................................................... 137
Table 6-14: Yearly investment for mitigation measures in efficiency, residential sector, in billion €/a, 450 and 400 ppm variant of the 2°C Scenario, EU27+2, 2020-2050 ......................................... 138
Table 6-15: Yearly investment for mitigation measures in fuel substitutions, residential sector, in billion €/a, two variants

ADAM Deliverable D-M1.3 xix
of the 2°C Scenario; European regions and EU27+2, 2020-2050 ................................................................................................ 138
Table 6-16: Programme costs in residential sector, in billion €/a; European regions and EU27+2; two variants of the 2°C Scenario, 2010-2050 ...................................................................... 139
Table 6-17: Impact of different policies and scenario drivers in direct CO2 emissions in Mt CO2/year, residential sector; two variants of the 2°C Scenario, 2020-2050 ....................................... 140
Table 7-1: Fuel energy efficiency improvements in different sub-sectors of the service sector in the two variants of the mitigation scenario relative to the Reference Scenario .................. 145
Table 7-2: Relative fuel share level in the two mitigation scenarios, general rules ................................................................................... 147
Table 7-3: Efficiency improvements (with technical and optimization measures) in the different sub-sectors of the SERVE model: yearly improvement of the Reference scenario; additional improvements in the mitigation scenarios compared to the Reference scenario (yearly and overall in 2050) ........................... 148
Table 7-4: Fuel energy demand in the service sector of the Reference scenario, and of the 450 ppm and the 400 ppm scenario variants by country and for four European regions 2005 to 2050, in PJ/year .............................................................................. 149
Table 7-5: Heating system break down in the service sector of the Reference scenario, and of the 450 ppm and the 400 ppm scenario variants, 2050 ................................................................... 151
Table 7-6: Electricity demand of the service sector for the Reference, the 450 ppm and the 400 ppm scenarios, in PJ/year. ..................... 152
Table 7-7: Electricity demand for cooling in the Reference scenario, and in the 450 ppm and the 400 ppm scenario variants of four European regions, in PJ/year .................................................. 153
Table 7-8: Electricity demand for additional heat pumps in the 450 ppm and the 400 ppm scenario variants of four European regions (compared to the Reference scenario), in PJ/year ............. 154
Table 7-9: Final energy demand break down in the Reference Scenario, and in the 450 ppm and the 400 ppm scenario variants of four European regions, in PJ/year. ............................... 154

xx ADAM Deliverable D-M1.3
Table 7-10: Fuel and electricity costs (energy expenditures) in the service sector, in billion EUR2005 per year. .................................... 155
Table 7-11: Investment in adaptation in the service sector, in billion EUR2005 per year, , for two warmer climate scenarios: +4 and +2 degrees ............................................................................... 156
Table 7-12: Investments in efficiency mitigation measures in the service sector, in billion EUR2005 per year ................................................. 156
Table 7-13: Mitigation investments in fuel substitutions in the service sector, in billion EUR2005 ............................................................... 157
Table 7-14: Programme costs in the service sector, in billion EUR2005 ............ 157
Table 7-15: Impact of different policies and scenario drivers on direct CO2 emissions in MtCO2/year in the service sector; two variants of the 2°C Scenario, 2020-2050 ....................................... 158
Table 8-2: Comparison of industrial CO2 emissions between scenarios [Mt] ................................................................................................ 181
Table 8-1: Comparison of electricity consumption between scenarios [PJ] ................................................................................................. 182
Table 8-2: Comparison of fuel consumption between scenarios [PJ] ............. 182
Table 8-3: Comparison of final energy consumption split by industrial subsector between scenarios [PJ] for EU27 ................................... 183
Table 8-4: Comparison of final energy consumption between scenarios [PJ] ................................................................................................. 183
Table 8-5: Additional annual investments compared to the Reference scenario [million euros 2000] ........................................................ 184
Table 9-1: Transport policies in the ADAM scenarios ................................... 207
Table 9-2: Changes of transport energy demand on regional level in the 450 ppm scenario ..................................................................... 213
Table 9-3: Changes of transport CO2 emissions on regional level in 450 ppm scenario ........................................................................... 215
Table 9-4: Changes of transport energy demand on regional level in the 400 ppm scenario ..................................................................... 216
Table 9-5: Changes of transport CO2 emissions on regional level in the 400 ppm scenario ........................................................................... 217
Table 10-1: Technical and economic characteristics of RET in 2005 .............. 231

ADAM Deliverable D-M1.3 xxi
Table 10-2: Technical potentials for renewable energies generating electricity, EU27, 2° Scenario, 2050 .............................................. 232
Table 10-3: Overview of electricity generation based on renewable energies, in TWh, EU27 total, Base Case Scenario and 2° Scenario, 2005 – 2050 .................................................................... 235
Table 10-4: Electricity generation based on renewable energies, in TWh, EU27, Base Case Scenario and 2° Scenario, 2005 to 2050 ................................................................................................ 236
Table 10-5: Primary energy use of solid biomass for electricity and CHP generation .............................................................................. 244
Table 10-6: Primary energy use of biogas types for electricity and CHP generation ....................................................................................... 246
Table 12-1: Population in the ADAM-HMS and POLES simulations .............. 265
Table 12-2: GDP in the ADAM-HMS and POLES simulations ....................... 266
Table 12-3: Development of final energy demand in ADAM-HMS and POLES (400 ppm scenario) ........................................................... 270
Table 12-4: Development of CO2 emissions in ADAM-HMS and POLES (400 ppm scenario) ........................................................... 271
Table 12-5: Most important drivers in the models POLES, RESIDENT, RESAPPLIANCE and SERVE for the EU27+2 countries, Reference and 2°C Scenario. 2005 to 2050 ................................... 274
Table 12-6: Share of buildings in line with low-energy standards in POLES and in RESIDENT for the residential sector, Europe, Reference Scenario and the two variants of the 2°C Scenario, 2050 ................................................................................ 275
Table 12-7: Relative break down of the final energy demand of the residential, service and agriculture sectors, 2005 and 2050, Reference and 2°C Scenario, EU27+2 ........................................... 276
Table 12-8: Final energy of the residential and service sectors, in 2005 and 2050 (in EJ) and change between 2005 and 2050, EU27+2, Reference and 2°C Scenario ........................................... 277
Table 12-9: Renewable conversion technologies covered by POLES and PowerACE-ResInvest .................................................................... 285
Table 13-1: Cumulated mitigation investment in the different sectors in EU27+2 .......................................................................................... 308

xxii ADAM Deliverable D-M1.3
Table 13-2: Comparison of cumulated mitigation investment and savings of energy imports for EU27+2 .......................................... 310
Table 13-3: Impact of 2-Degree scenarios on GDP [%-change to scenario] ......................................................................................... 313
Table 13-4: Impact of 2-Degree scenarios on employment [%-change to scenario] ......................................................................................... 314
Table 14-1: GDP Annual Growth Rates across EU regions and the world: Baseline “Trend” versus “Crisis” ....................................... 331
Table 14-2: Sectoral output effects across main activities for the EU E3MG regions: effects in 2020: % difference from baseline “Trend” .......................................................................................... 333
Table 14-3: EU and World GDP, Employment and CO2 Emissions Effects in 2020: % difference from baseline “Trend” ................... 335
Table 14-4: Annual World and EU Employment effects in the “crisis” scenario as difference from “trend” (million persons), 2008-2020 ............................................................................................... 336
Table 16-1: Dimension mapping example - from ASTRA EUCoun to EuroMM Region ............................................................................ 364
Table 16-2: Data flow between models – high level overview ......................... 366
Table 16-3: Data flow between models – details .............................................. 369
Table 16-4: Estimated production of crude steel in tonnes per capita in EU27 + Norway, Switzerland and Turkey, Reference Scenario 2005 – 2050 .................................................................... 371
Table 16-5: Estimated production of electrical steel in tonnes per capita in EU27 + Norway, Switzerland and Turkey, Reference Scenario 2005 – 2050 .................................................................... 372
Table 16-6: Estimated development of secondary aluminium production in EU27 + Norway, Switzerland and Turkey in 1000 tonnes, Reference Scenario 2005 – 2050 ....................................... 373
Table 16-7: Estimated cement production in tonnes per capita in EU27 + Norway, Switzerland and Turkey, Reference Scenario 2005 – 2050 ................................................................................... 374
Table 16-8: Consumption of the paper industry in Germany in percent (VDP, 2004) ................................................................................... 375
Table 16-9: Historical basis data for future glass production estimates ........... 376

ADAM Deliverable D-M1.3 xxiii
Table 16-10: Production of crude steel in EU27 + Norway, Switzerland and Turkey in 1000 tonnes, Reference Scenario, 2000 – 2050 ................................................................................................ 377
Table 16-11: Production of recycled steel in EU27 + Norway, Switzerland and Turkey in 1000 tonnes, Reference Scenario, 2000 – 2050 .................................................................... 378
Table 16-12: Production of primary aluminium in EU27 + Norway, Switzerland and Turkey in 1000 tonnes, Reference Scenario, 2000 – 2050 .................................................................... 379
Table 16-13: Production of secondary aluminium in EU27 + Norway, Switzerland and Turkey in 1000 tonnes, Reference Scenario 2000 – 2050 .................................................................................... 380
Table 16-14: Production of cement in EU27 + Norway, Switzerland and Turkey in 1000 tonnes, Reference Scenario, 2000 – 2050 ............ 381
Table 16-15: Production of paper in EU27 + Norway, Switzerland and Turkey in 1000 tonnes, Reference Scenario, 2000 – 2050 ............ 382
Table 16-16: Production of total glass in EU27 + Norway, Switzerland and Turkey in 1000 tonnes, Reference Scenario, 2000 – 2050 ................................................................................................ 383
Table 16-17: Production of crude steel in EU27 + Norway, Switzerland and Turkey in 1000 tonnes, 2°C Scenario, 2000 – 2050 ............... 384
Table 16-18: Production of recycled steel in EU27 + Norway, Switzerland and Turkey in 1000 tonnes, 2°C Scenario, 2000 – 2050 ............................................................................................. 385
Table 16-19: Production of primary aluminium in EU27 + Norway, Switzerland and Turkey in 1000 tonnes, 2°C Scenario, 2000 – 2050 ............................................................................................. 386
Table 16-20: Production of secondary aluminium in EU27 + Norway, Switzerland and Turkey in 1000 tonnes, 2°C Scenario, 2000 – 2050 ............................................................................................. 387
Table 16-21: Production of cement in EU27 + Norway, Switzerland and Turkey in 1000 tonnes, 2°C Scenario, 2000 – 2050 ...................... 388
Table 16-22: Production of paper in EU27 + Norway, Switzerland and Turkey in 1000 tonnes, 2°C Scenario, 2000 – 2050 ...................... 389
Table 16-23: Production of total glass in EU27 + Norway, Switzerland and Turkey in 1000 tonnes, 2°C Scenario, 2000 – 2050 ............... 390

xxiv ADAM Deliverable D-M1.3
List of Figures Figure 1-1: Overview of the model system of WP Mitigation M1 and
its context of related ADAM work packages Mitigation M2, Adaptation A1 and A2, Scenarios S .................................................. 7
Figure 2-1: Definition of scenarios and purpose of scenario comparison .......... 12
Figure 2-2: Population and GDP framework in the Reference Scenario ............ 13
Figure 2-3: Population structure and labor force in the EU regions ................... 16
Figure 2-4: Development of employment in major sectors in Europe ............... 17
Figure 2-5: Prices of fossil energy in Europe in Reference Scenario ................. 18
Figure 3-1: ADAM hybrid model system, POLES parallel approach and global framework ...................................................................... 22
Figure 3-2: Virtual Model Server – abstract data flow ....................................... 29
Figure 3-3: Convergence in the simulations of the ADAM-HMS ..................... 33
Figure 4-1: Economic growth, world and main regions ..................................... 36
Figure 4-2: Population growth, world and main regions .................................... 38
Figure 4-3: Ultimate Recoverable Resources, cumulative discoveries and production ................................................................................. 40
Figure 4-4: Prices of oil and gas in the Reference projection (€/bl) ................... 41
Figure 4-5: Heating shares of substitutable energy in residential and service sectors in Big Four countries ............................................... 43
Figure 4-6: Final consumption of substitutable energy and heating consumption in the residential sector without and with climate change ................................................................................. 44
Figure 4-7: Final consumption of substitutable energy and heating consumption in the service sector without and with climate change .............................................................................................. 44
Figure 4-8: Final consumption of substitutable energy and heating consumption in the residential sector without and with climate change ................................................................................. 45
Figure 4-9: World and EU27+NOR+SWITZ final consumption for captive electricity and air conditioning in the residential sector ................................................................................................ 47

ADAM Deliverable D-M1.3 xxv
Figure 4-10: World primary energy consumption in the Reference case, by region .......................................................................................... 48
Figure 4-11: Growth rates of the energy intensity of GDP by region of the world – Reference Scenario ....................................................... 49
Figure 4-12: EU27+Nor+Switz primary energy consumption, by country and region ......................................................................................... 49
Figure 4-13: EU27+Nor+Switz primary energy consumption ............................. 50
Figure 4-14: World and EU27+Nor+Switz electricity production ....................... 51
Figure 4-15: EU27+Nor+Switz share of the different sources in the total renewable generation ....................................................................... 54
Figure 4-16: Hydrogen energy production by technology and by region ............. 56
Figure 4-17: Hydrogen production in EU27+Nor+Switz ..................................... 56
Figure 4-18: World and EU27+Nor+Switz hydrogen markets ............................. 57
Figure 4-19: World and EU 27+Nor+Switz final energy consumption by energy ............................................................................................... 57
Figure 4-20: World and EU27+Nor+Switz final energy consumption by sector ................................................................................................ 60
Figure 4-21: World and EU27+Nor+Switz buildings in residential ..................... 60
Figure 4-22: World and EU27+Nor+Switz share of light vehicles ...................... 61
Figure 4-23: World and EU27+Nor+Switz transport consumption ...................... 61
Figure 4-24: World GHG emissions by region ..................................................... 62
Figure 4-25: World and EU27+Nor+Switz - GHG emissions (energy – industry) ........................................................................................... 63
Figure 4-26: Participation of different groups in total European CO2 emissions .......................................................................................... 64
Figure 4-27: World and EU27+Nor+Switz CO2 emissions by sector (energy) ............................................................................................ 65
Figure 4-28: Carbon value necessary to achieve objectives and the corresponding emission profile, 2°C scenario (400 and 450 ppm), 2000 to 2050 .......................................................................... 67
Figure 4-29: Total emissions by region, 2°C scenario (400 and 450 ppm), 2000 to 2050 .......................................................................... 67
Figure 4-30: World primary energy consumption by energy ............................... 69

xxvi ADAM Deliverable D-M1.3
Figure 4-31: World primary energy consumption by region ................................ 70
Figure 4-32: EU27+Nor+Switz primary energy consumption by energy ............ 71
Figure 4-33: European primary consumption change in 2050 in comparison with 2000 ...................................................................... 72
Figure 4-34: European primary consumption by region ...................................... 73
Figure 4-35: World oil production ........................................................................ 74
Figure 4-36: Energy prices ................................................................................... 75
Figure 4-37: World electricity production ............................................................ 76
Figure 4-38: EU27+Nor+Switz electricity production ......................................... 77
Figure 4-39: EU27+NOR+SWITZ share of electricity production by technology in Reference (bottom bar), 2°C 450 ppm (middle bar) and 2°C 400 ppm (to bar) scenarios by 2050 in TWh ................................................................................................. 78
Figure 4-40: EU27 electricity production with and without sequestration .......... 79
Figure 4-41: EU27 diffusion of different types of vehicles in Mitigation and 2° C scenario ............................................................................. 80
Figure 4-42: EU27 diffusion of different types of buildings in Reference and 2°C scenarios ............................................................................ 81
Figure 4-43: EU27+Nor+Switz annual contribution of various actions to reduce CO2 emissions (Reference-2°C scenarios – 2000-2050) ................................................................................................ 82
Figure 4-44: EU27+Nor+Switz Cumulative contributions of CO2 emission reduction measures (2°C scenarios – 2000-2050) ............ 82
Figure 4-45: Hydrogen production ....................................................................... 83
Figure 4-46: Share of EU27 hydrogen production by technology in Mitigation (top bar), MITIGATION (low bar) scenarios in 2050 and 2050a in the world level ................................................... 84
Figure 4-47: EU27+Nor+Switz Hydrogen production with and without sequestration .................................................................................... 84
Figure 4-48: EU27 hydrogen markets, in Reference and 2°C scenarios .............. 85
Figure 5-1: Demand for domestically produced wood as given by the M1 modelling system, expressed in roundwood volume equivalents, 2010 to 2050. ............................................................... 89

ADAM Deliverable D-M1.3 xxvii
Figure 5-2: Carbon sink in the soil and biomass compartments (Tg C/yr) for Europe (A) and the four regions (C-F), and development of average timber stock (B, m3/ha). ............................ 90
Figure 6-1: Specific energy demand for heating in multi-family houses for existing buildings and for simulated buildings as function to heating degree days ..................................................... 122
Figure 6-2: Shares in final energy of the residential sector, EU27+2 countries, 400 ppm variant of the 2°C Scenario, 2050 .................. 136
Figure 7-1: Shares of heating systems (in the service sector, for the 400 ppm scenario variant, in 2050 (all types except direct electric heating) .............................................................................. 150
Figure 8-1: GHG emissions by sector (2005, EU27) ........................................ 161
Figure 8-2: CO2 emissions in industry by subsector (2004, EU27) .................. 162
Figure 8-3: Energy consumption in industry by subsector (2004, EU27) ........ 162
Figure 8-4: Development of direct GHG emissions in the EU27 industrial sector .............................................................................. 163
Figure 8-5: Chosen cross-cutting technologies (CCTs) in industry – system boundaries .......................................................................... 164
Figure 8-6: Share of cross-cutting technologies by sector ................................ 166
Figure 8-7: Market share development of motor efficiency classes in the 2°C scenario ............................................................................. 167
Figure 8-8: Relative long-term technical saving potential by application ........ 168
Figure 8-9: Exemplary cost curve for aggregated saving options in electrical cross-cutting technologies (Germany, 2030) .................. 169
Figure 8-10: Heat demand by industrial sector and temperature level ............... 170
Figure 8-11: Share of industrial CHP electricity output in total industrial electricity demand in European countries (2004) .......................... 171
Figure 8-12: Heat generation by CHP technology .............................................. 172
Figure 8-13: Share of solar heat in total fuel demand by industrial sector in the 400 ppm scenario for the EU27 ........................................... 174
Figure 8-14: Processes by sub-sector implemented in the model ....................... 175
Figure 8-15: Development of CO2 emissions in cement and steel depending on the introduction of CCS ........................................... 178
Figure 8-16: Simplified structure of the ISIndustry model ................................. 180

xxviii ADAM Deliverable D-M1.3
Figure 8-17: Resulting CO2 emission reductions in 400 and 450 ppm scenarios compared to the Reference scenario for the year 2050 ............................................................................................... 185
Figure 9-1: Development of GHG emissions of transport compared with other sectors in EU-27 (1990 to 2005) .................................. 190
Figure 9-2: EU-27 GHG emissions of transport by major mode in 2005 ........ 191
Figure 9-3: ASTRA passenger transport model ............................................... 194
Figure 9-4: ASTRA freight transport model .................................................... 195
Figure 9-5: ASTRA car fleet and car choice model ......................................... 196
Figure 9-6: Development and structure of passenger transport demand in EU27 (Reference Scenario) ....................................................... 208
Figure 9-7: Development and structure of freight transport demand in EU27 (Reference Scenario) ........................................................... 209
Figure 9-8: Development of vehicle fleets in EU27 (Reference Scenario) ........................................................................................ 210
Figure 9-9: Development of transport energy demand and CO2 emissions (Reference Scenario) ..................................................... 210
Figure 9-10: Change in car mileage (pkm) and the car fleet in the 450 ppm scenario ........................................................................... 211
Figure 9-11: Change in car mileage (pkm) and the car fleet in the 400 ppm scenario ........................................................................... 212
Figure 9-12: Change of freight performance in the 2°C scenarios ..................... 213
Figure 9-13: Transport fuel consumption by fuel in the 450 ppm scenario in EU27 .......................................................................................... 214
Figure 9-14: Change of CO2 emissions of transport in 450 ppm scenario in EU27 .......................................................................................... 215
Figure 9-15: Transport fuel consumption by fuel in the 400 ppm scenario in EU27 .......................................................................................... 216
Figure 9-16: CO2 emissions of transport in the 400 ppm scenario in EU27 .............................................................................................. 217
Figure 9-17: Structure of the car fleet in the 450 ppm and 400 ppm scenarios ........................................................................................ 218
Figure 9-18: Impact on truck fleets in the 450 ppm and 400 ppm scenarios in EU27 .......................................................................... 219

ADAM Deliverable D-M1.3 xxix
Figure 9-19: Impact of the 2°C scenarios on transport investment in EU27 .............................................................................................. 221
Figure 9-20: Switch-off impacts on energy demand in the 450 ppm and 400 ppm scenarios .......................................................................... 224
Figure 9-21: Switch-off impacts on freight energy demand in the 450 ppm and 400 ppm scenarios ........................................................... 225
Figure 9-22: Switch-off impacts on passenger energy demand in the 450 ppm and 400 ppm scenarios ........................................................... 225
Figure 9-23: Switch-off impacts on transport CO2 emissions in the 450 ppm and 400 ppm scenarios ........................................................... 226
Figure 10-1: Value of avoided CO2 and reference CO2 price ............................. 234
Figure 10-2: Electricity generation based on renewables, EU27 and Base Case Scenario (left figure) and 2° Scenario (right figure), 2000 to 2050 .................................................................................. 235
Figure 10-3: Electricity generation based on wind onshore, EU27, Base Case and 2° Scenario, 2000 to 2050 .............................................. 238
Figure 10-4: Electricity generation based on wind offshore, EU27, Base Case and 2° Scenario, 2000 to 2050 .............................................. 239
Figure 10-5: Electricity generation based on solar energy, EU27, Base Case and 2° Scenario, 2000 to 2050 .............................................. 240
Figure 10-6: Financial characteristics of additionally installed Solar PV plants, EU27, 2° Scenario, 2000 to 2050 ....................................... 241
Figure 10-7: Electricity generation based on hydrothermal geothermal energy, EU27, Base Case and 2° Scenario, 2000 to 2050 ............. 242
Figure 10-8: Electricity generation based on hydroenergy, EU27, Baseline and 2° Scenario, 2000 to 2050 ........................................ 243
Figure 10-9: Electricity generation based on biomass, EU27, Base Case and 2° Scenario, 2000 to 2050 ....................................................... 244
Figure 10-10: Average electricity generation costs of additionally installed biomass technologies, EU27, 2° Scenario, 2000 to 2050 ................................................................................................ 245
Figure 10-11: Electricity generation based on biowaste, EU27, 2° Scenario, 2000 to 2050 .................................................................. 245

xxx ADAM Deliverable D-M1.3
Figure 10-12: Electricity generation based on biogas (agricultural biogas, landfill gas and sewage gas), Base Case and 2° Case Scenario, 2000 to 2050 .................................................................. 246
Figure 10-13: Primary use of biomass in the electricity sector according to the corresponding biomass input ................................................... 247
Figure 10-14: Electricity generation based on wave and tidal energy, EU27, Base Case and 2° Scenario, 2000 to 2050 .......................... 248
Figure 10-15: Heat generation based on biomass grid-connected systems, EU27, Base Case and 2° Scenario, 2000 to 2050 .......................... 249
Figure 10-16: Cumulated investment based on renewables, EU27, Comparison of 2° Scenario (right figure) with Base Case Scenario (left figure), 2000 to 2050 ............................................... 250
Figure 10-17: Specific investment indexed to 2005, 2° Scenario, 2000 to 2050 ............................................................................................... 251
Figure 11-1: Electricity generation depending on the fuel type for the 4 ADAM-M1 scenarios. ................................................................... 255
Figure 11-2: Electricity generation by technology. ............................................ 256
Figure 11-3: Net electricity trade (i.e., imports) between Germany and its neighbouring countries. In 2005, Germany was a net exporter of electricity ..................................................................... 257
Figure 11-4: Primary energy demand under the given scenarios. In the mitigation scenarios, fossil fuels reduce their share from 80% to 36% in the 400ppm scenario until 2050 ............................ 259
Figure 11-5: CO2 emissions for the given scenarios until 2050. The emission targets for the mitigation scenarios are derived from the global Poles model and adapted to EuroMM (including emissions from transport and coal products) ................ 260
Figure 11-6: Cummulative investment costs in the energy conversion sector for the 4 scenarios. Results are given in US$ (2001). The needed investment for the electricity grid infrastructure is given for transmission lines whithin regions (Grid) and cross boarder trade (Trade Grid) .................................................... 262
Figure 12-1: CO2 certificate price in ADAM-HMS and in POLES ................... 268
Figure 12-2: Energy demand by sector of EU27 in ADAM-HMS and POLES (400 ppm scenario) ........................................................... 269

ADAM Deliverable D-M1.3 xxxi
Figure 12-3: CO2 emissions by sector of EU27 in ADAM-HMS and POLES (400 ppm scenario) ........................................................... 270
Figure 12-4: Comparison of categories of CO2 savings in EU27 in ADAM-HMS and POLES (400 ppm scenario) ............................. 272
Figure 12-5: CCS in EU27 in ADAM-HMS and POLES model (400 ppm scenario) ................................................................................. 272
Figure 12-6: Comparison of final energy demand (in PJ) for the residential, service and agricultural sectors in POLES and the three CEPE models for the Reference Scenario and the two variants of the 2°C Scenario, 2005 to 2050 ............................ 276
Figure 12-7: Comparison of industrial CO2 emissions in POLES and ISIndustry for the 450 and the 400 ppm variant of the 2°C Scenario, EU-27+2, 2000 to 2050 .................................................. 278
Figure 12-8: Comparison of industrial final energy demand in POLES and ISIndustry for the 450 and the 400 ppm variant of the 2°C Scenario, EU-27+2, 2000 to 2050 .......................................... 279
Figure 12-9: Transport fuel consumption in ASTRA and POLES for the Reference Scenario ........................................................................ 280
Figure 12-10: Transport fuel consumption in ASTRA and POLES for the 450 ppm scenario ........................................................................... 281
Figure 12-11: Transport fuel consumption in ASTRA and POLES for the 400 ppm scenario ........................................................................... 282
Figure 12-12: Car fleets in ASTRA and POLES for the Reference Scenario .......................................................................................... 282
Figure 12-13: Car fleets in ASTRA and POLES for the 450 ppm scenario ......... 283
Figure 12-14: Car fleets in ASTRA and POLES for the 400 ppm scenario ......... 284
Figure 12-15: Comparison of modelling results – renewable electricity generation in the EU up to 2050 projected by PowerACE-ResInvest and POLES (2° Scenario) .............................................. 286
Figure 12-16: Comparison of modelling results – wind electricity generation in the EU up to 2050 projected by PowerACE-ResInvest and POLES (2° Scenario) .............................................. 287
Figure 12-17: Comparison of modelling results – solar electricity generation in the EU up to 2050 projected by PowerACE-ResInvest and POLES (2° Scenario) .............................................. 288

xxxii ADAM Deliverable D-M1.3
Figure 12-18: Comparison of modelling results – biomass electricity generation in the EU up to 2050 projected by PowerACE-ResInvest and POLES (2° Scenario) ............................................. 288
Figure 12-19: Comparison of results between POLES (top) and EuroMM (bottom) for primary energy demand ............................................ 290
Figure 12-20: Comparison of electricity generation between the POLES model (top) and EuroMM (bottom) ............................................... 291
Figure 13-1: Overview on the structure of the ASTRA economic models ........ 298
Figure 13-2: Conceptual structure of direct effects and second round economic effects of mitigation policy ........................................... 301
Figure 13-3: Feeding the bottom-up impulses of mitigation policy into the ASTRA model ......................................................................... 302
Figure 13-4: Linking and translating the bottom-up impulses of mitigation investment and energy expenditures into the ASTRA model ............................................................................... 305
Figure 13-5: Mitigation investment in 450 ppm and 400 ppm scenario in EU regions ..................................................................................... 306
Figure 13-6: Mitigation investment in 450 ppm scenario in EU27+2 ................ 307
Figure 13-7: Mitigation investment in 400 ppm scenario in EU27+2 ................ 307
Figure 13-8: Change of residential energy expenditure in 400 ppm scenario in EU regions ................................................................... 309
Figure 13-9: Change of services energy expenditure in 400 ppm scenario in EU regions ................................................................................. 309
Figure 13-10: Savings of energy imports in 450 ppm and 400 ppm scenarios in EU27 .......................................................................... 310
Figure 13-11: Subsidies for mitigation measures in 450 ppm and 400 ppm scenarios in EU regions ................................................................. 311
Figure 13-12: Programme cost for mitigation measures in 450 ppm and 400 ppm scenarios in EU regions .................................................. 311
Figure 13-13: Government revenues from auctioning of CO2 certificates in 450 ppm and 400 ppm scenarios in EU regions ........................ 312
Figure 13-14: Impact on GDP in the 450 ppm and 400 ppm scenarios in EU regions ..................................................................................... 313
Figure 13-15: Impact on employment in the 450 ppm and 400 ppm scenarios in EU27 .......................................................................... 314

ADAM Deliverable D-M1.3 xxxiii
Figure 13-16: Impact on sectoral employment in the 450 ppm and 400 ppm scenarios in EU27 .................................................................. 315
Figure 13-17: Impact on consumption in the 450 ppm and 400 ppm scenarios in EU27 .......................................................................... 316
Figure 13-18: Impact on sectoral consumption/household expenditure in the 450 ppm and 400 ppm scenarios in EU27 ............................... 317
Figure 13-19: Impact on investment in the 450 ppm and 400 ppm scenarios in EU27 .......................................................................... 318
Figure 13-20: Development of and impact on government budget in the 450 ppm and 400 ppm scenarios in EU27 ..................................... 318
Figure 13-21: Impact on fuel taxes in the 450 ppm and 400 ppm scenarios in EU27+2 ...................................................................................... 319
Figure 13-22: Anaylsing the impact of energy expenditure driven investment changes in the 400 ppm scenarios in EU27+2............. 320
Figure 13-23: Change of GDP with limited influence of energy expenditures of households on investment in 400 ppm scenarios in EU27+2 ...................................................................... 321
Figure 14-1: World and EU GDP growth rates: Baseline “Trend” versus “Crisis” ........................................................................................... 332
Figure 14-2: Impacts of the recession on EU and Global Investment and Consumption: % differences from baseline “trend”, 2010-2020 ................................................................................................ 334
Figure 14-3: World and EU Employment effects: “Crisis” as difference form “Trend”, million persons per annum, 2005-2020 .................. 335
Figure 14-4: Total CO2 Emissions for the World and EU: Baseline “Trend” versus “Crisis”, 2005-2020 .............................................. 337
Figure 15-1: Comparison of categories of CO2 savings in EU27 in ADAM-HMS (left) and POLES (right), 2000 to 2050, 400 ppm variant of the 2°C Scenario .................................................... 347
Figure 16-1: Virtual Model Server – abstract data flow ..................................... 360
Figure 16-2: Model definition – XML example file ........................................... 362
Figure 16-3: Transformation definition – XML example file ............................ 363
Figure 16-4: Sequence definition – XML example file ...................................... 365

xxxiv ADAM Deliverable D-M1.3
List of Abbreviations 400ppm Acronym for a Mitigation Scenario leading to a stabilization of CO2eq.
concentration of 400ppm until 2100 450ppm Acronym for a Mitigation Scenario leading to a stabilization of CO2eq.
concentration of 450ppm until 2100 A Year ABS Agent-based simulation ACER Air Conditioning Equipment Rate ACT Annual circulation tax ACUEC Air Conditioning Unit Energy Consumption ADAM Adaptation and Mitigation ADAM-HMS ADAM hybrid model system developed in our work package M1 AFR Africa AFV Alternative fuel vehicles Alterra Alterra Institute at Wageningen University ASTRA Assessment of transport strategies model AT Austria
AVRES Air conditioning Availability BCS Biomass for thermal electricity with sequestration BE Belgium BG Bulgaria BGA Hydrogen from biomass gasification BDZ Bundesverband der deutschen Zementindustrie e.V. BGS Hydrogen from biomass gasification with sequestration BGT Biomass gasification for electricity production in GT Bio Billion (1*10^9) BM Biomass BPY Hydrogen from biomass pyrolysis BRA Brasil BSR BSR Sustainability GmbH BTE Biomass for thermal electricity BUM Bottom-up Models CAN Canada CCGT Combined cycle gas turbine CCS Carbon capture and sequestration, Carbon caption and storage CCT Cross-cutting technologies CCT Coal powered Conventional Thermal

ADAM Deliverable D-M1.3 xxxv
CDD Cooling Degree Days CDM Clean Development Mechanism CEPI Confederation of European Paper Industry CGA Hydrogen from Coal Gasification CEMBUREAU The European Cement Association CEPI Confederation of European paper industries CGS Hydrogen from Coal Gasification with sequestration CHN China CHP Combined heat and power technologies CHP Combined Heat and Power (small to medium) CIS Countries of the Independent States CMAX Climate Maximum Saturation Rate CPIV Standing Committee of the European Glass Industry CNG Compressed natural gas CO2 Carbon dioxide COP Conference of the parties of the UNFCCC CSP Concentrating solar power CY Cyprus CZ Czech Republic D1 ADAM deliverable D-M1.1 [Jochem et al. 2007] describing the applied
models and the base case scenario D2 ADAM deliverable D-M1.2 [Jochem et al. 2009] describing the refer-
ence scenario (adaptation case) and a 2-degree scenario until 2100 D3 This deliverable of ADAM work package M1 DE Germany DK Denmark DPV Decentralised building integrated PV systems with network connection DWL Number of Dwellings E3MG global energy-environment-economy model East European country group: Czech Republic, Estonia, Hungary, Latvia,
Lithuania, Poland, Slovakia, Slovenia EC European Commission EE Estonia EEAP-NL Heat recovery and intermediate storage EFISCEN European Forest Information SCENario model EJ Exa Joule ENV Environment Module ES Spain ETS Emission trading system

xxxvi ADAM Deliverable D-M1.3
EU European Union EU27 European Union with 27 member states as of 2007 EU27+2 EU27+Norway+Switzerland EUCoun ASTRA index of countries Euro-MM A bottom up optimisation model simulating the energy conversion ector EUROPE Europe FAOSTAT Statistical Database of the Food and Agriculture Organisation of the
United Nations FCCELRESC Air Conditioning Electricity Consumption with Climate Change Impact FCSENRES Final Consumption for Substitutable Energy in Residential Sector FOT Foreign Trade Module of ASTRA FEBELCEM FI Finland FR France GC Generalised Cost GDP Gross domestic product GGC Gas powered Gas Turbine in Combined Cycle GGS Gas powered Gas Turbine in Combined Cycle with sequestration GGT Gas powered turbine GHG Greenhouse gases GIS Geographical information system GR Greece GSR Hydrogen from Gas Steam Reforming GSS Hydrogen from Gas Steam Reforming with sequestration Gt Billion tons GVW Gross vehicle weight H/C days Changes of heating and cooling days HDD Heating Degree days HDV Heavy Duty Vehicles HMS Hybrid model system – ADAM approach of integrating macro-
economic and bottom-up models HU Hungary HVAC Air conditioning system HYD Conventional large size hydroelectricity ICG Integrated Coal Gasification with Combined Cycle ICS Integrated Coal Gasification with Combined Cycle with sequestration IDA-ICE A dynamic building simulation model IE Ireland IFP Institut Français du Pétrole

ADAM Deliverable D-M1.3 xxxvii
INF Infrastructure Module of ASTRA IPCC Intergovernmental Panel on Climate Change ISIndustry A bottom up model simulating the energy demand of the industrial
sector IT Italy IWW Integrating Inland Waterways JAP.PACIFIK Japan & Pacific JI Joint Implementation LA Latvia LCD Liquid Cristal sector LCT Lignite powered Conventional Thermal LDV Light Duty Vehicles LED Diode lighting LEPII National Centre for Scientific Research, Energy and Environmental
Policy at CNRS LPG Liquefied Petroleum Gas, transport fuel LT Lithuania LU Luxemburg MARKAL MARKet ALlocation M1 Mitigation 1 work package (Europe) M2 Mitigation 2 work package (Global) MAC Macroeconomics Module of ASTRA MATEFF A bottom up model derived from material efficiency simulating the
reduced demand of energy-intensive basic products MEPS Minimum energy performance standards MIEA Middle East Mio Million (1*10^6) MT Malta MWh Mega Watt hours NDE India
NGV Natural Gas Vehicles NHT Hydrogen from nuclear thermal high NL Netherlands NMS New Member States NND New Nuclear Design North European country group: Denmark, Finland, Norway, Sweden NUC Conventional Light Water nuclear Reactor OD Origin Destination Pair OCT Oil powered Gas Turbine in Combined Cycle

xxxviii ADAM Deliverable D-M1.3
OECD Organization for Economic Cooperation and Development OGC Oil powered Gas Turbine in Combined Cycle OPO Hydrogen from Heavy Fuel Oil Partial Oxidation PFC Pressurised coal supercritical PJ Peta Joule PKM Passenger-km i.e. 1 person transported over 1 km = 1 pkm PL Poland POLES Prospective Outlook on Long term Energy Systems model POP Population Module POWER-ACE - ResInvest
Agent-based simulation model simulating the development of renew-able energies
PPM Parts per million PPP Purchasing power parities PSI Paul Scherrer Institute PSS Pressurised coal supercritical with sequestration PT Portugal PV Photovoltaics R&D Research and Development RASIAJ Rest of Asia REF Acronym for the Reference Scenario (adaptation, no mitigation) Region EuroMM index of countries REM Regional Economics Module of ASTRA RES Renewable energy sources RES-E Renewable energy systems for electricity generation RESAPPLIANCE A bottom up model for all electrical appliances including ventilation
and air conditioning RESIDENT A bottom up model for heating and warm water generation in the resi-
dential sector RET Renewable Energy Technology RLAM Rest of Latin America RO Romania RoW Rest-of-the World SFOE Swiss Federal Office of Energy SE Sweden SERVE-E A bottom up model simulating the energy demand of the service and
agricultural sector SHT Hydrogen from solar thermal high SHY Small Hydro Power plants (<10 MWe) SI Slovenia

ADAM Deliverable D-M1.3 xxxix
SK Slovakia SME Small and medium sized enterprises SMR Hydrogen from Solar Methane Reforming South European country group: Bulgaria, Greece, Italy, Malta, Cyprus, Portu-
gal, Romania, Spain SPP Solar Power Plants (thermal technologies for network electricity pro-
duction) SFOE Swiss Federal Office of Energy TEN-T Trans-European-Transport-Networks TKM Ton-km i.e. 1 ton transported over 1 km = 1 tkm TRA Transport Module of ASTRA TTW Tank-to-Wheel TWh Tera Watt hours UCAM Enerdata and Cambridge University UNFCCC United Nations Framework Convention on Climate Change UEC Unit Energy Consumption UK United Kingdom URS Ultimate Recoverable Resources VFT Vehicle Fleet Module of ASTRA USGS US Geological Survey VDP Verband Deutscher Papierfabriken e. V. VDZ Verein Deutscher Zementwerke e. V. VKT Vehicle-kilometres travelled VMS Virtual Model Server VRT Vehicle registration tax WEG Hydrogen from Water Electrolysis baseload electricity from Grid WEM Welfare Measurement Module WEN Hydrogen from water electrolysis nuclear dedicated West European country group: Austria, Belgium, Luxemburg, France, Ger-
many, Ireland, Netherlands, Switzerland, United Kingdom WEW Hydrogen from Water Electrolysis dedicated Wind power plant WND Wind power plants for network electricity production WNO Offshore Wind power plants WP Work package WTO World Trade Organization


ADAM 2-degree scenario for Europe – policies and impacts
Summary 01
Executive Summary Authors: Wolfgang Schade, Eberhard Jochem
ADAM research identifies and appraises existing and new policy options that can contribute to different combinations of adaptation and mitigation strategies. These options address the de-mands a changing climate will place on protecting citizens and valuable ecosystems – i.e., adaptation – as well as addressing the necessity to restrain/control humankind’s perturbation to global climate to a desirable level – i.e., mitigation.
Our work package Mitigation 1 (M1) has the core objective to simulate mitigation options and their related costs for Europe until 2050 and 2100 respectively. The focus of this deliv-erable is on the period 2005 to 2050. The longer-term period until 2100 is covered in the pre-vious deliverable D2, applying the POLES model for this time horizon [Jochem et al. 2009].
Our analysis constitutes basically a techno-economic analysis. Depending on the sector ana-lysed it is either directly combined with a policy analysis (e.g. in the transport sector, renew-ables sector) or the policy analysis is performed qualitatively as a subsequent and independent step after the techno-economic analysis is completed (e.g. in the residential and service sectors). We start from the policy framework developed for mitigation of climate change by the EU and the Member States which can be summarised by the following broad options of climate mitiga-tion policy:
• Introduce greenhouse gas (GHG) emissions trading,
• Increase of energy efficiency,
• Focus on renewable energies,
• Set standards and norms that drive technological development,
• Include all sectors and all greenhouse gases in the mitigation efforts, and
• Establish policies to directly stimulate low carbon technologies.
This framework is followed as well in our analysis throughout this deliverable: our assessment is that it would provide a suitable framework to drastically reduce the GHG emissions in Europe by 2050. The details of technologies and policy measures to fit into this framework and to com-plete the picture of climate policy are presented in this report on a sector-by-sector base for the residential sector, services sector, manufacturing sector, transport sector and energy conversion sector. This comprehensive sectoral analysis is then fed into a macro-economic model to assess the impacts on growth and employment of the proposed climate policy programme. Finally, the potential impacts of the economic crisis on the climate policy programme are discussed.

Executive Summary
Summary 02
Scenarios to 2050
We estimate results of two variants of a possible 2-degree scenario with target concentrations of CO2 of 450ppm (the 450ppm scenario) and of 400ppm (the 400ppm scenario). These two scenario variants are compared with the Reference Scenario [see Jochem et al. 2009], which constitutes a scenario with climate change of +4°C until 2100, i.e. an adaptation scenario.
The work on “Mitigation for Europe” is embedded into the larger framework of the ADAM project, in which also the “Mitigation on Global Level” is analysed. The global analysis pro-vided a pathway of allowed GHG emissions of Europe for our work taking into account the mitigation activities at the global level and thus providing guidance on the efforts Europe has to contribute. Roughly, Europe starts its GHG emissions pathway from about 4000 Mt CO2eq. emissions in 2010 and reduces it to below 1000 Mt CO2eq. in 2050. This GHG pathway was used as a benchmark into which the aggregate sectoral GHG emissions in our analysis have to fit.
Figure 0-1 presents the development of two major drivers in the scenario: population and GDP. Population is the same in all scenarios, while GDP is an endogenous outcome of the scenarios and thus differs. Population is declining slightly until 2050 (-4%). The potential labor force decreases by -13% due to ageing of the European population and assuming stable retirement ages. GDP is expected to increase by +85% in real terms by 2050 compared with 2010 in the Reference Scenario. Oil prices are expected to increase by +90% by 2050 compared to 2010.
‐
100
200
300
400
500
600
2010 2020 2030 2040 2050
Population in EU27+2 countries[million persons]
West
East
South
North
‐
5,000
10,000
15,000
20,000
25,000
2010 2020 2030 2040 2050
GDP in EU27+2 countries[billion €2005]
West
East
South
North
Source: ASTRA model reflecting the ADAM scenario framework.
Figure 0-1: Population and GDP framework in the Reference Scenario

ADAM 2-degree scenario for Europe – policies and impacts
Summary 03
Methodology
The research integrated bottom-up models with top-down models and developed the so-called ADAM Hybrid Model System (HMS). The basic concept underlying the ADAM-HMS is based on the following arguments: (1) it is feasible to link different types of models (e.g. top-down macro-economic and bottom-up techno-economic sectoral models), (2) it makes sense to link these models as each has specific strengths, and (3) the linkage of the models is more than the sum of the single pieces since it alleviates the limitations of the models by considering feed-backs that can not be considered just within one of the models.
An alternative to the linkage of separate models is the integration of the functionality within one model. Such an approach is taken by the POLES world energy system model, which besides a macro-economic model integrates all models of the ADAM-HMS into one integrated bottom-up model. Thus our work also included a comparison of the hybrid model system with the inte-grated approach for the energy system delivered by POLES.
Bottom-up techno-economic analysis
The bottom-up analysis included eight sectors/fields: forestry and energy crops, material effi-ciency, residential sector, services sector, industry sector, transport sector, renewables and en-ergy conversion sectors. Each of the sectors contributed savings of (final) energy demand and GHG emissions. The aggregate pathways of final energy demand in ADAM-HMS (left-hand side) and POLES (right-hand side) for the 400 ppm scenario are shown in Figure 0-2. Both final energy demand pathways shown in this analysis require stringent policies and support to be able to meet the targets set by the European Commission. In the ADAM-HMS, the support would have to start earlier and concentrate on fostering renewables and efficiency technologies, while, in POLES, efficiency policies play a much smaller role and priority is given to the use of bio-mass and to carbon removal technologies, i.e. foster R&D and the introduction of CCS.
0
10,000
20,000
30,000
40,000
50,000
60,000
2005 2010 2015 2020 2025 2030 2035 2040 2045 2050
Final energy demand by sectorin 400ppm scenario in ADAM‐HMS [PJ]
Industry Transport Household, Services
0
10,000
20,000
30,000
40,000
50,000
60,000
70,000
2005 2010 2020 2030 2040 2050
Final energy demand by sectorin 400ppm scenario in POLES [PJ]Industry Transport Household, Services, Agriculture
Figure 0-2: Energy demand by sector of EU27 in ADAM-HMS and POLES (400 ppm sce-
nario)

Executive Summary
Summary 04
Looking at the more detailed developments of energy demand in Table 0-1, it can be observed that, in the ADAM-HMS, the sectoral energy demand is reduced by -48 % in 2050 compared with 2010, while in POLES, the reduction amounts to only -15 %. The sectoral structure of re-ductions differs significantly. The total reductions are closest for the transport sector (-47 % and -36 %), while they differ significantly for industry and household/services, which cut demand by about half until 2050 in the ADAM-HMS, but by less than -10 % in POLES.
Table 0-1: Development of final energy demand in ADAM-HMS and POLES (400 ppm
scenario)
ADAM-HMS POLES Average annual change Total
change Average annual change Total
change 20 to 05 30 to 20 50 to 30 50 to 10 50 to 10 20 to 05 30 to 20 50 to 30 50 to 10 50 to 10 Industry -1.4% -1.6% -1.8% -1.7% -50% 0.3% -0.6% -0.3% -0.2% -6%Transport -0.7% -1.8% -1.6% -1.6% -47% 0.2% -1.1% -1.8% -1.1% -36%Household, services, agriculture -0.8% -1.4% -1.9% -1.6% -49% 0.6% -0.4% -0.5% -0.2% -8%Total -0.9% -1.6% -1.8% -1.6% -48% 0.4% -0.7% -0.7% -0.4% -15%
Source: ADAM-HMS and POLES
Figure 0-3 presents the path for the CO2 emissions in EU27 by sector for the ADAM-HMS and the POLES model. Reductions start around 2010 in both ADAM-HMS and POLES, although the reductions in POLES until 2020 are moderate compared with the ADAM-HMS calculations that reflect the immediate actions to reduce energy demand described above. A difference exists concerning energy conversion, for which negative CO2 emissions occur in POLES in 2050 due to CCS, while in the ADAM-HMS CCS is not applied to energy conversion at all.
0
500
1,000
1,500
2,000
2,500
3,000
3,500
4,000
4,500
5,000
2005 2010 2015 2020 2025 2030 2035 2040 2045 2050
CO2 emissions by sector in400ppm scenario in ADAM‐HMS [Mt CO2/year]
Industry Transport Household, Services Energy conversion
0
500
1,000
1,500
2,000
2,500
3,000
3,500
4,000
4,500
5,000
2005 2010 2020 2030 2040 2050
CO2 emissions by sectorin 400ppm scenario in POLES [Mt CO2 / year]
Industry Transport Household, Services, Agric. Electricity generation
Figure 0-3: CO2 emissions by sector of EU27 in ADAM-HMS and POLES (400 ppm sce-
nario)

ADAM 2-degree scenario for Europe – policies and impacts
Summary 05
Looking at the sectoral details of CO2 reductions in Table 0-2, it is once again clear that the re-sults are closest for the transport sector, with a CO2 reduction of -62 % by 2050 compared with 2010 in the ADAM-HMS and -58 % in the POLES model. For the industry sector, the POLES model calculates a more ambitious reduction path, while for household/services, the ADAM-HMS estimates the largest reduction of all final energy sectors with -88 % CO2. For energy conversion/electricity generation, the diffusion of CCS technologies results in a stronger reduc-tion in the POLES model amounting to -103 %, which means that CO2 is removed from the atmospheric CO2 cycle and stored underground due to the use of CCS and biomass in electricity generation.
Table 0-2: Development of CO2 emissions in ADAM-HMS and POLES (400 ppm scenario) ADAM-HMS POLES Average annual change Total
change Average annual change Total
change 20 to 05 30 to 20 50 to 30 50 to 10 50 to 10 20 to 05 30 to 20 50 to 30 50 to 10 50 to 10 Industry -1.9% -2.4% -2.9% -2.6% -65% -0.9% -2.2% -7.4% -4.4% -84%Transport -1.3% -2.6% -2.4% -2.4% -62% 0.0% -1.7% -3.4% -2.1% -58%Household, services, agriculture -2.4% -4.5% -6.3% -5.1% -88% -0.4% -2.9% -4.0% -2.8% -69%Energy conversion / elec. Generation -1.8% -3.0% -8.5% -5.3% -89% -0.5% -4.9% ~ -28% ~ -16% -103%Total -1.8% -3.0% -5.1% -3.8% -78% -0.4% -3.1% -6.0% -4.0% -81%
Source: ADAM-HMS and POLES
The broad message of the sectoral analyses performed for Europe using the ADAM-HMS and the POLES models is consistent: A pathway to reach the 2°C target is technologically feasible. However, there is no silver bullet in climate policies; many or even all the options of emission reductions will have to be energetically activated and sustained over a longer horizon. However, the two parallel approaches tell two different storylines of how to achieve the 2°C target in Europe: The baseline for both storylines is that carbon, or GHG emissions, has to be given a price, either in the form of an ETS or a greenhouse gas tax. However, such a policy on its own does not seem to be sufficient since (1) the price signals of an ETS in the first decades would be far too low to stimulate sufficient policy support for new technologies and sufficient behav-ioural change to implement sectoral policies, and (2) pricing systems are intended to affect mar-kets, but markets in general apply a short-term perspective, looking at short-term rates of return and short-term break-even points, while the system transitions necessary for climate policy re-quire a long-term perspective and can only be implemented over a long time horizon. Thus put-ting a price on greenhouse gases has to be accompanied by sectoral policies that give a powerful stimulus to new technologies and behavioural change from now until 2050.

Executive Summary
Summary 06
The first storyline relates to the results of the ADAM-HMS. It concludes that the 2°C- Scenario for Europe can be achieved by: (1) immediate action investing in: (2) energy efficiency, (3) renewables, and (4) material efficiency. In case of partial failure to deliver or in case of delays, the second storyline from POLES could be followed, which argues that Europe can achieve the 2°C Scenario by (1) increased electrification, (2) high use of biomass (also from imports), and (3) substantial use of carbon capture and storage technologies (CCS). However, it should be mentioned that CCS constitutes only a transition technology because CO2 storage capacities are finite and limit CCS in the long run.
Macro-economic analysis
The basic conclusion from an economic point of view is that mitigation measures needed to meet the 2-degree target of the EU will not fundamentally alter Europe’s economic development path. Some European regions will actually be better off with mitigation than without mitigation. A loss of GDP in EU27 of -1.7% and -2.7% in the 450 ppm and 400 ppm variants of the 2°C Scenario respectively at the end of the period in 2050, is acceptable considering that the finan-cial crisis caused losses of GDP of -4% to -6% in the EU27 within less than 2 years, while the impact of mitigation remains less than half of this over a period of 40 years.
The impact on employment remains even more limited than on GDP. It is projected to be be-tween +0.2%, i.e. mitigation fosters employment growth, and -0.3% of employment change until 2050 for the different regions of the EU. However, the sectors display considerable varia-tion. Agriculture and industry gain employment because of the increased use of biomass and the mitigation investment into all kinds of machinery and electric appliances. The energy sector and other market services loose in employment: energy because of the reduced demand for energy and the service sector because of the price increase of services induced by the mitigation in-vestment of the service sectors. It should be noticed that the service sectors face significantly higher price increases due to mitigation investment than the manufacturing sectors.
Comparing the cumulative amount of mitigation investment and savings of fossil energy im-ports it can be observed that before 2040 the cumulative mitigation investments are significantly higher, but this is turned around by 2050 when the cumulative savings of energy imports be-come higher than the mitigation investment. This trend should continue after 2050 and in this sense, mitigation measures represent a pre-investment into a profitable future which constitutes a strong argument for mitigation in Europe, as it contributes to both the two major objectives of the EU: winning the battle against climate change and securing Europe’s energy supply.

ADAM 2-degree scenario for Europe – policies and impacts
Summary 07
Impact of the current economic crisis on climate policy
The collapse of the global investment banks, with the consequent reduction in lending, instabil-ity of prices and falls in investment and trade, has led to reductions in industrial output, personal incomes, household expenditures, and hence in energy use and in greenhouse gas emissions. Since there is a data lag in the reporting of emissions, it is not yet clear how large the reduction will be, but it is likely to undermine earlier scenarios of continuous increases in emissions as-sumed in IPCC reports and other scenarios. Thus we applied a global energy-environment-economy model (E3MG) to assess these effects and find that the long-term effect of the crisis is to reduce CO2 emissions by some 10% below a trend baseline by 2020. However, the recession is just beginning and it is far from clear how governments will react in their policies towards the energy sector, and whether the old coal-burning plant will be retired never to return.
In parallel to the macroeconomic analysis of the crisis, we checked our sectoral results in rela-tionship with the potential impacts of the economic crisis on the sectors. The basic conclusion for Europe is that it will reduce the GHG emissions in the short-term and under a scenario of a permanent loss of GDP of -10% also in the long-term. The sectors reducing GHG emissions most due to the crisis would be industry and transport, where reductions in GHG emissions of the same order of magnitude as GDP can be expected.
In some cases, the crisis itself as well as the economic stimulus programmes will contribute to permanent reductions of GHG emissions by accelerating retirement of vehicles or facilities when their capacity is not needed anymore due to the crisis as well as by funding the renewal of vehicle fleets.
However, for the 2-degree scenarios there is also the major risk that lack of funding due to the crisis (e.g. because of reduced government budget) and increased risk averseness of investors or households will hamper the implementation of measures required to achieve the GHG emission reductions. This means, if policy does not put particular emphasis on mitigation policy the “conventional” way of handling the crisis will significantly reduce the chance that such 2-degree scenarios can be achieved. Therefore, policy has to aim for policy programmes that integrate mitigating the crisis and mitigating climate change. One option to link climate mitigation policy and crisis managment would be to follow the idea of the “Green New Deal”, which is to always link the economic stimulus with the requirement to introduce green tech-nologies and GHG lean processes.

Executive Summary
Summary 08
Policy conclusions
The broad message of the sectoral analyses performed for Europe is: a pathway to reach the 2°C target is technologically feasible and economically viable. However, there is no silver bullet in climate policies to achieve the goal and to optimize costs and benefits. All the options of emission reductions will have to be forcefully activated and sustained over a long time hori-zon. A broad package of policies to stimulate technological change as well as behavioural
change has to be implemented by the EU, the Member States, municipal governments and numerous actors from the public and the private sectors. Most relevant measures are:
• Assigning carbon (or GHGs) a price is a major pre-requisite for successful climate policy, as it translates environmental constraint into a market signal. However, this is only a neces-sary pre-requisite, not a sufficient stand-alone instrument to achieve the 400 ppm targets.
• Implement a coherent set of policy measures such to overcome barriers that prevent invest-ments in cost-effective and low-cost energy-efficiency measures and renewable energies: codes and standards including MEPS, preferential loans and other financial instruments, la-bels and other information measures. Temporarily limited subsidy schemes that could be fi-nanced by a carbon levy might be necessary to achieve fast diffusion of new technologies.
• New technologies play a very important role in achieving the goals of ambitious climate policy. Thus massive investments for public and private R&D are required for efficiency technologies (e.g. in buildings, vehicles, industrial processes ), renewables and, to limited extent, also CCS.
• The take-up of low carbon technologies by the markets has to be accelerated. This should be achieved by norms, standards and labels wherever appropriate, e.g. in buildings, vehicles or power plants. The second effect of norms and standards is that they provide certainty for in-vestors who plan for investments requiring a long-term payback period.
• Take immediate action since each year lost before shifting the transition pathway towards a low carbon society represents a year requiring even stronger action in the subsequent years.
The measures suggested in this report are not science fiction. However, they need strong sup-port by todays policy-makers, who have the most difficult task. They will have to promote such policies even though visible climate impacts are limited, yet, and knowledge of the possible impacts is limited as well. Future generations of policy-makers - and private decision-makers - will have an easier task, as climate change will be more visible. On the other hand, for future policy-makers it would be too late to mitigate climate change, if todays policy-makers do not start to implement our suggested mitigation measures.

ADAM 2-degree scenario for Europe – policies and impacts
- 1 -
1 Introduction Authors: Wolfgang Schade, Eberhard Jochem
The ADAM project is funded by the European Commission to research strategies for mitigating and adapting to climate change from a European perspective but in a global context. The re-search was conducted between March 2006 and July 2009 by a Consortium of 24 European research institutes, together with one partner from each of China and India. The Consortium is led by the Tyndall Centre for Climate Change Research at the University of East Anglia, UK.
ADAM research identifies and appraises existing and new policy options that would be able to contribute to different combinations of adaptation and mitigation strategies. These options ad-dress the demands a changing climate will place on protecting citizens and valuable ecosystems – i.e., adaptation – as well as addressing the necessity to restrain/control humankind’s pertur-bation to global climate to a desirable level – i.e., mitigation. The focus of this deliverable is on technological options for mitigation in Europe. This includes the analysis of new technologies and their diffusion into the market. This is completed by an analysis of the policy instruments fostering new technologies and other mitigation measures.
The ADAM work programme is structured around four overarching domains: Scenarios, Adap-tation, Mitigation and Policy Appraisal. In addition, four Case Studies were completed in which synergies and tradeoffs between climate change mitigation and adaptation strategies were ana-lysed at different scales, at the European and the global level. The work presented in this deli-verable belongs to the mitigation domain of ADAM. The deliverable deals with two parallel analytic approaches to develop mitigation scenarios for Europe that would put the EU27 on a path towards a 2-degree world. The two parallel approaches are using (1) the ADAM Hybrid Model System (ADAM-HMS), and (2) the POLES world energy system model. The focus of the deliverable is on the results of the ADAM-HMS, which are contrasted and compared with the results of the POLES model. The analysis is undertaken as part of the work package Mitiga-tion M1 led by Fraunhofer-ISI collaborating with a core group of partners including Paul Scherrer Institute (PSI), Centre for Energy Policy and Economics at ETH Zurich (CEPE), BSR Sustainability GmbH (BSR), National Centre for Scientific Research, Energy and Environmen-tal Policy at CNRS (LEPII) and Wageningen University (Alterra) supported by Potsdam Insti-tute for Climate Impact Research (PIK), Enerdata and Cambridge University (UCAM).

Introduction
- 2 -
1.1 Climate policy: past and future
At the United Nations Conference on Environment and Development in 1992 in Rio de Janeiro, Brazil – the so called Rio Earth Summit – the foundations of today's climate policy were laid by agreeing on the United Nations Framework Convention on Climate Change (UNFCCC). The Convention sets an ultimate objective of stabilizing greenhouse gas concentrations "at a level
that would prevent dangerous anthropogenic (human induced) interference with the climate system." It states that "such a level should be achieved within a time-frame sufficient to allow
ecosystems to adapt naturally to climate change, to ensure that food production is not threat-ened, and to enable economic development to proceed in a sustainable manner." [UN 1992].
The Convention placed the heaviest burden for fighting climate change on industrialized na-tions, since they are the source of most past and current greenhouse gas emissions. These coun-tries are asked to do the most to cut their greenhouse gas emissions, and to provide most of the money for efforts elsewhere. For the most part these industrialised nations belong to the Organi-zation for Economic Cooperation and Development (OECD). In the terms of the UNFCCC they are called "Annex I" countries because they are listed in the first annex to the Convention. The European Union (EU) belongs to these Annex I countries, such that developing an appropriate mitigation strategy for the EU as attempted in this deliverable also contributes to the UNFCCC and its succeeding agreements.
1.1.1 Current international climate policy: Kyoto Protocol and EU-ETS
The major agreement that was put into force as a follow-up to the UNFCCC is the so-called Kyoto Protocol, which was adopted in Kyoto, Japan, on 11th December 1997 and entered into force on 16th February 2005. 184 Parties of the Convention have ratified its Protocol to date. The major distinction between the Protocol and the Convention is that while the Convention encouraged industrialised countries to stabilize GHG emissions, the Protocol commits them to do so [UN 1998].
In fact, the Kyoto Protocol sets binding targets for 37 industrialized countries and the European Union for reducing greenhouse gas (GHG) emissions. These reductions amount to an average of five per cent against 1990 levels over the five-year period 2008-2012. Countries with commit-ments under the Kyoto Protocol to limit or reduce greenhouse gas emissions must meet their targets primarily through national measures. As an additional means of meeting these targets, the Kyoto Protocol introduced three market-based mechanisms, thereby creating the so-called “carbon market.” The Kyoto mechanisms are:

ADAM 2-degree scenario for Europe – policies and impacts
- 3 -
• Emissions trading,
• clean development mechanism (CDM), and
• joint implementation (JI).
To participate in the Kyoto mechanisms, Annex I Parties of UNFCCC must meet, among others, a number of eligibility requirements. First, they must have ratified the Kyoto Protocol and must have calculated their assigned amount of greenhouse gas emissions (GHG) in terms of tonnes of CO2-equivalent emissions. A national system for estimating emissions and removals of green-house gases within their territory has to be put in place as well as a national registry to record and track the creation and movement of savings of GHG and their equivalent tradable emissions allowances. Finally, an annual reporting of emissions and removals has to be delivered to the UNFCCC.
The EU has committed itself under the Kyoto Protocol to achieve a reduction of -8% of GHG emissions for the period 2008 to 2012 compared with 1990. The EU Member States have agreed on a distribution of reductions amongst them defining individual reduction targets for each country. The major instrument to achieve these reductions was the initialisation of the EU Emis-sions Trading System (EU-ETS) commencing in 2005 and being agreed in 2003 by EU Direc-tive 2003/87/EC [EU 2003]. The EU-ETS implemented the requirements of the Kyoto Protocol by setting a cap (i.e. a maximum quantity of allowed greenhouse gas emissions) for the large industrial emitters of GHGs and the energy conversion sector in the EU. However, sectors like transport, residential or services were mainly left outside the EU-ETS (i.e. besides indirect ef-fects that feed back on these sectors from the EU-ETS sectors).
1.1.2 Future climate policy: Post-Kyoto developments
Since, the commitment period of the Kyoto Protocol ends in 2012 and there has been no follow-up agreement put into place, so far, there is currently no further binding global concrete climate policy agreement existing for the time period after 2012. However, the Intergovernmental Panel on Climate Change (IPCC) reported in its fourth assessment report that the signals of climate change have developed stronger than estimated in the previous assessment report and that there might only be a short window of opportunity during which it will still be feasible to limit cli-mate change to a 2-degree Celsius temperature increase, only, compared with pre-industrial levels [IPCC 2007]. With a temperature increase of 2-degree Celsius it is assumed that negative consequences of climate change remain limited and no tipping points of the natural systems are

Introduction
- 4 -
reached.1 Thus the term 2-degree target is coined, expressing the target to reach a manageable level of climate change by mitigation measures.
Since the fourth IPCC assessment report in 2007 a number of observations indicate the risk of already accelerating changes in natural systems. Such observations make it even more relevant to continue the process under the UNFCCC and to develop a new global agreement for the Post-Kyoto period i.e. after 2012. An important step forwards, if not even a breakthrough, is ex-pected to be achieved at the next conference of the parties (COP-15), which will be held in De-cember 2009 in Copenhagen, Denmark. The EU has developed its position for COP-15 through a number of communications, which all emphasize the 2-degree target [e.g. EC 2007, EC 2009]. Basically, the European message is that the EU will reduce its GHG emissions be -20% until 2020 compared with 1990, even if the rest of the world would not agree on reductions. If a joint global agreement similar to the Kyoto-Protocol would be achieved for the Post-Kyoto period the EU would even accept a reduction target of -30% until 2020. On the global level the EU formu-lates the target of a reduction of -50% GHG emissions by 2050 compared with 1990, which according to IPCC means a reduction of -80 to -95% by the industrialised countries by 2050.
A path to achieve a -80% reduction also underlies the work in the work package Mitigation M1 described in this deliverable. It is obvious that this level of reductions can not be achieved by looking at the EU-ETS sectors only. The remaining sectors have to contribute to GHG emission reductions, such that the mitigation analysis in this work package considers the sectors house-holds, industry, services, transport, renewables and energy conversion and puts a particular fo-cus on energy efficiency and material efficiency in these sectors.
1.1.3 Related policy framework in the EU and Member States
Besides the introduction of the EU-ETS the European Union and its Member States have taken a number of policy measures that complement the EU-ETS and thus also contribute to mitiga-tion of climate change. An important step forward was the so-called European Energy and Cli-mate Package “20 20 by 2020” [EC 2008]. It confirmed the objective to reduce GHG emissions by 2020 by -20% unilaterally and brought forward the target to reach a level of 20% renewables for energy production by 2020 as well. The EU-ETS sectors should contribute a reduction of -21% by 2020 and for the first time also the Non-ETS sectors – e.g. transport, housing, agricul-
1 Recent evidence suggests that even with the restriction to 2-degree C temperature rise, climate im-
pacts will be considerable [e.g. Heimann/Reichstein 2008].

ADAM 2-degree scenario for Europe – policies and impacts
- 5 -
ture and waste – were made subject to a GHG reduction target i.e. they should reduce their emissions by -10% by 2020 compared with 2005. Further the EC seeks to develop the Carbon Capture and Storage (CCS) technology.
Such an ambitious policy package gained momentum through a publication on behalf of the UK government, which was “The Economics of Climate Change”, the so-called Stern Review [HM Treasury 2006]. The Stern Review concluded that climate change, if not mitigated, could cost about 5-20% of global GDP, while the cost of mitigation would remain at the order of 1% of global GDP. This was a strong signal in favour of mitigation policy and thus a driver for the work in our work package M1.
The EU put another policy focus related to GHG reductions and energy security on energy sav-ing and energy efficiency. It defined an indicative target that EU Member States should increase their energy efficiency and reduce their energy consumption by -9% until 2016 compared with 2006 [EU 2006]. Since GHG emissions are close to proportional to energy consumption this target would have a similar reduction effect on GHG emissions.
More specifically the EU tackled the CO2 intensity of passenger transport by introducing a binding legislation according to which the average of all new passenger cars sold in Europe in 2015 should emit not more than 130 g CO2/km such that considering the use of biofuels and further eco-innovations the binding target for the average new passenger car fleet in 2015 is set to 120 g CO2 / km, which means a reduction of -20 to -25% (depending on the country) com-pared with today [EU 2009].
On the level of the Member States similar policy programmes have been defined, both to im-plement the EU directives and regulations and to develop a national climate change mitigation approach. One example is the German Meseberger Integrated Energy and Climate Programme (IECP) [BMU 2007]. The IECP defines 29 policy measures / policy packages. It consists of a mix of energy efficiency improvement measures, which indirectly reduce GHGs as pointed out above, and direct GHG reduction measures. Examples, of the former are the energy efficient rehabilitation of houses or energy efficiency measures in businesses (e.g. direct via energy man-agement and indirect via efficiency standards of appliances). Examples of the latter are renew-ables policies for electricity and heating (e.g. feed-in tariffs) or a package to reduce CO2 emis-sion from passenger cars including CO2 emission limits, CO2 based taxation and CO2 effi-ciency labelling.
The policy framework developed by the EU and the Member States can be summarised by the following broad options of climate mitigation policy:

Introduction
- 6 -
• Introduce GHG emissions trading,
• Increase of energy efficiency,
• Focus on renewable energies,
• Setting standards and norms that drive technological development, and
• Include all sectors and all greenhouse gases in the mitigation efforts.
This framework is followed in the analysis throughout this deliverable: our assessment is that it would provide a suitable framework to reduce drastically the GHG emissions in Europe by 2050.
1.2 Approach of work package Mitigation M1
Our work package Mitigation 1 (M1) has the core objective to simulate mitigation options and their related costs for Europe until 2050 and 2100 respectively. The focus of this deliv-erable is on the period 2005 to 2050. The longer-term period until 2100 is covered in the pre-vious deliverable D-M1.2, applying the POLES model for this time horizon [Eberhard et al. 2009].
Our analysis in work package M1 constitutes basically a techno-economic analysis. Depending on the sector analysed it is either directly combined with a policy analysis (e.g. in the transport sector, renewables sector) or the policy analysis is performed qualitatively as a subsequent and independent step after the techno-economic analysis is completed (e.g. in the residential and service sectors).
Figure 1-1 presents the embedding of work package M1 into the broader frame of the ADAM project. As Europe obviously forms part of global emission reduction activities, the analysis of M1 also depends on the economic and policy assumptions as well as the results of work pack-age Mitigation M2 (covering the global level), on the results of work package Scenarios S (pro-viding a common framework of scenarios in the ADAM project) and on work packages Adapta-tion A1 and A2 (assessing the risks and damages of climate change). These ADAM work pack-ages provide inputs to our work in work package M1 in the form of scenario inputs (e.g. GDP, population projections, heating and cooling days) and model results (e.g. European CO2 emis-sion pathway to reach 2-degree considering the global context, consequences of adaptation).
The broad relationships between these work packages and inbetween of our work package M1 is shown in Figure 1-1. Within M1 there is interaction between macro-economic models and sec-

ADAM 2-degree scenario for Europe – policies and impacts
- 7 -
toral process oriented bottom-up models, which communicate recursively with each other via the Virtual Model Server (VMS), a tool enabling and structuring the data transfer between mod-els. This hybrid model system (HMS) of M1 is fed by the harmonised socio-economic ADAM storylines from the work package Scenarios S. Further work package S provided the changes of heating and cooling days (H/C days) for the EU Member States. The world reference scenario of the energy system and the global GHG emissions is provided by the work package M2 applying the POLES, REMIND and IMAGE models and delivering a European GHG emissions pathway for the mitigation scenarios to M1, which is input to the bottom-up models of M1. The adapta-tion work packages provide specific inputs either to the economic models or the bottom-up models of our work package M1 e.g. potential damages to the capital stock. However, the latter interaction remained limited. Finally, there has been exchange of data and results with the case study on the European electricity system (P3c).
Work package
Mitigation M2
Global Level
• World energysystem
• World cap ofGHG emissions
• EU cap of GHG emissions
Work package
Scenarios SScenario framework
• EU GDP and population
• Climate change impacts
Work packages
Adaptation A1/2
Regional Level
• Extreme events
• Climatedamages andrisk
Case study
EU Electricity System P3c
• EU electricity production
• EU electricity demand
Investment, cost change, energy expenditure
Macro-economic models(EU27 + Norway + Switzerland)
Work package Mitigation M1
Sectoral process-oriented bottom-up models(Residential, industry, services, transport, energy)
Virtual Model Server(VMS)
GPD change, change ofsectoral output
EU GHG cap
Population,
GDP, H/C days
Data / results
exchange
Risk of damages
Source: ADAM-M1
Figure 1-1: Overview of the model system of WP Mitigation M1 and its context of related ADAM work packages Mitigation M2, Adaptation A1 and A2, Scenarios S
There are four major methodological challenges in work package M1:
• The integration of the economic and technical developments in Europe into global devel-opment. This is handled by linking work package M1 with the global mitigation work pack-age M2 and using the model results from their models, in particular POLES, E3MG and REMIND.

Introduction
- 8 -
• The differences in economic and technical development within Europe with the presently quite different conditions of the capital stock and the economic performance in Western, Southern, and Eastern Member States of the European Union.
• The differences in natural resources (such as potentials of renewable or fossil energies, cli-mate conditions), which suggest different mitigation and adaptation policies in the various European Member States.
• Finally, the integration of 10 models applied in work package M1 to generate the results on different structural levels, i.e. eight models provide results on the bottom-up level that is considering sectoral technologies and processes to implement these technologies, while two models handle the macro-economic and global level, respectively.
This report is the third in a sequence, which started with deliverable D1 on the Base Case Sce-nario without climate change and also provided the model descriptions [Eberhard et al. 2007] followed by deliverable D2 on the impact of adaptation of the energy system in the Reference Scenario and a meso-level analysis of a 2-degree scenario until 2100 [Eberhard et al. 2009]. This final report describes two detailed variants of a 2-degree Mitigation Scenario for Europe to 2050 and compares them with the Reference Scenario.
1.3 Issues of mitigation analysis in Europe
Economic and technical developments and climate change in Europe are part of the global eco-nomic and technical developments and their related greenhouse gas emissions. In order to de-sign possible future adaptation and mitigation scenarios, therefore, a global context has to be taken into account. This is achieved by the ADAM work package Scenarios where climate change is simulated based on projected global emissions and by work package Mitigation 2, where the techno-economic development of the rest of the world and the associated greenhouse gas emissions are calculated for the period 2000 to 2100, and by the global POLES eneryg sys-tem model that is also part of work package M1.
The European countries are presently at different stages of their techno-economic development. Whereas some countries have almost fully complete infrastructures, few basic industries, and more than two thirds of their GDP generated by services (e.g. Switzerland, Denmark, Sweden), some of the Central European countries have relatively poor infrastructures, low incomes per capita, a relatively high share of GDP generated by agriculture, and a low degree of motorisa-tion and automation.

ADAM 2-degree scenario for Europe – policies and impacts
- 9 -
Because of the different population densities, landscape and climates, European countries have different potentials to use renewables (e.g. photovoltaics, wind energy) or biomass e.g. wood production per capita or additional felling potentials in the next decades which offer opportuni-ties for reducing energy-related greenhouse gases by using more wood as a fuel or by using forests as carbon stores or in long-lasting wood uses (e.g. houses and buildings).
Macroeconomic models have an advantage in simulating the cycles of goods and money, but they are not able to simulate new technological developments in detail. On the other hand, sec-toral, process-oriented bottom-up models that can simulate technical and organisational innova-tions cannot adequately simulate the indirect cost of the energy system on the national economy or on foreign trade patterns. This dilemma can be solved by hybrid model systems (HMS) con-sisting of macroeconomic and bottom-up models which exchange the results between them. Such a system is developed in this work package Mitigation M1. We call it the ADAM-HMS. The system is then applied to develop mitigation strategies for Europe until 2050.
1.4 Objectives and scenarios of this deliverable
This deliverable presents the final results of work package M1 on “Mitigation for Europe”. It provides results of two variants of a possible 2-degree scenario with target concentrations of CO2 of 450ppm (the so-called 450ppm scenario) and of 400ppm (the so-called 400ppm sce-nario). These two scenario variants are compared with the Reference Scenario, which is de-scribed in detail in the deliverable D2 of work package M1. This reference scenario has been slightly improved for this deliverable, such that where necessary updated results of the reference scenario are reported and are used for the comparison of the 2-degree scenarios with the refer-ence scenario.
The work on “Mitigation for Europe” is embedded into the larger framework of the ADAM project, in which also the “Mitigation on Global Level” is analysed in work package M2 of ADAM. The global analysis provided a pathway of allowed GHG emissions of Europe for our work taking into account the mitigation activities on global level and thus providing guidance on the efforts Europe has to contribute. This GHG pathway was used as benchmark into which the aggregate sectoral GHG emissions in our work have to fit.
The first objective of this deliverable is then to analyse technological options as well as poten-tial policies in all relevant sectors to reduce GHG emissions of these sectors such that the ag-gregate GHG emissions of all sectors follow the required European GHG pathway in a 2-degree scenario. The themes considered in detail are:

Introduction
- 10 -
• Forestry and energy crops,
• material use and material efficiency in industry,
• basic products and industrial sector,
• services sector,
• residential sector,
• transport sector, and the
• power generation from renewable energies and energy conversion sector.
For each theme a model-based techno-economic bottom-up analysis of technological options, diffusion of technologies, cost of diffusion, potential and required policies for technology diffu-sion is undertaken. The cost and investment results on the sectoral level are then transferred into a macro-economic model, which calculates the impacts of the bottom-up technology diffusion and policies on the economy, in particular on growth and employment. Thus the second objec-tive of this deliverable is to analyze the economic impacts of a mitigation policy in Europe that would bring Europe onto a globally aligned 2-degree development path until 2050.
1.5 Structure of this deliverable
This deliverable is structured in four main sections. The first section presents the framework and the methodological approach of our work. It consists of the executive summary, the introduc-tion, the description of the framework conditions and the methodology.
The second main section describes the bottom-up analysis consisting of the two parallel streams of analysis based (1) on the ADAM hybrid model system (HMS) consisting of 9 sectoral and separate bottom-up models, and (2) on the POLES model. It starts with the POLES model as this also provides inputs to the ADAM-HMS followed by seven sections on the sectoral bottom-up models (forest and material efficiency, residential, services, industry, transport, renewables and conversion sector), and concludes with a synthesis of the bottom-up analysis.
The third main section describes the macro-economic consequences for Europe. It consists of two sections: one on the economic impacts of EU climate policy to 2050 and another one on the potential impacts of the economic crisis on climate policy to 2020. The final section presents the analytic and policy conclusions of our analyses.

ADAM 2-degree scenario for Europe – policies and impacts
- 11 -
2 Scenarios and macroeconomic assumptions Author: Wolfgang Schade
This section presents the economic, demographic and energy prices scenario of the analysis in the work package Mitigation M1. The broad framework i.e. the scenario input on country level is provided by the ADAM work package Scenarios. The framework is then implemented into the macro-economic models (i.e. ASTRA and E3MG), which then disaggregate the input e.g. onto the level of economic sectors by country and then deliver the sectoral input for the bottom-up analysis (see section 3 on methodology).
The following sections present the general assumptions divided into the three sections: scenario set-up, economic and demographic trends as well as trends of energy prices.
2.1 Definition of Scenarios
In the course of the work on work package M1 three scenarios have been developed of which one scenario is developed in two variants. Figure 2-1 presents an overview on these scenarios and their main differences. The Base Case Scenario provides a virtual scenario, in which the policies are continued as defined in the year 2007. There are no GHG emission targets defined for the longer term i.e. for the years 2020 and 2050 (the Kyoto targets for 2008 to 2012 existed already in the year 2007) and climate change i.e. temperature increase does not occur, which makes it a virtual scenario as with increasing emissions we would have climate change. This scenario was used to establish the links between the models and to achieve a common and con-sistent reference.
The Reference Scenario differs from the Base Case Scenario by the fact that climate change is actually occurring i.e. the world is facing an increase of temperature by +4-degree Celsius by 2100 compared with pre-industrial levels. In other ADAM work packages this scenario is named Adaptation Scenario, which was avoided in M1 as most of adaptation (in particular the more severe damages and the sea level rise) would occur after 2050 i.e. outside the time horizon of this deliverable. Thus the purpose of the Reference Scenario is twofold (1) to provide a real-istic scenario for the comparison with the following 2-Degree Scenario (i.e. mitigation scenar-ios), and (2) to provide an assessment of the adaptation cost of the energy system, which will react earlier than other systems (e.g. by using more air-conditioning in buildings and vehicles or by requiring more or differently equipped power-plants in summer to cope with the reduced cooling capacity of rivers) in response to continuously increasing temperatures.

Scenarios and macroeconomic assumptions
- 12 -
The 2-Degree Scenario is developed in two variants reflecting the uncertainty about with which level of CO2 eq. concentrations the increase of temperature can actually be limited to 2-degree Celsius until 2100. The two variants represent (1) a concentration of 450 ppm CO2eq. in the long run and (2) a concentration of 400ppm CO2eq. of which the former would provide a 50% likeli-hood that the 2°C target is achieved and the latter a 70% likelihood. In the 2-Degree Scenarios after 2008 mitigation policies are implemented and climate change is successfully limited to +2°C, such that adaptation impacts to climate change remain very limited. The comparison be-tween the Reference Scenario and the 2-Degree Scenarios reveals the cost (or benefit) of mitiga-tion policy. Thus the 2-Degree Scenarios represent a mitigation scenario.
One could also compare the adaptation cost and the mitigation cost derived from the scenario comparisons. However, making this comparison one must have in mind that the bulk of mitiga-tion actions and the related cost occur before 2050, while for adaptation it is vice versa i.e. the bulk of adaptation cost, in particular damage cost, health cost or cost of sea level rise will only occur after 2050. Thus such a comparison would naturally be skewed, unless, the different time horizons for which adaptation impacts and mitigation measures have to be considered were taken into account.
Cost of adaptation ofenergy system until 2050
Base Case Scenario• Policies: continued as of 2007• Climate change: no• GHG emission targets: no
Reference Scenario• Policies: continued as of 2007• Climate change: yes (+4° Celsius)• GHG emission targets: no
2-Degree Scenario• Policies: mitigation policy after 2007/08• Climate change: limited (+2° Celsius)• GHG emission targets: yes (450, 400ppm)
Cost of mitigation in all sectors and macro-economy
Comparison of adaptation andmitigation cost
(limited due to time horizon 2050)
Source: ADAM-M1.
Figure 2-1: Definition of scenarios and purpose of scenario comparison

ADAM 2-degree scenario for Europe – policies and impacts
- 13 -
2.2 Demographic and economic conditions
Work package Scenarios S provides a common scenario for population and GDP for the Euro-pean countries. In work package M1 sone of the models that are applied endogenously calculate these two indicators by themselves (e.g. ASTRA model). The endogenous trends of these indi-cators have been adjusted in the ASTRA model to fit the common scenario framework as closely as possible to. Since the ASTRA model forwards its results to the sectoral bottom-up models the ASTRA trends are presented in the following Figure 2-2. Population in EU27+2 grows until 2020 and then starts to decline leading to a reduction of -4% by 2050 compared with 2010.2 However, the situation differs between the regions. The Southern and Eastern EU coun-tries loose about -10% of population, while the Northern countries increase by about +5% and the Western countries remain nearly stable.
In terms of GDP the situation differs. The EU27+2 grow by about +85% between 2010 and 2050 (in real terms). The strongest growth is expected for the Eastern countries (about +170%) followed by the Northern and Western countries (around +90%). The Southern countries loose ground with a slower growth of about +60%. In particular, this means that the catch-up process in the Eastern countries will continue until at least 2050.
‐
100
200
300
400
500
600
2010 2020 2030 2040 2050
Population in EU27+2 countries[million persons]
West
East
South
North
‐
5,000
10,000
15,000
20,000
25,000
2010 2020 2030 2040 2050
GDP in EU27+2 countries[billion €2005]
West
East
South
North
Source: ASTRA model reflecting the ADAM scenario framework.
Figure 2-2: Population and GDP framework in the Reference Scenario
2 The population projections allow for a net inwards migration into the EU between 1.3 and 1.4 mil-
lion persons annually.

Scenarios and macroeconomic assumptions
- 14 -
The following Table 2-1 and Table 2-2 present the population and GDP development until 2050 country-by-country, respectively. It should be noted that EU27 refers only to the EU Member States (i.e. excluding Norway and Switzerland), while the region North includes Norway and West includes Switzerland in the tables.
Table 2-1: Population development in EU27+2 countries until 2050 (all scenarios)
Country or country group
All Scenarios [Mio persons]
Changes
(average annual population change [%])
2010 2020 2030 2040 2050 '20 to
'10 '30 to
'20 '40 to
'30 '50 to
'40 '50 to
'10
Austria 8.3 8.4 8.5 8.4 8.2 0.2% 0.1% -0.1% -0.2% 0.0%Baltic States 6.9 6.6 6.3 6.1 5.9 -0.5% -0.4% -0.3% -0.4% -0.4%Belgium/Lux. 11.0 11.3 11.5 11.6 11.6 0.3% 0.2% 0.1% 0.0% 0.1%Bulgaria 7.4 6.8 6.2 5.6 5.1 -0.8% -0.9% -1.0% -0.9% -0.9%Czech Republic 10.1 10.0 9.7 9.3 8.9 -0.1% -0.3% -0.4% -0.4% -0.3%Denmark 5.5 5.5 5.5 5.5 5.4 0.1% 0.0% 0.0% -0.2% 0.0%Finland 5.3 5.4 5.4 5.4 5.2 0.2% 0.1% -0.1% -0.2% 0.0%France 61.5 63.4 65.0 65.8 65.9 0.3% 0.2% 0.1% 0.0% 0.2%Germany 82.7 82.4 81.1 78.6 74.7 0.0% -0.2% -0.3% -0.5% -0.3%Greece 11.2 11.4 11.3 11.1 10.6 0.2% -0.1% -0.2% -0.4% -0.1%Hungary 10.0 9.7 9.5 9.2 8.9 -0.2% -0.3% -0.3% -0.3% -0.3%Ireland 4.3 4.8 5.1 5.3 5.5 0.9% 0.6% 0.4% 0.3% 0.6%Italy 58.5 58.4 57.1 55.3 52.8 0.0% -0.2% -0.3% -0.5% -0.3%Malta/Cyprus 1.2 1.3 1.4 1.5 1.5 0.9% 0.6% 0.4% 0.2% 0.5%Netherlands 16.7 17.2 17.5 17.6 17.4 0.3% 0.2% 0.1% -0.1% 0.1%Norway 4.7 4.8 4.9 5.0 5.0 0.2% 0.3% 0.2% 0.0% 0.2%Poland 37.9 37.2 36.4 35.0 33.6 -0.2% -0.2% -0.4% -0.4% -0.3%Portugal 10.7 10.8 10.7 10.4 10.0 0.1% -0.1% -0.2% -0.4% -0.2%Romania 21.4 20.4 19.3 18.2 17.0 -0.5% -0.5% -0.6% -0.7% -0.6%Slovakia 5.3 5.3 5.2 5.0 4.7 -0.1% -0.2% -0.4% -0.5% -0.3%Slovenia 2.0 2.0 2.0 2.0 1.9 0.0% -0.1% -0.2% -0.3% -0.1%Spain 44.4 45.7 45.5 44.6 42.7 0.3% 0.0% -0.2% -0.4% -0.1%Sweden 9.2 9.6 9.9 10.1 10.2 0.4% 0.3% 0.2% 0.1% 0.3%Switzerland 7.5 7.5 7.3 7.1 6.7 0.0% -0.2% -0.4% -0.5% -0.3%
United Kingdom 61.0 62.8 64.2 64.8 64.4 0.3% 0.2% 0.1% -0.1% 0.1%
EU27 492 496 494 486 472 0.1% 0.0% -0.2% -0.3% -0.1%
North 25 25 26 26 26 0.3% 0.2% 0.1% 0.0% 0.1%South 155 155 152 147 140 0.0% -0.2% -0.3% -0.5% -0.3%East 72 71 69 67 64 -0.2% -0.3% -0.4% -0.4% -0.3%
West 253 258 260 259 254 0.2% 0.1% 0.0% -0.2% 0.0%
Source: Fraunhofer-ISI, ASTRA model in ADAM-M1.

ADAM 2-degree scenario for Europe – policies and impacts
- 15 -
Table 2-2: GDP development in EU27+2 countries until 2050 (Reference Scenario)
Country or country group
Reference Scenario [Billion €2005]
Changes
(average annual GDP growth [%])
2010 2020 2030 2040 2050 '20 to
'10 '30 to
'20 '40 to
'30 '50 to
'40 '50 to
'10
Austria 289 339 384 424 467 1.6% 1.2% 1.0% 1.0% 1.2%Baltic States 30 39 50 62 75 2.7% 2.5% 2.2% 1.8% 2.3%Belgium/Lux. 363 407 452 496 539 1.2% 1.0% 0.9% 0.8% 1.0%Bulgaria 17 22 27 31 34 2.2% 2.2% 1.6% 0.9% 1.7%Czech Republic 73 89 110 128 144 2.1% 2.1% 1.6% 1.1% 1.7%Denmark 216 265 316 364 416 2.1% 1.8% 1.4% 1.3% 1.7%Finland 195 230 263 290 316 1.7% 1.3% 1.0% 0.9% 1.2%France 1,947 2,369 2,935 3,654 4,476 2.0% 2.2% 2.2% 2.1% 2.1%Germany 3,015 3,602 4,063 4,453 4,781 1.8% 1.2% 0.9% 0.7% 1.2%Greece 163 169 187 219 269 0.3% 1.1% 1.6% 2.1% 1.3%Hungary 64 81 97 111 124 2.3% 1.9% 1.4% 1.1% 1.7%Ireland 111 132 149 159 160 1.7% 1.2% 0.7% 0.0% 0.9%Italy 1,317 1,484 1,644 1,768 1,880 1.2% 1.0% 0.7% 0.6% 0.9%Malta/Cyprus 18 21 24 28 31 1.6% 1.7% 1.3% 1.1% 1.4%Netherlands 543 653 803 962 1,109 1.9% 2.1% 1.8% 1.4% 1.8%Norway 221 287 351 423 520 2.6% 2.0% 1.9% 2.1% 2.2%Poland 232 346 475 629 746 4.1% 3.2% 2.8% 1.7% 3.0%Portugal 160 201 239 273 313 2.3% 1.8% 1.3% 1.4% 1.7%Romania 39 49 61 74 83 2.2% 2.3% 1.9% 1.2% 1.9%Slovakia 28 37 47 61 74 2.9% 2.5% 2.6% 1.9% 2.5%Slovenia 36 47 58 69 78 2.8% 2.1% 1.7% 1.3% 2.0%Spain 784 929 1,075 1,207 1,359 1.7% 1.5% 1.2% 1.2% 1.4%Sweden 341 404 484 562 633 1.7% 1.8% 1.5% 1.2% 1.6%Switzerland 386 466 536 591 635 1.9% 1.4% 1.0% 0.7% 1.2%
United Kingdom 1,503 1,835 2,230 2,679 3,152 2.0% 2.0% 1.9% 1.6% 1.9%
EU27 11,483 13,750 16,174 18,704 21,260 1.8% 1.6% 1.5% 1.3% 1.6%
North 972 1,186 1,414 1,639 1,885 2.0% 1.8% 1.5% 1.4% 1.7%South 2,499 2,873 3,258 3,600 3,971 1.4% 1.3% 1.0% 1.0% 1.2%East 462 640 838 1,061 1,240 3.3% 2.7% 2.4% 1.6% 2.5%
West 8,157 9,804 11,551 13,418 15,318 1.9% 1.7% 1.5% 1.3% 1.6%
Source: Fraunhofer-ISI, ASTRA model in ADAM-M1.
Particular attention should be paid to the changing demographic structure and the implications for employment. Figure 2-3 presents on the left hand side the age composition of the EU27 popu-lation. It can be observed that the number of children and the potential labor force reduces until 2050, while the number of retired persons is increasing. These numbers are calculated with chil-
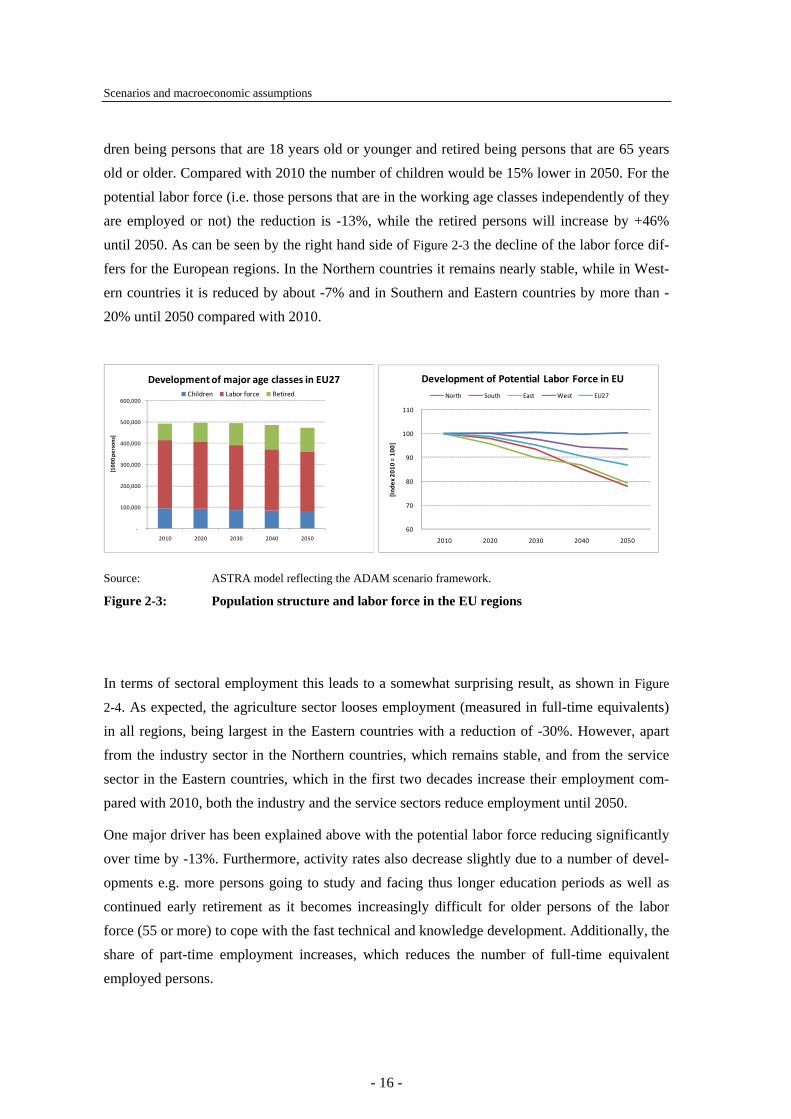
Scenarios and macroeconomic assumptions
- 16 -
dren being persons that are 18 years old or younger and retired being persons that are 65 years old or older. Compared with 2010 the number of children would be 15% lower in 2050. For the potential labor force (i.e. those persons that are in the working age classes independently of they are employed or not) the reduction is -13%, while the retired persons will increase by +46% until 2050. As can be seen by the right hand side of Figure 2-3 the decline of the labor force dif-fers for the European regions. In the Northern countries it remains nearly stable, while in West-ern countries it is reduced by about -7% and in Southern and Eastern countries by more than -20% until 2050 compared with 2010.
‐
100,000
200,000
300,000
400,000
500,000
600,000
2010 2020 2030 2040 2050
[100
0 pe
rson
s]
Development of major age classes in EU27Children Labor force Retired
60
70
80
90
100
110
2010 2020 2030 2040 2050
[Ind
ex 201
0 = 10
0]
Development of Potential Labor Force in EUNorth South East West EU27
Source: ASTRA model reflecting the ADAM scenario framework.
Figure 2-3: Population structure and labor force in the EU regions
In terms of sectoral employment this leads to a somewhat surprising result, as shown in Figure
2-4. As expected, the agriculture sector looses employment (measured in full-time equivalents) in all regions, being largest in the Eastern countries with a reduction of -30%. However, apart from the industry sector in the Northern countries, which remains stable, and from the service sector in the Eastern countries, which in the first two decades increase their employment com-pared with 2010, both the industry and the service sectors reduce employment until 2050.
One major driver has been explained above with the potential labor force reducing significantly over time by -13%. Furthermore, activity rates also decrease slightly due to a number of devel-opments e.g. more persons going to study and facing thus longer education periods as well as continued early retirement as it becomes increasingly difficult for older persons of the labor force (55 or more) to cope with the fast technical and knowledge development. Additionally, the share of part-time employment increases, which reduces the number of full-time equivalent employed persons.

ADAM 2-degree scenario for Europe – policies and impacts
- 17 -
‐
10,000
20,000
30,000
40,000
50,000
60,000
70,000
80,000
Agriculture
Indu
stry
Services
Agriculture
Indu
stry
Services
Agriculture
Indu
stry
Services
Agriculture
Indu
stry
Services
North South East West
[100
0 pe
rson
s]
Region
Development of employment (full‐time‐equivalents)in major sectors in EU regions
2010
2020
2030
2040
2050
Source: ASTRA model reflecting the ADAM scenario framework.
Figure 2-4: Development of employment in major sectors in Europe
2.3 Energy prices
The energy prices are provided by the POLES model and are used in the sectoral bottom-up models. This concerns the prices of crude oil and derived fossil fuels, e.g. gasoline, diesel, coal or heating oil. Electricity prices are estimated by the models of work package M1 independ-ently.
Figure 2-5 presents the development of fossil energy prices in Europe. The prices reflect the global market concept or at least European market concept according to which basically the European countries all pay the same price for their fossil energy (which is mostly imported), such that differences in final energy prices (e.g. gasoline) would mainly result from taxation differences.
It can be observed that the price structure remains the same as today with crude oil being most expensive followed by gas and then coal. Compared with 2010 both the crude oil price and the natural gas price will increase by about +90% by 2050. The coal price increases by about +60%. This price path reflects an optimistic point of view, projecting the peak of world oil production

Scenarios and macroeconomic assumptions
- 18 -
around 2030 as well as assuming the feasibility of replacing reduced conventional oil produc-tion by unconventional oil such that the world oil production roughly remains stable until 2050. Given that other studies expect the peak of oil production between today and 2015 [e.g. EWG 2007] or at least report a sharp decline of production of mature oil wells of -5% per annum, which requires a new production capacity of 3.5 million barrels per day annually [IEA 2008], the fossil energy price path of oil and gas seem to be at the lower end of the possible scenarios.
0
20
40
60
80
100
120
2000 2005 2010 2015 2020 2025 2030 2035 2040 2045 2050
[€2005/boe
]
Prices of fossil energy in EuropeCrude Oil Natural Gas Coal
Source: POLES model.
Figure 2-5: Prices of fossil energy in Europe in Reference Scenario

ADAM 2-degree scenario for Europe – policies and impacts
- 19 -
3 Methodological issues analysing mitigation options
Authors: Wolfgang Schade, Nicki Helfrich
This section describes the ADAM-HMS (ADAM hybrid model system) both in its components i.e. the single models and in its application. It starts with the description of the global structure and the explanation of the integrated models. This is followed by an explanation of the data exchange and the data flows between the models. The final section highlights the objective of converging selected model elements during the course of simulating a scenario and the diffculties to obtain convergence.
3.1 The ADAM hybrid model system (HMS)
The basic concept underlying the ADAM-HMS is based on the following arguments: (1) it is feasible to link different types of models (e.g. top-down and bottom-up models), (2) it makes sense to link these models as each has specific strengths, and (3) the linkage of the models is more than the sum of the single pieces since it alleviates the limitations of the models e.g. by considering feedbacks that can not be considered just within one of the models.
An alternative to the linkage of separate models is the integration of the functionality within one model. Such an approach is taken by the POLES world energy system model, which besides a macro-economic model integrates all models of the ADAM-HMS into one integrated bottom-up model. Thus our work also included a comparison of the hybrid model system with the integrated approach for the energy system delivered by POLES. The comparison focusses on the bottom-up sectoral models and neglects that in POLES all scenarios consider the same economic development, while in the ADAM-HMS the economic drivers change between the scenarios (in particular GDP) as well as the economic structure.
3.1.1 Linking top-down and bottom-up models
Two basic types of models have been integrated into the ADAM-HMS: top-down and bottom-up models. The terms emerge from the way these models look at the economy and its different sectors and actors. Top-down models come from the macro-perspective i.e. GDP, national employment or household consumption. Usually they disaggregate their analysis then into a number of economic sectors e.g. agriculture, vehicle manufacturing, construction, banking etc. and describe the interaction between these sectors. Such a model would constitute a macro-economic model (or if the number of sectors is highly disaggregated one would also speak of a meso-economic model). The variables in such a model would mainly represent monetary values. The analysis using such a model would most often be called a (macro-) economic analysis.

Methodological issues
- 20 -
Bottom-up models start from technologies and processes. By aggregating their results across technologies they provide statements on (parts of) economic sectors. E.g. a model that considers all the technologies for producing electricity in a country by describing the installation of the power-plants would be describing the electricity generation sector of that country. This could be equivalent to one sector in the top-down model or only to a part of such a sector. The variables in such a model would represent both physical values e.g. energy demand, tons of material and monetary values e.g. cost of the technologies. The analysis applying this type of model would be called a sectoral or partial-economic analysis.
The drawback of the first approach is that it lacks the technological foundation for the economic choices made in the different sectors, but it is able to consider the feedbacks of impacts between the sectors as well as the second round or indirect effects e.g. effects that occur because one sector stimulates the growth of GDP and via the demand side (i.e. consumption and investment) other sectors are also economically stimulated. The drawback of the second approach is that it lacks the interaction between the sectors as well as the second round effects, while it is able to describe the competition between different technologies and the structural change within a sector that is driven by the diffusion of new technologies.
The reason for linking top-down and bottom-up models is to overcome the individual drawbacks. The linked top-down model is able to consider technological details in the macro-economic analysis, while the bottom-up models receive the feedbacks from the other sectors and the second round effects from the macro-economy. Thus for our work package M1 it was decided to develop the linkage between a top-down model (i.e. ASTRA) and a number of bottom-up models (i.e. EFISCEN, MATEFF, RESIDENT, SERVE, ISIndustry, PowerAce, EuroMM).
3.1.2 Integration of models to form the ADAM-HMS
Figure 3-1 presents an overview of the ADAM-HMS and the linkages that have been developed between the models. The purpose of the different models in the ADAM-HMS is the following:
• POLES: world energy system model that delivers energy prices aligned with global energy demand as well as a GHG emissions path for Europe aligned with global mitigation activities, and a parallel bottom-up approach to the ADAM-HMS.
• ASTRA: EU structural economic model that calcluates the macro-economic effects of climate policy (top-down model applied in the ADAM-HMS).
• RESIDENT: bottom-up model describing the energy demand of the household sector for all purposes linked to housing (heating, electricity, etc.). Integrates the RESAppliance model.

ADAM 2-degree scenario for Europe – policies and impacts
- 21 -
• SERVE: bottom-up model describing the energy demand of the service sectors for all purposes besides transport (heating, electricity, etc.).
• ISIndustry: bottom-up model estimating the energy demand of basic industries and the manufacturing sectors.
• ASTRA-Transport: bottom-up model calculating the energy demand of the transport sector. Is directly integrated into the ASTRA model and thus the connection to ASTRA-Economics differs compared with the other bottom-up models.
• PowerAce: bottom-up model describing the market diffusion of renewables into the energy markets, in particular for electricity.
• EuroMM: bottom-up model modelling the full energy sector integrating the inputs of all final energy sector models.
• EFISCEN: forest model estimating the biomass potentials of EU forestry and providing them to PowerAce i.e. no full integration into the feedback loops of ADAM-HMS.
• MATEFF: basic materials and material efficiency model providing savings potentials of materials to the other models, in particular to ISIindustry. Not fully integrated into the feedback loops of ADAM-HMS.
• Virtual model server (VMS): is a tool that simplifies, structures and semi-automates the multilateral data exchange between various models.
Figure 3-1 presents a number of data flows between the models. These consist of three major types of information: energy demand, energy prices and economic variables. The core of the exchange of data between the bottom-up models consists of the estimated energy demand by the different sectors (black dotted arrows), which is provided to PowerAce and EuroMM from the final energy sectors: residential, services, industry and transport. In turn EuroMM calculates a new mix of power plants and a new electricity price using the world energy prices of POLES. The new electricity price is fed back to the final energy models (red dotted arrows).
The second major group of exchange data concerns the economic variables. These are needed to close the feedback loop between the bottom-up models and the top-down models (blue solid arrows). In the direction from top-down to bottom-up models the data to be transferred concerns mainly the drivers shaping the demand in the bottom-up models. Such drivers would be the GDP or income, the population, the trade flows, the sectoral output and the sectoral employment. In the direction from bottom-up to top-down models the data consists of investments that are induced by the mitigation policy as well as the avoided investment (e.g. reduced investment in coal power plants), changes of energy cost and/or energy expenditures in the different sectors, the reductions of imports of fossil energy, the prices and/or

Methodological issues
- 22 -
expenditures for CO2 (or carbon). The interface via which the data is exchanged is the Virtual Model Server (see section 3.2.1).
Top-down models =
Macro-economic
models
Interface
Bottom-up
models =
Sectoral process
oriented
Technology
models
Global models
POLESWorld energy
system
⇒EU cap ofGHG emissions
⇒ World / EU energy prices
Energy demandEconomic variables
Virtual model server
(VMS)
EuroMMEnergy system
IMPULSEinvestment, cost change, energy/CO2 expenditure
TRANSFORMGPD change, changeof
sectoral output
ASTRA
EU structural economic model
ASTRATransport system
ISIndustryIndustry sector
PowerAceRenewables
SERVEService sector
RESIDENTHouseholds
MATEFFEFISCEN
ADAM-HMS
Electricity price
POLES
EU energysystem
Parallel bottom-up approach to
ADAM-HMS
Source: ADAM M1, Fraunhofer-ISI
Figure 3-1: ADAM hybrid model system, POLES parallel approach and global
framework
Three issues usually have to be solved when linking or integrating separate models into a model system: (1) common boundary conditions for joint input variables, (2) overlaps between different models, and (3) in-/output relations between the models.
The common boundary conditions were defined by the ADAM work package Scenarios before the start of the simulations with the ADAM-HMS. The boundary conditions include the scenario set-up, population, GDP and energy prices as described in section 2. Such a common framework is simple to integrate for those models that use these variables as exogenous input. They mainly need to replace their exogenous input to fit to the common framework. Other models that endogenously calculate part of these variables have to be re-calibrated. Usually they would not be able to reproduce exactly the same development as given by the common framework. For instance this would be the case for the ASTRA model and its adaptation to the ADAM GDP trend.
In case of overlaps between the models either all models are calibrated to the same development, or one model is defined as the leading model that provides the results for the overlapping part and the other models have to comply as closely as possible to these results. The number of overlaps has been very limited in the ADAM-HMS, because the selection of models was made such that specialised sectoral models were chosen that would not overlap.

ADAM 2-degree scenario for Europe – policies and impacts
- 23 -
The main overlap was between PowerAce and EuroMM for the renewable energy, for which PowerAce was used as the leading model.
In-/output relations exist when model A calculates a variable as output, which is exogenous in model B such that model B can easily include the output of model A as new exogenous input and on this basis model B would then produce new results.
3.1.3 Brief description of the single models
The following paragraphs briefly describe the purpose and approach of each model. Detailed descriptions of all models have been provided in our deliverable D1 [Jochem et al. 2007].
3.1.3.1 ASTRA macro-economic model
ASTRA is a strategic integrated assessment model that includes a core macro-economic model, a trade model and a population model for the EU27+2 countries. The model builds on recursive simulations following the system dynamics concept and enables to run scenarios until 2050. The economic model applies different theoretical concepts e.g. endogenous growth by linking total factor productivity to investments, neo-classical production functions that consider capital, labor and the total factor productivity, Keynesian consumption driven and export driven investment functions. The macro-economic model consists of five elements: supply side, demand side, an input-output model based on 25 economic sectors, employment model and government model [Schade 2005].
3.1.3.2 RESIDENT model
RESIDENT-E06 is a bottom-up simulation model for the determination of long-term final energy demand for heating and hot water in the residential sector. The heating part is based on floor area, specific heat demand, and efficiency of heating system. The buildings are divided into two types (single family and multifamily house-holds), and three age classes (old, intermediate, new). For every such building (6 combinations), there is a specific heat demand which includes some retrofitting. The share of energy carriers (with yearly substitution factors) and the mean efficiency is only divided in the two types (single and multifamily).
The hot water part simulates the residential demand of hot water starting from the number of people and the specific demand of hot water (litre per person). The final energy (for different fuels) is then calculated with assumptions about share of final energies and using the efficiency of the different heating systems. The model applies the cohort methodology to describe the development of houses and technologies over time. It is implemented in Excel.
As add-on to RESIDENT the RESAppliance model calculates the energy demand of the most relevant household appliances by specific diffusion rates (number of appliances per household) and specific annual energy consumption values per appliances. The latter develop over time, both in the mitigation scenarios and the reference scenario.

Methodological issues
- 24 -
3.1.3.3 SERVE model
SERVE-E06 is CEPE’s energy demand model for the service sectors of the European countries. It is based on SERVE that was developed in the 1990s and has been used by CEPE on behalf of the Swiss Federal Office of Energy (SFOE) for the elaboration of new energy demand scenarios for Switzerland. Detailed accounts can be found in [Aebischer et al. 1996, Aebischer 1999, Aebischer et al., 2006].
SERVE is a bottom up simulation model implemented in Excel, that calculates the medium- and long-term final energy demand. A key feature of the model is to apply cohort models that depict the development of drivers and technological parameters over time. Within the ADAM project, it was further developed and applied to Europe (EU27 plus Norway, Switzerland), incorporating data and features from models and databases such as ODYSSEE, MURE, POLES, and others.
3.1.3.4 ISIndustry model
The model ISIndustry belongs to the class of energy system or bottom-up models, which means the calculation is based on technological information about distinct conservation options and industrial processes. Two different kinds of technology groups are considered, process-specific technologies and cross-cutting technologies. Blast furnaces in steel making are one example for the former; these are sector- and even process-specific. In contrast, cross-cutting technologies are widespread over very different industrial sectors. Examples are electric motors or lighting equipment, which are applied throughout all industrial sectors.
For process-specific technologies, the main driver is the projection of physical production (e.g. tonnes of crude steel from blast furnaces). The 40 most energy- and greenhouse gas-intensive processes are considered separately in the model. For each of these processes, the specific energy consumption/GHG emissions and the physical production output per country are model parameters.
Although cross-cutting technologies are usually smaller, there are huge numbers involved due to their widespread application and so they are responsible for a huge share of industrial electricity consumption. Electric motors and lighting account for more than 70% of industrial electricity consumption. They are implemented in the model as a share of the total sector’s electricity consumption and their main driver is the projected development of value added per industrial sector.
The technological detail of the model allows the simulation long-term industrial energy demand based on distinct technological energy efficiency options, allowing for the main economic trends.

ADAM 2-degree scenario for Europe – policies and impacts
- 25 -
3.1.3.5 ASTRA transport model
The integrated assessment model ASTRA incorporates its own bottom-up transport model consisiting of two classical 4-stage transport models for passenger and freight transport, vehicle fleet models, transport energy and emission models. The advantage of the ASTRA transport model is that although it is implemented as classical 4-stage model, it considers endogenous reactions on all stages i.e. there is no fixed generation and no fixed OD matrix. The vehicle fleet models include a discrete choice component to decide on the chosen engine technology and car size depending on the parameters of the vehicles and the socio-economic drivers. Development of technologies and ageing of vehicles is based on cohort models.
Due to the integration with the economic models of ASTRA the changes in the economic system immediately feed into changes of the transport behaviour and alter origins, destinations and volumes of European transport flows. The ASTRA model has been applied in various transport policy studies (e.g. pricing, infrastructure, integrated policy programmes), climate policy analysis in general and in the transport sector [e.g. Krail et al. 2007].
3.1.3.6 PowerAce-ResInvest model
The agent-based sector model PowerACE-ResInvest simulates the future development of energy conversion technologies using renewable energy sources (RES) in the electricity sector. Capacity expansion decisions of RES-technologies are modelled from an investor's perspective. The corresponding investment decisions are mainly driven by the heterogeneous techno-economic characteristics of RES on the one hand and on available financial support for RES-technologies on the other hand. In turn, techno-economic characteristics are represented by cost-resource-curves, describing a combination of the available resource potential and the corresponding electricity generation costs. To cite an example, detailed cost-resource-curves have been derived combining land availability and wind regimes in a geographical information system for wind onshore energy. Technology options are integrated dynamically into the model taking into account future cost developments of RES-technologies in terms of experience curves.
3.1.3.7 EuroMM model
The European Multi-regional MARKAL (EuroMM) energy-conversion model is a bottom-up, perfect-foresight optimization model. EuroMM is part of the MARKAL (MARKet ALlocation) family of models that is typically used to determine the least-cost energy system configuration over a given time horizon under a set of assumptions about technologies, resource potentials and demands [Fishbone et al. 1983, Loulou et al. 2004].
EuroMM provides a detailed representation of technologies in the electricity and heat production and fuel conversion sectors in Europe, including carbon capture and storage (CCS) and thermal power plant cooling system technologies, along with trade networks for energy

Methodological issues
- 26 -
carriers. The model represents 18 distinct regions covering the 27 EU member states plus Norway and Switzerland, and is calibrated to 2005 statistics with a time horizon up to 2050 [see also Jochem et al., 2007].
The EuroMM energy-conversion model is used to compute impacts of climate change on the energy conversion sector as well as to analyze policy instruments, such as carbon taxes or emission targets and their related effects.
Limitations: EuroMM relies on uncertain assumptions regarding future potential technology deployment rates and exogenous technological learning. The model uses the perfect foresight optimisation approach assuming perfect information and limited transaction costs. Furthermore, EuroMM only partly identifies the impacts from climate change and the necessary adaptation needs since it lacks a representation of detailed spatial impacts and extreme events.
3.1.3.8 EFISCEN model
Forestry projections for a base case scenario were produced using the European Forest Information SCENario model (EFISCEN). EFISCEN can be used to give projections of wood production and carbon stock changes in tree biomass in European forests down to the forest type and NUTS2 level [Pussinen et al. 2001, Nabuurs et al. 2007, Schelhaas et al. 2007]. EFISCEN consists of a whole tree biomass module, a soil module and a wood products module. Projections made with EFISCEN are initialised making use of detailed national forest inventories that were specifically gathered for this purpose from National forest inventory institutes.
For each country, projections are made by forest types. Forest types are distinguished by four characteristics, the tree species, the site quality, the region where the forest is situated (mostly NUTS2 regions) and the owner of the forest. Information from EFISCEN can be aggregated to any level. For this analysis, data was aggregated on a country level. We provide projections on wood available for the paper and conventional wood industry and wood available for bio-energy.
EFISCEN is an area-based matrix model that simulates the dynamics of the stemwood volume in a forest [Schelhaas et al. 2007]. For other tree organs as leaves, branches and roots, a detailed biomass expansion database is incorporated. For each forest type that is distinguished in the input data (which might be according to species, region, site class and owner), a separate matrix is set up. One matrix consists of 60 age classes of 5 year time steps and 10 volume classes with time steps that vary depending on the forest under study.
Aging of the forest is simulated by moving area to a higher age class, while growth is simulated by moving the area to a higher volume class. Transitions are derived from

ADAM 2-degree scenario for Europe – policies and impacts
- 27 -
increment figures from the input data, or from growth and yield tables. These transitions can be changed over time to simulate changes in growing conditions, like climate change.
3.1.3.9 MATEFF model
The MATEFF model simulates energy-intensive materials and products. MATEFF allows for the idea that energy-intensive materials can be reduced in their specific weight, but still perform their function in given products and investment goods by improved design or material properties. MATEFF also covers material recycling and material re-use as well as material substitution including materials made out of biomass. The materials covered by the model are all energy-intensive materials covered by the industrial model ISINDUSTRY and also at the same country level of the European countries.
MATEFF is based on economic and demographic data from the macroeconomic E3ME model of Cambridge Econometrics (up to 2030) and the ASTRA model from the Fraunhofer Institute of Systems and Innovation Research, ISI (from 2030 to 2050). The wood potential from forests is taken from results of the EFISCEN model of University of Wageningen.
As an important driver of energy demand in industry, the production of energy-intensive products and materials is quite important. The development of these energy-intensive products is often not easy to relate to the economic production value when value added of these basic materials increases substantially over time; this is often the case due to quality improvements or additional services of the related industrial sector and not to the quantities produced. It is important, therefore, to relate the specific energy demand of those materials to their physical production and not to gross or net production values.
3.1.3.10 POLES model
POLES – Prospective Outlook for Long term Energy Systems model - provides a complete system for the simulation and economic analysis of the sectoral impacts of climate change mitigation strategies. The POLES model is a dynamic Partial Equilibrium Model, essentially designed for the energy sector but also including other GHG emitting activities, with the 6 GHG of the “Kyoto basket”. The simulation process is dynamic, in a year by year recursive approach that allows describing full development pathways from 2005 to 2050.
The use of the POLES model combines a high degree of detail on the key components of the energy systems and a strong economic consistency, as all changes in these key components are at least partly determined by relative price changes at sectoral level. As the model identifies 46 regions of the world, with 22 energy demand sectors and about 40 energy technologies – now including generic Very Low Energy end-use technologies – the description of climate policy induced changes can be quite extensive.

Methodological issues
- 28 -
As far as induced technological change is concerned, the model provides dynamic cumulative processes through the incorporation of Two Factor Learning Curves, which combine the impacts of “learning by doing” and “learning by searching” on the technologies’ improvement dynamics. As price induced diffusion mechanism (such as feed-in tariffs) can also be included in the simulations, the model allows for a taking into account of the key drivers to the future development of new energy technologies.
One key aspect of the analysis of energy technology development with the POLES model is indeed that it relies in all cases on a framework of permanent inter-technology competition, with dynamically changing attributes for each technology. In parallel, the expected cost and performance data for each key technology are gathered and examined in the /Techs-DB/ database that is developed at LEPII-EPE for any modelling and policy-making purpose.
Finally one can emphasise the fact that, although the model does not provide the total indirect macro-economic costs of mitigation scenarios, it can produce reliable economic assessments that are principally based on the costs of developing low or zero carbon technologies, thus benefiting from a detailed engineering representation.
Developed under different EU research programmes (JOULE, FP5, FP6), the model is fully operational since 1997. It has been used for policy analyses by EU-DG Research, DG Environment and DG TREN, as well as by the French Ministry of Ecology and Ministry of Industry
3.2 Data exchange system
Managing and automating the exchange of data between the models was a major challenge within the ADAM M1 project, since 7 to 9 models covering different fields of specialisation were exchanging data. This exchange had to be done repeatedly, resulting in iterations of model simulations in order to achieve convergence, harmonise the model’s assumptions and generate consistent results. Manual transformation of the repeatedly exchanged huge amounts of data would have been highly repetitious work, which naturally is extremely error-prone and time consuming.
Therefore, a configurable software – the Virtual Model Server (VMS) – was developed for the data exchange and used as described in the two subsequent sections and in more detail in Annex 16.1. The full documentation is provided in [Helfrich/Reusch 2009].
3.2.1 Virtual Model Server – automated data exchange
The virtual model server – VMS – was developed by Fraunhofer-ISI in order to automate complex data transformations when passing data from one model to another and to manage sequences of transformation steps for running models in series, each model using the output of its predecessor as input. With this software the iteration of model simulations is also

ADAM 2-degree scenario for Europe – policies and impacts
- 29 -
possible, i.e. a sequence of simulations in which the starting model eventually receives data from another model calculated based on the first models results. This is depicted as an abstract example in Figure 3-2. Here, models 1 and 2 start the iteration and send their resulting data to the VMS. The server transforms the data into the format needed by models 3 and 4, each receiving different input formats and different subsets of the data provided by models 1 and 2. Then, models 3 and 4 can run their simulations and send their results to the VMS, for the compilation of input for the next models in the sequence, in our example models 1 and 2, which started the sequence. These two can then calculate again and continue the simulation loop.
Source: Fraunhofer-ISI
Figure 3-2: Virtual Model Server – abstract data flow
3.2.1.1 Technical details
The VMS was developed purely in Java as a web application for the Tomcat Application Server with a MySQL database as data storage backend, all following the open source philosophy. It builds on a variety of open source libraries for various functionalities. Most importantly, it uses Hibernate along with Spring for persistent data.
3.2.1.2 Design philosophy
The development of the software was driven by the idea of creating a highly configurable tool, which should not be specific to certain interfacing and transformation tasks. This design enables the adoption of model output transformation definitions without changing neither the source code of the source model nor of the target model. All transformations are defined using an XML subset specificallydeveloped for this purpose. With this design philosophy, we managed to create a highly reusable tool as it is possible to integrate new models into the data

Methodological issues
- 30 -
exchange. Thus the VMS enormously facilitates the data transformation tasks when integrating two or more models into an interacting hybrid model system.
3.2.1.3 Functionality
For defining the transformations, three major parts are necessary. First, for each model all relevant input attributes have to be defined. This is done in the model definition. Second, the data transformations have to be defined on a variable by variable basis, describing for each input variable of the subsequent model in the iteration sequence how it is composed of the output variables of the preceding models. This is the transformation definition. And third, the sequence of transformations has to be defined in the sequence definition. The latter is important when the sequence of running the models plays a role for generatimg results, which is most often the case.
Model definition
For each model, a definition file is compiled containing the following information:
• Variables and the dimensions they are defined on,
• Dimensions e.g. indexes for countries or economic sectors,
• Timeframe and time intervals as the models run on different time intervals, and
• File format used for transferring data.
Transformation definition
The core functionality of the VMS is the ability to transform data that has to be exchanged between two models in an automated way. Therefore, a definition language was developed in order to describe the transformations based on XML. VMS features the following operations:
• Basic arithmetic operations: addition, subtraction, multiplication, division.
• Dimension mapping, i.e. the definition of how one dimension of model A refers to a related but differently named or aggregated dimension of model B.
• Aggregating dimensions, i.e. reducing two- or mutli-dimensional variable to a lower number of dimensions.
• Splitting dimensions, i.e. the inverse operation of the aggregation, producing e.g. a two-dimensional variable based on a one-dimensional variable with fixed split factors for the elements of the new dimension.
• Intermediate variables for calculating various steps with the VMS, where the output of one calculation is the input for the next calculation.
• Index calculation, i.e. the ability to calculate an index on a given base year of a variable.

ADAM 2-degree scenario for Europe – policies and impacts
- 31 -
• Temporal interpolation, i.e. filling years not covered by the output of model A but needed in the subsequent model B. This is done as linear interpolation.
Sequence definition
Eventually, the order in which
• the individual models calculate results,
• deliver the results to the VMS,
• the VMS transfers these results and hands them over to the next model
has to be defined. This is done in the sequence definition, which is stored in another set-up file.
3.2.2 Data flow between models
Using the Virtual Model Server described in the previous section, a large amount of data was exchanged between the various models collaborating during the project. The details about which data was exchanged in what sequence is described in this section. Table 3-1 gives a high level overview of which data is exchanged by the individual models. As can be seen there, PowerACE delivers data to EuroMM and ASTRA. ISIndustry provides data to PowerACE, EuroMM and ASTRA. CEPE models hand over data to PowerACE, EuroMM and ASTRA. From EuroMM, data is transferred to PowerACE, CEPE models and ASTRA. From ASTRA, data is carried over to PowerACE, ISIndustry, CEPE models and EuroMM. Most data is provided as yearly figures, with the exceptions of EuroMM data, which is provided (or required) as 5 year aggregates or data for every 5th year. The details of which data is transferred between the models for each direct bilateral link are explained in Annex 16.1.
Table 3-1: Data flow between models – high level overview
to Power ACE ISIndustry CEPE models EuroMM ASTRA
from Power ACE ISIndustry CEPE models EuroMM ASTRA
Source: Fraunhofer-ISI, CEPE models: RESIDENT, SERVE, RESAppliance
Two examples of data flows are given in the following paragraphs. The full list of flows is provided in Annex 16.1.

Methodological issues
- 32 -
• Example 1: EuroMM provides the CEPE models with prices for electricity. These are provided per country both as separate electricity prices for industry as well as for households. Since the two models use different country groups, a mapping from the countries of EuroMM to the countries of the CEPE models had to be defined. Further, the currency had to be converted from US$ 2000 to Euro 2005.
• Example 2: ASTRA delivers value added and employment to the CEPE models. The data is disaggregated per country and per sector. Both countries and sectors are defined differently in the two models, therefore, mappings for both dimensions were developed. Both variables were delivered to CEPE as index variables with the value of 2004 as a base year.
3.3 Simulation and convergence of the models in ADAM-HMS
As explained above simulating the ADAM-HMS requires an iterative process that follows a pre-defined sequence in terms of at which part of the sequence a model receives input and when it has to deliver its output. During each iteration a model always receives the same input variables and delivers the same output variables, but in each iteration the values of these variables change. The question of convergence of the results of the various models then becomes: when the difference between the values of the variables within two subsequent iterations is small enough to decide that the models have converged and thus that their individual results are consistent?
Figure 3-3 presents the conceptual structure of the iterations for the three building blocks of the ADAM-HMS (top-down model, bottom-up final energy models and bottom-up aggregation model) and the major variables relevant for the analysis of convergence (GDP, energy demand and the CO2 price). An iteration now starts with GDP, provided from the scenario framework, and a CO2 price provided by the POLES model. Based on this information the final energy demand models generate energy demand, which is aggregated to total final energy demand in the bottom-up aggregation model (EuroMM) that simulates the technologies applied in the energy conversion sector and derives a new CO2 price. All bottom-up models deliver changes of energy cost and sectoral investments to the top-down model (ASTRA), which estimates a new GDP. With the new GDP and the new CO2 price the subsequent iteration starts generating a new energy demand and again new CO2 prices and GDP. Convergence is achieved when between two subsequent iterations GDP, CO2 price and energy demand does not change at all to within the specified tolerance.

ADAM 2-degree scenario for Europe – policies and impacts
- 33 -
Bottom-up aggregation
CO2 price
Bottom-up final energy
Top-down model
CO2 price
GDP
Energydemand
Energy costInvestment
Energy costInvestment
Top-down model: ASTRA
Bottom-up aggregation: EuroMM
Bottom-up final energy: othermodels
Variables to verify convergence ofmodels:
• GDP
• Final energy demand
• CO2 price (or carbon value)
Source: Fraunhofer-ISI
Figure 3-3: Convergence in the simulations of the ADAM-HMS
The three major variables to assess convergence display different sensitivities to the remaining differences between the models. GDP and energy demand converge rapidly i.e. in the first 3 to 4 iterations they incorporate most of the adaptations required to come to convergence. Later iterations change these only marginally. However, the CO2 price is much more sensitive (as also shown in section 12). The reason is that it is calculated on the base of the marginal cost concept in an optimisation model, which means that when scarcity occurs and the CO2 price shifts to the right hand side of the cost curve, the CO2 price change between two iterations occurs on the exponential part of the curve and thus minor changes of CO2 quantities lead to sharp price changes.

POLES model projections of adaptation and mitigation in Europe
- 34 -
4 The integrated global energy model POLES and its projections for the Reference and 2°C scenarios
Authors: Silvana Mima, Patrick Criqui
The development of a Reference scenario is essential for the overall consistency of the policy analysis. The Reference scenario aims to integrate the most up-to-date information and expectations about demographic growth, its regional distribution, major economic and technology trends (in GDP trends, sectoral allocation of production, technological progress, R&D investment) and availability of depletable resources. From this limited set of exogenous trends, the POLES model projects the relevant energy and environmental variables up to 2050.
The POLES Reference projection in the ADAM study provides an image of the energy scene up to 2050 resulting from the continuation of on-going trends and structural changes in the world economy. The model provides a tool for the simulation and economic analysis of world energy scenarios under environmental constraints. It is a partial equilibrium model, with a dynamic recursive simulation process. From the identification of the drivers and constraints in the energy system, the model allows us to describe the pathways for energy development, fuel supply, greenhouse gas emissions, international and end-user prices, from today until 2050.
The approach combines a high degree of detail in the key components of the energy systems with a strong economic consistency, as all changes in these key components are largely determined by relative price changes at sectoral level. The model identifies 47 regions of the world, with 22 energy demand sectors and about 40 energy technologies – now including generic “very low energy” end-use technologies.
The main exogenous inputs to the Reference projection relate to world population and economic growth as the main drivers of energy demand, oil and gas resources as critical constraints on supply, and the future costs and performance of energy technology that define the feasible and cost-effective solutions. In all cases, the projected trends extrapolate existing structural changes; this in no way implies a uniform development of the world economic and energy system, as illustrated below.
An important aspect of the projections performed with the POLES model is that they rely on a framework of permanent inter-technology competition, with dynamically changing attributes. The expected cost and performance data for each key technology are gathered and examined in a customised database that organises and standardises the information in a manner appropriate to the task.

ADAM 2-degree scenario for Europe – policies and impacts
- 35 -
Finally, in the ADAM Reference case, for the first time the impacts of climate change on the energy system in the cases of building heating and cooling are introduced as endogenous variables in the model. Analyses of the corresponding consequences of climate change are thus presented as well.
Two 2°C scenarios, one corresponding to 450 and another to 400 ppm are analysed in section 4.2. Each scenario can be described as the set of economically consistent transformations of the initial Reference case that is induced by the introduction of policy constraints. Although the model does not calculate the indirect macro-economic impacts of mitigation scenarios, it does produce robust economic assessments based on the sectoral costs of implementing new technologies, which benefit from a rigorous examination of the engineering and scientific fundamentals.
4.1 Assumptions and methods of the Reference Scenario
4.1.1 Major assumptions
4.1.1.1 Population and economic growth in ADAM projections
By 2050, world population will stabilise at 9 billion people. In this study, GDP is expected to be multiplied by a factor of 4 to 2050. This means that the world economy is projected to grow at 3.6 %/year until 2025 and then to slow down to an average of 3 %/year between 2000 and 2050. The slower growth in the second part of the period is the combined consequence of a falling population growth rate – or even a decrease in some regions – and of lower per capita GDP growth, in all regions except the Middle East and Africa (see Table 4-1 and Table
4-2 below).
Table 4-1: World population and economic growth in ADAM projections
Annual % change 2000 2025 2050 2025/00 2050/00Key Indicators Population (Millions) 6078 7896 9066 1.1% 0.8% GDP (G$05) 40903 100157 181215 3.6% 3.0% Per capita GDP ($05/cap) 6729 12684 19988 2.6% 2.2%
Source: POLES ADAM
The rate of future economic growth is broadly similar across industrialised regions; it is around 2.3 %/year from 2000 to 2025 and falls to 1.5 %/year from 2025 to 2050. As illustrated in Figure 1, economic growth is faster in developing regions: it is between 3 and 4 %/year in Africa and the Middle East over the period and a little less in Latin America; in Asia it falls steeply from the current 6.7-4.6 %/year to 3 %/year between 2025 and 2050. This largely reflects the end of the rapid catching-up process currently experienced by Asian

POLES model projections of adaptation and mitigation in Europe
- 36 -
economies and the economic slowdown consequent to the rapid ageing of the population in China. European GDP grows on average by around 1.9 %/year throughout the period. This growth rate is slightly higher than that of Canada and Japan-Pacific (+1.8 %/year), but it remains lower than the growth rate of USA (2 %/year).
Source: POLES ADAM
Figure 4-1: Economic growth, world and main regions
National growth rates vary substantially in Europe, particularly during the 2000/20 period from 1.8 %/year for Italy and Germany to 4.9 %/year for the Baltic countries. During the second half of the period, the growth rates converge to around 0.8-1.6 %/yr.
0.0%
1.0%
2.0%
3.0%
4.0%
5.0%
6.0%
7.0%
WORLD
EUROPEUSA
CAN
JAP. P
ACIFIC CIS
CHNNDE
RASIABRA
RLAMAFR
MIEA
2025/002050/25
0
5 000
10 000
15 000
20 000
25 000
30 000
35 000
40 000
45 000
50 000
EUROPEUSA
CAN
JAP. P
ACIFIC CIS
CHNNDE
RASIABRA
RLAMAFR
MIEA
G$0
5
200020252050

ADAM 2-degree scenario for Europe – policies and impacts
- 37 -
Table 4-2: Europe, EU27+Nor+Switz – GDP (in G$2005) Annual % change
2000 2010 2020 2030 2050 2020/00 50/20 50/00Austria 206 245 300 344 400 1.9% 1.0% 1.3%Baltic States 57 109 149 183 244 4.9% 1.7% 3.0%Belgium & Luxemburg 269 330 406 483 624 2.1% 1.4% 1.7%Bulgaria 47 73 94 116 168 3.6% 2.0% 2.6%Cyprus, Malta and Slovenia 30 44 55 64 80 3.0% 1.3% 2.0%Czech Republic 129 194 242 294 401 3.2% 1.7% 2.3%Denmark 143 176 214 251 310 2.0% 1.3% 1.6%Finland 123 153 188 224 293 2.1% 1.5% 1.8%France 1392 1711 2124 2540 3345 2.1% 1.5% 1.8%Germany 1975 2327 2839 3262 3969 1.8% 1.1% 1.4%Greece 164 232 297 360 483 3.0% 1.6% 2.2%Hungary 115 163 203 249 353 2.9% 1.8% 2.3%Ireland 101 162 199 239 316 3.5% 1.6% 2.3%Italy 1337 1599 1909 2133 2389 1.8% 0.8% 1.2%Netherlands 396 469 592 704 889 2.0% 1.4% 1.6%Norway and Switzerland 146 179 225 269 339 2.2% 1.4% 1.7%Poland 356 508 682 887 1392 3.3% 2.4% 2.8%Portugal 160 185 233 274 349 1.9% 1.4% 1.6%Romania 118 192 258 331 514 4.0% 2.3% 3.0%Slovakia 56 88 116 147 219 3.7% 2.1% 2.8%Spain 738 954 1220 1455 1850 2.5% 1.4% 1.9%Sweden 204 266 328 386 498 2.4% 1.4% 1.8%United Kingdom 1352 1714 2123 2555 3460 2.3% 1.6% 1.9%Rceu 82 125 173 229 371 3.8% 2.6% 3.1%EU27+Nor+Switz 9613 12073 14995 17751 22885 2.2% 1.4% 1.7%Europe 9695 12198 15168 17980 23256 2.3% 1.4% 1.8%B4 6056 7351 8995 10490 13163 2.0% 1.3% 1.6%SE 1093 1416 1806 2154 2763 2.5% 1.4% 1.9%NE 1381 1735 2151 2557 3270 2.2% 1.4% 1.7%EE 1165 1697 2217 2780 4060 3.3% 2.0% 2.5% Source: POLES ADAM3
Regional variations in the trends of economic growth worldwide are derived in part from the underlying population dynamics, as shown in Figure 2. By 2025, the growth in population is negative in Europe, the Pacific OECD, the CIS and China. North and Latin America and Asia have low positive growth rates. After 2025, Africa and the Middle East are the only regions where growth exceeds 1 %/year.
3 Note: the EU27 countries are divided into four main economic/geographical areas : the Big Four – B4 (Germany, Italy, France,the United Kingdom), Southern Europe - SE (Spain, Portugal, Greece, Cyprus, Malta & Slovenia), Northern Europe – NE (Belgium & Luxembourg, Denmark, Finland , Ireland, the Netherlands, Sweden, Norway and Switzerland), Eastern Europe – EE (Austria, Baltic States, Bulgaria, Czech Republic, Hungary, Poland, Romania, Slovakia).

POLES model projections of adaptation and mitigation in Europe
- 38 -
-0.5%
0.0%
0.5%
1.0%
1.5%
2.0%
2.5%
WORLD EUROPE USA CAN JAP.PACIFIC
CIS CHN NDE RASIA BRA RLAM AFR MIEA
2025/00
2050/25
0
200
400
600
800
1 000
1 200
1 400
1 600
1 800
2 000
EUROPEUSA
CAN
JAP. P
ACIFIC CIS
CHNNDE
RASIABRA
RLAMAFR
MIEA
Mill
ions
200020252050
Source: POLES REF ADAM
Figure 4-2: Population growth, world and main regions
The biggest changes concern Eastern Europe, with an acceleration of the population decrease after 2010 (Table 4-3).
Table 4-3: Europe, EU27+Nor+Switz, 4 areas – Population Annual % change
2000 2010 2020 2030 2050 2020/00 50/20 50/00Austria 8 8 8 8 8 0.1% -0.1% 0.0%Baltic States 7 7 7 6 5 -0.4% -0.7% -0.6%Belgium & Luxemburg 11 11 11 11 11 0.2% 0.0% 0.1%Bulgaria 8 7 7 6 5 -0.8% -1.0% -0.9%Cyprus, Malta and Slovenia 3 3 3 3 3 0.3% -0.1% 0.1%Czech Republic 10 10 10 10 8 -0.2% -0.5% -0.4%Denmark 5 6 6 6 6 0.3% 0.1% 0.2%Finland 5 5 5 5 5 0.2% 0.0% 0.1%France 59 62 63 64 63 0.3% 0.0% 0.1%Germany 82 83 82 82 79 0.0% -0.1% -0.1%Greece 11 11 11 11 11 0.1% -0.1% 0.0%Hungary 10 10 10 9 8 -0.3% -0.5% -0.4%Ireland 4 4 5 5 6 1.3% 0.5% 0.8%Italy 58 58 57 55 51 -0.1% -0.4% -0.3%Netherlands 16 17 17 17 17 0.3% 0.0% 0.2%Norway and Switzerland 12 12 13 13 13 0.3% 0.1% 0.2%Poland 39 38 38 36 32 -0.1% -0.6% -0.4%Portugal 10 11 11 11 11 0.3% -0.1% 0.1%Romania 22 21 20 19 17 -0.4% -0.7% -0.6%Slovakia 5 5 5 5 5 0.0% -0.5% -0.3%Spain 41 44 44 44 43 0.4% -0.1% 0.1%Sweden 9 9 9 10 10 0.3% 0.2% 0.2%United Kingdom 59 61 63 65 67 0.3% 0.2% 0.3%Rceu 24 24 24 23 22 0.0% -0.3% -0.2%EU27+Nor+Switz 495 505 506 503 484 0.1% -0.1% 0.0%Europe 519 529 530 527 506 0.1% -0.2% -0.1%B4 258 263 265 266 260 0.1% -0.1% 0.0%SE 65 69 70 69 67 0.4% -0.1% 0.1%NE 62 64 66 68 68 0.3% 0.1% 0.2%EE 134 132 129 124 110 -0.2% -0.5% -0.4% Source: POLES ADAM
The second key driver of economic growth is the growth in per capita GDP that increases the mobilisation of labour and global productivity in the long term. The average growth rate in per capita GDP slowly decreases worldwide over the period and this is consistent with studies of long-term economic growth, which point to a secular trend of 1.5-2 %/year for average productivity growth. As shown in Table 2, the slowdown in per capita GDP growth is most

ADAM 2-degree scenario for Europe – policies and impacts
- 39 -
noticeable in North America (although per capita GDP still increases up to $62,000/inhabitant in North America, thus remaining the highest throughout the period) and in Asia, where per capita GDP growth is more than halved, from the present impressive 3.2-6.1 %/year.
This pattern of economic and demographic growth mitigates the inequalities in income across the world in the long run. In spite of the drastic decrease in growth rates, China’s per capita GDP catches up with that of Western Europe by the end of the century. Africa remains the most backward region; by 2050, its per capita GDP is 6 % of that of the USA. In 2050, the average per capita income in all developing regions except Africa is more than € 12 000.
The per capita GDP of the Europe increases 2.2 % each year, reaching two times and a half the current level at the end of the period.
Table 4-4: Per capita GDP, by world region ($2005/year PPP)
Annual % change2000 2025 2050 2025/00 2050/25 2050/00
WORLD 6 729 12 684 19 988 2.6% 1.8% 2.2%EUROPE 17 160 28 612 42 033 2.1% 1.6% 1.8%USA 32 018 47 484 62 801 1.6% 1.1% 1.4%CAN 26 003 36 831 45 012 1.4% 0.8% 1.1%JAP. PACIFIC 20 820 35 624 52 108 2.2% 1.5% 1.9%CIS 4 775 13 883 23 828 4.4% 2.2% 3.3%CHN 3 499 15 501 33 166 6.1% 3.1% 4.6%NDE 2 220 6 721 13 671 4.5% 2.9% 3.7%RASIA 3 002 6 595 12 192 3.2% 2.5% 2.8%BRA 6 542 9 984 16 115 1.7% 1.9% 1.8%RLAM 6 115 9 237 14 757 1.7% 1.9% 1.8%AFR 1 957 2 731 3 993 1.3% 1.5% 1.4%MIEA 5 923 9 450 17 962 1.9% 2.6% 2.2%
Source: POLES ADAM
4.1.1.2 World fossil fuel resources
The assumptions about oil and gas resources are critical because present market behaviour and a series of studies on resource availability suggest that the development of supplies to meet future increases in demand may face increasing difficulties. Any energy outlook for the long term has to deal with the expectation of an “oil peak” and a “gas peak”, the date of which remains uncertain, but which some geologists expect soon. The consequent increase in prices may profoundly influence the development of competing energy technologies and reshape the future energy system at the world level. The POLES model provides a high level of detail for the evaluation of oil and gas resources and reserves, while all assumptions concerning ultimate recoverable resources (URS), discoveries, reserves and cumulative production and recovery rates have been reviewed by the Institut Français du Pétrole (IFP).

POLES model projections of adaptation and mitigation in Europe
- 40 -
Cumulative production of conventional oil today is around 835 Gbl. The assumption in the ADAM POLES study is that 1 820 Gbl remain to be produced with current recovery rates, of which almost 1 037 Gbl have been discovered.
0
500
1 000
1 500
2 000
2 500
3 000
3 500
4 000
4 500
2000 2010 2020 2030 2040 2050
Gbl
Cumulative Production URR Cumulative Discoveries
Oil Reserves
Conventional Oil Reserves - World
Source: POLES ADAM, Reference Scenario
Figure 4-3: Ultimate Recoverable Resources, cumulative discoveries and production
Figure 4-3 presents the results of the simulation of the discovery and production of oil. The volume of ultimately recoverable resources increases in the period because of improved recovery rates, while cumulative discoveries depend on the exploration effort. The dynamic process for the development of reserves is visible in the Figure, because reserves are the difference between total cumulative discoveries and cumulative production. This process of reserve development and extension explains how total ultimate recoverable resources estimated by the USGS are extended from 2 600 Gbl today to nearly 4 000 Gbl in 2050; this of course has a major influence on the supply and demand balance for oil to 2050.
4.1.1.3 The geo-political and climate policy context
Assuming there is no climate policy, the Reference scenario represents a case study where the investment and consumption decisions of the economic agents are not modified by environmental regulations. Some limited geopolitical constraints to world oil development are taken into account in this scenario. It adopts the view that recent developments in the oil market – with prices between $ 100 and 140/bl in 2008 – do not only reflect a conjunction of exceptionally high demand and limited supply, but also signal important and permanent changes in resource accessibility and market behaviour. There are no longer any significant

ADAM 2-degree scenario for Europe – policies and impacts
- 41 -
reserve margins of production capacity, suggesting that the tightness in supply will persist. This is not a consequence of insufficient reserves in the short term, but of restricted access for new developments and of growing scarcity in the longer term. Access is constrained in the crucial OPEC countries by inadequate investment in producing capacity and in non-OPEC countries by unexpected technical and political obstacles, with the CIS currently representing some exceptions.
The examination of the policies for oil development and foreign investment in the OPEC countries indicates that although there are still highly profitable opportunities, access is constrained in practice. The constant and significant increase in the oil production capacities of OPEC, which is needed to balance the world energy system in the next decades, will not be easy to achieve. This should even induce, in the medium term, stronger price volatility than the 2°C scenario exhibits. As a consequence, one can expect successive price shocks to limit demand and encourage alternative energy developments.
0
20
40
60
80
100
120
2000 2010 2020 2030 2040 2050
€05/
boe
OilGas (Asia)Gas (Europe)Gas (America)Coal (Asia)Coal (Europe)Coal (America)
International Prices - Reference Scenario
Source: POLES ADAM, Reference scenario
Figure 4-4: Prices of oil and gas in the Reference projection (€/bl)
However a full description of unstable price behaviour is hard to incorporate in a long-term model. However with the mechanisms of oil price formation included in the model, the Figure
4-4 illustrates the resulting trajectory of prices: the price of oil is expected to stabilise between 2008 and 2015 at a level of 50 €05/bl (i.e. approximately 70 $05/bl) and then increase again to more than 97 €/bl in 2050, as the resource constraints become tighter and tighter. This price level is needed, not so much to stimulate supply alternatives, which are in most cases already competitive, but to curb the trend in world oil demand, which would otherwise be clearly unsustainable.

POLES model projections of adaptation and mitigation in Europe
- 42 -
This trend in the prices of oil and gas creates a structural cost advantage for coal. Resources of coal are much larger than those of oil and gas; they are also more dispersed and often located in large consuming countries. Consequently, the absolute increase in coal prices, when expressed in terms of oil equivalent, is expected to be far less than for hydrocarbons. In the Mitigation projection, coal prices roughly double from the current level, which is similar to the relative change expected for oil; but in terms of oil equivalent the price of coal is still only 21 $/bl in 2050, creating a huge cost advantage compared to oil and gas.
4.1.2 Methods used to reflect the impact of climate change4
The objective of this work has been to assess changes in energy use for heating and air conditioning under climate change. For that, it has been necessary to adapt the existing demand equations while taking into account the available data on the fundamental drivers of energy demand for heating and air conditioning in residential and service sectors, in the framework of a world where the average temperature may increase by +3.7°C compared to pre-industrial ages.
4.1.2.1 Modelling the impacts of climate change on heating demand
First of all, we isolate the demand for heating from the demand for substitutable energy (heating, cooking and sanitary hot water) in the residential sector. So, final consumption for substitutable energy in residential sector (FCSENRES) is split into two parts: on the one hand, the demand that cannot be impacted by climate change (FCSENRESW) and on the other hand the demand that will be affected (FCSENRESH):
FCSENRES[ALLC] = FCSENRESW[ALLC] + FCSENRESH [ALLC]
Shares (SHRES) of the part of heating demand on the substitutable energy, computed from data found in the existing literature, helps to accomplish this separation:
FCSENRES[ALLC] = FCSENRES[ALLC] * SHRES[ALLC]
FCSENRESW[ALLC] = FCSENRES[ALLC] * (1-SHRES[ALLC])
In the second stage we estimate the climate change impact on the heating demand (FCSENRESHCC). For that, the main drivers are heating degree days (HDD) provided by Timer/IMAGE. These data correspond to the Reference scenario (771 ppmv in 2050a, +3.7°C since pre-industrial ages).
FCSENRESHCC[ALLC] = FCSENRES[ALLC] * SHRES[ALLC] *2002HDD
HDD ]ALLC[
4 This section has been written taking into account the work accomplished by Julien MOREL.

ADAM 2-degree scenario for Europe – policies and impacts
- 43 -
In this way, the new demand for substitutable energy taking into account the climate change is:
FCSENRESCC[ALLC] = FCSENRESW[ALLC] +FCSENRESHCC[ALLC]
The same methodology is used for the service sector.
• Data
The data for the base year 2002, for SHRES and SHSER, for each POLES region, are constructed using several sources such as Enerdata, Eurostat (2005) for temperature correction. Then a logarithmic regression is applied between SHRESH and HDD and GDP (assuming the equivalence between spatial and temporal regression):
SHRES[ALLC, T] = SHRES[ALLC, T-1] * (]T,ALLC[
]T,ALLC[
GDPPOPGDPPOP
1−) 06.0 *(
]T,ALLC[
]T,ALLC[
HDDHDD
1−) 58.1
(5)
SHSER[ALLC, T] = SHSER[ALLC, T-1] * (]T,ALLC[
]T,ALLC[
GDPPOPGDPPOP
1−) 02.0 *(
]T,ALLC[
]T,ALLC[
HDDHDD
1−) 47.1
Figure 4-5 shows the example of heating shares of substitutable energy in the residential and service sectors in “Big Four” EU countries.
0%
10%
20%
30%
40%
50%
60%
70%
80%
90%
100%
2000 2010 2020 2030 2040 2050
FRA
GER
GBR
ITA
Heating share of substituable energy in residential sector
0%
10%
20%
30%
40%
50%
60%
70%
80%
90%
100%
2000 2010 2020 2030 2040 2050
FRA
GER
GBR
ITA
Heating share of substituable energy in service sector
Source: POLES ADAM, Reference scenario
Figure 4-5: Heating shares of substitutable energy in residential and service sectors in Big
Four countries
5 The coefficient of determination is respectively 0.85 and 0.82 for the residential and service sector.

POLES model projections of adaptation and mitigation in Europe
- 44 -
4.1.2.2 Results
The increase in temperature clearly curtails the heating demand. A comparison of the heating demand in the residential sector, with and without climate change impacts, shows a gap which widens in time to -17 % by 2050 at world level and to -18 % for the EU27 level. This shrinkage of heating demand translates into a reduction of the substitutable energy demand by -5 % at world level and -11 % in the EU27+2 level by 2050. The results in the service sector are comparable.
0
10
20
30
40
50
60
70
80
90
100
2000 2010 2020 2030 2040 2050
EJ
FC subs. Energy
FC subs. Energy w ith CC
Heating
Heating w ith CC
World Final consumption of substituable energy and heating consumption in residential sector w/o and w climate change
-5%
-17 %
0
2 000
4 000
6 000
8 000
10 000
12 000
2000 2010 2020 2030 2040 2050
PJ
FC subs. Energy
FC subs. Energy w ith CC
HeatingHeating w ith CC
EU27+Nor+Switz consumption of substituable energy and heating consumption in residential sector w/o and w climate change
11%
18%
Source: POLES ADAM, Reference scenario
Figure 4-6: Final consumption of substitutable energy and heating consumption in the
residential sector without and with climate change
0
100
200
300
400
500
600
700
800
900
2000 2010 2020 2030 2040 2050
PJ
FC subs. Energy
FC subs. Energy with CC
Heating
Heating with CC
World Final consumption of substituable energy and heating consumption in service sector w/o and w climate change
-16 %
-11 %
0
20
40
60
80
100
120
140
160
180
2000 2010 2020 2030 2040 2050
PJ
FC subs. EnergyFC subs. Energy with CCHeatingHeating with CC
EU27+Nor+Switz Final consumption of substituable energy and heating consumption in service sector w/o and w climate change
Source: POLES ADAM, Reference scenario
Figure 4-7: Final consumption of substitutable energy and heating consumption in the
service sector without and with climate change
Some examples of the impact of climate change on the heating and substitutable consumption in the residential sector at country level are presented in the following figure.

ADAM 2-degree scenario for Europe – policies and impacts
- 45 -
0
500
1 000
1 500
2 000
2 500
2000 2010 2020 2030 2040 2050
PJ
FC subs. EnergyFC subs. Energy with CCHeatingHeating with CC
Final consumption of substituable energy and heating consumption in residential sector w/o and w climate change - France
0
500
1 000
1 500
2 000
2 500
2000 2010 2020 2030 2040 2050
PJ
FC subs. EnergyFC subs. Energy with CCHeatingHeating with CC
Final consumption of substituable energy and heating consumption in residential sector w/o and w climate change - Germany
0
500
1 000
1 500
2 000
2 500
2000 2010 2020 2030 2040 2050
PJ
FC subs. EnergyFC subs. Energy with CCHeatingHeating with CC
Final consumption of substituable energy and heating consumption in residential sector w/o and w climate change - United Kingdom
0
500
1 000
1 500
2 000
2 500
2000 2010 2020 2030 2040 2050
PJ
FC subs. EnergyFC subs. Energy with CCHeatingHeating with CC
Final consumption of substituable energy and heating consumption in residential sector w/o and w climate change - Italy
Source: POLES ADAM, Reference scenario
Figure 4-8: Final consumption of substitutable energy and heating consumption in the
residential sector without and with climate change
4.1.2.3 Modelling the impacts of climate change on cooling demand
The method proposed to model the impact of climate change on residential cooling demand is based on the paper by McNeil and Letschert. We model the impact in two steps, firstly modelling air conditioning installation rates and then modelling the average baseline unit energy consumption (UEC).
Step 1: Modelling air conditioning installation
The air-conditioning equipment rate (ACER) is the multiplication of the climate maximum saturation rate (CMAX) by the air-conditioning availability (AVRES). Climate maximum saturation depends on the cooling degree days (CDD). For example, for the USA the climate maximum saturation (CMAX) can be calculated with the following equation:
CMAX = 1 - 0.949 * CDD) * (-0.00187e

POLES model projections of adaptation and mitigation in Europe
- 46 -
Residential air conditioning availability (AVRES) is dependent on revenues following a logistic S-curve: AVRES = 1 / (1+ 3)(3.7761054e * GDPPOP)*0.22537608 (-e ) (6)
Then saturation is: ACER = CMAX * AVRES
Step 2: Modelling unit energy consumption of residential dwellings (by dwelling)
The air-conditioning unit energy consumption (ACUEC) depends on cooling degree days, but there is a significant dependence on income as well. The following equation was refitted with POLES data:
ACUEC=CDD*(a * ln(GDPPOP) + b)
The equation is proposed in the paper by Morna Isaac and Detlef Van Vuuren, which is derived from McNeil. The logarithm takes into account saturation for high income levels.
ACUEC(t) = ACUEC(t-1) * 1)-(t
(t)
CDDCDD
* ) b )ln(GDPPOP *(a
b) )ln(GDPPOP * (a
1)-(t
(t)
+
+
Where : a = 7.2651*10-0.8, b= 8.7398 * 10-0.5
Finally, the air conditioning electricity consumption with climate change impact (FCCELRESC) is calculated as production of climate maximum saturation (CMAX),
residential air conditioning availability (AVRES), the air-conditioning unit energy consumption (ACUEC) and the number of dwellings (DWL):
FCCELRESC[ALLC] = CMAX[ALLC] * AVRES[ALLC] * ACUEC[ALLC] * DWL[ALLC]
And the total captive electricity including the air conditioning:
FCCELRESTOT[ALLC] = FCCELRES[ALLC] - FCCELRESC[ALLC]2000 + FCCELRESC[ALLC]
4.1.2.4 Data
The cooling degree days (CDD) data come from Timer/IMAGE, for 2°C scenario (771 ppmv in 2050a, +3.7°C since pre-industrial ages). The air conditioner saturation data and the unit energy consumption data come from the paper by McNeil and Letschert. The GDP per capita and the dwellings come from POLES: GDPPOP, DWL.
6 Model refitted with POLES data. R2 = 0.66.

ADAM 2-degree scenario for Europe – policies and impacts
- 47 -
4.1.2.5 Results
0
200
400
600
800
1 000
1 200
2000 2010 2020 2030 2040 2050
PJ
Captive elec.with CCCaptive elec. wo CCAir cond.
World Final consumption of captive electricity and air conditionning in residential sector w/o and w climate change
0
10
20
30
40
50
60
70
80
90
2000 2010 2020 2030 2040 2050
PJ
Captive elec.with CCCaptive elec. wo CCAir cond.
EU27+Nor+Switz Final consumption of captive electricity and air conditionning in residential sector w/o and w climate change
Source: POLES ADAM, Reference scenario
Figure 4-9: World and EU27+NOR+SWITZ final consumption for captive electricity and
air conditioning in the residential sector
The net effect of climate change on global energy use and emissions is relatively small, as the increases in cooling are compensated for by the decreases in heating. However, impacts on heating and cooling individually are considerable in this scenario, with heating energy demand decreasing by 17 % worldwide by 2050 as a result of climate change, and air conditioning energy demand increasing by 72 %.
4.2 Energy balances and emission profiles in the 2°C projections
4.2.1 Primary energy balance
World GDP quadruples between now and 2050, in spite of relatively lower economic growth rates towards the end of the period. The energy intensity of the world GDP in 2050 falls to about half of the 2000 value due to structural change, autonomous efficiency improvements and higher prices. Consequently, world energy consumption roughly doubles from 414 EJ today to about 965 EJ in 2050.
The 1.6 %/year increase in world energy consumption to 2050 appears low, but the cumulative consequences are large, particularly at regional level. By 2050, the energy consumption of today’s industrialised countries (including the CIS countries) increases by a factor of 1.3. In the developing world, consumption increases by a factor of 3.7. Shortly after 2020, the consumption of the developing countries exceeds that of the present industrialised countries (Figure 4-10). The role of developed countries and that of the European region in the world primary energy consumption is estimated to decrease during this period (respectively from 62 % to 38 % and from 19 % to 13 %).

POLES model projections of adaptation and mitigation in Europe
- 48 -
0
120
240
360
480
600
720
840
960
1 080
1 200
2000 2010 2020 2030 2040 2050
EJ
USA CANEUROPE JAP. PACIFICCIS CHNNDE BRAAFR MIEARASIAJ RLAM
World Primary consumption by region - Reference Scenario
0%
10%
20%
30%
40%
50%
60%
70%
80%
90%
100%
2000 2010 2020 2030 2040 2050
RLAM
RASIAJ
MIEA
AFR
BRA
NDE
CHN
CIS
JAP. PACIFIC
EUROPE
CAN
USA
Share of Primary consumption by World region - Reference Scenario
Source: POLES ADAM, Reference scenario7
Figure 4-10: World primary energy consumption in the Reference case, by region
The world energy system that results from this analysis reveals the significant structural changes that are needed to accommodate the constraints on fossil fuel resources. The primary energy consumption in Europe increases moderately over the period, from 78 EJ today, to only 104 EJ in 2050 (Figure 4-12). This is one of the lowest growth rates in the world. This behaviour appears clearly in the energy intensity of GDP, which falls throughout the period (-1.4 % in the world level).
7 Where: RLAM- Rest of Latin America, RASIAJ-Rest of Asia, MIEA- Middle East, AFR-Africa, BRA-Brasil, NDE-Inde, CHN-China, CIS-Countries of the Indipendent States, JAP.PACIFIK – Japan & Pacific, EUROPE, CAN-Canada, USA-United States of America.

ADAM 2-degree scenario for Europe – policies and impacts
- 49 -
-5.0%
-4.5%
-4.0%
-3.5%
-3.0%
-2.5%
-2.0%
-1.5%
-1.0%
-0.5%
0.0%
WORLD
EUROPEUSA
CAN
JAP. P
ACIFICCIS
CHNNDE
RASIABRA
RLAM
AFRMIE
A
2025/00
2050/25
2050/00
Source: POLES ADAM, Reference Sc.
Figure 4-11: Growth rates of the energy intensity of GDP by region of the world –
Reference Scenario
The primary consumption of the Big Four countries increases slightly from 42 EJ currently to 51 EJ by 2050. However, the share of these countries in the total primary consumption of Europe decreases steadily from 55 % to 47 in 2050.
0
20
40
60
80
100
120
2000 2010 2020 2030 2040 2050
EJ
EENESEB4
European Primary consumption by region - Reference Scenario
Source: POLES ADAM, Reference Sc.
Figure 4-12: EU27+Nor+Switz primary energy consumption, by country and region
The contribution of fossil energy sources decreases from 80 % at the beginning of the century to 76 % by 2050. The consumption of oil and gas is restricted by high prices, in particular after 2020. By 2030, the consumption of oil and gas in Europe is less than in 2000. During the period, coal use more than doubles, providing slightly less than 30 EJ by 2050. Compared to the current 15 EJ, the figure is impressive. It reflects the relative abundance of coal and the resulting price advantage in the long term. Renewables increase steadily over the period,

POLES model projections of adaptation and mitigation in Europe
- 50 -
representing 15 % of primary consumption by 2050. The contribution of nuclear power is expected to diminish, from 10.5 EJ today to 12 EJ by 2050.
0
20
40
60
80
100
120
2000 2010 2020 2030 2040 2050
EJ
Coal, lignite Oil Natural gas Nuclear Biomass Other Renewables
EU27+Nor+Switz Primary consumption
0%
10%
20%
30%
40%
50%
60%
70%
80%
90%
100%
2000 2010 2020 2030 2040 2050
Coal, lignite Oil Natural gas Nuclear Biomass Other Renewables
EU27+Nor+Switz shares of Primary consumption
Source: POLES ADAM, Reference Sc.
Figure 4-13: EU27+Nor+Switz primary energy consumption
These trends have a clear impact on the energy self-sufficiency level of Europe:
1. The ratio of primary production to primary consumption is currently 53 %.
2. This ratio falls to 46 % between 2025 and 2050 because of falling production in the North Sea, despite the modest increase in demand.
Table 4-5: Europe energy self-sufficiency ratio
2000 2025 2050Primary Production (Mtoe) 936 1022 1073Primary Consumption (Mtoe) 1750 2139 2328P. prod/P. cons (%) 53% 48% 46%
Source: POLES ADAM, Reference Sc.
4.2.2 The development of electricity generation
The generation of electricity, worldwide, increases nearly four-fold, from 15 200 TWh/year today, to 60 100 TWh/year by 2050 (Figure 4-14).

ADAM 2-degree scenario for Europe – policies and impacts
- 51 -
0
10 000
20 000
30 000
40 000
50 000
60 000
70 000
2000 2010 2020 2030 2040 2050
TWh
Other renewables
Nuclear
Biomass
Natural gas
Oil
Coal, l ignite
World Electricity production
0
1 000
2 000
3 000
4 000
5 000
6 000
7 000
8 000
2000 2010 2020 2030 2040 2050
TWh
Other renewablesNuclearBiomassNatural gasOilCoal, lignite
EU27+Nor+Switz Electricity production
Source: POLES ADAM, Reference Sc.
Figure 4-14: World and EU27+Nor+Switz electricity production
In the EU27+2, electricity production more than doubles during the first half of the century. The evolution at country level is estimated to be similar for the Big Four and still faster for other European countries. For example, in southern European countries electricity generation is multiplied by 4 in 5 decades.
Table 4-6: Electricity generation by country in Europe (TWh) Annual % change
1990 2000 2005 2010 2020 2030 2050 2000/20 20/50 50/100Austria 50 62 63 67 82 97 118 1.5% 1.2% 0.3%Baltic States 34 24 33 45 54 62 77 4.1% 1.2% 0.3%Belgium & Luxemburg 72 85 82 97 119 146 190 1.7% 1.6% 0.4%Bulgaria 42 40 43 50 60 67 78 2.1% 0.9% 0.4%Cyprus, Malta and Slovenia 16 19 26 28 35 41 51 3.1% 1.3% 0.4%Czech Republic 63 73 80 94 113 128 156 2.2% 1.1% 0.3%Denmark 26 36 48 52 62 72 87 2.8% 1.1% 0.3%Finland 54 70 73 83 108 128 165 2.2% 1.4% 0.2%France 421 541 568 630 759 878 1072 1.7% 1.2% 0.1%Germany 550 567 610 655 766 862 1005 1.5% 0.9% 0.3%Greece 35 52 61 72 93 109 134 2.9% 1.2% 0.4%Hungary 28 35 38 45 55 67 92 2.2% 1.8% 0.1%Ireland 15 24 25 31 38 48 65 2.3% 1.8% 0.2%Italy 217 233 287 320 368 417 467 2.3% 0.8% 0.0%Netherlands 72 89 98 108 140 177 229 2.3% 1.6% 0.3%Norway and Switzerland 159 214 202 223 257 292 334 0.9% 0.9% 0.5%Poland 136 145 153 184 234 278 393 2.4% 1.7% 0.0%Portugal 29 44 51 60 75 90 113 2.8% 1.4% 0.3%Romania 64 52 56 63 81 97 134 2.3% 1.7% 0.4%Slovakia 24 31 31 38 45 52 68 1.9% 1.4% 0.6%Spain 152 221 283 321 411 486 621 3.2% 1.4% 0.5%Sweden 146 145 162 166 182 190 218 1.1% 0.6% 0.1%United Kingdom 320 377 394 422 489 595 790 1.3% 1.6% 0.2%Rceu 61 64 76 109 145 175 239 4.2% 1.7% 0.5%Turkey 58 125 155 207 352 550 963 5.3% 3.4% 1.7%EU27+Nor+Switz 2571 3178 3469 3856 4625 5380 6656 1.9% 1.2% 0.0%Europe 2845 3367 3699 4172 5123 6104 7859 2.1% 1.4% 0.0%B4 1507 1719 1859 2027 2382 2752 3334 1.6% 1.1% 0.2%SE 231 336 421 482 614 726 920 3.1% 1.4% 0.5%NE 544 662 691 761 907 1053 1288 1.6% 1.2% 0.3%EE 504 525 573 695 868 1024 1354 2.5% 1.5% 0.3% Source: POLES ADAM, Reference Sc.
The share of thermal generation increases until 2030-2040 (up to 69 % at the world level and 61 % for EU27+2) because other sources cannot match the growth in demand. This is a significant structural change for a Reference case. The role of thermal generation varies from country to country. Currently, in the eastern and southern European countries, 65 % and 63 % respectively of electricity generation is provided by thermal power plants. This contribution is

POLES model projections of adaptation and mitigation in Europe
- 52 -
expected to be relatively stable during the entire period, decreasing slightly at the end of the period (respectively, to respectively 66 % and 70 %). The role of thermal generation advances in the Big Four countries and in the northern European countries, respectively, from 51 and 33 % currently to 64 and 49 % by 2050.
Table 4-7: The share of thermal generation in total electricity generation
2000 2010 2020 2020 2030 2050EU27+Nor+Switz 51% 55% 55% 61% 61% 63%Europe 52% 57% 57% 61% 61% 63%B4 51% 57% 57% 63% 62% 64%SE 63% 66% 66% 63% 66% 70%NE 33% 38% 38% 46% 49% 49%EE 65% 66% 66% 65% 65% 66% Source: POLES ADAM, Reference Sc.
Within the thermal generation sector, advanced technologies will progressively gain the lion’s share. In 2050 in the EU27+2, less than 39 % of coal-based power generation is from advanced coal technologies and 22 % of gas-based electricity is from combined cycle or co-generation. Oil almost disappears from the electricity sector (Table 4-8).
Table 4-8: EU27+Nor+Switz electricity generation by technology Annual % change
2000 2010 2020 2030 2040 2050 2020/00 50/20 50/00Electricity Production (TWh) 3178 3856 4625 5380 6073 6656 1.9% 1.2% 1.5% Thermal, of which : 1617 2139 2799 3289 3785 4185 2.8% 1.3% 1.9% Coal, lignite 925 1138 1463 1823 2143 2563 2.3% 1.9% 2.1% of which advanced coal 0 46 557 1137 1495 1625 n.a 3.6% n.a Gas 507 792 1122 1206 1315 1214 4.1% 0.3% 1.8% of which combined cycle 278 392 691 777 813 668 4.7% -0.1% 1.8% of which cogeneration (industry) 50 106 146 182 225 268 5.6% 2.0% 3.4% Oil 181 127 65 49 54 61 -5.0% -0.2% -2.2% Biomass 43 82 149 211 272 347 6.5% 2.9% 4.3% Nuclear 972 1003 925 1044 1099 1097 -0.2% 0.6% 0.2% of which new design 0 0 0 0 50 167 n.a n.a n.a Hydro (large) 520 494 502 509 514 518 -0.2% 0.1% 0.0% Hydro (small) 45 53 57 58 58 59 1.1% 0.1% 0.5% Wind 22 159 305 405 475 543 14.0% 1.9% 6.6% Solar 0 7 37 73 137 235 n.a 6.4% n.a Source: POLES ADAM, Reference Sc.
World generation from renewable resources grows strongly, being multiplied by 5 in 2050. The development of renewable electricity in the EU27+2 almost meets the EU’s target of 20 % of total power generation by 2020. This share is maintained and even increases farther in the future to 23 % by 2050.
The contribution of renewables in the total electricity generation by country is projected to be more important in northern European countries (47 % currently, 42 % by 2020, 45 % by 2050). In the Big Four countries it seems that without climate policies the role of renewables remains at a relatively low level: 17 % by 2020, 21 % by 2050. Renewables in other European

ADAM 2-degree scenario for Europe – policies and impacts
- 53 -
countries are situated in between the former two groups of countries8: 21 % by 2020 and respectively 19 and 26 % by 2050 for eastern and southern European countries.
Table 4-9: The share of renewable electricity generation by country Annual % change
1990 2000 2005 2010 2020 2030 2050 2020/00 50/20 50/00Austria 65% 73% 67% 77% 78% 82% 81% 0.3% 0.1% 0.2%Baltic States 9% 15% 13% 9% 10% 11% 15% -1.8% 1.4% 0.1%Belgium & Luxemburg 2% 4% 6% 8% 13% 17% 26% 5.7% 2.4% 3.7%Bulgaria 4% 7% 11% 9% 10% 13% 20% 1.7% 2.2% 2.0%Cyprus, Malta and Slovenia 21% 21% 16% 18% 19% 21% 28% -0.4% 1.3% 0.6%Czech Republic 2% 4% 5% 5% 8% 8% 10% 3.6% 0.6% 1.8%Denmark 2% 17% 22% 21% 23% 26% 30% 1.6% 0.9% 1.2%Finland 20% 34% 32% 26% 26% 30% 41% -1.3% 1.5% 0.4%France 14% 14% 11% 13% 16% 17% 21% 0.6% 1.0% 0.8%Germany 4% 7% 12% 13% 16% 17% 19% 3.8% 0.7% 1.9%Greece 6% 9% 12% 11% 13% 14% 21% 2.0% 1.6% 1.7%Hungary 1% 1% 5% 6% 8% 10% 15% 12.2% 2.0% 5.9%Ireland 7% 6% 9% 10% 14% 18% 27% 4.1% 2.2% 3.0%Italy 18% 23% 18% 22% 28% 28% 31% 1.0% 0.3% 0.6%Netherlands 0% 5% 9% 10% 10% 11% 17% 3.7% 1.8% 2.6%Norway and Switzerland 99% 87% 88% 78% 71% 66% 67% -1.0% -0.2% -0.5%Poland 2% 3% 4% 6% 8% 9% 15% 4.9% 2.2% 3.3%Portugal 33% 31% 18% 30% 33% 32% 34% 0.4% 0.1% 0.2%Romania 18% 29% 36% 27% 24% 23% 24% -0.9% 0.0% -0.3%Slovakia 10% 16% 15% 15% 16% 17% 19% 0.1% 0.5% 0.3%Spain 17% 17% 17% 22% 20% 18% 15% 0.7% -1.0% -0.3%Sweden 50% 57% 51% 52% 65% 70% 72% 0.6% 0.3% 0.5%United Kingdom 2% 3% 5% 9% 14% 16% 16% 7.3% 0.4% 3.1%Rceu 38% 45% 42% 31% 33% 35% 38% -1.5% 0.4% -0.3%Turkey 40% 25% 26% 22% 19% 19% 22% -1.2% 0.4% -0.3%EU27+Nor+Switz 17% 20% 19% 21% 23% 23% 26% 0.7% 0.4% 0.5%Europe 18% 21% 20% 21% 23% 23% 26% 0.5% 0.4% 0.4%B4 8% 11% 11% 14% 17% 19% 21% 2.4% 0.6% 1.3%SE 18% 18% 16% 21% 21% 19% 19% 0.7% -0.3% 0.1%NE 45% 47% 45% 41% 42% 41% 45% -0.6% 0.3% -0.1%EE 16% 20% 21% 19% 21% 23% 26% 0.2% 0.7% 0.5% Source: POLES ADAM, Reference Sc.
The structure of the renewable electricity mix varies over time. In the case of the EU27+2, the share of hydro decreases from 90 % by 2000, to 55 % by 2020 and to 30 % by 2050. Biomass, wind and solar energy will increase their involvement throughout the decades, emerging with respectively 23 %, 31 % and 9 % at the end of the period.
8 Northern European countries and Big Four countries.

POLES model projections of adaptation and mitigation in Europe
- 54 -
2000
Wnd0%
Biomass7%
Hydro93%
2020
Solar1%
Wnd18%
Hydro64%
Biomass17%
2050
Wnd31%
Biomass23%
Solar9%
Hydro37%
2030
Hydro51%
Solar3%
Biomass19%
Wnd27%
Source: POLES ADAM, Reference Sc.
Figure 4-15: EU27+Nor+Switz share of the different sources in the total renewable
generation
The absolute contribution and the share of nuclear electricity both decrease until 2020, as some second-generation plants are retired. World electricity generation in nuclear plants revives after that date, with the rapid introduction of third- and fourth-generation plants increasing four times by 2050. In the EU27+2, the contribution of nuclear energy remains relatively stable. However, 12 % of electricity in the EU27+2 will come from nuclear energy by 2050.
In Europe, France, the United Kingdom and Turkey play a major role in nuclear generation. While nuclear generation in France decreases after 2030, it will increase in the United Kingdom and Turkey.

ADAM 2-degree scenario for Europe – policies and impacts
- 55 -
Table 4-10: Nuclear electricity generation by European country Annual % change
2000 2010 2020 2030 2050 2020/00 50/20 50/00Austria 0 0 0 0 0 59.1% 5.1% 24.1%Baltic States 8 19 20 15 13 4.3% -1.5% 0.8%Belgium & Luxemburg 48 43 33 26 16 -1.8% -2.5% -2.2%Bulgaria 18 17 17 16 14 -0.3% -0.5% -0.5%Cyprus, Malta and Slovenia 5 7 10 12 10 3.7% 0.0% 1.5%Czech Republic 14 33 33 29 26 4.6% -0.8% 1.3%Denmark 0 0 0 1 11 81.5% 21.8% 42.9%Finland 23 35 36 37 33 2.4% -0.3% 0.8%France 415 439 427 483 390 0.1% -0.3% -0.1%Germany 170 128 9 0 0 -13.6% n.a n.aGreece 0 0 7 15 18 138.7% n.a 44.2%Hungary 14 17 19 18 18 1.4% -0.2% 0.4%Ireland 0 0 0 0 0 74.1% -2.5% 23.0%Italy 0 0 0 2 30 n.a n.a 45.7%Netherlands 4 13 25 46 65 9.7% 3.2% 5.8%Norway and Switzerland 26 36 56 71 79 3.8% 1.2% 2.2%Poland 0 1 13 43 72 n.a 5.8% 48.3%Portugal 0 0 7 15 19 n.a 3.3% 44.3%Romania 5 6 9 14 16 2.5% 1.9% 2.1%Slovakia 17 19 16 13 11 -0.2% -1.3% -0.8%Spain 62 59 86 79 73 1.6% -0.6% 0.3%Sweden 57 64 22 0 0 -4.7% n.a n.aUnited Kingdom 85 69 80 109 185 -0.3% 2.8% 1.6%Rceu 0 5 22 31 33 152.7% 1.3% 46.0%Turkey 0 0 29 83 145 155.9% 5.5% 50.4%EU27+Nor+Switz 972 1003 925 1044 1097 -0.2% 0.6% 0.2%Europe 972 1007 977 1158 1274 0.0% 0.9% 0.5%B4 670 636 516 595 604 -1.3% 0.5% -0.2%SE 67 66 110 120 119 2.5% 0.3% 1.2%NE 158 190 173 181 204 0.4% 0.6% 0.5%EE 76 115 149 179 202 3.4% 1.0% 2.0% Source: POLES ADAM, Reference Sc.
4.2.3 Hydrogen production
In the Reference case, the development of hydrogen production remains limited at the world level (6.6 PJ in 2050). In 2050, it represents only 1.2 % of total final energy consumption. In the EU27+2 the contribution of hydrogen is even lower (it represents only 0.8 % of total final energy consumption in 2050.
As illustrated in Figure 4-16, hydrogen production comes mostly from coal. The production from steam reforming of natural gas is limited by increasing gas prices and is more costly than hydrogen from coal gasification. World hydrogen production has a relatively balanced profile across regions.

POLES model projections of adaptation and mitigation in Europe
- 56 -
0
1 000
2 000
3 000
4 000
5 000
6 000
7 000
2000 2010 2020 2030 2040 2050
PJ
BGAOPOWENBPYCGAGSR
World hydrogen production by technology Regional Hydrogen Production
0
1 000
2 000
3 000
4 000
5 000
6 000
7 000
2000 2010 2020 2030 2040 2050
PJ
USA CAN
WEUR JANZC
CIS CHN
NDE BRA
MIEA AFR
RASIAJ RLAM
Source: POLES ADAM, Reference Sc9.
Figure 4-16: Hydrogen energy production by technology and by region
The amount of hydrogen production for energy purposes in Europe is very limited until 2030. Thereafter it begins to penetrate the market and by 2050, total production is of 604 PJ. This is equivalent to 3 % of total final consumption of electricity (Figure 4-17).
0
100
200
300
400
500
600
2000 2010 2020 2030 2040 2050
PJ
BGSBGAOPOSMRWEWWEGWENNHTSHTBPYCGSCGAGSSGSR
EU27+Nor+Switz hydrogen production by technology
Source: POLES ADAM, Reference Sc.
Figure 4-17: Hydrogen production in EU27+Nor+Switz
Nearly two thirds of hydrogen produced at the world level is used for mobility purposes in the transport market, which represents 79 % of the total by 2050. In the EU27+2 countries this figure represents 74 % of the total hydrogen used in the transport sector by 2050.
9 Where: RLAM- Rest of Latin America, RASIAJ-Rest of Asia, MIEA- Middle East, AFR-Africa, BRA-Brasil, NDE-Inde, CHN-China, CIS-Countries of the Indipendent States, JAP.PACIFIK – Japan & Pacific, EUROPE, CAN-Canada, USA-United States of America.

ADAM 2-degree scenario for Europe – policies and impacts
- 57 -
0
1 000
2 000
3 000
4 000
5 000
6 000
7 000
2000 2010 2020 2030 2040 2050
PJ
MobileStationary
World hydrogen markets
0
100
200
300
400
500
600
2000 2010 2020 2030 2040 2050
PJ
MobileStationary
EU27 + Nor+ Switz hydrogen markets
Source: POLES ADAM, Reference Sc.
Figure 4-18: World and EU27+Nor+Switz hydrogen markets
4.2.4 Trends in final energy demand
Expected world final energy demand almost doubles by 2050, but then increases more slowly. Final electricity demand increases significantly faster, at a rate of more than 2 %/year which means an increase from 45 EJ in 2000 to 178 EJ in 2050.
The final consumption of energy in the EU27+2, increases during the period at an average rate of 0.55 %/year. This tendency is confirmed in all European countries, however, the speed is lower in the Big Four and northern countries and faster in the rest of the Europe.
0
100
200
300
400
500
600
2000 2010 2020 2030 2040 2050
EJ
OthersElectricityBiomassNatural gasOilCoal, lignite
World Final consumption by energy
0
10
20
30
40
50
60
70
80
2000 2010 2020 2030 2040 2050
EJ
OthersElectricityBiomassNatural gasOilCoal, lignite
EU27 + Nor+ Switz Final consumption by energy
Source: POLES ADAM, Reference Sc.
Figure 4-19: World and EU 27+Nor+Switz final energy consumption by energy

POLES model projections of adaptation and mitigation in Europe
- 58 -
Table 4-11: Final energy consumption by European country Annual % change
2000 2010 2020 2030 2050 2020/00 50/20 50/00Austria 1.0 1.2 1.3 1.4 1.3 1.3% 0.0% 0.5%Baltic States 0.4 0.6 0.7 0.8 0.8 2.5% 0.5% 1.3%Belgium & Luxemburg 2.1 2.1 2.4 2.5 2.5 0.6% 0.2% 0.4%Bulgaria 0.4 0.5 0.7 0.7 0.7 2.3% 0.3% 1.1%Cyprus, Malta and Slovenia 0.3 0.4 0.4 0.4 0.5 1.4% 0.5% 0.9%Czech Republic 1.1 1.3 1.5 1.6 1.7 1.6% 0.4% 0.9%Denmark 0.6 0.7 0.8 0.8 0.8 1.1% 0.2% 0.5%Finland 1.0 1.2 1.4 1.5 1.6 1.5% 0.6% 1.0%France 7.1 7.6 8.6 9.3 10.1 0.9% 0.6% 0.7%Germany 10.3 10.7 11.7 11.9 11.8 0.6% 0.0% 0.3%Greece 0.8 0.9 1.1 1.1 1.2 1.4% 0.5% 0.9%Hungary 0.7 0.9 1.0 1.1 1.2 1.6% 0.5% 1.0%Ireland 0.5 0.6 0.6 0.6 0.6 1.4% 0.1% 0.6%Italy 5.6 6.0 6.4 6.4 5.9 0.7% -0.3% 0.1%Netherlands 2.5 2.8 3.1 3.3 3.4 1.1% 0.3% 0.6%Norway and Switzerland 1.8 1.9 2.1 2.3 2.4 0.8% 0.4% 0.6%Poland 2.5 2.8 3.3 3.5 4.0 1.3% 0.6% 0.9%Portugal 0.8 0.9 1.0 1.1 1.1 0.7% 0.5% 0.6%Romania 1.0 1.3 1.5 1.5 1.6 1.9% 0.3% 1.0%Slovakia 0.5 0.6 0.6 0.7 0.7 1.2% 0.3% 0.6%Spain 3.8 4.6 5.5 5.9 6.2 1.9% 0.4% 1.0%Sweden 1.5 1.5 1.6 1.7 1.8 0.4% 0.4% 0.4%United Kingdom 6.8 6.9 7.4 7.6 8.0 0.4% 0.2% 0.3%Rceu 0.7 1.3 1.6 1.8 2.1 3.9% 1.0% 2.2%Turkey 2.4 3.3 5.0 6.2 8.1 3.7% 1.6% 2.5%EU27+Nor+Switz 53.3 58.0 64.7 67.5 70.2 1.0% 0.3% 0.6%Europe 56.4 62.5 71.2 75.5 80.4 1.2% 0.4% 0.7%B4 29.8 31.2 34.1 35.2 35.8 0.7% 0.2% 0.4%SE 5.7 6.8 8.0 8.5 9.1 1.7% 0.4% 0.9%NE 10.1 10.7 12.1 12.7 13.3 0.9% 0.3% 0.6%EE 8.4 10.5 12.1 12.9 14.1 1.8% 0.5% 1.0% Source: POLES ADAM, Reference Sc.
EU27+2 final electricity demand increases at a faster pace than final energy consumption, of more than 0.9 %/year, but much more slowly than the world average for electricity. At the country level, since the increase of electricity demand in the southern and eastern European countries is most rapid, the role of the Big 4 and northern countries decreases from 73 % currently to 61 % by 2050.

ADAM 2-degree scenario for Europe – policies and impacts
- 59 -
Table 4-12: Final electricity consumption by European country Annual % change
2000 2010 2020 2030 2050 2020/00 50/20 50/00Austria 0.2 0.2 0.3 0.3 0.4 2.0% 1.2% 1.5%Baltic States 0.1 0.1 0.1 0.2 0.2 4.3% 1.3% 2.5%Belgium & Luxemburg 0.3 0.4 0.4 0.5 0.7 1.8% 1.4% 1.6%Bulgaria 0.1 0.1 0.1 0.2 0.2 2.3% 1.0% 1.5%Cyprus, Malta and Slovenia 0.1 0.1 0.1 0.1 0.2 2.8% 1.4% 1.9%Czech Republic 0.2 0.2 0.3 0.3 0.4 2.5% 1.3% 1.8%Denmark 0.1 0.1 0.2 0.2 0.2 1.7% 1.3% 1.5%Finland 0.3 0.3 0.4 0.5 0.6 2.1% 1.3% 1.6%France 1.4 1.7 2.1 2.5 3.1 2.1% 1.3% 1.6%Germany 1.8 2.0 2.3 2.6 3.1 1.4% 1.0% 1.1%Greece 0.2 0.2 0.3 0.3 0.4 2.9% 1.3% 1.9%Hungary 0.1 0.1 0.2 0.2 0.3 2.1% 1.7% 1.9%Ireland 0.1 0.1 0.1 0.2 0.2 2.8% 1.8% 2.2%Italy 1.0 1.2 1.3 1.5 1.7 1.6% 0.8% 1.1%Netherlands 0.4 0.4 0.5 0.6 0.8 1.8% 1.5% 1.6%Norway and Switzerland 0.6 0.7 0.8 0.9 1.1 1.5% 0.9% 1.1%Poland 0.3 0.4 0.6 0.7 1.0 2.4% 1.9% 2.1%Portugal 0.1 0.2 0.2 0.3 0.4 2.8% 1.4% 2.0%Romania 0.1 0.2 0.2 0.3 0.4 2.7% 1.8% 2.2%Slovakia 0.1 0.1 0.1 0.1 0.2 2.3% 1.5% 1.8%Spain 0.7 1.0 1.3 1.5 1.9 3.1% 1.4% 2.1%Sweden 0.5 0.5 0.5 0.6 0.7 0.8% 0.6% 0.7%United Kingdom 1.2 1.3 1.5 1.9 2.5 1.3% 1.6% 1.5%Rceu 0.2 0.3 0.4 0.5 0.7 3.9% 1.6% 2.5%Turkey 0.3 0.6 1.1 1.7 3.0 5.8% 3.5% 4.4%EU27+Nor+Switz 9.7 11.8 14.1 16.5 20.5 1.9% 1.3% 1.5%Europe 10.2 12.7 15.6 18.6 24.2 2.1% 1.5% 1.7%B4 5.3 6.2 7.3 8.5 10.4 1.6% 1.2% 1.3%SE 1.0 1.5 1.9 2.2 2.9 3.0% 1.4% 2.1%NE 2.2 2.5 3.0 3.5 4.3 1.6% 1.2% 1.3%EE 1.4 1.8 2.3 2.8 3.7 2.7% 1.6% 2.0% Source: POLES ADAM, Reference Sc.
In sectoral terms (Figure 4-20), the fastest increase in world final consumption is observed in the residential and service sector (1.2 %/year), followed by transport (0.8 %/year) and industry (0.6 %/year). Figure 4-20 reveals a long-term stabilisation of energy consumption in the transport sector at world level, while for the EU27+2 countries a slight slowdown is seen. This is an important change in the pattern of demand. In the past thirty years, the long-lasting decoupling of “energy services” from GDP has only been observed for stationary uses of fuels and only temporarily for transport, i.e. in the USA after the first oil shock and the introduction of the CAFE standards. There are several possible explanations for this new trend in transport, including: saturation in equipment and in the time budget for personal transport, significant oil price increases; the impact of more severe technological standards. In this respect, the Reference case again already includes significant structural change.
Changes in the transport sector suggest that the EU27+2 may have already entered a second phase of energy decoupling, with electricity remaining the only energy carrier or service for which demand continues to grow. The third and final phase of decoupling – that of electricity, if it ever happens – is not visible before the 2050 horizon.

POLES model projections of adaptation and mitigation in Europe
- 60 -
0
100
200
300
400
500
600
2000 2010 2020 2030 2040 2050
EJ
Transport
Residential-Tertiary-Agr
Industry
World Final consumption by sector EU27+Nor+Switz Final consumption by sector
0
10
20
30
40
50
60
70
80
90
100
2000 2010 2020 2030 2040 2050
EJ
Transport
Residential-Tertiary-Agr
Industry
Source: POLES ADAM, Reference Sc.
Figure 4-20: World and EU27+Nor+Switz final energy consumption by sector
The version of the POLES model used in ADAM incorporates the diffusion of new low energy or very low energy buildings, which consume only one half or one quarter respectively of the rate in the average existing buildings in each region. The VLE building concept reflects current efforts in many countries to develop zero or even positive energy buildings, when associated with integrated solar PV panels. In the Reference case, while price increases allow for more energy efficiency in buildings, they are insufficient to overcome the building stock inertia and to trigger a significant development of low and very low energy buildings: in 2050 their world and EU27+2 market is only 1 % and 3 %.
World - Buildings in residential
0%
10%
20%
30%
40%
50%
60%
70%
80%
90%
100%
2000 2010 2020 2030 2040 2050
%
Very low energy
Low energy
Standard
0%
10%
20%
30%
40%
50%
60%
70%
80%
90%
100%
2000 2010 2020 2030 2040 2050
%
Very low energy
Low energy
Standard
EU27+Nor+Switz - Buildings in residential
Source: POLES ADAM, Reference Sc.
Figure 4-21: World and EU27+Nor+Switz buildings in residential
Similarly, in the transport sector, different types of technologies take into account the effort of many actors to develop cleaner cars. In that case, stock effects and inertias are lower and the impact of oil prices stronger, so that conventional cars steadily lose market shares and hybrid, electric, hydrogen ICE and hydrogen fuel cell technologies progressively increase their market share after 2020. In that way, while world transport consumption continues to expand,

ADAM 2-degree scenario for Europe – policies and impacts
- 61 -
the role of electricity and hydrogen in transport fuels expands significantly. In the EU27+2 light vehicle consumption peak much earlier, during 2015-2035, and then decrease to 15 EJ by the end of the period.
0%10%20%30%40%50%60%70%80%90%
100%
2000 2010 2020 2030 2040 2050
%
CONV HYBV
ELEV GFCV
THYV HFCV
World share of Light Vehicles
0%
10%20%30%40%50%60%70%80%90%
100%
2000 2010 2020 2030 2040 2050
%
CONV HYBV
ELEV GFCV
THYV HFCV
EU27+Nor+Switz - share of Light Vehicles
Source: POLES ADAM Reference Sc.
Figure 4-22: World and EU27+Nor+Switz share of light vehicles
World - Transport Consumption
0
20
40
60
80
100
120
140
2000 2010 2020 2030 2040 2050
EJ
Hydrogen
Biofuel
Electricity
Gasoline, Diesel
0
2
4
6
8
10
12
14
16
18
2000 2010 2020 2030 2040 2050
EJ
Hydrogen
Biofuel
Electricity
Gasoline, Diesel
EU27+Nor+Switz - Transport Consumption
Source: POLES ADAM, Reference Sc.
Figure 4-23: World and EU27+Nor+Switz transport consumption
4.2.5 GHG emissions
World GHG emissions from energy and industrial activities double until 2050. The result is serious, because the trajectory would probably lead to a concentration of about 1000 ppmv CO2e by the end of the century and therefore to a temperature increase of at least 3-4°C already in 2050. Energy and climate policies with limited ambitions will not solve the climate change problem. The combined effects of all structural and technological changes in the Reference case are that GHG emissions are 2.2 times greater in 2050 than in 2005.

POLES model projections of adaptation and mitigation in Europe
- 62 -
The GHG emissions of Annex B countries increase slowly from 15 GtCO2e in 2005, to 19 GtCO2e by 2050. The increase in non-Annex B regions is dramatic; emissions are 17 GtCO2e in 2005, but by 2050 the emissions from non-Annex B countries are up to 42 GtCO2e and amount to two thirds of the world total. This reflects the magnitude of energy needs in the developing world, which are only partly contained by price increases, and are also increasingly met by coal in a context of expensive oil and gas.
0
10
20
30
40
50
60
70
2000 2010 2020 2030 2040 2050
GtC
O2
eq
RLAMRASIAJAFRMIEABRANDECHNCISJANZCWEURCANUSA
Total Emissions by region
Source: POLES ADAM, Reference Sc.
Figure 4-24: World GHG emissions by region
As for Europe, the level of GHG emissions from energy and industrial activities peaks by 2050 at 5.9 GtCO2e. This behaviour is a consequence of low population growth or even decrease in some regions, the high price of energy and also of the implementation of climate policies, even when they are moderate.

ADAM 2-degree scenario for Europe – policies and impacts
- 63 -
0
10
20
30
40
50
60
70
2000 2010 2020 2030 2040 2050
GtC
O2e
CO2 CH4N2O SF6PFC&HFC
World - GHG Emissions (energy - industry)
0.0
1.0
2.0
3.0
4.0
5.0
6.0
7.0
2000 2010 2020 2030 2040 2050
GtC
O2e
CO2 CH4N2O SF6PFC&HFC
EU27+Nor+Switz - GHG Emissions (energy - industry)
Source: POLES ADAM, Reference Sc.
Figure 4-25: World and EU27+Nor+Switz - GHG emissions (energy – industry)
The evolution of CO2 emissions by country in Europe is described in Table 4-13 that displays contrasting dynamics. The contribution of the Big Four and northern European countries in European CO2 emissions decreases from 50 % and 14 % by 2005, to 42 % and 13 % by 2050. The role of eastern European countries remains relatively stable, while that of Turkey increases considerably from 5 % by 2005 to 13 % by 2050.
Table 4-13: CO2 emissions by European country (MtCO2) Annual % change
2000 2010 2020 2030 2050 2020/00 50/20 50/00Austria 66 67 70 66 61 0.2% -0.5% -0.2%Baltic States 29 39 49 56 65 2.5% 1.0% 1.6%Belgium & Luxemburg 148 144 170 183 187 0.7% 0.3% 0.5%Bulgaria 51 66 72 72 72 1.8% 0.0% 0.7%Cyprus, Malta and Slovenia 31 38 39 38 43 1.1% 0.4% 0.7%Czech Republic 117 126 138 146 159 0.8% 0.5% 0.6%Denmark 54 66 71 72 64 1.3% -0.3% 0.3%Finland 67 68 74 79 88 0.5% 0.6% 0.6%France 400 457 534 550 682 1.5% 0.8% 1.1%Germany 837 864 1006 1022 1045 0.9% 0.1% 0.4%Greece 88 101 110 115 119 1.1% 0.3% 0.6%Hungary 51 61 71 79 91 1.7% 0.8% 1.2%Ireland 46 52 57 59 59 1.1% 0.1% 0.5%Italy 429 438 441 436 393 0.1% -0.4% -0.2%Netherlands 180 187 205 211 213 0.6% 0.1% 0.3%Norway and Switzerland 81 85 95 102 99 0.8% 0.1% 0.4%Poland 327 341 350 331 368 0.3% 0.2% 0.2%Portugal 62 59 67 72 80 0.4% 0.6% 0.5%Romania 85 103 114 112 129 1.5% 0.4% 0.8%Slovakia 37 46 51 55 62 1.6% 0.6% 1.0%Spain 308 369 429 482 575 1.7% 1.0% 1.3%Sweden 55 54 73 87 94 1.5% 0.8% 1.1%United Kingdom 565 595 585 594 612 0.2% 0.1% 0.2%Rceu 84 149 146 149 180 2.8% 0.7% 1.5%Turkey 218 316 486 605 826 4.1% 1.8% 2.7%EU27+Nor+Switz 4112 4425 4871 5016 5359 0.8% 0.3% 0.5%Europe 4414 4891 5503 5770 6366 1.1% 0.5% 0.7%B4 2231 2353 2567 2601 2731 0.7% 0.2% 0.4%SE 489 567 645 706 817 1.4% 0.8% 1.0%NE 630 656 745 791 805 0.8% 0.3% 0.5%EE 847 998 1060 1067 1187 1.1% 0.4% 0.7% Source: POLES ADAM, Reference Sc.

POLES model projections of adaptation and mitigation in Europe
- 64 -
EE19%
NE14%
B446%
SE12%
TUR9%
2020
EE19%
NE13%
B442%
SE13%
TUR13%
2050
EE19%
NE14%
B451%
SE11%
TUR5%
2000
TUR10%
SE12%
B446%
NE14%
EE18%
2030
Source: POLES ADAM, Reference Sc.
Figure 4-26: Participation of different groups in total European CO2 emissions
The combination of the different trends results in significant structural changes in the energy system in Europe, even in the Reference case. These changes mostly result from the modest increase in total energy demand, while there is still a relatively high growth of electricity consumption, as described above. Associated with this penetration of electricity, the development of renewables and nuclear allows Europe’s CO2 emissions to stabilise by 2050 at 52 GtCO2. This profile provides a consistent reference for emission trends, in this case without significant climate policies, which is of course not consistent with the type of international commitments that would adequately mitigate climate change. Stronger climate policies are needed and are examined in the next section.

ADAM 2-degree scenario for Europe – policies and impacts
- 65 -
0
10
20
30
40
50
60
2000 2010 2020 2030 2040 2050
GtC
O2
TransportRes-Ser-AgrIndustryTransformation
World CO2 emissions by sector (energy)
0.0
1.0
2.0
3.0
4.0
5.0
6.0
2000 2010 2020 2030 2040 2050
GtC
O2
TransportRes-Ser-AgrIndustryTransformation
EU27+Nor+Switz CO2 emissions by sector (energy)
Source: POLES ADAM, Reference Sc.
Figure 4-27: World and EU27+Nor+Switz CO2 emissions by sector (energy)
4.3 Assumptions and results for the POLES model – the 2°C scenarios
4.3.1 Assumptions and methods for the 2°C scenarios
Most critical questions on how to attain the EU climate policy objectives still remain unanswered. The POLES model and scenarios developed in the ADAM project aim to introduce a more detailed treatment of new technology diffusion and thus to provide better insights into the role of these technologies in climate change mitigation policies: at what rate can clean technologies be deployed, how is it possible to accelerate their diffusion, what are the economic costs of the corresponding large-scale technological transitions?
While some observers argue that radical technology breakthroughs will be required to solve the climate problem [Hoffert et al., 2003], others assert that existing technologies are sufficient to address the problem for the next half century [Pacala and Socolow 2004]. Most observers seem to agree, however, on the need for significantly increased investment in energy technology research and development [National Commission on Energy Policy 2003]. However, R&D activity is also an activity with strong uncertainties, and as such, any deterministic model is limited in its ability to characterise its potential benefits, particularly for disruptive technologies. Deterministic models do not take into account either uncertainty of future technology performances, and they do not endogenously simulate technological breakthroughs, which are by definition hard to forecast.
Given the capabilities of the POLES model in terms of energy technology description, the impacts of new and alternative technology pathways involving renewables, biomass, nuclear, hydrogen, carbon capture and sequestration and others have been examined in relation to their role in reaching the EU targets and in the dynamics of forming new technology paradigms.

POLES model projections of adaptation and mitigation in Europe
- 66 -
The ADAM Reference scenario presented above provides a plausible projection of future energy use and carbon emissions until 2050, assuming that the current main trends continue and that these climate policies remain very modest. In the alternative scenario proposed below, a carbon value is introduced as representing a synthesis of the various taxes, emissions quotas, policies and other measures that may be combined to give a price to carbon and to achieve the desired emission reductions, in a "dose-response" type approach. This carbon value therefore is a good "proxy variable", reflecting the stringency of the policy measures to be implemented.
The 2°C scenario explores a severe GHG reduction profile, which implies a stabilisation of the concentration level at 450 ppmv CO2e. This means that global emissions would peak before 2020, return to their current level before 2030 and then end up at one third of their current level by 2050. The results obtained for the carbon value provide two types of information that will be described below in the detailed analysis of the model’s results. First of all, it can be noted that in order to achieve the significant reductions in emissions after the peak is reached, the model's response functions require a sharp increase in the carbon value, since simulations with a moderate linear increase in the carbon value only induce a slowdown in emissions growth.
Secondly, this sharp increase illustrates the fact that in the energy system described in the model there is no "backstop technology" that would enable massive reductions when the carbon value reaches the threshold after which the backstop enters into the system. Although all low-carbon technologies are to some degree economically feasible at the carbon values considered, the full development of their potential implies a continuously improving economic environment. It is therefore necessary to promote high carbon values to reduce energy consumption and to accelerate the diffusion of very low-emission technologies. The high carbon value of 405 and 214 €05/tCO2 in 2050 in the 400 and 450 ppm scenarios respectively achieves cuts in GHG emissions by 54 % and by 72 % in 2050 compared to 2005 respectively in the two 2°C scenarios.

ADAM 2-degree scenario for Europe – policies and impacts
- 67 -
0
50
100
150
200
250
300
350
400
450
2000 2010 2020 2030 2040 2050
€05/
tCO
2
Carbon value - 2°C Scenarios
450 ppm
400 ppm
0
10 000
20 000
30 000
40 000
50 000
60 000
2000 2010 2020 2030 2040 2050
MtC
O2
World CO2 emissions
REF
450 ppm
400 ppm
Source: POLES ADAM, 2°C scenarios
Figure 4-28: Carbon value necessary to achieve objectives and the corresponding emission
profile, 2°C scenario (400 and 450 ppm), 2000 to 2050
0
10
20
30
40
50
60
70
2000 2010 2020 2030 2040 2050
GtC
O2
eq
RLAMRASIAJAFRMIEABRANDECHNCISJANZCWEURCANUSA
Total Emissions by region - REF Sc.
0
10
20
30
40
50
60
70
2000 2010 2020 2030 2040 2050
GtC
O2
eq
RLAMRASIAJAFRMIEABRANDECHNCISJANZCWEURCANUSA
Total Emissions by region - 2°C Sc. (450 ppm)
0
10
20
30
40
50
60
70
2000 2010 2020 2030 2040 2050
GtC
O2
eq
RLAMRASIAJAFRMIEABRANDECHNCISJANZCWEURCANUSA
Total Emissions by region - 2°C Sc. (400 ppm)
Source: POLES ADAM, 2°C scenarios
Figure 4-29: Total emissions by region, 2°C scenario (400 and 450 ppm), 2000 to 2050
For companies in the power sector and energy-intensive industries, stricter greenhouse gas regulations designed to meet the Mitigation target will mean a shift in the global business environment, probably even greater than the one launched by the oil crisis in the 1970s. It may have a fundamental impact on key aspects of business strategy, such as production

POLES model projections of adaptation and mitigation in Europe
- 68 -
economics, cost competitiveness, investment decisions, and the value of different types of assets. Companies in these industries should therefore anticipate the effects of different types of greenhouse gas regulation, strive to adjust to it, and position themselves accordingly.
The first section below analyses the main consequences of this climate policy framework on energy supply and demand for Europe in a world context, while the second section deals with the resulting technological changes in the European power generation sector.
4.3.2 Results of the 2°C scenario to 2050
4.3.2.1 Impact on energy supply and demand
Unlike the Reference scenario, where world energy consumption more than doubled in 2050 in comparison to 2000, in the 2°C scenarios global energy consumption stabilises at a level of about 61 % and 42 % above that of 2000 respectively in 450 and 400 ppm. This shows that the answer to climate change is largely to be found on the demand side of the energy system. The introduction of a high carbon tax is particularly effective in reducing the demand for fossil fuels, which account for only half of the energy balance in 2050, as renewable and nuclear energy technologies which do not emit CO2 become increasingly widespread.

ADAM 2-degree scenario for Europe – policies and impacts
- 69 -
0
120
240
360
480
600
720
840
960
2000 2010 2020 2030 2040 2050
EJ
Other RenewablesBiomassNuclearNatural gasOilCoal, lignite
World Primary consumption - REF Sc.
0
120
240
360
480
600
720
840
960
2000 2010 2020 2030 2040 2050
EJ
Other RenewablesBiomassNuclearNatural gasOilCoal, lignite
World Primary consumption - 2°C Sc. (450 ppm)
0
120
240
360
480
600
720
840
960
2000 2010 2020 2030 2040 2050
EJ
Other RenewablesBiomassNuclearNatural gasOilCoal, lignite
World Primary consumption - 2°C Sc. (400 ppm)
Source: POLES-LEPII ADAM
Figure 4-30: World primary energy consumption by energy
In terms of regional analysis, the energy consumption of the industrialised countries in the mitigations scenarios increases slightly until 2020 and then stabilises at the 2000 level. Although consumption in the developing countries continues to increase throughout the period, this growth is much slower than in the Reference scenario. Total consumption of the developing countries nearly triples, rising from 280 to 392 or 329 EJ in 2050. This increase reflects the fact that access to modern energy sources remains essential for poverty reduction and human development, even in a case of strong environmental constraint as examined here.
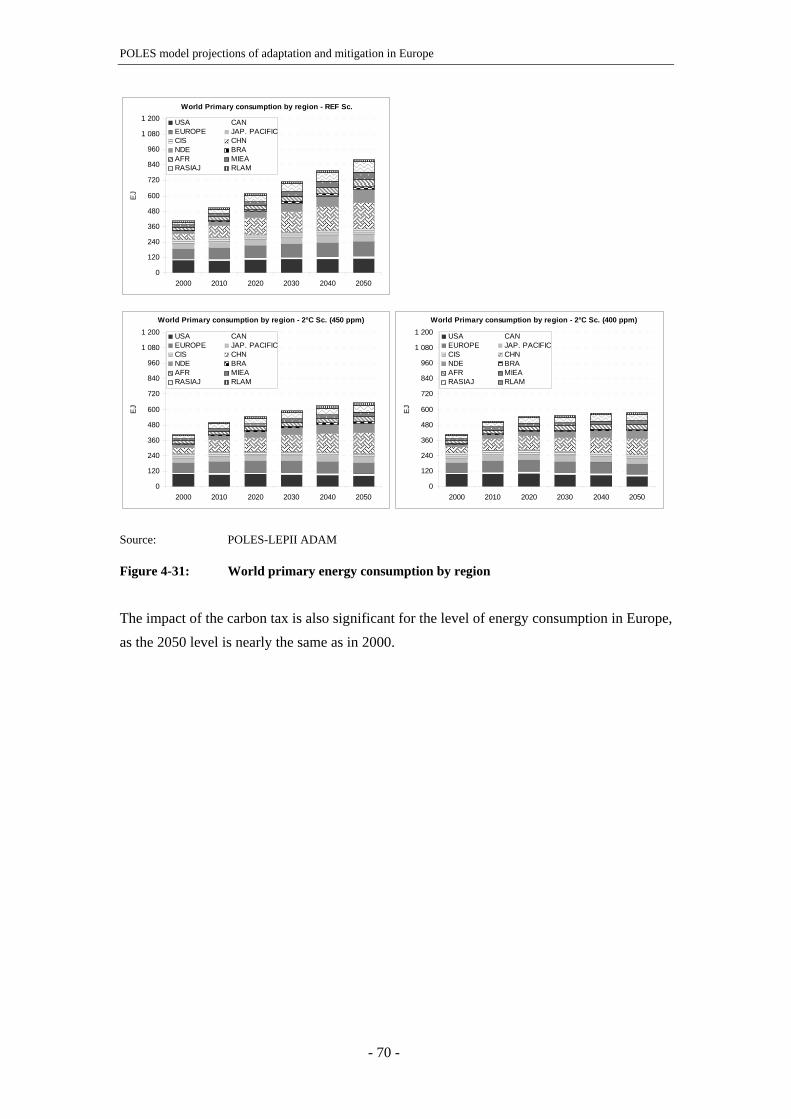
POLES model projections of adaptation and mitigation in Europe
- 70 -
0
120
240
360
480
600
720
840
960
1 080
1 200
2000 2010 2020 2030 2040 2050
EJ
USA CANEUROPE JAP. PACIFICCIS CHNNDE BRAAFR MIEARASIAJ RLAM
World Primary consumption by region - REF Sc.
0
120
240
360
480
600
720
840
960
1 080
1 200
2000 2010 2020 2030 2040 2050
EJ
USA CANEUROPE JAP. PACIFICCIS CHNNDE BRAAFR MIEARASIAJ RLAM
World Primary consumption by region - 2°C Sc. (450 ppm)
0
120
240
360
480
600
720
840
960
1 080
1 200
2000 2010 2020 2030 2040 2050
EJ
USA CANEUROPE JAP. PACIFICCIS CHNNDE BRAAFR MIEARASIAJ RLAM
World Primary consumption by region - 2°C Sc. (400 ppm)
Source: POLES-LEPII ADAM
Figure 4-31: World primary energy consumption by region
The impact of the carbon tax is also significant for the level of energy consumption in Europe, as the 2050 level is nearly the same as in 2000.

ADAM 2-degree scenario for Europe – policies and impacts
- 71 -
0
20
40
60
80
100
120
2000 2010 2020 2030 2040 2050
EJ
Coal, lignite Oil Natural gas Nuclear Biomass Other Renewables
EU27+Nor+Switz Primary consumption - REF Sc.
0
20
40
60
80
100
120
2000 2010 2020 2030 2040 2050
EJ
Coal, lignite Oil Natural gas Nuclear Biomass Other Renewables
EU27+Nor+Switz Primary consumption - 2°C Sc. (450 ppm)
0
20
40
60
80
100
120
2000 2010 2020 2030 2040 2050
EJ
Coal, lignite Oil Natural gas Nuclear Biomass Other Renewables
EU27+Nor+Switz Primary consumption - 2°C Sc. (400 ppm)
Source: POLES-LEPII ADAM
Figure 4-32: EU27+Nor+Switz primary energy consumption by energy
GHG emissions peak by 2020 and decrease considerably after that, representing only 49 % and 33 % of the current level by the end of the simulation in the 450 and 400 ppm scenarios respectively.
The impacts on energy consumption and emissions vary from country to country. At the end of the period, countries like Italy, Germany the Belgium & Luxembourg, Sweden, Slovakia seem to be much more strongly affected than the European average. Baltic Countries, Hungary, Spain and Greece increase their consumption in comparison with the current level (Figure 4-33).

POLES model projections of adaptation and mitigation in Europe
- 72 -
-30%-20%-10%
0%10%20%30%40%50%
Italy
German
y
Sweden
Belg & Lux
Slovakia
Bulgaria
United K
ingdom
Irelan
d
EU27+N
or+S
witz
Cyp, Mal
& Slo
Austria
Romania
Netherlan
ds
Czech
Repub
lic
France
Portugal
Denmark
Finland
Poland
Nor. & Swit.
Greece
Spain
Hungary
Baltic S
tates
Sc. 450 ppm
-30%-20%-10%
0%10%20%30%40%50%
German
yIta
ly
Belg & Lux
Sweden
Bulgaria
United K
ingdom
Slovakia
Austria
EU27+N
or+S
witz
Irelan
d
Netherlan
ds
France
Denmark
Romania
Portugal
Cyp, Mal
& Slo
Czech
Repub
lic
Finland
Poland
Nor. & Swit.
Spain
Greece
Baltic S
tates
Hungary
Sc. 400 ppm
Source: POLES-LEPII ADAM
Figure 4-33: European primary consumption change in 2050 in comparison with 2000
The Big Four and northern European countries (Figure 4-34) see their primary consumption increase until 2020, but this consumption decreases steadily thereafter, down to 43 % and 29 % respectively below the current level in 2050.

ADAM 2-degree scenario for Europe – policies and impacts
- 73 -
0
20
40
60
80
100
120
2000 2010 2020 2030 2040 2050
EJ
EENESEB4
European Primary consumption by region - REF Sc.
0
20
40
60
80
100
120
2000 2010 2020 2030 2040 2050
EJ
EENESEB4
European Primary consumption by region - 2°C Sc. (450 ppm)
0
20
40
60
80
100
120
2000 2010 2020 2030 2040 2050
EJ EE
NESEB4
European Primary consumption by region - 2°C Sc. (400 ppm)
Source: POLES-LEPII ADAM
Figure 4-34: European primary consumption by region
On the supply side, world crude oil production is similar to that of the 2°C scenario until 2015, since carbon taxes are roughly the same during this initial period. In the 2°C scenario production begins to decline in 2020, as the high and ever increasing carbon tax increasingly weighs on demand.

POLES model projections of adaptation and mitigation in Europe
- 74 -
0
20
40
60
80
100
120
2000 2010 2020 2030 2040 2050
Mbd Total
Gulf
Conventionnal
Oil Production - REF Sc.
0
20
40
60
80
100
120
2000 2010 2020 2030 2040 2050
Mbd
Total
Gulf
Conventionnal
Oil Production - 2°C Sc. (450 ppm)
0
20
40
60
80
100
120
2000 2010 2020 2030 2040 2050
Mbd
Total
Gulf
Conventionnal
Oil Production - 2°C Sc. (400 ppm)
Source: POLES-LEPII ADAM
Figure 4-35: World oil production
After 2020, global crude oil and natural gas prices begin to be much lower in the 2°C scenario than in the Reference. However, it should be noted that these lower prices are only for oil and natural gas prices on the international markets or for imports. This lower level is of course not reflected in the prices charged to end-users and consumers, since the carbon tax component of the final price increases sharply.

ADAM 2-degree scenario for Europe – policies and impacts
- 75 -
0
20
40
60
80
100
120
2000 2010 2020 2030 2040 2050
€05/
boe
OilGas (Asia)Gas (Europe)Gas (America)Coal (Asia)Coal (Europe)Coal (America)
International Prices - REF Sc.
0
20
40
60
80
100
120
2000 2010 2020 2030 2040 2050
€05/
boe
OilGas (Asia)Gas (Europe)Gas (America)Coal (Asia)Coal (Europe)Coal (America)
International Prices - 2°C Sc. (450 ppm)
0
20
40
60
80
100
120
2000 2010 2020 2030 2040 2050
€05/
boe
OilGas (Asia)Gas (Europe)Gas (America)Coal (Asia)Coal (Europe)Coal (America)
International Prices - 2°C Sc. (400 ppm)
Source: POLES-LEPII ADAM
Figure 4-36: Energy prices
One of the most noteworthy differences between the Reference and the 2°C scenarios concerns the growth in total primary energy consumption and its structure. In the Reference scenario, because of the increasing scarcity of crude oil, there is a considerable increase in the use of coal, leading to dramatic developments for the global climate. On the contrary, in the 2°C scenario oil indeed becomes relatively more abundant and cheaper. This is probably the greatest "win-win" benefit for climate policies that has been identified so far.
4.3.2.2 Technological changes induced by the scenario
Drastic carbon emission reductions in the energy sector will be obtained both by reductions in the demand for energy and by modifying the corresponding supply-mix, in particular of electrical power. The first type of measures aiming at modifying the demand for energy includes the constant promotion of a high level of energy efficiency in all sectors and, in the longer term, the deployment of very low energy consumption technologies and equipment in the construction, transportation and manufacturing sectors.
The second category of measures includes four different options for "decarbonising" the energy sector, in particular power production. The first one is simply the substitution of natural gas for crude oil and coal, that takes advantage of the lower CO2 content by unit of delivered energy of natural gas burning, while the three other options involve distinct families

POLES model projections of adaptation and mitigation in Europe
- 76 -
of technologies: renewable energies; nuclear power (using current technology reactors and new "fourth-generation" reactors); and finally, CO2 capture and storage for large thermal power plants and other consumption units.
Although all of these actions are used to achieve the carbon emissions reduction target in the 2°C scenario, their respective contribution to emission reductions varies over the period. Initially, the bulk of reductions are obtained by substituting natural gas for coal and crude oil in those applications where these fossil fuels can easily be substituted, in particular in the generation of electrical power. Subsequently, cleaner power production technologies (renewable energy, nuclear power and carbon capture and storage) are sufficiently developed to achieve most of the reductions up to 2040. Towards the end of the period, the spread of "very low emissions" demand technologies in buildings where the long lifetime is a constraint to rapid deployment will once again make the greatest contribution to emission reductions.
0
10 000
20 000
30 000
40 000
50 000
60 000
70 000
2000 2010 2020 2030 2040 2050
TWh
Other renewables
Nuclear
Biomass
Natural gas
Oil
Coal, l ignite
World Electricity production - REF Sc.
0
10 000
20 000
30 000
40 000
50 000
60 000
70 000
2000 2010 2020 2030 2040 2050
TWh
Other renewables
Nuclear
Biomass
Natural gas
Oil
Coal, l ignite
World Electricity production - 2°C Sc. (450 ppm)
0
10 000
20 000
30 000
40 000
50 000
60 000
70 000
2000 2010 2020 2030 2040 2050
TWh
Other renewables
Nuclear
Biomass
Natural gas
Oil
Coal, l ignite
World Electricity production - 2°C Sc. (400 ppm)
Source: POLES-LEPII ADAM
Figure 4-37: World electricity production
It should be noted here that renewable energies and nuclear power make an increasingly large contribution to the reduction effort, whereas the impact of carbon capture and sequestration technologies diminish at the end of the period, due to the increasing costs of storage sites and
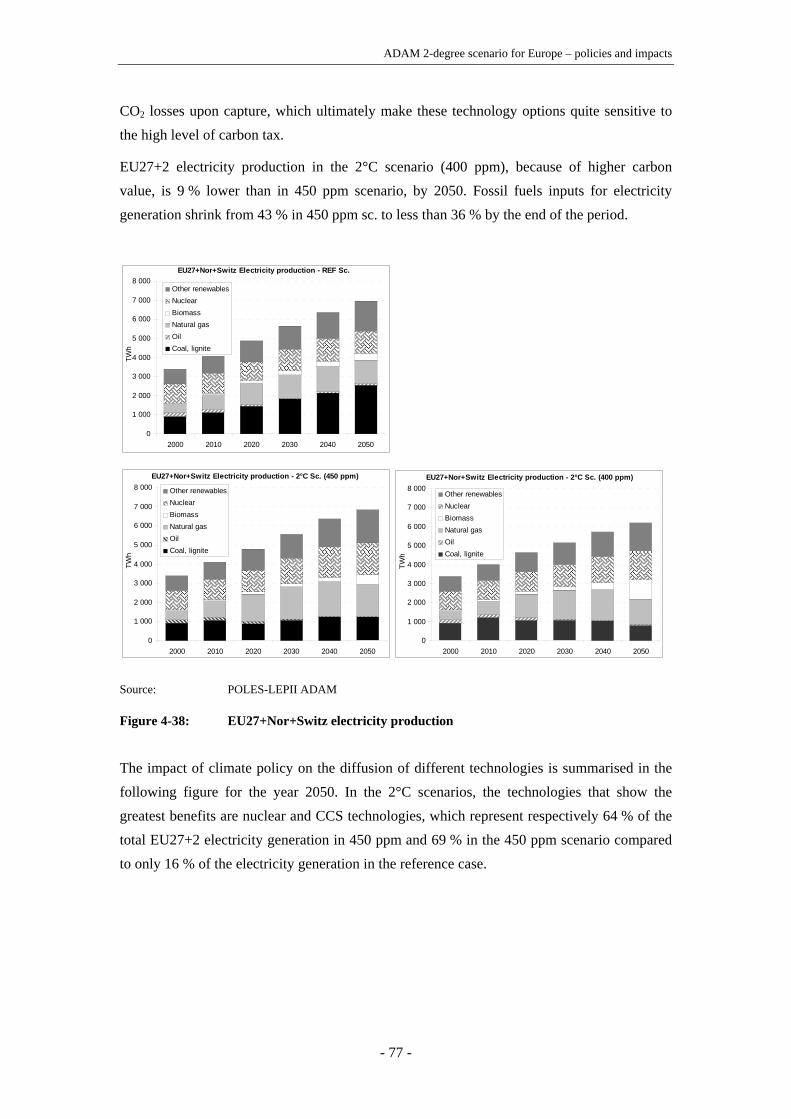
ADAM 2-degree scenario for Europe – policies and impacts
- 77 -
CO2 losses upon capture, which ultimately make these technology options quite sensitive to the high level of carbon tax.
EU27+2 electricity production in the 2°C scenario (400 ppm), because of higher carbon value, is 9 % lower than in 450 ppm scenario, by 2050. Fossil fuels inputs for electricity generation shrink from 43 % in 450 ppm sc. to less than 36 % by the end of the period.
0
1 000
2 000
3 000
4 000
5 000
6 000
7 000
8 000
2000 2010 2020 2030 2040 2050
TWh
Other renewablesNuclearBiomassNatural gasOilCoal, lignite
EU27+Nor+Switz Electricity production - REF Sc.
0
1 000
2 000
3 000
4 000
5 000
6 000
7 000
8 000
2000 2010 2020 2030 2040 2050
TWh
Other renewablesNuclearBiomassNatural gasOilCoal, lignite
EU27+Nor+Switz Electricity production - 2°C Sc. (450 ppm)
0
1 000
2 000
3 000
4 000
5 000
6 000
7 000
8 000
2000 2010 2020 2030 2040 2050
TWh
Other renewablesNuclearBiomassNatural gasOilCoal, lignite
EU27+Nor+Switz Electricity production - 2°C Sc. (400 ppm)
Source: POLES-LEPII ADAM
Figure 4-38: EU27+Nor+Switz electricity production
The impact of climate policy on the diffusion of different technologies is summarised in the following figure for the year 2050. In the 2°C scenarios, the technologies that show the greatest benefits are nuclear and CCS technologies, which represent respectively 64 % of the total EU27+2 electricity generation in 450 ppm and 69 % in the 450 ppm scenario compared to only 16 % of the electricity generation in the reference case.

POLES model projections of adaptation and mitigation in Europe
- 78 -
0% 5% 10% 15% 20% 25%
PFC
PSS
ICG
ICS
LCT
CCT
OCT
GCT
GGT
OGC
GGS
GGC
BGT
BCS
BTE
NUC
NND
CHP
SPP
HFC
HYD
WND
WNO
DPV
SHY 2°C Sc. (400 ppm)2°C Sc. (450 ppm)REF Sc.
2050
Source: POLES-LEPII ADAM10
Figure 4-39: EU27+NOR+SWITZ share of electricity production by technology in
Reference (bottom bar), 2°C 450 ppm (middle bar) and 2°C 400 ppm (to bar)
scenarios by 2050 in TWh
10 SHY - Small Hydro Power plants (<10 MWe), DPV - Decentralised building integrated PV
systems with network connection, WNO - Offshore Wind power plants, WND - Wind power plants for network electricity production, HYD - Conventional, large-size hydroelectricity, HFC - Stationary Fuel Cells with hydrogen, SPP - Solar Power Plants (thermal technologies for network electricity production), CHP - Combined Heat and Power (small to medium-size cogeneration in industry), NND - New Nuclear Design, NUC - Conventional Light-Water nuclear Reactor, BTE - biomass for thermal electricity, BCS - biomass for thermal electricity with sequestration, BGT - Biomass gasification for electricity production in GT, GGC - Gas-powered Gas Turbine in Combined Cycle, GGS - Gas-powered Gas Turbine in Combined Cycle with sequestration, OGC - Oil-powered Gas Turbine in Combined Cycle, GGT - Gas-powered turbine, GCT - Gas-powered Conventional Thermal, OCT - Oil-powered Conventional Thermal, CCT - Coal-powered Conventional Thermal, LCT - Lignite-powered Conventional Thermal, ICS - Integrated Coal Gasification with Combined Cycle with sequestration, ICG - Integrated Coal Gasification with Combined Cycle, PSS - Pressurised coal supercritical with sequestration, PFC - Pressurised coal supercritical.

ADAM 2-degree scenario for Europe – policies and impacts
- 79 -
While in the reference case, the technologies with sequestration do not appear at all, in the 2°C scenarios they represent 80 % and 83 % of the fossil based electricity generation respectively in the 450 and 400 ppm scenarios by 2050 (Figure 4-40).
0
1 000
2 000
3 000
4 000
5 000
6 000
7 000
2000 2010 2020 2030 2040 2050
TWh
OtherFossil With SEQFossil WO SEQ
EU27+Nor+Switz Electricity generation with and w/o Sequestration - REF Sc.
0
1 000
2 000
3 000
4 000
5 000
6 000
7 000
2000 2010 2020 2030 2040 2050
TWh
OtherFossil With SEQFossil WO SEQ
EU27+Nor+Switz Electricity generation with and w/o Sequestration - 2°C Sc. (450 ppm)
0
1 000
2 000
3 000
4 000
5 000
6 000
7 000
2000 2010 2020 2030 2040 2050
TWh
OtherFossil With SEQFossil WO SEQ
EU27+Nor+Switz Electricity generation with and w/o Sequestration - 2°C Sc. (400 ppm)
Source: POLES-LEPII ADAM
Figure 4-40: EU27 electricity production with and without sequestration
As indicated above, the 2°C scenarios have an impact not only on the diffusion of cleaner supply and conversion technologies, but they also accelerate the diffusion of new types of energy-consuming devices or infrastructures. Two key dimensions of this evolution are the development of very low energy (or positive) energy buildings, and the new low energy/emission vehicles.
The shares of electric and hybrid vehicles rise by 2050 respectively from 14 and 27 % of the fleet in the Reference case, to 26 % and 34 % in the 2°C scenario 400 ppm.

POLES model projections of adaptation and mitigation in Europe
- 80 -
0%10%20%30%40%50%60%70%80%90%
100%
2000 2010 2020 2030 2040 2050
%
CONV HYBV
ELEV GFCV
THYV HFCV
EU27+Nor+Switz - share of Light Vehicles - REF Sc.
0%10%20%30%40%50%60%70%80%90%
100%
2000 2010 2020 2030 2040 2050
%
CONV HYBV
ELEV GFCV
THYV HFCV
EU27+Nor+Switz - share of Light Vehicles - 2°C Sc. (450 ppm)
0%
10%20%30%40%50%60%70%80%90%
100%
2000 2010 2020 2030 2040 2050
%CONV HYBV
ELEV GFCV
THYV HFCV
EU27+Nor+Switz - share of Light Vehicles - 2°C Sc. (400 ppm)
Source: POLES-LEPII ADAM
Figure 4-41: EU27 diffusion of different types of vehicles in Mitigation and 2° C scenario
In the Reference scenario the share of low energy buildings in the residential sector is marginal, while in 2°C scenarios the share of low and very low energy buildings represents more than 40 % and 50 % of the building stock in Europe in 2050, in the 450 and 400 ppm scenarios respectively.

ADAM 2-degree scenario for Europe – policies and impacts
- 81 -
0%
10%
20%
30%
40%
50%
60%
70%
80%
90%
100%
2000 2010 2020 2030 2040 2050
%
Very low energy
Low energy
Standard
EU27+Nor+Switz - Buildings in residential - REF Sc.
0%
10%
20%
30%
40%
50%
60%
70%
80%
90%
100%
2000 2010 2020 2030 2040 2050
% Very low energy
Low energy
Standard
EU27 + Nor + Switz - Buildings in residential - 2°C Sc. (450 ppm)
0%
10%
20%
30%
40%
50%
60%
70%
80%
90%
100%
2000 2010 2020 2030 2040 2050
% Very low energy
Low energy
Standard
EU27 + Nor + Switz - Buildings in residential - 2°C Sc. (400 ppm)
Source: POLES-LEPII ADAM
Figure 4-42: EU27 diffusion of different types of buildings in Reference and 2°C scenarios
In order to analyse the relative weight of the different options examined above, the contribution of six major options to emission reductions can be traced through the projection period:
1. Energy-efficiency and very low emission buildings and vehicles
2. Changes in fuel-mix at the demand level
3. Changes in fuel-mix in the electricity sector
4. Renewable energies
5. Nuclear energy
6. Carbon capture and sequestration
Although all of these actions are used to achieve the carbon emissions reduction target in the stabilisation 2°C scenarios (Figure 4-43), their respective contribution to emissions reduction varies over the period. Initially, the bulk of reductions is obtained by substituting natural gas for coal and crude oil in those applications where these fossil fuels may be easily substituted, for instance in the generation of electrical power. Thereafter, cleaner power production technologies (renewable energy, nuclear power and carbon capture and storage) make an increasingly large contribution to the reduction effort.

POLES model projections of adaptation and mitigation in Europe
- 82 -
0
1 000
2 000
3 000
4 000
5 000
6 000
2000 2010 2020 2030 2040 2050
MtC
O2
Energy efficiencyEl Demand, fuel mixNuclearRenewablesFos. fuel mixSequestrationEmiss. in 2°C Sc.
2°C Sc. (450 ppm)
Emiss. in the REF Sc.
0
1 000
2 000
3 000
4 000
5 000
6 000
2000 2010 2020 2030 2040 2050
MtC
O2
Energy efficiencyEl Demand, fuel mixNuclearRenewablesFos. fuel mixSequestrationEmiss. in 2°C Sc.
2°C Sc. (400 ppm) Emiss. in the REF Sc.
Source: POLES-LEPII ADAM
Figure 4-43: EU27+Nor+Switz annual contribution of various actions to reduce CO2
emissions (Reference-2°C scenarios – 2000-2050)
A look at the cumulative contributions of the various actions to reduce carbon emissions from 2010 to 2050 shows that carbon capture and storage play the biggest role in bothe scenarios, followed by demand-related actions (for 400 ppm sc.), developing renewable energies, and in equal proportions, increasing nuclear power production and fossil-fuel substitution (Figure
4-44). It should be noted that these contributions are measured with respect to the trend projection, which explains why the incremental contribution of capture and storage is relatively large (it is very low in the trend projection) and why the renewable energy contribution exceeds that of nuclear power, whereas the absolute contribution of nuclear power to the global energy balance slightly exceeds that of renewable energies in both cases.
Sequestration : 35%
Energy efficiency : 1%Demand fuel mix : 18%
Nuclear : 15%
Renewables (elec) :11%
Fossil fuel mix (elec) : 20%
2°C Sc. (450 ppm) 2°C Sc. (400 ppm)
Sequestration : 30%
Fossil fuel mix (elec) : 16%Renewables (elec) :15%
Nuclear : 12%
Demand fuel mix : 15%
Energy efficiency : 12%
Source: POLES-LEPII ADAM
Figure 4-44: EU27+Nor+Switz Cumulative contributions of CO2 emission reduction
measures (2°C scenarios – 2000-2050)
As far as hydrogen production is concerned, Figure 4-45 shows that the volume of the world hydrogen production does vary from 600 PJ in the Reference scenario to 900, 1500 PJ in the 2°C scenarios (450 and 400 ppm) respectively. The role of the different hydrogen production technologies is also significantly modified.

ADAM 2-degree scenario for Europe – policies and impacts
- 83 -
0
200
400
600
800
1 000
1 200
1 400
1 600
2000 2010 2020 2030 2040 2050
PJ
BGSBGAOPOSMRWEWWEGWENNHTSHTBPYCGSCGAGSSGSR
EU27+Nor+Switz hydrogen production by technology - REF Sc.
0
200
400
600
800
1 000
1 200
1 400
1 600
2000 2010 2020 2030 2040 2050
PJ
BGSBGAOPOSMRWEWWEGWENNHTSHTBPYCGSCGAGSSGSR
EU27+Nor+Switz hydrogen production by technology - 2°C Sc. (450 ppm)
0
200
400
600
800
1 000
1 200
1 400
1 600
2000 2010 2020 2030 2040 2050
PJ
BGSBGAOPOSMRWEWWEGWENNHTSHTBPYCGSCGAGSSGSR
EU27+Nor+Switz hydrogen production by technology - 2°C Sc. (400 ppm)
Source: POLES-LEPII ADAM11
Figure 4-45: Hydrogen production
In the 2°C scenarios, the winning technologies are based on nuclear and biomass: hydrogen from water electrolysis nuclear dedicated (WEN), nuclear thermal high-temperature thermolysis (NHT), biomass gasification with sequestration (BGS) and biomass pyrolysis (BPY). Hydrogen production by these technologies represents around 79 % (400 ppm sc.) by 2050. 29 % of hydrogen production is provided by technologies with sequestration (see Figure
4-47).
11 Where: BGS- Hydrogen from biomass gasification with sequestration, BGA- Hydrogen from biomass gasification, OPO - Hydrogen from Heavy Fuel Oil Partial Oxidation , SMR - Hydrogen from Solar Methane Reforming, WEW - Hydrogen from Water Electrolysis dedicated Wind power plant, WEG - Hydrogen from Water Electrolysis baseload electricity from Grid, WEN- Hydrogen from water electrolysis nuclear dedicated, NHT - Hydrogen from nuclear thermal high-temperature thermolysis, SHT - Hydrogen from solar thermal high-temperature thermolysis, BPY - Hydrogen from biomass pyrolysis, CGS - Hydrogen from Coal Gasification with sequestration, CGA - Hydrogen from Coal GAsification, GSS - Hydrogen from Gas Steam Reforming with sequestration, GSR - Hydrogen from Gas Steam Reforming.

POLES model projections of adaptation and mitigation in Europe
- 84 -
0% 10% 20% 30% 40% 50%
GSR
GSS
CGACGS
BPY
SHT
NHTWEN
WEG
WEW
SMR
OPOBGA
BGS
2050
2°C Sc. 400 ppm
2°C Sc. 450 ppmREF Sc.
Source: POLES ADAM, 2°C scenarios
Figure 4-46: Share of EU27 hydrogen production by technology in Mitigation (top bar),
MITIGATION (low bar) scenarios in 2050 and 2050a in the world level
0
200
400
600
800
1 000
1 200
1 400
1 600
2000 2010 2020 2030 2040 2050
PJ
With SEQWO SEQ
EU27+Nor+Switz Hydrogen Production with and w/o Sequestration - REF sc.
0
200
400
600
800
1 000
1 200
1 400
1 600
2000 2010 2020 2030 2040 2050
PJ
With SEQWO SEQ
EU27+Nor+Switz Hydrogen Production with and w/o Sequestration - 2°C Sc. (450 ppm)
0
200
400
600
800
1000
1200
1400
1600
2000 2010 2020 2030 2040 2050
PJ
With SEQWO SEQ
EU27+Nor+Switz Hydrogen Production with and w/o Sequestration - 2°C Sc. (400 ppm)
Source: POLES-LEPII ADAM
Figure 4-47: EU27+Nor+Switz Hydrogen production with and without sequestration

ADAM 2-degree scenario for Europe – policies and impacts
- 85 -
Mobile uses of hydrogen are more important in the three scenarios compared to stationary uses. However, the share of the mobile markets is much more important in the 2°C scenarios than in the reference case (Figure 4-48).
0
200
400
600
800
1 000
1 200
1 400
1 600
2000 2010 2020 2030 2040 2050
PJ
MobileStationary
EU27 + Nor+ Switz hydrogen markets - REF Sc.
0
200
400
600
800
1 000
1 200
1 400
1 600
2000 2010 2020 2030 2040 2050
PJ
MobileStationary
EU27+Nor+Switz hydrogen markets - 2°C (450 ppm)
0
200
400
600
800
1 000
1 200
1 400
1 600
2000 2010 2020 2030 2040 2050
PJ
MobileStationary
EU27+Nor+Switz hydrogen markets - 2°C Sc. (400 ppm)
Source: POLES-LEPII ADAM
Figure 4-48: EU27 hydrogen markets, in Reference and 2°C scenarios
4.4 Conclusions on policies and reduction strategies by POLES The key insights of POLES in the ADAM project for the European energy technology policies can be summarized as follows:
• As already known, there is no silver bullet in climate policies, all the wedges of emission reductions have to be activated through time.
• Energy efficiency can be triggered in the short term through carbon pricing, while the diffusion of Very Low Energy Buildings and Very Low Emission Vehicles are important to emission reductions in the long term.
• Carbon Capture and Storage is an important option in the medium term, since from 2020 to 2050 it plays a major role in the decarbonization of the electricity sector.

POLES model projections of adaptation and mitigation in Europe
- 86 -
• Renewables and nuclear energy seem to play a somewhat minor role in the transition from Reference to 2°C; but this is largely an error of perspective as their development presupposes a major research and investment effort which is already in the Reference case.
In order to foster the decarbonization of the European energy system comprehensive policies should certainly:
• Give a price to carbon; this will provide the pervasive signal that is necessary for the taking into account of the carbon constraint by all economic agents … as for the triggering of private R&D in low carbon technologies.
• Develop massive public R&D policies in the four main areas of emission reduction and low-carbon supply: end-use technologies, renewables, nuclear and carbon capture and storage.
• Accelerate the dissemination of the low carbon technologies through norms and standards wherever it is appropriate: buildings, vehicles power plants etc.
• Create the urban and transport infrastructures that will allow reducing the energy needs and accelerating the diffusion of low carbon technologies.

ADAM 2-degree scenario for Europe – policies and impacts
- 87 -
5 Forest and basic materials sector
Authors: Mart-Jan Schelhaas, Laura Quandt
5.1 Forest sector
5.1.1 Target of analysis
Forests of the EU 27+2 countries comprise some 156 million ha, or 34 % of the land surface. Since most of these forests are harvested for only about 60% of their increment, a vast resource of stemwood standing stock has developed over the last decades. This and the generally good accessibility of the forests, makes that biomass from these existing forests is seen as potentially a significant source of raw material for bio energy purposes. In earlier analyses, the technical potential for delivery of biomass from forests has been quantified until 2050 (Jochem et al., 2007; Jochem and Schade, 2008), assuming an unchanged demand for other wood products. This technical potential has been used in the model system (mainly PowerAce) of M1 to ensure that the use of forest biomass in the energy system was within sustainable limits. Apart from the use of biomass for bioenergy, forests deliver the material for many products like paper and construction timber. Within M1, this type of demand is quantified by the MATEFF model. In this chapter, we describe how the combined demand for conventional wood products and biomass for bioenergy as defined by the M1 model system affects the carbon sink in the forest, using the EFISCEN model as before.
5.1.2 Assumptions and model rationale
EFISCEN is an area-based matrix model that simulates the dynamics of the stemwood volume in a forest (Schelhaas et al. 2007), given a certain harvest level and basic management regime. For other tree organs as leaves, branches and roots, a detailed biomass expansion database is incorporated. The soil model YASSO (Liski et al., 2005) is incorporated to project development of soil carbon stocks, given inputs from litter turnover and harvest residues. Basic outputs of EFISCEN are developments of area, standing stock, increment, standing dead wood, harvest level, extracted residues, age class distribution, and carbon stock in soil and biomass over time. EFISCEN can be used to give projections of wood production and carbon stock changes in tree biomass and soils in European forests up to many decades (Nabuurs et al. 2007, Schelhaas et al. 2007).
Projections made with EFISCEN are initialised making use of detailed national forest inventories that were specifically gathered for this purpose from National forest inventory institutes. The standard EFISCEN management regimes were used in this study (Nabuurs et

Forest and basic materials sector
- 88 -
al., 2007); nature oriented management in forestry or adaptation of forest management to climatic change was not taken into consideration. Climate change effects on forest growth were incorporated, based on the process-based model chain SMART-SUMO-WATBAL (Wamelink et al., 2009), which was applied to Intensive Forest Monitoring level plots in mid and high latitudinal Europe (Pussinen et al., 2009). For Southern Europe, expected impacts were based on a literature survey. Effects of climate change on extreme events (fires, storms) were not taken into account.
For the period 2010-2050, total demand for conventional products and biomass for energy was delivered by the other models within ADAM, given in m3 wood underbark. This was multiplied with 1.12 for conversion to overbark, as needed by EFISCEN. From the results of the Reference scenario we calculated for each country which fraction of the total removed biomass was covered by extraction of forest residues. This fraction was used to calculate total stemwood demand from the total demand. The fraction of residues from thinnings and fellings (branches, tops and roots) that is extracted from the forest was assumed to be unchanged as compared to the Reference Scenario. Before 2010, harvest was derived from FAOSTAT data (FAOSTAT 2008). Results are presented for four country groups (see Table 5-1).
Table 5-1: Division of European countries into four regions
Central\western Europe Austria
Belgium/Luxembourg France Germany Ireland the Netherlands Switzerland United Kingdom Mediteranean Italy Portugal Spain Scandinavia Denmark Finland Norway Sweden Eastern Europe Bulgaria Czech Republic Baltic states Hungary Poland Romania Slovakia Slovenia

ADAM 2-degree scenario for Europe – policies and impacts
- 89 -
5.1.3 Results
The total demand for wood from the forest is projected to increase from slightly under 600 million m3 underbark in 2010 to over 900 million m3 by 2050 (Figure 5-2). Most of this increase is caused by increased demand for biomass for heat and especially electricity. In 2010, the majority of the demand is still for conventional products (62%). By 2050, equal shares of the demand are for products and biomass for heat or electricity.
0100200300400500600700800900
1000
2010
2015
2020
2025
2030
2035
2040
2045
2050
Dem
and
(Mm
3 rou
ndw
ood
unde
rbar
k)
heatelectricityproducts
Figure 5-1: Demand for domestically produced wood as given by the M1 modelling system,
expressed in roundwood volume equivalents, 2010 to 2050.
The gradual increase in harvest level slows the build-up of stemwood standing stock (Figure 5-2B). Eventually the stemwood standing stock stabilizes in most regions. As a consequence, the total carbon sink in the forest is decreasing over time, from 128 Tg C/yr in 2005 to 85 Tg C/yr in 2050 (Table 5-2). The soil sink is rather stable, amounting to 30-40 Tg C/yr for total Europe. Only in the Mediterranean region it is a small source around 2015. The biomass sink for total Europe displays more volatility, starting at 100 Tg C/yr, decreasing to 36 Tg C/yr by 2040, and increasing again afterwards. This volatility is caused by opposing patterns in the different regions. In Central/Western Europe and Eastern Europe the biomass sink is currently rather high, but declines to virtually zero in 2050. In Scandinavia, the biomass sink is increasing after 2040, due to increased increment in this region due to higher temperatures. In the Mediterranean region, the biomass sink gradually increases towards 2030 and decreases afterwards, due decreased increment caused by climate change.

Forest and basic materials sector
- 90 -
Central/Western Europe
0
25
50
2005 2010 2015 2020 2025 2030 2035 2040 2045 2050
Year
Tg
C y
r-1
C Mediterranean Europe
0
25
50
2005 2010 2015 2020 2025 2030 2035 2040 2045 2050
Year
Tg
C y
r-1
D
Skandinavia
0
25
50
2005 2010 2015 2020 2025 2030 2035 2040 2045 2050
Year
Tg
C y
r-1
E Eastern Europe
0
25
50
2005 2010 2015 2020 2025 2030 2035 2040 2045 2050
Year
Tg
C y
r-1F
Total Europe
0
50
100
150
2005 2010 2015 2020 2025 2030 2035 2040 2045 2050
Year
Tg
C y
r-1trees
soil
A Growing stock
0
50
100
150
200
250
300
2005 2010 2015 2020 2025 2030 2035 2040 2045 2050
Year
Gro
win
g st
ock
(m3 h
a-1)
Central/Western Europe Eastern EuropeMediterranean SkandinaviaTotal Europe
B
Figure 5-2: Carbon sink in the soil and biomass compartments (Tg C/yr) for Europe (A) and
the four regions (C-F), and development of average timber stock (B, m3/ha).
Table 5-2: Total carbon sink in the forest (biomass plus soil, Tg C/yr) per region and for total
Europe, 2010 to 2050
Country group 2005 2010 2015 2020 2025 2030 2035 2040 2045 2050 Scandinavia 42 39 39 38 46 48 36 26 36 53 Central/Western Europe 50 47 42 40 39 34 25 20 13 9 Eastern Europe 31 22 17 13 18 18 15 10 8 11 Mediterranean 6 5 4 12 15 21 19 18 16 12 Europe 128 113 102 103 119 121 95 74 73 85
The total demand for wood and biomass is very close to the maximum the forest can deliver, as was specified by EFISCEN under climate change conditions (Jochem and Schade, 2009). As a consequence, the mitigation function of the forest is shifting from physical carbon storage in the biomass and soil towards avoiding greenhouse gas emissions from fossil fuels by delivering biomass for bioenergy. The carbon that is released by burning of the biomass will be taken up by the vegetation again, and thus this process is seen as carbon neutral (apart from emissions in harvesting, processing and transport). This cycle can be repeated endlessly, without risk of loosing previously gained carbon. The opposite is true for carbon storage in

ADAM 2-degree scenario for Europe – policies and impacts
- 91 -
biomass and, to a lesser extent, soil. Storage of carbon in the forest biomass will reach a limit sometime, and there is always a risk that part of the carbon stored will be released again, for example due to disturbance events. Kundzewicz et al. (2009) studied the future risk for disturbances (fires and storms) in the forest and possible adaptation measures in the A2 workpackage within the ADAM project. Under climate change, forest fires are expected to become more common, and storm activity might increase as well. An increase in harvest level will contribute to limit the risk of wind damage in forest, by limiting the numer of old stands and the amount of timber (and thus carbon) present in the forest (Kundzewicz et al., 2009). However, at the same time it increases the risk of forest fires, since more stands will be in the vulnerable young stage (Kundzewicz et al., 2009). However, the removal of harvest residues from the forest decreases the fuel load for fires and might contribute to lower the risk. This factor was not taken into account by Kundzewicz et al.
A very uncertain factor is how much climate change will influence the growth of the forest. The potential for delivering biomass from the forest increased by 20% in 2050 when the effects of climate change where taken into account. If climate change will have less effect on the increment, the harvest level cannot increase as far as suggested in this scenario. Therefore, it will be very important to monitor the forest growth in future and adjust harvest levels and industry expectations based on this.
Although an increase in harvest level and removal of harvest residues is needed and even preferable in some cases, it is the question if it can be realised to this extent. Increased harvest and residue removal might conflict with other functions of the forest, like nature conservation, soil and water protection and recreation. Furthermore, many forest owners seem to be not sensitive to financial stimuli in their forest management. Subsidies and increased prices might therefore not be enough to increase the harvest level to the extent needed as sketched by the M1 modelling system. Currently, several studies are looking into alternative ways to stimulate owners to mobilise their wood resources.
5.1.4 Conclusions
In order to reach the target for the 400 ppm scenario, the harvest of wood and extraction of residues need to be increased close to the maximum the forests can sustain. As a consequence, the carbon sink in biomass and soil will decrease, which will be (partly) compensated for by avoided emissions from fossil fuels. An increased harvest level will contribute to limit the wind risk in forests. The effect on fire risk is not clear, with increased risk due to an increasing number of young stands and decreased risk due to lower fuel load when harvest residues are removed. Part of the increase in harvest level can be obtained due to expected positive effects of climate change on the growth of the forest. However, the exact magnitude

Forest and basic materials sector
- 92 -
of the effect is still unsure, and close monitoring of the balance between growth and harvest is needed. In order to reach the required harvest level, much effort will be needed in the policy domain to convince forest owners to harvest more. Such efforts could include for example full-service contracts to small private owners, support to ownership co-operations, support in making management plans, awareness campaigns about the environmental benefits of biomass harvest, and stimulation of integration of different types of measures with biomass removal (nature conservation measures, fuel reduction against forest fires).
5.2 Assumptions and results of the MATEFF model – Reference and 2°C Scenario - 2000 to 2050
The model used for simulating the development of energy-intensive materials and products is called MATEFF (derived from material efficiency). The production of such energy-intensive products and materials is an important driver of industrial energy demand. However, the results of the projections of the macroeconomic models given as value added or net production of these basic materials do not reflect the development of the physical production of these materials, because quality improvements increase the value added, increasing rates of recycling or additional services of the related industrial sectors (e.g. consulting, product development for customers) add to intra-industrial structural change. It is important, therefore, to consider these aspects in the Reference Scenario as normal intra-industrial structural change and as a policy option of climate change in the 2°C Scenario. If these aspects and policy options of material efficiency – in form of less use of material for the same product function (e.g. lighter cars by using thinner steel sheets), material recycling (e.g. paper, aluminium, glass, copper) and product re-use (e.g. truck tires) - are not taken into consideration, the energy demand projections and related CO2 emissions of energy-intensive bulk product will be overestimated when they take the value added data of the macroeconomic models as the driver for energy demand.
MATEFF, therefore, is an important part of the TRANSFORM module of the hybrid model system (HMS) to transform the value added or net production figures of the macroeconomic models into physical production figures that can be directly related to energy demand by technical data of specific energy demand of the related products in industry (see Chapter 8). The MATEFF model is shortly described in Chapter 3 and was specifically developed ion the ADAM project. in order to demonstrate the important role of material efficiency policies as a part of an ambitious climate change policy reflected in the 2°C Scenario.

ADAM 2-degree scenario for Europe – policies and impacts
- 93 -
5.2.1 Assumptions about the demand of energy-intensive products
The assumptions for the development of the physical production of energy-intensive materials were based on two alternative methods:
• Trend estimates of per capita production of the energy-intensive basic products is one option, particularly if saturation effects were able to be observed in the past, or are anticipated in the future, or
• the use of a statistically estimated relation between the economic production figures of the basic material industries projected by the macroeconomic models and the physical production of the basic products which often reflects the trends to higher value added, higher material quality and improved properties.
The following sections briefly describe the assumptions and method used for the main basic materials such as steel, aluminium, glass, paper, cement, and plastics. The assumptions and results concerning the different industrial sectors are identical in the Base Case Scenario (see Deliverable M1.1: Report of the Base Case Scenario for Europe) and the Reference Scenario (see Chapter 5.2.1.1). In contrast, the assumptions of the 2°C Scenario are quite different and assume rapid progress in material efficiency in order to reduce industrial energy demand in the basic product industries (see Chapter 5.2.1.2).
A few of the projections for energy-intensive products presented in Deliverable M1.1 have been revised due to new data. The assumptions and results of the Reference and the 2°C Scenario are described in the following sections or in the ANNEX , Chapter 16.2).
5.2.1.1 Reference Scenario – 2000 to 2050
The results of this scenario reflect the trend to material efficiency and intra-industrial structural change without any additional attempt to reduce the demand of energy-intensive materials.
Assumptions about the drivers of steel production in Europe
Steel is a much valued basic material with numerous uses as a raw material, half-finished product, finished product, transformed product or processed product. An enormous increase in competitiveness (improvement of energy and resource efficiency, minimisation of CO2 emissions, new steel grades, innovative and efficient steel production technologies) is apparent in every field of steel production.
World steel production has been increasing continuously at high rates since 1970. In 1970, world crude steel production equalled 595 million tonnes. In 2006, 1,240 million tonnes of crude steel were produced globally, worth around 670 billion €. There has been particularly rapid growth in steel production in China and India, demonstrated by the fact that 422.7

Forest and basic materials sector
- 94 -
million tonnes of crude steel were produced in China in 2006, which translates to about 324 kg/capita and year.
In comparison, the EU27 produced 206.8 million tonnes of steel in 2006 even though the European Union (485 million inhabitants) is a leading steel market (426 kg/cap. per year). In 2006, in the EU27, the share of oxygen steel was 59.6 % and the share of electrical steel 40.1 %. Electrical steel is made out of steel scrap, whereas oxygen steel is mainly produced as a primary material from iron ore in blast furnaces. There is a large share of electrical steel in the highly industrialised countries of Europe with large capital stocks, which will continue to increase in the future.
Based on the production of oxygen steel and electrical steel in the year 2005, the development of steel production was estimated for EU27 (+ Norway, Switzerland, Turkey) by projecting the steel production per capita of the European countries in the years 2020, 2030, 2040 and 2050 (see table 16-4 and Table 16-5). The data between these reference points were calculated as a linear increase or decrease. When estimating per capita steel production, two different trends have to be considered for the next decades:
• The older the capital stock of an industrialised country, the more steel scrap becomes available. This increases the potential for electrical steel production in the country considered.
• The more industrial goods with steel parts are imported into a country, the more likely it is for domestic steel production to be reduced, particularly oxygen steel.
As a result of these basic trends, increasing shares of electrical steel production can be expected, especially in the smaller European countries where crude steel production in blast furnaces is no longer economically feasible. In these cases, the share of electrical steel production may reach 100 % like in Denmark or Ireland in the year 2000 (see section 16.2.1).
The basic assumption made about crude steel production in European countries is that it declines after a peak due to the end of industrialisation and motorisation of a country. Therefore, Eastern European countries either exhibit a still growing or a stagnating pattern of steel production, while Western European countries all have declining trends in steel production in physical terms. However, as increasing amounts of steel scrap become available, these serve as secondary material for the electric arc process which shows increasing or stagnating trends. The overall result is that the per capita crude steel production is declining slightly in most EU-15 countries. However, in some Eastern European countries and Turkey, per capita production will continue to increase until 2030 (see Chapter 16.2.1).
Assumptions about the drivers of aluminium production in Europe
Aluminium is a young material compared to steel. Its specific weight is considerably less than steel which is the major reason it is often preferred to steel in mobile applications when

ADAM 2-degree scenario for Europe – policies and impacts
- 95 -
lightweight solutions are necessary (e.g. airplanes, elevators, packaging, car wheels or even cars and windows). However, the production of primary aluminium is very electricity-intensive due to its electrolytic production process and it is also costly compared to steel. Therefore, aluminium is in stiff competition with steel as well with plastics, as plastics also have low specific weight and similar properties to aluminium (such as no corrosion, recyclable (polymers), and similar prices).
Aluminium can easily be recycled by melting aluminium scrap. Because of the high price per ton of primary aluminium (about 2,000 € / t), the production of secondary aluminium is very attractive and recycling a widespread practice. As aluminium is a young material, the share of secondary aluminium in total aluminium production should be rather low. Since primary aluminium is so electricity-intensive, much of it is produced in countries with cheap electricity (like Canada or Australia). Austria, the Baltic States, Belgium/Luxembourg, Bulgaria, Denmark, Finland, the Czech Republic, Ireland, Malta/Cyprus and Portugal do not have any primary aluminium production. Based on production in the year 2005, the development of primary aluminium production was estimated for EU27 (+ Norway, Switzerland, Turkey) applying the following basic considerations:
• Most of the increases in primary aluminium demand in Europe will be satisfied by imports from countries with cheap electricity.
• In many European countries, existing production capacities will be maintained (but not enlarged) and mostly re-invested (but not in Germany or in other European countries in cases of re-investments in the next decades).
• The production data between the estimated values for each decade were calculated as linear increases or decreases.
The primary aluminium production of France, Hungary, Romania and Spain remains constant after 2030 (see Chapter 16.2.1).
Assumptions about the drivers of cement production in Europe
Cement is an important construction material, not only for houses and buildings, but also for the transportation infrastructure of a country such as bridges, tunnels, roads or airports. This means that the development of a country's population, country size and topography and transportation infrastructure are major determinants when estimating the cement demand of an industrialised country. It also means that each industrialised country experiences a maximum cement demand per capita during its capital stock construction phase. This per capita cement demand decreases afterwards to a lower cement demand per capita for fully industrialised countries when only re-investments have to be made. This consideration implies that per capita estimates are the best method, assuming that cement is cheap to produce and expensive to transport over long distances so that changing trade patterns are unlikely in the future.

Forest and basic materials sector
- 96 -
The relevant economic branch "non-metal minerals", simulated by the E3ME and the ASTRA models, shows moderate growth for the EU15 countries plus Norway and Switzerland and generally higher growth for Eastern European countries. Although the non-metal minerals cover many more industrial products than just cement (e.g. lime, bricks, glass (see Chapter 5.2.4) and ceramics), the economic development of this branch has been used as an indicator to differentiate the per capita estimates.
Based on the production of cement per capita in the year 2000, its development was estimated by country for the years 2020, 2030, 2040, and 2050 for EU27 (+ Norway, Switzerland, Turkey) (see Chapter 16.2.1).
Assumptions about the drivers of paper production in Europe
Paper is a natural material made from wood, recycled paper and additives. The average annual paper and board production grew by 3.3 % per year between 1980 and 1997 in Western Europe (Competitiveness Study of the European Pulp, Paper and Board Manufacturing Industry 1998, Confederation of European Paper Industries CEPI). This development was not actually expected by many experts in the 1990s as it was a widespread belief that the increasing use of computers and telecommunications would reduce the demand for paper in the near future. As paper production is quite energy- and resource-intensive, a new European declaration on paper recycling covers a total of 29 European countries and aims to ensure that the recycling rate reaches 66 % by 2010.
The paper production of the EU27 + Norway and Switzerland is calculated based on the following categories: production and net import of pulpwood (in metric tonnes), net import of pulp (in metric tonnes), insertion quotas of recycled paper (in %) and insertion quotas of additives (in metric tonnes). The following equation was used for paper production (see Equ. 5.2.1-1 ):
Production of paper =
(net import of wood pulp/pulp in tonnes + net import of pulpwood in tonnes + production of pulpwood in tonnes) / (1 – (additives in % of paper production + quotas of insertion of recycled paper in %) Equation 5.2.1-1
The economic data of the E3ME and ASTRA models form the basis used to define the main development trend concerning the wood and paper sector. The development of different wood-classes therefore follows the progression of the E3ME-sector “wood and paper” from 2005 until 2030 as well as the ASTRA-sector “paper” from 2030 to 2050. It should be noted

ADAM 2-degree scenario for Europe – policies and impacts
- 97 -
that the ASTRA-sector “paper” combines the two E3ME-sectors “wood and paper” and “printing and publishing”.
In the rich Western European countries, the elasticity factor - the relation between physical growth and economic growth - was selected as 40 % of the annual economic increase from 2005 to 2030. In some Eastern European countries (Estonia, Latvia, Lithuania, Slovakia, Slovenia, Bulgaria, Romania), the elasticity factor was estimated as 50 % between 2005 and 2030, because their industry sector “wood and paper” was assumed to grow faster. The remaining annual economic increase is not due to increasing physical paper production, but due to improved paper quality, wood products, and printing as well as publishing activities which all add to the growth in value added of the sector (Detailed results see Chapter 16.2.1).
Assumptions about the drivers of glass production in Europe
The glass industry is very heterogeneous, with a wide variety of products and applications (food industry, construction industry, beverage industry, automotive industry, etc.). But the glass industry in Europe only consists of a very limited number of companies. Where glass production is restricted to just two or three national manufacturers, production data are confidential. Therefore there are few publicly available statistics of glass production in Europe. Only global production figures by glass types are available at EU level.
Europe is the most mature glass market and has the highest proportion of value-added products (Pilkington). About 30 million tonnes of glass are produced here each year. Container glass represents the largest share (~ 61 %) followed by flat glass (~ 26 %) and other glass (~ 13 %). Germany is the biggest manufacturer of glass (~ 24 %) followed by France (~ 18 %) and Italy (17 %). In 2005, the glass industry was run at around 90 percent capacity utilisation, globally (Pilkington).
The European glass industry shows a stable development of production with a marginal increase (~1 % per year) over the last few years. In contrast, the glass demand of the various countries has grown more quickly than their GDP over the last 20 years (Pilkington). Furthermore, the demand for value-added products is growing at a faster rate than the demand for basic glass.
The basic data defining the development of production in the glass sector are economic production data from the E3ME and ASTRA models, i.e. the development of the different glass categories (flat glass, container glass, other glass) follow the progression of the E3ME-sector “non-metallic mineral products” from 2005 until 2030 and of the ASTRA-sector “non-metallic mineral products” from 2030 to 2050.
In most Western European countries (Austria, Belgium/Luxembourg, Denmark, Finland, France, Germany, Ireland, Italy, the Netherlands, Sweden, United Kingdom, Norway and Switzerland), the elasticity between physical and economic growth is 40 % of the annual

Forest and basic materials sector
- 98 -
economic increase from 2005 to 2030. In the poorer Western and Central European countries (Greece, Portugal, Spain, the Czech Republic, the Baltic States, Hungary, Poland, Slovakia, Slovenia, Bulgaria and Romania), the elasticity was estimated to be 50 % of the annual economic increase from 2005 until 2030 because the share of high value-added products in production is assumed to be lower and because there is a substantial demand for glass due to the increasing consumption of private households, investments in buildings and retrofitting windows. Since 1992, the average glass production growth in Turkey has been 5 % per year. Therefore the glass industry in Turkey is estimated to increase by 3 % from 2005 to 2030. Subsequently, in the years 2030 – 2050, glass production growth is assumed to decline to 2 % per year. There is no glass production in Malta or Cyprus (Detailed assumptions see chapter 16.2.1)
5.2.1.2 Assumptions about material efficiency in the 2°C Scenario – 2000 to 2050
Compared to the Reference Scenario, improved material efficiency and substitution of energy-intensive materials is assumed for all industry sectors in the 2°C Scenario. From 2000 to 2009, the Reference Scenario and the 2°C Scenario have identical production results in the basic product industry sectors. From 2010 to 2050, production changes take place in energy-intensive products due to the assumed high energy prices (including energy taxes and emission certificates, see Chapter 4) and climate change policies that include material efficiency and substitution policies at national and at EU level, as well as in most other parts of the world. Similar technological improvements are estimated for all the European countries so that production changes are calculated using the same factors for all these countries.
Assumptions about the drivers of steel production in Europe
Crude steel production, which includes electrical as well as oxygen steel, decreases in this scenario until 2050 in comparison to the Reference Scenario due to improved material efficiency and increased material substitution. Due to specific technical applications, the production of oxygen steel will not decline as much as electrical steel in the next 40 years (Table 5-3).
Table 5-3: Production changes (in %) of electrical and oxygen steel in EU27 + Norway,
Switzerland and Turkey compared to the Reference Scenario, 2000 – 2050
Energy-intensive product 2000-2010 2010-2020 2020-2030 2030-2040 2040-2050
Production changes in % per year compared to Reference Scenario Electrical steel 0.0 - 0.5 - 0.6
Oxygen steel 0.0 - 0.3 - 0.4 - 0.5
Source: BSR Sustainability GmbH

ADAM 2-degree scenario for Europe – policies and impacts
- 99 -
Assumptions about the drivers of aluminium production in Europe
In line with the assumptions about the drivers of steel production, primary and secondary aluminium production is also assumed to fall continuously in the future (see Table 5-4).
Table 5-4: Production changes (in %) of aluminium in EU27 + Norway, Switzerland and
Turkey compared to the Reference Scenario, 2000 – 2050
Energy-intensive product
2000-2010 2010-2020 2020-2030 2030-2040 2040-2050 Production changes in % per year compared to Reference Scenario
Primary aluminium 0.0 - 0.2 - 0.3
Secondary aluminium 0.0 - 0.2 - 0.3
Source: BSR Sustainability GmbH
Assumptions about the drivers of cement production in Europe
Similar to steel and aluminium production, cement production is assumed to decrease continuously in the future due to technological innovations and a global economic slowdown (see Table 5-5).
Table 5-5: Production changes (in %) of cement in EU27 + Norway, Switzerland and Turkey
compared to the Reference Scenario, 2000 – 2050
Energy-intensive product
2000-2010 2010-2020 2020-2030 2030-2040 2040-2050 Production changes in % per year compared to Reference Scenario
Cement 0.0 - 0.5
Source: BSR Sustainability GmbH
Assumptions about the drivers of paper production in Europe
Paper production in the 2°C Scenario is also reduced by between 0.5 % and 0.7 % per year in all European countries compared to the Reference Scenario (see Table 5-6). This development is due to the “paperless office” and technological innovations (like thin and flexible displays for books or newspapers, thinner paper types, etc.). The percentage of recycled paper does not change compared to the Reference Scenario.
Table 5-6: Production changes of paper (in %) in EU27 + Norway, Switzerland and Turkey
compared to the Reference Scenario, 2000 – 2050
Energy-intensive product 2000-2010 2010-2020 2020-2030 2030-2040 2040-2050
Production changes in % per year compared to Reference Scenario Paper 0.0 - 0.5 - 0.6 - 0.7
Source: BSR Sustainability GmbH

Forest and basic materials sector
- 100 -
Assumptions about the drivers of glass production in Europe
The glass production of other glass is identical to the results of the Reference Scenario. In contrast, container glass production is estimated to decrease by roughly -0.5 % to -1.0 % per year (see Table 5-7). For the same period, there is an increased production of flat glass compared with the Reference Scenario. This increase is due to rapidly growing photovoltaic cell production, window glass (for example triple glazing) and the demand of the automobile industry.
Table 5-7: Production changes of glass (in %) in EU27 + Norway, Switzerland and Turkey
compared to the Reference Scenario, 2000 – 2050
Energy-intensive product
2000-2010 2010-2020 2020-2030 2030-2040 2040-2050 Production changes in % per year compared to Reference Scenario
Container glass 0.0 - 0.5 - 0.8 - 1.0
Other glass 0.0
2000 -2010 2010 -2013
2014 -2020
2020 -2026
2026 -2036
2036 -2048
2048 -2050
Production changes in % per year compared to Reference Scenario Flat glass 0.0 + 1.3 + 1.2 + 1.1 + 1.0 + 0.9 + 0.8
Source: BSR Sustainability GmbH
5.2.2 Production changes in energy-intensive products
5.2.2.1 Reference Scenario – 2000 to 2050
Results for steel production in European countries – 2000 to 2050
The total crude steel production of EU27 plus Switzerland and Norway increases slightly from 195 Mt to 200 Mt, before slowly decreasing to about 191 Mt in 2030 (see Table 5-8). The decreasing population between 2030 and 2050 (-4.5 %) and increasing net imports of investment goods with steel components together have the effect of reducing crude steel production to 174 Mt in 2050, i.e. a drop of 9 % over two decades. If Turkey's steel production is included, the peak in steel production is postponed to 2030, and production in 2050 is about 11 Mt higher than in 2000 (i.e. +5.5 %; see Table 16-10).
Relative to the gross production of the basic metal industry, which stagnates until 2030, the estimates of crude steel production do not contradict the economic development of the larger economic sector (basic metals).
The development of electrical steel is more dynamic due to the basic assumption of increasing steel scrap. The electrical steel produced in EU27 plus Switzerland and Norway increases from around 80 Mt in 2000 to 95 Mt in 2050, i.e. by 19 % (see Table 16-11). This

ADAM 2-degree scenario for Europe – policies and impacts
- 101 -
raises the share of electrical steel in total crude steel production from 41.3 % in 2000 to almost 55 % in 2050.
The trends are similar even if Turkish steel production is included. However, the trend is then more pronounced. The share of electrical steel in total crude steel production increases from 82 Mt (or by 39.4 %) in 2000 to 115 Mt in 2050 (i.e. by 52.4 %). This equals an average annual growth of almost 0.7 % per year.
Table 5-8: Production of crude steel (oxygen steel + electrical steel) in Europe in 1000 tonnes,
Reference Scenario, 2000 – 2050
Country group Production of 2000 2010 2020 2030 2050
EU27 + 2 Oxygen steel 121,370 121,110 113,370 104,340 81,620 Electrical steel 73,280 78,330 82,730 87,090 92,980 Crude steel (oxygen steel + electrical steel) 195,140 200,110 196,430 191,400 174,720
Total Europe Oxygen steel 126,600 133,230 133,960 133,840 107,550 Electrical steel 82,370 93,780 99,130 104,500 112,600 Crude steel (oxygen steel + electrical steel) 209,470 227,670 233,430 238,300 220,270
Source: BSR Sustainability GmbH
Results for aluminium production in European countries – 2000 to 2050
The total production of primary aluminium increases from 4 Mt in 2000 to 6.1 Mt in 2050 (+52 %) due to substantial production increases in Norway and small increases in the UK, some central European countries, and Turkey. Including Turkey does not significantly alter the figures of total European primary aluminium production (to 6.2 Mt in 2050, seeTable 16-12).
The total production of secondary aluminium increases at a slightly faster rate than that of primary aluminium, reaching more than 4.1 Mt in 2050 (see Table 16-13). Starting from initial low values per capita, the highest growth is in Central European countries due to the expected modernisation of the capital stock here and also some shifting of production sites from Western to Central Europe. Looking at both types of aluminium, production increases significantly by more than 50 % from 2.7 Mt to slightly above 10 Mt (see Table 5-9).

Forest and basic materials sector
- 102 -
Table 5-9: Total production of aluminium (primary + secondary) in Europe in 1000 tonnes,
Reference Scenario, 2000 – 2050
Country group
Production of 2000 2010 2020 2030 2050
EU-27 + 2 Primary aluminium 4,020 4,900 5,290 5,650 6,130 Secondary aluminium 2,670 2,970 3,320 3,660 4,120 Total aluminium 6,690 7,870 8,610 9,310 10,250
Total Europe Primary aluminium 4,090 4,960 5,350 5,720 6,220 Secondary aluminium not
specified not
specified 3,370 3,720 4,200 Total aluminium not
specified not
specified 8,720 9,440 10,420
Source: BSR Sustainability GmbH
Results for cement production in European countries – 2000 to 2050
The total cement production of Europe is almost constant at around 240 Mt per year, but the long-term trend is a declining one: Cement production is reduced to 203 Mt in 2050. This decline reflects the basic influence of population and the assumption that rich, industrialised countries have completed their building stock and infrastructure and only need cement for re-investments. Major contributions to the drop in cement production between 2000 and 2050 are from Italy (-12.8 Mt), Spain (-15.2 Mt), and Greece (-10.2 Mt). If Turkey is included, European cement production stagnates one decade later, before also declining to 244 Mt in 2050, or by -12 % relative to the year 2000 (see Table 16-14).
Results for paper production in European countries – 2000 to 2050
The data of this sector are subject to further revision after 2030 as the economic data of ASTRA have been re-calculated which was not able to be reflected in the figures of Table 16-15. Total paper production in Europe increases from 93.3 Mt in 2000 to 134 Mt in 2030 (or by almost 44 % or 1.2 % per year). In the last two decades, paper production totals 158 Mt, i.e. slows down to an annual increase of 0.8 %, which still represents a substantial per capita growth of almost 1.2 % per year in the light of the shrinking population.
Results for glass production in European countries – 2000 to 2050
The total glass production of Europe increases from 35 Mt in 2000 to 43.2 Mt in 2030 (or by almost 23.4 % or 0.7 % per year (see Table 16-16). In the final two decades, glass production reaches more than 47 Mt and production slows to an annual increase of 0.4 %, which still represents a significant per capita growth of 0.65 % per year in the light of the shrinking population. If the Turkish glass industry is included, the increase in glass production is more pronounced, starting from 36.6 Mt and growing by almost 0.9 % per year to 47.3 Mt in 2003 and to 53 Mt in 2050 (i.e. by 0.57 % per year).

ADAM 2-degree scenario for Europe – policies and impacts
- 103 -
5.2.2.2 2°C Scenario - 2000 to 2050
Results for steel production in European countries – 2000 to 2050
The total crude steel production of EU27 plus Switzerland and Norway increases slightly in the 2°C Scenario from 195 Mt to about 199 Mt in 2010, before slowly decreasing to about 138 Mt in 2050 (see Table 5-10). Electrical steel production of EU27 plus Switzerland and Norway decreases only slightly in the 2°C Scenario from around 73 Mt in 2000 to 71 Mt in 2050 (see Table 16-18). Therefore, the share of electrical steel (EU27 + 2) in total crude steel production rises from 38 % in 2000 to 51 % in 2050 (see Table 16-17). Over the same time, the oxygen steel produced decreases from 121 Mt to 67 Mt (~-49 %). The total amount of crude steel production in EU27+2 in 2010 is only 1.4 Mt lower than in the Reference Scenario. The difference between the Reference and the 2°C Scenario concerning the amount of produced crude steel increases to 36 Mt in 2050 or from 0.4 Mt (2010) up to 21 Mt (2050) for electrical steel.
Table 5-10: Production of crude steel (oxygen steel + electrical steel) in Europe in 1000 tonnes,
2°C Scenario, 2000 – 2050
Country group Production of 2000 2010 2020 2030 2050
EU27 + 2 Oxygen steel 121,370 120,750 109,510 96,510 67,340 Electrical steel 73,280 77,940 78,100 76,990 71,040 Crude steel (oxygen steel + electrical steel)
195,140 198,690 187,610 173,500 138,380
Total Europe Oxygen steel 126,600 132,830 129,410 123,800 88,730 Electrical steel 82,370 93,310 93,580 92,380 86,030 Crude steel (oxygen steel + electrical steel)
209,460 226,140 222,980 216,180 174,750
Source: BSR Sustainability GmbH
Results for aluminium production in European countries – 2000 to 2050
The total production of primary aluminium increases from 4 Mt in 2000 to 5.4 Mt in 2050 (see Table 16-19). In contrast to the Reference Scenario, this means a decline of about 11.4 % for EU27+2 in the year 2050. In comparison, the total production of secondary aluminium increases, starting at 2.7 Mt in 2000 and reaching 3.7 Mt in 2050 (see Table 16-20). In the same period, the total amount of aluminium produced in EU27+2 increases from 6.69 Mt in 2000 up to 9.13 Mt in 2050 (see Table 5-11).

Forest and basic materials sector
- 104 -
Table 5-11: Production of aluminium (primary aluminium + secondary aluminium) in Europe
in 1000 tonnes, 2°C Scenario, 2000 – 2050
Country group
Production of 2000 2010 2020 2030 2050
EU27 + 2 Primary aluminium 4,020 4,890 5,170 5,350 5,430 Secondary aluminium 2,670 2,960 3,250 3,510 3,700 Total aluminium 6,690 7,850 8,420 8,860 9,130
Total Europe Primary aluminium 4,090 4,950 5,230 5,420 5,510 Secondary aluminium not
specified not
specified 3,290 3,570 3,770
Total aluminium not specified
not specified
8,520 8,990 9,280
Source: BSR Sustainability GmbH
Results for cement production in European countries – 2000 to 2050
In the 2°C Scenario, a substantial decrease in European cement production is assumed due to several factors: the stagnation or sometimes even decreasing per capita cement consumption, which already results in a decrease of almost 40 Mt by 2050 in the Reference Scenario. This decreases further by almost 42 Mt in the EU27+2 due to better design of buildings and built infrastructures, substitution by other construction materials such as metals, bricks, and wood, and higher cement quality. In total, EU27+2 countries produce 190 Mt cement in 2035 and only 162 Mt in 2050. Even in Turkey and some other EU countries, cement production starts declining after 2020 (see Table 16-21).
Results for paper production in European countries – 2000 to 2050
While in the Reference Scenario, paper production increased steadily over the whole period, in the 2°C Scenario, European paper policies induce a lower growth in paper demand, saving 10 Mt in 2020 and up to 90 Mt in 2050. This reduction is assumed to be achieved by lighter paper, new paper, paper substitution (including modern communication systems), and a more efficient packaging and copying use of paper in offices (front and back page). In total, this leads to a stagnation of paper production at around 118 Mt in Europe after 2035, which substantially reduces the energy demand for this energy-intensive product (see Table 16-22).
Results for total glass production in European countries – 2000 to 2050
The demand and related domestic production of glass is quite complex, because two complementary developments have to be taken into account. On the one hand, there are additional efficiencies in glass use and glass substitution (e.g. by plastics). On the other hand, there is increasing production of double and triple glazing for low energy and passive buildings in the 2°C Scenario leading to quite substantial differences among countries

ADAM 2-degree scenario for Europe – policies and impacts
- 105 -
between the Reference and the 2°C Scenario. This is why total glass production in Europe stagnates at around 2030 after an increase of 15% relative to 2005 (see Table 16-23). However, there are important structural changes in European countries: The new member states and some Western European countries which had low building standards in the past have small reductions in glass production, while southern European countries experience a reduction in total glass production of between 20 and 25%.
5.2.3 Remarks on data availability
There are marked differences in the availability of production output data in the various industry sectors.
The available database of the cement industry is relatively widespread. Historical data (including export and import data) for the countries are present in different databases. The oldest accessible data for cement production are from the year 1913 (World statistical review N°18, Cembureau). Current key factors of the cement industry sector are also available (Word Statistical Review (Annual), Cembureau). Useful sources for cement data were: The European Cement Association (CEMBUREAU), national federations (e.g. Verein Deutscher Zementwerke e.V. [VDZ], Bundesverband der deutschen Zementindustrie e.V. (BDZ), FEBELCEM, etc.) and national/international statistical offices (Eurostat, Destatis, etc.).
The availability of production data for the aluminium industry, the steel industry and the paper industry is also satisfactory. The Statistical Yearbooks of the Steel Industry and the Metallstatistik/Metal Statistics (World Bureau of Metal Statistics) are common benchmarks for metals, which contain data for most western and eastern European countries. These sources can be used as annual reports or taken from the Internet (e.g. US Geological Survey, USGS).
For the paper sector, the Verband Deutscher Papierfabriken e.V. (VDP), the Confederation of European paper industries (CEPI), Eurostat and the statistical database FAOSTAT of the food and agriculture organisation of the United Nations provide the best data.
In contrast to the sectors mentioned above, the glass sector and the wood sector have the poorest data availability. The glass production data are compiled from national sources (statistical offices, associations of the glass industry), annual reviews of companies, press releases, the Internet, glass market studies (e.g. Overview of Glass Container Production in the EU: 2006, British Glass), the Standing Committee of the European Glass Industries (CPIV) and the European Federation of Glass Packaging.
As already stated in the section "Assumptions on the drivers of glass production in Europe", the glass industry is very heterogeneous with a wide variety of products and applications (food industry, building industry, beverage industry, automotive industry, etc.). In addition

Forest and basic materials sector
- 106 -
there are problems with data confidentiality. Therefore the available statistics on glass production in Europe are very sparse. Production figures by glass types are only available at EU level (see Figure 5-3). Production data for most eastern European countries are very difficult to find.
The wood sector covers wood production for material utilisation (industrial wood) as well as wood production for energy use. But a large proportion of the wood produced is used privately by forest owners without any records. Therefore official statistics of “wood cuttings” do not feature the real amount of wood used. Furthermore the wood sector, which is not well organised, is subdivided into different industrial sectors and various categories of wood utilisations. In particular, there are not many subdivided statistics available for fuelwood (firewood, woodchips and wood pellets; see also section 5.3).
Source: The Standing Committee of the European Glass Industries
Figure 5-3: EU glass production 1980 to 2005

ADAM 2-degree scenario for Europe – policies and impacts
- 107 -
5.3 Wood fuel demand in Europe in the Reference and 2°C Scenario, 2000 to 2050
The MATEFF model also calculates the availability of wood fuels by receiving the figures of available round wood calculated by the EFISCEN model, taking the projections of the Paper demand and production from the MATEFF model, considering in addition the wood demand for the wooden products manufacturing and also the available waste wood from construction, saw dust and other wooden wastes. From this data, the total available wooden material as a potential for wood fuel is derived and can be used for projections of the potential for modern forms of wood use (e.g. chips and pellets). This method has been described in detail in Jochem et al. (2007).
5.3.1 The Reference Scenario
As the results of the EFISCEN model (see Chapter 5.1.2.1) show, there is slightly more roundwood available (including forest residues such as top wood or branches) in Europe in the Reference Scenario (+9.4 %) than in the Base Case Scenario. this is due to higher average temperatures and more precipitation north of the Alps. However, these changes are not uniform for total Europe, as there are favourable conditions for forests north of the Alps, but their growth is impeded south of the Alps due to diminished precipitation.
5.3.1.1 Assumptions on the Reference Scenario
There are considerable differences regarding roundwood availability (including forest residues) between countries north of the Alps and countries south of the Alps. In the Reference Case, the South-Alps region has less biomass available than the North-Alps region, because drier periods on the one hand and more irregular rainfall on the other hand are expected in this area. No changes are assumed for waste wood availability and wood-based products. There are also no different assumptions for fuel wood for cogeneration and district heating plants in the Reference Case. From 2000-2010, the data for the Reference Scenario in all sectors are taken from the Base Case Scenario. The general trend of the South-Alps region compared with the North-Alps region shows less biomass development (see Table 5-12).
Based on these assumptions, the Mateff model distinguishes between two regions for the calculations of fuelwood in Europe: South of the Alps and North of the Alps. Calculations and projections were made for both regions which are described below

Forest and basic materials sector
- 108 -
Table 5-12: Roundwood availability in EU27 (including forest residues), Reference Scenario,
2005 - 2050
Country group
Roundwood availability in PJ Difference to Base Case in % Base Ref. Base Ref. Base Ref. Base Ref.
2005 2020 2030 2050 2020 2030 2050 N. Alps 3,374 3,374 4,396 4,409 5,131 5,188 5,333 6,023 +0.3 +1.1 +13 S. Alps 1,106 1,106 1,287 1,279 1,510 1,503 1,960 1,954 -0.6 -0.4 -0.3 EU27+2 4,479 4,479 5,683 5,688 6,641 6,691 7,293 7,977 +0.1 +0.8 +9.4
Note: South Alps countries: Bulgaria, France, Greece, Hungary, Italy, Portugal, Romania, Slovenia, Malta,
Cyprus and Spain
Source: Efiscen, FAO 2008, own calculations
Countries south of the Alps
In the Reference Scenario, the countries further south of the Alps (Bulgaria, France, Greece, Hungary, Italy, Portugal, Romania, Slovenia, Malta, Cyprus and Spain) are forecasted to have a little less biomass than in the Base Case Scenario (-1.3% until 2050), because they are likely to be drier and experience more heavy rainfalls, but with less water available due to dried out soils. Based on these assumptions, the availability for woodchips directly from the forest (70 % of the woodchips) and firewood directly from the forests (80 % of the firewood) is assumed to decrease by 4% per year and country from 2011 onwards in private households, services, agriculture, district heating, co-generation and industry sectors as the demand of wood for construction and paper does not change in the Reference Scenario. However, this declining availability of fuel wood coincides with warmer temperatures and less heating demand (see Chapter 6.3 and 6.5).
Countries north of the Alps
The situation in the countries further north of the Alps (Austria, the Baltic, Belgium, Luxemburg, Czech Republic, Denmark, Finland, Germany, Ireland, Netherlands, Norway, Poland, Slovakia, Sweden, United Kingdom and Switzerland) is predicted to develop contrary to the development in the South, i.e. an increase in biomass. More wood is available than in the Base Case Scenario (+13%), because more biomass can grow in these countries due to warmer temperatures and advantageous growing conditions. The availability for woodchips and firewood is predicted to increase by almost of 4% per year and country from 2011 onwards in private households, services, agriculture, district heating, co-generation and industry.

ADAM 2-degree scenario for Europe – policies and impacts
- 109 -
5.3.1.2 Results of the Reference Scenario
Comparison firewood, pellets and chips demand
Contrary to the differences between the regions north and south of the Alps the EFISCEN model calculated for the total roundwood availability in EU27+2 (+9% in 2050 relative to the Base Case Scenario), total wood supply of the Reference Scenario (including wood wastes and landscape wood) available for fuelwood use in non-grid connected firing plants appears quite similar to the Base Case Scenario. The overall picture shows an increase in total fuelwood to a maximum of 2200 PJ in 2038 (see Table 5-13).
There may be a small unused potential due to some not implemented measures of sustainable forest management in some European countries. In 2050, total fuelwood amounts to about 2120 PJ in EU27+2. Looking at the Reference Scenario in more detail, it becomes obvious that woodchips substituting the firewood use pass the break even point in Europe around 2045 onwards. Woodchips from short rotation crops, such as already exist in Portugal, Sweden or Spain, can also displace conventional firewood (see Figure 5-4).
Comparison: Development of fuelwood demand EU-27+2 (2000 - 2050) Reference Scenario
0100200300400500600700800900
1.0001.1001.2001.3001.4001.5001.6001.7001.8001.9002.0002.1002.2002.3002.400
2000
2002
2004
2006
2008
2010
2012
2014
2016
2018
2020
2022
2024
2026
2028
2030
2032
2034
2036
2038
2040
2042
2044
2046
2048
2050
year
Dem
and
of fu
elw
ood
in P
J
Chips Total Pellets Total Fuelwood Total Firewood Total
Source: BSR-Sustainability 2008
Figure 5-4: Share of firewood and new forms of fuelwood, EU27+2, Reference Scenario, 2000
to 2050
The different kinds of fuelwood in detail
The detailed calculations of the different kinds of fuelwood - pellets, chips and firewood - are similar to the data in the Base Case Scenario. The Reference Scenario does not consider

Forest and basic materials sector
- 110 -
policy changes, so there are no differences in pellet demand to the Base Case Scenario, because pellets are mainly produced from sawdust and it is quite inefficient to produce pellets from fresh roundwood. Similar to the Base Case, pellet demand in 2050 is considered to increase up to 620 PJ in total (see Figure 5-5).
Table 5-13: Fuelwood demand in EU27+2 in the Reference Scenario
Country group
Fuelwood demand in PJ Difference to Base
Case in % Base Case
Reference Scenario
Base Case
Reference Case
Base Case
Reference Scenario
Base Case
Reference Case
2005 2020 2030 2050 2020 2030 2050 North-Alps 1,189 1,189 1,409 1,447 1,582 1,621 1,548 1,582 +2.7 +2.4 +2.2
South-Alps 416 416 433 432 517 515 537 535 -0.2 -0.2 -0.3
EU27+2 1,605 1,605 1,842 1,879 2,098 2,136 2,085 2,118 +2.0 +1.8 +1.6
Source: BSR-Sustainability 2008
Pellets demand EU-27+2 (2000 - 2050) Reference Scenario
0306090
120150180210240270300330360390420450480510540570600630660
2000
2002
2004
2006
2008
2010
2012
2014
2016
2018
2020
2022
2024
2026
2028
2030
2032
2034
2036
2038
2040
2042
2044
2046
2048
2050
year
Dem
and
of p
elle
ts in
PJ
PelletsTotal PelletsHH Pellets Service+Agriculture
Source: BSR-Sustainability 2008
Figure 5-5: Pellet demand (EU 27+2) in different sectors, 4° C Scenario, 2000-2050
Contrary to pellets, there is a higher increase in woodchip demand in EU27+2 in the Reference Scenario than in the Base Case Scenario, because more wood biomass is available and more wood can be used efficiently as chips either directly from the forest or from short rotation crops. There is an almost continuous increase in woodchip demand in the Reference

ADAM 2-degree scenario for Europe – policies and impacts
- 111 -
Scenario in Europe (EU27+2). Woodchips are mainly used in district heating plants, co-generation and industry. Total woodchip demand in 2050 is predicted to rise to 785 PJ (see Figure 5-6).
In the Reference Scenario, the firewood demand in Europe decreases by 46 % between 2000 and 2050 from around 1,320°PJ in 2000 to 710°PJ in 2050 (see Figure 5-7) which is essentially the same as in the Base Case Scenario. This means that the slightly higher biomass availability has no influence on firewood demand. The main share of this firewood is used in boilers, particularly in private households and farms outside of the cities, and also in boilers and wood gasification plants, particularly in industry and district heat plants.
Chips demand EU-27+2 (2000 - 2050) Reference Scenario
0
50
100
150
200
250
300
350
400
450
500
550
600
650
700
750
800
850
2000 2002 2004 2006 2008 2010 2012 2014 2016 2018 2020 2022 2024 2026 2028 2030 2032 2034 2036 2038 2040 2042 2044 2046 2048 2050
year
Dem
and
of C
hips
in P
J
ChipsTotal CHips Service ChipsIndustry Chipsdistrict&Cogeneration
Source: BSR-Sustainability 2008
Figure 5-6: Woodchip demand (EU27+2) by sectors, Reference Scenario, 2000 to 2050

Forest and basic materials sector
- 112 -
Firewood demand EU 27+2(2000-2050) Reference Scenario
0
100
200
300
400
500
600
700
800
900
1.000
1.100
1.200
1.300
1.400
2000
2002
2004
2006
2008
2010
2012
2014
2016
2018
2020
2022
2024
2026
2028
2030
2032
2034
2036
2038
2040
2042
2044
2046
2048
2050
Time
Dem
and
of fi
rew
ood
in P
J
Firewood Service+Agriculture Firewood Industry FirewoodHH Firewood Total all Sectors
Source: BSR-Sustainability 2008
Figure 5-7: Firewood demand of EU27+2 by sectors, Reference Scenario, 2000-2050
5.3.2 The 2°C Scenario
In the 2°C Scenario, the same distinction is made as in the Reference Scenario between the regions North-Alps and South-Alps for the projections of fuelwood. In addition to the relatively small changes in wood supply due to lower temperatures, the 2°C Scenario also assumes major policy changes and technical improvements; this leads to greater use of pellets and woodchips in all sectors, industry, co-generation and heating plants. For the first decade (2000-2010), however, the data for the 2°C Scenario remain the same as projected for the Base Case Scenario for all sectors because the changed policies do not have an effect before the second decade.
5.3.2.1 Assumptions of the 2° C Scenario
Based on the 2°C Scenario, the projections made by the MATEFF model include (small) changes in the growth of European forests and (major) policy changes as two factors of influence on the future use of fuelwood in Europe.

ADAM 2-degree scenario for Europe – policies and impacts
- 113 -
Natural changes in European forests
In the 2° Scenario, the countries south of the Alps (Bulgaria, Greece, Hungary, Italy, Portugal, Romania, Slovenia, Malta, Cyprus and Spain) are forecasted to have slightly less biomass than in the Base Case Scenario, because they are likely to have a drier climate with drier soils than in the Base Case Scenario. Fewer fellings are expected from forests in these countries compared to the Base Case Scenario. This is reflected in a slightly smaller production of woodchips and firewood directly from forests by some 1 % per year starting in 2011. This slight decline affects every sector: private households and services, the agricultural sector, district heating and co-generation plants as well as industry in the countries south of the Alps.
As the forests north of the Alps benefit from climate change in the 2°C Scenario, the projections for this part of Europe assume slightly higher biomass production compared to the Base Case Scenario. The production potential of woodchips and firewood stemming directly from the forest is predicted to increase by about 1 % yearly in all the sectors mentioned above.
Policy changes and technical improvements
In the 2° Scenario, changing polices will lead to greater use of renewable energies – therefore, there will be an increase in overall fuelwood demand in Europe. A substantial increase in the use of pellets and chips is expected in all European countries except Greece, Malta and Cyprus due to the reduced wood availability here in the 2°C Scenario. Almost stagnating demand is assumed in the Mediterranean countries, because these countries have low amounts of wood available from their forests, but high potentials for solar energy using solar thermal collector systems. Pellet use in private households and the service sector will almost stagnate relative to the Base Case Scenario as less wood availability from forests is compensated by more use of demolition wood and industrials waste wood.
In countries north of the Alps, changing policies will lead to increased pellet use due to increased mobilisation of demolition wood and short rotation crops; this will also increase the use of fuel wood in co-generation, industry and district heating. The pellet demand in industry, district heating and co-generation is calculated based on the woodchip development in the service sector in the Base Case Scenario. Starting in 2011, the chips data of the Base Case Scenario are increased annually by 1 % in the service sector of each country. The service sector is used because its chip use in the Base Case Scenario is expected to develop in a similar way to industrial pellet demand and the use of pellets in co-generation.
In addition, technical improvements in industrial wood use lead to more wood being available as wood fuel. For instance, more wood fuel is available because of the drop in the demand for wood due to highly efficient paper production technologies. Moreover, the resulting fresh wood available can be efficiently turned into woodchips. This is assumed to trigger a 3%

Forest and basic materials sector
- 114 -
annual increase in the demand for woodchips in industry, district heat and cogeneration in each country north of the Alps in the 2°C Scenario.
5.3.2.2 Results 2°C Scenario: firewood, pellet and chip demand
In the 2°C Scenario, there is a sharp drop in the use of conventional firewood. In contrast, woodchips and pellets show increasing market shares, because the changes in policies support new forms of fuelwood and because modern automatic fuelwood plants and improved efficiencies in industrial wood use increase the amount of wood available for energy use. Pellets and chips can easily be delivered by van (similar to oil) and their energy density is higher than firewood, which has different economic advantages, (see Table 5-14).
Table 5-14: Gross calorific value of different kinds of wood (in kWh/kg)
Firewood Pellets Wood
briquettes Woodchips
Conifer Deciduous dry G30 (water content <
20%) damp G50 (water content
~ 50%) 4.3 4.2 4.7-5 5 4 2
Source: BSR-Sustainability 2008
Compared to the Base Case Scenario, wood fuel demand in the 2°C Scenario is high (see Table 5-15). By the year 2005, the use of fuelwood peaks at a maximum of around 2,890 PJ. By 2030, the demand for firewood drops to 990 PJ which is lower than the demand for woodchips (around 1,000 PJ). In 2050, the pellets demand almost reaches with around 680 PJ the traditional firewood use with around 710 PJ (see Figure 5-8).

ADAM 2-degree scenario for Europe – policies and impacts
- 115 -
Table 5-15: Total fuelwood demand (firewood, wood pellets, woodchips), all sectors in EU-27 +
2 in PJ – Comparison of the Base Case Scenario and the 2 °C Scenario, 2015 –
2050
Country or country group
2015 2020 2030 2050 Base Case
2 °C Scenario
Base Case
2 °C Scenario
Base Case
2 °C Scenario
Base Case
2 °C Scenario
Austria 113 115 123 129 141 160 137 178
Baltic States 94 99 95 103 96 111 89 117
Belgium/Luxembourg 24 25 27 29 32 40 34 52
Bulgaria 27 27 26 26 27 29 25 31
Czech Republic 48 49 50 53 55 62 52 68
Denmark 20 21 21 22 21 24 22 26
Finland 218 229 219 238 209 244 171 237
France 72 73 85 88 142 149 161 175
Germany 263 284 311 358 375 480 350 550
Greece 9 9 10 9 13 13 17 18
Hungary 22 22 22 23 27 30 32 40
Ireland 9 9 11 12 17 21 22 32
Italy 72 79 79 89 87 103 86 114
Malta/Cyprus 0 0 0.0 0 0.0 0 0.1 0
Netherlands 7 7 8,3 9 10 10 10 11
Norway 54 56 58 61 62 68 63 74
Poland 143 145 143 147 156 178 150 212
Portugal 9 9 10 10 16 16 20 20
Romania 72 79 70 78 72 83 69 88
Slovakia 13 13 14 14 18 22 22 34
Slovenia 17 17 18 18 22 25 21 30
Spain 115 115 112 112 111 112 106 110
Sweden 223 247 235 272 251 316 274 396
Switzerland 48 51 68 80 106 147 117 206
United Kingdom 26 30 28 34 32 44 35 57
EU-27 + Norway and Switzerland 1,721 1,833 1,842 2,034 2,098 2,505 2,085 2,888
Source: BSR-Sustainability 2008
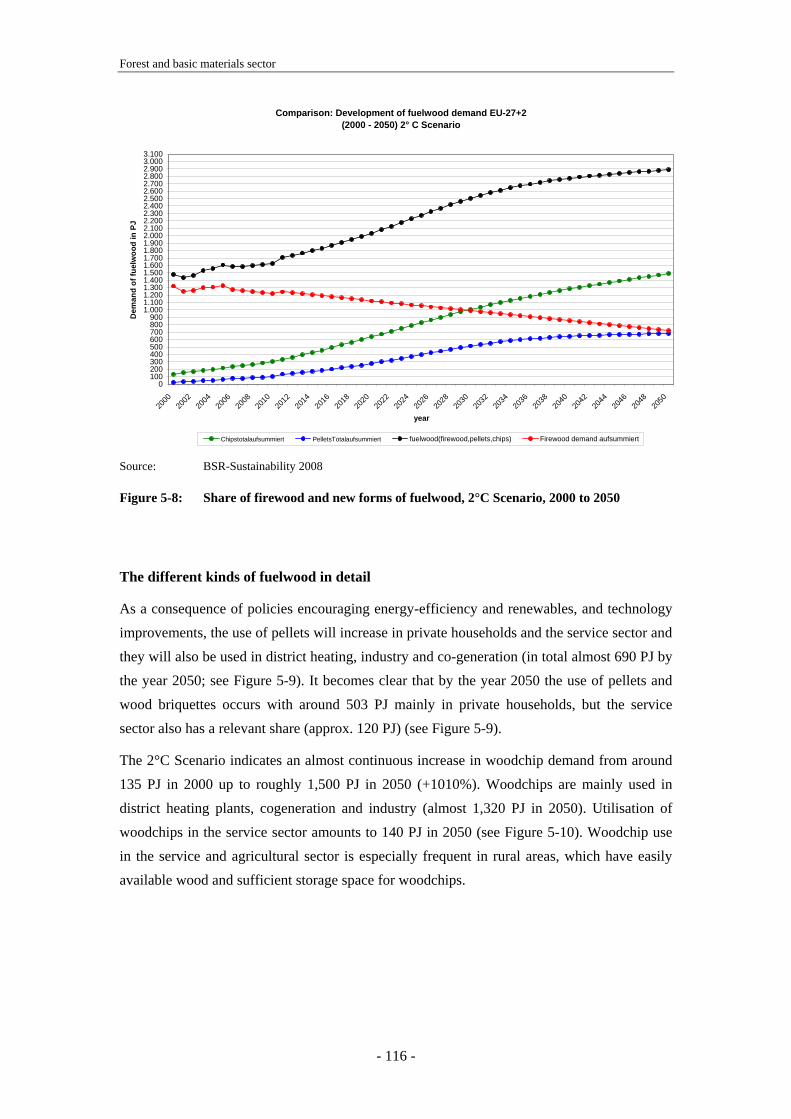
Forest and basic materials sector
- 116 -
Comparison: Development of fuelwood demand EU-27+2 (2000 - 2050) 2° C Scenario
0100200300400500600700800900
1.0001.1001.2001.3001.4001.5001.6001.7001.8001.9002.0002.1002.2002.3002.4002.5002.6002.7002.8002.9003.0003.100
2000
2002
2004
2006
2008
2010
2012
2014
2016
2018
2020
2022
2024
2026
2028
2030
2032
2034
2036
2038
2040
2042
2044
2046
2048
2050
year
Dem
and
of fu
elw
ood
in P
J
Chipstotalaufsummiert PelletsTotalaufsummiert fuelwood(firewood,pellets,chips) Firewood demand aufsummiert
Source: BSR-Sustainability 2008
Figure 5-8: Share of firewood and new forms of fuelwood, 2°C Scenario, 2000 to 2050
The different kinds of fuelwood in detail
As a consequence of policies encouraging energy-efficiency and renewables, and technology improvements, the use of pellets will increase in private households and the service sector and they will also be used in district heating, industry and co-generation (in total almost 690 PJ by the year 2050; see Figure 5-9). It becomes clear that by the year 2050 the use of pellets and wood briquettes occurs with around 503 PJ mainly in private households, but the service sector also has a relevant share (approx. 120 PJ) (see Figure 5-9).
The 2°C Scenario indicates an almost continuous increase in woodchip demand from around 135 PJ in 2000 up to roughly 1,500 PJ in 2050 (+1010%). Woodchips are mainly used in district heating plants, cogeneration and industry (almost 1,320 PJ in 2050). Utilisation of woodchips in the service sector amounts to 140 PJ in 2050 (see Figure 5-10). Woodchip use in the service and agricultural sector is especially frequent in rural areas, which have easily available wood and sufficient storage space for woodchips.
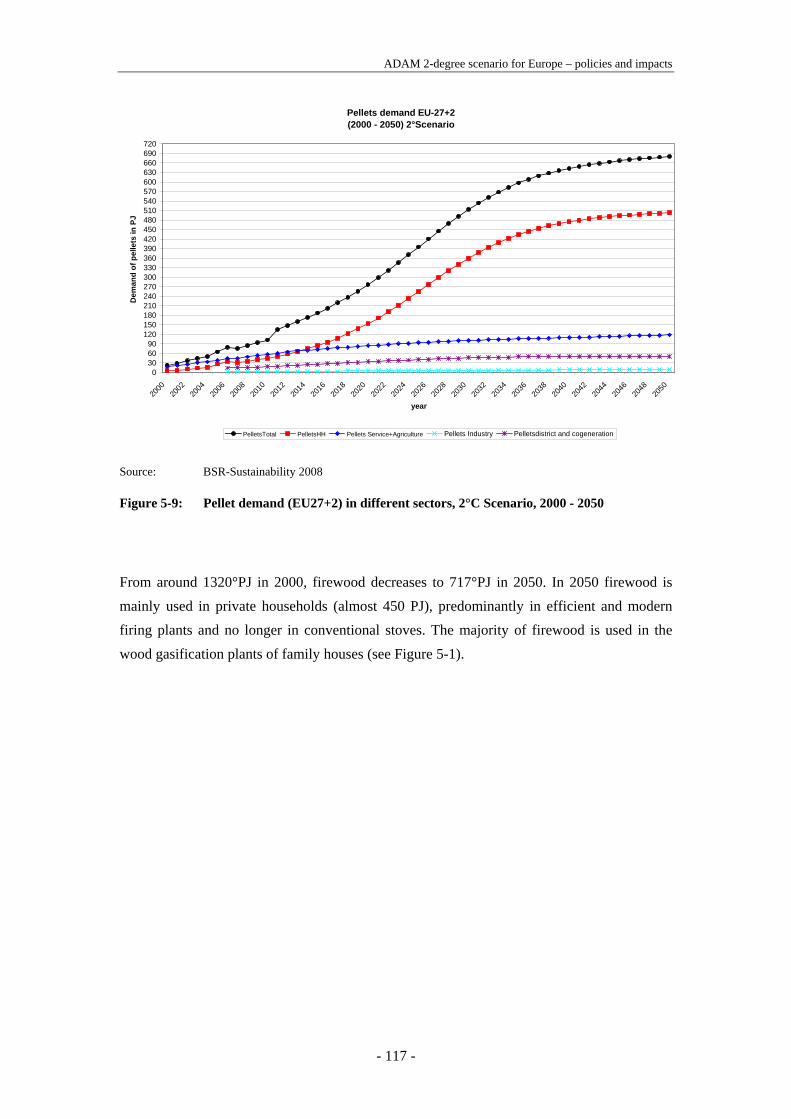
ADAM 2-degree scenario for Europe – policies and impacts
- 117 -
Pellets demand EU-27+2 (2000 - 2050) 2°Scenario
0306090
120150180210240270300330360390420450480510540570600630660690720
2000
2002
2004
2006
2008
2010
2012
2014
2016
2018
2020
2022
2024
2026
2028
2030
2032
2034
2036
2038
2040
2042
2044
2046
2048
2050
year
Dem
and
of p
elle
ts in
PJ
PelletsTotal PelletsHH Pellets Service+Agriculture Pellets Industry Pelletsdistrict and cogeneration
Source: BSR-Sustainability 2008
Figure 5-9: Pellet demand (EU27+2) in different sectors, 2°C Scenario, 2000 - 2050
From around 1320°PJ in 2000, firewood decreases to 717°PJ in 2050. In 2050 firewood is mainly used in private households (almost 450 PJ), predominantly in efficient and modern firing plants and no longer in conventional stoves. The majority of firewood is used in the wood gasification plants of family houses (see Figure 5-1).

Forest and basic materials sector
- 118 -
Chips demand EU-27+2 (2000 - 2050) 2° C Scenario
050
100150200250300350400450500550600650700750800850900950
1.0001.0501.1001.1501.2001.2501.3001.3501.4001.4501.5001.5501.600
2000 2002 2004 2006 2008 2010 2012 2014 2016 2018 2020 2022 2024 2026 2028 2030 2032 2034 2036 2038 2040 2042 2044 2046 2048 2050
year
Dem
and
of C
hips
in P
J
ChipsTotal CHips Service ChipsIndustry Chipsdistrict&Cogeneration Source: BSR-Sustainability 2008
Figure 5-10: Chips demand (EU27+2) by sectors, 2° C Scenario, 2000 to 2050
Firewood demand EU 27+2(2000-2050) 2 ° Scenario
0
100
200
300
400
500
600
700
800
900
1.000
1.100
1.200
1.300
1.400
2000
2002
2004
2006
2008
2010
2012
2014
2016
2018
2020
2022
2024
2026
2028
2030
2032
2034
2036
2038
2040
2042
2044
2046
2048
2050
Time
Dem
and
of fi
rew
ood
in P
J
Firewood Service+Agriculture Firewood Industry FirewoodHH Firewood Total all Sectors
Source: BSR-Sustainability 2008
Figure 5-11: Firewood demand (EU27+2) by sectors, 2°C Scenario, 2000 – 2050

ADAM 2-degree scenario for Europe – policies and impacts
- 119 -
6 Residential sector in Europe
Authors: Eberhard Jochem, Martin Jakob, Giacomo Catenazzi
The residential sector in Europe presently has a share of 26 % in total final energy demand, but a somewhat lower share of direct CO2 emissions due to the relatively high shares of natural gas use and district heat supply.
The future energy demand of the residential sector has been projected until 2050 using detailed bottom-up models. These are able to explain structural changes and their impact on energy demand more clearly than more aggregated models. Heating, cooking/hot water, and electrical appliances are treated separately as these energy uses depend on different – sometimes diverging – factors such as population and the income of private households. On the other hand, data availability may be poor for some sub-sectors and European countries and the many assumptions which then have to be made to compensate for missing empirical data may offset offset the advantage of higher differentiation. Unique to this report is the inclusion of the building sector’s adaptation to climate change in each of the 29 European countries.
6.1 Challenges and objectives of the analysis
The objectives of the analyses and projections in the residential sector were the following:
• (1) The projections up to 2050 should provide a realistic picture of the drivers of energy demand in the residential sector in relation to higher income per capita and household, and the anticipated population development in each country and related ageing.
• (2) The projections should include the impacts of a high adaptation scenario (Reference Scenario) and of an intensive mitigation scenario (called 2°C Scenario) on energy demand as well as on the investments in adaptation or mitigation. The energy demand should be broken down into heating demand, warm water and different electrical appliances.
• (3) Finally, the two scenarios should give a brief outline of the policies that would be needed to achieve the mitigation targets or to adapt to the changing climate in Europe.
The challenges involved in the analysis and projections were determined by the objectives and the available data and models. Multi- and single-family houses should be distinguished and the thermal insulation of the existing building stock should be determined as should the present and evolving efficiencies of several major electrical appliances. Data for Central European countries were often lacking and had to be estimated; the models had to be disaggregated and the influence of changing temperatures on heat demand or air conditioning

Residential Sector
- 120 -
had to be determined. Finally, investments and cost changes of adaptation and mitigation measures had to be calculated to provide data for the macroeconomic analysis performed using the ASTRA model.
6.2 Methodology and assumptions
The energy demand for heating, warm water and electrical appliances is projected by means of two different models, the RESIDENT model for heating and warm water generation and the RESAPPLIANCE model for all electrical appliances including ventilation and air conditioning. As in the other final energy sectors, two variants of the 2°C Scenario were calculated, one with the emission path of 400 ppm and the other with 450 ppm atmospheric CO2 concentration by the end of this century.
These two variants of the 2°C Scenario assume the following impacts of mitigation in comparison to the Reference Scenario that does not include any additional climate change policies:
• ambitious mitigation measures through energy efficiency improvements of houses and buildings as well as electrical appliances,
• extensive mitigation measures by substituting fossil fuels with renewable energies (e.g. modern forms of wood, solar thermal, heat pumps), and
• fewer adaptation measures (less cooling demand, but more heating).
• The related macroeconomic changes due to adaptation and mitigation policies (including their programme costs) and due to investments and changing energy costs and other operating costs (see Chapter 13). The macroeconomic impacts (e.g. changes in value added, employment, or trade) are calculated by the ASTRA model.
• There are no changes in the drivers stemming from changing preferences or awareness of the future impacts of climate change, and even slightly changing income per capita in the 2°C Scenario was not considered due to the time limits of the analysis.
As the bottom-up models and the macroeconomic model form a hybrid model system (HMS), interactions between the two types of models are increasingly important with increasing intensity of mitigation policies. However, interactions were not considered due to the project’s time constraints.
The following two sections give a brief description of the two models applied to the residential sector and their major assumptions.

ADAM 2-degree scenario for Europe – policies and impacts
- 121 -
6.2.1 Buildings
The RESIDENT model is a bottom-up simulation model to determine the long-term energy demand for heating and hot water in the residential sector (see also Jochem et al. 2009a). Demand for heat energy is determined as
Energy demand = specific energy demand per floor area x floor area
Computation is performed sequentially for two types of buildings (single family houses, multi-family houses). The current specific energy demand per floor area is determined by the construction period and the impact of retrofitting. The future specific energy demand for space heating is influenced by the following developments:
• changes in the building stock over years and decades are captured in a vintage model reflecting the number of buildings newly constructed, renovated or dismantled per year; the average heat demand is calculated for each vintage;
• the average energy efficiency of the heating system is determined by the number of newly installed heating systems in new buildings as well as in existing buildings where old boilers or heating systems are being replaced;
• fuel shares are determined by their shares in new buildings and the estimated interfuel substitution in existing buildings;
• behavioural changes of heating system operators and end-users (e.g. due to energy price changes) are assumed to have the same relative effect on all vintages;
• mitigation policy measures aiming to improve the thermal insulation of buildings and the efficiency of heating, ventilation and air conditioning systems are not explicitly simulated, but are reflected in the technical and behavioural changes mentioned above;
• changing average winter and summer temperatures in the different European countries resulting in changes in how energy is used to in the residential sector: less heating and more cooling compared to present climate in the 4 °C Scenario.
6.2.1.1 Energy efficiency of heating in residential buildings
At present, the strictest building standards are the Minergie-P and Passivhaus standards of Switzerland and Germany, respectively, which greatly reduce the energy demand of buildings. Similar standards and labelling systems are in place in other European countries. For space heating, we were inspired by such standards, and adapted them to the different climates in Europe and different needs.
For both new and old buildings, the specific energy demand of the Minergie-P standard is substantially lower than the current demand of existing buildings and the specific demand of new ones built in line with current practice and regulations (see Figure 6-1). Comparing the present (2004) unit energy demand (UEC) of old buildings (triangles) and new buildings (squares) with the results of a detailed building simulation model, the authors defined four classes of buildings (and related energy demand): buildings without energy saving measures

Residential Sector
- 122 -
(M_1), typical European new buildings (M_15), strict building standards (Minergie, M_16), and Minergie-P (or passive houses; M_24). These figures are displayed for EU27+2 according to the different climates (measured in yearly heating degree days, HDD; see Figure 6-1).
0
100
200
300
400
500
600
700
800
900
1000
500 1000 1500 2000 2500 3000 3500 4000 4500 5000HDD
UE
C [M
J/m
2]
oldnewM_1M_15M_16M_24
Source: CEPE's assumptions
Figure 6-1: Specific energy demand for heating (in MJ/m2) in multi-family houses for
existing buildings (old: old buildings, new: buildings of 2004), and for
simulated buildings (M_1: without special energy efficiency measures; M_15:
typical new buildings in 2004; M_16: energy efficiency similar to Minergie;
M_24: energy efficiency similar to Minergie P/ Passivhaus) as function to
heating degree days
Based on these data and the building simulation model (IDA-ICE), the authors defined an ambitious efficiency improvement to the building codes for new buildings: an improvement of 56 % between 2010 and 2016 and of 72 % to 2025 for the 450 ppm variant. Starting from 2026, a yearly technical progress of 0.25 % is assumed (0.2 % in the Reference scenario). The figure of the first period represents a Minergie standard (38 kWh per m2 including warm water), and that of the second period indicates a building code between Minergie and MinergieP (15 kWh/m2; or alternatively that 50 % of buildings will be built as MinergieP and the other half as Minergie). Using a single relative improvement for all countries forces the Nordic countries to adapt a more advanced insulation level and indoor air exchange control.
ADAM 2-degree scenario for Europe – policies and impacts
- 123 -
Stricter policies are assumed in the 400 ppm variant of the 2°C Scenario, which result in an 88 % reduction in heat demand relative to the present energy demand of the building stock. This means that all new buildings (on average) are expected to fulfil the Minergie-P standard by 2025.
A similar assumption is made with regard to retrofitting buildings: retrofitted buildings are expected to have a unit energy demand which is around 10% higher than new buildings, starting from 2016. The yearly retrofit rate, that is the share of buildings to be retrofitted relative to the building stock, increases from 0.8 % (in 2020) and 0.5 % (in 2050) in the Reference Scenario to 1.8 % and 1.3%, respectively, in the 450 ppm variant of the 2°C Scenario and to 1.8 % and 2.1 %, respectively, in the 400 ppm variant. This implies an enormous speed up in the retrofitting activities in residential houses and buildings with the result that 75 % of old buildings (before 1950) and 84 % of the intermediate cohort of the buildings contructed between 1950 and 1980 are retrofitted in the 450 ppm variant by 2050 and 86 % to 93 %, respectively, in the 400 ppm variant.
These assumptions regarding the accelerated yearly retrofit rate are extremely ambitious. However, they still assume that energy-relevant retrofittings are less effective and more costly than improvements to new buildings and that some technical obstacles reduce the effectiveness of improvements (facades in old town centres, higher room height, unavoidable heat bridges, etc.).
The energy demand for hot water generation and the additional electricity demand for the ventilation systems required by highly insulated houses and buildings are described in Section 6.2.2.1.
6.2.1.2 Substitution of fossil fuels
As residential sector floor area is increasing in all European countries, even the high thermal insulation assumptions will not be sufficient to reduce the CO2 emissions of this sector. Therefore, additional assumptions about the substitution of fossil fuels had to be made.
As the shares of fossil fuels in total final energy demand vary among the European countries, a general rule for the declining use of fossil fuels was assumed and applied equally to all European countries over the projection period (see Table 6-1). In the 450 ppm variant of the 2°C Scenario, for instance, the coal share for heating was set at zero in 2050 and the share of heating oil was reduced to 35 % of its 2005 value (see Table 6-1). Natural gas and electricity only decrease to 80 % of their 2005 value until 2050 in the 450 ppm variant. However, they decline strongly in 400 ppm variant. Similar patterns were assumed for propane and "others".

Residential Sector
- 124 -
The absolute energy figures for wood and pellets are set at nearly the maximum supply potential of Europe, with some inter-European trade and low imports from Russia and Canada. Heat pumps also gain substantial market shares until 2050 in absolute terms. The biogas demand is implicitly included in the demand for natural gas. Because of its relatively restricted availability and a potentially high demand, buildings, transportation and the conversion sector are in competition for biogas (and biomass in general). For this reason, the split of biogas use among the different sectors is determined in the renewables chapter (see Chapter 10).
Table 6-1: Changes in the fuel shares of heating energies of residential buildings in
Europe in the two variants of the 2°C Scenario, 2005 to 2050
450 ppm variant 400 ppm variant 2010 2030 2050 2030 2050 Coal 90% 40% 0% 30% 0% Heating oil 95% 65% 35% 52% 21% District heat 100% 85% 65% 77% 52% Firewood is given in absolute energy terms absolute energy terms Natural gas 99% 90% 80% 63% 24% Electricity 98% 90% 80% 54% 16% Heat pumps (el.) is given in absolute energy terms absolute energy terms Propane 100% 100% 100% 60% 40% Pellets is given in absolute energy terms absolute energy terms Solar 102% 110% 133% 132% 186% Biogas is given in absolute energy terms absolute energy terms Others 100% 100% 100% 60% 40%
Source: CEPE's assumptions
6.2.1.3 Impact of adaptation
In the first stage, the specific energy demand for lighting, ventilation, cooling, appliances, heating and other thermal applications is modelled for different building types and locations in Europe. 14 locations are chosen to cover the relevant regions both in terms of the energy demand of the residential and tertiary sector and the range of climate conditions in Europe.
Energy demands (and indoor climate conditions) are estimated with a dynamic building simulation model (IDA-ICE). Simulation results differentiate between the main types of energy services, namely lighting, ventilation, cooling, heating and other thermal applications, and will reveal the impact of climate change on the specific energy demand and the need for adaptation measures in buildings to ensure an acceptable level of comfort for their occupants. The impact estimated by our own building model simulation is backed up by evidence from the literature, particularly from Rivière, Adnot et al. (2008), Cartalsi, Synodinou et al. (2001),

ADAM 2-degree scenario for Europe – policies and impacts
- 125 -
Frank (2005) and Aebischer et al. (2007). A longer description is given in the second deliverable of this work package, in Jochem et al. (2009b).
Regarding the efficiency of cooling appliances, we assume an improvement of about 65 % over the next 45 years in the 450 ppm variant of the 2°C Scenario. This is technically feasible (Adnot 2003; Adnot, 2008) due to the use of better technologies, cooling fluids and the removal of inefficient systems from the market, thus using more split air conditioning by regulation.
Moving towards the "Passivhaus" standard requires controlled ventilation and such buildings are often equipped with heat pumps to generate the remaining heat demand. Ventilation systems will aid the efficient cooling of buildings by providing free or overnight cooling and thus avoid the need for less energy-efficient room air conditioning. In general, modern ventilation systems will reduce the felt temperature by one to two degrees centigrade.
In the 400 ppm variant, we assume that further efficiency improvements are possible. However these improvements are compensated by the additional electricity demand for the increased use of ventilation (in winter and in summer).
6.2.1.4 Cost of mitigation and adaptation
In many instances when investments in improved energy efficiency have to be monetarised, there are no concrete data on the additional investment costs that can be attributed to the improved efficiency. There are various reasons for the lack of data: in some cases involving, e.g. electrical appliances or cars, the pricing policy of the manufacturer dominates the price difference between a less and a more efficient product; in other cases, the new, more efficient products may also have additional functions (e.g. more selection options for washing or drying, greater comfort in new cars) so that the specific effect of improved efficiency cannot be identified in the price changes. However, it is quite clear from a technical point of view that the more efficient solution is profitable. In yet other cases, like the many thermal insulation investment options, it would be extremely cumbersome to survey the additional investments attributable to additional efficiency performance in all the possible building types and sizes. Indeed, in this last case it would be impossible to identify the net cost and energy savings of the many thousands of different combinations of investments.
This is why Jochem and Bradke (1996) developed a very simple method in order to estimate the investment costs of additional energy efficiency. The method uses a simple economic rule: "People are inclined to invest additional money if they expect that they will save more money over the lifespan of the new investment'", i.e. if the investment can be considered to be profitable.

Residential Sector
- 126 -
The investment costs for thermal insulation in single family houses are around 100 to 5,000 € per annually saved MJ in the 450 ppm variant and about 200 to 6,000 € in the 400 ppm variant. The huge difference in investment is due to the initial level of insulation, the reduced energy demand, and the fuel prices determining the reduced energy cost. The payback time is estimated to be 25 years.
For re-investments in heat generating systems, the interval of investment was chosen to be between 15 and 30 years, also depending on the new fuel in case of fuel substitution. The investment costs vary between energy systems and the size of buildings (see Table 6-2).
Table 6-2: Investment cost (in Euro per square metre) of a replaced heating system for
hot water generation and for different types of buildings
hot water single family
house multi family
building service sector Electricity 11.9 55.4 22.7 16.3 Electric heat pump 32.2 138.8 68.4 53.8 District heat 13.1 60.2 25.2 18.1 Oil boiler 23.0 112.5 40.0 28.6 Gas boiler 20.3 99.4 35.3 25.3 Wood, pellets boiler 25.9 127.5 44.7 32.0 Solar thermal collector 30.4 124.9 68.8 51.8 Others 23.0 112.5 40.0 28.6
Source: P. Hofstetter and M. Jakob (2006), M. Jakob, 2003, and CEPE's assumptions
Regarding heating, there are no (direct) adaptation costs in terms of investments due to a warmer climate. The model does not assume reduced investments as the capacity of boilers and heating systems have to serve maximum heat demand in very cold periods in winter seasons. Regarding operating cost, the residential sector stands to gain somewhat due to slightly reduced energy costs for heating.
Adnot (2007) estimated the investment costs of air conditioning for several European countries: the values are in the range between 335 € and 695 € per movable air conditioner, and between 450 € and 1,215 € for split air conditioners. This means investment cost between 130 € and 240 € per installed thermal kW. To calculate the investment costs of additional air conditioning, a re-investment cycle of 15 years is assumed. Only one third of the invested air conditioners is included in the additional investment costs due to adaptation: nearly 2/3 of the air conditioner investments will be made in any case due to higher per capita income and increasing demand for comfort according to the assumptions in the Base Case Scenario.

ADAM 2-degree scenario for Europe – policies and impacts
- 127 -
6.2.2 Energy efficiency of non-heating uses and of electrical appliances
The future energy demand of non-heating uses and various electrical appliances reflects the different intensity of mitigation policies (see Table 6-3). The assumptions for improved efficiencies are not differentiated among the European countries as the trade of electrical appliances in Europe is very high and the European labelling schemes support this homogenous technical performance of ecletrical appliances. This also explains little dfferences between the assumptions in the EU15+2 countries and the New Member States (NMS, see Table 6-3).
Table 6-3: Yearly efficiency improvement for non heating uses and electrical appliances
EU15 +2 and New Member States, Reference and 2°C Scenario, 2020 to 2050
EU15+2 New Member States Reference 450ppm 400ppm Reference 450ppm 400ppm Hot water -0.8% -1.0% -1.3% -0.6% -1.0% -1.3% Cooking -0.7% -1.2% -1.5% -0.7% -1.3% -1.5% Lighting -1.0% -5.3% -5.5% -1.0% -6.0% -5.5% Refrigerators -0.7% -2.9% -3.2% -0.5% -1.5% -3.2% Freezers -0.8% -3.8% -4.1% -0.6% -3.8% -4.1% Washing machines -0.8% -4.8% -5.0% -0.8% -4.3% -5.0% Dishwashers -0.8% -3.0% -3.3% -0.8% -3.0% -3.3% TV -0.5% -2.5% -2.9% 0.0% 0.0% -2.9% Others 2.2% 1.5% 1.0% 7.6% 5.7% 4.5% AC -0.5% -3.0% -3.0% -0.5% -3.0% -3.0%
Source: CEPE's assumptions
6.2.2.1 Hot water, cooking and lighting
With regard to the three energy services - hot water, cooking and lighting – the authors assumed the development of specific energy demand by the foloowing considerations:
• Specific energy demand for hot water is diminuished from 0.6 %-0.8 % per year in the Reference Scenario to 1.0 % per year in the 450 ppm variant and to 1.3 % per year in the 400 ppm variant of the 2°C Scenario. The relative small gain is due to the improvement of heat losses by better insulation and control and some improvement of boiler efficiencies. However, most of the energy use is useful energy, which cannot be reduced without reducing the use of hot water, which was excluded by scenario definition.
• Specific energy demand for cooking could be further decreased by using ceramic cooking or induction cooking increasing efficiency from 0.7 % per year to 1.2 % - 1.3 % per year (450 ppm variant) or to 1.5 % per year (400 ppm variant); such substitutions have long market penetration periods as preferences and traditions play an important role.
• Lighting has large efficiency potentials in the residential sector, using high efficient illumination options (including diode lighting (LED) in the near future). Due to very short

Residential Sector
- 128 -
re-investment cycles of incandescent lighting, the improvement could be very fast. The authors estimate savings of some 85 % (450 ppm variant) to 87 % (400 ppm variant) per dwelling at the middle of this century. The new member states have some more potential, because they start from a higher market share of traditional bulbs.
6.2.2.2 Electrical appliances
The future efficiency improvement in white good can be substantial as demonstrated by the top ten appliances that are actually on the market1. These data (from topten.ch) were used as the target and average specific electricity demand for 2040 (450 ppm variant) or for 2030/2035 (400 ppm variant; see Table 6-4). The authors assume that this trend of efficiency improvement continues until 2050. The differences between EU15+2 and the New Member States (NMS) are due to the different present levels of electiricty demand: in the NMS, the technical improvement is partially set off by larger appliances and by faster market diffusion.
Table 6-4: Yearly electricity demand of selected appliances (in MJ per year) of the
present stock, standard new appliances and currently most efficient (top-ten)
appliances, and relative improvement replacing old appliances by standard
and top ten appliances, Europe, 2005
Specific electricity demand (MJ/a) Improvement in percent
present stock
new appliances Top Ten
Difference new / stock
Difference Top Ten / stock
Refrigerator 1865 1140 614 -39% -67% Freezer 1762 1078 583 -39% -67% Kitchen stove 1078 936 720 -13% -33% Dishwasher 1486 1128 566 -24% -62% Washing machine 828 684 204 -17% -75% Tumble dryer 2071 1843 922 -11% -56%
Source: http://topten.ch (EnergieSchweiz, SAFE)
Specific electricity demand of television sets and similar electrical appliances (video recorders, set-top boxes etc.) as welll as of information and communication appliances have been estimated by the autors on the basis of existing literature. Regarding televisionsets, the LCD screen will contribute to reduce the electricity demand (but only little due to larger screens). In many other cases, larger appliances and/or stand-by demand and accessories (e.g.
1 Top-ten is an information and dissemination platform that collects information of the most efficient appliances of each type. It exists in the following countries: Austria, Belgium, Czech Republic, Finland, France, Germany, Italy, Luxemburg, Netherlands, Poland, Portugal, Spain, Switzerland (see http://topten.info)

ADAM 2-degree scenario for Europe – policies and impacts
- 129 -
set-top-boxes) will contribute to increasing electricity demand of private households in the future.
6.2.2.3 Cost of mitigation and adaptation
Regarding the costs of mitigation of non-heating uses, we use the method of "applicable investment cost" (see the building section 6.2.1.4 and Jochem and Bradke, 1996). The specific investment costs increase by some 20 % for each category of appliance with increasing efficiency between 2010 and 2050 (see Table 6-5). Improving the efficiency of cooking implies a threefold higher investment per yearly saved MJ as compared to investments in high efficient heating systems.
Table 6-5: Assumed payback time to calculate applicable investment cost for energy-
efficient electrical appliances and investments (in € per saved MJ per year);
Europe, 2010 to 2050
pay-back time
in years 2010 2020 2035 2050
White electrical appliances 8 0.4 0.4 0.5 0.5
lighting 8 0.4 0.4 0.5 0.5
entertainment & communication 12 0.6 0.7 0.7 0.7
heating systems 20 0.3 0.4 0.5 0.5
hot water 20 0.3 0.4 0.5 0.5
cooking 20 1.0 1.1 1.2 1.2
Source: CEPE's assumptions
Of course, all these assumptions on technical and cost data could be discussed and sensitivity calulations with changed assumptions could be applied to identify those areas where results achieved are sensible to the assumptions made here. Due to time constraints sensitivity analyses were not undertaken.
6.3 Results of the Reference and of the variants of the 2°C Scenario
The results of the heating energy demand and the electricity demand of electrical appliances are discussed in separate sections. The results of the Reference Scenario have been presented and commented in more detail ind the foregoing deliverable (D.2 of the work package; see Jochem et al. 2009 b).

Residential Sector
- 130 -
6.3.1 Energy savings in residential sector
For Europe as a whole, the final energy demand for space heating will decrease continuously throughout the period in both scenarios. In the Reference Scenario, the impact of the warmer climate (+4°C at the end of this century) amounts to a decrease in space heating by some 1,400 PJ or -16 % for EU27+2 in 2050 (see section 6.2.2.1 in Jochem et al. 2009). The changes vary in the different European countries.
The heating demand decline in buildings in the Nordic and Baltic countries is small in relative terms (changes of 13 to 15 %), but large in absolute terms. In contrast, the decrease in Mediterranean countries by the year 2050 is large in relative terms (16 to 33 %) but comparatively small in absolute energy terms relative to a Base Case Scenario. The reductions here are higher in relative terms due to the larger changes in heating degree days (HDD). However, specific heating demand in absolute terms is currently much higher in the Nordic countries, so in absolute terms, the reduction in energy demand (and the economic benefits associated with this) is much higher in countries north of the Alps.
In the 2°C Scenario, total final energy demand is reduced by slightly more than half in the 450 ppm variant and by about two thirds in the 400 ppm variant as compared to the Reference Scenario (Table 6-6). The reductions are quite similar in all European regions due to the same technological improvements and related polices (such as the building directive, the eco design directive, harmonising labelling schemes and regulation). As compared to the 2005 level of final energy demand, the reduction is 58 % and 69 % in the 450 ppm variant and the 400 ppm variant respectively. The slightly higher heat demand in the 2°C Scenario due to a lower climate change relative to the Reference Scenario has been taken into account.
Table 6-6: Final Energy demand for space heating in the residential sector in PJ,
European regions, Reference and 2°C Scenario, 2005 to 2050
Region Reference Scenario
450 ppm variant 400 ppm variant
2005 2020 2035 2050 2035 2020 2050 diff1) 2035 2020 2050 diff1)
North 515 470 474 444 415 294 215 -52% 414 270 161 -64% South 1618 1529 1506 1337 1367 962 652 -51% 1364 896 489 -63% East 1107 1079 1012 926 949 654 430 -53% 947 597 303 -67%
West 5343 5042 5148 4758 4407 3155 2300 -52% 4390 2900 1729 -64%
EU27(9) 8584 8121 8140 7465 7138 5065 3598 -52% 7115 4663 2682 -64% 1) compared to the Reference Scenario in 2050
Source: CEPE's results
In the Reference Scenario, electricity demand increases by 1,100 PJ or more than 60 % between 2005 and 2050 (see Table 6-7). The relative large increase of electricity demand by

ADAM 2-degree scenario for Europe – policies and impacts
- 131 -
electrical appliances (+95 %) in East European countries is caused by relatively intensive diffusion of appliances, starting from currently still quite low diffusion levels (e.g. dishwashers, freezers, TV-sets) and an increasing number of dwellings (due to decreasing occupancy density). Hence, the basic observation is that the shift towards more efficient electrical appliances does not compensate the additional electricity demand due to further market penetration of the various and new electrical appliances in the Reference Scenario (see also section 6.3.2.1 in Jochem et al 2009 b).
The results of the two variants of the 2°C Scenario demonstrate the large efficiency potentials of electrical appliances (see Table 6-7): The electricity demand slightly increases until 2020, before it stagnates at present levels at around 1,760 PJ between 2035 and 2050 in the 450 ppm variant. This means that the increasing energy services of this sector can be completely offset by the additional efficieny gains during the coming decades. In the 400 ppm variant, present electricity demand can even be reduced by a further 14% until 2050 (see Table 6-7) or by almost 50 % compared to the demand in the Reference Scenario in 2050.
Table 6-7: Electricity demand for electric appliances, European regions and EU27+2,
Reference and 2°C Scenario, 2005 to 2050
El. appliances Reference Scenario 450 ppm variant 400 ppm variant
2005 2020 2035 2050 2035 2020 2050 diff1) 2035 2020 2050 diff1)
North 143 160 178 194 141 127 121 -38% 135 115 106 -46% South 500 634 757 858 548 516 507 -41% 527 465 434 -49% East 153 192 239 298 165 164 186 -38% 159 147 151 -49%
West 968 1157 1353 1514 1007 954 941 -38% 968 865 819 -46%
EU27(9) 1764 2144 2528 2864 1861 1762 1755 -39% 1789 1593 1509 -47% 1) Compared to the Reference Scenario in 2050
Source: CEPE's results
The demand for air conditioning in Europe is greatly increasing from 23 PJ in 2005 to some 116 PJ until 2050 in Reference Scenario which is still a small share of 4 % in 2050 (see Table 6-8). In absolute terms, the major impacts are in the southern countries, because of the larger air cooled area and high yearly operating hours. In these countries the saturation level of air conditioners is almost reached in 2050. In relative terms, the areas most affected are West and East Europe, because of the lower initial level, but with greater need for additional cooling (compared to the northern countries).

Residential Sector
- 132 -
Table 6-8: Electric demand for cooling and ventilation, European regions, Reference and
2°C Scenario, 2005 to 2050
Region Reference Scenario 450 ppm variant 400 ppm variant
2005 2020 2035 2050 2035 2020 2050 diff1) 2035 2020 2050 diff1)
North 0.2 1.0 1.4 1.5 0.9 0.9 0.6 -58% 0.9 0.9 0.6 -58% South 20.6 62.2 86.5 94.2 53.8 51.9 42.2 -55% 53.8 51.9 42.2 -55% East 0.6 1.6 2.7 3.2 1.4 1.5 1.3 -60% 1.4 1.5 1.3 -60%
West 2.0 8.0 14.1 16.9 6.9 8.0 6.7 -60% 6.9 8.0 6.7 -60%
EU27(9) 23 73 105 116 62.9 62.3 50.8 -56% 62.9 62.3 50.8 -56% 1) compared to the Reference Scenario in 2050
Source: CEPE's results
In both variants of the 2°C Scenario, the demand for more cooling services can be partly compensated by more efficient cooling appliances and building concepts. Electricity demand in 2050 for cooling only increases to the level of about 2017 of the Reference Scenario which is also due to the fact that cooling degree days will be lower in the 2°C Scenario in comparison to the Reference Scenario.
The following tables show the summarised results of the two sectors on heating and electrical appliances, including cooking with gas or hot water generation by electricity. While the fuel demand is sightly reduced from 9,856 PJ in 2005 to around 8,200 PJ in 2050 in the Reference Scenario (-17 %) (see Table 6-9), the decline is substantial in the two variants of the 2°C
Scenario reaching 4,120 PJ (-57 % relative to 2005) in 2050 and about 2,200 PJ (-78 % relative to 2005) respectively in the 400 ppm variant. The countries with cold and warm climates reduce their fuel demand slightly less than the West and East European countries (see Table 6-9).
The electricity demand of the residential sector increases by 30 % between 2005 and 2050 in the Reference Scenario, being dominated by the increase of the electrical appliances (see above). While electricity demand of North Europe is stagnating over the whole period (due to decreasing electricity demand for heating which offsets the increase of the electrical appliances), the electricity demand of South Europe increases by 50 % due to increasing air conditioning and the growing stock of electrical appliances (see Table 6-9 ). The improvements of the electrical uses in private househods in the 2°C Scenario relative to the Reference Scenario are somewhat less pronounced than in the fuels demand: their growth in energy efficiency is 36 % at the EU27+2 level in 2050 in the 450 ppm variant and 42 % in the 400 ppm variant respectively. Again this reflects the relative high share of heating in electricity use in the Scandinavian countries where heat demand can more easily be reduced as the electricity demand of electrical appliances.

ADAM 2-degree scenario for Europe – policies and impacts
- 133 -
Table 6-9: Fuels demand in the residential sector, European countries and EU27+2,
Reference Scenario and 2°C Scenario, 2005 to 2050
Fuels Reference Scenario 450 ppm variant 400 ppm variant
2005 2020 2035 2050 2035 2020 2050 diff1) 2035 2020 2050 diff1)
Austria 228 211 201 174 197 144 106 -39% 182 124 81 -54% Baltic States 144 129 113 97 117 78 49 -50% 113 66 31 -68% Belgium/Lux. 379 347 348 312 294 191 127 -59% 257 128 61 -80% Bulgaria 59 53 46 40 48 32 19 -51% 46 27 13 -68% Czech Republic 194 181 167 151 163 116 80 -47% 149 86 45 -70% Denmark 141 126 122 110 110 75 53 -52% 98 54 30 -73% Finland 134 114 100 86 107 76 55 -36% 100 70 48 -44% France 1247 1253 1253 1148 1021 744 570 -50% 899 530 306 -73% Germany 2207 2011 1968 1726 1746 1193 820 -52% 1557 860 415 -76% Greece 158 139 139 132 118 79 56 -58% 105 60 38 -72% Hungary 203 185 166 147 161 107 69 -53% 144 74 35 -76% Ireland 84 94 104 103 80 60 44 -57% 73 43 23 -77% Italy 940 874 855 742 775 553 390 -47% 678 367 180 -76% Malta/Cyprus 10 11 12 11 9 7 5 -50% 8 5 4 -64% Netherlands 351 317 300 263 280 196 137 -48% 239 124 57 -78% Norway 42 41 45 43 41 43 41 -4% 42 43 37 -13% Poland 639 631 594 542 536 361 241 -55% 497 282 149 -73% Portugal 82 77 70 57 68 44 28 -50% 63 42 28 -52% Romania 282 268 248 222 240 165 105 -53% 220 121 55 -75% Slovakia 96 90 83 76 76 48 31 -59% 69 36 17 -77% Slovenia 35 38 38 36 33 24 17 -52% 32 20 11 -68% Spain 480 473 455 403 438 343 263 -35% 411 286 191 -53% Sweden 162 153 148 137 149 114 92 -33% 134 99 76 -44% Switzerland 165 149 144 118 128 88 60 -49% 114 65 39 -67%
United Kingdom 1394 1295 1343 1323 1126 841 662 -50% 947 489 215 -84%
EU27+2 9856 9258 9061 8198 8064 5721 4123 -50% 7179 4101 2184 -73%
North 480 433 415 375 407 308 241 -36% 374 265 191 -49% South 2011 1895 1825 1608 1697 1222 868 -46% 1532 908 508 -68% East 1311 1254 1161 1049 1086 734 487 -54% 1004 565 289 -72%
West 6054 5676 5660 5167 4874 3457 2527 -51% 4269 2363 1197 -77%
EU27+2 9856 9258 9061 8198 8064 5721 4123 -50% 7179 4101 2184 -73% 1) compared to the Reference Scenario in 2050
Source: CEPE's results

Residential Sector
- 134 -
Table 6-10: Electricity demand in the residential sector, European countries and EU27+2,
Reference Scenario and 2°C Scenario, 2005 to 2050
Electricity Reference Scenario 450 ppm variant 400 ppm variant
2005 2020 2035 2050 2035 2020 2050 diff1) 2035 2020 2050 diff1)
Austria 47 52 60 64 42 37 33 -49% 47 39 32 -51% Baltic States 22 27 31 36 23 21 22 -39% 23 21 19 -47% Belgium/Lux. 57 64 71 77 60 58 55 -28% 71 69 58 -25% Bulgaria 30 34 37 39 30 26 24 -40% 29 22 19 -52% Czech Republic 54 60 59 61 53 42 38 -39% 51 37 29 -52% Denmark 39 41 44 46 34 30 28 -40% 38 34 30 -35% Finland 73 77 83 82 65 55 48 -42% 65 48 35 -57% France 518 541 599 631 481 437 404 -36% 488 399 332 -47% Germany 465 473 497 513 437 400 375 -27% 478 419 356 -31% Greece 79 88 89 94 76 59 52 -44% 79 60 48 -49% Hungary 46 48 51 56 44 39 39 -32% 46 38 32 -43% Ireland 19 29 37 45 27 29 30 -33% 28 31 30 -33% Italy 243 296 336 357 264 241 222 -38% 285 259 220 -38% Malta/Cyprus 8 11 13 15 9 9 9 -39% 9 8 7 -52% Netherlands 71 83 96 105 73 70 70 -33% 85 81 72 -31% Norway 106 106 110 116 92 67 56 -52% 82 48 34 -71% Poland 105 120 141 169 110 110 118 -30% 119 113 101 -40% Portugal 51 61 72 80 57 61 61 -24% 55 49 45 -44% Romania 44 64 85 106 57 62 68 -36% 60 61 57 -46% Slovakia 19 21 24 27 20 21 21 -25% 20 18 15 -44% Slovenia 9 10 11 13 9 9 9 -32% 9 8 7 -45% Spain 244 294 341 369 258 240 225 -39% 253 219 191 -48% Sweden 149 122 123 124 98 79 68 -45% 103 74 56 -55% Switzerland 55 59 63 59 52 45 38 -37% 56 46 33 -44%
United Kingdom 404 475 536 584 426 391 369 -37% 458 418 372 -36%
EU27+2 2957 3255 3607 3868 2898 2637 2478 -36% 3038 2618 2230 -42%
North 366 346 360 368 289 231 200 -46% 289 204 155 -58% South 699 848 972 1059 753 698 660 -38% 769 679 587 -45% East 255 286 317 362 258 241 246 -32% 268 235 204 -44%
West 1637 1775 1958 2079 1598 1467 1373 -34% 1712 1501 1284 -38%
EU27+2 2957 3255 3607 3868 2898 2637 2478 -36% 3038 2618 2230 -42% 1) compared to the Reference Scenario in 2050
Source: CEPE's results
It was clear from the very beginning of the analysis that in addition to more energy-efficient solutions there would be also fossil fuel substitution necessary in order to reach ambitious greenhouse gas reduction targets. The reduction of heating oil by more than 50 % in the Reference Scenario is topped by additional 67 % in 2050 in the 450 ppm variant and additional 81 % in the 400 ppm variant. Natural gas has a somewhat better looser perspective as its use stagnates in the Reference Scenario and only reduces at a similar rate its demand in the 400 ppm variant by 88 % (see Table 6-11). Most interesting is that also district heating looses enormous market shares particularly in the 400 ppm variant of the 2°C Scenario. The relative and absolute winners are the renewables (heat pumps, woodfuel, and thermal solar

ADAM 2-degree scenario for Europe – policies and impacts
- 135 -
collectors): starting from some 940 PJ in 2005 they reach around 1,179 PJ in 2050 in the Reference Scenario and 1,750 PJ in the 400 ppm variant.
Table 6-11: Fuels demand by different energy carriers in the residential sector in PJ,
EU27 + 2, Reference Scenario and 2°C Scenario, 2005 to 2050
Reference Scenario 450 ppm variant 400 ppm variant
2005 2020 2035 2050 2020 2035 2050 diff1) 2020 2035 2050 diff1) Electricity (with out heat pumps) 2947 3220 3549 3796 2838 2507 2331 -39% 2619 2066 1771 -53% Heat pumps 10 35 58 73 146 188 172 136% 419 552 459 532% Heating oil 2084 1470 1237 990 1123 475 186 -81% 1005 333 86 -91% Natural gas 5073 5325 5361 5007 4574 3228 2277 -55% 3858 1803 576 -88% Wood, pellets 905 835 980 928 867 1023 964 4% 876 993 805 -13% Thermal solar 28 93 141 165 117 199 262 59% 255 423 488 196% District heating 1012 984 901 752 840 478 246 -67% 789 378 144 -81% 1) compared to the Reference Scenario in 2050
Source: CEPE's results
The diversification of fuels in the residential sector projected for the year 2050 in the 400 ppm variant is quite obvious looking at the total of the EU27+2 (see Table 6-11) or at the national level (see Figure 6-2). Heating oil and gas have small shares in all countries while woodfuel in form of chips and pellets have dominating roles in countries with larger forests areas (see the Baltic States, the Scaninavian countries, Austria, Switzerland, Romania or Bulgaria). Solar thermal collector systems are widely used in the mediterranian countries as one would expect given the favourable conditions in those European contries (see Figure 6-2).
To conclude: the structure of final energy of the residential sector will undergo substantial changes away from fossil fuels to renewable energies (including heat pumps) and, herewith contribute a lot to reduced CO2 emissions of the European countries assuming an ambitious climate change policy that start early in the coming years.
Policies that are suited to reach these efficiency improvements and mitigsation results are shortly mentioned in section 6.5.

Residential Sector
- 136 -
0% 20% 40% 60% 80% 100% 120%
AT
BELUX
DK
FI
FR
DE
GR
IE
IT
NL
PT
ES
SE
UK
NO
CH
BALTIC
HU
PL
CZ
SK
MED
SI
BG
RO
ElHPoilgasheatwoodpelletssolarothers
400ppm
Figure 6-2: Shares in final energy of the residential sector, EU27+2 countries, 400 ppm
variant of the 2°C Scenario, 2050
6.3.2 Changes of cost and investments
While the foregoing sections looked into the impacts of adaptation and mitigation from a technical point of view, this section focuses on the direct economic impacts in the residential sector regarding changed energy cost and additional investments due to adaptation and mitigation in the two scenarios. Total energy cost of the European residential sector will increase from some 190 Bill. € in 2005 to more than 250 Bill. € in 2050 in the Reference Scenario driven by increasing electricity demand (see Table 6-12). In contrast to this development, the energy cost will decrease in both variants of the 2°C Scenario (-12 % in the 450 ppm variant and -45 % relative to 2005 in the 400 ppm variant). Relative to the Reference Scenario in 2050, the decline is 33 % and 58 % respectively. However, these savings are needed to finance enormous capital cost of the investments of the mitigation scenario.

ADAM 2-degree scenario for Europe – policies and impacts
- 137 -
Table 6-12: Fuels and electricity costs of the residential sector, in billion EUR, Reference
Scenario, European region and EU27-2, 2005 to 2050
Region Reference Scenario 450 ppm variant 400 ppm variant
2005 2020 2035 2050 2020 2035 2050 diff1) 2020 2035 2050 diff1)
North 18 18 19 19 14 12 13 -32% 13 10 9 -52% South 44 51 55 56 39 38 35 -37% 36 29 23 -59% East 14 16 17 20 19 14 14 -27% 18 11 9 -53%
West 115 134 150 157 126 109 105 -33% 119 84 63 -60%
EU27+2 191 219 242 252 198 173 168 -33% 187 135 105 -58% 1) compared to the Reference Scenario in 2050
Source: CEPE's results
The investments for adaptation of the residential sector are quite small. In total, they reach half a billion € in 2050 with high increases in air conditioning investments in South and East Europe (see Table 6-13). These investment are cut in half in the two variants of the 2°C Scenario and of minor importance relative to the investments for mitigation in the two variants of the 2°C Scenario (see Table 6-14).
Table 6-13: Yearly investment for adaptation in billion €/a, residential sector, Reference
and 2°C Scenario, European regions and EU27+2, 2020-2050
Region Reference Scenario (4°C) 2°C Scenario 2020 2020 2035 2050 2020 2035 2050 diff1) North 0.01 0.03 0.06 0.07 0.03 0.04 0.03 -56% South 0.00 0.02 0.03 0.04 0.02 0.02 0.02 -54% East 0.02 0.10 0.13 0.17 0.08 0.08 0.07 -60% West 0.07 0.18 0.22 0.24 0.14 0.13 0.10 -56% EU27+2 0.10 0.33 0.44 0.52 0.27 0.26 0.22 -57% 1) compared to the Reference Scenario in 2050
Source: CEPE's results
The yearly investments in mitigation have been split into investments due to efficiency investments and to fuel substitution. The yearly investments for mitigation peak during the 2030s at some 85 bill. € in the 450 ppm variant and slightly above 100 bill. € in the 400 ppm variant (see Table 6-14). This peaking may be underestimated as some re-investments in boilers, ventilation systems or windows in the 2040s may not have been fully considered by the authors in the model calculations.
The additional investments due to fuel substitution are about 10 % of the investments for mitigation in the 400 ppm variant and less than 3 % of the investments in the 450 ppm variant (see Table 6-15). The fivefold increase of substitution investments clearly shows that the additional CO2 reductions between the 450 ppm and the 400 ppm variant are stemming

Residential Sector
- 138 -
increasingly from the substitution of fossil fuels and less from additional energy efficiency improvements (see also Table 6-17).
Table 6-14: Yearly investment for mitigation measures in efficiency, residential sector, in
billion €/a, 450 and 400 ppm variant of the 2°C Scenario, EU27+2, 2020-2050
Region 450 ppm variant 400 ppm variant 2020 2035 2050 2020 2035 2050
North 4 5 3 5 6 5 South 16 20 13 18 24 19 East 9 8 7 10 11 12 West 41 50 30 48 61 48
EU27+2 70 83 53 82 101 84
Source: CEPE's results
Table 6-15: Yearly investment for mitigation measures in fuel substitutions, residential sector, in billion €/a, two variants of the 2°C Scenario; European regions and EU27+2, 2020-2050
450 ppm variant 400 ppm variant 2020 2035 2050 2020 2035 2050
North 0.1 0.1 0.1 0.9 0.4 0.2 South 0.3 0.3 0.4 2.9 1.9 1.3 East 0.2 0.2 0.1 1.7 1.4 0.9 West 1.1 0.8 0.8 7.4 5.4 4.8
EU27+2 1.6 1.4 1.5 12.9 9.1 7.3
Source: CEPE's results
Programme costs from public institutions
Of course, the achievements of the 2°C Scenario do not come by itself. To overcome obstacles and market imperfection, public programmes have to be developed in form of information and professional training, by preparing regulation schemes, giving financial incentives to the first movers and by research and development of new technologies. These programme costs have been roughly estimated to range in the order of 10 % of the mitigation investments (see Table 6-16). These programme cost have been transferred to the ASTRA model for the macroeconomic evaluation of the two variants of the scenario.

ADAM 2-degree scenario for Europe – policies and impacts
- 139 -
Table 6-16: Programme costs in residential sector, in billion €/a; European regions and
EU27+2; two variants of the 2°C Scenario, 2010-2050
Region 450 ppm variant 400 ppm variant 2010 2020 2035 2050 2010 2020 2035 2050
North 0.1 0.4 0.5 0.3 0.1 0.6 0.6 0.5 South 0.3 1.6 2.0 1.4 0.4 2.1 2.5 2.0 East 0.2 0.9 0.8 0.7 0.2 1.2 1.2 1.3 West 0.7 4.2 5.1 3.0 0.9 5.6 6.6 5.3
EU27+2 1.3 7.2 8.5 5.5 1.6 9.5 11.0 9.1
Source: CEPE's results
6.4 Policy conclusions
Implementation of energy efficiency in buildings poses several unique challenges. Building codes need to be increasingly stringent; they also have to include refurbishing of the existing building stock. Energy audits are a useful tool for pointing out inefficiencies and consist of a detailed survey by a specialist of the energy used in an industrial firm or building. The objective is to provide technical and financial information to investors and building owners about what actions can be taken to reduce their energy bills and at what cost.
Lack of information regarding opportunities and benefits of improved efficiency in residential buildings and equipment slows penetration of these technologies. Information campaigns to foster public awareness and local information centers that provide advice to households and small-to-medium enterprises would help address this problem. Professional training for architects, planners and craftsmen is an important element in order to get out low energy building and passive houses out of their niche markets. and to avoid complaints from building owners.
Households, local authorities and companies are the main investors for building construction and refurbishing. Higher initial investment costs are often a barrier to use of appliances and building components with higher energy performance standards even though lifetime costs of more efficient buildings and equipment are lower because of lower operating costs. There are also principal-agent problems in this sector in which the incentives for builders to reduce prices result in use of low-cost, inefficient components even though consumers’ interests would be better served with more efficient dwellings and appliances. Since the most important potential relies in existing buildings at least for EU27+2 countries, access to capital through low interest rate loans is an important argument to motivate refurbishing decisions. such financial mechanisms with the participation of private banks are implanted in several European countries, but should be adopted by all European countries.

Residential Sector
- 140 -
Regarding electrical appliances, the following policy measures have been assumed in the projections and are subject to our policy recommendations:
• Establish regularly updated minimum energy performance standards (MEPS) to ensure phase out of inefficient equipment.
• Design labels (comparison labels and endorsement labels) to inform consumers of the costs and benefits of the most and least efficient appliances on the market.
• Encourage well monitored voluntary or negotiated agreements with appliance manufacturers to enhance the overall efficiency of products.
• Support research and development, including encouraging manufacturers to integrate energy efficiency considerations into the early stages of product design.
To conclude: very active energy efficiency policy is needed by all European countries regarding residential buildings, as the re-investment cycle of buildings is extremely long (40 to more than 60 years). Many politicians are hesitant to follow this policy line as home owners and users are voters. They may be convinced accepting more ambitious efficiency an renewables policies by stressing the life cycle cost of buildings, homes and factory buildings.
Finally, the results of the scenario projections clearly show the important role efficiency improvements: while 370 Million tonnes of direct CO2 emissions would be emitted in 2050 in the Reference Scenario, almost 170 Million tonnes (or 45 %) are reduced by efficiency improvements and more than 60 (17 %) by fuel substitution in the 450 ppm variant (see Table 6-17). This contribution to the reduction target changes in the 400 ppm variant, where total emission reductions are almost 340 Million tonnes (or 91 %) where energy efficiency contributes almost 210 Million tonnes (56 %) and substitution of fossil fuels about 130 Million tonnes (35 %) in 2050. This result of a relative shift towards renewable energies reflects the fact that marginal cost of mitigation by efficiency improvements increase more following very ambitious targets than renewables that still have an enormous potential to reduce their cost by learning and economy of scale effects.
Table 6-17: Impact of different policies and scenario drivers in direct CO2 emissions in Mt
CO2/year, residential sector; two variants of the 2°C Scenario, 2020-2050
450 ppm variant 400 ppm variant 2010 2020 2035 2050 2010 2020 2035 2050 Reference Scenario 460 431 412 371
Reference Scenario 460 431 412 371
+climate change 0 0 5 12 + climate change 0 0 5 12 +efficiency -3 -45 -133 -168 - efficiency -3 -49 -154 -208 +substitution -7 -24 -52 -62 - substitution -7 -72 -127 -131 450 ppm total 450 362 232 153 400 ppm total 450 310 136 45
Source: CEPE's results

ADAM 2-degree scenario for Europe – policies and impacts
- 141 -
7 The service (tertiary) and the primary sectors in Europe
Authors: Giacomo Catenazzi, Martin Jakob, Eberhard Jochem
The service sector, also referred to as the tertiary sector, includes the public sector and the non-industrial/manufacturing (private) sectors such as public administration, education and health, bank and finance, trade. Next to some infrastructure services such as street lighting, most of the energy in the service sector is used in buildings. The service sector of Europe in 2005 had a share of 58% in employment, 35% in total electricity demand, 13 % in total final energy demand, and a somewhat lower share of direct CO2 emissions due to the relatively high shares of natural gas use and district heat supply (Jochem et al. 2007, Eurostat). In line with traditional approaches in energy bottom-up modelling, this section also covers the primary sector, which includes agriculture, forestry, fishery etc.
The future energy demand of the service sector has been projected until 2050 using detailed bottom-up models which explain structural changes and their impact on energy demand more clearly than aggregated models. Non-electric applications, particularly space heating, on the one hand and electric applications and building technologies such as lighting, cooling and ventilation and others, on the other hand, are treated separately as these energy uses depend on different – sometimes diverging – drivers of the bottom-up model such as floor area, number of employee or value added. Energy demand that is used outside buildings was estimated similarly.
However, data availability may be poor for some sub-sectors and European countries and the many assumptions which then have to be made to compensate for missing empirical data may partly offset the advantage of higher differentiation. As in the ADAM M1 report on the reference case (4°C), the building sector’s adaptation to climate change (2°C) in each of the 29 European countries was taken into account.
7.1 Challenges and objectives of the analysis
The objectives of the analyses and projections in the service sector were the following:
• (1) The projections up to 2050 should provide a realistic picture of the bottom-up drivers of energy demand in the service sector in relation to the developments in terms of the economic drivers such as value added, increased floor area and number of employees in each country.
• (2) The projections include the impacts of a high adaptation scenario (Reference Scenario) and of an intensive mitigation scenario (called the 2°C Scenario) on energy

Service Sector
- 142 -
demand, energy efficiency, as well as on the costs and investments associated with adaptation to climate change or mitigation of climate change. The energy demand is broken down into fuel and electricity demand, of which the energy demand for cooling is reported separately.
• (3) Finally, the two scenarios should give a brief outline of the policies needed to achieve the mitigation targets or to adapt to the changing climate in Europe.
The challenges involved in the analysis and projections were determined by the objectives and the available data and models. Data for Central and Eastern European countries were often lacking and had to be estimated; the models had to be disaggregated and the influence of changing temperatures on heat demand or air conditioning had to be determined. Finally, the investments in and cost changes of adaptation and mitigation measures had to be calculated to provide data for the macroeconomic analysis performed using the ASTRA model.
7.2 Methodology and assumptions
The modelling of the energy demand of the service sector in Europe is based on the energy demand model SERVE of the Centre for Energy Policy and Economics (CEPE) of ETH Zurich, a detailed bottom-up model for the service sector of Switzerland. It was developed in the 1990s and has been used by CEPE on behalf of the Swiss Federal Office of Energy (SFOE) in the elaboration of new energy scenarios for Switzerland. It includes a cohort model of both the building and the heating system stock and models the electricity demand by categorizing the buildings according to their level of technological equipment which develops over time, as does the specific energy consumption due to technical progress. Detailed accounts can be found in Aebischer et al. (1996), Aebischer and Schwarz (1998), and Aebischer et al. (2007a). For the European case pursued in the ADAM project, an adjusted and simplified approach is followed (called SERVE-E). The basic structure of the approach, which is typical for bottom-up models, can be described as follows:
, ,,
_i k i ki k
energy quantity specific demand= ⋅∑
Where quantity denotes a quantitative (mostly physical) driver (e.g. floor area), specific_demand denotes the energy demand per unit of quantitative driver (e.g. square metre), i the economic sector or sub-sector (see below), and k the energy carrier, respectively. The choice of the quantitative driver depends on data availability and the underlying processes of energy use (heating, ventilation, lighting). In the building sector, energy use is mostly related to floor area, which is in turn related to economic drivers represented by indicators such as floor area per employee and value added per employee. Regarding

ADAM 2-degree scenario for Europe – policies and impacts
- 143 -
buildings, both the quantitative drivers and the specific energy demand are structured into different cohorts of new (as from 2005) and existing buildings and into unchanged and refurbished buildings (see the ADAM model description report for more details).
The structure of the electricity demand module is similar to that of the heat demand module of SERVE, i.e. the demand for electricity is determined as the product of the specific electricity demand per floor area multiplied by the floor area.
The model SERVE-E differentiates between the following six service sub-sectors:
• Commerce/trade (distribution and warehousing, retail)
• Finance (banks and insurances)
• Hotels, restaurants (including catering)
• Education (schools, universities, research)
• Health (hospitals, social services)
• Others (other commercial offices, public buildings, sport and leisure, transportation infrastructure12 etc),
Moreover, SERVE-E covers the primary sector which includes agriculture, forestry and fishery, which represents a commonly adopted sectoral breakdown of bottom-up models.
Most data and studies of energy demand for buildings target the residential sector. For this reason, we refer to the chapter on the residential sector for a more detailed discussion about the assumptions.
The main quantitative drivers are floor area and the unit energy consumption (per floor area) for both heating and electricity. The floor area of the service sector is derived from the number of employees, imported from the scenario boundary conditions (see Chapter 2) and from estimates for the future development of the sector-specific floor area per employee.
The number of employees is driven by the value added of the sectors, importing results from E3ME (up to 2030) and ASTRA (relative growth as from 2030) for the Reference Scenario, and the relative change of ASTRA for further iteration in the two mitigation scenarios (450 ppm and 400ppm targets). The number of employees rises in almost all sectors of nearly every country up to 2030. According to the model E3ME, however, there are quite noticeable differences between the EU 15+2 and the new EU-12 Member States (NMS) and between the various sub-sectors. For instance, the number of employees in the sectors commerce/trade and
12 Regarding transportation, the energy use of buildings (train stations, air ports etc.) and infrastructure (e.g. street lighting, ventilation of tunnels) is included in the service sector, whereas the energy use of cars, buses, trucks, trains etc. is covered by a separate model (ASTRA).

Service Sector
- 144 -
finance increases in the NMS, but decreases in the EU 15+2, whereas the opposite trend applies to the health sector: increasing employees in the EU 15+2 and mostly decreasing in the NMS. After 2030, the relative growth is based on the results of ASTRA, which indicates a reduction in the number of employees in all sectors for both country groups (EU 15+2, NMS), mostly by between -10% and -15%.
It is assumed that, in the long run (up to 2100), there is a tendency for the floor area per employee to reach a similar level in every country. This long-run level is sector-specific and determined by cost-cutting trends (less labour). In some sectors, such as banking and administration, this means less floor area per employee. In other sectors, such as wholesale, retail, hotels etc., this means an increase of floor area per employee (the number of employees here is reduced due to efficiency gains and structural changes, for instance from small retail shops to large commercial centres), see D1 Chapter 6.4.1 for a more detailed description.
Apart from energy demand on the level of useful or final energy, SERVE-E also models substitution effects between different energy carriers. Such substitution effects mainly occur regarding heating energy demand, but in the long term, other energy services such as cooling, cooking or drying (e.g. laundries in hotels or hospitals) might also be subject to energy carrier substitution effects.
In the next two sections, details about the specific assumptions are given, differentiating between heating (space heat and hot water and process heat) and associated fuel energy demand (section 7.2.1) and specific electricity-based energy services (section 7.2.2).
7.2.1 Heating and fuel energy demand
7.2.1.1 Energy efficiency for heating in the service and the primary sector
The service sector improvements of space heating on the one hand, and hot water and process heat on the other are assumed to be similar to those of multi-family houses (see Chapter 6.2.1), taking into account adjusted shares of heating and hot water and process energy demand. The improvements due to the retrofitting of buildings, building technologies, and heating systems result in improvements in terms of the unit energy demand (energy demand per square metre) of between 44% in the case of hotels and restaurants and 59% in the case of offices (in banks and finance, and in other services, public administration, etc.) in the 450 ppm scenario variant (see Table 7-1). In the case of the more ambitious scenario variant, the specific energy demand improvement varies between 54% and almost 70%. Again, the highest efficiency gains are assumed to take place in sectors with the highest share of space heating.

ADAM 2-degree scenario for Europe – policies and impacts
- 145 -
To illustrate these assumptions: An overall reduction of about 50% is achieved if 70% of buildings are each improved by 70%, and an overall reduction of 70% is obtained if almost 90% of buildings are each improved by almost 80%. Such improvements are, in principle, achievable using today’s building technology and retrofit practices (see, for instance, Jakob et al. 2006). The assumptions become even more realistic if the techno-economic progress of the next forty years is taken into account. High performance insulation materials, ventilation and other systems with very efficient heat recovery and energy-efficient windows are currently entering the market and will play a prominent role in an ambitious mitigation scenario. Also, control technologies are becoming more and more relevant which allow user-specific energy services (e.g. occupancy, daylight and indoor air quality controls) and avoid energy consumption without use (see for instance Brunner et al. 2008).
Although there is little published evidence regarding fuel energy efficiency in the primary sector (agriculture, forestry etc.),13 it can still be assumed that there are considerable energy efficiency potentials available at negative or low costs (Urge-Vorsatz and Metz (2009). Such potentials are assumed to be exploited in the mitigation scenario over the next decades. These include, for instance, a more efficient energy use in glasshouse horticulture due to heat management systems, e.g. with heat recovery and intermediate storage (EEAP-NL, 2007), more fuel-efficient farm machinery, particularly tractors. Due to the lack of evidence and following a conservative approach, no differentiation was made between the two scenario variants.
Table 7-1: Fuel energy efficiency improvements in different sub-sectors of the service
sector in the two variants of the mitigation scenario relative to the Reference
Scenario
450 ppm mitigation scenario variant 400 ppm mitigation scenario variant 2035 2050 2035 2050 Trade 30% 50% 37% 62% Bank, finance 46% 59% 52% 68% Hotel, restaurants 32% 44% 38% 54% Education 45% 57% 51% 67% Health 43% 56% 49% 65% Other 46% 59% 52% 69% Agriculture 21% 32% 21% 32%
Source: CEPE's assumptions
13 Urge-Vorsatz and Metz (2009) state that the “contribution of energy efficiency measures in the
agricultural sector to climate change mitigation is under-researched”.

Service Sector
- 146 -
7.2.1.2 Fuel shares in the service sector
The fuel share assumptions are similar to the residential sector. However, because of the lack of data, electric heating is considered together with other electricity demand. For the two scenarios, we adopted some generic rules (see Table 7-2) which eliminate coal demand in the final energy demand of the service sector and reduce the oil, district heat and natural gas shares by 65%, 35% and 20%, respectively, in the 450 ppm scenario variant compared to the Reference Scenario. In the more ambitious 400 ppm scenario variant, structural change is assumed to be significantly more pronounced: Oil is displaced by nearly 80%, district heat by 50% and natural gas by 75%.
The assumptions about the remaining energy carriers were differentiated by country to account for their respective conditions. There will be a clear increase in the shares of wood, pellets, heat pumps and solar heat, which replace fossil fuel demand, but because of the large demand-side efficiency improvements, energy demand in absolute terms will increase only in the case of solar energy and heat pumps. In countries with low fossil fuel shares, like the northern countries, the changes are minor: Heat pumps (and also solar heat) will displace the share of fossil fuels, and to some extent also wood, which will be exported to other countries. Note that total wood consumption (of all demand sectors) was kept more or less within the potentials available from European sources (see section 5 on EFISCEN).
Solar heat will have greater impacts (in relative terms) on the southern countries , due in part to the higher insulation, but also due to the relatively high demand for hot water in comparison to winter heat generation.
The demand for biogas is implicitly included in natural gas demand. Because of its limited availability and the potentially high demand, buildings and the transportation sector will compete for biogas (and biomass in general). For this reason, biogas use is not broken down into sectors, but is modelled in the conversion sector.
Overall, the structural change of building energy supply is considerably stronger in the two mitigation scenario variants than in the Reference case. Note that the two scenario variants only differ noticeably after 2010.

ADAM 2-degree scenario for Europe – policies and impacts
- 147 -
Table 7-2: Relative fuel share level in the two mitigation scenarios, general rules
450ppm scenario variant 400ppm scenario variant 2010 2030 2050 2010 2030 2050 Coal 90% 40% 0% 90% 30% 0%
Oil 95% 65% 35% 95% 52% 21% District heat 100% 85% 65% 100% 77% 52% Wood increasing `strongly increasing Natural gas 99% 90% 80% 99% 63% 24% Heat pumps (el.) increasing strongly increasing Propane 100% 100% 100% 100% 60% 40% Pellets increasing strongly increasing Solar 102% 110% 133% 102% 132% 186% Biogas Not explicitly modeled Not explicitly modeled Others 100% 100% 100% 100% 60% 40%
Source: CEPE's assumptions
7.2.2 Electricity demand in the service and the primary sectors
Regarding technical progress and structural changes, differentiated assumptions were made for different sub-sectors depending on the diffusion of building technologies, energy services and the remaining efficiency potentials. The annual improvements listed in Table 7-3 include the net effects of structural changes, additional energy services and efficiency improvements. Efficiency improvements include measures such as planning, appropriate sizing, and control technologies. In the case of existing buildings, retrofits of existing building technologies are covered such as ventilation and cooling systems, lighting installations etc.. Apart from purely technical improvements, it is also possible to optimise the operation and use of energy services such as computers and lighting. Overall, an improvement of around 50% of the unit energy demand in 2050 is assumed in the case of the 450 ppm scenario, and up to 65% in the 400 ppm scenario compared to the Reference Scenario. These assumptions are based on the findings of our own research (e.g. Jakob et al. 2006), various preparatory studies of the Ecodesign Directive (e.g. Adnot et al. 2003, Rivière, Adnot et al. 2008 regarding ventilation and air conditioning, De Almeida et al. 2008 regarding electric motors, Van Tichelen, Jansen et al. (2007) regarding lighting), and others (e.g. Brunner et al. 2009).
Efficiency measures in the primary sector include more efficient electric motor systems such as those used in irrigation and other pumping systems, conveyors, more efficient HVAC systems for livestock and crop drying systems, and others. For instance, the economic use of solar collectors to reduce hay ventilation was already successfully proven in Switzerland in the 1990s.

Service Sector
- 148 -
Table 7-3: Efficiency improvements (with technical and optimization measures) in the
different sub-sectors of the SERVE model: yearly improvement of the
Reference scenario; additional improvements in the mitigation scenarios
compared to the Reference scenario (yearly and overall in 2050)
Reference scenario Additional to the reference scenario 450 ppm sc. variant Diff (*) 400 ppm sc. variant Diff (*)
2020-2005
2035-2020
2050-2035-
2035-2005 2050-2035- 2035-
2005 2050-2035-
Trade -0.6% -0.4% -0.2% -1.5% -2.1% -51% -1.8% -2.9% -62% Bank, finance -0.6% -0.4% -0.2% -1.6% -2.4% -56% -1.9% -3.2% -65% Hotel, restaurants -0.4% -0.2% -0.2% -1.4% -2.0% -50% -1.8% -2.8% -61% Education -0.4% -0.2% -0.2% -1.4% -2.1% -51% -1.8% -2.9% -61% Health -0.6% -0.2% -0.2% -1.7% -2.5% -57% -2.0% -3.3% -67% Other -0.6% -0.4% -0.2% -1.5% -2.2% -53% -1.9% -3.1% -64% Agriculture 0% 0% 0% -1.3% -1.7% -45% -1.6% -2.5% -57% (*) compared to the Reference Scenario in 2050
Source: Deliverable M1.1, CEPE's assumptions
7.3 Results for the Reference (adaptation) and the 2°C mitigation scenarios
7.3.1 Energy demand and energy-efficiency gains in the service and primary sectors
Whereas the energy demand for fuels, which includes all final energies except electricity, either increases or more or less stabilizes between 2035 and 2050 in most of the countries in the Reference Scenario, it decreases in both the 450 ppm and the 400 ppm scenario variants and to a greater extent in the latter. Generally speaking, the difference between the Reference Scenario and the 450 ppm scenario variant varies between 40 % and 60 % in 2050 (see Table
7-4). In the more ambitious 400 ppm scenario variant, the relative energy-efficiency improvement is larger and varies here between 60 % and 80 % (exceptions apply).
The relative improvements are the lowest in the case of the northern countries. This can be partly explained by the fact that these countries were already more efficient at the outset in 2005.
In the 400 ppm scenario variant, there is a strong tendency to substitute fossil fuel heating systems by renewable energies including heat pumps (see Figure 7-1). Although heat pumps are driven by electricity, which might be generated by fossil fuels, such a combination is still more efficient in terms of primary energy or CO2-emissons than most other individual heating systems, particularly fossil ones. The mitigation effectiveness of heat pumps is even greater if

ADAM 2-degree scenario for Europe – policies and impacts
- 149 -
the electricity used to power them is generated in a carbon-free way which is almost the case in the 450 and the 400 ppm scenarios (see Chapter 11).
Table 7-4: Fuel energy demand in the service sector of the Reference scenario, and of the
450 ppm and the 400 ppm scenario variants by country and for four
European regions 2005 to 2050, in PJ/year
Reference scenario 450ppm scenario variant 400ppm scenario variant 2005 2020 2035 2050 2020 2035 2050 Diff (*) 2020 2035 2050 Diff (*)
Austria 87 91 89 76 82 67 50 -34% 75 53 35 -54%Baltic States 53 63 66 61 56 47 37 -39% 52 38 25 -59%Belgium/Lux. 169 175 168 140 142 97 62 -56% 125 64 27 -81%Bulgaria 18 17 20 18 15 14 11 -40% 14 12 9 -52%Czech Republic 94 120 120 114 103 78 61 -47% 90 53 32 -72%Denmark 70 73 75 68 63 51 37 -45% 60 42 26 -61%Finland 87 80 74 65 72 54 39 -39% 69 47 31 -51%France 518 524 502 422 430 308 209 -51% 382 228 138 -67%Germany 913 1053 1026 874 871 639 428 -51% 763 453 249 -72%Greece 42 36 33 31 31 20 13 -58% 29 18 10 -67%Hungary 131 159 168 146 138 108 73 -50% 119 69 31 -79%Ireland 58 71 73 64 57 41 26 -59% 50 29 14 -78%Italy 439 448 421 354 377 275 190 -46% 332 192 97 -73%Malta/Cyprus 3 5 5 4 4 2 1 -60% 4 2 1 -68%Netherlands 405 408 386 329 345 253 170 -48% 308 175 78 -76%Norway 36 29 26 24 26 18 14 -42% 24 15 11 -56%Poland 328 390 390 338 327 242 163 -52% 302 186 103 -70%Portugal 72 112 162 161 83 72 45 -72% 75 63 40 -75%Romania 90 93 125 127 82 91 75 -41% 80 83 55 -57%Slovakia 91 141 158 135 117 94 62 -54% 103 62 28 -79%Slovenia 22 26 25 22 22 16 11 -48% 19 12 8 -63%Spain 271 317 318 285 262 185 125 -56% 246 158 99 -65%Sweden 94 109 113 97 97 82 61 -38% 94 71 45 -53%Switzerland 62 64 63 54 54 44 33 -39% 49 35 22 -59%
United Kingdom 462 533 586 543 443 370 280 -49% 375 235 109 -80%
EU27(+2) 4616 5135 5191 4551 4299 3266 2275 -50% 3840 2396 1324 -71%
North 286 291 288 253 259 204 151 -40% 247 175 114 -55%South 936 1027 1084 980 854 660 460 -53% 780 527 311 -68%East 719 900 926 816 762 584 407 -50% 685 420 227 -72%
West 2675 2918 2893 2503 2424 1818 1256 -50% 2128 1273 672 -73%
(*) compared to the Reference Scenario in 2050
Source: CEPE's results
Renewable energies used for heating purposes mainly include wood-fired energy systems, particularly in northern Europe and the Alpine region of Austria and Switzerland. At the end of the period, pellet systems account for a substantial share of heating in the service sector of

Service Sector
- 150 -
these countries. In terms of renewables, wood is complemented by solar energy, especially in the southern countries which have a solar share of 10 % to 20 %, compared to only about half this figure in the other countries. Solar energy may include direct thermal applications that contribute to space heating and other heat demand (e.g. drying) and PV used to drive heat pumps (together with a back-up system).
As far as fossil energies are concerned their share might include conventional or fuel based cogeneration, although cogeneration is not explicitly modelled.
0% 20% 40% 60% 80% 100% 120%
AT
BELUX
DK
FI
FR
DE
GR
IE
IT
NL
PT
ES
SE
UK
NO
CH
BALTIC
HU
PL
CZ
SK
MED
SI
BG
RO
HPoilgasheatwoodpelletssolarothers
400ppm
CEPE's results
Figure 7-1: Shares of heating systems (in the service sector, for the 400 ppm scenario
variant, in 2050 (all types except direct electric heating)
The share of renewable energy and heat pump heating systems is largest in the ambitious 400 ppm scenario variant (see Table 7-5). Here, the share of fossil fuel energy systems (oil and gas) is reduced by 25%. Note that these are idealised shares. Some of the fossil-fired boilers might be part of combined systems with heat pumps, where fossil fuels satisfy peak demand

ADAM 2-degree scenario for Europe – policies and impacts
- 151 -
and heat pumps the base load heating demand. Such a combination is often more cost-effective and allows the installed power of heat pumps to be lowered. Solar energy is also usually used in combined systems where either fossil fuels or wood boilers provide back-up power during periods with no to low solar availability. The share of wood systems increases from 7% in the Reference Scenario to 11% in the 450 ppm variant and almost triples to 20% in the 400 ppm variant.
Table 7-5: Heating system break down in the service sector of the Reference scenario,
and of the 450 ppm and the 400 ppm scenario variants, 2050
HP (*) Oil Gas Heat Wood Solar Others Total
Reference scenario 0% 26% 58% 8% 7% 1% 1% 100% 450ppm scenario variant 20% 13% 46% 5% 11% 4% 0% 100% 400ppm scenario variant 43% 10% 15% 4% 20% 8% 0% 100% (*) Electricity and ambient heat (air or ground source)
Source: CEPE's results
Contrary to fuel energy demand, electricity demand increases in most countries in the Reference Scenario even after 2035, although then only slightly. However, electricity demand does decrease slightly after 2035 in some countries, mainly in northern and western Europe (see Table 7-6).

Service Sector
- 152 -
Table 7-6: Electricity demand of the service sector for the Reference, the 450 ppm and
the 400 ppm scenarios, in PJ/year.
Reference scenario 450ppm scenario variant 400ppm scenario variant
2005 2020 2035 2050 2020 2035 2050 Diff(*) 2020 2035 2050 Diff(*)
Austria 64 76 84 83 66 56 41 -51% 66 53 34 -59% Baltic States 28 40 49 54 34 32 26 -52% 35 30 22 -60% Belgium/Lux. 48 58 66 65 52 48 36 -45% 56 50 35 -47% Bulgaria 23 28 34 36 24 24 18 -49% 24 22 15 -58% Czech Republic 58 77 84 96 71 61 53 -45% 73 60 46 -52% Denmark 51 58 66 66 50 45 34 -48% 50 42 28 -57% Finland 66 73 82 80 64 54 39 -51% 63 49 31 -61% France 517 666 811 806 580 540 390 -52% 584 502 319 -60% Germany 480 609 675 661 541 473 347 -48% 561 460 298 -55% Greece 70 84 103 110 72 69 54 -51% 73 64 45 -59% Hungary 41 54 66 67 50 48 36 -45% 55 51 36 -46% Ireland 37 48 55 54 44 43 35 -35% 45 42 32 -40% Italy 313 385 452 453 352 337 270 -41% 366 336 252 -44% Malta/Cyprus 11 15 17 18 15 13 9 -48% 15 12 8 -57% Netherlands 172 188 207 200 170 155 121 -40% 178 158 118 -41% Norway 93 101 110 108 90 75 54 -50% 89 67 43 -60% Poland 132 194 241 242 169 171 133 -45% 173 167 117 -52% Portugal 59 94 143 159 83 101 85 -46% 84 93 67 -58% Romania 44 59 86 104 52 62 56 -46% 53 60 53 -49% Slovakia 68 107 132 133 93 90 67 -50% 95 87 58 -56% Slovenia 11 16 18 16 14 12 8 -49% 15 12 7 -58% Spain 255 378 464 498 324 304 246 -51% 331 287 208 -58% Sweden 111 133 156 157 116 105 76 -52% 115 95 61 -61% Switzerland 57 65 73 73 57 49 36 -51% 58 45 29 -60%
United Kingdom 402 476 561 581 420 385 297 -49% 431 373 263 -55%
North 321 365 414 410 321 279 203 -51% 318 254 163 -60%
South 774 1042 1301 1377 922 909 738 -46% 946 873 648 -53%
East 338 488 590 609 431 414 324 -47% 446 406 286 -53%
West 1776 2185 2533 2524 1930 1749 1302 -48% 1979 1684 1127 -55% EU27+2 3210 4079 4838 4920 3604 3351 2568 -48% 3688 3217 2224 -55%
(*) compared to the Reference Scenario in 2050
Source: CEPE's results
In the 450 ppm scenario variant, electricity demand is below its 2005 level either in 2020 (North EU27+2), in 2035 (West Europe, which represents the bulk of the EU27+2), or in 2050 (East and South EU27+2). The electricity demand of the service sector ranges between 45% and slightly more than 50% compared to the Reference Scenario in 2050. In the more ambitious 400 ppm variant, the general pattern is similar to the 450 ppm variant, except for the fact that electricity demand is curbed to a greater extent, by about 5 to 10 percentage points.
Hereafter, the electricity demand for cooling and that for heat pumps are reported separately. These applications are of special interest with respect to adaptation (cooling) and mitigation

ADAM 2-degree scenario for Europe – policies and impacts
- 153 -
(heat pumps that replace fossil fuel heating systems). Reporting these applications separately also helps to get a better grasp of the overall results.
In the Reference Scenario, the relative growth of electricity demand is largest in southern countries due to general comfort requirements which call for more cooling, a trend which is reinforced slightly by the changing climate (see Jakob et al. 2008). Although the share of electricity for cooling purposes will increase in all countries, it does so at a significantly higher level in southern European countries, namely by about 45% in the Reference Scenario (compare Table 7-7 with Table 7-6).
In the mitigation scenario variants, the electricity demand for cooling is significantly reduced, namely by almost two thirds, for two main reasons: First, energy efficiency improvements such as more efficient compressors and cooling systems as a whole including free cooling, occupancy control technologies, and others help to lower electricity demand. Indeed, free cooling, that is the use of ambient air or ground, has large efficiency potentials in most countries and for the larger part of the year. Second, climate change is less pronounced – as a result of global mitigation measures. As a result, the shares of cooled floor area are slightly lower and the specific cooling electricity demand per unit of floor area does not increase to the same extent (see Jakob et al. 2008 for more details regarding the relationship between cooling energy demand and cooling degree days).
Table 7-7: Electricity demand for cooling in the Reference scenario, and in the 450 ppm
and the 400 ppm scenario variants of four European regions, in PJ/year
Reference scenario 450ppm scenario variant 400ppm scenario variant
2005 2020 2035 2050 2020 2035 2050 Diff (*) 2020 2035 2050 Diff (*)
North 3 6 8 9 5 5 3 -62% 5 5 3 -62%South 209 449 604 636 379 335 231 -64% 379 335 231 -64%East 13 34 51 54 29 29 20 -63% 29 29 20 -63%
West 64 156 225 233 133 125 84 -64% 133 125 84 -64%
EU27+2 288 645 889 931 546 493 338 -64% 546 493 338 -64%
(*) compared to the Reference Scenario in 2050
Source: CEPE's results
Although significant shares of buildings are assumed to be heated by heat pumps (see Figure
7-1 oben), the total electricity demand for heat pumps (see Table 7-8) remains relatively low compared to the total electricity demand and also compared to the electricity demand for cooling and ventilation (compare with Table 7-7 oben). Such results are consistent with the assumptions regarding increased energy efficiency due to retrofits of the building envelope and of building technologies (particularly ventilation) and regarding the high seasonal energy efficiencies of heat pumps (annually weighted average of coefficient of performance) of 200% to 300%.

Service Sector
- 154 -
Table 7-8: Electricity demand for additional heat pumps in the 450 ppm and the 400
ppm scenario variants of four European regions (compared to the Reference
scenario), in PJ/year
450ppm scenario variant 400ppm scenario variant
2020 2035 2050 2020 2035 2050 North 0 1 2 3 5 4 South 12 31 39 30 54 57 East 10 21 23 30 52 47
West 39 76 83 115 174 152
EU27+2 60 130 147 177 284 260
Source: CEPE's results
Electricity remains the dominant final energy in the service sector in all scenarios and all years (see Table 7-9). This is due to the fact that electricity demand is already very relevant in the base year 2005 and then continues to increase quite strongly in the Reference Scenario. Despite this increase in the Reference Scenario, however electricity demand is reduced in both mitigation scenario variants compared to the base year 2005: by about 20% in the 450 ppm case and by about 30% in the case of the more ambitious 400 ppm scenario variant.
Table 7-9: Final energy demand break down in the Reference Scenario, and in the 450
ppm and the 400 ppm scenario variants of four European regions, in PJ/year.
Reference scenario 450 ppm scenario variant 400 ppm scenario variant
2005 2020 2035 2050 2020 2035 2050 Diff (*) 2020 2035 2050 Diff(*)
Electricity (incl. el. for HP) 3210 4079 4838 4920 3604 3351 2568 -48% 3688 3217 2224 -55%Heating oil 1707 1556 1409 1166 1289 758 379 -67% 1204 620 243 -79%Natural gas 2256 2802 2964 2649 2301 1852 1320 -50% 1939 1046 347 -87%Wood, pellets, chips 140 251 296 317 237 286 323 2% 241 366 467 47%Solar 6 19 35 38 51 102 117 211% 64 152 181 383%
District heating 384 436 439 349 362 248 133 -62% 337 196 83 -76%
Ambient heat 136 338 429 399 742 753
Total 7702 9142 9982 9439 7979 6936 5269 -44% 7872 6338 4299 -54%
(*) compared to the Reference Scenario in 2050
Source: CEPE's results
In relative terms, the biggest decrease is in fossil energies and district heat in both mitigation scenario variants compared to the Reference Scenario and also when compared to the base year 2005. Compared to the Reference Scenario, electricity demand is also reduced quite considerably, namely by roughly 50 %. Conversely, wood energy demand of all kinds more than doubles in the 450 ppm variant by 2050 compared to base year and more than triples in the 400 ppm variant. As a result, wood energy demand is about 50 % higher in the 400 ppm variant than in the less ambitious 450 ppm case.

ADAM 2-degree scenario for Europe – policies and impacts
- 155 -
7.3.2 Changes in costs and investments
In terms of total energy costs, there are several overlapping effects. Some of these effects are cumulative whereas others are compensatory.
• Compared to 2005, energy costs increase in the Reference Scenario due to the general trend of increasing final energy demand and a shift towards electricity, which is more expensive than the other energies.
• To a certain extent the cost increase in the Reference case is due to climate change adaptation since more electricity is consumed for cooling.
• In the mitigation scenarios, the additional costs for cooling are less marked and heating costs decrease.
Until 2020 the adaptation effect is stronger, so that the additional costs for air conditioning are slightly higher than the reduced energy costs of heating. Overall, the reduced heating demand in the mitigation scenarios more than compensates for the increase in electricity demand due to air conditioning, especially in the long term (period 2030-2050). Indeed, in the long run, the current trend towards more air conditioning diminishes so that the reduced energy costs for heating become more relevant (see Table 7-10).
Table 7-10: Fuel and electricity costs (energy expenditures) in the service sector, in billion
EUR2005 per year.
Reference scenario 450ppm variant 400ppm variant
2005 2020 2035 2050 2020 2035 2050 Diff (*) 2020 2035 2050 Diff (*)
North 15 17 20 19 13 12 12 -38% 13 11 9 -50%South 35 48 58 59 31 34 31 -47% 31 35 32 -45%East 12 19 23 24 23 17 16 -34% 23 14 11 -52%
West 88 116 133 133 102 88 77 -42% 100 76 56 -58%
EU27+2 150 201 233 235 170 152 136 -42% 167 136 109 -53%
(*) compared to the Reference Scenario in 2050
Source: CEPE's results
In addition to the cost differences due to energy expenditures, there are also additional investments made to increase the air conditioned area and to maintain or increase comfort levels. The additional investments due to a warmer climate are based on specific costs found in Rivière, Adnot et al. (2008) for room air conditioning, and on Jakob et al. (2006) for central air conditioning and ventilation installations. The re-investment cycles range from 15 years for room air conditioning to 20 years for central air conditioning.

Service Sector
- 156 -
The investments needed for adaptation amount to 1.5 billion euros per year in the Reference Scenario, but less than half this amount in the two mitigation scenarios (see Table 7-11).
Table 7-11: Investment in adaptation in the service sector, in billion EUR2005 per year, ,
for two warmer climate scenarios: +4 and +2 degrees
4 degree scenario (reference) 2 degree mitigation scenario (450-400ppm)
2020 2020 2035 2050 2020 2035 2050 Diff (*)
North 0.13 0.26 0.35 0.39 0.16 0.20 0.16 -58%
South 0.06 0.15 0.22 0.25 0.11 0.15 0.11 -56%
East 0.13 0.24 0.32 0.35 0.04 0.06 0.19 -44%
West 0.21 0.35 0.47 0.50 0.25 0.10 0.17 -66%
EU27+2 0.54 0.99 1.36 1.48 0.56 0.51 0.63 -57%
(*) compared to the Reference Scenario in 2050
Source: CEPE's results
The mitigation costs are considerably larger than the adaptation costs in buildings of the service sector, namely around 50 billion euros per year for energy efficiency measures of the building envelope (see Table 7-12) and about 0.8 billion euros for investments in fuel substitutions in the 450 ppm variant and 1.3 billion euros in the 400 ppm variant, respectively (see Table 7-13). Investments in fuel substitution are much lower since all the heating systems display similar investment costs (see Jakob et al. 2006), so that only minor differences are assumed.
Table 7-12: Investments in efficiency mitigation measures in the service sector, in billion
EUR2005 per year
450ppm scenario variant 400ppm scenario variant
2020 2035 2050 2020 2035 2050
North 3 3 3 3 4 3
South 15 16 12 12 13 10
East 7 6 5 8 7 7
West 20 25 20 24 29 25
EU27+2 46 51 40 48 54 46
Source: CEPE's results
Hence, investments of 50 billion euros per year in mitigation measures (see Table 7-12 and Table 7-13) induce savings of 100 to 130 billion euros in terms of reduced energy costs (compare mitigation scenario variants and the Reference Scenario in Table 7-10 oben).
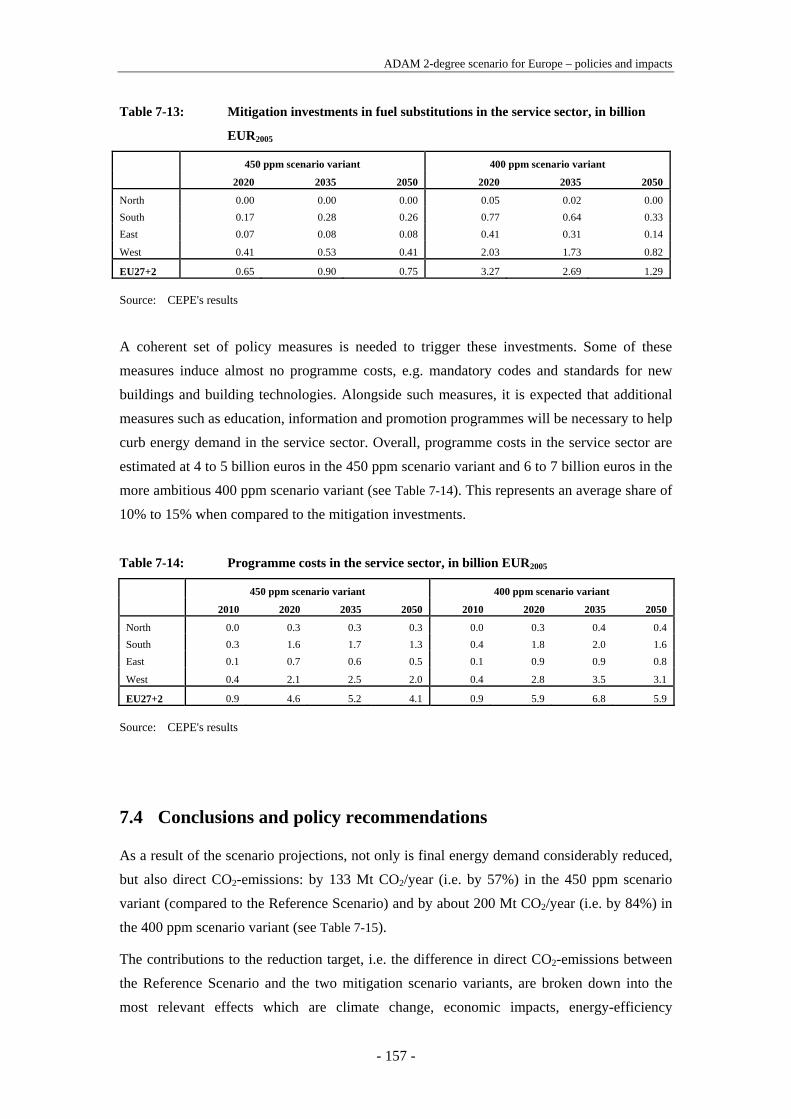
ADAM 2-degree scenario for Europe – policies and impacts
- 157 -
Table 7-13: Mitigation investments in fuel substitutions in the service sector, in billion
EUR2005
450 ppm scenario variant 400 ppm scenario variant
2020 2035 2050 2020 2035 2050
North 0.00 0.00 0.00 0.05 0.02 0.00 South 0.17 0.28 0.26 0.77 0.64 0.33 East 0.07 0.08 0.08 0.41 0.31 0.14
West 0.41 0.53 0.41 2.03 1.73 0.82
EU27+2 0.65 0.90 0.75 3.27 2.69 1.29
Source: CEPE's results
A coherent set of policy measures is needed to trigger these investments. Some of these measures induce almost no programme costs, e.g. mandatory codes and standards for new buildings and building technologies. Alongside such measures, it is expected that additional measures such as education, information and promotion programmes will be necessary to help curb energy demand in the service sector. Overall, programme costs in the service sector are estimated at 4 to 5 billion euros in the 450 ppm scenario variant and 6 to 7 billion euros in the more ambitious 400 ppm scenario variant (see Table 7-14). This represents an average share of 10% to 15% when compared to the mitigation investments.
Table 7-14: Programme costs in the service sector, in billion EUR2005
450 ppm scenario variant 400 ppm scenario variant
2010 2020 2035 2050 2010 2020 2035 2050
North 0.0 0.3 0.3 0.3 0.0 0.3 0.4 0.4 South 0.3 1.6 1.7 1.3 0.4 1.8 2.0 1.6 East 0.1 0.7 0.6 0.5 0.1 0.9 0.9 0.8
West 0.4 2.1 2.5 2.0 0.4 2.8 3.5 3.1
EU27+2 0.9 4.6 5.2 4.1 0.9 5.9 6.8 5.9
Source: CEPE's results
7.4 Conclusions and policy recommendations
As a result of the scenario projections, not only is final energy demand considerably reduced, but also direct CO2-emissions: by 133 Mt CO2/year (i.e. by 57%) in the 450 ppm scenario variant (compared to the Reference Scenario) and by about 200 Mt CO2/year (i.e. by 84%) in the 400 ppm scenario variant (see Table 7-15).
The contributions to the reduction target, i.e. the difference in direct CO2-emissions between the Reference Scenario and the two mitigation scenario variants, are broken down into the most relevant effects which are climate change, economic impacts, energy-efficiency

Service Sector
- 158 -
improvements and substitution effects. Two first two mentioned effects are positive, i.e. emissions of the mitigation scenarios increase rather than decrease assuming that all other factors are unchanged.
Compared to the Reference case, (gross) direct CO2-emissions increase slightly in the mitigation scenario variants because more heating energy is needed due to a lower rise in the ambient temperature in the mitigation cases. Note, however, that this effect is only minor, namely about 3% of the difference in the case of the 450 ppm scenario variant (4 Mt CO2/year out of 133 Mt CO2/year of net reduction) and relatively spoken even less in the 400 ppm case (4 Mt CO2/year out of about 200 Mt CO2/year of net reduction) (see Table 7-15). Also, (gross) CO2-emissions in the mitigation scenario variants increase due to macro-economic effects – if everything else remains unchanged: mitigation measures call for additional investments including engineering and other services which have a positive effect on employment in the sector, too. In 2050, this contributes about 9% additional CO2-emissions.
Besides these rather minor increases, the results of the scenario projections follow – in qualitative terms – a similar pattern as in the residential sector: In relative and absolute terms, energy efficiency improvements make the biggest contribution in the 450 ppm variant (-130 million tonnes of 158, i.e. 82%million tonnes of gross direct CO2 emission reductions or 55% of the emissions of the Reference scenario in 2050), while substitution effects are much lower (29 Mt, i.e. 18% of the gross emission reduction or 12 % of the reference scenario). In contrast, the contribution of energy efficiency decreases in the 400 ppm scenario variant to almost 70% of the gross reduction of direct CO2-emissions (or two thirds of the emissions of the reference level in 2050), whereas substitution effects of all kinds, mainly towards renewable energies, but also towards electricity, increase to 31% (29% of the reference level in 2050).
Table 7-15: Impact of different policies and scenario drivers on direct CO2 emissions in MtCO2/year in the service sector; two variants of the 2°C Scenario, 2020-2050
450 ppm scenario 400 ppm scenario 2010 2020 2035 2050 2010 2020 2035 2050 Reference 259 272 270 235 Reference 259 272 270 235 +climate 0 0 2 4 +climate 0 0 2 4 +macroeconomic 0 1 11 22 +macroeconomic 0 1 11 22 +efficiency -2 -36 -96 -130 +efficiency -2 -39 -112 -154 +substitution -5 -13 -28 -29 +substitution -5 -36 -67 -69 450 ppm 253 224 160 102 400 ppm 253 198 104 37
Source: CEPE's results
As in the residential sector, these results reflect the fact that the marginal costs of mitigation by efficiency improvements are quite low for a considerable part of the potential (i.e. the

ADAM 2-degree scenario for Europe – policies and impacts
- 159 -
marginal cost curve is flat), but then increase quite strongly (steep curve). For this reason, the absolute contribution of energy efficiency is not much larger in the 400 ppm variant than in the 450 variant. Conversely, the costs of renewables are higher to start with, but still have a large potential for cost reduction through learning and economy-of-scale effects.
With regard to the contributions of energy efficiency and substitution effects presented above, it is recommended to base policy measures on both energy efficiency and renewable energy, with an emphasis on energy efficiency.
To a certain extent similar principles apply as in the residential sector, although some peculiarities have to be considered. As in the residential sector, the implementation of energy efficiency poses several challenges, particularly regarding the building envelope and building technologies with long life-cycles. In the service sector, an even larger share of energy, particularly electricity, is related directly to the building (and less to products and appliances as in the household sector). This applies to lighting, heating, ventilation and cooling, which represent large energy shares in this sector, but also to information and communication technologies which have more of a building infrastructure character.
Hence standards, codes and labels which have traditionally focused on residential buildings, i.e. on the building envelope and on thermal energies, need to be extended and adjusted to service sector buildings , particularly to include electricity consuming building technologies.
Also the principal-agent or split-incentive issue is particularly relevant in the service sector, both in the case of constructing new buildings and in the case of operating and refurbishing existing buildings. Incentives are split along the supply chain between companies. The incentives for builders to reduce prices result in the use of low-cost, inefficient components, even though consumer interests would be better served by more efficient buildings and technologies. This issue is even more relevant since the supply chain is quite long. For instance, more than five different companies are needed to design and implement a cooling system and its energy efficiency performance is influenced by even more than this. There may also be different incentives within different departments of the same company (e.g. between the investment and the operations department). Moreover, diverse priority setting and the lack of information about the opportunities and benefits of improved efficiency slows the penetration of these technologies (see Sorrell et al. 2004 for more insights regarding the economics of energy efficiency, especially regarding barriers to cost-effective investments).
A broad portfolio of policy measures such as energy audits that provide technical and financial information to investors and building owners, information campaigns to foster public awareness, local information centres that provide advice to small-to-medium enterprises (SMEs) would help to address this problem. Moreover, specialised, professional training for architects, planners and craftsmen is an important element to address the issue of

Service Sector
- 160 -
interactions between different energy services (e.g. between lighting and cooling) and to achieve low energy buildings and passive houses.
Regarding the service sector, the following specific policy measures have been assumed in the projections and are subject to our policy recommendations (see also Jakob 2008):
• Establish regularly updated minimum energy performance standards (MEPS) to ensure the phase-out of inefficient equipment and products (e.g. cooling and ventilation systems, cooling appliances, lighting products and systems).
• Encourage integral planning (see Jakob et al. 2006b) and commissioning of new buildings to establish energy-efficient operation.
• Stimulate continuous monitoring and optimisation of building technology operation to avoid energy consumption without use (Brunner et al. 2008).
• Promote the use of renewable energies including ambient air and ground sources in the context of (free) cooling and managing heating and cooling needs (Wellig et al. 2007).
• Design labels (comparison labels and endorsement labels) to inform consumers of the costs and benefits of the most and least efficient appliances on the market.
• Encourage well-monitored voluntary or negotiated agreements with appliance manufacturers to enhance the overall efficiency of products.
• Support research and development, and encourage manufacturers to integrate energy efficiency considerations into early stages of product design.
To conclude: A very active energy efficiency and renewable energy policy is needed by all the European countries regarding buildings in the service sector, as the re-investment cycle of buildings and building technologies is quite long (20 to more than 60 years). It must be stressed that the intensity of policy measures has to be augmented considerably compared to past and present activities in order to be able to achieve the improvements and emission reductions described in this section.

ADAM 2-degree scenario for Europe – policies and impacts
- 161 -
8 Basic products and other manufacturing industry sectors
8.1 Target of analysis
Industry accounted for about 28% of the energy consumption in the European Union in 2005, equivalent to 13.7 EJ. At the same time, GHG emissions amounted to about 1098 Mt CO2
equivalent, which is a share of 20 percent. While the sectoral shares remained fairly constant over the period from 1990 to 2005, total emissions fell by 15.4%.
Source: EU statistical pocket book 2007/2008
Figure 8-1: GHG emissions by sector (2005, EU27)
Figure 8-2 shows that the iron and steel production as well as the chemical industry are by far the largest CO2 emitting sectors. Although direct, energy-related, CO2 emissions are dominant in industry, the indirect emissions related to electricity consumption are also significant. To calculate the indirect emissions, country-specific emission factors were taken into account. Process-related GHG emissions (not from energy conversion), e.g. from clinker burning, nitric acid or adipic acid, are not considered in this figure.

Basic products and industry sector
- 162 -
Source: own calculations based on Eurostat
Figure 8-2: CO2 emissions in industry by subsector (2004, EU27)
0 1000 2000 3000
Non‐ferrous metals
Engineering and other metal
Food, drink and tobacco
Paper and printing
Non‐metallic mineral products
Other non‐classified
Chemical industry
Iron and steel
Energy consumption [PJ]
Fuel Electricity
Source: Eurostat
Figure 8-3: Energy consumption in industry by subsector (2004, EU27)
Given the large share of industrial GHG emissions, the importance of this sector for mitigating climate change becomes obvious.
Although industrial GHG emissions are about 15% below the 1990 level in 2006, there has been no clear trend towards an autonomous emission reduction over the last years and emissions have remained more or less constant. Industrial restructuring in Eastern Germany and Eastern Europe during the nineties had a significant impact on reducing GHG emissions.

ADAM 2-degree scenario for Europe – policies and impacts
- 163 -
This chapter analyses the technical as well as policy options to reduce emissions and bring them in line with a long-term sustainable development. The applied approach is a bottom-up model of energy demand and CO2 emissions based on the most energy-intensive industrial processes as well as the most relevant cross-cutting technologies (such as ventilators, pumps, compressed air etc.) and their related saving options. The main drivers of energy demand in industry are the value added as well as the physical production of energy-intensive products like steel, cement and paper.
Source: EU statistical pocket book 2007/2008
Figure 8-4: Development of direct GHG emissions in the EU27 industrial sector
In our analysis of the industrial sector we distinguish between energy-efficient technologies and abatement options that are available industry-wide and can be applied to different processes on the one hand and, technologies that are very process-specific on the other. The former are referred to as cross-cutting technologies (CCT) in the following. We also make a distinction between CCT that consume electricity – mainly motor systems – and CCT that produce heat (steam and hot water boilers, combined heat and power generation).
8.2 Technologies and assumptions
8.2.1 Cross-cutting technologies electricity
In contrast to the household or even the commercial sector, electricity is used for a much wider variety of purposes and appliances in industry. Most systems are individually designed according to the characteristics of production processes which often differ between companies.

Basic products and industry sector
- 164 -
Figure 8-5 gives an overview of the possible uses of electricity in industry. The figure shows some example applications.
Figure 8-5: Chosen cross-cutting technologies (CCTs) in industry – system boundaries
By selecting the most relevant technologies, it is possible to cover a larger part of the electricity demand in the model. Depending on the country-specific structure of industry, the share of CCT changes slightly, but is on average about 70 % of total industrial electricity consumption, if electric motors and lighting are considered to be CCT. The shares of each CCT considered, the relevant saving options and their potentials are important inputs to the scenario calculations. As there is no single data source available which covers all the most important cross-cutting technologies, we combined several sources and filled any data gaps with our own estimations.
As electric motors make up the biggest share in electricity demand, five of the six CCTs considered are electric motor systems, while the sixth is lighting. Thus electric motors play a central role in our assessment of efficiency potentials and they do have a large potential, which is available relatively short-term and at very low or mostly negative costs. The selected technologies are described below.
Pumps represent the CCT with the highest share of industrial electricity demand, estimated to be about 12 % in Europe. The paper industry, in particular, has a very high share of pumps in its electricity consumption, mainly used for pulp and water pumping (Sulzer Management, (Winterthur) 1997). Saving potentials for pumps were taken from the Ecodesign study lot 11

ADAM 2-degree scenario for Europe – policies and impacts
- 165 -
(Falkner 2007) and a previous study that also assessed pump systems on a European level (ETSU et al. 2001).
Fans are mainly used in industry for cooling, drying, suction cleaning or the ventilation of rooms (Hoffmann, Pfitzner 1994). A huge variety of different fan types are utilised in industry, which all have varying efficiencies. According to Radgen (2002), they account for about 9 to 17 % of the electricity demand of industrial branches. Again, the Ecodesign study from lot 11 provides detailed stock and saving potentials data (Radgen et al. 2007).
Compressed air is used in industry for a variety of different applications, like pneumatic drives for tools, fogging and varnishing as well as for suction and cleaning. The advantage of compressed air in comparison to the direct use of electricity is mainly its flexibility (Fraunhofer ISI 2003). Thus, for many applications, compressed air is often preferred, despite its higher electricity demand. A detailed analysis of the stock of compressed air systems in Europe including possible saving options and their potentials was conducted by Radgen et al. (Radgen, Blaustein 2001) and provides the basis for our calculations.
Cooling systems are not as widespread through industrial branches as other CCTs are. They are mainly used in the food sector, for cold storages and refrigerators, and in the chemical sector for low temperature processes.
Other motor appliances represent all motor systems not covered by the systems described above. This group is very heterogeneous and includes, for example, conveyors, centrifuges, elevators and mixers. Despite its heterogeneity, the saving potentials related to the core motor system (meaning the motor and its drive) can still be estimated. Our estimation is mainly based on the study by Almeida et al. (Almeida et al. 2001) for the stock of electric motors in the EU and by Almeida et al. (Almeida et al. 2000) for saving potentials in variable speed drives, i.e. motor drives. Up to the year 2020, the savings estimated in the Ecodesign lot 10 report (Almeida et al. 2007) were used.
Lighting systems in industry either use fluorescent lamps or high intensity discharge lamps (HID), representing between 37 and 63 %, respectively, of the total electricity demand for lighting in Europe (IEA 2006). Thus industrial lighting is clearly far more efficient than residential lighting.
To show the saving potentials and their costs not only in relative terms but also in absolute values for the industrial sector of a whole country, we needed to identify the absolute energy demand of each of the considered motor systems. Therefore we estimated the share of every motor system in the total electricity demand of each industrial subsector (see Figure 8-6), based on the literature cited above.

Basic products and industry sector
- 166 -
0%
10%
20%
30%
40%
50%
60%
70%
80%
90%
100%
Ore ex
tracti
on in
dustr
y
Other n
on-m
etallic
mine
rals
Food a
nd to
bacc
o
Other c
hemica
ls
Other s
ector
s
Paper
and p
rintin
g
Engine
ering
Vehicl
e con
struc
tion
Basic
chem
icals
Glass a
nd ce
ramics
Iron a
nd st
eel
Rubbe
r and
plas
tics
Metal p
roces
sing
Non-fe
rrous
meta
ls
Shar
e of
ele
ctri
city
dem
and Process technology
Lighting
Other motors
Pumps
Ventilation
Cold supply
Compressed air
Figure 8-6: Share of cross-cutting technologies by sector
To assess the saving potentials, we related specific saving options to any one of the cross-cutting technologies; for example, the repair of air leakages in compressed air systems. As we included about 50 saving options in total, it is not possible to describe each of them in detail; instead, the following summary indicates which type of options were considered.
As shown, most of the cross-cutting technologies considered are motor systems. Due to the similarity of motor systems, there are several saving options that can be applied to more than one system. Examples include using higher efficiency motors (Almeida et al. 2007), or directly coupling the motor and the application it is driving, which avoids the friction losses of a belt-driven system. The assumptions made about the further diffusion of highly efficient electric motors are summarised in Figure 8-7, which shows how the market share of each motor class develops over time.

ADAM 2-degree scenario for Europe – policies and impacts
- 167 -
0%
10%
20%
30%
40%
50%
60%
70%
80%
90%
100%
1998
2003
2008
2013
2018
2023
2028
2033
2038
2043
2048
low efficiency (EFF3)
IE1 (EFF2)
IE2 (EFF1)
IE3 (Premium motors)
IE4 (super premium)
IE5 (IE4 ‐ 40% losses)
Figure 8-7: Market share development of motor efficiency classes in the 2°C scenario
The selection of high efficiency pumps, fans and compressors also leads to considerable savings (Radgen et al. 2007). The optimisation of the ductwork is another often very effective saving option; this is especially the case in compressed air systems, where only small leakages in the pipes may be responsible for huge energy losses (Radgen, Blaustein 2001 p. 49). In all systems, there is the possibility to lower so called ‘standby losses’ by improving control systems that are related to the real demand of an energy service. Control systems are especially interesting in combination with a variable speed drive, which is an inverter that controls the input frequency to the motor and thus also the motor’s rotation speed depending on the load (Almeida et al. 2000). Variable speed drives are especially efficient in pump systems that are often controlled using a valve, which decreases the flow of a fluid by increasing friction in the pipe, but leaves the rotation speed of the motor constant.
For pumps, there is the possibility to smoothe the surface by coating it with glass or resin to reduce friction losses and also increase durability (Gudbjerg, Andersen 2007).
Lighting systems are somewhat different to the presented motor systems. A lighting system for discharge or fluorescent lamps consists of a lamp, a ballast, cables, control mechanisms and light fixture. All these components influence the efficiency of the entire system.
Using electronic instead of magnetic ballasts can decrease the electricity consumption by about 25 % at constant luminous efficacy (Meyer et al. 2000 p.111).
Besides technical improvement options, a high saving potential can be realised using improved and demand-related control systems. These may be quite simple like more and better located light switches and time switches, or more complicated systems including

Basic products and industry sector
- 168 -
motion detectors and photometers that allow the illumination level to be adjusted to the actual demand (Carbon Trust 2006, p.5).
For some CCTs, comprehensive analyses of saving potentials exist, like the study conducted by Radgen et al. (2002; 2001) on compressed air and ventilation systems. In these cases, the literature values were taken and extended slightly as well as updated.
The resulting saving potentials are shown in Figure 8-8. Each bar represents one CCT system and shows the aggregated savings of this system possible from applying the best available technology. Although the technical savings are shown, most of these are actually cost-effective as well and all will be exploited in the 450 ppm scenario. In contrast, in the Reference Scenario, only 30% of these potentials are exploited on average, varying by technology and saving option.
0%
10%20%
30%
40%
50%
60%
70%
80%
90%
100%
Compre
ssed
air
Pumps
Fans
Cold su
pply
Lighti
ng
Other m
otors
Savi
ng p
oten
tial r
elat
ed to
sys
tem
ele
ctric
ity
cons
umpt
ion
[%]
Remaining consumption:
Technical saving potential
Figure 8-8: Relative long-term technical saving potential by application
As the lifetime of many of the motor technologies ranges between 10 and 25 years, this is also the time horizon assumed for the diffusion of efficient technologies through the stock. The reason for this slow diffusion is the general assumption that technologies are not replaced before their end of life, i.e. the conventional life-cycle is not disturbed. This significantly decreases costs, because only the additional costs for the efficient technology compared to the standard technology are taken into account, but it also slows down the market diffusion.
How cost-effective the cross-cutting technologies are is shown by the exemplary cost curve for Germany in Figure 8-9. The average costs of nearly all the efficiency measures are negative, which means the options are cost-effective. However, because of the heterogeneity

ADAM 2-degree scenario for Europe – policies and impacts
- 169 -
between companies and countries, some of the options might not be cost-effective in all applications even though they are cost-effective on average.
Source: Fleiter (2008)
Figure 8-9: Exemplary cost curve for aggregated saving options in electrical cross-cutting
technologies (Germany, 2030)
8.2.2 Cross-cutting technologies heat and steam
Heat is used in industry for a wide variety of different purposes. While, in some cases, heat with a temperature of less than 100°C is sufficient, other branch-specific processes require temperatures far above 1000°C. While low temperature levels can be supplied by ordinary boilers, for the high temperature processes, industrial furnaces specially designed for certain processes are necessary. Figure 8-10 illustrates in detail which temperature levels are needed in which industries. Although the calculation methodology is based on a rather old study by Hofer (1994), the method used is still valid as the main processes in industry have not changed considerably since then.

Basic products and industry sector
- 170 -
0%10%20%30%40%50%60%70%80%90%
100%
Glass a
nd ce
ramics
Iron a
nd st
eel fo
undri
es
Non-fe
rrous
meta
ls
Iron a
nd S
teel
Non-m
etallic
mine
rals
petro
leum pr
oces
sing
Chemica
l indu
stry
Pulp an
d pap
er
Other
Inves
tmen
t goo
ds
Food a
nd to
bbac
o
Textile
s
avera
ge
Shar
e of
tota
l hea
t dem
and
<1700°C<1000°C<500°C<100°C
Source: Source: own calculations based on Hofer (1994)
Figure 8-10: Heat demand by industrial sector and temperature level
A variety of different technologies are applied to generate CHP in Europe, which are presented briefly based on the overview given by (IZT Institute for Futures Studies and Technology Assessment gGmbH et al. 2002 p.44). Steam turbines are the classical and most used CHP technology, either as backpressure or condensing turbines, which are flexible with regard to the fuel input. The disadvantage of steam turbines is the relatively low electrical efficiency of below 20 percent. In industrial CHP, gas turbines are more common because of their high reliability and large range of power. They have a higher electrical efficiency but are restricted to gaseous and liquid fuels, traditionally natural gas. The highest electrical efficiency can be reached with combined cycle gas turbines (CCGT), which are a combination of a gas turbine followed by a steam turbine. Their main advantage, their high efficiency of more than 40 percent, led to a tripling of electricity production in CCGT in the EU-15 between 1994 and 1998 (Eurostat 2001 p. 14), while in the same period, the electricity production from steam turbines remained constant. A remarkable increase in electricity generation was also able to be observed for internal combustion engines. These are mainly applied in smaller units and for more decentralised and flexible purposes.

ADAM 2-degree scenario for Europe – policies and impacts
- 171 -
0% 5% 10% 15% 20% 25% 30% 35%
SKAUDKNLFI
CZUKSPPDESPOIR
GEFRNOSVLXIT
GRSNHUBELALI
CYMA
[%]
Source: (Danko 2005)
Figure 8-11: Share of industrial CHP electricity output in total industrial electricity
demand in European countries (2004)
Source: (Danko 2005)
Figure 8-12 shows the share of heat generation of each of these technologies in total CHP generation. Unfortunately, only aggregated data was available for public and industrial (autoproducers) CHP heat generation. In industry, the share of steam turbines might be lower and the use of gas turbines might be more extensive than shown in this figure.
All these technologies permit heat production with a maximum temperature of around 500°C. Thus, their application is bounded by the temperature pattern of heat demand. As shown in Figure 8-10, heat below 500°C is concentrated on certain sectors, which, consequently, have the highest potential for further CHP utilization.

Basic products and industry sector
- 172 -
0,0000
0,1000
0,2000
0,3000
0,4000
0,5000
0,6000
Combinedcycle
Steam :backpressure
turbine
Steam :condensing
turbine
Gas turbinewith heatrecovery
Internalcombustion
engine
Others
Shar
e of
tota
l CH
P he
at g
ener
atio
n
Source: (Danko 2005)
Figure 8-12: Heat generation by CHP technology
Two general groups of saving options are implemented in heat generation: improved diffusion of combined heat and power, replacing separate generation of heat and electricity, and improved efficiencies in separate as well as combined heat generation. Both are explained in the following.
In this paragraphe, the first option, the increased diffusion of CHP plants, which substitute separate heat and electricity generation systems is described. As an upper threshold for CHP diffusion, it is assumed that CHP can only be applied to the share of heat demand with a temperature below 500°C. CHP technologies producing heat above 500° are not available so far but might become so in the future. One option could be the solid oxide fuel cell (SOFC) that produces heat up to 900°C, which would clearly increase the potential for CHP applications in the industrial sector. It is assumed that the share of heat generation from CHP in relation to total heat consumption in industry increases from 15% in 2004 to 32% in 2030 in the 2° scenario, whereas it increases to 20% in the Reference scenario. After 2030, only slight increases in the CHP share are assumed.
Calculating the energy savings due to faster CHP diffusion is a methodologically crucial aspect. In this modelling approach, we applied a methodology in accordance with Eurostat (Eurostat 2001) which calculates the savings by comparing the CHP system with an alternative system that might have been used if the CHP unit had not been built. The saving

ADAM 2-degree scenario for Europe – policies and impacts
- 173 -
potential is defined as the difference between the primary energy demand of each system. Consequently, the choice and definition of the alternative system - the system that was replaced by the CHP plant – has considerable influence on the results. If, for example, the alternative system is a modern Combined Cycle Gas Turbine (CCGT) for electricity generation with an efficiency of about 60 % and a modern boiler for heat generation with an efficiency above 90 %, the savings allocated to the substitution by CHP are rather small if not negative. In contrast, if the efficiencies of an average power plant are assumed to be the alternative to CHP, the savings allocated to CHP are considerably higher, and may even be overestimated. In our calculations, we assumed an alternative system that produces electricity with an efficiency of 45 % and heat with an efficiency of 85 %.
The second group of energy savings is related to an improved energy efficiency of all heat supply technologies. All the technologies mentioned above have a potential for energy efficiency improvements. It is important to consider the fact that the model works using the average efficiencies of plants already in operation, which also includes rather outdated technologies with low efficiencies.
This approach is based on the most recent Eurostat statistics on CHP (Danko 2005). The remaining saving potential is calculated as the difference between the average efficiency of a certain heat production technology in a certain country and the highest efficiency of the same technology in all countries. As the differences in average efficiencies between countries are high, the saving potentials also vary greatly. If there was no data available for one country, the average efficiencies of either the EU-25 or the EU-15 were taken.
The emission reductions in industry achieved in the 450 ppm scenario and the 400 ppm scenario are mainly managed by significantly increasing the deployment of solar thermal heat supply. So far, solar thermal energy has hardly been used in industry, and if it is applied, then usually to provide space heating. Its integration into industrial processes is still at the R&D stage (Werner W et al., 2008). Solar thermal is especially applicable in the low temperature
range (below 250°C), which is mostly found in the food industry, the pulp and paper industry, textile industry, chemical industry and, to a lower extent, also in some other branches (compare Figure 8-10). To account for company- and process-specific barriers to solar thermal energy, we assumed certain thresholds for the low temperature heat demand able to be supplied by solar energy. These are lowest in the paper industry (max. 20 %) and highest in the food industry (max. 80%). Evacuated tube collectors were assumed to be the main technology, but they can be seen as being representative for other solar technologies as well. Especially in the Nordic countries, evacuated tube collectors have significant advantages compared to standard flat plate collectors and they also allow heat to be provided at a higher temperature level (up to 170°C) (Werner W et al., 2008). We assumed the best moment to install a solar heating system is when the conventional heating system reaches its end of life

Basic products and industry sector
- 174 -
and has to be replaced. The solar system is sized so that it provides all the solar heat needed by the process during summer periods, when irradiation is highest. Consequently, in winter, considerable gaps exist between solar heat supply and heat demand (depending on the country-specific irradiation). Thus, the conventional heating system, i.e. gas or oil boiler, is still needed, also as a backup for short-term variations in solar irradiation. As a result, the solar fraction varies between 75% in southern countries and 60% in northern ones, resulting in different solar heat potentials. This further reduces the above mentioned company- and process-specific technical restrictions.
Taking these assumptions into account, the resulting diffusion of solar thermal heat in industrial sectors is shown in Figure 8-13. The share of solar energy throughout industry rises to about 9% in 2036 and remains at this level until 2050.
Figure 8-13: Share of solar heat in total fuel demand by industrial sector in the 400 ppm
scenario for the EU27
Investment costs also vary strongly among countries, mainly due to the differing solar collector area needed to provide the same amount of heat. The solar irradiation varies between 1060 kWh/m²a in Ireland and 2008 kWh/m²a in Malta. Consequently, in countries with lower irradiation, a considerably larger collector area is needed, which increases the total costs of solar heat supply. For the calculations, the following technological characteristics of evacuated tube collectors were used: 45% efficiency, investment costs of 400 euros per m² which are assumed to be reduced to 260 euros per m² in 2050 and an average lifetime of 25 years (German Solar Energy Society, 2005).

ADAM 2-degree scenario for Europe – policies and impacts
- 175 -
8.2.3 Process-specific technologies
In contrast to the above mentioned cross-cutting technologies, process-specific technologies are related to explicit industrial branches or processes. They represent options to improve the efficiency of certain processes (e.g. papermaking, steel casting or rolling, clinker burning for cement production, etc.). Due to the large variety of different processes applied in industry, it is not possible to discuss all the assumptions and technologies considered in detail. Instead, we will give an overview of the processes considered and describe some of the most interesting options with the potential to induce large savings.
Industrial sectors can be further divided into the most energy-intensive processes for which data is needed about production statistics and forecasts as well as specific energy consumption. By considering physical production values and the specific energy intensity for each process, its bottom-up energy demand can be calculated. But as the amount of data needed for the calculation increases considerably when extending the bottom-up calculations to further processes, only the processes with the highest energy consumption are included (compare Figure 8-14).
Iron and steel Non-ferrous metals Paper and printing Sinter Primary aluminium (Hall-Heroult) Paper Blast furnace Secondary aluminium Mechanical pulp EAF Aluminium further treatment Chemical pulp Rolled steel Primary copper Recovered fibres Coke oven Secondary copper Smelting reduction Copper further treatment Direct reduction Primary zinc: imperial smelting Zinc: galvanizing
Glass Cement Chemicals Container glass Clinker burning-dry Chlorine-Hg (mercury) Flat glass Clinker burning-semidry Chlorine-Membrane Other glass Clinker burning-wet Chlorine-Diaphragm Quarrying Polypropylene (PP) Raw material preparation Polyethylene (PE) Cement grinding Polyvinyl chloride (PVC) Lime milling Ammonia Gypsum milling Carbon black Cracker
Figure 8-14: Processes by sub-sector implemented in the model
As is the case for the cross-cutting technologies, saving options also exist for the process-specific technologies that have the potential to improve energy efficiency and thus lower the specific energy demand. In total, about 80 distinct saving options are considered and allocated to the relevant processes. Some examples are described below:

Basic products and industry sector
- 176 -
• For the production of chlorine in the chemical industry, three main technologies can be used: the diaphragm process, the mercury process and the membrane process. Of these, the membrane process is least energy-intensive and a clear trend is currently observable and is considered in the calculations that this process will continuously substitute the mercury process, which will be banned in Europe by 2020.
• The energy intensity of cement production is directly related to the clinker / cement ratio, i.e. the amount of clinker used to produce a fixed amount of cement. The more clinker substitutes, such as fly ashes or granulated blast furnace slag are used, the less energy-intensive is the production of cement. In our calculation, a considerable increase of clinker substitutes is considered, leading to an average clinker factor of about 71 % in 2030.
• For the production of steel, two main processes are used: the blast furnace and the electric arc furnace (some others play a minor role in Europe). Of these two, the electric arc furnace requires enormous amounts of electricity so that a shift towards this process would greatly increase electricity demand while at the same time decreasing the demand for fuels. In terms of primary energy, however, this shift still induces significant savings.
• In aluminium production one can distinguish between primary and secondary aluminium. The production of primary aluminium is very energy-intensive, because electrolysis is used. For the secondary aluminium production route, which is far less energy-intensive, recycled aluminium is used. Also here, a shift towards secondary (recycled) aluminium is an important option to lower energy demand for aluminium production. However, there are clear restrictions to the technology in terms of the available amount of scrap.
• In most steel mills, steel finishing is a multi-step process that includes intermediate products and reheating to allow for the next rolling step. Emerging technologies like thin slab or strip casting allow significant reductions in the production steps required, by already casting the steel in a form that is closer to the final form (thin products) and thus requires less rolling and preheating. Using this technology instead of the traditional continuous casting, about 50% of the energy demand could be saved. According to IEA (2007), it is applicable to one quarter of the worldwide steel production.
• Black liquor is a by-product of chemical pulp production and is normally burned in a recovery boiler to produce electricity and heat for the pulp mill. The use of the conventional recovery boiler has several drawbacks, like poor efficiency, poor environmental performance and difficult handling. Therefore, ongoing R&D activities are trying to commercialise a process in which the black liquor is gasified before being converted into electricity or liquid fuels. This so called black liquor gasification technology would result in significantly higher conversion efficiencies and also reduce the environmental impacts as well as the process risks. As a result, a chemical pulp

ADAM 2-degree scenario for Europe – policies and impacts
- 177 -
production plant could develop towards a biorefinery that also produces surplus electricity.
8.2.4 Carbon Capture and Storage
In the 2°C scenario, carbon capture and storage (CCS) is considered for the most CO2
intensive processes in industry, which comprise clinker burning in cement production and the blast furnace route in steelmaking. It is considered to the same extent in both the 400 ppm and the 450 ppm variants, but is not considered at all in the Reference Scenario. Although, CCS is already being discussed as an option for CO2 abatement in other sectors such as the pulp and paper industry (Hektor, Berntsson 2007), we do not apply it to other sectors, as steel and cement making are by far the most CO2 intensive processes, and thus, the diffusion of CCS will concentrate on these processes first.
State-of-the-art cement production accounts for about 1 t CO2 emissions per tonne of cement produced. These emissions can be equally divided into process emissions (related to the chemical process) and those related to the combustion of fuels. In primary steel production, the average European blast furnace plant emits about 1.5 t CO2 / t pig iron. Spain, Italy and Germany account for about 50% of the CO2 emissions related to cement production, while Germany is by far the largest emitter of steel-related CO2.
According to the Community independent transaction log (CITL), the emissions of both processes amounted to about 319 Gt CO2 in the year 2008 in the EU27 (187 Gt due to cement and lime and 132 Gt due to pig iron and steel production). Both processes are covered by the EU ETS and future reductions will be strongly driven by the prices of emission allowances.
The available data on total emissions varies depending on the source. While the Community independent transaction log presents 132 Mt CO2 equivalent from pig iron and steel production for 2008, the UNFCCC greenhouse gas inventory cites 89 Mt CO2 equivalent for 2006. Differences may arise from how blast furnaces or converter gas are accounted.
The assumptions about the technological possibilities are based on first results from the ULCOS14 project, which focuses on emerging technologies for low-emission steel production. We assume a capture coefficient of 50% for CCS, which starts to diffuse through the market in 2030. Up to 2050, the capture coefficient increases to 85% and 84% of steel and cement plants will be equipped with CCS. Thus, we assume that CCS is first implemented in the power sector and only after sufficient experience has been gained is it introduced in industrial
14 https://www.ulcos.org.

Basic products and industry sector
- 178 -
processes. The main policy driver for the development is the EU ETS and the price of the emission allowances.
Investment costs for CCS in industrial processes are still difficult to assess as so far, not even demonstration projects have been conducted. Thus the cost estimations are based on the expected costs for CCS in power plants. We calculated abatement costs of 60 Euro / t CO2 in 2030 which decrease to 30 Euro / t CO2 in 2050.
The main driver behind falling CO2 emissions, which already occur in the case without CCS, is the physical production of cement and steel. Here, improvements in material efficiency lead to a 10% lower demand for steel and 13% lower demand for cement in 2050 compared to the Reference development. Further details on the production development are presented in Chapter 5 on material efficiency.
0
20
40
60
80
100
120
2004
2008
2012
2016
2020
2024
2028
2032
2036
2040
2044
2048
Million tonn
es of CO
2 eq
uivalent
Cement (with CCS)
Steel (with CCS)
Cement (without CCS)
Steel (without CCS)
Figure 8-15: Development of CO2 emissions in cement and steel depending on the
introduction of CCS
8.3 Model rationale and limits
The ISIndustry model belongs to the class of energy system or bottom-up models, which means the calculation is based on technological information about distinct conservation options and industrial processes. Regarding the technological foundation of the model, we distinguish between process-specific technologies and cross-cutting technologies. Blast furnaces in steelmaking are one example of the former; these are sector- and even process-specific. In contrast, cross-cutting technologies are widespread across very different industrial

ADAM 2-degree scenario for Europe – policies and impacts
- 179 -
sectors. Examples include electric motors or lighting equipment, which are applied throughout all industrial sectors.
For process-specific technologies, the main driver is the projection of physical production (e.g. tonnes of crude steel from blast furnaces). The 40 most energy- and greenhouse gas-intensive processes were considered separately in the model. For each of these processes, the specific energy consumption/GHG emissions and the physical production output per country are modelling parameters.
Although individual cross-cutting technologies are usually smaller in size than the process specific technologies, there are huge numbers involved due to their widespread application and so they are responsible for a huge share of industrial electricity consumption. Electric motor systems and lighting account for more than 70% of industrial electricity consumption. They are implemented in the model as a share of the total sector’s electricity consumption and their main driver is the projected development of value added per industrial sector.
The model’s level of technological detail allows the long-term industrial energy demand to be simulated based on distinct technological energy efficiency options while considering the main economic trends. However, it becomes increasingly difficult to predict technological developments for the longer term. In particular, after 2030, new options will probably arise that are completely unknown at present and at the same time, most of the known options will have more or less fully diffused throughout the stock by then. Consequently, we assumed that technological change continues beyond 2035 at the same pace as before. Thus, in the period from 2035-50, estimations are mainly based on extrapolation of efficiency improvements rather than detailed modelling of technology developments. One exception here is the diffusion of CCS and the deployment of solar thermal heating systems, which were modelled separately up to 2050.

Basic products and industry sector
- 180 -
Figure 8-16: Simplified structure of the ISIndustry model
As already mentioned, one advantage of the modelling approach is the high level of technological detail considered in the calculations. In contrast to top-down approaches, the bottom-up approach used clearly shows which technologies can contribute to the long-term development. Nevertheless, there are still limitations to this approach which are described below:
• In general – and especially in the very heterogeneous industrial sector - bottom-up modelling is not able to consider all the options or technologies. It has to concentrate on the main options or can attempt to group less influential options, but there will always be certain (possibly less costly) abatement options that are not covered by such an approach.
• Although we calculated additional investment costs on a technology basis, these costs are often rather indicative and in reality may vary substantially. In particular the costs of industrial process innovations are difficult to estimate. Often it is not clear if these are exclusively energy efficiency innovations or have other co-benefits, like increased production capacity, which should also be accounted for.
• As bottom-up models are very data intensive, data quality is also a very crucial aspect for the quality of the results.
• As our approach considers distinct technologies and their characteristics such as investment costs, specific energy consumption of lifetime, by definition, only known technologies can be considered. But it is highly probable that promising new technologies will be developed in the next decades. Furthermore, the more innovative a technology is, the less reliable its data becomes. Costs for emerging technologies which are still

ADAM 2-degree scenario for Europe – policies and impacts
- 181 -
basically concepts or research projects cannot be estimated without considerable uncertainty.
8.4 Results of scenarios
The results show large CO2 reductions in both the 450 and the 400 ppm scenarios. While total EU CO2 emissions fall from 651 to 235 Mt in the 450 ppm scenario, they decrease even further down to 210 Mt in the 400 ppm scenario. These reductions are equivalent to relative changes of -33% and -40% for the year 2050, respectively, compared to the Reference development. The reductions are mainly achieved by improvements in production efficiency, carbon capture and storage for steel and cement production as well as resource and material efficiency, leading to a lower demand for energy-intensive products. The additional reductions in the 400 ppm scenario in comparison to the 450 ppm scenario are mainly due to large scale diffusion of solar thermal heating in industrial low-temperature processes.
The already substantial reductions in CO2 emissions in the Reference case are mainly driven by inter-industrial structural changes and significant energy efficiency improvements. While the shares of the large energy-consuming sectors like iron and steel, the chemical industry or the non-metallic minerals decrease in many countries, the less energy-intensive sectors increase.
Table 8-1: Comparison of industrial CO2 emissions between scenarios [Mt]
Country or country group
Reference Case 2°C Scenario (450ppm) 2°C Scenario (400ppm)
2005 2020 2050 2020 2050 Diff. 2020 2050 Diff.
EU27 651,53 558,43 349,94 509,57 235,71 -33% 485,94 209,99 -40%
North* 35,62 32,64 21,63 29,95 14,80 -32% 28,13 12,30 -43%
South* 326,97 260,81 156,21 237,64 100,03 -36% 226,49 88,42 -43%
East* 84,31 71,51 54,31 64,57 36,58 -33% 61,67 32,31 -41%
West* 211,44 198,72 121,35 182,37 87,10 -28% 174,42 79,28 -35%
*North: Denmark, Finland, Norway, Sweden; South: Spain, Italy, Portugal, Greece, Bulgaria, Malta, Cyprus, Romania; East: Baltic States, Czech Republic, Hungary, Poland, Slovakia, Slovenia; West: Austria, Luxembourg, Belgium, Netherlands, France, Germany, Ireland, Switzerland, United Kingdom
Source: ISIndustry calculations
In contrast to (direct) CO2 emissions and fuel demand, electricity demand grows slightly in the EU27.

Basic products and industry sector
- 182 -
Table 8-2: Comparison of electricity consumption between scenarios [PJ]
Country or country group
Reference Case 2°C Scenario (450ppm) 2°C Scenario (400ppm)
2005 2020 2050 2020 2050 Diff. 2020 2050 Diff.
EU27 4155 4292 4300 3544 2723 -37% 3544 2723 -37%
North 579 655 847 546 541 -36% 546 541 -36%
South 2241 2186 2187 1809 1386 -37% 1809 1386 -37%
East 364 448 440 368 281 -36% 368 281 -36%
West 1155 1226 1116 1011 689 -38% 1011 689 -38%
Source: ISIndustry calculations
Table 8-3: Comparison of fuel consumption between scenarios [PJ]
Country or country group
Reference Case 2°C Scenario (450ppm) 2°C Scenario (400ppm)
2005 2020 2050 2020 2050 Diff. 2020 2050 Diff.
EU27 9857 8412 5497 7631 3716 -32% 7641 3741 -32%
North 977 876 642 777 416 -35% 776 417 -35%
South 4778 3747 2322 3403 1521 -34% 3408 1533 -34%
East 1211 1034 806 932 545 -32% 932 549 -32%
West 2997 2832 1789 2592 1285 -28% 2599 1292 -28%
Source: ISIndustry calculations

ADAM 2-degree scenario for Europe – policies and impacts
- 183 -
Table 8-4: Comparison of final energy consumption split by industrial subsector between
scenarios [PJ] for EU27
Country or country group
Reference Case 2°C Scenario (450ppm) 2°C Scenario (400ppm)
2005 2020 2050 2020 2050 Diff. 2020 2050 Diff.
Chemicals 2431 2388 1812 2124 1337 -26% 2122 1334 -26%
Rubber and Plastic 267 229 182 195 125 -31% 195 125 -31%
Primary metals 3132 2729 2107 2446 1210 -43% 2470 1244 -41%
Non-metallic minerals 1899 1448 967 1328 734 -24% 1328 734 -24%
Paper and printing 1678 1761 1564 1435 890 -43% 1434 893 -43%
Food 1340 1229 868 1068 549 -37% 1062 545 -37%
Textile and leather 373 338 268 295 183 -32% 293 181 -32%
Equipment goods 1363 1392 1106 1234 799 -28% 1232 796 -28%
Other sectors 672 626 491 553 331 -33% 552 329 -33%
Industry 14012 12704 9797 11174 6439 -34% 11185 6464 -34%
Source: ISIndustry calculations
Table 8-5: Comparison of final energy consumption between scenarios [PJ]
Country or country group
Reference Case 2°C Scenario (450ppm) 2°C Scenario (400ppm)
2005 2020 2050 2020 2050 Diff. 2020 2050 Diff.
EU27 14012 12704 9797 11174 6439 -34% 11185 6464 -34%
North 1556 1531 1488 1323 956 -36% 1322 958 -36%
South 7019 5933 4509 5211 2907 -36% 5217 2919 -35%
East 1575 1482 1247 1300 826 -34% 1300 831 -33%
West 4152 4058 2904 3603 1974 -32% 3610 1981 -32%
Source: ISIndustry calculations

Basic products and industry sector
- 184 -
Table 8-6: Additional annual investments compared to the Reference scenario [million
euros 2000]
Country or country group
2°C Scenario (450ppm) 2°C Scenario (400ppm)
2020 2030 2040 2050 2020 2030 2040 2050
EU27 4734 6114 10970 14766 10575 9214 16787 17410
North 1012 1508 2273 3168 1656 1917 2849 3544
South 2338 2975 5349 7407 5499 4455 8420 8847
East 475 618 1253 1686 1294 1212 1999 2107
West 1318 1698 3266 4401 2615 2378 4743 4865
Source: ISIndustry calculations
Comparing the CO2 reduction efforts among countries in Figure 8-17 reveals a variation by country close to the EU average of 33%. For the 400 ppm scenario, additional CO2 reductions of about 7 percent vary strongly by country, depending on the use of low-temperature heat in industry because the additional reductions achieved in the 400 ppm scenario are mainly due to further solar thermal diffusion.
8.5 Conclusion on policies to achieve changes in industry sector
In order to achieve the CO2 reductions calculated in the 2°C scenario, a variety of policy options is required to address the saving options available in industry. In other words, the policies need to take into account the very heterogeneous structure of industry, its technologies and subsectors. The following set of policy groups was identified to place industrial CO2 emissions on the paths towards the calculated emission reductions.
• The EU ETS and the further tightening of its cap plays a crucial role in reducing direct emissions from energy-intensive industries, such as the iron and steel sector, cement production or the pulp and paper industry. This may require international agreements on climate change to reduce the danger of carbon leakage, or specific sectoral agreements, for example for the iron/steel and cement sectors.

ADAM 2-degree scenario for Europe – policies and impacts
- 185 -
0% 10% 20% 30% 40% 50% 60%
AustriaBaltic States
Belgium/Luxembo…Bulgaria
Czech RepublicDenmarkFinlandFrance
GermanyGreeceHungaryIreland
ItalyMalta/CyprusNetherlands
NorwayPoland
PortugalRomania
Slovak RepublicSlovenia
SpainSweden
United KingdomEU27NorthSouthEastWest 400ppm to Ref
450ppm to Ref
Figure 8-17: Resulting CO2 emission reductions in 400 and 450 ppm scenarios compared to
the Reference scenario for the year 2050
• An important group of abatement options can best be summarised as being related to the improvement of individual products or appliances with clear system boundaries, like electric motors, fans, boilers, lamps or pumps in industry. To improve the energy efficiency of these appliances, two regulatory instruments are needed. The first is the concept of minimum energy performance standards (MEPS), which sets minimum efficiency levels for products to be sold within a region or country. The second is to label even more efficient classes to enable consumers to select a product based on its energy efficiency. For both instruments, it is essential to apply policies on a European level, if

Basic products and industry sector
- 186 -
not a global level. This concept is already being pursued in the EU Directives on the ecodesign of energy-using products and on the labelling of household appliances.
• Another set of saving options can be grouped under the umbrella of cross-cutting technologies (like electric motor systems, heat generation or lighting systems) and tackles system aspects more directly. Saving options in relation to these technologies are characterised first by a low degree of intervention in the production process, as they are mostly regarded as ancillary units. Second, the saving options are similar in different branches and companies so that large spillover effects could occur. Third, they have relatively large saving potentials (within a company but also economy-wide) available at low or often negative costs. These characteristics allow policies to tackle efficiency improvements across different branches (cross-cutting character) and without high subsidies or financial aid because most of the options are cost-effective. Furthermore, the barriers are relatively easy to overcome as it is not necessary to intervene in the production process. Policies that are applicable to exploit this potential include:
o Policy options addressing the barriers to efficient cross-cutting technologies related to the fact that many electric motors are not purchased directly by the end user but rather by equipment producers or wholesalers. Such policies could, for example, include agreements with these groups to purchase more efficient motor systems, information campaigns etc.
o Support for energy efficiency contracting. This is especially effective if the saving potentials are cost-effective and no intervention in the core production process is necessary, but the company is reluctant to invest in energy efficiency, e.g. due to budget, knowledge or capacity restrictions.
o Further support for the implementation of comprehensive energy management systems in large companies in particular. Case studies show that comprehensive energy management systems that are implemented and monitored over a longer time horizon can reduce energy demand considerably, even if this mostly involves investing in saving options with a short payback period.
o Energy efficiency networks, where companies work together to improve energy efficiency. These networks tend to consist of around 10 medium-sized companies that meet on a regular basis, discuss possibilities and activities to improve energy efficiency and set efficiency targets and in doing so, exchange experiences and learn from each other. The fact that the companies come from different non-competing branches allows them to work together without worrying about competitive disadvantages. Consequently, most of the realised investments in energy efficiency tackle improvements in so-called cross-cutting technologies like lighting, motor driven systems, compressed air, heat and steam generation. The

ADAM 2-degree scenario for Europe – policies and impacts
- 187 -
incentive for improvements in branch-specific technologies is less strong, as companies cannot learn from each other here. The success of energy efficiency networks is actually based on the assumption of available cost-effective saving potentials not being realised due to transaction costs. Experiences with a first efficiency network show that the participating companies had an annual efficiency increase which was 2 to 3 times higher than non-participating companies. In Germany, 30 additional energy efficiency networks will be launched this year, but there is still the potential for several hundreds more.
o (Financial) Support of energy efficiency audits but also of investments in energy-efficient technologies (although the latter may be limited due to state aid considerations). The audits are conducted mostly to identify cost-effective saving potentials in cross-cutting technologies. This measure should be related to a broader energy efficiency fund that also offers financial aid for the required investments in more efficient technologies (examples are the Energy Saving Trust in the UK or the German energy efficiency fund for small and medium-sized companies). The external energy efficiency audits are especially useful in smaller SMEs, which do not have the funds available to implement a comprehensive energy management system or even participate in the above mentioned energy efficiency networks. But even in larger companies, case studies have identified larger reduction potentials for cross-cutting technologies.
o The diffusion of information and best practices to overcome the information deficit, which is generally observed.
• In particular, the abatement options in the long term depend on the R&D activities and expenditures happening now. Although ideas and concepts to improve energy efficiency exist for the majority of industrial processes by radically changing the process involved, companies only rarely invest in R&D for such process innovations. There is also a gap when it comes to demonstration plants which require large financial inputs while still presenting high risks. There are two main explanations for these observations. The first is the long-term nature of the research process, which often lasts much longer than 10 years and is associated witha high degree of uncertainty about the payback of investments. The second is the radical character of these innovations which would make redundant the knowledge and capacity accumulated over years for the conventional process. Therefore, to foster the R&D activities on improved energy efficiency of industrial processes, public R&D spending is essential but also needs to be consistent with state aid rules. This is not only the case for process innovations, but also for emerging technologies, where R&D is also very costly, like in the field of new surface technologies and wherever large demonstration plants are needed.

Basic products and industry sector
- 188 -
• R&D could focus especially on carbon capture and storage for industrial processes. While there are alternatives to electricity generation from coal in the form of renewables, a variety of industrial processes are experiencing difficulties in further reducing their CO2 emissions because they are operating increasingly close to theoretical limits, or because they have high emissions from process reactions which cannot be reduced unless the products are actually phased out. In the case of limited storage facilities, industrial CCS should have priority over CCS from electricity generation.
• The diffusion of efficient process innovations can be further supported by the implementation of ambitious benchmarking schemes for the most energy-intensive products (e.g. within the frame of the EU emissions trading scheme). Such benchmarking schemes would also allow the efficiency of production plants to be compared and thus increase the pressure to further improve efficiency.
• Additional financial support is crucial for the solar thermal energy, as so far these systems are associated with long payback times and high costs, especially in northern countries. Our calculations assume a stronger and quicker diffusion of solar thermal energy in the 400 ppm scenario in comparison to the 450 ppm scenario where it remains on a very low level. To achieve this fast take-off, we assumed a mixture of regulation obliging company owners to install some kind of solar system when replacing heating systems and financial subsidies depending on the specific investment costs of the system.
• Energy taxes accompanying the strong cuts in energy intensity are needed to ensure that energy efficiency improvements remain cost-effective for decision-makers in less energy-intensive companies which are not subject to the EU ETS.
• An important accompanying action to achieve the strong emission reductions, especially in the energy-intensive basic material industries, is a comprehensive material efficiency strategy that aims at reducing the consumption of these materials as well as realising the potentials for recycling. More details on the material efficiency strategy can be found in Chapter 5 on “material efficiency”.
In general, achieving the enormous emission and energy demand reductions in the 450 ppm as well as in the 400 ppm scenario will require strong policies. Most of the technological potentials available are realised in the 400 ppm scenario. Energy efficiency has to improve a lot faster than economic growth, which has not been the case in the past. Our analysis of the available technologies has showed that this is possible, but will not happen without comprehensive action.
The programme costs related to the above mentioned policies are estimated based on specific country case studies and experiences. Subsidies for comprehensive energy audits in companies would amount to about 30 million euros annually in Germany (Gruber et al. 2006).

ADAM 2-degree scenario for Europe – policies and impacts
- 189 -
The energy efficiency networks are estimated to cost 40,000 euros per network, with a potential of around 700 networks for Germany (Jochem et al. 2007). Subsidies for solar thermal installations are assumed to be 20% of the initial investment and a subsidy of around 5% is assumed for other energy efficiency measures in industry in the form of low tax loans for energy efficiency investments. Furthermore, for the public R&D on industrial energy efficiency, we assumed national expenditure to increase by the factor 5 (for Germany, that would mean the state providing 30 million euros instead of the 6 million it spent in 2007). CCS and other measures in the energy-intensive industries are only cost-effective due to the increasing CO2 certificate prices. As a result, in the 400 ppm scenario, about 5% of the additional investment is from public subsidies and about 5% is also needed to develop administrative authorities. In the 450 ppm scenario, these figures are 8% and 4%, respectively. The overall relatively low share of programme costs in relation to the investments (10-12%) is due to the fact that many of the investments are driven by the CO2 certificate price (e.g. CCS) and by MEPS (e.g. standards for electric motors), which have very low programme cost shares. To compare, other studies find, e.g. a value of 15% for supporting energy-efficient cross-cutting technologies through an energy efficiency fund (Irrek 2006).

Transport Sector
- 190 -
9 Transport sector in Europe
Authors: Wolfgang Schade, Nicki Helfrich, Anja Peters
9.1 Target of analysis
The transport sector in Europe contributed more than 23 % of EU-27 GHG emissions in 2005 (1277 Mt CO2 eq.). Due to the high share of fossil fuel use, the share of CO2 emissions is even higher, amounting to more than 27 % of EU-27 CO2 emissions in 2005 (1247 Mt CO2). As Figure 9-1 reveals, the transport sector is the only major sector in the EU-27 in which GHG emissions have risen compared with 1990. The same holds for the CO2 emissions of transport [European Commission 2007]. Despite this growth trend, the European Commission has agreed on a target of a -10 % reduction of GHG emissions by 2020 compared with the year 2005 for the non-ETS sectors, which includes transport [European Commission 2008].
0
20
40
60
80
100
120
140
1990
1991
1992
1993
1994
1995
1996
1997
1998
1999
2000
2001
2002
2003
2004
2005
[Inde
x 19
90 = 100
] , [%
]
Development of GHG emissions in EU27Conversion
Industry
Household & Services
Other
Transport
Share transport [%]
Source: European Commission, 2007
Figure 9-1: Development of GHG emissions of transport compared with other sectors in
EU-27 (1990 to 2005)
The split of GHG emissions across the major modes of transport is presented in Figure 9-2. With more than 70 %, roads generate by far the largest quantity of GHG emissions. Navigation and Civil Aviation, both including international bunkers, generated about 14 % and 12 % in 2005, respectively.
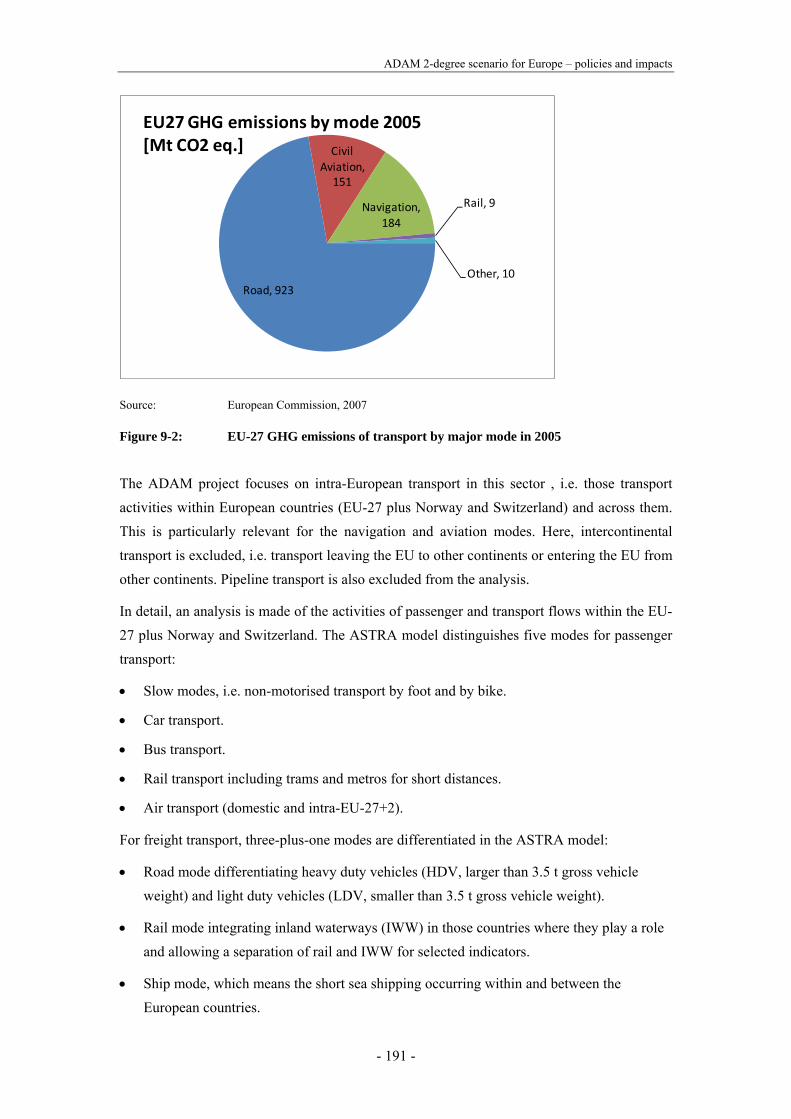
ADAM 2-degree scenario for Europe – policies and impacts
- 191 -
Road, 923
Civil Aviation, 151
Navigation, 184
Rail, 9
Other, 10
EU27 GHG emissions by mode 2005[Mt CO2 eq.]
Source: European Commission, 2007
Figure 9-2: EU-27 GHG emissions of transport by major mode in 2005
The ADAM project focuses on intra-European transport in this sector , i.e. those transport activities within European countries (EU-27 plus Norway and Switzerland) and across them. This is particularly relevant for the navigation and aviation modes. Here, intercontinental transport is excluded, i.e. transport leaving the EU to other continents or entering the EU from other continents. Pipeline transport is also excluded from the analysis.
In detail, an analysis is made of the activities of passenger and transport flows within the EU-27 plus Norway and Switzerland. The ASTRA model distinguishes five modes for passenger transport:
• Slow modes, i.e. non-motorised transport by foot and by bike.
• Car transport.
• Bus transport.
• Rail transport including trams and metros for short distances.
• Air transport (domestic and intra-EU-27+2).
For freight transport, three-plus-one modes are differentiated in the ASTRA model:
• Road mode differentiating heavy duty vehicles (HDV, larger than 3.5 t gross vehicle weight) and light duty vehicles (LDV, smaller than 3.5 t gross vehicle weight).
• Rail mode integrating inland waterways (IWW) in those countries where they play a role and allowing a separation of rail and IWW for selected indicators.
• Ship mode, which means the short sea shipping occurring within and between the European countries.

Transport Sector
- 192 -
The ASTRA model enables transport emissions occurring over the whole life-cycle to be calculated but excludes those arising from vehicle scrapping. That means the emission calculations consider the emissions from the driving activity including cold start emissions, upstream emissions of fuel production and upstream emissions of vehicle production. In the ADAM project, only the emissions and energy consumption of the driving activity (the so-called hot emissions) are taken from the ASTRA model. The other types of emissions and the energy demand in the transport sector are considered in different bottom-up models, e.g. the manufacturing emissions of vehicles form part of the ISI-industry calculations. Thus the main output of the ASTRA transport model in the frame of the ADAM hybrid model system (HMS) is the transport energy demand, which is provided to the EuroMM model.
9.2 Policies, technology trends and model rationale of ASTRA
This section presents the rationale and structure of the transport model in ASTRA, which is made up of four of the nine ASTRA.15 It is completed by the technology trends considered for the transport sector and a discussion of available policy options and the policy choice implemented in the model simulations in the 450 ppm and 400 ppm scenarios.
Major boundary conditions affecting the transport system include the growth of GDP since, so far, no decoupling has been observed (mainly relevant for freight transport), the stabilisation of the European population (mainly relevant for passenger transport), the continuous increase of fossil fuel prices due to their growing scarcity and the continued urbanisation process in Europe meaning that more people will live in urban areas compared with today which are better served by public transport, car-sharing or bicycles than by private cars.
9.2.1 Model rationale of the ASTRA transport model
In ASTRA, the spatial representation consists of 76 zones. Each of the larger EU15 countries is spatially divided into four zones (apart from Denmark and Ireland with three zones), while Eastern European countries in particular have only one or two zones. ASTRA estimates the transport demand within each zone and across all zones for five different distance categories for passenger transport and four distance categories for freight transport. The ASTRA transport model consists of four models that are embedded into the socio-economic framework provided by the economic models of ASTRA. The four transport models are:
• Transport infrastructure model (INF module).
• Passenger transport model (REM and TRA module).
• Freight transport model (REM and TRA module).
15 A detailed description of the ASTRA model can be found in [Schade 2005].

ADAM 2-degree scenario for Europe – policies and impacts
- 193 -
• Vehicle fleet model (VFT module).
Transport infrastructure in the infrastructure model is driven by the investment in infrastructure that in turn depends on (1) GDP development, and (2) policy choices about which types of infrastructure should be financed, e.g. the Trans-European-Transport-Networks (TEN-T), rail freight corridors, ports etc. The capacity of infrastructure then influences the travel times and thus the destination and mode choices in the passenger and freight transport model.
Figure 9-3 presents the major interdependencies of the passenger transport model. The main output of the model is the passenger transport performance by mode as well as the vehicle-kilometres-travelled (VKT) by mode. The core of the model is a classical four-stage transport model [see Ortuzar/Willumsen 2004] with a rather limited assignment component (4th stage). However, the first three stages act in an integrated and dynamic way, i.e. at none of these stages (generation, distribution, mode choice) are any assumptions made about structural stability. In the generation stage, e.g. changes in population, degree of (un-)employment or the car fleet may alter the number of generated trips. In the distribution stage, of course, changes may stem from generation, but more important is the aggregated generalised transport cost between any origin (O) and destination (D) in Europe. These aggregated costs consist of monetary costs and time costs and thus represent an accessibility measure for each European OD-relation described by the ASTRA functional zoning system.
Accessibility is influenced by the travel time (depending on infrastructure and network load) and the travel cost (depending, e.g. on tariffs, car prices, fuel prices, car taxes etc.) by mode. The same influences also affect the mode choice for each OD relation and each distance band (0-3.2 km, 3.2-8km, 8-40km, 40-160km, >160km distance). As a starting point for travel distances and travel times for each OD relation, the input from a European network model (in ADAM this is still the SCENES model [ME&P 2000]) is integrated into ASTRA. Distances and travel times change due to exogenous (e.g. growth of average distances within distance bands) and endogenous influences (e.g. investment in infrastructure, destination choice shifts to further away destination zones).
In the final step, passenger transport performances by mode are converted into vehicle kilometres using distance- and mode-specific occupancy rates. The occupancy rates are taken from national travel surveys (e.g. UK national travel survey) and decrease over time. The major outputs of the passenger transport model comprise the energy demand, emissions, transport expenditures, transport tax and toll revenues.

Transport Sector
- 194 -
ASTRA socio-economic framework
Population
EmploymentTransportgeneration
Transportdistribution
Car fleet bycar typesIncome
Generalizedcost O/D
Generalizedcost modes
Modal-split
GDPInfrastructureCapacity
Travel time
Transport demand
Occupancyrates
InfrastructureInvestment
Passenger transport model
Source: Fraunhofer-ISI, own presentation
Figure 9-3: ASTRA passenger transport model
Figure 9-4 shows the major interdependencies of the freight transport model. The main outputs of the model are the freight transport performance by mode as well as the vehicle-kilometres-travelled (VKT) by mode. The basic structure of the freight transport model is similar to that of passenger transport; it is a classical four stage transport model including only a limited 4th stage for assignment. A major difference concerns the distribution model of international freight transport, which derives the freight flows for the OD relations based on foreign trade flows. National transport flows are derived from the sectoral output of each goods producing sector (15 sectors) in the 29 European countries.
In the final step, freight transport performances by mode are converted into vehicle kilometres using distance- and mode-specific load factors. The load factors are taken from the SCENES model and exogenously increase over time due to the assumption of improved logistics. Further, the load factors are endogenously altered by transport cost, e.g.. to reflect organisational improvements in response to higher fuel prices or fuel taxes. The major outputs of the freight transport model comprise the energy demand, emissions, investments in freight vehicle fleets, transport tax revenues and toll revenues.

ADAM 2-degree scenario for Europe – policies and impacts
- 195 -
ASTRA socio-economic framework
Sectoral output
Trade flows
National transportgeneration
Transportdistribution
Generalizedcost O/D
Generalizedcost modes
Modal-split
GDPInfrastructureCapacity
Travel time
Transport demand
Load factors
InfrastructureInvestment
Freight transport modelValue-to-volume ratios
Source: Fraunhofer-ISI, own presentation
Figure 9-4: ASTRA freight transport model
A third model relevant for the ADAM project is the car fleet model consisting of a stock model, a purchase model and a choice model for the selection of newly purchased cars. The car fleet model constitutes one of the most policy-sensitive model elements in ASTRA as it reacts to policies that support new technologies (e.g. subsidies or ‘feebates’, a novel combination of fees and rebates), to taxation policies (i.e. car and fuels) and to fuel price changes including changes of CO2 taxes/certificates and energy tax changes. Other socio-economic drivers also affect the development of the car fleet, especially income, population and the existing level of car-ownership.
The car fleet model starts with the purchase model, which determines changes in the absolute level of the car fleet. Depending on changes in income, population and fuel prices, the level of the car fleet is estimated for the next time period. Together with information on the scrappage of cars which mainly depends on the age structure of the fleet, the number of newly purchased cars is then calculated. Purchase of cars via the second-hand market from other countries is neglected, which is a simplification that played a role for the new Member States before they joined the EU.
In the second step, the newly purchased cars are transmitted to the choice model, which determines the types of cars that are purchased. Car types include:
• Gasoline cars: three types differentiated by cubic capacity (<1.4l, 1.4-2.0l, >2.0l),
• Diesel cars: two types differentiated by cubic capacity (<2.0l, >2.0l),
• Compressed natural gas (CNG) cars,
• Liquefied petroleum gas (LPG) cars,

Transport Sector
- 196 -
• Bioethanol cars, i.e. cars that can run on 85 % bioethanol (E85) and more (incl. flex fuel),
• Hybrid cars, meaning advanced hybrid cars depending on timing, i.e. plug-in hybrids with the ability to run for a significant distance on electricity,
• Battery electric cars, i.e. smaller cars running in battery-only mode,
• Hydrogen fuel cell vehicles (hydrogen internal combustion engine is not considered a reasonable option).
The choice of new car depends on fuel prices (incl. taxes), car prices, taxation of car technologies, efficiency of cars, filling station network and, in the case of new technologies, on subsidies or feebates (combined fee and rebate system). In the case of electric vehicles, preferences are also altered by adapting the choice parameters in the model equations.
Emission standards are also considered in the car fleet model. The point of time when a new car is purchased determines to which emission standard it belongs and which emission factors have to be applied to model its emissions. ASTRA distinguishes nine emission standards (2 pre-euro standards, euro1 to euro 7 standard). For example, if a car is purchased in 2005, it is assumed that it complies with the euro 3 standard.
The third element is the stock model of the existing fleet. This model provides the number of cars and the age distribution in the fleet . Using age-specific scrappage functions and a cohort approach, the model simulates ageing of the individual cohorts of the fleet. Thus it is feasible to analyse at any point of time the number of cars using a certain engine technology and belonging to a certain emission standard.
ASTRA socio-economic framework
IncomeScrappedcars
Existing car fleetby age, by technology,by emission stand.
Ageing ofcar fleetGDP
Filling stationnetwork
Purchase ofnew cars
Car pricesInfrastructureInvestment
Car fleet and car choice model
Fuel price
Car taxesChoice ofnew cars
Policy andnew technologies
Population Car-ownership
Source: Fraunhofer-ISI, own presentation
Figure 9-5: ASTRA car fleet and car choice model

ADAM 2-degree scenario for Europe – policies and impacts
- 197 -
The major function applied in most of the transport models are discrete choice functions, i.e. logit functions [Ortuzar/Willumsen 2004]. These are, for instance, used to model the destination choice, mode choice and car purchase choice. The following two equations illustrate the mode choice calculation for passenger transport resulting in the transport demand by mode and trip purpose for a specific origin-destination pair:
∑ +−
+−
=
m
MCGC
MCGC
ODTPODTPm TPmODTPmTPm
TPmODTPmTPm
eeDD
,,,,
,,,,
*
*
,,, * λ
λ
(eq. 9-1:)
TPODTPmODmTPmODmODTPm VoTSPDISTCDISTGC *** ,,,,,,, += (eq. 9-2:)
Where: D = transport demand (by purpose and origin destination (OD) pair) [trips]).
GC = generalised cost [€].
λ = logit parameter defining the elasticity of the modal shift [1/€].
MC = modal constant.
DIST = distance between origin and destination of trip [km].
C = specific cost per km by mode and trip purpose [€/km].
SP = speed of mode [h/km].
VoT = value-of-time [€/h].
m = index for modes (i.e. car, bus, rail, air, slow).
TP = index for trip purposes (business, private, tourism).
OD = index for origin and destination zones i.e. OD-matrix.
For clarity reasons, the index for European countries has been omitted. In the ASTRA model, all these equations would additionally include a country index representing the 28 European countries modelled in ASTRA. Instead of the GC-term (generalised cost), the equivalent logit equation for the car purchase choice would have a term that describes the utility parameters of cars, e.g. the vehicle price, fuel price, fuel efficiency, fuelling station network and vehicle taxation.
9.2.2 Transport technology trends
Though the internal combustion engine has been the dominant propulsion technology in the transport system for about one hundred years, it cannot be expected that this will continue in the next decades as well. The growing scarcity of fossil fuel resources, the challenges of combating climate change and the availability and competitiveness of new technologies will lead to a diversity of fuels and engine technologies in transport over the next 40 years.

Transport Sector
- 198 -
Backed-up by corresponding cost developments of vehicles and fuels in the ASTRA model, the following specific trends are expected to play a significant role in the mitigation scenarios:
• Conventional cars with internal combustion engines still have high energy efficiency potentials. The efficiency potentials for gasoline are higher than those for diesel cars in the future [TNO 2006].
• The breakthrough in battery technology (in particular in lithium-ion batteries) will enable battery electric city cars to gain large market shares in short and medium distance car transport.
• Electric engines and batteries will also be available for light duty vehicles used for last-mile delivery in cities.
• It will not be possible to replace the internal combustion engines in heavy duty vehicles and air transport with alternative engines in the next 40 years. Thus besides efficiency improvements, the main option to reduce the GHG emissions of these modes is to switch to higher shares of second (third) generation biofuels.
• CNG starts to play a role as a low carbon fossil alternative to gasoline and diesel for cars, buses and trucks as well as a bridge technology towards hydrogen for transport.
• After 2030 hydrogen fuel cell vehicles also begin to enter the market, but their share remains limited as long as fossil fuels are still available and renewable energy production is limited.
• For maritime shipping, the use of wind power (e.g. sky sails, turbo sails, Flettner rotors) will start to play a role due to growing fossil fuel and CO2 prices. This was not considered for the short sea shipping in the ASTRA model, which underestimates the potentials of these technologies.
9.2.3 Policy options for passenger cars
In this section, a number of car fleet related policies are explained in more detail to demonstrate important fiscal policies and information measures which are being discussed and which aim to transform the transport system into a low carbon emitting system. The measures concentrate on those that would change car purchase behaviour (energy / CO2 labelling, a CO2 based circulation tax and feebates on new passenger vehicles). Findings in the literature on their effects are described to derive the assumptions about the CO2 reductions induced by these measures implemented in the ASTRA model.
9.2.3.1 Energy / CO2 labelling of new passenger vehicles
Energy/ CO2 labelling is an information tool. In Europe, a label similar to the one used for household appliances (showing seven colour-coded bars for the efficiency classes A (very

ADAM 2-degree scenario for Europe – policies and impacts
- 199 -
efficient) to G (very inefficient)) is being used or considered by several countries [de Haan et al. 2009]. However, countries vary markedly in how they classify vehicles. If they define energy efficiency in an "absolute" way, the rated CO2 emissions directly determine the efficiency class of a vehicle. An alternative policy base results from the notion of "relative" energy efficiency, which is computed by normalizing energy consumption to car size operationalized by, e.g. floor space, curb weight or car length. The specific design of a labelling scheme might be important for its effects, especially when other measures such as vehicle taxation are directly linked to its categories. A study of Peters et al. [2008] suggests that a relative system succeeds better in addressing more consumers. However, a relative system potentially allows people to switch to cars with higher relative efficiency without actually lowering absolute CO2 emissions. Here, it is important to find the optimal trade-off.
In the literature, a few studies have been made on the impact of labelling on the energy efficiency and CO2 emissions of new vehicles. However, their results vary with the methods used. Based on a survey in Austria, E.V.A. et al. [1999] studied the impact of labelling on the consumer’s car purchase decision and came to a rather optimistic estimation of the possible effect. They concluded that, on average, 4-5 % lower specific fuel consumption and CO2 emissions of newly registered cars could be obtained.
In a Swiss study, Iten et al. [2005] analysed the impact of the Swiss energy label, which was introduced in 2003. Amongst others, they conducted a discrete choice analysis of Swiss consumers to study the effect of the label on car choice. Based on the results and following market simulations, they estimated that the energy label could reduce the specific fuel consumption of the car fleet by 0.4 % per year. However, the discrete choice analysis included some flaws, e.g. unrealistic combinations of vehicle characteristics.
In a cross-national study by the ADAC [2005] on the effectiveness of the EU car labelling Directive (which was adopted in December 1999), there was no evidence that labelling had contributed to a reduction of the average CO2 emissions of new cars sold in the EU. The study was based on an evaluation of the Member States’ reports, findings of other studies, the results of a survey of European automobile club members and an analysis of data on the average specific CO2 emissions of new cars. The authors point out that, due to the different elements of the European strategy and continuous technical improvements, it is very difficult to attribute a shift in purchasing behaviour to such an information tool. Despite this conclusion, they still consider the labelling scheme a useful tool for raising awareness about the climate change impacts of passenger cars. But more time is needed for the Directive's provisions to achieve their full effect. Moreover, as labels varied strongly in their quality among EU Member States, a common and improved EU labelling scheme should be developed. The inclusion of an energy efficiency rating system is especially recommended to allow consumers to compare vehicles more easily.

Transport Sector
- 200 -
In general, to be effective, such a label should be used as part of a package of measures, rather than as an isolated measure. For example, labelling can be an important way to raise consumer awareness about the impact of car use on CO2 emissions and climate change if vehicle taxation is linked to its categories and can then result in significant medium- to long-term indirect impacts on car purchasing behaviour.
For calculating the CO2 reductions induced by energy/ CO2 labelling of new passenger vehicles within the ASTRA model, we assumed that labelling can have a moderate impact on the car purchasing decision and increases the probability that consumers will choose more efficient vehicles if it is developed and designed effectively and accompanied by broad information campaigns. Such a moderate estimation of the resulting effect on energy efficiency and CO2 emissions might range around 3 % reduction considering that, in a mitigation scenario, fuel efficient cars are on the market and that the level of awareness is significantly higher than in the Reference Scenario.
9.2.3.2 CO2 based annual vehicle circulation tax
The specific design of the annual vehicle circulation tax differs substantially among EU Member States with regard to the level of taxation, the extent to which differentiation is applied and the tax base (e.g. kW, cylinder capacity, weight of the car) [Kalinowska et al. 2005; Kunert/Kuhfeld 2007]. Linking the annual circulation tax (ACT) to the CO2 emissions of a vehicle throughout the EU might be an effective measure to reduce the energy consumption and CO2 emissions of road transport.
The UK already introduced CO2 emissions as the explicit ACT base in 2001. This CO2-based tax scheme was studied by Lehman et al. [2003] via interviews with new car purchasers who had bought a car under the new tax scheme or who were planning to buy a new car within the following year. Under the new tax scheme, the difference between the bands was around €15-45, ranging from €83 ACT for an alternative fuel car with CO2 emissions of up to 100g/km to €248 ACT for a diesel car with CO2 emissions over 185 g/km. The results indicate that the current graduated scheme does not offer a large enough incentive to change purchasing behaviour, but that increased differentiation would enhance the scheme’s effectiveness. According to the authors, a differential of €75 between bands would be enough for at least 33 % of buyers to choose a different car. At a differential of €225, more than half of the interviewed buyers would change to a lower emission car in order to benefit from the saving. However, 28 % of respondents, typically older respondents of a higher social class who already own or intend to buy a vehicle with a larger sized engine, would not change their vehicle choice regardless of the differential. In general, the study points out the importance of effective information measures. At the time the study was conducted, the message that the ACT in the UK was linked to CO2 emissions had not reached many private car buyers.

ADAM 2-degree scenario for Europe – policies and impacts
- 201 -
For Ireland, which changed its vehicle tax policy in July 2008 and introduced a CO2-based ACT as well as a CO2-based vehicle registration tax (VRT), Giblin and McNabola [2009] predicted the impacts of these changes. For the ACT, they estimate a 2.2-2.4 % reduction in the average CO2 emissions from new cars. The authors also proposed changes to both the ACT and the VRT which would optimise both reductions in CO2 emissions and reduce losses in tax revenue. To do so, the ACT rates of Ireland would have to be increased by 15-25 %.
In a cross-national study, COWI [2002] estimated the potential of restructured ACT systems based on CO2 emissions for nine European countries using scenario simulations. The estimated CO2 reductions in the individual Member States range around -4.5 % compared to existing systems based on horsepower. The estimated effects depend on the conditions in the individual countries and are affected, e.g. by the existing tax systems and the market composition. The biggest effect was estimated for the Netherlands with 6 % and the smallest one for Portugal with 2.3 %.
The results of the above mentioned studies underline that the efficacy of CO2-based taxes depends on their specific design, e.g. the tax level and differentiation between vehicles, as well as on the provision of effective information to consumers about the tax basis and aims.
More tips for the specific design of tax schemes are provided by studies made in the US which indicate that consumers only consider the first 2.8 to 3 years, or only the first 50,000 miles when assessing the value of higher energy efficiency [cf. Greene et al. 2005]. This suggests that financial incentives in the first three years are relevant for consumers, but later incentives probably not. Thus, another effective design might be to exempt consumers of very energy-efficient new vehicles from the ACT for three years instead of levying the same tax across the whole ownership period.
However, interviews with car buyers suggest that consumers do not use payback periods, but calculate the financial aspects of energy efficiency only very roughly, if at all [e.g. Kurani 1992; Kurani/Sperling 1988; Turrentine/Kurani 2007]. In fact, other aspects of energy efficiency may be more important to consumers such as technology, environmental aspects or the strong symbolic image of energy-efficient vehicles. Nevertheless, financial incentives of a relevant level can raise awareness of these issues, especially when accompanied by information campaigns [de Haan et al. 2007].
For calculating the CO2 reductions induced by a CO2-based ACT within the ASTRA model, we assume a reduction effect of about -4.5 % at the time of introduction provided that consumers are effectively informed about the measure. However, unlike a tax levied at the time of purchase, of which consumers are always very conscious, the awareness of the link between the ACT and CO2 emissions may subside over time and thus also its effect on consumer behaviour. Hence, we assume a moderate decrease by 1 % until 2015. This measure

Transport Sector
- 202 -
was treated as an additional option to enforce the transport policy on cars, but it was not implemented in the 2°C scenarios.
9.2.3.3 Feebates on new passenger vehicles
In order to promote very energy-efficient vehicles such as the upcoming electric or fuel-cell vehicles, feebates might be a feasible tool. Feebate systems combine rebates for very energy-efficient vehicles with additional fees for very inefficient vehicles [de Haan et al. 2009]. Various possible types of feebate schemes and design options appear in the literature [DeCicco et al. 1993; Greene et al. 2005; HLB Decision Economics Inc. 1999; Johnson 2006; Peters et al. 2008; Train et al. 1997].
A study of Iten et al. [2005] indicates that the implementation of a feebate system (here: rebates funded by a general increase of the VRT) based on the Swiss energy label would enhance the impact of such a label. Assuming a rebate of €1200 for ‘A’ labelled vehicles and of €800 for ‘B’ labelled vehicles funded by an increased purchase tax, they estimated that the specific fuel consumption of the new car fleet could be reduced by -1.6 %.
In another Swiss study based on simulations, de Haan et al. [2009] assumed incentives of €2000 only for ‘A’ labelled cars (again funded by an increase of the VRT) and concluded that they would induce CO2 emissions reductions of between 3.4 and 4.3 % for new car registrations.
A study of Giblin and McNabola [2009] analysed the effects of the Irish CO2-based VRT introduced in July 2008 and estimated a resulting reduction of 1.6-1.7 % in CO2 emissions. For the combined effect of the restructured ACT and VRT, a 3.6-3.8 % reduction was calculated (estimated reduction for ACT alone presented above). Proposed changes to both the ACT and the VRT could result in an improved reduction of 5.1-5.7 %.
In the study of COWI [2002], the reduction potential of CO2-based VRT systems across selected European countries was estimated to range between 1.8 % (for Italy) and 8.4 % (for Denmark). Combining CO2-differentiated VRT and ACT results in reductions ranging from 4.3 % (for Finland) and 8.5 % (for Denmark).
It should be noted that the above mentioned studies only considered the effects of car choice models on consumers . In a small country without large car manufacturers, manufacturers might not be encouraged by a national feebate system to adopt more vehicle efficiency technologies [Langer 2005]. However, if feebates are introduced in large countries that represent a relevant share of the vehicle market or at EU level, studies modelling feebates on a broader level which also consider manufacturer’s behaviour predict quite large effects (over 20 % reduction in average CO2 emissions) which are mainly due to the manufacturers’ response [e.g. Davis et al. 1995; Greene et al. 2005].

ADAM 2-degree scenario for Europe – policies and impacts
- 203 -
De Haan et al. [2007] pointed out that traditional methods to forecast the effects of feebates are based on oversimplifying assumptions and do not capture all the relevant elements of consumer and manufacturer behaviour. For both consumers and manufacturers, they are limited to the monetary effects of feebates [Langer 2005]. However, on the consumer side, other mechanisms which affect important psychological factors influencing car purchase behaviour are also relevant, such as norms, values, the image of energy-efficient vehicles and the perceived opportunity to do something about the problems linked to fuel consumption. These mechanisms have the potential to address consumer segments with lower price elasticity in contrast to the sole monetary component of feebates. Thus, de Haan et al. [2007] assume that such models underestimate the effect of feebates on consumer behaviour. However, in order to exploit the full potential of feebates, effective accompanying information and marketing measures are decisive. Moreover, a combination of feebates with a regulatory program (e.g. CO2 emissions standards) might be a feasible approach to reduce vehicle emissions faster, as feebates could shift the market towards the efficient vehicles which have to be sold by manufacturers in order to meet the standards [Langer, 2005].
Of course, the specific design of the feebate system is decisive for the effect of specific fees or rebates. As mentioned above, feebates based on a relative definition of energy efficiency might have more success in addressing greater numbers of consumers but, at the same time, they potentially allow people to switch to cars with a higher relative efficiency without actually lowering absolute CO2 emissions. Here, it is important to find the optimal trade-off (see discussion in Section 9.2.3.2). With regard to the handling of payments, according to de Haan et al. [2007], rebates and fees should be paid and charged separately instead of being charged directly against the purchase price, as the perceived value of separate payments is higher.
As consumers are reminded of this tax at the time of the purchase in contrast to an annual circulation tax linked to vehicle characteristics, we do not assume that this effect will diminish over time as long as this measure is implemented. Moreover, it can be expected that its effect on consumers will endure even if feebates are only implemented for a certain time frame, if their potential to change consumer awareness, norms and values is used. However, for manufacturers, stable instruments which represent and follow long-term political objectives seem to be important to create enduring effects.
Based on this outline, we assume a CO2 reduction of 5 % induced by effectively designed feebate systems. We did not implement the feebate system fully as a separate measure on its own, but assumed that a moderate system would support the labelling and CO2 regulation measures for cars.

Transport Sector
- 204 -
Subsidies for alternative fuel vehicles and fuelling infrastructure:
As mentioned above, feebates on new passenger vehicles, in particular rebates for very efficient ones can also be effective in promoting the diffusion of alternative fuel vehicles, such as battery-electric vehicles or fuel cell vehicles, which require a special fuelling/charging infrastructure. As their diffusion shows specific characteristics and requirements, in the following, we present some conclusions which can be drawn based on the experiences with the introduction of natural gas vehicles (NGVs) in various countries.
Based on data on the adoption of NGVs in eight countries (Argentina, Brazil, China, India, Italy, New Zealand, Pakistan, and the US.), Yeh [2007] examined a range of factors that influence the adoption of NGVs. Several economic factors, such as the purchase costs of NGVs, the natural gas fuel price, the profitability of operating refuelling stations, and selling/installing vehicle equipment, can affect consumer and investor decisions to enter the NGV market. Janssen et al. [2006] also point out that the price for natural gas should leave enough room for an attractive margin for fuelling station investors and for customers buying NGVs. In countries where the price difference to gasoline and diesel is too low, fuel tax reductions and subsidies for fuelling stations could compensate this unfavourable condition. Yeh [2007] concludes that natural gas fuel prices of 40–50 % below gasoline and diesel prices and incentives to keep the payback period at 3–4 years or less are important keys for a widespread adoption of NGVs.
With regard to the vehicle-to-refuelling-stations ratio, countries with a large number of NGVs show a ratio of 1000 vehicles per refuelling station [Janssen et al. 2006; Yeh 2007], which seems to be the optimal balance between profitability for fuelling stations and consumer convenience and thus very decisive for market development. This ratio could be a useful indicator to monitor the effectiveness of government policies and make policy adjustments based on its values, either to promote vehicle adoption or to stimulate the installation of refuelling stations. With regard to Germany, Janssen et al. [2006] point out that in 2003, Germany showed a high ratio of fuel stations to gas cars with a quickly growing fuelling station infrastructure of approximately 250 public fuelling stations (+150 non-public), whereas the current 18,000 NGVs only show a moderate growth rate. This may have been a major barrier to the diffusion of NGVs in Germany.
Moreover, the availability and reliability of vehicle technology and components are important factors for consumer acceptance of NGVs and alternative fuel vehicles in general [Yeh 2007]. Struben and Sterman [2008] point out that consumer willingness to consider a vehicle type is important for the adoption of AFVs and that this can be generated by marketing and media, direct social exposure to the vehicle type and word of mouth. For the self-sustaining adoption of AFVs by consumers, awareness and adoption must exceed a certain tipping point.
ADAM 2-degree scenario for Europe – policies and impacts
- 205 -
The critical ratios and required infrastructure may vary according to the specific type of alternative vehicle (e.g. plug-in-hybrid vehicle, battery-electric vehicle; fuel cell vehicle), its capacities with regard to range and fuelling/charging capacity and driver behaviour. Here, more research is needed on the conditions for successful diffusion and use. But in general, policies such as subsidies for alternative vehicles, e.g. within a feebate system, and fuelling infrastructure are required for the successful diffusion of AFVs that persist over periods long enough to reach the critical tipping points [cf. Struben/Sterman 2008]. As a result, a feebate system was considered to be implemented during the initial market entry period of battery electric vehicles and hydrogen fuel cell vehicles.
9.2.4 Policy choices for transport in the EU
To simulate the mitigation scenarios in the ASTRA model it was necessary (1) to take into account the cross-cutting policies relevant for all sectors, and (2) to make a selection of the available transport policies, some of which were discussed above. The main cross-cutting policy considered for transport is the existence of a CO2 certificate system, which would be the EU-ETS to start with that is extended in the post-Kyoto period to a global ETS system. Rail transport is subject to the EU-ETS from the beginning as far as electric rail transport is concerned. Air transport and ship transport become part of the ETS around 2012 and the remaining road transport is integrated into the ETS via an upstream system around 2020. However, strong impacts of an ETS should not be expected for road transport in particular as even at prices of 100 €/t CO2, the price increase of one litre gasoline fuel would be around 26 cent/l, which will only have limited impacts, if this is not accompanied by other measures. On the other hand, including road transport is important to obtain a closed system, i.e. one covering all the major sources of emissions, in order to be able to calculate the cap on CO2 and GHG emissions. As including transport in the ETS via an upstream approach has the same effect as increasing the fuel tax, no further fuel taxation policy was considered.
Table 9-1 presents the transport policies that have been selected to simulate the ADAM mitigation scenarios. The selection is based on the heuristics of the feasibility, technical availability and comparative cost of the measures, but not on an optimised cost competitiveness. This seems a better course to pursue given the uncertainties of scenarios that run 40 years into the future.
Broadly speaking, the 450 ppm scenario can be characterised as focusing on passenger transport, urban freight transport, new engine technologies (in particular electric city vehicles and hydrogen fuel cells) and biofuels. The 400 ppm scenario adds measures for long-distance freight transport, in particular the efficiency of HDV, improved logistics, improved competitiveness of railways and a modal shift to rail freight. Air transport in both scenarios is mainly addressed by the introduction of biofuels and the impact of including it in the ETS,

Transport Sector
- 206 -
which has a dampening impact on air transport growth in the longer run when CO2 prices reach levels of 50 to 100 €/tCO2.
It is also assumed that the European policy to improve the competitiveness of rail transport for both passengers and freight is continued and even augmented. In terms of passenger transport, this means the continued expansion of the high-speed rail network, upgrading speed restricted sections to standard speeds and the consistent introduction of synchronised timetables all of which increase the reliability and frequency of rail transport.
In terms of rail freight transport, this means eliminating bottlenecks, i.e. building dedicated freight rail tracks for sections or nodes that are relevant for long-distance rail freight but that face capacity constraints. In addition, cooperative logistics, i.e. logistic planning across different forwarding companies, should be fostered such that sufficient freight demand is generated to load full trains for long-distance shipments. Since such improvements also require infrastructure investments, these should be funded by revenues from the ETS payments of transport.

ADAM 2-degree scenario for Europe – policies and impacts
- 207 -
Table 9-1: Transport policies in the ADAM scenarios
Area 450 ppm scenario 400 ppm scenario Cross-cutting policy Inclusion in ETS (air/ship 2012, road 2020) Path to 80€/t in 2050 Path to 198€/t in 2050 Car transport CO2 emission limits for cars Up to -10 % fuel efficiency
compared with REF The same
Efficiency labelling of cars Avg. -3 % energy demand The same Low resistance lubricants binding legislation -2.5 % energy demand The same Battery technology breakthrough (E-mobility), policy support and linkage of battery vehicles with increased use of renewable electricity
City cars only, diffusion by R&D&prototype-sup-port 2010, market share 3 % in 2020, 8 % in 2050
Additional feebate for market entry, market share 8 % in 2020, 21 % in 2050
Hydrogen fuel cell breakthrough, policy support for R&D, field tests and subsidies at market entry. Fuelling station network build-up.
Market entry 2025, market share 1 % in 2030, 8 % in 2050
The same
Bioethanol quota (partly by blending in gasoline) 10 % of gasoline in 2020 (flex fuel cars & blended)
Quota increase to 20 % in 2035, 25 % in 2050
Rail passenger transport Increased competitiveness compared with long distance road and air transport
--- Rail infrastructure and services improved
LDV transport Battery technology breakthrough (E-mobility) Starting 2015, reaching 10 %
new LDV in 2030, and 30 % in 2050
The same
CO2 emission limits for LDV enforced early Up to -10 % fuel efficiency compared with REF starting 2016, fully effective 2024
The same
CO2 emission limits for LDV medium-term enforcement
--- Up to -10 % fuel effi-ciency compared with 450ppm starting 2025, fully effective 2040
HDV transport CO2 emission limits for HDV in medium-term --- Starting 2030, reducing
CO2 -5 % by 2040 and -10 % by 2050.
Additional reaction of logistics to cost increase of CO2 certificates
--- +15 % / 21 % increased load factor short/long
Driver education --- Up to -10 % fuel efficiency relative to REF
Low resistance tyres --- Up to -5 % fuel efficiency relative to REF
Logistics Improved logistics for all freight modes reduces vehicle-km
Corporate logistics, network logistics etc.
The same
Improved rail logistics, improved rail freight accessibility+information => modal-shift to rail
--- Starting 2020, +5 % rail mode share in 2050
Biofuel Quota for biodiesel in road transport (in REF scenario the quota is already 9 % in 2020)
Increase to 12 % in 2030 and 16 % in 2050
Increase to 17 % in 2030 and 30 % in 2050, increase mainly HDV
Quota for biodiesel in rail transport for diesel engines
Starting 2015, 5 % share in 2030, 15 % in 2050
The same
Quota for biofuel in air transport (e.g. Jatropha based)
Starting after 2012, 4 % in 2020, 10 % in 2030, 25 % in 2050
Starting after 2012, 4 % in 2020, 20 % in 2030, 50 % in 2050 (doubling)
Source: Fraunhofer-ISI, ADAM project

Transport Sector
- 208 -
9.3 Results of scenarios
This section presents the scenario results for the transport sectors for the two variants of the ADAM 2°C scenario: the 450 ppm scenario (450 ppm) and the 400 ppm scenario (400 ppm). Since, the comparison with the Reference Scenario (REF) is often used to illustrate the results, this section starts with a brief presentation of the major transport trends in the Reference Scenario until 2050.
9.3.1 Overview of the Transport Reference Scenario
Figure 9-6 presents the trends for passenger transport. Total demand increases only slightly until about 2035 and then declines due to the demographic development in Europe, i.e. the population decrease, which actually starts more than a decade earlier. It should be noted that air transport only includes intra-European transport, i.e. excludes the fastest growing segment - intercontinental air transport. It can also be observed that road transport will remain the most important mode with a modal share of more than 70 % of all passenger-km (pkm). Air transport shows the strongest increase in modal share, but rail transport also increases its modal share due to the greater availability of high-speed rail connections in the EU. On the other hand, bus transport has a reduced modal share as a result of the demographic development (i.e. fewer children and less demand for transport to education centres), changes in transport behaviour in Eastern Europe (i.e. growing car-ownership and less use of public transport) and changed trends in the older generations (i.e. more retired persons own a car than was the case in the past).
2010 2020 2030 2040 2050
72.9% 73.7% 73.2% 73.2% 72.3%
9.6% 8.2% 7.8% 7.4% 7.2%9.0% 9.0% 9.5% 9.7% 10.4%8.5% 9.0% 9.5% 9.8% 10.1%
EU27 Passenger modal‐splitCar Bus Train Air
0
1,000
2,000
3,000
4,000
5,000
6,000
7,000
8,000
2005 2010 2015 2020 2025 2030 2035 2040 2045 2050
[Bio pkm
]
Transport performance by passenger mode
Air
Train
Bus
Car
Source: Fraunhofer-ISI, ASTRA calculations
Figure 9-6: Development and structure of passenger transport demand in EU27
(Reference Scenario)
The picture for freight transport demand differs significantly as revealed by Figure 9-7 . Total freight transport performance increases by more than 130 % from 2005 until 2050. Heavy

ADAM 2-degree scenario for Europe – policies and impacts
- 209 -
goods vehicles show the strongest growth; their modal share increases by more than 3 %. There is also a slight increase in the modal share of rail freight16 as a consequence of the European railway liberalisation together with the construction of an interconnected European rail network. Short sea shipping suffers a slight loss of its modal share but continues to be one of the two most important freight transport services together with heavy goods vehicles.
2010 2020 2030 2040 2050
22.3% 22.0% 22.1% 22.3% 22.4%
31.0% 31.9% 32.8% 33.8% 34.2%
13.8% 13.7% 13.8% 14.0% 14.3%
32.9% 32.3% 31.3% 29.9% 29.1%
EU27 Freight modal‐split Van Truck Train Ship
0
1,000
2,000
3,000
4,000
5,000
6,000
7,000
8,000
9,000
2005 2010 2015 2020 2025 2030 2035 2040 2045 2050
[Bio tkm
]
Transport performance by freight mode
Ship
Train
Truck
Van
Source: Fraunhofer-ISI, ASTRA calculations
Figure 9-7: Development and structure of freight transport demand in EU27 (Reference
Scenario)
The road vehicle fleet develops roughly in line with the transport demand as can be seen in Figure 9-8. The strongest growth is expected for heavy trucks (HDV) and light trucks (LDV), although improved load factors mean that the fleet does not have to grow as strongly as the transport demand. Compared with 2010, these two fleets increase by about 80 %. Over the same period, the bus fleet is reduced by about 15 % and the car fleet increases by about 30 %, which is stronger than the transport performance and reflects both the reduced annual mileage of cars and the reduction of occupancy rates over time.
The composition of the fleet changes slightly. Due to relatively lower fuel prices and the development of the relevant fuelling station network, CNG cars gain market shares after 2010. The trend towards the dieselisation of cars slows down and gasoline cars increase their market share due to larger efficiency potentials and improvements, particularly in the smaller car categories. Hydrogen does not enter the market, and battery electric vehicles occupy only a small niche market, while advanced plug-in hybrids gain a small market share as do bioethanol (E85) cars.
16 In countries featuring IWW, their performances are aggregated into the rail freight mode as the transport characteristics are similar. Thus about 20 % of the rail freight figures refer to IWW, with a declining share in the future.

Transport Sector
- 210 -
0
20
40
60
80
100
120
140
160
180
200
2002 2010 2018 2026 2034 2042 2050
Inde
x 20
10 = 100
Development of road vehicle fleet in EU27
Car
Bus
HDV
LDV
0
50
100
150
200
250
300
350
2002 2006 2010 2014 2018 2022 2026 2030 2034 2038 2042 2046 2050
Development of EU27 car fleet by engine technology [Mio*cars]
Hydrogen
Electric
Bioethanol
Hybrid
CNG
LPG
Diesel
Gasoline
Source: Fraunhofer-ISI, ASTRA calculations
Figure 9-8: Development of vehicle fleets in EU27 (Reference Scenario)
Figure 9-9 presents the energy consumption of transport by type of fuel and the CO2 emissions by transport mode. It can be observed that both trends are quite stable, which shows that significant efficiency gains are already expected to occur in the Reference Scenario in the transport sector to compensate for the growth in transport demand. The main growth is in freight transport demand so that a shift occurs between freight and passenger energy demand, with freight accounting for 28 % of the energy demand in 2005 and for 40 % in 2050. This means that freight energy demand increases continuously, while passenger energy demand declines after about 2012. These trends can also be observed for fuels, where diesel fuel demand remains more or less stable over the whole period, while gasoline demand is significantly reduced due to efficiency gains of cars and the fuel switch to biofuels and CNG.
Accordingly, the CO2 emissions from cars fall significantly until 2050, while they increase strongly for heavy duty vehicles, and moderately for air, shipping and rail transport. It should be noted once again here that air transport CO2 emissions exclude intercontinental flights.
0
2,000
4,000
6,000
8,000
10,000
12,000
14,000
16,000
18,000
2005 2010 2015 2020 2025 2030 2035 2040 2045 2050
[PJ]
Transport fuel consumption by fuel type in EU27
Diesel
Gasoline
Kerosene
LPG
CNG
Biofuel kerosene
Biodiesel
Bioethanol
Hydrogen
Electric0
200
400
600
800
1,000
1,200
1,400
2005 2010 2015 2020 2025 2030 2035 2040 2045 2050
[Mt CO2/year]
Transport CO2 emissions by mode
Ship
LDV
HDV
Rail
Air
Bus
Car
Source: Fraunhofer-ISI, ASTRA calculations
Figure 9-9: Development of transport energy demand and CO2 emissions (Reference
Scenario)

ADAM 2-degree scenario for Europe – policies and impacts
- 211 -
9.3.2 Transport in the 2°C scenarios
The two variants of the 2°C scenario are assumed to build upon each other. A first set of transport-related policies is implemented in the 450 ppm scenario, and then a second set of policies is introduced in addition to these in the 400 ppm scenario.
Passenger and freight transport react in different ways to the policies. The strongest reaction in passenger transport is in the car fleet, while transport performance is adapted only to limited extent. The composition of the car fleet is tackled by several policies leading to an increase of efficiency and a diffusion of new engine technologies, in particular battery electric vehicles and hydrogen vehicles. As Figure 9-10 illustrates, there are about 20 million battery electric city vehicles in the fleet in 2050 as well as about the same number of hydrogen fuel cell vehicles. All other technologies relinquish some of their market shares. In particular, small gasoline cars are strongly affected as these have to compete with the battery electric vehicles
These new technologies as well as the efficiency gains in conventional cars have the effect of increasing the cost of purchasing a car, but at the same time they significantly reduce its running costs. This results in a rebound effect in the order of 2 to 5 % in terms of car passenger transport performance (see Figure 9-10).
‐50
0
50
100
150
200
250
2010 2020 2030 2040 2050
[Bio pkm
]
Change of car passenger mileageby major European regions
Central‐East
North
South
West
‐60
‐40
‐20
0
20
40
60
2010 2014 2018 2022 2026 2030 2034 2038 2042 2046 2050
Change of EU27 car fleet by engine technology450ppm vs REF scenario[Mio*cars]
Hydrogen
Electric
Bioethanol
Hybrid
CNG
LPG
Diesel
Gasoline
Source: Fraunhofer-ISI, ASTRA calculations
Figure 9-10: Change in car mileage (pkm) and the car fleet in the 450 ppm scenario
The difference in passenger transport in the 400 ppm scenario can be observed in Figure 9-11. The diffusion of new technologies, in particular battery electric vehicles, is reinforced by policies supporting the market entry of electric vehicles and the greater cost of running fossil fuel based cars due to the increase of the CO2 certificate price. As a result, the number of battery electric vehicles reaches about 60 million in 2050, which means that they become the main type of car used in cities. This is further supported, e.g. by zero-emission requirements in cities.

Transport Sector
- 212 -
The increased energy costs resulting from the higher CO2 certificate prices have the effect of reducing and, in the last decade with the highest prices, even avoiding altogether the rebound effect of increased demand due to efficiency gains.
‐60
‐40
‐20
0
20
40
60
80
100
120
2010 2020 2030 2040 2050
[Bio pkm
]
Change of car passenger mileageby major European regions
Central‐East
North
South
West
‐120
‐100
‐80
‐60
‐40
‐20
0
20
40
60
80
100
2010 2014 2018 2022 2026 2030 2034 2038 2042 2046 2050
Change of EU27 car fleet by engine technology400ppm vs REF scenario[Mio*cars]
Hydrogen
Electric
Bioethanol
Hybrid
CNG
LPG
Diesel
Gasoline
Source: Fraunhofer-ISI, ASTRA calculations
Figure 9-11: Change in car mileage (pkm) and the car fleet in the 400 ppm scenario
For freight traffic, the efficiency of trucks and vans also plays a role as do new engine technologies for vans. However, a demand reduction is also expected and observed here . The first but not the most important reason is the slight reduction of GDP compared with the Reference Scenario which has the effect of reducing freight volumes and consequently also performance.
The second reason is the reduction of freight transport distances due to a number of developments driven by non-transport policies and reinforced by the transport policies. The trend of re-urbanisation concentrates both the centres of consumption and the centres of labour supply, which makes these locations also attractive as production sites, such that transport distances are reduced as a side effect. Further, increased energy prices as well as including the cost of CO2 force logistics to improve to avoid unnecessary journeys, e.g. to transhipment points and to select instead either fewer transhipments or closer transhipment points. In total, these effects reduce freight transport performance by close to 20 % in the 450 ppm variant and by about 22 % in the 400 ppm scenario. In the 400 ppm scenario, the increased competitiveness of rail due to infrastructure and organisational improvements leads to an additional modal shift of about 5 % in 2050, which further reduces truck transport performance.

ADAM 2-degree scenario for Europe – policies and impacts
- 213 -
‐
1,000
2,000
3,000
4,000
5,000
6,000
7,000
8,000
9,000
2005
2008
2011
2014
2017
2020
2023
2026
2029
2032
2035
2038
2041
2044
2047
2050
[Bio tkm
]
Change of freight performancein 450ppm scenario
Van reduction
Truck reduction
Ship reduction
Train reduction
Ship
Train
Truck
Van ‐
1,000
2,000
3,000
4,000
5,000
6,000
7,000
8,000
9,000
2005
2008
2011
2014
2017
2020
2023
2026
2029
2032
2035
2038
2041
2044
2047
2050
[Bio tkm
]
Change of freight performancein 400ppm scenario
Van reduction
Truck reduction
Ship reduction
Train increase
Ship
Train
Truck
Van
Source: Fraunhofer-ISI, ASTRA calculations
Figure 9-12: Change of freight performance in the 2°C scenarios
The trends described and the transport sector’s adaptations to them influence both energy demand and CO2 emissions in the transport sector. Table 9-2 presents the total transport energy demand for different regions and Figure 9-13 shows the consumption of different fuels in the 450 ppm scenario. In 2050, transport energy demand will be reduced by -24 % compared with the Reference Scenario and by -27 % compared with 2005. Fossil fuel demand is significantly reduced until 2050, while the demand for biofuels, electricity and hydrogen rises. All fossil fuels are decreased, i.e. diesel, gasoline, kerosene, CNG and LPG, though diesel takes the biggest cut of about 70 % (about 3000 PJ). About 40 % of the reduction is from passenger transport and 60 % from freight transport. However, the timing of reductions differs. Passenger transport responds in a faster manner so that a significant reduction is already achieved by 2020 , while the reductions only become significant for freight transport around 2030. The alternative fuels increase to hold moderate shares in 2050 with about 13 % for biofuels, 4 % for hydrogen and 3 % for electricity.
Table 9-2: Changes of transport energy demand on regional level in the 450 ppm
scenario
[PJ] Reference Scenario 2° Scenario (450 ppm) Changes (450ppm vs. Ref.)
Country group 2010 2020 2050 2010 2020 2050 2010 2020 2050
North 1,232 1,241 1,258 1,206 1,144 1,021 -2% -8% -19%
South 4,325 4,213 3,736 4,184 3,820 2,876 -3% -9% -23%
East 1,413 1,559 1,548 1,377 1,442 1,275 -3% -7% -18%
West 9,537 9,282 8,759 9,208 8,370 6,366 -3% -10% -27%
EU27 15,781 15,579 14,593 15,265 14,114 10,928 -3% -9% -25%
Source: Fraunhofer-ISI, ASTRA calculations

Transport Sector
- 214 -
0
2,000
4,000
6,000
8,000
10,000
12,000
14,000
16,000
18,000
2005 2009 2013 2017 2021 2025 2029 2033 2037 2041 2045 2049
[PJ]
Transport fuel consumption by fuel type
Hydrogen
Electric
Biofuel kerosene
Kerosene
Biodiesel
Bioethanol
LPG
CNG
Gasoline
Diesel
Source: Fraunhofer-ISI, ASTRA calculations
Figure 9-13: Transport fuel consumption by fuel in the 450 ppm scenario in EU27
The CO2 reductions reflect the patterns of energy demand reductions (see Figure 9-14). The largest decrease is observed for heavy duty vehicles. However, car transport contributes about three quarters of the total reductions in 2020 and remains the second most important until 2050. A further significant reduction comes from the efficiency gains of light duty vehicles (LDV) which are stimulated by the CO2 emission limits imposed on LDVs and the diffusion of electric engines into the LDV fleet which are then used for zero emission city goods delivery.
Since, at no point in time do bus, rail, ship and air transport together emit more than 20 % of the total transport CO2 emissions, the CO2 savings from these modes are also smaller than for car and truck transport by one order of magnitude. Thus they are illustrated as a small area in Figure 9-14, contributing altogether less than 4 % of transport CO2 reductions. Partially, their CO2 reductions are compensated by demand growth due to the modal-shift from the road modes towards rail and ships.

ADAM 2-degree scenario for Europe – policies and impacts
- 215 -
Table 9-3: Changes of transport CO2 emissions on regional level in 450 ppm scenario
[Mt CO2 / year] Reference Scenario 2° Scenario (450 ppm) Changes (450ppm vs. Ref.)
Country group 2010 2020 2050 2010 2020 2050 2010 2020 2050
North 105 106 114 103 98 86 -2% -8% -25%
South 335 328 308 324 296 220 -3% -10% -28%
East 109 114 126 106 105 98 -3% -7% -22%
West 751 738 763 726 663 501 -3% -10% -34%
EU27 1,242 1,228 1,250 1,203 1,109 854 -3% -10% -32%
Source: Fraunhofer-ISI, ASTRA calculations
‐450
‐400
‐350
‐300
‐250
‐200
‐150
‐100
‐50
0
50
2005 2010 2015 2020 2025 2030 2035 2040 2045 2050
[Mt C
O2/year]
Change of transport CO2 emissions by modeCar Bus Air Rail HDV LDV Ship
Source: Fraunhofer-ISI, ASTRA calculations
Figure 9-14: Change of CO2 emissions of transport in 450 ppm scenario in EU27
Table 9-4 provides the total transport energy demand and Figure 9-15 the consumption of different fuels in the 400 ppm scenario. In 2050, transport energy demand will be reduced by -42 % compared with the Reference Scenario and by -45 % compared with 2005. Fossil fuel demand is significantly reduced until 2050, while the demand for biofuels, electricity and hydrogen increases. All fossil fuels are decreased, i.e. diesel, gasoline, kerosene, CNG and LPG, although about 65 % (about 5300 PJ) comes from a reduction of diesel. In 2050, about 40 % of the reduction comes from passenger transport and 60 % from freight transport. However, the timing of reductions differs. Passenger transport responds faster so that about

Transport Sector
- 216 -
60 % of reductions are due to passenger transport in 2025, while the reductions in freight transport only kick in after this. The alternative fuels increase to higher shares in 2050 with about 21 % for biofuels, 8 % for electricity and 5 % for hydrogen.
Table 9-4: Changes of transport energy demand on regional level in the 400 ppm
scenario
[PJ] Reference Scenario 2° Scenario (400 ppm) Changes (400ppm vs. Ref.)
Country group 2010 2020 2050 2010 2020 2050 2010 2020 2050
North 1,232 1,241 1,258 1,204 1,060 782 -2% -15% -38%
South 4,325 4,213 3,736 4,177 3,650 2,317 -3% -13% -38%
East 1,413 1,559 1,548 1,373 1,341 990 -3% -14% -36%
West 9,537 9,282 8,759 9,186 7,818 4,705 -4% -16% -46%
EU27 15,781 15,579 14,593 15,231 13,242 8,294 -3% -15% -43%
Source: Fraunhofer-ISI, ASTRA calculations
0
2,000
4,000
6,000
8,000
10,000
12,000
14,000
16,000
18,000
2005 2009 2013 2017 2021 2025 2029 2033 2037 2041 2045 2049
[PJ]
Transport fuel consumption by fuel type
Hydrogen
Electric
Biofuel kerosene
Kerosene
Biodiesel
Bioethanol
LPG
CNG
Gasoline
Diesel
Source: Fraunhofer-ISI, ASTRA calculations
Figure 9-15: Transport fuel consumption by fuel in the 400 ppm scenario in EU27
Figure 9-16 illustrates the changes in transport CO2 emissions in the 400 ppm scenario. Transport reduces its CO2 emissions by -52 % compared with 2005, which means the applied policy programme does achieve a significant reduction , but not sufficient to achieve -80 % GHG emissions by 2050. 70 % of the additional reduction compared with the 450 ppm

ADAM 2-degree scenario for Europe – policies and impacts
- 217 -
scenario is from the freight sector due to the increased use of biofuels, efficiency improvements of HDV and to a large extent from logistics improvements and the modal shift to rail.
In this scenario, air transport also contributes about 7 % reduction compared with the 450 ppm scenario due to the increased use of biofuels and the higher certificate prices added onto the air ticket prices, which reduces demand and gives higher incentives for efficiency improvements in air transport.
Table 9-5: Changes of transport CO2 emissions on regional level in the 400 ppm scenario
[Mt CO2 / year] Reference Scenario 2° Scenario (400 ppm) Changes (400ppm vs. Ref.)
Country group 2010 2020 2050 2010 2020 2050 2010 2020 2050
North 105 106 114 103 90 60 -2% -14% -47%
South 335 328 308 324 281 162 -3% -14% -47%
East 109 114 126 106 97 68 -3% -14% -46%
West 751 738 763 725 613 324 -4% -17% -58%
EU27 1,242 1,228 1,250 1,201 1,031 575 -3% -16% -54%
Source: Fraunhofer-ISI, ASTRA calculations
‐800
‐700
‐600
‐500
‐400
‐300
‐200
‐100
0
2005 2010 2015 2020 2025 2030 2035 2040 2045 2050
[Mt C
O2/year]
Change of transport CO2 emissions by mode
Ship
LDV
HDV
Rail
Air
Bus
Car
Source: Fraunhofer-ISI, ASTRA calculations
Figure 9-16: CO2 emissions of transport in the 400 ppm scenario in EU27
The trends for the car fleet can be observed in Figure 9-17. The number of fossil-based cars remains more or less stable in the 450 ppm scenario and drops in the 400 ppm scenario.

Transport Sector
- 218 -
However, their average efficiency improves by between 30 and 45 % in the different countries until 2050 compared with 2010. In the medium-term, CNG cars gain a market share of up to 10 % since they represent a suitable option to reduce CO2 from transport, can also run on bio-methane and provide a bridge to the hydrogen fuel cell technology that enters the car market in the long term. However, for inner city and short distance transport, it is expected that electric cars, i.e. city cars, will enter the market in the short to medium term and gain a significant market share among the smaller car segments. Bioethanol, LPG and advanced plug-in hybrids remain as niche markets for different reasons. Bioethanol suffers from a shortage of fuel supply since it tends to be blended with gasoline rather than sold as a pure oil (or E85). LPG offers too little savings in terms of CO2 and costs to be really attractive and advanced electric hybrids, i.e. featuring both an electric and a combustion engine, become too heavy and costly and furthermore achieve the highest fuel savings in urban traffic, where they will have to compete with pure electric cars.
The picture is similar for the 400 ppm scenario except that electric cars are even more successful due to more support policies and the higher cost of fossil fuels because of higher certificate prices, with the result that the numbers of fossil-fuelled cars drop over time.
0
50
100
150
200
250
300
350
2006 2010 2030 2050
[Mio vhc]
Car fleet by engine technology in 450 ppm scenario
Hydrogen
Electric
Bioethanol
Hybrid
CNG
LPG
Diesel
Gasoline0
50
100
150
200
250
300
350
2006 2010 2030 2050
[Mio vhc]
Car fleet by engine technology in 400 ppm scenario
Hydrogen
Electric
Bioethanol
Hybrid
CNG
LPG
Diesel
Gasoline
Source: Fraunhofer-ISI, ASTRA calculations
Figure 9-17: Structure of the car fleet in the 450 ppm and 400 ppm scenarios
In contrast to the car fleet, where the number of cars hardly changes across the scenarios, the development of the truck fleet (both LDVs and HDVs) is greatly affected by the policies in the scenarios. Figure 9-18 presents the vehicle stock of trucks in the Reference Scenario and in the two variants of the 2°C scenario. In the Reference Scenario, both truck types increase by about 100 % until 2050 compared with 2006; with a slightly stronger rise in HDVs. In the 450 ppm scenario, road freight performance decreases slightly and a shift occurs from smaller HDVs towards electric LDVs, with the result that the HDV fleet is at a lower level than in the Reference Scenario with an increase of 45 % in 2050. The LDV fleet is about the same in 2050.

ADAM 2-degree scenario for Europe – policies and impacts
- 219 -
In the 400 ppm scenario, there is a more marked reduction in freight performance and the modal shift towards rail and ships is reinforced by their improved competitiveness, so that the HDV fleet in 2050 is about the same as in 2006. LDVs still increase by 70 % compared with 2006, which means the number of LDVs is 30 % smaller than in the Reference Scenario.
0
5
10
15
20
25
30
35
40
45
[]Mio vhc]
Development of truck fleets in scenarios
400ppm LDV
450ppm LDV
Reference LDV
400ppm HDV
450ppm HDV
Reference HDV
Source: Fraunhofer-ISI, ASTRA calculations
Figure 9-18: Impact on truck fleets in the 450 ppm and 400 ppm scenarios in EU27
9.3.3 Mitigation investments in the transport sector
The mitigation policies in the transport sector are influenced by two factors: (1) implementing the policies requires additional investments, which increase the specific cost of transport activities (i.e. the transport cost per pkm or per tkm), and (2) the mitigation policies lead to demand changes and modal shifts which alter the investment patterns of the transport sector. Both investment changes are significant compared with the Reference Scenario and cannot be neglected.
Additional investments are considered for the development of vehicles with higher fuel efficiency, e.g. those required by the CO2 emission limits for cars, LDVs and HDVs. For cars, the detailed cost increases are taken from TNO [2006] and are in the order of a few 100 euros to about 1500 euros added onto the purchase price. For LDVs and HDVs, the maximum cost increase is estimated to be 1500 and 5000 euros per vehicle, respectively, which corresponds to a vehicle price increase of about 5 %. In addition to this, other additional costs have to be considered, for instance for the use of ultra-fluid lubricants which cost 10€ per filling and are required every two years for each car, for the binding use of low resistance tyres for trucks, which are assumed to cost 10 % more than standard tyres and have a 10 % shorter lifetime.

Transport Sector
- 220 -
About 2 billion euros additional investments in rail systems are also required each year in the EU27 to improve the competitiveness of passenger rail by adding 3000 km of high-speed lines (built over 30 years), provide better connections at stations and improve the attractiveness of stations. In addition, the competitiveness of freight rail has to be improved by adding 3000 km of dedicated freight rail track (built over 20 years), eliminating bottlenecks caused either by (1) competition between freight and passenger rail transport or (2) direct capacity limits for rail freight transport (e.g. in seaport-hinterland connections) and implementing additional, multi-modal terminals.
The impact of the demand changes have already been described in the previous section. The car fleet remains more or less the same with only about -1 % reduction in the 2°C scenarios and a moderate downsizing of cars, but the EU27 truck fleet is significantly reduced by -10 % in the 450 ppm scenario and -24 % in the 400 ppm scenario in 2050. In particular, the changes in the truck fleet reduce the investments required for vehicles in the transport sector, although increased demand for rail transport requires increased investments in locomotives and engines. After 2030, a strong reduction of transport-related vehicle investment can be observed.
Figure 9-19 shows the investment increase by mitigation measure, the reduction of transport investment due to demand changes (left-hand side) and the accumulated changes in investment over time (right-hand side). It is clear that the mitigation investments in the 450 ppm scenario occur earlier (between 2015 and 2035, with a peak of €18 billion in 2022), while the peak in the 400 ppm scenario is around 2030 (peaking at €30 billion) and that significant mitigation investments are required to drive down the GHG emissions of transport after this point until 2050.
On the other hand, the adaptations of investment due to changes in transport demand increase continuously following the path of continuously increasing load factors and the modal shift away from roads. They reach a maximum in 2050 with about €-52 billion and €-82 billion in 450 ppm and 400 ppm scenarios, respectively. Looking at the accumulated balance of the investment changes in the 2°C scenarios (right-hand side of Figure 9-19), it is apparent that, until around 2033, additional mitigation investments are required in the transport sector (with a respective peak of €68 billion and €80 billion in the 450 ppm and the 400 ppm scenario). After this point, the accumulated investments in the transport sector are lower than in the Reference Scenario.

ADAM 2-degree scenario for Europe – policies and impacts
- 221 -
‐100,000
‐80,000
‐60,000
‐40,000
‐20,000
0
20,000
40,000
2010 2020 2030 2040 2050
Changes of transport sector investment through mitigation [Million Euro]
Mitigation investment 450ppm
Mitigation investment 400ppm
Demand change investment 450ppm
Demand change investment 400ppm
‐1,000,000
‐800,000
‐600,000
‐400,000
‐200,000
0
200,000
2010 2020 2030 2040 2050
Accumulated changes of transport sector investment through mitigation [Million Euro]
450ppm 400ppm
Source: Fraunhofer-ISI, ASTRA calculations
Figure 9-19: Impact of the 2°C scenarios on transport investment in EU27
Translating the mitigation investments for trucks into an average cost change per tkm, it appears that costs increase moderately during the first two decades by about 1 cent/tkm (or about +8 %). In the long term, road freight transport costs actually decrease by about 3 cent/tkm due to energy and CO2 efficiency improvements.
9.3.4 Impact of policies in the 2°C scenarios
A model-based analysis performed with a simulation model like ASTRA enables simulations of scenarios to be run with and without selected measures (i.e. policies or technological changes). This feature is used in ADAM to run simulations of the 450 ppm and 400 ppm scenarios in which a selected number of measures are excluded (switched-off) from the scenario. We call such a scenario a ‘switch-off scenario’. The results of the 450 ppm switch-off scenarios can be compared with the full implementation of measures in the 450 ppm scenario to identify the impact of individual measures. It should be pointed out that the simulation could be done using a different approach, i.e. by taking the Reference Scenario and adding only one measure to identify its impact. However, the results would not be the same and it is more appropriate to apply the switch-off analysis as the measures then unfold their effects within the frame of interaction with the other measures of this scenario. Further, adding the impacts of all the switch-off analyses together and assuming that there are no synergies between the measures, one should reach the level of indicators (e.g. energy demand) in the Reference Scenario. This is not the case which demonstrates implicitly the existence of synergies between the measures. Accordingly, the switch-off analysis includes one category of impacts which is called synergies.
Since more than 20 measures have been implemented in the transport sector, measures were grouped together to produce a limited number of thematic packages in order to reduce the number of required simulations. The following packages were defined for the switch-off analysis in the 450 ppm scenario:

Transport Sector
- 222 -
• ‘Efficiency package switch-off’ includes CO2 emission limits for cars, CO2 emission limits for LDVs, reactions of truck load factors to fuel cost increase (including CO2 prices of certificates), binding regulation of low resistance lubricants.
• ‘Biofuels package switch-off’ includes biofuels for road transport only as in the Reference Scenario; no biofuels at all for rail or air transport.
• ‘Fuel switch package switch-off’ includes electric car diffusion only as in the Reference Scenario, no hydrogen cars and no hydrogen filling station network, no electric LDVs.
• ‘Demand shift package switch-off’ includes no CO2 efficiency labelling of cars, no inclusion of transport into ETS, i.e. no CO2 costs aggregated into the cost parameters of any of the modes.
Since additional measures were implemented in the 400 ppm scenario, the packages in the switch-off analysis include those listed above plus:
• Efficiency package switch-off also includes no binding regulation for low resistance tyres for trucks, no special training for HDV truck drivers.
• Biofuels package switch-off also includes no increased quotas of biodiesel for road or of biofuel for air transport.
• Fuel switch package switch-off also includes no increased diffusion of electric cars, i.e. diffusion only as in the Reference Scenario.
• Demand shift switch-off package further includes no increased competitiveness of rail due to investment and organisational innovations and thus no modal shift of long distance freight and passenger transport to rail. No inclusion of the higher CO2 cost in transport costs.
Figure 9-20 provides the results of the switch-off analysis for the total energy demand in the 450 ppm and 400 ppm scenarios. The lowest dark area represents the energy demand in the 450 ppm and 400 ppm scenario, respectively. Each switch-off element increases the energy demand towards the level of the Reference Scenario, which is represented by the upper curve of the topmost area (the synergies area). Looking at the 450 ppm scenario (left-hand side), one can observe two key features of the switch-off packages: (1) the order of magnitude in relation to each other, and (2) the time profile of package impacts.
In the 450 ppm scenario, the most effective element is the efficiency package, i.e. in particular, the CO2 emission limits for cars and light duty vehicles. Such a binding regulation is not only effective, but also provides the framework for a competitive market to develop efficient vehicles. In other words, (1) it provides certainty for the investment decisions of vehicle manufacturers (they can be certain they have to develop efficient cars and will not lose any R&D investments in efficiency improvements), and (2) the free-rider argument does

ADAM 2-degree scenario for Europe – policies and impacts
- 223 -
not hold anymore, i.e. the argument that a manufacturer is not able to develop efficient cars even though they might want to because their competitors are continuing to sell high-powered, fast cars which would sell better than fuel-efficient ones (at least in the past).
In the medium to long run, the fuel-switch, i.e. the market penetration of electric cars and vans as well as hydrogen cars plays the second most important role. Here, it has to be taken into account that only moderate market penetration is achieved in this scenario and that the energy savings are proportional to the market shares gained by these new technologies. The demand shift plays a limited role as labelling only has a potential of 2-4 % savings, and including the transport sector in the ETS with certificate prices of up to 80€/t CO2 only increases the fuel cost for diesel or gasoline by about +10 % and by about +20 % for kerosene, because no other taxes are added here. Further, fuel costs play the largest role for air transport compared with the other modes. Accordingly, air transport experiences the highest impact of -5 % reduction of passenger performance.
Biofuels only have a very limited effect on energy demand as they mainly replace one type of primary energy input (i.e. fossil fuels) by a similar type of input (i.e. bioethanol or biodiesel). A more important role can be observed for the synergies in the medium to long term. The causes of synergies are difficult to identify analytically. One reason may be that the modal shift is augmented by adding different policies, e.g. the diffusion of electric engines reduces energy demand and leads to a new modal split between modes as well as between car engines. This is also affected when the cost of CO2 certificates are added onto fossil fuels, such that fewer gasoline and diesel cars are bought and more electric cars, which then further reduces the energy demand compared with the efficiency package switch-off and thus constitutes one of the reasons for synergies. In 2050, the synergies are nearly equally as important as the efficiency and the fuel switch packages.
Looking at the 400 ppm scenario, two major changes can be observed. The demand shift plays a much larger role than in the less ambitious 450 ppm scenario and in the long run actually delivers the largest contribution to energy saving. This has two explanations: First, investments in and organisational improvements of rail transport increase its competitiveness significantly. Second, the higher CO2 price of up to 200 €/t CO2 increases kerosene price by close to 50 % such that, e.g. air transport suffers a loss of more than 20 % of demand compared with the Reference Scenario.
A similar large contribution to the reductions is made by the synergies, which also enfold over the medium to long term. The contribution of the efficiency measures increases by about one third compared with the 450 ppm scenario.

Transport Sector
- 224 -
0
2,000
4,000
6,000
8,000
10,000
12,000
14,000
16,000
18,000
2005
2008
2011
2014
2017
2020
2023
2026
2029
2032
2035
2038
2041
2044
2047
2050
[PJ]
Contributions to changes of energy demandin 450 ppm scenario
Synergies
Off demand shift
Off fuel switch
Off efficiency
Off biofuels
Full 450ppm
0
2,000
4,000
6,000
8,000
10,000
12,000
14,000
16,000
18,000
2005
2008
2011
2014
2017
2020
2023
2026
2029
2032
2035
2038
2041
2044
2047
2050
[PJ]
Contributions to changes of energy demandin 400 ppm scenario
Synergies
Off demand shift
Off fuel switch
Off efficiency
Off biofuels
Full 400ppm
Source: Fraunhofer-ISI, ASTRA calculations
Figure 9-20: Switch-off impacts on energy demand in the 450 ppm and 400 ppm scenarios
Figure 9-21 shows the energy demand impacts for freight transport based on the approach explained above. First, it should be noted that the 450 ppm scenario enables to shift freight energy demand from a growth path to a stable path. In the 450 ppm scenario, again efficiency measures make the largest contribution. The impact of any other measure only unfolds in the medium to long term showing that fuel switching, i.e. the introduction of electric LDVs, plays a significant role, while demand shift and biofuels have almost no impact on energy demand of freight transport.
In the 400 ppm scenario, freight energy demand is also reduced by -43 % compared with 2005, i.e. freight energy demand is also put on a declining path. This is achieved by increased efficiency measures which now also address HDV freight transport and thus nearly double the efficiency savings of freight transport in 2030 (medium term). In the long term, the modal shift towards rail freight and shipping plays an even larger role than efficiency measures, which was also observed for the whole transport sector above. This confirms once again that aligned push-pull strategies are needed to shape transport in a climate-friendly manner. In this case. the pull strategy is the improved competitiveness of rail and the push strategy comprises higher CO2 prices and the higher relative energy demand per unit of truck transport compared with rail. Also, as observed above, synergies play a large role, particularly when demand shift measures already contribute a significant share of energy demand reductions.

ADAM 2-degree scenario for Europe – policies and impacts
- 225 -
0
1,000
2,000
3,000
4,000
5,000
6,000
7,000
2005
2008
2011
2014
2017
2020
2023
2026
2029
2032
2035
2038
2041
2044
2047
2050
[PJ]
Contributions to changes of freight energy demandin 450 ppm scenario
Synergies
Off demand shift
Off fuel switch
Off efficiency
Off biofuels
Full 450ppm
0
1,000
2,000
3,000
4,000
5,000
6,000
7,000
2005
2008
2011
2014
2017
2020
2023
2026
2029
2032
2035
2038
2041
2044
2047
2050
[PJ]
Contributions to changes of freight energy demandin 400 ppm scenario
Synergies
Off demand shift
Off fuel switch
Off efficiency
Off biofuels
Full 400ppm
Source: Fraunhofer-ISI, ASTRA calculations
Figure 9-21: Switch-off impacts on freight energy demand in the 450 ppm and 400 ppm
scenarios
Figure 9-22 presents the corresponding figures for the switch-off analysis of passenger transport. Since passenger transport in the Reference Scenario already includes efficiency gains that, together with a stable demand, generate a declining energy demand path, the further reductions of passenger energy demand are smaller than for freight. Efficiency and demand shift play the largest role in passenger transport. The demand shift reduces the share of air transport and to lesser extent also car transport and increases the shares of slow modes, train and bus transport.
In the 400 ppm scenario, the demand shift becomes even more relevant as air transport has to bear the highest cost impacts of the CO2 certificate prices and rail transport benefits from infrastructure and organizational improvements and increases its competitiveness and thus its modal share. Again, synergies are important as is a higher significance of the demand shift in generating energy reductions.
0
2,000
4,000
6,000
8,000
10,000
12,000
2005
2008
2011
2014
2017
2020
2023
2026
2029
2032
2035
2038
2041
2044
2047
2050
[PJ]
Contributions to changes of passenger energy demand in 450 ppm scenario
Synergies
Off demand shift
Off fuel switch
Off efficiency
Off biofuels
Full 450ppm
0
2,000
4,000
6,000
8,000
10,000
12,000
2005
2008
2011
2014
2017
2020
2023
2026
2029
2032
2035
2038
2041
2044
2047
2050
[PJ]
Contributions to changes of passenger energy demand in 400 ppm scenario
Synergies
Off demand shift
Off fuel switch
Off efficiency
Off biofuels
Full 400ppm
Source: Fraunhofer-ISI, ASTRA calculations
Figure 9-22: Switch-off impacts on passenger energy demand in the 450 ppm and 400 ppm
scenarios

Transport Sector
- 226 -
Figure 9-23 presents the results of the switch-off analysis for the transport CO2 emissions. In general, they confirm the results of the energy-related analysis above. Two major differences concern the fact (1) that biofuels actually contribute to CO2 savings, and (2) that the fuel switch plays a larger role than it does for energy demand.
In both cases, one should mention the specifications under which the CO2 emissions were calculated in the ASTRA model.17 The CO2 emission savings are not estimated considering different pathways for their production, but are considered as average savings of CO2 per unit of fuel. This average saving starts at about 50 % and rises to 65 % in 2050 for bioethanol, which is optimistic for the first decade and rather pessimistic for the medium- to long-term future, which could see the use of second (e.g. straw and use of residues and whole plants) and even third generation biofuels (e.g. algae fed by CO2) so that the CO2 savings from biofuels could be even higher in the medium and long run than shown in the figures.
In the case of fuel switching, one has to note that the figures show the tank-to-wheel emissions (TTW). That is, for electricity and hydrogen, the CO2 emissions are calculated as zero. ASTRA also estimates the upstream emissions (well-to-tank) of these fuels. The figures show that about two thirds of the area shown constitute actual CO2 savings for fuel switching, while about one third is generated upstream.
0
200
400
600
800
1,000
1,200
1,400
2005
2008
2011
2014
2017
2020
2023
2026
2029
2032
2035
2038
2041
2044
2047
2050
[Mt CO
2/year]
Contributions to changes of CO2 emissions (TTW)in 450 ppm scenario
Synergies
Off demand shift
Off fuel switch
Off efficiency
Off biofuels
Full 450ppm
0
200
400
600
800
1,000
1,200
1,400
2005
2008
2011
2014
2017
2020
2023
2026
2029
2032
2035
2038
2041
2044
2047
2050
[Mt CO
2/year]
Contributions to changes of CO2 emissions (TTW)in 400 ppm scenario
Synergies
Off demand shift
Off fuel switch
Off efficiency
Off biofuels
Full 400ppm
Source: Fraunhofer-ISI, ASTRA calculations
Figure 9-23: Switch-off impacts on transport CO2 emissions in the 450 ppm and 400 ppm
scenarios
17 The main results concerning CO2 savings in our work came from the EuroMM model in the conversion sector, which aggregates all the energy demands and considers the different production pathways, e.g. for biofuels. However, for the detailed transport analyses, the internal ASTRA results have to be taken since the described switch-off simulations were only performed with the ASTRA model.
ADAM 2-degree scenario for Europe – policies and impacts
- 227 -
9.4 Conclusions about policies to achieve changes in transport sector
Including transport in the EU-ETS is not sufficient to transform it into a low carbon and climate-friendly activity. The time scales of market-based choices (one to four years), to which an ETS system belongs, are too short to introduce the required changes of technologies, organisations and behaviour and the time lag between adapted choices and their impacts on GHG emissions is often too large so that new choices have to be anticipated years or even decades before they become effective in reducing the GHG emissions of transport. Thus besides including transport in the EU-ETS, a package of transport-focussed policy measures has to be implemented, including regulation, taxation, R&D support and information campaigns. One main issue is that policy-makers have to make it very clear to decision-makers in companies and households that climate protection policies in the transport sector are not a short-term policy fashion, but will be pursued forcefully and over the medium and long term.
The 2°C scenario results of implementing 22 different measures for transport have shown that transport energy demand can be reduced by -27 % and -45 % in the 450 ppm and the 400 ppm scenarios, respectively, until 2050 compared with 2005and that this can feasibly be done with still moderate policy packages,. In terms of transport CO2 emissions reductions until 2050, this is equivalent to CO2 reductions of -30 % and -52 % compared with 2005.
The impact analysis of the different measures’ contributions to reductions has revealed that, in the short to medium term (3 to 20 years), energy efficiency measures contribute the largest reductions. In particular, CO2 emission limits for cars and light duty vehicles play a large role in reducing the energy demand and CO2 emissions of transport. As a side-effect, they also reduce the dependency on fossil fuels, which could already become an important issue within this time horizon.
In the medium- to long-term perspective (20 to 40 years), two other measures play a larger role. These are the fuel switch (i.e. the introduction of electric vehicles and hydrogen fuel cell vehicles into transport) and the demand shift (i.e. improved logistics and competitiveness of rail as well as including transport in an ETS system with CO2 certificate prices well above 100 €/t CO2). Both need strong political support, the former via the support of R&D and early market diffusion (e.g. feebates) and the latter by supporting the creation of an interoperable European rail network featuring a backbone of high-speed rail for passenger and dedicated freight links at bottlenecks together with improvements of intermodal logistics as well as including transport in a global CO2 ETS system.
Considering that the emerging policy objective is to reduce GHG emissions by -80 % by 2050, it seems that our estimated reductions of transport emissions would still fall short compared with what is needed for climate protection. However, there are both some supporting trends of CO2 reductions not fully operationalized in our analysis and other

Transport Sector
- 228 -
additional policies that could be realised to achieve the climate policy target. As a first trend, re-urbanisation should be mentioned. Cities are becoming greener with many attractions in terms of culture, education, childcare and healthcare services so that a growing number of people will move back into cities from the suburbs or even rural areas. Since cities are able to offer more carbon lean transport than suburbs or rural areas, this trend will help to reduce CO2 emissions from transport. Of course, this also needs support in the sense that cities have to promote multi-modality, i.e. increased use of bikes, bike- and car-sharing systems, the latter ideally based on a fleet of highly efficient conventional or electric city cars and both combined with a comfortable and reliable public transport system. It must be possible to use all of these transport options with just one mobility card. If necessary, e.g. to fund the set-up of such a system and to add a push measure, city tolls should be considered to reflect the scarcity of infrastructure and urban space as well as clean urban air.
In addition, a number of soft factors also play a role. One example is the advertising strategies of European car manufacturers who tend to invest more in advertising fast, powerful cars than they do in adverts for fuel-efficient small and midsize cars [DENA 2009]. If this past trend also reflects the future development strategy of European car manufacturers, they run the risk of losing the market segment of fuel-efficient cars to Asian manufacturers, who have clearly defined the small, efficient and still affordable car as their main development goal. Given the constraints of limited fossil fuel resources and the need for climate protection, this represents precisely the car market segment with the − largest demand in the future, while continuing to pursue the strategy of horsepower and speed will lead European manufacturers directly into a blind alley.

ADAM 2-degree scenario for Europe – policies and impacts
- 229 -
10 Renewables sector in Europe
10.1 Target of the analysis
Primary energy conversion based on renewable energy sources (RES) is projected by different models up to the year 2050. The agent-based simulation model PowerACE-ResInvest covers the projection of grid-connected energy conversion plants using renewable energy sources (pure electricity generation, CHP and biomass district heating plants). As opposed to conventional approaches based on equilibrium or optimisation models, agent-based simulation (ABS) takes into consideration market imperfections, e.g. strategic behaviour, asymmetric information and non-economic influences (cf. Gilbert 2007; Weiss 2000; Wooldridge 2005). It investigates macro-level issues in a bottom-up approach by analysing interactions on the micro-level (Ma, Nakamori 2005). These interactions on the micro-level comprise the decentralised decisions of and interactions between heterogeneous actors or agents in a system (Janssen, Ostrom 2006).
PowerACE-ResInvest covers the EU as a whole and focuses on the simulation of potential RET-pathways including centralised installations up to 2050. The central concept of PowerACE-ResInvest consists in individual investment decisions for RET-projects from an investor's perspective. That is, the investor calculates the expected net present value of a potential project taking into account dynamic cost-resource curves and existing financial policy support. Investment decisions are based on the financial premiums available for RET and the techno-economic characteristics of RETs. Main characteristics include the available resource potential and the corresponding energy conversion costs, or by the technology-specific cost-resource-curves. In the case of wind onshore, detailed cost-resource curves have been derived, which combine land availability and wind regimes in a geographical information system (see Held et al. 2008). Technology learning is modelled endogenously within the model based on the experience curve concept. The model focuses on the development of RET-options in the EU and does not take into account possible imports of green electricity from other countries such as electricity imports from concentrating solar power in North Africa.
This chapter provides a comparison of the model runs of the 2° Scenario with results from the Base Case. As the share of renewables in the electricity mix already reaches very high levels in case of the 450ppm Scenario, we assumed no further increase in case of the 400ppm Scenario. Thus, only one climate mitigation scenario is described subsequently. For a description of the detailed scenario assumptions of the Base Case Scenario for renewables, the reader is referred to Jochem et al. (2007). Details about the future development of renewable

Renewables Sector
- 230 -
energy sources in case of climate change adaptation can be found in (Reiter et al. 2009; Jochem et al., 2008).
In contrast, the development of non-grid connected heat production (geothermal heat pumps and solar thermal collectors) is projected by the demand-driven final energy models SERVE, RESIDENT, ASTRA, and ISI-INDUSTRY for the corresponding final energy sectors (see Chapter 6, 7, 8 and 9). Non-grid based heat production using wood fuel is handled by MATEFF (see section 5).
10.2 Basic assumptions on technologies
The basic assumptions for renewable conversion technologies in the 2° Scenario are similar to those undertaken within the Base Case and the Reference Scenario. Techno-economic data of the technologies (see Table 10-1), the status quo of RES-E in 2005 remain completely the same (see Jochem et al. 2007).
10.3 The potential contribution of renewable energy sources to mitigating climate change in centralised installations
10.3.1 Assumptions for electricity generation by renewables - 2° Scenario
As the possible use of RET depends in particular on the available resources and the associated costs renewable energy potentials have been assessed in a very detailed manner (see Table 10-2). Thereby, all potentials have been assessed in a bottom-up procedure using country specific assumptions, e.g. on agricultural land availability, shares of landfill, land availability for PV or solar thermal electricity generation. The potentials for wind onshore are based on a geographical information system (GIS) assessment. The resulting geographically explicit full-load hours for wind onshore represent one of the main determinants of wind power economics.

ADAM 2-degree scenario for Europe – policies and impacts
- 231 -
Table 10-1: Technical and economic characteristics of RET in 2005
Technology Plant specification Investment O&M costs Electric
efficiency Heat efficiency
Life-time
Typical plant size
Units [€/kWel] [€/ (kWel*yr.)] [-] [-] [years] [MWel]
Biogas
Agricultural biogas plant 2,550 - 4,290 115 – 140 0.28 - 0.34 - 25 0.1 - 0.5
Agricultural biogas plant – CHP
2,760 - 4,500 120 – 145 0.27 - 0.33 0.55 - 0.59 25 0.1 - 0.5
Landfill gas plant 1,280 - 1,840 50 – 80 0.32 - 0.36 - 25 0.75 – 8
Landfill gas plant – CHP 1,430 - 1,990 55 – 85 0.31 - 0.35 0.5 - 0.54 25 0.75 – 8
Sewage gas plant 2,300 - 3,400 115 – 165 0.28 - 0.32 - 25 0.1 - 0.6
Sewage gas plant – CHP 2,400 - 3,550 125 – 175 0.26 - 0.3 0.54 - 0.58 25 0.1 - 0.6
Biomass
Biomass plant 2,225 - 2,530 75 – 135 0.26 - 0.3 - 30 1 – 25
Co-firing 550 60 0.37 - 30 -
Biomass plant – CHP 2,600 - 4,230 80 – 165 0.22 - 0.27 0.63 - 0.66 30 1 – 25
Co-firing – CHP 550 60 0.2 0.6 30 -
Biowaste
Incineration plant 4,300 - 5,820 90 – 165 0.18 - 0.22 - 30 2 – 50
Incineration plant – CHP 4,600 - 6,130 100 – 185 0.14 - 0.16 0.64 - 0.66 30 2 – 50
Geothermal electricity 2,000 - 3,500 100 – 170 0.11 - 0.14 - 30 2 – 50
Hydro large-scale 850 - 5,950 35 - - 50 20 – 250
Hydro small-scale 800 - 6,050 40 - - 50 0.25 – 10
Photovoltaics 4,000 - 6,100 38 – 47 - - 25 0.005 - 0.05
Solar thermal electricity 2,880 - 4,465 163 – 228 0.33 - 0.38 - 30 2 – 50
Tidal energy 2,670 - 3,025 44 – 53 - - 25 0.5 – 2
Wave energy 2,135 - 2,850 44 – 53 - - 25 0.5 – 2
Wind onshore 890 - 1,100 33 – 40 - - 20 2
Wind offshore 1,590 - 2,070 55 – 68 - - 20 5
Source: (Ragwitz, Resch 2006). In case of PV: (Staiß 2007)

Renewables Sector
- 232 -
Table 10-2: Technical potentials for renewable energies generating electricity, EU27, 2°
Scenario, 2050
Electricity Generation Potential [PJ]
Primary Energy
Potentials18 [PJ]
Wind Solar Geothermal (hydrothermal) Hydro Wave
&Tide Total
(excl. BM) Biomass
Austria 35 94 0 157 0 287 305
Belgium 107 56 0 1 1 164 105
Luxembourg 4 6 0 0 0 11 5
Bulgaria 26 122 5 46 3 203 240
Cyprus 7 12 0 0 1 20 12
Malta 1 7 0 0 0 8 1
Slovenia 2 20 0 30 0 52 108
Czech Republic 196 105 0 11 0 312 184
Germany 746 544 0 91 28 1,408 1,605
Denmark 661 60 0 0 9 730 171
Estonia 132 23 0 0 4 160 98
Latvia 98 50 0 15 2 165 153
Lithuania 31 69 0 3 1 104 274
Spain 893 954 0 138 48 2,033 891
Finland 229 48 0 56 6 339 491
France 1,420 795 1 213 47 2,476 1,566
Greece 89 149 1 24 14 277 188
Hungary 11 158 0 5 0 174 212
Ireland 674 77 0 3 14 769 53
Italy 209 650 6 177 12 1,055 775
Netherlands 254 83 0 0 4 341 128
Poland 385 415 0 11 4 815 1,252
Portugal 309 169 1 34 27 539 212
Romania 49 395 0 94 2 541 302
Sweden 1,253 73 0 274 11 1,611 638
Slovakia 21 63 0 20 0 104 146
United Kingdom 2,144 418 0 19 212 2,792 874
EU-27 9,987 5,616 14 1,426 448 17,491 10,990
Source: Own calculations and estimations, partially based on European Environment Agency (2006); Ragwitz
et al. (2006)
As an overall framework to define and analyse the climate change mitigation scenario we base our calculations on the emission cap derived from the global Poles model. Since CO2
18 The biomass primary energy potential includes the potential for grid-connected energy conversion plants (pure electricity generation plants, CHP plants and district heating plants). The potential for non-grid connected heat production based on biomass is excluded in this table, but has been considered separately in Chapter 6 in the final energy sectors.

ADAM 2-degree scenario for Europe – policies and impacts
- 233 -
emissions and their impact on the global mean temperature are locally independent, this link to the Poles model is needed to achieve reliable estimates for total CO2 emissions which are allowed for Europe. With the given emission cap, we can estimate the measures and costs which are necessary in Europe to transform the energy sector. Some of the necessary reductions in CO2 emissions are achieved in the final energy demand sectors. As we use the energy demand in terms of exogenous model input, we focus on policies implemented in the renewable sector. Policies applied to achieve reductions in energy demand are described in more detail in Chapter 6 - 9.
With regard to the renewables sector, we assume the application of reinforced policy measures compared to those active in the baseline scenario. In this way, we calculated a hypothetical financial support value reflecting the economic value of CO2 that can be avoided by the use of low-carbon technologies using two iterations.
For this purpose we calculated the current average CO2 emissions per unit of electricity generated for the current electricity mix at country level in a first step. We assumed that this value corresponds to the amount of CO2 emissions that can be avoided by the use of RES as a first estimation. Multiplied with the CO2 price, which has been taken from POLES, we obtained a first estimation of the potential benefit of using RES regarding their potential CO2 avoidance. Since a first comparison of these CO2 prices with the results from EuroMM showed significantly lower CO2 prices, we decided to use 60% of the certificate price identified by POLES (see section 12.1 for further explanations). Finally, the economic value of CO2 avoidance is added to the wholesale electricity price and results in the total remuneration level available for RES in the electricity sector (RES-E). Since the electricity mix was assumed to be constant, this iteration represents a static calculation.
The second iteration estimates the same value in a dynamic way. Thereby, the results of PowerACE-ResInvest are integrated into a first EuroMM run. Based on these results, we recalculated the value of avoided CO2, but this time based on the conventional power capacity displaced by RES. The final value of avoided CO2 shows (see Figure 10-1) that this value differs on a national basis. Starting in 2040 it amounts to 0 in some countries (AT, FR), as no conventional electric power with relevant CO2 emissions is replaced by RES. The CO2 price marks the maximum limit for this value. As long as the value of avoided CO2 does not allow for a sufficient remuneration level for profitable investments in renewables, the financial support as described in the baseline scenario is available. Once the remuneration from the value of avoided CO2 and the electricity price exceeds the feed-in tariffs in place, potential investors tend to choose the support option with a higher remuneration level. If no financial support is available for a certain technology in a country, the wholesale electricity price (excl. taxes) represents the possible turnover per unit of electricity generated.

Renewables Sector
- 234 -
0
20
40
60
80
100
120
140
2005 2010 2015 2020 2025 2030 2035 2040 2045 2050
Value of avoided
CO2and CO
2‐Price
[€/M
Wh]
AT BE BG CY CZ DE DKEE ES FI FR GR HU IEIT LA LT LU MT NL PLPT RO SE SI SK UK CO2‐Price
Figure 10-1: Value of avoided CO2 and reference CO2 price
Electricity demand data forecasted by the different bottom-up models calculating sectoral electricity demand (see Chapter 6 - 9) have been used by the PowerAce-ResInvest model in this chapter.
10.3.2 Results for electricity generation by renewables in Europe – Base Case Scenario and 2° Scenario 2000 to 2050
Given the implementation of technology-specific support policies and the support resulting from the CO2 value, we expect an increase in renewable based electricity generation from 488 TWh to 2,222 TWh by 2050 under 2° Scenario assumptions (see Figure 10-2). At a first glance, the total growth rate of roughly 350 % indicates a substantial growth of the use of RES, but taking into account the long-term horizon of 45 years, the annual growth on average of 3.4 % shows that the increase still remains at a reasonable level. Comparing the evolution of renewable technologies in both scenarios, it becomes clear that total RES-E generation in the 2° Scenario exceeds total renewable electricity production in the Base Case by 60 % by mid-century.

ADAM 2-degree scenario for Europe – policies and impacts
- 235 -
0
0.5
1
1.5
2
2.5
2000 2005 2010 2020 2030 2040 2050
2° Scenario
Geothermal Biowaste Ocean Solar Biogas Solid Biomass Hydro Wind
0
0.5
1
1.5
2
2.5
2000 2005 2010 2020 2030 2040 2050
Ele
ctric
ity G
ener
atio
n [P
Wh]
Base Case Scenario
Source: PowerACE-ResInvest, own calculations
Figure 10-2: Electricity generation based on renewables, EU27 and Base Case Scenario
(left figure) and 2° Scenario (right figure), 2000 to 2050
The deployment of RES-E technologies appears to accelerate earlier in the 2° Scenario than compared to the Base Case. Thus, total electricity production from wind by 2020 is 150 % higher than in the Base Case. Later on wind energy development accelerates also in the Base Case Scenario (see Table 10-3). Assuming 2° Scenario conditions, wind energy takes over the dominant role of hydropower in 2017 and contributes almost half of total renewable electricity generation (49 %) by 2050. Since the potential for hydropower has nearly been fully exploited, this technology only shows moderate growth until 2050 in both scenarios. In contrast, wind energy shows a substantial development in particular in the 2° Scenario.
Table 10-3: Overview of electricity generation based on renewable energies, in TWh,
EU27 total, Base Case Scenario and 2° Scenario, 2005 – 2050
Electricity generation [TWh]
Historic Base Case Scenario 2° Scenario Changes
(2° against Base Case Scenario)
2005 2020 2050 2020 2050 2020 2050
Wind 71 206 645 516 1,093 +150% +70% Hydro 336 374 396 405 420 +8% +6% Solid Biomass 49 93 103 144 224 +56% +117% Biogas 15 44 93 103 157 +131% +70% Solar 1 25 78 36 203 +44% +159% Ocean 0 3 36 30 85 +860% +137% Biowaste 10 25 29 27 30 +8% +4% Geothermal 5 8 8 9 9 +14% +18% RES-E total 488 779 1,388 1,270 2,222 +63% +60%
Source: PowerACE-ResInvest, own calculations

Renewables Sector
- 236 -
According to our modelling results, 87 % of total wind energy generation comes from onshore wind power plants assuming 2° Scenario conditions. The share of biomass technologies including solid biomass, biowaste and biogas in total renewables will increase from 15 % in 2005 to 19 % in 2050, allowing a growth of 338 TWh from 74 TWh annual electricity production in 2005 to 411 TWh by 2050, given that enhanced climate policies are active (see Table 10-3). In the 2° Scenario electricity generation from solar energy increases from 1 TWh in 2005 to 203 TWh by 2050. Thereby, 67 % of total solar electricity generation in 2050 is provided on the basis of photovoltaics technology. The remaining 33 % is generated by means of solar thermal power plants in southern Europe.
Table 10-4: Electricity generation based on renewable energies, in TWh, EU27, Base Case
Scenario and 2° Scenario, 2005 to 2050
Electricity generation [TWh]
Historic Base Case Scenario 2° Scenario Changes
(2° against Base Case Scenario)
2005 2020 2050 2020 2050 2020 2050 Austria 40 47 53 56 57 19% 7% Belgium 2 8 18 11 21 43% 18% Bulgaria 4 7 9 12 26 59% 184% Cyprus 0 0 1 1 2 230% 374% Czech Republic 3 9 23 16 43 85% 88% Germany 62 106 135 153 298 44% 121% Denmark 10 21 32 27 32 30% 0% Estonia 0 2 8 5 8 159% 7% Spain 58 92 138 216 272 134% 97% Finland 23 28 32 35 64 28% 96% France 69 98 217 133 357 35% 64% Greece 7 15 32 27 51 74% 60% Hungary 2 4 7 10 17 127% 133% Ireland 2 8 22 20 24 147% 6% Italy 48 80 121 118 184 48% 53% Latvia 3 4 9 7 8 66% -10% Lithuania 0 1 4 6 10 336% 140% Luxembourg 0 0 1 1 1 186% 65% Malta 0 0 0 0 0 443% 156% Netherlands 8 12 37 30 56 144% 52% Poland 4 15 36 37 112 155% 213% Portugal 15 28 40 55 55 96% 38% Romania 20 25 34 38 49 53% 47% Sweden 82 91 121 110 149 21% 23% Slovenia 4 9 9 10 12 10% 28% Slovakia 5 6 8 10 17 53% 116% United Kingdom 17 61 243 127 298 108% 23% EU 27 488 779 1,388 1,270 2,222 +63% +60%
Source: PowerAce-ResInvest, own calculations

ADAM 2-degree scenario for Europe – policies and impacts
- 237 -
Looking at the countries’ contribution to European RES-E production, the large European countries make the most substantial contributions to the entire EU electricity supply based on renewables. Thus, most of the total renewable electricity generation in EU27 will be generated in France (16 % of total renewable electricity generation in the EU), the United Kingdom and Germany (13 % each), Spain (12%) and Italy (8 %) followed by Sweden (8 %) and Poland (7 %).
The following sections comment briefly on the development of each renewable energy generating electricity in terms of its development for each Member State and the EU27.
10.3.2.1 Wind onshore
The increase in wind electricity generation on land under the 2° Scenario is considerable stronger than in the Base Case and the Reference Scenario level (see Figure 10-3). Total annual electricity generation from wind onshore plants amounts to 912 TWh by 2050, exceeding the wind electricity generation in the Reference and in the Base Case Scenario by 75 %. This development shows that the implementation of adequate support policies for wind energy allows for considerably stronger market development. However, some countries with a high initial share of wind energy in the overall portfolio, such as Germany and Spain, show a saturation of the market. In Germany the construction of wind power plants on land appears to reach its potential limits, whereas in Spain the additional construction of wind power plants is not hampered by potential limitations, but rather by a too high share of fluctuating renewable energy sources in the electricity system. In contrast, other countries like France and the UK with a low initial share of wind power in their technology portfolio, have a substantial potential for the use of wind onshore power plants and owing to favourable policy measures they will catch up and may become the largest producers of wind power by the year 2050. Depending on the wind regime of the site, average electricity generation costs of the plants installed in the five largest wind power countries (UK, FR, ES, SE, DE) during the time horizon from 2005 to 2050 range from 39 €/MWh in the UK to 72 €/MWh in Germany. Comparing the electricity generation costs with a range of electricity prices between 47 €/MWh in France and 87 €/MWh in Germany, it becomes clear that wind electricity generation costs will be competitive with conventional conversion technologies by 2050. In general, the development of the average electricity generation costs of wind onshore electricity is affected by two opposing effects. First, technological learning involves decreasing investments and electricity generation costs and second, the depletion of areas with good wind resources implies rising electricity generation costs.

Renewables Sector
- 238 -
DE
ES
FR
SEUK
0100200300400500600700800900
1000
Elec
trici
ty G
ener
atio
n [T
Wh]
2 Scenario
AT BE BG CY CZ DE DK EE ES FI FR GR HU IEIT LA LT LU MT NL PL PT RO SE SI SK UK
0100200300400500600700800900
1000
2000
2005
2010
2015
2020
2025
2030
2035
2040
2045
2050
Base Case Scenario
Source: PowerACE-ResInvest, own calculations
Figure 10-3: Electricity generation based on wind onshore, EU27, Base Case and 2°
Scenario, 2000 to 2050
10.3.2.2 Wind offshore
Due to existing problems with wind power installations on sea (i.e. technical problems concerning foundation, grid integration, problems with obtaining permits), current wind offshore development lags somewhat behind expectations. The future progress of this technology therefore depends on whether and when the currently existing technical and administrative barriers can or may be overcome. As there is clearly less experience with commercial applications of wind offshore plants than with wind power plants on land, the modelling of the future development of this technology involves higher uncertainties. One possible pathway of an enhanced offshore development under the 2° Scenario is shown in Figure 10-4. Assuming the reinforced implementation of policy support measures, total wind offshore electricity generation by 2050 exceeds the corresponding generation in the Base Case Scenario by 45 % and amounts to 182 TWh in absolute terms. However, Figure 10-4 shows a moderate development of wind offshore plants up to 2010 and continues with stronger growth from then on. Owing to the existing technical potentials and the policy support offered in particular countries, Germany, the United Kingdom and France will be the largest contributors of wind offshore energy in mid-century, producing 63 TWh (DE), 25 TWh (UK) and 18 TWh (FR) of electricity by 2050.

ADAM 2-degree scenario for Europe – policies and impacts
- 239 -
DE
FR
ITNL
UK
020406080
100120140160180200
Elec
trici
ty G
ener
atio
n [T
Wh]
2 Scenario
AT BE BG CY CZ DE DK EE ES FI FR GR HU IEIT LA LT LU MT NL PL PT RO SE SI SK UK
020406080
100120140160180200
Base Case Scenario
Source: PowerACE-ResInvest, own calculations
Figure 10-4: Electricity generation based on wind offshore, EU27, Base Case and 2°
Scenario, 2000 to 2050
10.3.2.3 Solar energy
Whereas PV electricity may theoretically be produced in all European countries, solar thermal electricity generation needs direct solar irradiation (without clouds) and electricity generation is only economical in southern European countries. If there is sufficient direct solar irradiation to generate electricity using solar thermal conversion technologies, generation costs are considerably below those of PV, at least for the next two decades. Even so, grid-connected PV technology already shows higher market diffusion rates than solar thermal electricity within Europe at present and accounted for 3.3 GW of installed capacity (EurObserv'ER 2007). Germany is the country with most installed solar energy capacity in terms of photovoltaics, delivering more than 85 % of the total PV electricity generated within Europe. Comparing the potential development of solar energy under the assumption of enhanced climate policies with the Base Case Scenario, we observe a strong boost in the use of solar energy for electricity production. Whereas electricity production from solar energy achieved 78 TWh by 2050 under Base Case Scenario assumptions, the corresponding value in the 2° Scenario amounts to 203 TWh and consequently exceeds electricity generation with wind power plants on sea. 77 % of the entire solar electricity is thereby produced based on photovoltaics. Besides the southern European countries Italy, Spain and France, Germany contributes a large share of total solar electricity generation as a result of favourable support conditions for photovoltaics (Figure 10-5).

Renewables Sector
- 240 -
DE
ES
FRGRIT
0
50
100
150
200
250
Elec
trici
ty G
ener
atio
n [T
Wh]
AT BE BG CY CZ DE DK EE ES FI FR GR HU IEIT LA LT LU MT NL PL PT RO SE SI SK UK
0
50
100
150
200
250
Source: PowerACE-ResInvest, own calculations
Figure 10-5: Electricity generation based on solar energy, EU27, Base Case and 2°
Scenario, 2000 to 2050
Economic considerations rather than the available potential represent the main limiting factor to the development of solar energy. One should also consider that the future development of solar energy may vary from the pathways shown in the ADAM scenarios, depending particularly on the development of the corresponding electricity generation costs. Our modelling results indicate that the strong market development of Solar PV plants involves a strong reduction of PV investment and the corresponding electricity generation costs as a result of technological learning effects, assuming a learning rate of 20 % (see Figure 10-6). Thus, average investment in newly installed plants decreases from 4,000 €/kW on average in 2005 to one third of the initial value or 1,285 €/kW by 2050. This reduction in investment leads to a reduction of average electricity generation costs from slightly above 300 €/kWh to 140 €/MWh by 2050.

ADAM 2-degree scenario for Europe – policies and impacts
- 241 -
0
50
100
150
200
250
300
350
0500
1,0001,5002,0002,5003,0003,5004,0004,500
2005 2010 2015 2020 2025 2030 2035 2040 2045 2050
Average electricity generation costs [€/M
Wh]
Aver
age
inve
stm
ent [
€/kW
]
Average investment in new PV capacity (left axis)Average electricity generation cost for new PV capacity (right axis)
Source: PowerACE-ResInvest, own calculations
Figure 10-6: Financial characteristics of additionally installed Solar PV plants, EU27, 2°
Scenario, 2000 to 2050
10.3.2.4 Geothermal energy
The development of high-temperature geothermal energy systems for electricity generation in the 2° Scenario is slightly stronger than in the Base Case Scenario. Indeed, geothermal electricity is able to make only a marginal contribution to the entire renewable electricity supply, amounting to an annual production of 9 TWh (7 TWh in the Base Case Scenario) by 2050 (see Figure 10-7). Since the technical potentials for high-temperature hydrothermal geothermal energy systems (electricity generation) are restricted within Europe, a slight increase of geothermal electricity production is expected for Italy. Hot-dry-rock systems are not included, since it is not yet commercially proven and we do not expect any substantial development of this technology, due to existing technical problems.

Renewables Sector
- 242 -
BGFRGR
IT
PT
0123456789
10
Elec
trici
ty G
ener
atio
n [T
Wh]
2 Scenario
AT BE BG CY CZ DE DK EE ES FI FR GR HU IEIT LA LT LU MT NL PL PT RO SE SI SK UK
0123456789
10Base Case Scenario
Source: PowerACE-ResInvest, own calculations
Figure 10-7: Electricity generation based on hydrothermal geothermal energy, EU27, Base
Case and 2° Scenario, 2000 to 2050
10.3.2.5 Hydroenergy
Since most of the available hydropower potential is already being exploited, the use of hydroenergy remains at a rather constant level and does not show considerable changes when the 2° Scenario is compared with the Base Case Scenario. There is only a slight increase up to 2050, in particular including small hydropower plants with a capacity size of up to 10 MW (see Figure 10-8). Whilst our modelling calculations indicate an annual electricity production based on hydropower of 420 TWh in the 2° Scenario, 396 TWh are produced under Base Case Scenario assumptions. It must be noted that annual hydropower production may vary considerably according to the precipitation patterns, as can be seen in the historic development between 2000 and 2005. The annual variations have not been modelled with PowerACE-ResInvest. Inter-annual variations are considered within EuroMM (see Reiter et al. 2009).

ADAM 2-degree scenario for Europe – policies and impacts
- 243 -
AT
ES
FR
IT
SE
050
100150200250300350400450
Elec
trici
ty G
ener
atio
n [T
Wh]
2 Scenario
AT BE BG CY CZ DE DK EE ES FI FR GR HU IEIT LA LT LU MT NL PL PT RO SE SI SK UK
050
100150200250300350400450
Base Case Scenario
Source: PowerACE-ResInvest, own calculations
Figure 10-8: Electricity generation based on hydroenergy, EU27, Baseline and 2° Scenario,
2000 to 2050
10.3.2.6 Solid biomass
According to modelling results, total electricity generation from biomass by 2050 doubles, reaching an annual electricity production of 224 TWh when comparing the 2° Scenario to the Base Case Scenario (see Figure 10-9). About 54 % of the electricity generated in 2050 is expected to be produced in CHP plants.
DE
FI
IT
PL
UK
0
50
100
150
200
250
Elec
trici
ty G
ener
atio
n [T
Wh]
2 Scenario
AT BE BG CY CZ DE DK EE ES FI FR GR HU IEIT LA LT LU MT NL PL PT RO SE SI SK UK
0
50
100
150
200
250Base Case Scenario
Source: PowerACE-ResInvest, Own calculations
Figure 10-9: Electricity generation based on biomass, EU27, Base Case and 2° Scenario,
2000 to 2050

Renewables Sector
- 244 -
Whilst most of the biomass electricity generation in the Base Case Scenario comes from northern European (Sweden, Finland) countries with a large wood and paper industry, the increase in the use of biomass in the 2° Scenario is additionally based on other biomass feedstock such as agricultural products and forest products (see Table 10-5). In the Base Case Scenario, the use of biomass for electricity and CHP generation is clearly dominated by cheap residual biomass. In contrast, primary energy use in the 2 ° Scenario relies additionally on more expensive feedstock, such as agricultural products and forest products as a consequence of reinforced policy efforts. Thus, primary energy input of agricultural products rises from 47 PJ in the Base Case Scenario to roughly 800 PJ. The corresponding input from forest products is increased by 160 % from 261 PJ to 678 PJ.
Table 10-5: Primary energy use of solid biomass for electricity and CHP generation
Primary Energy Input [PJ]
Historic Base Case Scenario 2° Scenario Changes
(2° against Base Case Scenario)
2005 2020 2050 2020 2050 2020 2050
Agricultural products 25 34 47 239 797 +599% +1,582% Agricultural residues 25 284 327 455 634 +61% +94% Forest products 172 198 261 300 678 +52% +160% Forest residues 151 429 514 585 643 +36% +25% Black liquor 138 215 248 267 289 +24% +17% Solid biomass 511 1,160 1,397 1,846 3,041 +59% +118%
Source: PowerACE-ResInvest, own calculations
Electricity generation costs of biomass technologies may vary considerably, depending on the conversion technology and the biomass feedstock used. Average costs of additionally installed capacity, as shown in Figure 10-10, show an increasing trend as no significant technological progress is expected for conversion technologies that use solid biomass. In the beginning of the modelling period, low cost potentials such as co-firing biomass to conventional fuels are exploited first in combination with comparatively cheap residual biomass feedstock. This fact explains the comparatively low electricity generation costs of 50 to 80 €/MWh up to 2011. Later on, more cost-intensive technologies and biomass resources have to be used and average electricity generation costs rise before they peak at approximately 160 €/MWh by mid-century.

ADAM 2-degree scenario for Europe – policies and impacts
- 245 -
0
20
40
60
80
100
120
140
160
180
2005 2010 2015 2020 2025 2030 2035 2040 2045 2050
Aver
age
elec
trici
ty g
ener
atio
n co
sts
of b
iom
ass
elec
trici
ty
[€/M
Wh]
Source: PowerACE-ResInvest, own calculations
Figure 10-10: Average electricity generation costs of additionally installed biomass
technologies, EU27, 2° Scenario, 2000 to 2050
10.3.2.7 Biowaste
The evolution of biowaste according the PowerACE 2° Scenario is characterised by considerable growth until 2010 and then slows down, since exploitation already approaches the potential limits (see Figure 10-11). It is for this reason that the entire electricity production based on biowaste in the 2° Scenario is only marginally above the level (+3.7 %) achieved under Base Case Scenario assumptions and reaches 30 TWh by 2050.
DE
ESFR
IT
UK
0
5
10
15
20
25
30
35
Ele
ctric
ity G
ener
atio
n [T
Wh]
2 Scenario
AT BE BG CY CZ DE DK EE ES FI FR GR HU IEIT LA LT LU MT NL PL PT RO SE SI SK UK
0
5
10
15
20
25
30
35Base Case Scenario
Source: PowerACE-ResInvest, own calculations
Figure 10-11: Electricity generation based on biowaste, EU27, 2° Scenario, 2000 to 2050

Renewables Sector
- 246 -
10.3.2.8 Biogas
According to modelling results, we expect electricity production based on biogas to increase up to 157 TWh by 2050, assuming the implementation of support policies in the 2° Scenario (see Figure 10-12). This corresponds to a rise by 70 % compared to the development of biogas conversion technologies under Base Case conditions.
DE
FRIT
PL
UK
020406080
100120140160180
Ele
ctric
ity G
ener
atio
n [T
Wh]
2 Scenario
AT BE BG CY CZ DE DK EE ES FI FR GR HU IEIT LA LT LU MT NL PL PT RO SE SI SK UK
020406080
100120140160180 Base Case Scenario
Source: PowerACE-ResInvest, own calculations
Figure 10-12: Electricity generation based on biogas (agricultural biogas, landfill gas and
sewage gas), Base Case and 2° Case Scenario, 2000 to 2050
Most of the growth in the use of biogas for electricity production can be attributed to a strong development of agricultural biogas resulting from agricultural products (cereals, oil crops, grass, maize, perennial grasses, etc.) and agricultural residues (manure and crop residues). In the 2° Scenario about 77 % of the electricity produced using biogas in 2050 corresponds to the use of agricultural biogas (see Table 10-6). 18 % of the electricity production from biogas in 2050 is based on the use of landfill gas, with the rest attributed to sewage gas.
Table 10-6: Primary energy use of biogas types for electricity and CHP generation
Primary Energy Input [PJ]
Historic Base Case Scenario 2° Scenario Changes
(2° against Base Case Scenario)
2005 2020 2050 2020 2050 2020 2050
Agricultural biogas 0 167 605 794 1,373 +376% +127% Landfill gas 113 240 327 272 318 +13% -3% Sewage gas 35 65 84 85 102 +30% +21% Biogas 148 473 1,017 1,151 1,793 143% 76%
Source: PowerACE-ResInvest, own calculations

ADAM 2-degree scenario for Europe – policies and impacts
- 247 -
10.3.2.9 Primary use of all biomass types
In general, total use of primary biomass in the 2° Scenario by 2050 shows an increase by 78 % as compared to the Base Case and achieves 6,652 PJ/year. In contrast to the primary use of biomass feedstock in the Base Case Scenario, the development in the 2° Scenario is characterised by a stronger utilisation of agricultural biogas, agricultural products and forest products. Of course, this development involves considerably higher generation costs owing to the comparatively high feedstock prices of wood products (particularly of chips) and of agricultural products (see Figure 10-13).
0
1,000
2,000
3,000
4,000
5,000
6,000
2005 2010 2020 2030 2040 2050
Prim
ary
use
of b
iom
ass
in th
e el
ectri
city
sec
tor [
PJ/a
]
Agricultural biogas Landfill gas Sewage gasAgricultural products Agricultural residues Forest ProductsForest Residues Black Liquour Biowaste
Source: PowerACE-ResInvest, own calculations
Figure 10-13: Primary use of biomass in the electricity sector according to the
corresponding biomass input19
One should consider that the deployment of residual biomass resources should still be preferable to the use of biomass products that can be used for non-energy purposes (e.g food production, material use). As the biomass potentials used within this modelling exercise have been estimated considering competition for biomass feedstock and environmental aspects (see European Environment Agency 2006), the pathway shown does not jeopardise food supply or environmental damages associated with a pronounced cultivation of biomass crops for energy purposes. The contribution of biowaste remains at a high level and experiences slight growth.
19 As data regarding the historical use of biomass for electricity generation, figures were estimated using known shares of biomass primary composition as described in EurObserver (2007).

Renewables Sector
- 248 -
10.3.2.10 Ocean energy
As only few practical experiences exist with wave and tide technologies, their potential future development is highly uncertain and depends to a large extent on the technological development of the respective technologies. The first commercial wave power plant with a size of 2.25 MW has recently been implemented in Portugal near the city of Porto (September 2008). Assuming positive technological progress and the implementation of strong policy support up to 2050 in the 2° Scenario, wave and tidal energy development could provide some 85 TWh of electricity per year (see Figure 10-14). Due to its large potential, the UK is expected to provide more than half of the total electricity from the sea.
DEESFRIE
UK
0102030405060708090
100
Elec
trici
ty G
ener
atio
n [T
Wh]
2 Scenario
AT BE BG CY CZ DE DK EE ES FI FR GR HU IEIT LA LT LU MT NL PL PT RO SE SI SK UK
0102030405060708090
100Base Case Scenario
Source: PowerACE-ResInvest, own calculations
Figure 10-14: Electricity generation based on wave and tidal energy, EU27, Base Case and
2° Scenario, 2000 to 2050
10.3.2.11 The use of biomass in district heating plants and CHP-plants
In particular Northern European countries with a huge wood and paper industry such as Sweden, Finland and Denmark are supposed to be the leading countries within Europe with regard to heat generation from district heating plants and CHP-plants at present as well as in the year 2050. The projections result in an increase from some 35 PJ in 2000 to almost 130 PJ in 2050 in the 2° Scenario (see Figure 10-15). This value corresponds to a slight increase of 18 % compared to the development of district heating plants in the Base Case, which is due to an increased heat output from CHP-plants.

ADAM 2-degree scenario for Europe – policies and impacts
- 249 -
DEDKFI
PL
SE
0
20
40
60
80
100
120
140
Hea
t Gen
erat
ion
[TW
h]
2 Scenario
AT BE BG CY CZ DE DK EE ES FI FR GR HU IEIT LA LT LU MT NL PL PT RO SE SI SK UK
0
20
40
60
80
100
120
140Base Case Scenario
Source: PowerACE-ResInvest, own calculations
Figure 10-15: Heat generation based on biomass grid-connected systems, EU27, Base Case
and 2° Scenario, 2000 to 2050
10.3.3 Mitigation costs in the renewables sector
The increased use in the 2° Scenario involves additional investments in renewable conversion technologies. Cumulated investments in renewables in the electricity secter amount to € 820 billion in the Base Case Scenario and to € 1,545 billion in the 2° Scenario (see Figure 10-16)20. This means that the assumed achievement of the 2° target requires an additional investment of € 724 Billion compared to the Base Case. It should thereby be considered that this investment replaces investment in conventional conversion technologies (see Chapter 11). Owing to the strong development of wind energy, the predominant part of the investment is dedicated to this technology, amounting to € 710 billion up to 2050 in the 2° Scenario. At the same time, € 251 billion are expected to be invested in solar energy technologies, € 115 billion are spent on biogas plants and € 110 billion on conversion plants that use solid biomass21. Investment in hydro energy remains nearly constant, as it results predominantly from the refurbishment of existing plants than from the construction of new hydro power capacity.
20 Cumulated investment includes investment in the capacity of RES installations that have ended their life cycle and need to be replaced during the modelling horizon.
21 Cumulated investments into solar energy in the EuroMM-model result to be considerably higher, as lower learning rates for Photovoltaics have been assumed (see Chapter 11).

Renewables Sector
- 250 -
The cumulated investment into district heating plants in the 2° Scenario amounts to € 9 billion during the considered modelling horizon and remains unchanged compared to the investment undertaken under Base Case conditions.
0
200
400
600
800
1,000
1,200
1,400
1,600
Cum
ulat
ed in
vest
men
t [B
illion
€(2
005)
]
2 Scenario
Wind Solar Biogas Solid Biomass Hydro Biowaste Ocean Geothermal
0
200
400
600
800
1,000
1,200
1,400
1,600Base Case Scenario
Source: PowerACE-ResInvest, own calculations
Figure 10-16: Cumulated investment based on renewables, EU27, Comparison of 2°
Scenario (right figure) with Base Case Scenario (left figure), 2000 to 2050
According to modelling results, the development of renewables technologies accompanies technological development, that results in a reduction of specific investment in Solar PV technologies to 20 %, when comparing the year 2050 with the default value in the year 2005 (see Figure 10-17). Significant reductions may take place for wind offshore plants achieving roughly 40 % of the initial investment value by 2050. With regard to biomass technologies and hydropower plants, no significant progress in terms of investment reductions is anticipated,, as most of these represent rather mature and experienced technologies.

ADAM 2-degree scenario for Europe – policies and impacts
- 251 -
0
0.2
0.4
0.6
0.8
1
2005 2010 2015 2020 2025 2030 2035 2040 2045 2050Spec
ific
inve
stm
ent i
ndex
ed to
200
5 [-]
Biogas Biowaste Geothermal Hydro
Solar Solid Biomass Wind Onshore Wind Offshore
Source: PowerACE-ResInvest, own calculations
Figure 10-17: Specific investment indexed to 2005, 2° Scenario, 2000 to 2050
10.4 Conclusions on policies to achieve changes in the renewables sector
Increasing the share of renewable energy sources in the electricity mix was identified as a crucial factor which could make a substantial contribution to mitigating climate change. Because many RET-options are not yet cost-effective, financial support is required to stimulate the growth of renewable energy conversion technologies. This financial support can be provided by the continuous and enhanced application of various climate policies. The results of our analysis indicate that only applying a European emission trading scheme does not provide sufficient incentives to make most RET-options competitive with other conversion technologies at least during the next two decades.
Therefore, sectoral policy measures adapted to the specific requirements of RET, such as feed-in tariff systems, should be applied besides sector-uniform cap and trade policies in order to trigger a sufficiently rapid diffusion of RET. Merely deploying low-cost electricity generation technologies such as wind onshore will not be sufficient to meet the climate target of a 2 degree increase by 2050. Instead, it is necessary to exploit the full range of RET. The sectoral policy measures may also stimulate the market development of cost-intensive RET, needed to meet the climate target, and encourage future cost reductions as a result of technological learning and economies of scale.
Technology specification of support and investment security were found to be the core elements of policy measures applied in the renewables sector. The technology-specific

Renewables Sector
- 252 -
distinction of support levels applies to the heterogeneous economic characteristics of various RET-options. Thus, a policy measure should be based on a financial support level which is designed such that RET-projects become profitable without overcompensating investors. This policy is capable of stimulating investments without provoking unnecessary windfall profits and thus incurring excessive support costs for society.
Besides policies to enhance the market development of already quite mature technologies, emerging technologies that still need to make considerable technological progress should also be supported by research and development (R&D) policies. Using technology options in addition to those considered within the modelling runs may make an important contribution to achieving the ambitious climate targets, in particular if the policies assumed to be active under the 2° Scenario cannot be realised in reality for political reasons. Owing to the fact that the policy assumptions in the 2° Scenario reflect very ambitious climate targets, this may be likely to happen. Likewise, the option of importing green electricity from outside the EU should be considered as an option to combat climate change, although it is not represented within the model. Importing concentrating solar power (CSP) from North Africa represents a promising alternative. At present there are already private investors planning to build CSP-plants in North Africa and to export the electricity to Europe22.
22 See also http://www.desertec.org/.

ADAM 2-degree scenario for Europe – policies and impacts
- 253 -
11 Conversion sector in Europe
11.1 Target of analysis
The target of the analysis is to identify technology options in the conversion sector for achieving stringent climate change mitigation targets in Europe, including possible bottlenecks between the energy demand side and the energy conversion sector which may undermine mitigation efforts. To realise this objective, the analysis models the European Energy conversion sector using EuroMM, which brings together the outputs of a set of models describing several final energy demand sectors and the renewable electricity generation sector, together with a detailed technological representation of the conventional conversion sector. In this report we focus on an analysis of climate change mitigation scenarios with the two driving boundaries of 400 and 450 ppm CO2-eq concentrations allowed over the long term.
11.2 Policies / Technologies / Assumptions and model rationale / limits for EuroMM
In the analysis for the mitigation scenario we base our assumptions for final energy demands on the results from the other bottom up models involved in the ADAM-M1 team. On the energy conversion side we use the detailed representation of electricity generation technologies in EuroMM, including fossil fuel based technologies with carbon capture and sequestration, nuclear technologies as well as renewable electricity technologies which are further described in section 10. EuroMM also covers fuel refining technologies, biofuel production technologies as well as hydrogen production facilities, which supply fuels to transport and other sectors based on (Guel, 2008). A range of parameters are specified to define the characteristics of each technology option in the model, including investment costs, and fixed and variable operation and maintenance costs. In addition, parameters defining the efficiency of each technology are specified, along with annual and seasonal availability factors during which production is allowed. EuroMM is used to determine the least-cost combination of technology and fuel options to meet a given set of energy demands subject to certain technical and policy constraints. The model is calibrated to the statistical data of the year 2005 (Eurostat, 2005). More information about model details can be found in (Reiter U. and Held A., 2009) and in the model description as part of deliverable M1.1 (Jochem et al., 2007).

Conversion Sector
- 254 -
On the policy side we assume that the implemented policies on country level regarding nuclear electricity generation which were in place in 2005 are continued in the future. This means nuclear energy is phased out in Germany and Sweden. In countries such as Italy and Austria, new investments in nuclear power generation only appear after 2025. Policies on the use and implementation of renewable energy are according to the data of PowerAce-ResInvest. Data on fossil fuel prices and emission targets were obtained from Mima S. and Criqui P. (see section 4).
One of the limiting parameters in EuroMM is the resolution of time23 for the analysis of interactions between non-dispatchable electricity sources and baseline production and demand. Due to the high share of fluctuating renewable power in the electricity sector in mitigation scenarios (shown in section 11.3.1) it becomes more important to show solutions for its reliable integration in the network. A higher time resolution would be advantagous to prove the feasibilty of our presented results.
11.3 Results of scenarios
In this section the main results for the European energy conversion sector are presented, focussing on the electricity generation sector.
11.3.1 Electricity generation
Achieving targets of 450ppm or even 400ppm CO2-eq requires a substantial reduction in CO2 emissions. In the electricity generation sector in Europe this likely translates to a requirement to decarbonise by 90 to 100% by 2050 for the two scenarios, respectively. To achieve such a reduction, a rapid and large expansion of renewable electricity generation mainly based on new wind, solar and biomass based power generation capacities together with a continued use of nuclear power are mandatory (see Figure 11-1). The use of renewable sources for power generation reaches levels of up to 75% of total generation (including hydro power) in 2050. The remaining share is covered mainly by nuclear power and partly advanced coal powered generation in the 450ppm scenario. Natural gas only plays a minor role for power generation mainly due to the high gas prices in the assumptions. In our analysis the option of carbon capture and storage is too costly compared with other CO2 free power generation and therefore only plays a marginal role in the energy conversion sector. As described in (Reiter U. and Held A., 2009) and (Jochem et al. 2009) renewable electricity generation in the baseline and adaptation scenario only contributes by approx. 38% whereas coal contributes
23 In EuroMM 3 seasons (winter, summer and intermediate) and 2 parameters for day and nigth (in each season) are defined.

ADAM 2-degree scenario for Europe – policies and impacts
- 255 -
with 31% and nuclear based electricity with 27% to total electricity generation. Further details about the technologies which are used for power generation are shown in Figure 11-2 wheras only technologies are specified which are contributing by more than 2.5 % to total generation.
0
1000
2000
3000
4000
5000
2005
Baseli
ne
Adapta
tion
450p
pm
400p
pm
Baseli
ne
Adapta
tion
450p
pm
400p
pm
Baseli
ne
Adapta
tion
450p
pm
400p
pm
Elec
trici
ty G
ener
atio
n [T
Wh/
year
] Sol, GeoBioWindHydroOilGas/DC/WCGasNuclear/DC/WCNuclearCoal/DC/WCCoal
2020 2035 2050
Source: Euro MM, PSI
Figure 11-1: Electricity generation depending on the fuel type for the 4 ADAM-M1 scenarios. The results are given for the base year and the years 2020, 2035 and 2050. The legend entry DC/WC stands for advanced cooling technologies which are mandatory for the reference scenario which is further described in (Reiter U.,. and Held A., 2009)
As mentioned above and shown in Figure 11-1, by 2050 renewable energy sources account for up to 75% in the two scenarios, with wind and solar generation accounting for 35%. This high share of fluctuating wind and solar pv generation poses some challenges for the electricity system (e.g. baseload generation), but this is managed in this scenario largely through electricity trade between neighbouring countries and extensive grid interconnections. These enable intermittency (particularly of wind) to be managed by integrating regionally diverse generation sites, thus ensuring a higher certainty of dispatch. The high share of renewables is further managed through electricity trade between countries with a high share of non-dispatchable sources and those with more dispatchable sources (nuclear, biomass, hydroelectric and residual fossil capacity). Hydro capacity is also used as a backup for storing excess electricity in times of low demand. In contrast to today’s situation where hydro storage is often used for arbitrage, pumped storage only plays the role as backup capacity in our least cost analysis.

Conversion Sector
- 256 -
0
1000
2000
3000
4000
5000
2005
Baseli
ne
Adapta
tion
450p
pm
400p
pm
Baseli
ne
Adapta
tion
450p
pm
400p
pm
Baseli
ne
Adapta
tion
450p
pm
400p
pm
Elec
tric
ity o
utpu
t by
tech
nolo
gy [T
Wh/
yr]
Other renewableOther fossilBio conv.Biogas Turb.CHP Bio SteamWind offshoreWind onshoreConc. SolarSolar PVSmall HydroLarge HydroNuclear LWR adv. coolNuclear LWRCHP GCCGTCCLignite conv. adv. coolLignite conv.Press. Coal adv. coolPress. CoalCHP Coal Steam 2CHP Coal Steam 1Coal conv.
2020 2035 2050
Source: Euro MM, PSI Figure 11-2: Electricity generation by technology. Only technologies are shown which are
contributing by 2.5% in at least one period to total generation in each scenario. Most of the remaining sources of fossil generation (indicated as “Other fossil” in the figure) are combined heat and power technologies (CHP) and other renewable technologies (“Other renewable” in the figure) are mainly based on biomass and geothermal energy
The importance of electricity trade inside the EU, can be best illustrated by looking at results for single regions: for example, without extensive trade links Germany would be unable to achieve stringent mitigation targets, given its policy of phasing out nuclear electricity generation together with limited renewable resources (see Figure 11-3). In the case of Germany we are estimating that approx. 50% of the electricity needs to be imported until 2050 in the 400ppm scenario.24
24 One of the important assumptions in our analysis is that we do not consider policies for the security of supply on a country level.

ADAM 2-degree scenario for Europe – policies and impacts
- 257 -
-50
0
50
100
150
200
250
2005
Baseli
ne
Adapta
tion
450p
pm
400p
pm
Baseli
ne
Adapta
tion
450p
pm
400p
pm
Baseli
ne
Adapta
tion
450p
pm
400p
pm
Net
ele
ctric
ity tr
ade
[TW
h/ye
ar]
Net trade
2020 2035 2050
Source: Euro MM, PSI
Figure 11-3: Net electricity trade (i.e., imports) between Germany and its neighbouring countries. In 2005, Germany was a net exporter of electricity
In the different mitigation scenarios the demand for electricity from end-use sectors (residential, services, transport and industry) shows two different trends (see Figure 11-1). The demand for electricity in the residential and service sector decreases further in the 400ppm scenario compared to the 450ppm scenario due to increased energy efficiency, whereas the electricity demand for transport (electric vehicles) increases in the 400ppm scenario due to electrification of the automobile fleet. However, in both scenarios, the total demand for electricity is approx. 35% lower compared to the baseline scenario in 2050.
Details about the results in case of climate change adaptation in the energy conversion sector which are not described in detail in this report can be found in (Reiter U. and Held A., 2009) and the deliverable M1.2 (Jochem et al., 2009)
11.3.2 Other energy conversion
In our analysis we also include other forms of energy conversion compared to electricity generation such as coke or briquette production together with refining activities for oil products. However, in all scenarios the activities in these segments are highly depending on the final energy demand for the specific fuels. It is likely that e.g. coke or naphta alternatives in fuel are less available and therefore it is more difficult to fully decarbonise such activities.
Conversion Sector
- 258 -
11.3.3 Primary energy demand
Similar to the demand reductions for electricity, the demand for other fuels decreases in the climate mitigation scenarios compared to the baseline and adaptation scenarios. Efficiency gains in space heating and appliances along with fuel switching in the residential and services sectors (see section 6 and 7) lead to significant reductions in demand for fossil fuels. A shift to advanced transport technologies allows for further reductions in demand for fossil fuels (see section 9). Fuel savings are also achieved in the electricity generation sector since fossil fuel based technologies are replaced by technologies based on renewable sources (as discussed in section 11.3.1). Additionally, efficiency improvements in generating and distributing electricity are achieved in the scenarios described here. As a result, the overall demand for primary energy is reduced by 28% and 36% in 2050 in the the 450ppm and 400ppm scenario, respectively (see Figure 11-4) compared to the baseline. In the 400 ppm scenario approx. 37% of primary energy is supplied by fossil fuels in 2050, much of which supplies final energy demand directly. For example, 60% of the coal and gas and 50% of the crude oil is used directly in end-use sectors. The remainder is used in the conversion sector, although primarily for production of fuels other than electricity, including heat, coal products and gas. The remainder of primary energy demand is covered by renewable sources25—which increase their share from 7% in 2005 to 40% in the 400 ppm scenario as maximum in 2050. Nuclear fuels slightly increase their share from 13% in 2005 to 16% and 22% in the 450ppm and 400ppm scenarios, respectively.
25 We use the primary energy content principle for all renewable and nuclear sources with a fossil equivalent of 33%.

ADAM 2-degree scenario for Europe – policies and impacts
- 259 -
0
20
40
60
80
100
2005
Baseli
ne
Adapta
tion
450p
pm
400p
pm
Baseli
ne
Adapta
tion
450p
pm
400p
pm
Baseli
ne
Adapta
tion
450p
pm
400p
pm
Prim
ary
Ener
gy D
eman
d [E
J/ye
ar]
'Renewable''Fuels + Crude Oil''Natural Gas''Nuclear''Coal'
2020 2035 2050
Source: Euro MM, PSI
Figure 11-4: Primary energy demand under the given scenarios. In the mitigation scenarios, fossil fuels reduce their share from 80% to 36% in the 400ppm scenario until 2050
11.3.4 Emissions
Under stringent climate mitigation targets, the annual CO2 emissions in Europe need to be reduced from 4.7 billion tons (Gt) in 2005 to approx. 1.6 Gt and 1.0 Gt per year in 2050 in the 450ppm and 400ppm scenarios, respectively. Industry contributes with 8% to 12% to the annual emissions in the baseline, adaptation and 450ppm scenarios and the residential and service sectors contribute with 16% to 18% to the annual emissions under the same set of scenarios and across periods. Only in the 400ppm scenario the residential and service sectors can decrease the share in total emissions down to 10% in 2050 whereas the industrial sector increases its share to 20% to the total emissions. However, compared to the baseline and adaptation scenarios, in the 400ppm scenario the specific emissions are reduced by approx. 70% in the industry sector and up to 90% in the residential and service sector until 2050. Looking at the transport sector, achieving these stringent mitigation targets does not necessarily require such large emissions reductions compared to those described for the industry and service and residential sector. The transport sector reduces emissions by approx. 60% in the 400ppm scenario whereas the share in total emissions increases from 23% in 2005 to more than 40% in 2050. In contrast to the transport sector, the energy conversion sector achives very steep emission reductions and reduces its share in total emissions from almost

Conversion Sector
- 260 -
50% in 2005 down to 23%-30% in the mitigation scenarios. The main contributors to the emissions in the energy conversion sector are the fuel production industries, mainly for transport fuels and coal products.
0
1000
2000
3000
4000
5000
2005
Baseli
ne
Adapta
tion
450p
pm
400p
pm
Baseli
ne
Adapta
tion
450p
pm
400p
pm
Baseli
ne
Adapta
tion
450p
pm
400p
pm
CO
2 em
issi
ons
[Mt/y
ear]
IndustryService/ResidentialTransportEnergy conversion
2020 2035 2050
Source: Euro MM, PSI
Figure 11-5: CO2 emissions for the given scenarios until 2050. The emission targets for the mitigation scenarios are derived from the global Poles model and adapted to EuroMM (including emissions from transport and coal products)
11.3.5 Investment costs
Over the first half of this century substantial new investment will be needed in the energy conversion sector, irrespective of climate change. In fact, the cumulative investment needs in the energy conversion sector out to 2050 are only 12-15% higher in the mitigation scenarios compared to the baseline scenario (see Figure 11-6) and are in the range of $2000 billion to $2100 billion in 2050. The annual investment costs for the energy conversion sector are highest in the years from 2020 to 2035 in the range of 1.8% of total GDP and are decreasing thereafter down to 1% of total GDP. The electricity sector, covering up to 91% of total investments shows even smaller differences between the scenarios. This can be explained by a number of factors. In the baseline and adaptation scenarios higher investment is needed to cover growing demands for electricity and carbon based fuels for heating, transportation, industry and others (see Jochem et al, 2009). In the mitigation scenarios, the demand for energy is reduced significantly, so less conversion capacity is needed. However, this is offset

ADAM 2-degree scenario for Europe – policies and impacts
- 261 -
by the need for more costly conversion technologies with a lower CO2-intensity.26 In the 450ppm and 400ppm scenario, the majority of investments are needed in renewable energy technologies, with an equal distribution between wind- and solar-based electricity generation which need investments in the range of $560 billion and $600 billion, respectively (compare also with section 10).27 However, the need for investments in renewable generation may be slightly overestimated since our analysis in EuroMM uses conservative estimates for capacity factors, particularly in those regions with high renewable potentials (e.g. UK for wind and IBE for solar).
The additional investment in the grid infrastructure only takes up a small share in total investment. This is mainly due to low investment cost for new transmission lines (assumed to vary between $230,000 and $650,000 per km of high voltage transmission line) compared to investments in generation capacity.
Further investments are needed for producing low temperature heat and alternative fuels such as biofuels and hydrogen for transport. The needed investments in the sectors others then electricity are in the range of $180 - $190 billion in the baseline and adaptation scenario. In the 450ppm and 400ppm scenario the needed investments are in the range of $330 to $350 billion, respectively. Additional investments needed to achieve efficiency improvements in the final energy sectors are described in the sections 6 to 9 of this report.
26 In addition, more investment is needed in the end-use sectors on efficient technologies, as discussed in chapters 6 and 9.
27 It should be noted that the cost per kW is higher for solar capacity, hence there is much larger installation of wind capacity.

Conversion Sector
- 262 -
0
300
600
900
1200
1500
1800
2100
2400
2005
Baseli
ne
Adapta
tion
450p
pm
400p
pm
Baseli
ne
Adapta
tion
450p
pm
400p
pm
Baseli
ne
Adapta
tion
450p
pm
400p
pm
Cum
mul
ativ
e In
vest
men
ts [B
illio
n U
S$]
Other conversionGridTrade GridOther RenewableWindHydroNuclearFossil
2020 2035 2050
Source: Euro MM, PSI
Figure 11-6: Cummulative investment costs in the energy conversion sector for the 4 scenarios. Results are given in US$ (2001). The needed investment for the electricity grid infrastructure is given for transmission lines whithin regions (Grid) and cross boarder trade (Trade Grid)
11.4 Conclusion on policies to achieve sectoral changes
A number of important changes are required in the conversion sector to achieve the stringent mitigation targets explored in this analysis. These include phase-out of CO2 emitting fossil generation, large-scale deployment of renewables, and a continued deployment of nuclear energy. As discussed in section 10, realising the high level of renewable power generation is likely to necessitate substantial government support over a long period (achievable through a range of measures such as feed in tarifs or cap and trade systems). Maintaining and expanding deployment of nuclear energy will likely require a different type of policy support to address concerns regarding waste disposal, risk of accidents and nuclear proliferation, thus ensuring sufficient public support. The phase-out of CO2 emitting fossil generation will be brought forward by high and stable CO2 prices which are likely to be achieved by CO2 taxes or cap and trade systems. In addition to these measures, one of the most important areas for policy intervention to achieve cost-effective mitigation targets may be in supporting open and efficient markets for electricity trade. This was illustrated by the importance of trade for managing the large-scale deployment of renewables and providing additional flexibility where countries have lower access to hydroelectric, nuclear or other generators that can be operated more or less on demand. Exploiting the renewable potentials in those regions where they are highest, together with the unconstrained option for trading electricity to centres with high

ADAM 2-degree scenario for Europe – policies and impacts
- 263 -
demand is therefore essential. It is in the interest of the European member states to secure the electricity exchange across boarders and among reliable partners. However, national concerns about security of supply are not included in this results.
In our analysis of the adaptation scenario (see Reiter U. and Held A., 2009) we show the relevance of looking into the needs of adapting the energy conversion sector to climate change. Also in the case of mitigation, climate change impacts are expected to influence the energy conversion sector. However, the impacts of mitigated climate change on efficiency losses and the availability of cooling water are negligibale for the time horizon we are looking at.

Synthesis of sectoral analyses
- 264 -
12 Synthesis of sectoral analysis in Europe
Authors: Wolfgang Schade, Giacomo Catenazzi, Tobias Fleiter, Anne Held, Nicki Helfrich, Martin Jakob, Eberhard Jochem, Silvana Mima, Ulrich Reiter, Hal Turton.
This section compares the results of the ADAM hybrid model system (HMS) with those of the POLES model. In particular, the bottom-up results of the different sectors can be compared. Differences between the two approaches exist concerning four issues:
(1) POLES directly includes the global level in its considerations, while the ADAM-HMS considers the global level only indirectly via the climate policy framework in the form of a GHG emissions path provided by POLES, but then focuses on the EU-27 countries plus Norway and Switzerland, only.
(2) The ADAM-HMS allows for a flexible response of the economy to climate policy, i.e. it considers changes of GDP as well as structural economic changes, while POLES runs the same economic development path in all scenarios.
(3) The POLES model estimates specific fossil fuel prices for each scenario, i.e. fuel prices before taxes and CO2 prices. In the ADAM-HMS, only the electricity price changes depending on the power plant mix, while the net fossil fuel prices remain the same, besides in EuroMM.
(4) In parts, the level of technological detail or details of demand structures in the ADAM-HMS will be higher than in POLES, as the single ADAM-HMS models are specialised sectoral models, while POLES is an integrated world energy system model.
The comparison starts with a presentation of the framework variables used in the two approaches which provide the baseline for the comparison and an overview of the results of both approaches on energy demand and GHG emissions in the 400 ppm scenario. This is followed by the five sectoral comparisons of residential/services, industry, transport, renewables and the conversion sector. The final section presents conclusions on the policy implications that can be drawn from the bottom-up analysis.
12.1 Comparison of common framework variables
The major framework variables that have to be considered when comparing the results are: population, GDP and the price of carbon or CO2, which can be represented by comparable indicators like a CO2 certificate price or a carbon tax level.

ADAM 2-degree scenario for Europe – policies and impacts
- 265 -
Table 12-1 shows the population development in the ADAM-HMS and the POLES models. The two approaches show a comparable level and trend. Both start in 2010 with 492 million persons for the EU27 and reach 472 and 471 million persons in 2050, respectively. Thus the EU27 growth rate is also comparable with an average annual loss of -0.10 % and -0.11 % in the ADAM-HMS and in POLES. On a regional level there is a slightly stronger population decline for southern and eastern countries in POLES than in the ADAM-HMS.
Table 12-1: Population in the ADAM-HMS and POLES simulations
ADAM-HMS
Country group
Reference Scenario [million persons]
Changes [%]
(average annual population change)
2010 2020 2030 2040 2050 '20 to
'10 '30 to
'20 '40 to
'30 '50 to
'40 '50 to
'10
North 25 25 26 26 26 0.27% 0.20% 0.10% -0.05% 0.13%
South 155 155 152 147 140 0.00% -0.21% -0.34% -0.47% -0.25%
East 72 71 69 67 64 -0.19% -0.25% -0.36% -0.40% -0.30%
West 253 258 260 259 254 0.19% 0.09% -0.04% -0.19% 0.01%
EU27 492 496 494 486 472 0.08% -0.04% -0.17% -0.29% -0.10%
POLES model
Country group
Reference Scenario [million persons]
Changes [%]
(average annual population change)
2010 2020 2030 2040 2050 '20 to
'10 '30 to
'20 '40 to
'30 '50 to
'40 '50 to
'10
North 25.6 26.3 26.9 27.1 27.2 0.27% 0.22% 0.07% 0.04% 0.15%
South 152.9 151.0 147.1 142.7 136.9 -0.12% -0.26% -0.30% -0.42% -0.28%
East 74.0 72.6 69.7 65.9 61.8 -0.20% -0.39% -0.56% -0.64% -0.45%
West 252.1 256.3 259.4 259.8 258.5 0.17% 0.12% 0.01% -0.05% 0.06%
EU27 492 494 490 482 471 0.03% -0.07% -0.16% -0.23% -0.11%
Source: ASTRA and POLES
Table 12-2 presents the comparison for GDP between the ADAM-HMS and POLES, which has to take into account that the two approaches use different GDP concepts (e.g. GDP based on PPPs in POLES) and price bases, which had to be converted into the same base. For the EU27 as a whole, the GDP numbers are comparable in 2010. However, the distribution of GDP over the regions differs: POLES has lower GDP in the western European countries and a higher one in the southern and eastern European countries. This results from the PPP point of view.
In terms of growth rates, the basic observation for the EU27 is that in the first decade the POLES model expects higher growth, but overall between 2010 and 2050, both approaches predict the same average annual growth of GDP of 1.6 % and in both cases the growth rates decline decade by decade. There are differences in the growth rates for eastern European

Synthesis of sectoral analyses
- 266 -
countries, which in general are higher in the ADAM-HMS and the growth rates for southern European countries, which are higher in POLES.
Overall, the framework of population and GDP development of POLES and the ADAM-HMS seems to be comparable.
Table 12-2: GDP in the ADAM-HMS and POLES simulations
ADAM-HMS
Country group
Reference Scenario [billion €2005]
Changes [%]
(average annual GDP growth)
2010 2020 2030 2040 2050 '20 to
'10 '30 to
'20 '40 to
'30 '50 to
'40 '50 to
'10
North 972 1,186 1,414 1,639 1,885 2.0% 1.8% 1.5% 1.4% 1.7% South 2,499 2,873 3,258 3,600 3,971 1.4% 1.3% 1.0% 1.0% 1.2% East 462 640 838 1,061 1,240 3.3% 2.7% 2.4% 1.6% 2.5%
West 8,157 9,804 11,551 13,418 15,318 1.9% 1.7% 1.5% 1.3% 1.6%
EU27 11,483 13,750 16,174 18,704 21,260 1.8% 1.6% 1.5% 1.3% 1.6%
POLES model
Country group
Reference Scenario [billion €2005]
Changes [%]
(average annual GDP growth)
2010 2020 2030 2040 2050 '20 to
'10 '30 to
'20 '40 to
'30 '50 to
'40 '50 to
'10
North 650 799 946 1,078 1,206 2.1% 1.7% 1.3% 1.1% 1.6%
South 3,113 3,859 4,492 5,046 5,535 2.2% 1.5% 1.2% 0.9% 1.4%
East 1,064 1,392 1,755 2,153 2,587 2.7% 2.3% 2.1% 1.9% 2.2%
West 6,788 8,375 9,884 11,299 12,689 2.1% 1.7% 1.3% 1.2% 1.6%
EU27 11,443 14,209 16,818 19,282 21,690 2.2% 1.7% 1.4% 1.2% 1.6%
Source: ASTRA and POLES model converted to the same price base
There is a larger difference for the prices of CO2 and the carbon value, respectively. The ADAM-HMS applies a certificate system for CO2 (emissions trading system) for which either the bottom-up models endogenously calculate the certificate price, or they receive an exogenous certificate price from one of the other bottom-up models. POLES calculates a carbon value that should be added on as a tax to carbon emitting processes. For comparison reasons, this carbon value is converted into a CO2 price.28
Two issues have to be discussed here: First, in its final simulations, the ADAM-HMS did not yield a common, unified CO2 certificate price. This is due to the iterative process of running the bottom-up models and the sensitivity of the CO2 price estimation. There is one bottom-up model that contains the GHG emission information from all the bottom-up models, which is
28 The conversion from carbon to CO2 uses the factor 3.67 that is recommended by the UK Defra http://www.defra.gov.uk/environment/climatechange/research/carboncost/step1.htm.

ADAM 2-degree scenario for Europe – policies and impacts
- 267 -
then able to determine the CO2 price. This is the EuroMM model, which models the energy conversion sector. In the simulation process, the bottom-up models besides EuroMM start with an initial CO2 price from the very first POLES simulation and obtain a sectoral energy demand result (e.g. in the residential or transport sector), which is delivered to EuroMM. EuroMM then aggregates all the energy demand and CO2 emissions results and estimates a new CO2 price. This CO2 price is fed back into the other bottom-up models, which obtain new results for energy demand with the new CO2 price. The simulation process runs iteratively and ideally converges to a CO2 price which does not change anymore or only marginally between two iterations. Unfortunately, the number of iterations which could be feasibly managed in the project was limited and the sensitivity of the CO2 price optimisation was high, so that simulation stopped before full convergence could be achieved. This results in CO2 prices that are not completely congruent in the ADAM-HMS. The left-hand side of Figure 12-1 presents the CO2 prices of EuroMM and ASTRA calculated or used in their last iteration. It is obvious that, in EuroMM, the cap on CO2 emissions only becomes effective after 2040 when the CO2 price rockets, in particular in the 400 ppm scenario, which also means that it is difficult or simply impossible for large-scale systems (e.g. energy, housing) to react to mitigate this price increase because of the inertia and time lags in the systems. ASTRA used a smoothly increasing price from earlier iterations, which ended at a higher level in the 450 ppm scenario and a lower one in the 400 ppm scenario than in the final EuroMM iteration.
The second issue to be mentioned is the difference in price levels between POLES and the ADAM-HMS. As can be observed from Figure 12-1, in the 450 ppm scenario, POLES reached a price of about 250 €/tCO2, while in the ADAM-HMS this remained between 20 and 80 €/tCO2. There seem to be a number of possible reasons for this: (1) The ADAM-HMS applies immediate actions such that the price path of CO2 remains low in the first decades as no scarcity emerges due to the early reduction actions. (2) In the ADAM-HMS, besides carbon pricing, sectoral policies are also applied so the pressure for GHG emission reductions does not have to come from the CO2 pricing system alone. (3) The possibility of barrier removal when implementing measures and new technologies seems to be treated more optimistically in the ADAM-HMS than in POLES.

Synthesis of sectoral analyses
- 268 -
0
50
100
150
200
250
300
350
400
2006 2010 2014 2018 2022 2026 2030 2034 2038 2042 2046 2050
CO2 price path in the ADAM‐HMS [€/t CO2]
ASTRA 450ppm ASTRA 400ppm
EuroMM 450ppm EuroMM 400ppm
0
50
100
150
200
250
300
350
400
450
2006 2010 2014 2018 2022 2026 2030 2034 2038 2042 2046 2050
CO2 price path in POLES [€/t CO2]
450ppm 400ppm
Figure 12-1: CO2 certificate price in ADAM-HMS and in POLES
12.2 Overview comparing the energy and emission trends of ADAM-HMS and POLES
The European Commission has defined the target that temperature increases due to global climate change should not exceed 2 degrees Celsius in 2100 relative to preindustrial levels. To achieve this climate change mitigation target, stringent GHG emission reductions need to be made in the coming decades. However, it is still unclear which levels of CO2 concentration are acceptable to achieve this target. Climate scientists agree that limiting the CO2 concentration to 400 ppm gives an 80 % chance of meeting the proposed 2°C target [Meinshausen et al. 2009]. If CO2 concentrations can only be stabilized at 450 ppm, the probability of meeting the target decreases to 50 %. For both scenarios, the impacts on the European energy sector were analysed using the POLES model and the ADAM hybrid model system, respectively.
Given that the emission profile for Europe is defined by the global POLES model for the 450 ppm and the 400 ppm scenarios (see section 4), our analysis shows that at least two different pathways are feasible to achieve stringent climate mitigation targets under the given set of assumptions. According to the results of both bottom-up approaches defining the European energy conversion sector, the European climate target of 2°C can be achieved by a rapid and large deployment of renewable energies together with effective efficiency improvements, mainly in the final energy demand sectors.
An alternative pathway is shown by the POLES model, which assumes lower efficiency improvements, a later point in time at which technological change and behavioural change start to occur and a higher deployment of fossil technologies equipped with carbon capture and sequestration (CCS). In this sense, the ADAM-HMS suggests an immediate action path, while the POLES model describes a development which is close to business-as-usual until 2020 followed by a trend break leading to a moderate decline of energy demand.

ADAM 2-degree scenario for Europe – policies and impacts
- 269 -
The pathways of final energy demand in ADAM-HMS (left-hand side) and POLES (right-hand side) for the 400 ppm scenario are shown in Figure 12-2. Both pathways shown in this analysis require stringent policies and support to be able to meet the targets set by the European Commission. In the ADAM-HMS, the support would have to start earlier and concentrate on fostering renewable energies and efficiency technologies (e.g. fuel efficiency standards of cars, insulation of buildings, top runner approach to electric appliances), while, in POLES, efficiency policies play a much smaller role and priority is given to the use of biomass and to carbon removal technologies, i.e. foster R&D and the introduction of CCS.
0
10,000
20,000
30,000
40,000
50,000
60,000
2005 2010 2015 2020 2025 2030 2035 2040 2045 2050
Final energy demand by sectorin 400ppm scenario in ADAM‐HMS [PJ]
Industry Transport Household, Services
0
10,000
20,000
30,000
40,000
50,000
60,000
70,000
2005 2010 2020 2030 2040 2050
Final energy demand by sectorin 400ppm scenario in POLES [PJ]Industry Transport Household, Services, Agriculture
Figure 12-2: Energy demand by sector of EU27 in ADAM-HMS and POLES (400 ppm
scenario)
Looking at the more detailed developments of energy demand in Table 12-3, it can be observed that, in the ADAM-HMS, the sectoral energy demand is reduced by -48 % until 2050 compared with 2010, while in POLES, the reduction amounts to -15 %, only. The sectoral structure of reductions differs significantly. The total reductions are closest for the transport sector (-47 % and -36 %), while they differ significantly for industry and household/services, which cut demand by about half until 2050 in the ADAM-HMS, but by less than -10 % in POLES.
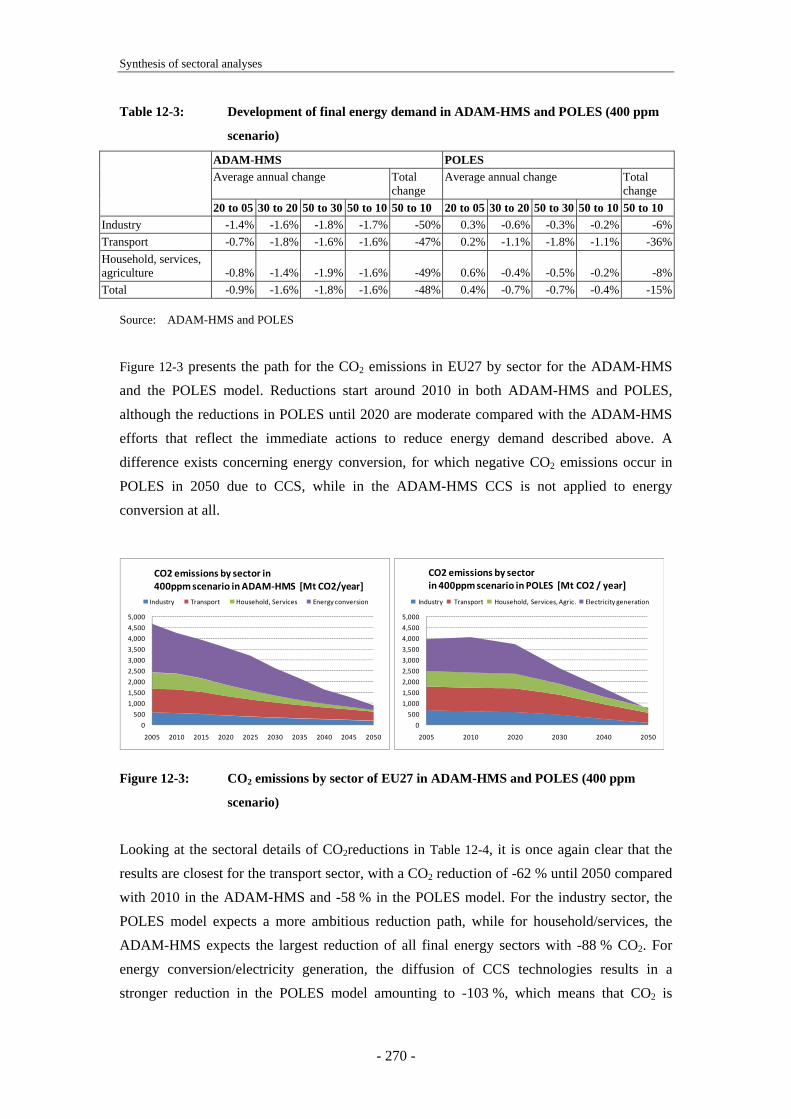
Synthesis of sectoral analyses
- 270 -
Table 12-3: Development of final energy demand in ADAM-HMS and POLES (400 ppm
scenario)
ADAM-HMS POLES Average annual change Total
change Average annual change Total
change 20 to 05 30 to 20 50 to 30 50 to 10 50 to 10 20 to 05 30 to 20 50 to 30 50 to 10 50 to 10 Industry -1.4% -1.6% -1.8% -1.7% -50% 0.3% -0.6% -0.3% -0.2% -6%Transport -0.7% -1.8% -1.6% -1.6% -47% 0.2% -1.1% -1.8% -1.1% -36%Household, services, agriculture -0.8% -1.4% -1.9% -1.6% -49% 0.6% -0.4% -0.5% -0.2% -8%Total -0.9% -1.6% -1.8% -1.6% -48% 0.4% -0.7% -0.7% -0.4% -15%
Source: ADAM-HMS and POLES
Figure 12-3 presents the path for the CO2 emissions in EU27 by sector for the ADAM-HMS and the POLES model. Reductions start around 2010 in both ADAM-HMS and POLES, although the reductions in POLES until 2020 are moderate compared with the ADAM-HMS efforts that reflect the immediate actions to reduce energy demand described above. A difference exists concerning energy conversion, for which negative CO2 emissions occur in POLES in 2050 due to CCS, while in the ADAM-HMS CCS is not applied to energy conversion at all.
0
500
1,000
1,500
2,000
2,500
3,000
3,500
4,000
4,500
5,000
2005 2010 2015 2020 2025 2030 2035 2040 2045 2050
CO2 emissions by sector in400ppm scenario in ADAM‐HMS [Mt CO2/year]
Industry Transport Household, Services Energy conversion
0
500
1,000
1,500
2,000
2,500
3,000
3,500
4,000
4,500
5,000
2005 2010 2020 2030 2040 2050
CO2 emissions by sectorin 400ppm scenario in POLES [Mt CO2 / year]
Industry Transport Household, Services, Agric. Electricity generation
Figure 12-3: CO2 emissions by sector of EU27 in ADAM-HMS and POLES (400 ppm
scenario)
Looking at the sectoral details of CO2reductions in Table 12-4, it is once again clear that the results are closest for the transport sector, with a CO2 reduction of -62 % until 2050 compared with 2010 in the ADAM-HMS and -58 % in the POLES model. For the industry sector, the POLES model expects a more ambitious reduction path, while for household/services, the ADAM-HMS expects the largest reduction of all final energy sectors with -88 % CO2. For energy conversion/electricity generation, the diffusion of CCS technologies results in a stronger reduction in the POLES model amounting to -103 %, which means that CO2 is

ADAM 2-degree scenario for Europe – policies and impacts
- 271 -
removed from the atmospheric CO2 cycle and stored underground due to the use of CCS and biomass in electricity generation.
Table 12-4: Development of CO2 emissions in ADAM-HMS and POLES (400 ppm
scenario)
ADAM-HMS POLES Average annual change Total
change Average annual change Total
change 20 to 05 30 to 20 50 to 30 50 to 10 50 to 10 20 to 05 30 to 20 50 to 30 50 to 10 50 to 10 Industry -1.9% -2.4% -2.9% -2.6% -65% -0.9% -2.2% -7.4% -4.4% -84%Transport -1.3% -2.6% -2.4% -2.4% -62% 0.0% -1.7% -3.4% -2.1% -58%Household, services, agriculture -2.4% -4.5% -6.3% -5.1% -88% -0.4% -2.9% -4.0% -2.8% -69%Energy conversion / elec. generation -1.8% -3.0% -8.5% -5.3% -89% -0.5% -4.9% ~ -28% ~ -16% -103%Total -1.8% -3.0% -5.1% -3.8% -78% -0.4% -3.1% -6.0% -4.0% -81%
Source: ADAM-HMS and POLES
Figure 12-4 presents the categorisation of sources of CO2 savings for the ADAM-HMS (left hand side) and POLES (right hand side). In both figures the top line of the curve represents the CO2 emissions in their reference scenario and the bottom area the CO2 emissions in the 400 ppm scenario. Inbetween the top line and the bottom area are the wedges of the different categories of CO2 emission reductions. Accounting in POLES four categories into the fuel switch to make it roughly comparable with the ADAM-HMS (change of fuel mix of electricity and at the demand level, nuclear and renewable energies) it shows that this category reveals the highest contribution with about 50 % share in ADAM-HMS and 60 % in POLES. However, nuclear plays a very limited role in the ADAM-HMS, while the relative weight of renewable energies is significantly higher than in POLES. The largest differences exist concerning energy efficiency, which in the ADAM-HMS accounts for about one third of CO2 savings, and in POLES for about one tenth, only. CCS contributes roughly one third in POLES, while it is only a small part of the other category in the ADAM-HMS with about 3 % of total CO2 savings.

Synthesis of sectoral analyses
- 272 -
0
500
1000
1500
2000
2500
3000
3500
4000
4500
5000
2005 2010 2020 2030 2040 2050
Categories of savings in ADAM‐HMS in EU27 [Mt CO2]
Other
Demand shift
Energy Efficiency
Fuel switch (incl. Renewables, biofuels)
400ppm
0
1 000
2 000
3 000
4 000
5 000
6 000
2000 2010 2020 2030 2040 2050
MtC
O2
Energy efficiencyEl Demand, fuel mixNuclearRenewablesFos. fuel mixSequestrationEmiss. in 2°C Sc.
2°C Sc. (400 ppm) Emiss. in the REF Sc.
Source: ADAM-HMS and POLES
Figure 12-4: Comparison of categories of CO2 savings in EU27 in ADAM-HMS and
POLES (400 ppm scenario)
Figure 12-5 presents the diffusion of CCS as estimated in ADAM-HMS and POLES. The POLES model estimates that about 65 % of the 2050 emissions of CO2 will be reduced by CCS, of which the largest part comes from electricity generation. In the ADAM-HMS, CCS is only applied in industrial processes, e.g. for the production of steel and cement. Thus the quantity of CO2 that needs to be stored is much lower.
0
200
400
600
800
1,000
1,200
1,400
1,600
2005 2010 2020 2030 2040 2050
[Mt CO
2/year]
CCS in 400ppm scenario
POLES (mainly electricity) ADAM‐HMS (steel & cement)
Source: DAM-HMS (ISIndustry) and POLES model
Figure 12-5: CCS in EU27 in ADAM-HMS and POLES model (400 ppm scenario)

ADAM 2-degree scenario for Europe – policies and impacts
- 273 -
12.3 Comparison of residential and service sectors: POLES and three bottom-up models of the ADAM-HMS
The results of the residential and the service sector are compared jointly. The comparison discusses the results between the POLES model on the one hand and CEPE’s bottom-up models RESIDENT, RESAPPLIANCES and SERVE on the other. The models use different assumptions about drivers and technology. To a certain extent, the two model systems also have a differently detailed structure which hampers a comprehensive comparison and which does not allow the assumptions about structural changes to be compared. In this section, we limit the comparison to the most important drivers, the main technical assumptions and the results of EU27+2 countries.
In the residential sector, both POLES and CEPE’s models use basically the same drivers. Heating energy and other substitutable energies are based on floor area. Electricity for appliances is modelled based on the number of households. The floor area in the residential sector evolves in more or less the same way: It increases by +26 % in the POLES model and by +40 % in RESIDENT (Table 12-5). In POLES, the number of households increases by +7 %, and by +22 % in RESAPPLIANCE.
In the service sector there are different quantitative drivers in POLES and SERVE: whereas energy demand is linked to economic indicators (value added of different sub-sectors) in the POLES model, it is based on physical drivers in SERVE (floor area). These two sets of drivers differ significantly in their development: whereas the value added in POLES increases by +100 % (i.e. it more or less doubles), the floor area in SERVE increases only by about +40 % (Table 12-5) taking into account higher labour productivity and automation in the various service sectors. Hence, POLES is based on quantitative drivers that increase to a much greater extent than those in SERVE. In addition, the development of the value added of the service sector until 2050 does not change in the two scenarios in the POLES model, while value added and floor area of the service sector are slightly reduced in the 2°C Scenario.

Synthesis of sectoral analyses
- 274 -
Table 12-5: Most important drivers in the models POLES, RESIDENT, RESAPPLIANCE
and SERVE for the EU27+2 countries, Reference and 2°C Scenario. 2005 to
2050
POLES RESIDENT, RESAPPL., SERVE 2005 2050 2005 / 2050 2005 2050 2005 / 2050 Ref.-
Scen. 2°C- Scen.
Ref.-Scen.
2°C-Scen.
Ref.-Scen.
2°C-Scen.
Ref.-Scen.
2°C-Scen.
Population (million) 514 498 498 -4% -4% 503 487 487 -3% -3% No. of dwellings (million)
238 249 249 +7% +7% 199 243 243 22% 22%
Floor area residential 19.6 24.7 24.7 26% 26% 17.6 24.6 24.6 40% 40% Value added services (billion €) 5,793 11,65 11,65 100% 100% 6,430 15,76 15,24 145% 137%
Floor area services n.a. n.a. n.a. - - 7.2 11.4 11.3 58% 57%
Source: POLES' and CEPE assumptions
Next to quantitative drivers, the future energy demand of the residential and service sectors is strongly dependent on assumptions regarding energy-efficiency developments in buildings, appliances, lighting and other processes. Due to the different underlying model structure, there are only a few directly comparable energy-efficiency indicators.
One such indicator is the diffusion of the share of energy-efficient buildings. The fact that the CEPE models show greater progress is due in part to the assumed wider diffusion of low-energy buildings (see Table 12-6). In the POLES model, about one third of buildings is assumed to comply with a strict energy standard in the year 2050, whereas in RESIDENT about 80 % of buildings are assumed to meet this standard in the 450 ppm variant of the 2°C Scenario. In POLES, about 40 % of buildings are still of standard efficiency, even in the 400 ppm scenario variant. Hence the assumptions in the model RESIDENT are much more ambitious in terms of the diffusion of energy-efficient buildings, i.e. they project a more ambitious and successful energy policy in buildings and related building management systems.
Moreover, RESIDENT has a more detailed model structure, which differentiates explicitly between existing buildings and new buildings, whereas POLES models the structural change due to more new buildings only implicitly through the reduced specific heat demand of the building stock. Differentiating between new and existing buildings allows building codes and technical standards to be explicitly modelled that usually only apply to new buildings, but can also be applied to buildings to be retrofitted under new legislation in European countries. The explicit simulation of those policies results in more transparency regarding these assumptions.

ADAM 2-degree scenario for Europe – policies and impacts
- 275 -
Table 12-6: Share of buildings in line with low-energy standards in POLES and in
RESIDENT for the residential sector, Europe, Reference Scenario and the two
variants of the 2°C Scenario, 2050
type of POLES RESIDENT and SERVE building code Reference 450 ppm 400 ppm Reference 450 ppm 400 ppm Standard 97% 54% 39% 70% 20% 0% Low energy 3% 36% 45% 30% 80% 20% Very low energy 0% 9% 16% 0% 0% 80%
Source: POLES' and CEPE assumptions
Against the above described background regarding the different developments of the drivers and efficiency indicators, it is no surprise that the final energy demand differs between the two model systems already in the Reference Scenario: It increases by +33 % in POLES and only by +5 % in the CEPE models (see Table 12-8 and Figure 12-6). Regarding final energy demand in the 2°C Scenario, both models show significant improvements in the two variants compared to the Reference Scenario: In POLES, the resulting final energy demand of the two sectors is reduced by -21 % in the 450 ppm variant and in the CEPE models by -48 % in 2050; for the 400 ppm variant, the reduction is -29 % (POLES) and -64 % (CEPE).
Hence, there are two major differences in the resulting final energy demand between the two modelling systems:
• In the Reference Scenario, final energy demand increases considerably in POLES, whereas it is more or less stable in CEPE’s bottom-up models.
• The relative difference between the Reference Scenario and the two mitigation scenarios is distinctly larger in the CEPE models.
These two differences explain the considerable difference in the final energy demand of the two variants of the 2°C Scenario between POLES and the other models. Compared to 2005, mitigation measures are able to more or less stabilize total final energy demand in the case of the POLES model and significantly reduce it in the CEPE models: by about 50 % in the 450 ppm scenario variant and by about two thirds in the more ambitious 400 scenario variant (see Table 12-8). Obviously, such a large difference has implications with regard to direct CO2 emissions, but also with regard to indirect ones such as those related to electricity demand.

Synthesis of sectoral analyses
- 276 -
0
5000
10000
15000
20000
25000
30000
2005 2010 2020 2030 2040 2050
POLES-RefPOLES-450POLES-400CEPE-RefCEPE-450CEPE-400
Figure 12-6: Comparison of final energy demand (in PJ) for the residential, service and
agricultural sectors in POLES and the three CEPE models for the Reference
Scenario and the two variants of the 2°C Scenario, 2005 to 2050
Also, the results of the two model systems differ to a certain extent regarding the development of the individual final energy shares (Table 12-7).
Table 12-7: Relative break down of the final energy demand of the residential, service and
agriculture sectors, 2005 and 2050, Reference and 2°C Scenario, EU27+2
POLES Ref.- 2°C Scenario CEPE Ref.- 2°C Scenario Scen. 450 ppm 400 ppm Scen. 450 ppm 400 ppm 2005 2050 2050 2050 2005 2050 2050 2050
Heating oil 20% 16% 8% 7% 18% 10% 5% 4% Nat. gas 36% 28% 14% 12% 37% 37% 34% 12% Coal 2% 0% 0% 0% 2% 1% 0% 0% Electricity 27% 37% 46% 47% 30% 41% 46% 64% Biomass 7% 9% 17% 21% 5% 6% 11% 16% District heat 8% 10% 15% 13% 7% 5% 4% 3%
Source: POLES' and CEPE assumptions
However, the differences become more apparent when analysing the breakdown of the final energy demand in absolute terms: In POLES, the demand for both electricity and other fuels increases considerably between 2005 and 2050 in the Reference Scenario (see Table 12-8). Even the demand for fossil fuels grows by some 25 %. Conversely, the CEPE models show an increase only in the case of electricity and biomass; fossil fuels and district heat will be decreasing in the Reference Scenario (see Table 12-8).

ADAM 2-degree scenario for Europe – policies and impacts
- 277 -
For the two mitigation scenario variants, there are some common characteristics in the development until 2050 (see Table 12-8): a substantial decrease in oil (-57 % and -66 % respectively in POLES, -85 % and -90 % in CEPE’s models respectively). Also natural gas has a similar trend: In POLES, it decreases strongly in both mitigation variants (-56 % in the 450 ppm and -68 % in the 400 ppm variant), and also in CEPE’s models natural gas demand is reduced considerably (-51 % in the 450 ppm variant and -87 % in the 400 ppm variant).
There are also some noticeable differences: Both fossil fuels and heat are reduced in CEPE’s models, but in POLES, only fossils decrease. Biomass exhibits a marked increase in POLES by +169 % and +163 % respectively and but only a quite low increase in the case of CEPE’s models (+21 % in both scenario variants). Also district heat also shows a quite different development: In POLES, it increases by +76 % to +69 % respectively, but in the CEPE models it decreases in all scenarios (Table 12-8). Since these shares in total final energy demand are in the order of 10 %, the deviation is understandable given the different absolute amounts of final energy demand in the two sectors. Similar structural differences are found regarding electricity, POLES still exhibits an increase of 45 % and about 60 % respectively (compared to 2005), whereas in CEPE’s models, electricity demand is curbed by 15 % to 20 %. The differences are due in part to heat pumps, but also to the relative increase in electric appliances in the CEPE models due to the much lower heat demand assumed.
Table 12-8: Final energy of the residential and service sectors, in 2005 and 2050 (in EJ)
and change between 2005 and 2050, EU27+2, Reference and 2°C Scenario
Ref. Sc. 450 ppm 400 ppm Ref. Sc. 450 ppm 400 ppm final energy 2005 2050 2050 2050 05/50 05/50 05/50 POLES POLES Fossil fuels 11.7 14.5 7.6 6.3 24% -35% -47% District heat 1.5 2.6 2.7 2.6 69% +76% 69% Biomass 1.5 2.5 4.0 3.9 69% +169% 163% Electricity 5.6 9.9 9.5 9.0 78% +70% 61% TOTAL 20.4 27.0 21.2 19.2 33% +5% -5% CEPE CEPE Fossil fuels 12.7 10.9 4.5 1.5 -14% -65% -88% District heat 1.4 1.1 0.4 0.2 -21% -73% -84% Biomass 1.0 1.1 1.2 1.2 17% 21% 21% Electricity 5.8 8.4 4.7 4.8 44% -17% -18% TOTAL 19.5 20.4 10.5 7.4 5% -46% -62%
Source: POLES' and CEPE results
To conclude, the final energy demand in the two variants of the 2°C Scenario projected by the POLES model is slightly reduced, but significantly curbed in the case of CEPE’s models (by one half and about two thirds, respectively). All types of energy contribute to this difference, but in absolute terms, fossil fuels (-1.9 EJ and -4.8 EJ) and electricity (-3.4 EJ and -4.2 EJ)

Synthesis of sectoral analyses
- 278 -
make the largest contribution by 2050 (see Table 12-8). The authors of the three HMS bottom-up models obviously assume a higher impact of energy and climate policies on the investments in energy efficiency and fossil fuel substitution than the authors of POLES. This relates to different assumptions about how much existing obstacles and market imperfection can be alleviated in the residential and service sectors.
12.4 Comparison of industry sector: POLES and ISIndustry
The development of CO2 emissions is relatively similar in POLES and ISIndustry (see Figure
12-7). Both show a comparable downward slope, but where the POLES emissions path is constant until 2020, ISIndustry shows emission reductions from the first calculation year on. While for the 450 ppm scenario the final emissions level in 2050 is about one third higher in POLES than it is in ISIndustry, both models calculate very similar emission levels for the 400 ppm variant.
Figure 12-7: Comparison of industrial CO2 emissions in POLES and ISIndustry for the 450
and the 400 ppm variant of the 2°C Scenario, EU-27+2, 2000 to 2050
The similarity of the development path for CO2 emissions may give the impression that the models work in a similar way and thus projected a comparable reduction path. That this is not the case is shown in Figure 12-8. This plots the development of industrial final energy demand, which rises in the POLES 450 ppm variant to more than 18,000 PJ, but falls in ISIndustry to below 7,000 PJ. The difference is still marked in the 400 ppm variant, but not as much as in the 450 ppm variant, because emissions remain more or less constant in the 400 ppm case even in the 2°C Scenario of POLES. In ISIndustry, no difference between 400 and 450 ppm can be observed, which is due to the fact that the additional emission reductions between these two variants are mainly achieved by wide-scale deployment of solar heating
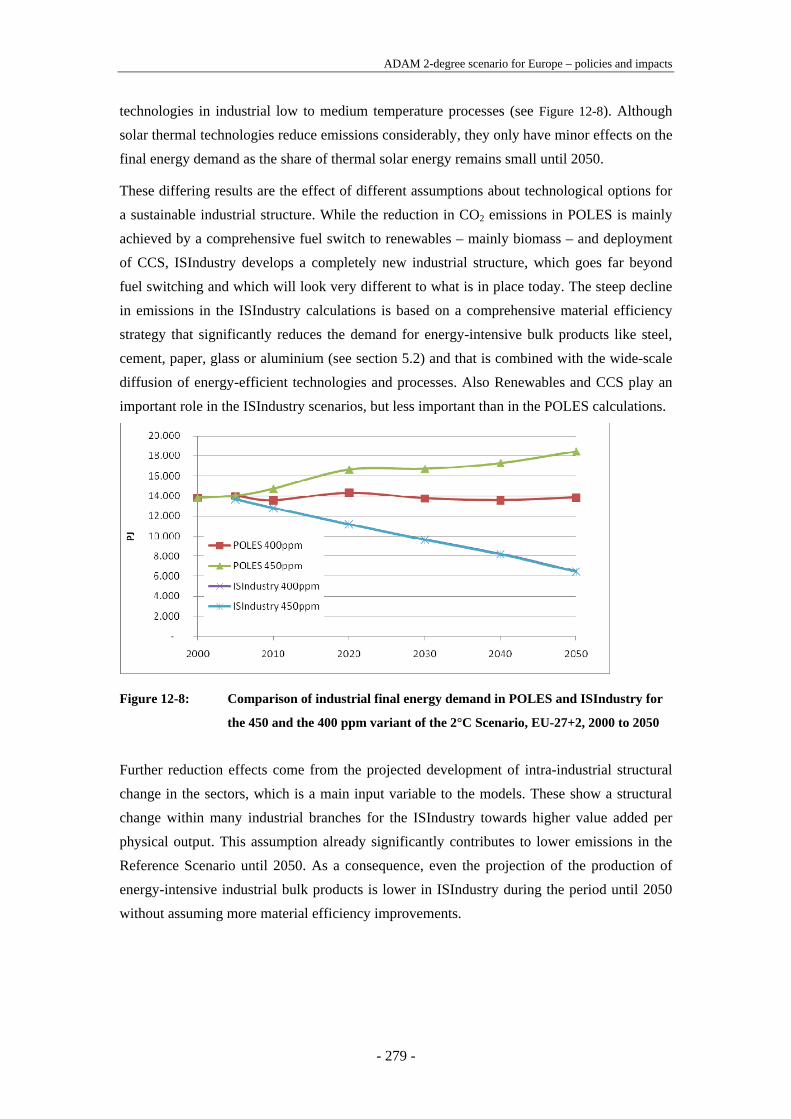
ADAM 2-degree scenario for Europe – policies and impacts
- 279 -
technologies in industrial low to medium temperature processes (see Figure 12-8). Although solar thermal technologies reduce emissions considerably, they only have minor effects on the final energy demand as the share of thermal solar energy remains small until 2050.
These differing results are the effect of different assumptions about technological options for a sustainable industrial structure. While the reduction in CO2 emissions in POLES is mainly achieved by a comprehensive fuel switch to renewables – mainly biomass – and deployment of CCS, ISIndustry develops a completely new industrial structure, which goes far beyond fuel switching and which will look very different to what is in place today. The steep decline in emissions in the ISIndustry calculations is based on a comprehensive material efficiency strategy that significantly reduces the demand for energy-intensive bulk products like steel, cement, paper, glass or aluminium (see section 5.2) and that is combined with the wide-scale diffusion of energy-efficient technologies and processes. Also Renewables and CCS play an important role in the ISIndustry scenarios, but less important than in the POLES calculations.
Figure 12-8: Comparison of industrial final energy demand in POLES and ISIndustry for
the 450 and the 400 ppm variant of the 2°C Scenario, EU-27+2, 2000 to 2050
Further reduction effects come from the projected development of intra-industrial structural change in the sectors, which is a main input variable to the models. These show a structural change within many industrial branches for the ISIndustry towards higher value added per physical output. This assumption already significantly contributes to lower emissions in the Reference Scenario until 2050. As a consequence, even the projection of the production of energy-intensive industrial bulk products is lower in ISIndustry during the period until 2050 without assuming more material efficiency improvements.

Synthesis of sectoral analyses
- 280 -
12.5 Comparison of transport sector: POLES and ASTRA
12.5.1 Transport fuel consumption
This section compares the consumption of different fuel types in the transport sector as computed by POLES and by ASTRA on EU27 aggregated level.
The total transport fuel consumption within the EU27 in the Reference Scenario (Figure 12-9) calculated by POLES shows a roughly similar pattern to the fuel consumption computed by ASTRA. Both models show a fairly constant level of total fuel consumption over the entire simulation timeframe, with a peak in the first half. Both show a global peak around the same time, and then a drop by 2050. ASTRA peaks in 2014 at 16.3 EJ and POLES peaks in 2019 at 17.5 EJ. In ASTRA, total consumption then decreases by 10.4 % to 14.6 EJ in 2050. In POLES, fuel consumption drops by 10.8 % to 15.6 EJ in 2050. A more significant difference between the two models is the composition of the fuel types consumed. In 2000, ASTRA reports almost 100 % fossil fuels, while POLES already shows 2 % electricity consumption in the transport sector. In ASTRA, the fossil fuels are substituted by CNG & LPG (5 % in 2050) as well as by biofuels (7 % in 2050). In contrast, POLES calculates a share of 12 % electricity, 4 % biofuels and 3 % hydrogen in 2050.
Figure 12-9: Transport fuel consumption in ASTRA and POLES for the Reference
Scenario
In the 2°C 450 ppm scenario, the decline of the total transport fuel consumption in the EU27 is more pronounced in POLES than it is in ASTRA (Figure 12-10). In ASTRA, the total figure drops from 14 EJ in 2000 to 11 EJ in 2050, while in POLES, it falls from 15.6 EJ to 10.7 EJ for the same years. This represents a decrease of 21 % in ASTRA and 31 % in POLES. In both models, the composition of the total fuel consumption also changes compared to the Reference Scenario. In ASTRA, in 2050, fossil fuels account for 75 % of the total fuel

ADAM 2-degree scenario for Europe – policies and impacts
- 281 -
consumption, biofuels for 13 %, CNG&LPG for 5 %, hydrogen around 4 % and the electricity share turns out to be 3 %. In comparison, POLES shows a stronger shift towards hydrogen along with a stronger reduction of fossil fuels, which account for 64 % of total fuel consumption. Electricity contributes around 20 %, hydrogen about 13 % and biofuels roughly 4 % of the total fuel consumption in this model.
Figure 12-10: Transport fuel consumption in ASTRA and POLES for the 450 ppm scenario
In the 2°C 400 ppm scenario (Figure 12-11), ASTRA computes 8.3 EJ of total energy consumption within the EU27 in the transport sector, which is 24 % lower than the 450 ppm scenario and 43 % lower than the Reference Scenario. The fuels consumed shift away from fossil to alternative fuels with lower climate change impacts compared to the 450 ppm scenario. Fossil fuels contribute about 61 %, biofuels 21 %, electricity 8 %, hydrogen 5 % and CNG & LPG together also about 5 % of the total energy consumption in 2050. POLES indicates about 10.3 EJ of total energy consumption in 2050 for the 400 ppm scenario, which is only slightly smaller than the 450 ppm scenario, for which POLES computes 10.7 EJ. But the share of fossil fuels falls from 64 % in the 450 ppm variant to 60 % in the 400 ppm scenario. Biofuels remain at 4 %, but electricity increases significantly from 20 % in the 450 ppm scenario to 29 % in the 400 ppm scenario. The share of hydrogen in total transport energy consumption drops from 13 % in the 450 ppm scenario to 7 % in the 400 ppm scenario.

Synthesis of sectoral analyses
- 282 -
Figure 12-11: Transport fuel consumption in ASTRA and POLES for the 400 ppm scenario
12.5.2 Car Fleets
This section compares the composition of car fleets at EU27 aggregated level as computed by ASTRA and POLES. The car class “conventional” includes vehicles running on biofuels as well as on compressed natural gas.
The car fleets computed by ASTRA and POLES for the EU27 in the Reference Scenario (Figure 12-12) differ significantly in their composition. ASTRA assumes almost no alternative vehicle technologies on the market, with the exception of about 1 % of electric hybrid vehicles, while POLES assumes that electric, electric hybrid and hydrogen vehicles will significantly substitute conventional vehicles from 2020 on. According to POLES, in 2050, the European fleet will be composed of 27 % electric hybrid, 14 % electric, 10 % hydrogen and 50 % conventional vehicles.
Figure 12-12: Car fleets in ASTRA and POLES for the Reference Scenario

ADAM 2-degree scenario for Europe – policies and impacts
- 283 -
For the 2°C 450 ppm scenario (Figure 12-13), ASTRA computes a significant introduction of electric and hydrogen vehicles. In 2050, about 9 % electric vehicles and 10 % hydrogen vehicles will be driven on European roads as well as 1 % advanced electric hybrid vehicles. However, 80 % of the total fleet will still be made up of conventional vehicles (including mild hybrids). For the same scenario, POLES calculates a stronger dissemination of the same technologies but already introduced in the Reference Scenario. In 2050, only 30 % conventional vehicles will remain on the roads. The total fleet will then be composed of 26 % electric, 34 % electric hybrid and 10 % hydrogen vehicles.
Figure 12-13: Car fleets in ASTRA and POLES for the 450 ppm scenario
For the 2°C 400 ppm scenario (Figure 12-14), both models come up with the most marked shift towards alternative vehicle technologies within the EU27. In ASTRA, efficient conventional vehicles will only make up 65 % of the total fleet in 2050, while 25 % of vehicles will be electric, 10 % hydrogen and 1 % equipped with an advanced hybrid electric drive train. POLES paints a very different picture: Conventional vehicles almost completely disappear from the roads, only making up 18 % of the total fleet, while 43 % are electric hybrid, 26 % electric and 14 % hydrogen vehicles.

Synthesis of sectoral analyses
- 284 -
Figure 12-14: Car fleets in ASTRA and POLES for the 400 ppm scenario
The reasons for this difference are probably the moderate fuel price development provided by the ADAM scenario framework (see section 2), which seems rather optimistic, and the significantly lower CO2 prices in ASTRA compared with POLES. The result is that neither fuel prices and oil scarcity nor high CO2 prices push fossil-fuelled cars off the roads in ASTRA while this does occur in POLES as a consequence of the high carbon values (see Figure 12-1).
12.6 Comparison of renewables sector: POLES and PowerACE-ResInvest
The use of renewable energy sources in the electricity sector is modelled on the one hand by PowerACE-ResInvest, focussing exclusively on the renewables sector, and on the other hand by the POLES model, which covers the predominant part of the power sector as a whole.
12.6.1 General comparison of modelling approach and assumptions
Both models differ with regard to the RES technologies included and the corresponding level of aggregation (see Table 12-9). In general, renewables are displayed in greater detail within PowerACE-ResInvest than in POLES, but POLES includes modelling of the non-biogenic fraction of municipal solid wastes. Geothermal electricity, solar thermal electricity and ocean energy are considered within PowerACE-ResInvest, but are not included in the POLES model.

ADAM 2-degree scenario for Europe – policies and impacts
- 285 -
Table 12-9: Renewable conversion technologies covered by POLES and PowerACE-
ResInvest
POLES PowerACE-ResInvest
RES-technology covered covered Wind-Onshore yes yes Wind-Offshore yes yes Solar PV yes yes Solar Thermal Electricity no yes Geothermal Electricity no yes Hydro power (large scale) yes yes Hydro power (small scale) yes yes Solid biomass plants
yes yes
Biogenic MSW plants yes Non-biogenic MSW plants no Agricultural biogas plants
yes yes
Landfill gas plants yes Sewage gas plants yes Wave energy no yes Tidal stream energy no yes
POLES and PowerACE-ResInvest also follow different modelling techniques. Although both are simulation models, POLES includes inter-technology competition, whereas the PowerACE-ResInvest simulation focuses on the RES market and includes influences of the conventional power sector in the form of exogenous inputs such as electricity prices or electricity demand. POLES is based on the principles of a dynamic Partial Equilibrium Model with a dynamic simulation process, whereas the PowerACE-ResInvest logic is based on individual agents deciding whether an investment in renewable technologies is profitable or not. The investment decisions of the agents are based on a net present value calculation taking into account cost potential curves, which provide information about the available national potential to exploit RES and the involved electricity generation costs.
12.6.2 Specific comparison of the 2° Scenario results
Both models pursue different strategies concerning the policy support for RES. Whereas POLES assumes that the main support for renewables comes from the impact of the price on carbon on the competitiveness of RES technologies, PowerACE-ResInvest assumes additional support to be active in terms of the currently existing technology support schemes. Since conversion technologies using RES are generally not competitive with conventional resources at present, the assumed financial policy support represents one of the crucial drivers for RES-development, in particular during the first half of the modelling period. As PowerACE-ResInvest does not consider inter-technology competition with non-renewable conversion technologies, the impact of the carbon value is taken into account indirectly by assuming financial support to be available for renewable energy technologies. This support level is

Synthesis of sectoral analyses
- 286 -
calculated based on the economic value of CO2 that can be avoided by the use of low-carbon technologies (see Section 10.3.1).
The two models show different outcomes concerning RES in particular towards the end of the period as a result of the different underlying modelling techniques and assumptions (see Figure 12-15). During the first five modelled years (2005 to 2010), both models show a similar trend of RES-E development. As the increasing carbon price appears to be insufficient to stimulate more growth of RES-E technologies up to 2040, the POLES model projects a steadier growth in RES-E technologies than PowerACE-ResInvest. In the PowerACE-ResInvest model, additional technology-specific support instruments promote earlier investment in RES-E conversion technologies. Starting in 2040, the RES-E development projected by POLES accelerates as a consequence of the increasing carbon price. Another reason for the differences in the results is the slightly diverging technology coverage (compare with Table 12-9). Whereas Poles predicts a slightly different development of RES in the 400 ppm scenario and the 450 ppm scenario, PowerACE-ResInvest assumes the same RES development in both scenarios.
0
500
1000
1500
2000
2500
2000 2005 2010 2015 2020 2025 2030 2035 2040 2045 2050
Electricity Generation [TWh]
PowerACE-ResInvest - 400/450 ppm - EU27Poles - 450 ppm - EU27Poles - 400 ppm - EU27
All renewables
Figure 12-15: Comparison of modelling results – renewable electricity generation in the EU
up to 2050 projected by PowerACE-ResInvest and POLES (2° Scenario)
The predicted development of wind onshore & offshore in the 2° Scenario diverges considerably due to the different policy assumptions made in each model. Wind power development is triggered by technology-specific support schemes such as feed-in tariffs as well as the impact of the carbon value (see sections 4 and 10). In addition, the potentials considered to be available for the use of wind power differ between the models.

ADAM 2-degree scenario for Europe – policies and impacts
- 287 -
0
200
400
600
800
1000
1200
2000 2005 2010 2015 2020 2025 2030 2035 2040 2045 2050
Ele
ctric
ity G
ener
atio
n [T
Wh] PowerACE-ResInvest - 400/450 ppm - EU27
Poles - 450 ppm - EU27Poles - 400 ppm - EU27
Wind
Figure 12-16: Comparison of modelling results – wind electricity generation in the EU up to
2050 projected by PowerACE-ResInvest and POLES (2° Scenario)
With regard to the evolution of solar electricity, the results of both models show a comparable development up to 2035. It should be noted that the PowerACE-ResInvest results comprise the development of solar thermal electricity in Mediterranean countries, whilst POLES focuses exclusively on the development of solar photovoltaics (PV). In PowerACE-ResInvest, the share of concentrating solar power (CSP) reaches 23 % by 2050. POLES shows a faster development of PV-devices in the 450 ppm Scenario which begin to take off around 2035, whilst the development of PV in the 400 ppm Scenario remains moderate. This might be explained by the significantly stronger use of biomass in the 400 ppm Scenario, which substitutes solar electricity generation in the 450 ppm Scenario.
The reason for the observed differences is the difficulty in predicting PV-development due to the high degree of uncertainty about achievable future cost reductions. Compared to other RES, PV is a cost-intensive way to generate electricity , but it has the advantage of decentral installation. Therefore, PV development strongly depends on whether PV electricity is priced at wholesale or retail prices.

Synthesis of sectoral analyses
- 288 -
0
50
100
150
200
250
300
350
2000 2005 2010 2015 2020 2025 2030 2035 2040 2045 2050
Ele
ctric
ity G
ener
atio
n [T
Wh]
PowerACE-ResInvest - 400/450 ppm - EU27Poles - 450 ppm - EU27Poles - 400 ppm - EU27
Solar
Figure 12-17: Comparison of modelling results – solar electricity generation in the EU up to
2050 projected by PowerACE-ResInvest and POLES (2° Scenario)
Electricity generation using biomass, biowaste and biogas shows a very moderate development up to 2040 in the POLES model and then increases strongly, whereas PowerACE-ResInvest indicates earlier investments in biomass conversion technologies and a slowdown towards the end of the modelling period. Similar to the evolution of wind onshore, the observed differences can be attributed to differing policy assumptions.
0100200300400500600700800900
1000
2000 2005 2010 2015 2020 2025 2030 2035 2040 2045 2050
Elec
trici
ty G
ener
atio
n [T
Wh] PowerACE-ResInvest - 400/450 ppm - EU27
Poles - 450 ppm - EU27Poles - 400 ppm - EU27
Biomass
Figure 12-18: Comparison of modelling results – biomass electricity generation in the EU up
to 2050 projected by PowerACE-ResInvest and POLES (2° Scenario)
12.7 Comparison of conversion sector: POLES and EuroMM
The European Markal model EuroMM describes the energy conversion sector in Europe, combining least-cost analysis of the energy supply side with the inputs from other bottom-up models for final energy demands. The differences between this modeling approach and the POLES model have been described earlier (Jochem et al. 2007) and are not further discussed

ADAM 2-degree scenario for Europe – policies and impacts
- 289 -
here. However, it is important to mention that both models use the same assumptions about costs and efficiencies for most of the technologies regarding electricity generation. In the following, the main results for primary energy demand and electricity generation are compared.
12.7.1 Primary energy
Primary energy demand in EuroMM is approx. 25 % to 30 % lower in 2050 compared to the results in POLES for the 450 ppm and 400 ppm scenarios (see Figure 12-19). In addition, the primary energy demand in EuroMM peaks around 2010, and around a decade later in POLES. These differences mainly occur due to the assumptions about final energy demands which are compared in sections 12.3-12.5. However, some differences can also be explained by the results for the energy supply sector, mainly electricity generation, where fossil fuels play a more important role in the POLES model (see section 12.7.2 and further discussion below).
One aspect of primary energy is the availability of biomass for energy purposes. In both EuroMM and POLES, a biomass potential of approx. 8 EJ is assumed for 2005. Until 2050, this potential can be extended and reaches 10.2 EJ in POLES and 12.8 EJ in the 400 ppm scenario in EuroMM. Additional biomass imports from other world regions for energy purposes vary between the two models. POLES assumes biomass imports of approx. 9.6 EJ in 2050 in the 400 ppm scenario, while EuroMM shows imports of 2.6 EJ for the same scenario. Other main differences in the results concern the use of biomass for biofuel and hydrogen production. While in POLES a high share of hydrogen is produced from biomass and the biofuel demand in transportation is low, in EuroMM the biomass is used for biofuel production and hydrogen is produced primarily via electrolysis using wind electricity. The differences between POLES and the ADAM-HMS regarding biofuel in transportation is further explained in section 12.5.

Synthesis of sectoral analyses
- 290 -
0
20
40
60
80
100
120
2000 2010 2020 2030 2040 2050
EJ
Coal, lignite Oil Natural gas Nuclear Biomass Other Renewables
EU27+Nor+Switz Primary consumption - Mitigation Sc. (450 ppm)
0
20
40
60
80
100
120
2000 2010 2020 2030 2040 2050
EJ
Coal, lignite Oil Natural gas Nuclear Biomass Other Renewables
EU27+Nor+Switz Primary consumption - Mitigation Sc. (400 ppm)
0
20
40
60
80
100
2005
Baseli
ne
Adapta
tion
450p
pm
400p
pm
Baseli
ne
Adapta
tion
450p
pm
400p
pm
Baseli
ne
Adapta
tion
450p
pm
400p
pm
Prim
ary
Ener
gy D
eman
d [E
J/ye
ar]
'Renewable''Fuels + Crude Oil''Natural Gas''Nuclear''Coal'
2020 2035 2050
Figure 12-19: Comparison of results between POLES (top) and EuroMM (bottom) for
primary energy demand
12.7.2 Electricity generation
In the electricity sector, there are a number of differences between EuroMM and POLES regarding the output of power plants. One of the most notable differences is that total electricity output is 50 % to 60 % higher in 2050 for POLES compared to EuroMM for the 450 ppm and 400 ppm scenarios, again because of the differences in final energy demands discussed in sections 12.3-12.5. While the POLES results show a high share of fossil fuel based electricity generation (up to 40 %), EuroMM shows an almost CO2-free electricity sector. It is noteworthy that the output of renewable electricity in both models is in the range of approx. 2000TWh in 2050 in the 450 ppm and 400 ppm cases. The output for nuclear electricity is slightly higher in the POLES results. However, because total generation is significantly lower in EuroMM, the share of renewable and nuclear electricity is higher in EuroMM. For instance, in EuroMM, almost 75 % of total electricity generation is based on renewable fuels, whereas POLES estimates a share of approx. 30 %. This difference may be

ADAM 2-degree scenario for Europe – policies and impacts
- 291 -
partly related to different assumptions regarding the integration of intermittent renewable sources of generation. Specifically, EuroMM presents scenarios where electricity grid management and trade facilitate a high penetration of intermittent renewables. In contrast, the POLES results, with the lower share of renewables, illustrate the implications of being unable to integrate a large amount of intermittent renewable resources, in which case fossil fuels (with carbon capture and storage) need to play a much larger role in the energy system. This represents a potentially important key uncertainty requiring further analysis to determine the most suitable technology options for mitigation.
Despite these differences, the other main explanation for the differences in results is again the different assumptions about demands. In this respect, it is also necessary to further evaluate and understand the drivers behind the demand scenarios.
0
1 000
2 000
3 000
4 000
5 000
6 000
7 000
8 000
2000 2010 2020 2030 2040 2050
TWh
Other renewablesNuclearBiomassNatural gasOilCoal, lignite
EU27+Nor+Switz Electricity production - Mitigation Sc. (450 ppm)
0
1 000
2 000
3 000
4 000
5 000
6 000
7 000
8 000
2000 2010 2020 2030 2040 2050
TWh
Other renewablesNuclearBiomassNatural gasOilCoal, lignite
EU27+Nor+Switz Electricity production - Mitigation Sc. (400 ppm)
0
1000
2000
3000
4000
5000
2005
Baselin
e
Adaptat
ion
450p
pm
400pp
m
Baselin
e
Adaptat
ion
450p
pm
400pp
m
Baselin
e
Adaptat
ion
450p
pm
400pp
m
Elec
tric
ity o
utpu
t by
tech
nolo
gy [T
Wh/
yr]
Other renew able
Other fossil
Bio conv.
Biogas Turb.
CHP Bio Steam
Wind offshore
Wind onshore
Conc. Solar
Solar PV
Small Hydro
Large Hydro
Nuclear LWR adv. cool
Nuclear LWR
CHP GCC
GTCC
Lignite conv. adv. cool
Lignite conv.
Press. Coal adv. cool
Press. Coal
CHP Coal Steam 2
CHP Coal Steam 1
Coal conv.
2020 2035 2050
Figure 12-20: Comparison of electricity generation between the POLES model (top) and
EuroMM (bottom)

Synthesis of sectoral analyses
- 292 -
12.8 Summary of bottom-up analysis
The broad message of the sectoral analyses performed for Europe using the ADAM-HMS and the POLES models is congruent: A pathway to reach the 2°C target is technologically feasible. However, there is no silver bullet in climate policies; many or even all the wedges of emission reductions will have to be forcefully activated and over a longer time horizon. A broad package of policies to stimulate technological change as well as behavioural change has to be implemented by the EU, the Member States and municipal governments.
In the details of how and when, the two analyses provide mostly congruent, but also partially divergent answers. The reasons for divergence must be looked for in the different expectations of how barriers to implement technologies can be overcome. Such barriers could be technological, cost or acceptance barriers, which require different approaches to overcome them. Thus the results of the two analyses are presented as two possible storylines of how to reach the 2°C target.
The baseline for both storylines is that carbon, or in a wider sense, GHG emissions, have to be given a price, either in the form of an ETS or a carbon tax. However, such a policy on its own does not seem to be sufficient since (1) the price signals of an ETS in the first decades would be too low to stimulate sufficient policy support for new technologies and sufficient behavioural change to implement sectoral policies. (2) Pricing systems are intended to affect markets, but markets in general apply a short-term perspective, looking at short-term rates of return and short-term break-even points, while the system transitions necessary for climate policy require a long-term perspective and can only be implemented over a long time horizon. Thus giving carbon a price has to be accompanied by sectoral policies that forcefully stimulate new technologies and behavioural change from now until 2050.
12.8.1 The ADAM-HMS storyline of the 2°C scenario
The four major building blocks of the ADAM-HMS 2°C scenario storyline include:
• immediate action,
• energy efficiency,
• renewables and
• materials efficiency and structural change.
Immediate action implies that, from 2010 onwards, climate policies have to start fostering the improvement of efficiency in all sectors (residential, industry, services, transport, energy conversion) and must do so at a relevant pace in order to achieve an annual reduction of final energy demand of close to -1 % despite moderate demand growth in the final energy sectors

ADAM 2-degree scenario for Europe – policies and impacts
- 293 -
in the next decade. This reduction should then increase annually in the following decades. In terms of annual CO2 reduction rates, these have to be close to --2 %. A failure to achieve immediate reductions will mean that in later years the annual reductions of CO2 emissions, already amounting to -4 to -5 %, will have to be even higher (about 1 to 3 % more, annually).
The second major building block of this storyline is energy efficiency improvement in all sectors. The burden of improvement is similar in all final energy sectors. Transport, industry and residential/services have to reduce their final energy demand by about -1.6 % annually from now on until 2050. This is an ambitious target, which requires that improving energy efficiency has to be treated as a cross-cutting technology and a strategic approach that is followed by all the stakeholders in business, households and policy-making. Of course, not only climate policy exerts pressure on improving energy efficiency. Energy security and the depletion of fossil fuels (which will be relevant in the next 30 to 40 years) also constitute two major drivers of energy efficiency.
The third major building block to achieve the 2°C scenario comprises renewables, in particular used for electricity generation, but also for heating and biofuels for transport. In 2050, about 75 % of electricity generation will be based on renewables and about 20 % of transport fuels will be biofuels. One should consider that the percentage numbers refer to a relatively low final energy demand due to the efficiency improvements. Major national studies indicate that even levels of more than 80 % renewables for electricity production could be achieved until 2050, e.g. in Germany [Nitsch 2008].
The fourth building block is increased materials efficiency and structural change. Due to improvements in materials efficiency, for example, the demand in specific sectors will be reduced (e.g. steel production shifting to high strength steel). This contributes to reductions of energy demand as well as fostering structural production changes, e.g. when new materials are introduced like compound materials replacing steel.
On the other hand, two major elements that are considered in other 2°C scenarios play a very limited role here. First, nuclear electricity production remains roughly stable until 2050, and plays only a limited role in reducing GHG emissions. Second, carbon capture and sequestration (CCS) is not required by the electricity sector at all because only very limited fossil energy will be used in 2050 (<10 % of electricity production), which can be generated by highly efficient fossil plants without the need for CCS.

Synthesis of sectoral analyses
- 294 -
12.8.2 The POLES storyline of the 2°C scenario
The three major building blocks of the POLES 2°C scenario storyline include:
• increased use of electricity,
• high use of biomass, and
• substantial use of carbon capture and storage technologies (CCS).
The first major block in POLES is the marked increase in electricity demand until 2050. Between 2010 and 2050, electricity demand increases by about +50 %, which is double the demand of the ADAM-HMS in the 400 ppm scenario. This can be explained by the electrification of the energy sector since the overall energy demand in POLES is slightly reduced. The other two major building blocks fit this picture and contribute to the CO2 reductions in POLES together with electrification.
The second building block is the increased use of biomass also involving a significant amount of imported biomass of close to 10,000 PJ in 2050. The third building block is CCS, which enables about 65 % of the remaining CO2 emissions to be stored in 2050. If CCS is combined with biomass, it may even be possible in 2050 for electricity generation to have a negative net CO2 balance, i.e. more CO2 is saved than emitted.
Improved energy efficiency makes a limited contribution in this storyline, although final energy demand is reduced by -15 % until 2050. The POLES model simulations do not focus on improved material efficiency or structural change.
12.8.3 Policy conclusions from the bottom-up analyses
The main policy conclusions that should be drawn from the two bottom-up analyses can be summarised by the following list of bullet points:
• Assigning carbon (or GHGs) a price is a major pre-requisite for successful climate policy, as it translates the environmental constraints into a market signal. However, this is only a necessary pre-requisite, not a sufficient stand-alone instrument to achieve the 450 or 400 ppm targets.
• Implement a coherent set of policy measures such to overcome barriers that prevent investments in cost-effective and low-cost energy-efficiency measures and renewable energies: codes and standards including MEPS, preferential loans and other financial instruments, labels and other information measures. Ultimately temporarily limited subsidy schemes that could be financed by a carbon levy might be necessary to achieve underlying ambitious assumptions.

ADAM 2-degree scenario for Europe – policies and impacts
- 295 -
• New technologies play a very important role in achieving the goals of ambitious climate policy. Thus massive investments for public and private R&D are required for efficiency technologies (e.g. new insulation materials and highly efficient building technologies including controls for buildings, highly fuel-efficient vehicles, new engine technologies, CO2 lean industrial processes), renewables and, to limited extent, also CCS.
• The take-up of low carbon technologies by the markets has to be accelerated. This should be achieved by norms, standards and labels wherever appropriate, e.g. in buildings, vehicles or power plants. The second effect of norms and standards is that they provide certainty for investors who plan for investments requiring a long-term payback period.
• Foster the system transition of urban structures considering (1) that more than 50 % of persons live in urban areas and their share will grow [UNFPA 2008]; (2) the integrated development of city structures and transport infrastructures reduce the need for motorized transport and pave the way for new forms of mobility (e.g. car- and bike-sharing, electric city and delivery vehicles, barrier-free, multi-modal transport); (3) the creative potential of urban areas attracts qualified and young/innovative groups of people.
• Take immediate action since each year lost before shifting the transition pathway towards a low carbon society represents a year requiring even stronger action in the subsequent years.

Macro-economic impacts of EU climate policy
- 296 -
13 Macro-economic impacts of climate policy in the EU
Authors: Wolfgang Schade, Nicki Helfrich
In this section the macro-economic impacts of the mitigation measures in the 2-degree scenarios described in the previous sections 5 to 12 are assessed for Europe. The assessment is based on the economic modules of the ASTRA model i.e. the macroeconomics module (MAC) and the foreign trade module (FOT) of ASTRA. The economic results are compared with the Reference Scenario i.e. a scenario in which adaptation and damages to the capital stock occured, which do not occur in the 2-degree scenarios, as the policy is assumed to avoid such climate damages. The Reference Scenario and its economic impacts have been described in our deliverable D2 of work package M1 [Jochem et al. 2009]. The analysis neglects the financial crisis happening in the years 2008 and 2009, though it already applies low GDP growth rates compared with many other studies (e.g. annually +1.8 % from 2010 until 2020 and +1.6 % from 2020 until 2030 for the EU27). A complementary analysis of the potential impacts of the financial crisis on mitigation efforts is presented in the following section 14 applying the E3MG global economic model.
This chapter is structured into five main section s. It starts with a brief description of the economic model structure of the ASTRA model (section 13.1) followed by an explanation of how the impulses of the bottom-up models enter the ASTRA model (section 13.2). Thirdly, the aggregate bottom-up impulses are presented i.e. the mitigation investment, the changes of energy expenditures and energy imports, the required subsidies and programme cost (section 13.3) followed by the analysis of the macro-economic impacts of the 2-degree scenarios for the EU (section 13.4). The final chapter concludes the economic analysis of the 2-degree scenarios for Europe (section 13.5).
13.1 Structure of economic models of ASTRA
ASTRA stands for Assessment of Transport Strategies. The model has been continually developed since 1997 and is used for the strategic assessment of policies in an integrated way, i.e. by considering the feedback loops between the transport system and the economic system. Since 2004, it has been further extended by a number of studies and linked with energy system analysis, e.g. to analyse the economic impacts of high oil prices [Schade/Fiorello et al. 2008], the economic impacts of the European renewables strategy [Ragwitz/Schade et al. 2009] and of the German climate strategy [Jochem/Jäger/Schade et al. 2008]. The structure of the transport models in ASTRA has been explained in section 9 as ASTRA in the ADAM project is also applied to undertake the bottom-up analysis of the transport sector.

ADAM 2-degree scenario for Europe – policies and impacts
- 297 -
The model is based on the System Dynamics methodology similar to the POLES model (described in section 4), which can be seen as a recursive simulation approach. It follows system analytic concepts which assume that the real systems can be conceived as a number of feedback loops that are interacting with each other. These feedback loops are implemented in ASTRA and the model is calibrated for key variables for the period 1990 until 2003/2006. The spatial coverage extends over the EU27 countries plus Norway and Switzerland. Each country is further disaggregated into a maximum of four functional spatial zones based on their settlement characteristics and classified into metropolis zones, high-, medium- and low-density zones. A detailed description of ASTRA can be found in Schade [2005] with extensions described in Krail et al. [2007].
The ASTRA model consists of nine modules that are all implemented within one Vensim system dynamics software file:
• Population module (POP),
• Macroeconomic module (MAC),
• Foreign trade module (FOT),
• Regional economic module (REM),
• Infrastructure module (INF),
• Transport module (TRA),
• Environment module (ENV),
• Vehicle fleet module (VFT) and
• Welfare measurement module (WEM).
As the transport modules have been explained in section 9, the following descriptions focus on the presentation of the economic modules, i.e. MAC and FOT. An overview of the major interactions within the economic modules is given in Figure 13-1. Core variables of the economic models have been highlighted, which are consumption, investment, exports and employment that are all calculated in the level of 25 economic sectors by country as well as GDP, calculated on the national level taking into account both the behaviour of GDP on the supply side (i.e. driven by capital stock, labor supply and total factor productivity (TFP)) and on the demand side (i.e. driven by the behaviour of consumption, investment, government and the trade balance). The description of the structure of the 25 economic sectors is presented in Annex 16.3.

Macro-economic impacts of EU climate policy
- 298 -
GDP Supply Side
Final Demand(by sector)
GDP Demand Side
GDP> <
Investment
Consumption
Trade Balance
Gov. consum.Import
Export
Potential Output(national)
Capital Stock
TFP
Labour Supply
(Resource Inp.)
Employment
Population
Private Cap.
Public Cap.
IncomeNet national product
Depreciation
Subsidies
Indirect taxes National income
Disposable income
Fuel taxes
Other taxes
Value-added tax
Transfers
Direct taxes
Social contrib.
Source: ADAM-M1, Fraunhofer-ISI
Figure 13-1: Overview on the structure of the ASTRA economic models
The economic models implemented in ASTRA reflect the view of the economy as constructed of several interacting feedback loops (e.g. income – consumption – investment – final demand – income loop, the trade – GDP – trade loop etc.). These feedback loops are comprised of separate models which do not refer to only one specific economic theory. For instance, investments are partially driven by consumption following Keynesian thought, but exports are added as a second driver of investment. Neoclassic production functions are used to calculate the production potential of the 29 national economies (i.e. the potential output). Total factor productivity (TFP) is endogenised following endogenous growth theory by considering sectoral investment and freight travel times as endogenous drivers of TFP.
The macroeconomics module (MAC) provides the national macroeconomic framework and constitutes the core ASTRA module, which is needed for the economic assessment of the mitigation policy. The macroeconomics module is made up of six major elements. The first is the sector interchange model that reflects the interactions between 25 economic sectors of the 29 national economies. This is done by implementing an input-output table into the MAC. Demand-supply interactions are considered by the second and third element. The second element, the demand side model, depicts the four major components of final demand: consumption, investments, exports-imports and government consumption.
The supply-side model reflects the influence of three production factors: capital stock, labour and natural resources as well as the influence of technological progress that is modelled as total factor productivity. Endogenised Total Factor Productivity (TFP) depends on sectoral investments, freight transport times and sectoral labour productivity changes weighted by

ADAM 2-degree scenario for Europe – policies and impacts
- 299 -
sectoral value added. Investments are involved in a major positive loop since they increase the capital stock and total factor productivity (TFP) of an economy which leads to a growing potential output and GDP that in turn drive income and consumption which feeds back into an increase of investments again. However, this loop may be influenced by other interfering loops that could disrupt the growth tendency. Examples of such loops are:
• In ASTRA, the existence of the ‘crowding out’ effect is accepted so that increasing government debt could have a negative impact on investment.
• Exports, e.g. influenced by mitigation policy, energy and transport cost, can also change, which in turn would affect investments.
• Different growth rates between the supply side (potential output) of an economy and the demand side (final demand) change the utilisation of capacity. If demand grows slower than supply, utilisation would be reduced which would also have an effect on investment decisions. Ultimately, investments could decrease.
• Substantial changes of energy prices could cause inflation, thus reducing real disposable income.
The employment model constitutes the fourth element of MAC based on value-added as the output from the input-output table calculations and labour productivity. The fifth element of MAC describes government behaviour. As far as possible government revenues and expenditures are differentiated into categories that can be modelled endogenously by ASTRA and one category covering other revenues or other expenditures. Categories that are endogenised include VAT and fuel tax revenues, direct taxes, import taxes, social contributions and revenues of transport charges on the revenue side as well as unemployment payments, transfers to retired persons and children, transport investments, interest payments on government debt and government consumption on the expenditure side.
The micro-macro bridges form the sixth and final element comprising the MAC. These link micro- and meso-level models of ASTRA, for instance the transport module or the vehicle fleet module to components of the macroeconomics module. This means that expenditures for bus transport or rail transport of one origin-destination pair (OD) become part of the final demand of the economic sector for inland transport within the sectoral interchange model. This element also includes the linkages with the bottom-up models of the ADAM hybrid model system (ADAM-HMS).
The Foreign Trade Module (FOT) is divided into two parts: trade among the EU27+2 European countries (INTRA-EU model) and trade between the EU27+2 European countries and the rest-of-the world (RoW) that is divided into fifteen regions (EU-RoW model with, Arab-African Oil Exporters, Asian Oil Exporters, Brazil, China, East Asia, India, Japan, Latin

Macro-economic impacts of EU climate policy
- 300 -
America, North America, Oceania, Russia, South-Africa, South-Asia, Turkey, Rest-of-the-World). Both models are differentiated into bilateral relationships by country pair and sector.
The INTRA-EU trade model depends on three endogenous and one exogenous factor. World GDP growth exerts an exogenous influence on trade. Endogenous influences are provided by: GDP growth of the importing country of each country pair relation, the relative change of sectoral labour productivity between countries and the averaged generalised cost of passenger and freight transport between countries. The latter is chosen to represent an accessibility indicator for transport between countries. In the ADAM-HMS in particular the changes of trade patterns of fossil energy is provided from the bottom-up models to the ASTRA trade model.
The EU-RoW trade model is mainly driven by the relative productivity between the European countries and the rest-of-the-world regions. Productivity changes together with GDP growth of the importing RoW-country and world GDP growth drive the export-import relationships between the countries. In principle, ASTRA could exogenously consider first mover advantages of the EU in the case of ambitious mitigation policies of Europe. This was not assumed in the ADAM project, as it is expected that other regions have to implement similar ambitious mitigation policies and thus also develop their carbon lean industries. The resulting sectoral export-import flows of the two trade models are fed back into the macroeconomics module as part of final demand and national final use, respectively.
The purpose of the ASTRA model is to analyse long-term and strategic developments. Thus the model concentrates on describing the real economy and to a large extent neglects the short-term oscillations caused by the financial system. Two effects related to the financial markets are considered in ASTRA: (1) crowding out of private investment due to increased government debt and thus increased interest rates, and (2) dampening impact of inflation on real disposable income induced by higher energy prices. Both impacts were of limited importance in the ADAM analyses as the policies do involve only limited government mitigation investments besides private investment and as the energy efficiency increases rather tend to reduce energy expenditures instead of increasing them.
The economic outcome of the mitigation policies in the different countries depends on the countries’ specific characteristics with respect to renewable potentials, adaptation impacts, current energy use as well as their specific economic characteristics which are reflected either in the ASTRA model or in the bottom-up inputs into ASTRA. Among the important characteristics are:
• The existing energy system and the cost of energy in a country.
• The elasticity of consumers and industry in responding to energy price changes or changes of the CO2 prices.

ADAM 2-degree scenario for Europe – policies and impacts
- 301 -
• The level of (un-)employment which affects the reaction of the labour market.
• The productivity effect of investments in mitigation technologies compared with the productivity effect of other investments.
• The inter-industry structure, in particular the input-output relations of the energy sector and the major sectors producing mitigation technologies, i.e. machinery, electronics, construction, computers and metal products.
• The trade relationships among EU countries, i.e. growth in one EU country can lead to growth in other countries via imports.
• The competitiveness to export technologies for climate mitigation.
• The potential to produce biomass and use other renewable energies.
All these characteristics shape the indirect effects in the national economies that are triggered by the direct effects that are caused by the mitigation policies implemented for the 2-degree scenarios in the eight bottom-up models of the ADAM-HMS and then transferred to the ASTRA model. Figure 13-2 presents the conceptual structure of how bottom-up impulses (i.e. direct effects) feed into ASTRA. Two examples of such bottom-up impulses are (1) the investment into energy efficiency or renewables and (2) the change of energy expenditures of households implementing energy efficiency technologies in buildings. The former enters the economic models as a direct effect on the investment variable, the latter as a direct effect on the consumption variable. In the first round of model simulations this would lead to a change of GDP and the disposable income, which then feeds back onto the consumption variable and the investment variable, and the impacts would lead to a second round of changes of GDP, income etc. Thus one speaks of the second round (or indirect effects) of the mitigation policies
Mitigation investmente.g. into energy efficiency, renewables
Change of energy expendituree.g. electricity cost industry, households
Disposable Income
Bottom-up impulse
Investment GDP
Consumption
Macro-economic feedbacks
directeffects
directeffects
second roundeffects
Source: ADAM-M1, Fraunhofer-ISI
Figure 13-2: Conceptual structure of direct effects and second round economic effects of
mitigation policy

Macro-economic impacts of EU climate policy
- 302 -
13.2 Feeding the bottom-up impulses into the ASTRA model
ASTRA already incorporates the micro-macro-bridges from the bottom-up transport system models to the economy. For the ADAM project, the micro-macro-bridges from the bottom-up models describing the energy system in the residential sector, services sector, industry sector, renewables and energy conversion sector to the economy had to be established. This was achieved by coupling ASTRA via the Virtual Model Server (VMS) and its components TRANSFORM and IMPULSE to these bottom-up models. This concept is called the ADAM-HMS (see section 3). The linkages to the bottom-up models (BUM) and their further take-up in the economic models of ASTRA are presented in Figure 13-3.
IO-Table Intermediate Sector
Sectors 1 to 25InputS1 - S25
Sector 1
Sector 25
Gross value-added by sector
Inve
rse
Co
effi
cien
t M
atri
x.
Employment by sectorLabour productivity GDP (supply side)
Investment Total Factor Productivity
Consumption Investment
Sector 1
Sector 25
Export/Imp.
Energy
GDP (demand side)
S1-S25Metal productsMachineryElectronicsComputersVehiclesConstructionTradeOther services
Sector 1
Sector 25
Sector 1
Sector 25
Energy expenditure(budget constraint)Energy cost increase(substitution effect)
Mitigation investment
Avoided conventionalinvestment
Energy import
Energy etc.
BUM models
Inland transportAir maritime transport
input to sectors 1 to 25input to sectors 1 to 25
Energy input to sectors 1 to 25
Fuel cost
change
Energy cost
change
Energy
cost change
BUM models
Energy import Time savings offreight transport
Source: ADAM-M1, Fraunhofer-ISI
Figure 13-3: Feeding the bottom-up impulses of mitigation policy into the ASTRA model
Broadly speaking, the impacts from the energy and transport system and thus from the mitigation policies can be divided into those on (1) consumer demand, (2) the production of goods and services, (3) the trade balance of the 29 economies, and (4) the impacts on government budget.
Consumer demand is directly affected by the changes of energy expenditures via the budget effect and the substitution effect. In case of energy efficicency gains less money needs to be spent on energy and thus more money can be spent for other purposes and sectors. This is called the budget effect. The substitution effect occurs as prices of different goods and services change differently as a reaction to the mitigation policies. This depends on the sectoral investment required for mitigation and the efficiency improvements that can be achieved, such that depending on investment and cost changes, CO2 prices, energy content and elasticities, the sectoral consumer demand will be restructured, e.g. if CO2 prices increase, CO2-intensive goods and services will be substituted by less CO2-intensive ones.

ADAM 2-degree scenario for Europe – policies and impacts
- 303 -
The production of goods and services reacts in two ways: first, the adaptation of the energy and transport system estimated by the bottom-up models lead to additional investments e.g. into efficiency technologies in households, industry and services, into renewables and into buildings. Avoided investments in conventional energy technologies are also considered. Second, changes of energy expenditures affect the exchange of intermediate goods in the input-output-table. Third, the mitigation investment made by a sector changes the cost structrue of the sector and thus feed into the input-output table. The latter two impacts are then felt on the value-added of each sector, employment and finally the GDP from the supply side, while the direct impacts on the consumer side and to some extent also the additional demand for investment goods also affect the GDP on the demand side.
Thirdly, the direct impacts on the trade balance have to be considered. These consist of reductions of energy imports of fossil fuels that have a positive impact on the demand side of GDP, as well as an increase of the value-added of the energy sector as the share of domestic energy production e.g. by renewables is growing.
Fourth, the impacts on the government budget have to be considered as they could be significant for climate policy. This concerns two issues (1) the direct policy impacts estimated by the bottom-up models, and (2) the indirect impacts calculated in ASTRA e.g. the change of revenues of fuel taxes. The direct policy impacts would consist of subsidies (e.g. if the introduction of a new technology requires financial support for selling the first units on the market, or if R&D is (partially) funded by the government) and programme cost (e.g. if a national authority is set-up to monitor energy efficiency improvements or to promote renewables and insulation of houses, or if loans at interest rates that are lower than the market interest rates are provided by the government to finance mitigation investments). Indirect impacts emerge if those variables are affected that form the base for taxation e.g. fossil fuel taxes that are reduced either because the increase of energy efficiency reduced fuel demand and thus the fuel tax revenues or because fuel switch to other fuels occur that are lower taxed e.g. biofuels or CNG. A new element of the revenue base of governments becomes the selling of the CO2 certificates of the GHG emissions trading system (ETS). Assuming that these certificates are mainly auctioned to the emitting sectors the government will receive significant revenues from the CO2 certificates. Thus the analysis of the mitigation policy has also to consider the use of these revenues. Options would be to fund the mitigation investment, to reduce the direct taxes, to reduce the government debt or to apply a mix of these options.
One specific on the interface with the bottom-up models needs to be explained. Though often the analysis of mitigation policies refers to the (energy) cost changes – mostly expected to be cost increases – this does not constitute the relevant variable to be considered in macro-economic models. The relevant variable is the expenditures for energy use and not the cost

Macro-economic impacts of EU climate policy
- 304 -
change, which only indicates a cost per unit of energy (e.g. per kWh). The cost only then presents the relevant variable if energy demand does not change. However, the nature of many climate mitigation policies is actually that they save energy and thus decrease energy demand. This makes that the relevant input to consider from the bottom-up models is not the cost change but the change of energy expenditures, which is the multiplication of unit cost of energy by the energy demand. This is expressed in the following equation showing also that in most cases it is not the absolute change of energy expenditures that is provided by the bottom-up models, but the change compared with the reference scenario:
EPECEPECEPEC QPEE ,,, *= (eq. 13-1:)
EPECEPECEPEC QPEE ,,, *ΔΔ=Δ expressed as change to reference scenario (eq. 13-2:)
Where: EE = energy expenditure [€].
P = cost per unit of energy [€/kWh, €/l, €/kg, etc.].
Q = consumption of energy [kWh, l, kg, etc.].
ΔEE = change of energy expenditure to reference scenario [€ or %].
ΔP = change of cost per unit of energy to reference scenario [€/unit or %].
ΔQ = change of consumption of energy to reference scenario [kWh, l,
kg or %].
EC = index for the EU27+2 countries.
EP = index for the energy use purposes (heating, electricity, fuel).
Figure 13-4 presents an overview on the linkage of the bottom-up impulses of the mitigation investment and energy expenditures to the ASTRA model. The figure concentrates on these two bottom-up impulses as they seem more relevant for the economic impacts and the structural change induced by the mitigation policy. The figure starts from the left hand side with the input from the bottom-up models divided into five sectors: households, services, industry, transport and conversion (i.e. energy sector). In each sector different kind of mitigation measures are implemented, which are grouped into a few sector-specific categories. In particular, the categories relevant for requiring investment are shown, e.g. in the household sector it is the increase of energy efficiency by investing in insulation of buildings, new heating systems or efficient electric appliances, the fuel switch by investing in renewables (e.g. solar heating of water, geothermal heating) or natural gas and the effects of air conditioning, which have been more important for the Reference Scenario than the 2-degree scenarios. In fact, investment in air conditioning is lower in the 2-Degree scenarios than in the Reference Scenario.

ADAM 2-degree scenario for Europe – policies and impacts
- 305 -
Moving from the left-hand side to the middle of the figure i.e. the interface between bottom-up and macro-economic model the bottom-up impulses are converted. The investment are split onto the 25 economic sectors of the ASTRA model considering individual technological splits for each measure/technology.
Consistent with the mitigation investment the bottom-up models either provide the change of energy demand (e.g. achieved by energy efficiency investment), the change of energy cost or the change of energy expenditure to the interface with the economic model. This input is aggregated across all mitigation measures by each bottom-up model. The only differentiation made is that energy usages are differentiated into electricity, heating and transport fuels. However, the final impacts on transport energy demand are determined in the transport sector bottom-up model. Thus each model delivers at the end a sectoral change of energy expenditures, which can feed into the consumption and investment models of ASTRA, though the way the energy expenditures are treated differs for the sectors. The household sector affects the consumption expenditures and the consumption split. The conversion sector affects both: consumption and business sectors (i.e. the input-output table structures) as in both choices of actors depend on energy expenditures. The services and industry sector first experience changes of their product cost via (1) their own mitigation investment, and (2) their changes of energy expenditures, and only from the changed product cost the impacts go into the consumption and the business sector. The transport sector is integrated more directly into consumption and business sector as it is part of the ASTRA model itself.
Household investmentby sector
Fuel switch incl. RES
Air conditioning
Energy efficiency
Infrastructure
Vehicle fleets
Electric appliances
Solar thermal energy
Energy efficiency
CCS
Air conditioning
Hou
seho
ldse
ctor
Indu
stry
se
ctor
Tran
spor
t se
ctor
Industry investmentby sector
Transport investmentby sector
Renewables
Conventional energyEne
rgy
sect
or Conversion investmentby sector
Consumption by sector
Investment by sector
Budget constraint
Energy exp. (elec., heat)
Product cost by sector
Final demand by sector
Input-Output Table
Investment flowsCost changes
Transport cost by mode
Bottom-up inputs Bottom-up to Top-down interface ASTRA macro-economic model
Energy demandelectric, heating
Energy cost (elec., heat)
Energy demand changes
Fuel switch incl. RES
Air conditioning
Energy efficiency
Ser
vice
s se
ctor Services investment
by sector
Source: ADAM-M1, Fraunhofer-ISI
Figure 13-4: Linking and translating the bottom-up impulses of mitigation investment and
energy expenditures into the ASTRA model

Macro-economic impacts of EU climate policy
- 306 -
13.3 Macro-economic cost and investment impulses of mitigation in Europe
The list of bottom-up impulses that have been calculated by the bottom-up models and delivered to the macro-economic model ASTRA includes the following eight factors.
• Mitigation investments,
• energy demand change,
• energy cost changes,
• energy expenditure change resulting from combined demand and cost changes,
• change of fossil energy imports,
• subsidies to support R&D, new technologies or new organisational measures,
• programme cost of mitigation policies, and
• revenues from CO2 certificates.
The bottom-up impulses can be analysed across European regions (West, North, South, East as in previous sections), differentiated for the sectors requiring the mitigation investments. Figure 13-5 presents the total mitigation investment in the European regions. Around 2030 both scenario reach the peak of mitigation investment, with about 200 billion € in 450 ppm scenario and 250 billion € in 400 ppm scenario. The pattern slightly differs between the scenarios. The 400 ppm scenario requires a more ambitious growth path of investment as well as a higher level of investment after 2030 compared with the 450 ppm scenario.
0
50
100
150
200
250
300
2010 2020 2030 2040 2050
Total mitigation investment by region450 ppm scenario [billion Euro]
East
South
North
West
0
50
100
150
200
250
300
2010 2020 2030 2040 2050
Total mitigation investment by region400 ppm scenario [billion Euro]
East
South
North
West
Source: ASTRA and bottom-up models, ADAM-M1
Figure 13-5: Mitigation investment in 450 ppm and 400 ppm scenario in EU regions

ADAM 2-degree scenario for Europe – policies and impacts
- 307 -
The major sectors that have to undertake the mitigation investment can be differentiated into renewable energies, conversion sector. services, industry, transport and residential, following the structure of the bottom-up models in the ADAM-HMS. The sectoral mitigation investment plus avoided investment into conventional technologies are shown in Figure 13-6 and Figure 13-7 for the 450 ppm scenario and the 400 ppm scenario, respectively. The largest investments have to be made in the residential sector followed by the services and conversion sector (see also Table 13-1). Looking at the renewable investment and the other investment in the conversion sector, it shows that in the first two decades the focus will be on these two sectors, though around 2020 the residential sector is catching-up i.e. the timing of the investment plays a role as through learning-by-doing on renewables in the conversion sector also stimulus is generated for the other sectors in their direct usage of renewables. Two sectors, conversion and transport, also report about avoided investment as in the conversion sector some conventional power plants will not be built and in transport the changes of demand, in particular of freight transport, require fewer road vehicles saving investment.
‐100,000
‐50,000
0
50,000
100,000
150,000
200,000
250,000
2010 2020 2030 2040 2050
Total mitigation investment by sector450 ppm scenario [million Euro]
Avoided transport
Avoided conversion
Residential
Transport
Industry
Services
Conversion
Renewables
‐60,000
‐40,000
‐20,000
0
20,000
40,000
60,000
80,000
2010 2020 2030 2040 2050
Total mitigation investment by sector450 ppm scenario [million Euro]
Renewables
Conversion
Services
Industry
Transport
Residential
Avoided conversion
Avoided transport
Source: ASTRA and bottom-up models, ADAM-M1
Figure 13-6: Mitigation investment in 450 ppm scenario in EU27+2
‐150,000
‐100,000
‐50,000
0
50,000
100,000
150,000
200,000
250,000
300,000
2010 2020 2030 2040 2050
Total mitigation investment by sector400 ppm scenario [million Euro]
Avoided transport
Avoided conversion
Residential
Transport
Industry
Services
Conversion
Renwables
‐100,000
‐80,000
‐60,000
‐40,000
‐20,000
0
20,000
40,000
60,000
80,000
100,000
2010 2020 2030 2040 2050
Total mitigation investment by sector400 ppm scenario [million Euro]
Renwables
Conversion
Services
Industry
Transport
Residential
Avoided conversion
Avoided transport
Source ASTRA and bottom-up models, ADAM-M1
Figure 13-7: Mitigation investment in 400 ppm scenario in EU27+2

Macro-economic impacts of EU climate policy
- 308 -
Table 13-1 improves the understanding of the total mitigation efforts required from the different sectors. The order of magnitude of the sectors in both scenarios is similar: residential requires more than one third of all investment cumulated over the period 2009 until 2050. Conversion and services need about one fifth in the scenario with lower share in the 400 ppm scenario. Renewables, industry and transport account for less than 10 % each, with a higher share in the 400 ppm scenario for industry and transport. For the transport sector the numbers should be at the lower end as it was not possible to separate completely all the mitigation investment from the total investment in the sector. In total the cumulated mitigation investment required for the EU27+2 amounts to € 6.6 billion in the 450 ppm scenario, and 8 billion € in the 400 ppm scenario. On the other hand, due to mitigation significant investment are not needed as they would have been in the Reference Scenaro, which are called avoided investment. The avoided investment in both scenarios amount to about one fifth of the investment required for mitigation, such that the balance of investments caused by the mitigation policy amounts to € 5.4 billion and € 6.3 billion in the 450 ppm and 400 ppm scenarios, respectively.
Table 13-1: Cumulated mitigation investment in the different sectors in EU27+2
[million Euro] 450 ppm scenario 400 ppm scenario
Cumulation 2009 until: 2020 2030 2040 2050 2020 2030 2040 2050
Renewables 191,423 328,173 528,635 606,075 191,423 328,173 528,635 606,075
Conversion 365,529 751,687 1,197,004 1,553,734 368,014 763,125 1,212,359 1,586,463
Services 312,571 735,791 1,124,634 1,474,184 341,772 831,606 1,293,054 1,716,732
Industry 48,378 117,911 225,870 387,215 121,419 231,521 383,403 587,391
Transport 22,200 187,533 317,400 324,067 33,455 227,743 476,060 574,927
Residential 436,473 1,147,512 1,755,828 2,283,693 542,568 1,437,301 2,255,054 3,015,122
Total mitigation 1,376,573 3,268,607 5,149,371 6,628,968 1,598,650 3,819,468 6,148,565 8,086,709
Avoided conversion -68,233 -79,379 -154,275 -178,201 -70,719 -90,817 -169,631 -210,930
Avoided transport -51,534 -205,586 -527,621 -1,033,204 -60,447 -268,969 -747,646 -1,598,772
Total avoided -119,767 -284,965 -681,896 -1,211,405 -131,166 -359,785 -917,276 -1,809,701
Net mitigation 1,256,806 2,983,643 4,467,475 5,417,563 1,467,484 3,459,683 5,231,289 6,277,008
Source: ASTRA and bottom-up models, ADAM-M1
The mitigation investments increase the product cost of goods and services. This effect differs between the service sectors and the industry sectors. Services have to spend three- to four times the mitigation investment compared to industry in the above table, although value-added in the tow sectors is comparable. Consequently the cost of services increases more than for goods. Broadly the bandwidth of cost increases of services is between +2 % and +10 %, while for goods from the industry sectors the cost increase is rather between zero and +2 %.
Figure 13-8 and Figure 13-9 present an example of how energy expenditure develops in the four regions, using one representative country per region (Germany for West, Sweden for North,

ADAM 2-degree scenario for Europe – policies and impacts
- 309 -
Italy for South and Poland for East), since an aggregation or averaging of the changes of expenditure is less meaningful. It is obvious that the energy saving measures become very successful such that the unit cost increase of energy is overcompensated by the savings in energy demand. For electricity the savings reach levels of -30 % to -60 % of expenditures in the residential and services sector. For heating the savings could even become larger with savings in 2050 being between -40 % and -80 % of expenditures for heating.
‐70%
‐60%
‐50%
‐40%
‐30%
‐20%
‐10%
0%
West North South East
Reduction of expenditure for residential electricity [% to Reference]
2010 2020 2030 2040 2050
‐90%
‐80%
‐70%
‐60%
‐50%
‐40%
‐30%
‐20%
‐10%
0%
West North South East
Reduction of expenditure for residential heating[% to Reference]
2010 2020 2030 2040 2050
Source: ASTRA and bottom-up models, ADAM-M1
Figure 13-8: Change of residential energy expenditure in 400 ppm scenario in EU regions
‐80%‐70%‐60%‐50%‐40%‐30%‐20%‐10%0%
10%20%
West North South East
Reduction of expenditure for services electricity[% to Reference]
2010 2020 2030 2040 2050
‐100%
‐80%
‐60%
‐40%
‐20%
0%
20%
West North South East
Reduction of expenditure for services heating[% to Reference]
2010 2020 2030 2040 2050
Source: ASTRA and bottom-up models, ADAM-M
Figure 13-9: Change of services energy expenditure in 400 ppm scenario in EU regions
The energy savings achieved by the mitigaton policy significantly reduce the imports of fossil energies into the EU. Figure 13-10 presents the import savings in monetary terms for the 450 ppm and 400 ppm scenarios. In the former scenario the annual savings amount to about € 360 billion in 2050 and in the latter to € 520 billion.

Macro-economic impacts of EU climate policy
- 310 -
‐600
‐500
‐400
‐300
‐200
‐100
0
2010 2020 2030 2040 2050
[Billion Eu
ro]
Energy import savings by major European regions450 ppm scenario
North
South
East
West
‐600
‐500
‐400
‐300
‐200
‐100
0
2010 2020 2030 2040 2050
[Billion Eu
ro]
Energy import savings by major European regions400 ppm scenario
North
South
East
West
Source: ASTRA and bottom-up models, ADAM-M1
Figure 13-10: Savings of energy imports in 450 ppm and 400 ppm scenarios in EU27
The interesting thing to note is that by 2050 the accumulated savings of energy imports come very close to the required mitigation investment, though this is not the case for earlier years. Table 13-2 reveals that up to 2040 the mitigation investment are significantly higher than the energy import savings (between € half a billion and close to € 2 billion). However, at this point of time the annual savings are more than € 200 billion and € 300 billion in energy import savings (see Figure 13-10), which is above the annual mitigation investment such that the balance of the cumulated numbers strongly shifts towards the energy import savings such that within a decade cumulated savings become larger than the additional mitigation investment.
Table 13-2: Comparison of cumulated mitigation investment and savings of energy
imports for EU27+2
[billion Euro] 450 ppm scenario 400 ppm scenario
Cumulation 2009 until: 2020 2030 2040 2050 2020 2030 2040 2050
Mitigation investment 1,257 2,984 4,467 5,418 1,467 3,460 5,231 6,277
Energy import saving -340 -1,174 -3,009 -6,052 -507 -1,890 -4,695 -9,170
Saldo (Invest-Saving) 917 1,810 1,459 -634 961 1,570 537 -2,893
Source: ASTRA and bottom-up models, ADAM-M1
The implementation of the mitigation policies requires government subsidies in some cases (e.g. the market penetration of new technologies like electric vehicles or CCS). These subsidies have been also considered by the bottom-up models and provided to the macro-economic in which they affect the government budget. Figure 13-12 presents the subsidies for the 450 ppm and 400 ppm scenarios. Their peak amounts to about € 12 billion and € 14 billion annually in 2030. This means also that governments need to provide directly a significant amount of money to stimulate the mitigation investment.

ADAM 2-degree scenario for Europe – policies and impacts
- 311 -
0
2000
4000
6000
8000
10000
12000
14000
16000
2010 2020 2030 2040 2050
Mio EURO
Subsidies in 450 ppm scenarioEast
South
North
West
0
2000
4000
6000
8000
10000
12000
14000
16000
2010 2020 2030 2040 2050
Mio EURO
Subsidies in 400 ppm scenarioEast
South
North
West
Source: ASTRA and bottom-up models, ADAM-M1
Figure 13-11: Subsidies for mitigation measures in 450 ppm and 400 ppm scenarios in EU
regions
Besides subsidies, governments will also need to provide administrative support to implement their mitigation policy. This could be to set-up authorities that control and promote national initiatives to foster energy efficiency or to provide loans with lower-than-market interest rates. Figure 13-12 presents these programme cost for the 450 ppm and 400 ppm scenarios, which are one order of magnitude lower than the subsidies. However, after 2020 the programme cost also amounts to more than € 1 billion annually in both scenarios.
0
200
400
600
800
1000
1200
1400
1600
1800
2010 2020 2030 2040 2050
Mio EURO
Programme cost for mitigation in 450 ppm scenario
East
South
North
West
0
200
400
600
800
1000
1200
1400
1600
1800
2010 2020 2030 2040 2050
Mio EURO
Programme cost for mitigation in 400 ppm scenario
East
South
North
West
Source: ASTRA and bottom-up models, ADAM-M1
Figure 13-12: Programme cost for mitigation measures in 450 ppm and 400 ppm scenarios
in EU regions
A further element of the scenarios is the revenues generated from auctioning of the CO2 certificates. In ASTRA it is assumed that after 2012 100 % of the CO2 certificates are auctioned such that they generate revenues to the government. The government then leaves 30 % of these revenues in the government, e.g. to finance the subsidies of the mitigation

Macro-economic impacts of EU climate policy
- 312 -
investment and the programme cost, but also to compensate for the loss of fuel tax revenues due to the energy savings achieved by mitigation. 20 % of the revenues are “burned” as the CO2 certificates increase the price of goods and services (in particular of energy) and stimulates inflation. Figure 13-13 presents the total revenues from auctioning the CO2 certificates. They are influenced by (1) the certificate prices, and (2) the CO2 emissions. The lower level of certificate prices in the 450 ppm scenarios leads to the fact that the revenues reach a maximum of about € 130 billion annually, while in the 400 ppm scenario the maximum reaches about € 200 billion. However, the certificate prices is more than twofold as high in the 400 ppm scenario, which shows that the reductions of CO2 emissions limit the potentials of revenue generation from CO2 certificates. Actually, in the 400 ppm scenario the peak of revenues generated by the certificates is around 2045. After that the revenues reduce as the CO2 emissions decrease strongly.
0
50
100
150
200
250
2010 2014 2018 2022 2026 2030 2034 2038 2042 2046 2050
[Billion eu
ro]
Government revenues from CO2 certificates450 ppm scenario
East
South
North
West
0
50
100
150
200
250
2010 2014 2018 2022 2026 2030 2034 2038 2042 2046 2050
[Billion eu
ro]
Government revenues from CO2 certificates400 ppm scenario
East
South
North
West
Source: ASTRA model, ADAM-M1
Figure 13-13: Government revenues from auctioning of CO2 certificates in 450 ppm and
400 ppm scenarios in EU regions
13.4 Macro-economic impacts of 2-degree scenarios in Europe
In the previous section the bottom-up impulses estimated by the bottom-up models and feeding into the macro-economic models of ASTRA were explained. This section continues with the presentation of the macro-economic impacts for Europe caused by the mitigation policy as it was implemented in the bottom-up models.
At first we have a look at the impact on GDP. Figure 13-14 presents the changes of GDP in the 2-degree scenarios, 450 ppm scenario and 400 ppm scenario, compared with the Reference Scenario [for details see Jochem et al. 2009]. It can be noted that in the first decade until 2020 GDP is slightly increasing, driven by the mitigation investment. Over time further second

ADAM 2-degree scenario for Europe – policies and impacts
- 313 -
round effects develop (e.g. cost changes of goods and services, changes of government revenues, structural change) that lead to reductions in GDP for the whole EU27+2. However, the impacts differ for the European regions. The Eastern and Northern countries benefit from the mitigation policy, which occurs partially as the relative impulse of the investment (i.e. the ratio of mitiagtion investment to GDP) is larger in these regions, at least compared to the Western region, and as some specific sectors benefit overproportionally, such asike agriculture in the Eastern countries. Further, it can be observed that the impact in the 400 ppm scenario is larger than in 450 ppm scenario.
‐700
‐600
‐500
‐400
‐300
‐200
‐100
0
100
200
2010 2020 2030 2040 2050
[Billion Euro]
GDP changes by major European regions450 ppm scenario
North
South
East
West
‐700
‐600
‐500
‐400
‐300
‐200
‐100
0
100
200
2010 2020 2030 2040 2050
[Billion Euro]
GDP changes by major European regions400 ppm scenario
North
South
East
West
Source: ASTRA calculations, Fraunhofer-ISI
Figure 13-14: Impact on GDP in the 450 ppm and 400 ppm scenarios in EU regions
Table 13-2 presents the impact on GDP as percentage change to the reference scenario as well as percentage change between 400 ppm and 450 ppm scenarios. This reveals that in relative terms the Southern region is affected most by the mitigation policy followed by the Western region. Northern and Eastern countries benefit in both scenarios from the mitigation, as explained above.
Table 13-3: Impact of 2-Degree scenarios on GDP [%-change to scenario]
450 ppm to Reference 400 ppm to Reference 400 ppm to 450 ppm
2010 2020 2030 2040 2050 2010 2020 2030 2040 2050 2010 2020 2030 2040 2050 West 0.1% 0.3% -0.2% -1.5% -2.2% 0.1% 0.2% -0.7% -2.4% -3.5% 0.0% -0.1% -0.5% -0.9% -1.2%
East 0.1% 0.7% 1.3% 2.0% 3.1% 0.1% 0.8% 1.5% 2.5% 4.0% 0.1% 0.1% 0.2% 0.5% 0.8%
South 0.0% -0.2% -0.7% -1.8% -2.8% 0.0% -0.3% -1.3% -3.2% -5.5% 0.0% -0.1% -0.6% -1.5% -2.8%
North 0.0% 0.1% 0.2% 0.2% 0.0% 0.0% 0.3% 1.2% 2.1% 3.1% 0.0% 0.2% 1.0% 1.9% 3.1%
EU27 0.1% 0.2% -0.3% -1.2% -1.7% 0.1% 0.1% -0.6% -1.8% -2.7% 0.0% -0.1% -0.3% -0.6% -1.0%
Source: ASTRA calculations, Fraunhofer-ISI

Macro-economic impacts of EU climate policy
- 314 -
The impact on employment is more moderate than on GDP. Figure 13-1 shows that in the 450 ppm scenario the EU as whole is able to increase its employment with a maximum increase in 2030 of about +700,000 more persons employed, while in the 400 ppm scenario employment increases only for the first two decades and is reduced afterwards. The changes of GDP are reflected in losses of employment in the South and gains in the East and North, while in the West structural change seems to occur as the lower GDP is only translated into rather moderate employment reductions.
‐1,000
‐800
‐600
‐400
‐200
0
200
400
600
800
1,000
2010 2020 2030 2040 2050
[100
0 Pe
rson
s]
Employment changes by major European regions450 ppm scenario
North
South
East
West
‐1,000
‐800
‐600
‐400
‐200
0
200
400
600
800
1,000
2010 2020 2030 2040 2050
[100
0 Pe
rson
s]
Employment changes by major European regions400 ppm scenario
North
South
East
West
Source: ASTRA calculations, Fraunhofer-ISI
Figure 13-15: Impact on employment in the 450 ppm and 400 ppm scenarios in EU27
Table 13-3 presents the percentage changes of employment in the different regions and the EU27+2. In the 450 ppm scenario employment is increased by a moderate +0.2 % over most of the period until 2050, though on regional level there are some larger changes including also periods in which employment is slightly reduced.
Table 13-4: Impact of 2-Degree scenarios on employment [%-change to scenario]
450 ppm to Reference 400 ppm to Reference 400 ppm to 450 ppm
2010 2020 2030 2040 2050 2010 2020 2030 2040 2050 2010 2020 2030 2040 2050West 0.2% 0.1% -0.1% -0.2% 0.2% 0.2% 0.1% 0.0% -0.2% -0.2% 0.1% 0.0% 0.0% 0.0% -0.3%
East 0.5% -0.3% 1.7% 1.5% 1.1% 0.5% -0.1% 1.5% 1.5% 1.0% 0.0% 0.2% -0.2% 0.0% -0.1%
South 0.2% 0.7% 0.1% -0.3% -0.3% 0.2% 0.6% -0.2% -1.2% -1.4% 0.0% -0.1% -0.3% -0.9% -1.2%
North 0.2% 0.5% 0.6% 0.4% 0.4% 0.2% 0.7% 0.8% 0.8% 1.4% 0.0% 0.2% 0.2% 0.4% 1.0%
EU27 0.2% 0.2% 0.3% 0.0% 0.2% 0.3% 0.2% 0.2% -0.2% -0.3% 0.0% 0.0% -0.1% -0.2% -0.5%
Source: ASTRA calculations, Fraunhofer-ISI
Looking at Figure 13-16 provides some background on the employment impacts. In general, the industry and the agriculture sector experience increasing employment, while energy and service sectors loose employment. The agriculture sector benefits from the increased demand

ADAM 2-degree scenario for Europe – policies and impacts
- 315 -
for biomass for energy purposes and the industry sector from the demand for mitigation investments of all kinds (e.g. renewable technologies, efficient vehicles, efficient electric appliances). Furthermore, the industry sector has lower mitigation investment than the services sector such that the prices of manufactured goods hardly increase. For market services, the opposite applies: their mitigation investments are higher than for industry (see Table 13-1) such that the prices of their services increase stronger reducing the demand from services, which is reinforced as some services are highly price sensitive as they do not constitute a basic need e.g. restaurants or wellness activities and thus can be avoided/substituted more easily. Employment in the energy sector is significantly reduced due to the reduction of energy expenditures caused by the energy savings. Here ASTRA operates with nearly fixed labor productivity of the energy sector between the scenarios, though the structural change in the energy sector (e.g. more decentralised renewables and less large-scale power-plants) would suggest the need to apply a more adaptive labor productivity compensating for part of the loss of expenditures and refelecting the structural change in the energy sector. Transport services also reduce employment as the transport demand, in particular of labor-intensive road freight, is reduced.
‐800
‐600
‐400
‐200
0
200
400
600
800
1,000
1,200
2010 2020 2030 2040 2050
[100
0 Pe
rson
s]
Change of employment by aggregate sector450 ppm scenario
Agriculture & Fishery
Energy
Industry
Construction
Transport services
Market services excl. transport
EU27
‐800
‐600
‐400
‐200
0
200
400
600
800
1,000
1,200
2010 2020 2030 2040 2050
[100
0 Pe
rson
s]
Change of employment by aggregate sector400 ppm scenario
Agriculture & Fishery
Energy
Industry
Construction
Transport services
Market services excl. transport
EU27
Source: ASTRA calculations, Fraunhofer-ISI
Figure 13-16: Impact on sectoral employment in the 450 ppm and 400 ppm scenarios in
EU27
Figure 13-17 presents the change of consumption (i.e. the expenditure of households including investment) in the European regions. Consumption constitues the variable in ASTRA which follows GDP developments most closely and thus is also subject to the second round effects that enfold over time. Thus we oberve in both scenarios an increased consumption in the first two decades, followed by two decades with reduced consumption. For Eastern and Norhern countries the development is even more positive with consumption growing until 2050, in particular in the 400 ppm scenario.

Macro-economic impacts of EU climate policy
- 316 -
‐250
‐200
‐150
‐100
‐50
0
50
100
2010 2020 2030 2040 2050
[Billion Euro]
Consumption changes by major European regions450 ppm scenario
North
South
East
West
‐250
‐200
‐150
‐100
‐50
0
50
100
2010 2020 2030 2040 2050
[Billion Euro]
Consumption changes by major European regions400 ppm scenario
North
South
East
West
Source: ASTRA calculations, Fraunhofer-ISI
Figure 13-17: Impact on consumption in the 450 ppm and 400 ppm scenarios in EU27
Looking at the sectoral structure of consumption in Figure 13-18 one broadly observes a similar pattern to employment, but not exactly the same. Expenditures for energy show the largest reductions, coming from the efficiency improvements. In the first two decades when GDP remains stable the losses of energy demand lead to gains in other sectors controlled by the budget constraint (in this case the opposite to a constraint as the savings of energy expenditures frees money that is now spent for other purposes). In the last two decades this does not hold any more, due to the second round effects i.e. the loss of GDP and disposable income such that the overall leveölof consumption is reduced, which affects three sectors - energy, industry and other market services - for different reasons. On the other hand two sectors benefit, construction due to the massive mitigation investment in the residential sector in particular for insulation of buildings, and transport services, which become more attractive due to their strong savings of energy as well as due to a fiscal effect specific to transport. This is that fossil fuels in transport are highly taxed, but the mitigation policies lead to substitution of fossil fuels by alternatives (e.g. electricity, biofuels, CNG). These are all taxed at lower rates but net of taxes they may be more expensive than the fossil counterparts. Since consumption in ASTRA is presented net of taxes, such a shift between fuels would reduce the tax payments and increase consumption spending for transport, though in the pockets of the people the change could be negligible.

ADAM 2-degree scenario for Europe – policies and impacts
- 317 -
‐120
‐100
‐80
‐60
‐40
‐20
0
20
40
60
2010 2020 2030 2040 2050
[Billion Euro]
Change of household expenditure by aggregate sector450 ppm scenario
Agriculture & Fishery
Energy
Industry
Construction
Transport services
Market services excl. transport
‐120
‐100
‐80
‐60
‐40
‐20
0
20
40
60
2010 2020 2030 2040 2050
[Billion Euro]
Change of household expenditure by aggregate sector400 ppm scenario
Agriculture & Fishery
Energy
Industry
Construction
Transport services
Market services excl. transport
Source: ASTRA calculations, Fraunhofer-ISI
Figure 13-18: Impact on sectoral consumption/household expenditure in the 450 ppm and
400 ppm scenarios in EU27
Figure 13-19 presents the changes of total investment in the European regions. In the first decade total investments are reduced in the Western and Southern countries, while they remain stable or slightly increase in the Eastern and Northern countries. This is part of the explanation for why GDP in these countries develops more positively than in the other countries. The most relevant question is, why despite the huge additional mitigation investment does the total investment decrease? There seem to be two major reasons for that, which will be further analysed in the following: (1) ASTRA includes an endogenous investment model, which also estimates the investment of the 25 economic sectors considered in the economic models and the structure of the mitigation policies affects these investments negatively. We would argue that this reduction makes our assessment of mitigation a pessimistic approach and we will explain this later. (2) The reductions of fuel taxes due to energy savings decreases government revenues and increases its debt, which causes crowding out and thus reduces private investment. This could also be tackled by government intervention, which is not considered in the definition of the mitigation policies underlying the assessment of the 2-degree scenarios.

Macro-economic impacts of EU climate policy
- 318 -
‐400
‐350
‐300
‐250
‐200
‐150
‐100
‐50
0
50
2010 2020 2030 2040 2050
[Billion Euro]
Investment changes by major European regions450 ppm scenario
North
South
East
West
‐400
‐350
‐300
‐250
‐200
‐150
‐100
‐50
0
50
2010 2020 2030 2040 2050
[Billion Euro]
Investment changes by major European regions400 ppm scenario
North
South
East
West
Source: ASTRA calculations, Fraunhofer-ISI
Figure 13-19: Impact on investment in the 450 ppm and 400 ppm scenarios in EU27
Figure 13-20 provides a closer look at the government debt and the revenue and expenditure side of the government budget. We can observe that in 2030 government revenues have declined, while the expenditures remained roughly stable such that a deficit occured. This is already accumulated over some years such that the government debt increases by close to € 300 billion in 2030. The decline of revenues continues further and though expenditures also reduce – but less than the revenues – the annual budget deficit increases as does the total government debt. The latter is relevant for determining the crowding out effect.
‐300,000
‐200,000
‐100,000
0
100,000
200,000
300,000
400,000
500,000
600,000
Revenue Expenditure Debt Revenue Expenditure Debt
450 ppm scenario 400 ppm scenario
Development of government budget flowsand debt [Million Euro]
2010
2030
2050
Source: ASTRA calculations, Fraunhofer-ISI
Figure 13-20: Development of and impact on government budget in the 450 ppm and
400 ppm scenarios in EU27

ADAM 2-degree scenario for Europe – policies and impacts
- 319 -
Figure 13-21 presents the revenues from fuel taxes in the 2-degree scenarios. The success of the efficiency measures and the energy savings in the transport sector can be directly observed. Until 2050 fuel tax revenues decrease by more than -€ 80 billion annually in the 450 ppm scenario and by more than -€ 140 billion in the 400 ppm scenario. This is one major reason whygovernment debt increases and dampens private investment.
‐160,000
‐140,000
‐120,000
‐100,000
‐80,000
‐60,000
‐40,000
‐20,000
0
2010 2020 2030 2040 2050
[Million Euro]
Change of fuel tax revenues by major European regions (450 ppm scenario)
East
North
South
West
‐160,000
‐140,000
‐120,000
‐100,000
‐80,000
‐60,000
‐40,000
‐20,000
0
2010 2020 2030 2040 2050
[Million Euro]
Change of fuel tax revenues by major European regions (400 ppm scenario)
East
North
South
West
Source: ASTRA calculations, Fraunhofer-ISI
Figure 13-21: Impact on fuel taxes in the 450 ppm and 400 ppm scenarios in EU27+2
It has been explained that the endogenous ASTRA investment model also dampened the total investment in the mitigation scenarios. Without linking investments to inputs from bottom-up models it turns out that the expenditures for energy i.e. the consumption from the energy sector is one of the important drivers of investments in ASTRA, which is an outcome of the calibration to the period 1990 until 2004. However, the bottom-up models have some overlap with the ASTRA investment model. In particular the energy sector investments should be largely covered by the inputs from the renewables model (PowerACE) and the conversion model (EuroMM). Thus a sensitivity anlysis was made by largely switching-off the endogenous influence of the energy sector on investment demand for the 400 ppm scenario. Figure 13-22 shows the result. The left hand side constitutes the investment figure as presented above for the 400 ppm scenario, but the right hand side shows the switch-off case of the endogenous energy sector investment. In this case, the total investment would be positive in the Western countries and the balance for the EU27 would only be slightly negative in 2050.

Macro-economic impacts of EU climate policy
- 320 -
‐400
‐350
‐300
‐250
‐200
‐150
‐100
‐50
0
50
2010 2020 2030 2040 2050
[Billion Euro]
Investment changes by major European regions400 ppm scenario
North
South
East
West
‐250
‐200
‐150
‐100
‐50
0
50
100
150
200
2010 2020 2030 2040 2050
[Billion Euro]
Investment changes by major European regions400 ppm scenario ‐ limitation of energy expenditure driven investment
North
South
East
West
Source: ASTRA calculations, Fraunhofer-ISI
Figure 13-22: Anaylsing the impact of energy expenditure driven investment changes in the
400 ppm scenarios in EU27+2
Figure 13-23 presents the effect on GDP of this improved investment calculation. The figure shows three scenarios against the base case. This includes the Reference Scenario, which differs from the base case by that it incorporates adaptation of the energy sector, the standard 400 ppm scenario as described throughout this report and marked as 400 ppm low since it should be at the lower end of possible scenarios and the 400 ppm medium scenario excluding the endogenous reduction of investment caused by the reduced demand from the energy sector. We can observe that loss of GDP in the Reference Scenario until 2050 is smaller than in the 400 ppm scenario, which is the -2.7 % difference from Table 13-3. On the other hand we can observe that the new 400 ppm medium scenario comes much closer to the Reference Scenario. Considering that most of the adaptation impacts and cost will occur after 2050, while in the mitigation scenarios these impacts largely happen between now and 2050 as well as that positive effects of mitigation e.g. the reduction of fossil fuel imports (as explained in section 13.3) also strengthen after 2050 our analysis confirms that investment into mitigation seems to be the more promising option. This conclusion is obtained through a purely economic analysis. Considering further the possible external cost of adaptation (e.g. health costs, psychological costs of having to move houses because of flooding) the conclusion to invest into mitigation as the better option would be reinforced.

ADAM 2-degree scenario for Europe – policies and impacts
- 321 -
‐1,000
‐800
‐600
‐400
‐200
0
200
2010 2020 2030 2040 2050
Change of GDP with limited loss of investment
REF 400ppm low 400ppm medium
Source: ASTRA calculations, Fraunhofer-ISI
Figure 13-23: Change of GDP with limited influence of energy expenditures of households
on investment in 400 ppm scenarios in EU27+2
13.5 Conclusions of the macro-economic assessment
The basic conclusion that can be drawn is that mitigation to meet the 2-degree target of the EU wil not destroying economic development. Some European regions will even be better off with mitigation than without mitigation. A loss of GDP in EU27 of -1.7 % and -2.7 % in 2050 in the 450 ppm and 400 ppm scenarios, respectively, is acceptable considering that the financial crisis managed to reduce GDP by -4 % in the EU27 within less than 2 years, while the impact of mitigation remains much more limited over a period of 40 years.
The impact on employment remains much more limited than on GDP, of the order of between +0.2 % and -0.3 % of employment change by 2050. There is considerable variation between economic sectors. Agriculture and industry gain employment because of the increased use of biomass and the mitigation investment into all kinds of machinery and electric appliances, but energy and other market services loose in employment. The energy sector losses because of the reduced demand for energy and the service sector because of the price increase of services induced by the mitigation investment of the service sectors. It is important to note here that the service sectors face significantly higher price increases due to mitigation investment than the manufacturing sectors.
Two issues should also be explained that provide arguments for why mitigation policy could even have a positive economic impact on the EU27: (1) a dampening effect comes from increasing government debt due to reduced fuel tax revenues because of the efficiency improvements, and (2) the ASTRA model considers endogenously the impact of reduced

Macro-economic impacts of EU climate policy
- 322 -
energy expenditures of households on the investment demand of the energy sector, though this is in fact better handled by the bottom-up models and thus overestimates the dampening effect of this consumption shift. Both effects could be reduced e.g. in the first case the government could take actions to maintain their tax base e.g. by taxes on imports of products that are not subject to a climate mitigation policy in the producer countries and thus avoid the crowding out effect of increased government debt. The World Trade Organization (WTO) has just acknowledged that such a policy would be compatible with the current WTO agreements.
Comparing the cumulative amount of mitigation investment and savings of fossil energy imports between now and 2050 it can be observed that before 2040 the cumulative mitigation investments are significantly higher, but this is turned around by 2050 when the cumulative savings of energy imports are higher than the mitigation investment. This trend should continue after 2050 and constitutes a strong argument for mitigation in Europe, as it contributes to both the two major objectives of the EU: winning the battle against climate changes and securing Europes energy supply.
These conclusions are similar to those of the Stern Report Stern (2007), which come to an assessment of a GDP change of the order of -1 % for mitigation to stabilise the climate. The Stern report also makes the important point that world GDP losses due to climate change are estimated to be in the range -5 % or more of GDP. While the EU will probably have lower losses than some other regions of the world, this is still a strong argument for decisive, large scale mitigation action to avoid major climate change impacts. The analysis presented here reinforces the argument that the macroeconomic costs of large scale climate change mitigation are small, compared to the risks, largely because of the strong positive boost to investment in the EU.

ADAM 2-degree scenario for Europe – policies and impacts
- 323 -
14 The Effects of the Financial Crisis on Baseline Simulations with Implications for Climate Policy Modelling: An Analysis Using the Global Model E3MG, 2008-2012
Authors: Terry Barker, S. Serban Scrieciu29
This brief study explores the implications of incorporating the recent financial crisis event for simulating business-as-usual future developments in the global real economy with relevant consequences for modelling climate policy. The 2008 world financial crisis is having strong effects on the structure of the global economy with substantial, and arguably lasting, negative repercussions on economic growth, employment, investment, consumption and trade. The incorporation of such effects into baselines used in energy-environment-economy models is crucial for providing reliable simulations of mitigation measures and climate policy analysis. We incorporate salient aspects of the financial crisis and of policy responses into our overall E3 modelling framework, E3MG, used for climate policy scenario analysis. The E3MG model shows substantial differences in baseline trends when considering the crisis with important implications for the future modelling of energy systems and climate policy responses. However, the caveat here is that the data on the outcome of the crisis is changing fast, by the week, which complicates the modelling. Hence, the results should be treated as preliminary. This analysis provided is up to 2020 and is aimed at informing long-term climate-policy models that do not have the capacity to model short- and medium term economic collapse.
14.1 Introduction
The global economy has begun a severe contraction after the “Big Crunch” of 15 September 2008, when Lehman Brothers went bankrupt and the event confirmed that the global investment banks were essentially insolvent without government support. The contraction has progressed month by month, slowing after the first phase as the reduction in holdings of current stocks comes to an end, but expected to continue as consumers’ expenditure responds to lower real incomes. The current consensus is for a major reduction in global GDP for 2009, with every major industrial country in decline, and world trade falling more strongly.
29 The introductory text of this chapter draws heavily on Barker (2009a). We would like to acknowledge valuable contributions from Hector Pollitt at Cambridge Econometrics.

The Effects of the Financial Crisis on Baseline Simulations with Implications for Climate Policy Modelling
- 324 -
This chapter considers how the crisis will affect greenhouse gas emissions, particularly in Europe, and how the solution to the economic crisis may or may not be positive for mitigating climate change. A positive outcome would take the form of the required co-ordinated intervention by world governments being focused on investment in low greenhouse gas options for climate change mitigation. A negative outcome would be if governments attempted to restore pre-crisis investment patterns, and continued the high-carbon production and consumption patterns that have led to the climate change problem from the beginning.
The outcome remains unclear, but a return to normal seems unlikely. The global financial system has been severely damaged and, according to our analysis as of May 2009, the fiscal stimulus so far is well below what is needed to restore the global economy to pre-2007 rates of capacity utilisation and growth. Not only does it appear that output will be lost across the global economy, but global growth may not return to earlier rates, because the banks’ indiscriminate withdrawal of lending facilities has tended to damage the more innovative, and hence more risky, enterprises. In addition, the indications are that Europe will have a more severe recession than many other regions as a result of greater exposure of European banks to toxic debt and a less aggressive policy response in terms of fiscal stimulus packages. The money creation by the European Central Bank in June 2009 will not necessarily translate to more loans when the banks’ own balance sheets need restoring to safe levels in terms of leverage ratios and safe assets.
It appears that too many countries are relying on the extra spending in the USA and China to pull them back to growth. And the “green” component of the stimulus is mainly in China, South Korea, with a smaller (proportionate) effort in the US. It may be even less in other countries. The green stimulus is also diffused across many worthwhile projects, especially in improving water supplies and quality, but with only a small and uncertain component specifically allocated to mitigating climate change.
This study is structured into five sections. The next section 14.2 discusses the causes and consequences of the twin financial and climate crises. Section 14.3 presents the E3MG modelling approach to the financial crisis. Section 14.4 discusses results in terms of the direct effects of the financial-led economic collapse on greenhouse gas emissions, GDP and employment in EU economies relative to the base case where such crisis is not considered. Section 14.5 concludes.

ADAM 2-degree scenario for Europe – policies and impacts
- 325 -
14.2 The financial crisis and the climate crisis: common traits
Both crises can be traced ultimately to unrestrained pursuit of monetary wealth by individuals and corporations, without consideration of the social consequences or environmental effects of their actions30. In the events leading to the financial crisis, now in turn leading to mass unemployment, existing regulations were weakened and new regulations opposed to promote profit in spite of obvious risks. And although the climate crisis has long been recognised by governments, vested interests have persistently lobbied to undermine political and scientific efforts to introduce policies to address the market failures in the asset and loan markets and assert social priorities and objectives.
The pursuit of self interest in a market economy is seen as a virtue by Adam Smith but, as Foley argues, this thinking is based on the fallacy that the pursuit is necessarily “guided by objective laws to a socially beneficent outcome” when instead it involves moral choices at both personal and social levels (Foley, 2006, p. xiii). The effects of the pursuit of self interest by the bankers are evident from the May report from the Washington-based Center for Public Integrity (2009). The report provides the evidence that the US investment banks were instrumental in promoting subprime lending in the US through specialised dealers, now mostly bankrupt, and in lobbying against regulation to curb the risky behaviour, with the banks profiting by the repackaging of the loans. The bankers profited personally by the banks’ generous bonus schemes, which operate even when the banks make record losses.
Similarly the self interest of those in the fossil-fuel industries, both producing and consuming the fuels, is evident in their unrestrained pursuit of profit in cases where the damages to future generations have become highly likely in the scientific terms of successive IPCC Reports. The lack of corporate restraint is obvious where no adequate global regulations or pricing of environmental damages is in force, such as in the development of bunkering facilities in northern Canada, in expectation of new shipping routes through previously frozen Arctic waters. The certain consequence of such a development is more soot deposits on the Greenland ice sheet and hence more melting, exacerbating the sea level rise as global temperatures rise.
These are instances of two massive market failures associated with systemic risks: (1) the market failure of the financial system when the banks fail to take account of the risk that house and other asset prices might fall over a period of years, despite much historical evidence of such falls, and hence undermine their solvency; and (2) the market failure associated with climate change, that is the use of the atmosphere as a free waste disposal for greenhouse gas emissions from burning of fossil fuels and biomass in market-induced
30 See Barker (2008) for an analysis of the implications of the values embedded in the traditional economic approach to the climate crisis.

The Effects of the Financial Crisis on Baseline Simulations with Implications for Climate Policy Modelling
- 326 -
deforestation. Both crises are the outcomes of highly non-linear systems’ failures leading to extreme events in the economy, e.g. the collapse of Lehman Brothers bank on 15 September 2008, and in the environment (such as climate-change-induced hurricanes). And both threaten the world’s economies with catastrophic collapse.
The solution to both market failures is action on a co-ordinated global investment plan to decarbonise the economy, complemented by a combination of effective regulation and long-term pricing of risk, in the forms of international standards for banks in creating risky assets, a long-term and reliable global carbon price, and international standards for low-greenhouse-gas technologies and products to reduce the costs of mitigation. However, this paper is focused on the effects of the financial crisis on the real economy and greenhouse gas emissions and hence the interaction of the financial and climate crisis, rather than the solution to the problems. Such an analysis will help to inform long-term climate-policy models that do not have the capacity to model short- and medium term economic collapse.
Of course there are striking differences between the two market failures. The financial crisis has been sudden, starting in early 2007, although its roots go back to the financial deregulation begun in 1971 in the UK and USA. The climate crisis is very long term, since it is associated with the accumulation of greenhouse gases in the atmosphere rather than in the emission fluctuations from one year to the next, and the effects of the accumulation have timescales of hundreds if not thousands of years (sea level rise). The risks are also different: the financial risks lie in a collapse of trust in money with the consequent risks of unstable prices and global depression; the climate risks are of wild weather over the indefinite future. The other key difference in the crises is in their solutions. The financial crisis has required an immediate solution to prevent or manage the collapse of the insolvent banks. The climate crisis is slow and ongoing and has not required immediate action, and so it has been more easily delayed and weakened by special interests.
14.3 Modelling the financial crisis
14.3.1 Our E3MG modelling approach
E3MG is the latest in a succession of models developed for energy-economy and, later, E3 (energy-economy-environment) interactions at global level. It is very similar in structure to the E3ME model,31 which follows from EXPLOR, built in the 1970s, then HERMES in the 1980s. Each model has required substantial resources from international teams and each model has learned from earlier problems and developed new techniques. Like its
31 See www.e3me.com.

ADAM 2-degree scenario for Europe – policies and impacts
- 327 -
predecessors, E3MG is an estimated model, based on OECD, Eursotat, UN, IMF and IEA data; it also includes data sets collected from national sources. It encompasses both long-term behaviour and dynamic year-to-year fluctuations, so that it can be used for dynamic policy simulation and for forecasting and projecting over the medium and long terms. As such, it is a valuable additional tool available for economic, energy and environment policy analysis at the global level.
The model represents a different approach to the modelling of technological change in the literature on the costs of climate stabilisation. It is based upon a “new economics”32 view of the long-run, drawing on Post Keynesianism, adopting a “history” approach of cumulative causation33 and demand-led growth, and incorporating technological progress in gross investment enhanced by R&D expenditures. Furthermore, E3MG is a hybrid model in the sense that it integrates a bottom-up energy technology sub-model with energy technologies explicitly modelled34 within a top-down detailed macroeconomic framework. The latter incorporates a dynamic simultaneous system of 22 sets of behavioural time-series equations to explain demand-led growth, as well as prices, energy demand, wages, employment, housing investment and trend output for each industrial sector. Overall, compared to the existing modelling literature targeted at achieving the same goals, we argue that the advantages of the E3MG model lie in three main areas. First, the detailed and disaggregated nature of the model (estimated on annual data spanning 1970–2006 across 20 regions, 42 sectors, 28 consumer spending categories, 12 fuels and 19 fuel users) allows the representation of fairly complex scenarios.35 Second, the econometric grounding of the model makes it better able to represent the behaviour of energy-economy systems. And third, by linking the top-down macro-econometric structure of the model with a bottom-up energy technology sub-model (explicitly modelling 28 energy technologies), a two-way feedback between the economy, energy demand/supply and environmental emissions is achieved. This represents an undoubted advantage over other models, which may either ignore the interaction
32 "New Economics" is concerned with institutional behaviour, expectations and uncertainty as opposed to traditional economics with its emphasis on equilibrium, mathematical formalism and deterministic solutions. We use the term to include various heterodox approaches including Post Keynesian, evolutionary and institutional economics. This new economics approach (see footnote 2) is currently being developed for future research and papers. However, some elements of new economics have already been explored in Barker (2008) and Barker, Scrieciu and Taylor (2008).
33 “Cumulative causation” refers to a dynamic institutional process in which various factors combine to create a vicious or virtual circle to strengthen an initial effect (Berger, 2008). Kaldor (1957, 1972, 1985) developed the economic theory based on increasing returns and agglomeration economies.
34 The energy technologies and the equations underpinning the ETM sub-component of E3MG are also extensively discussed in Barker et al (2005, 2006), Köhler et al (2006) and Barker et al (2007) for the E3ME model, the European counterpart of E3MG.
35 The model’s regions are linked by trade equations based on bilateral trade matrices, and the sectors are linked by 2000-based input-output tables.

The Effects of the Financial Crisis on Baseline Simulations with Implications for Climate Policy Modelling
- 328 -
completely, or only assume a one-way causation. The advantages of using the hybrid approach have been reviewed in Grubb et al (2002) and Hoogwijk et al (2008).
Three main mechanisms describe the key features of accounting for endogenous technological change in the version of E3MG we used. First, at the macro-level, sectoral energy-demand, import and export-demand, and employment equations include indicators of technological progress in the form of accumulated investment and R&D. Second, as described below, the ETM incorporates learning-by-doing through regional investment in energy generation technologies that reduce in cost depending on global-scale economies. And third, extra investment in new technologies, in relation to baseline investment induces further output through a Keynesian multiplier effect and therefore more investment, trade, income, consumption and output in the rest of the world economy. However, further changes can be induced by policy; hence the term induced technological change.36 For example, feed-in tariffs for renewables (as used in Germany) will alter relative prices such that investments in renewable technologies are stimulated and, depending on their learning curve characteristics (and Keynesian multiplier effects at the macro level), they will lead to higher adoption rates. The effects of technological change modelled in this way may turn out to be sufficiently large in a closed global model to account for a substantial proportion of the long-run growth of the system. Further details of the E3MG model are extensively discussed in Barker et al (2005, 2006, 2008) and Barker and Scrieciu (forthcoming).37
14.3.2 Scenarios simulating the financial crisis
This study explores the impact of the ongoing financial crisis and economic downturn on business-as-usual trends up to 2020 (Pollitt and Barker, forthcoming). The financial crisis (labelled “crisis” scenario) was modelled through a baseline (defined here as “trend” representing business-as-usual projections in the absence of a crisis) plus a series of sub-scenarios. The latter simulating the crisis element fall into two groups: aspects of the crisis and current policy, i.e. announced policy stimulus across countries. The baseline without the crisis “trend” scenario is very similar to that reported for ADAM M2 in Knopf et al (forthcoming) and Barker and Scrieciu (forthcoming). At the European country level, baseline “trend” assumptions (e.g. oil prices and population) are discussed in detail in the ADAM deliverable report M1.1.38 In other words, the baseline set of projections excluded the effects
36 The term induced technological change (ITC) refers to further changes in technological progress (i.e. endogenous technological change) that are induced via policy measures (Barker et al., 2006).
37 The model manual for E3MG is currently under development. However, the manual for the European E3ME model, which is similar in structure and econometric method, is freely available online (Cambridge Econometrics, 2007).
38 Deliverable D-M1.1 for the ADAM project (2007) “Report of the Base Case Scenario for Europe and full description of the model system”; contributed with E3ME modelling results; E. Jochem

ADAM 2-degree scenario for Europe – policies and impacts
- 329 -
of the financial crisis. These projections were formed by allowing E3MG to solve year by year over the forecast period. As the estimated output for 2008 at this time was only slightly below trend, the baseline projections roughly show a continuation of growth rates from before the financial crisis.
The inputs referring to the financial crisis being inserted into the “trend” baseline have been carefully defined based on economic theory, historical precedent and the judgement of the modelling team. The crisis has been modelled in order to capture a specific aspect of observable behaviour caused by the downturn, as well as a summarised version of current policy reactions (e.g. fiscal stimulus packages) towards the end of March 2009. In other words, each of the sub-scenarios forming the “crisis” baseline was designed to demonstrate a specific aspect of observed outcomes caused by the crisis. The model results indicate the direct plus indirect impacts of these behavioural shifts.
The behavioural aspects of the financial crisis being modelled in E3MG include:
• Banks cutting back on expenditure, both on capital (e.g. buildings) and labour, in an attempt to protect their own businesses. Investment by the banking sector was assumed to fall by 25% and employment is reduced by 12.5% over 2009-11 compared to baseline “trend”.
• Banks encouraging higher savings rates in order to protect their balance sheets, with a resulting net impact of 0.5 percentage points increase in household savings ratios in 2009;
• Banks reducing lending to business despite stimulus from policy makers, yet again in order to protect their balance sheets. The resulting macroeconomic impacts is assumed to be a reduction in investment by businesses of 5% in 2009-11
• Returning to “normal” (historical averages) savings rates, as banks no longer making available cheap credit. Savings rates are assumed to increase 7-9% (historical level in 2000) in the US, Japan and Western Europe (except Germany, where rates were already high)
• Emerging disincentive to invest created by an uncertain and unstable economic environment particularly with reference to future probability (fuelled by high volatility in asset and commodity prices). It is assumed here that the private-sector business investment (to include R&D) is permanently cut by around 40% over 2009-2011.
• Global commodity prices reacting and declining, with oil prices assuming to fall from baseline values to $60/bbl in 2009 and oil-producing countries cutting back on investment as a result.
M1 Work Package leader (Fraunhofer Institute of Systems and Innovation Research); www.adamproject.eu.

The Effects of the Financial Crisis on Baseline Simulations with Implications for Climate Policy Modelling
- 330 -
Furthermore, the “crisis” baseline scenario as modelled in E3MG includes a summarised version of current policy measures (“fiscal stimulus” towards the end of March 2009 collected as inputs to the model. The focus in on the effects on the real economy so we do not include the large sums of money injected into the global financial system. Central bank interest rates were updated with the latest available information. Two main sources were used for this purpose: Prasad and Sorkin (2009) and HSBC (2009) with additional information (when needed) from the Economist website. Much more detail on the subset of scenarios forming the “crisis” baseline, as well as on the underlying thinking may be found in Barker (2009b) and Pollitt and Barker (forthcoming).
14.4 Impacts of the financial crisis and recession
Before presenting the results, we would like to stress that the results should be treated as preliminary. This is because the data on the outcome of the crisis is changing fast, by the week, which complicates the modelling. Furthermore, though the model is based on historical data, the crisis represents a deep change in economic structure not captured in the time series inputted into E3MG. As a result, the E3MG model is constantly undergoing development to incorporate the flows of new information on the recession.
With these caveats in mind, preliminary results are displayed in Table 14-1showing the growth rates on GDP in major EU economies, the EU and the world both on trend, as adopted in the ADAM baseline, and in the crisis scenario. Figure 14-1 illustrates the table. It is clear that the assumptions and modelling indicate that GDP will be lost not only in the short term but also in the long term. Growth rates are expected to be lower after the economies return to more normal rates of growth after the crisis is resolved. GDP growth rates across all EU economies displayed in Table 14-1 are shown to be below “trend” rates corresponding to a situation where the crisis would not have emerged. Such outcomes were evident in the aftermath to the Nordic economies’ 1992 financial crisis (Ergungor and Thomson, 2006; Ergungor, 2007; Ergungor and Cherny, 2009). In the short term, there is a dramatic drop in world growth rates and across EU economies (Figure 14-1), with world GDP growth rates projected at -1.3 and -1.5 percent, and EU growth rates at -2.8 and -2.1 percent, for 2009, and respectively, 2010. Across most large economies, negative growth rates are expected to persist in the next two years, with the rates turning positive only after 2010. The fall in output is less driven by the activities of the banks by themselves, but more by the effects of the behavioural changes by industry and households. Looking at GDP impacts across EU countries, Italy, rest of EU-15 and UK appear to be the most affected. The former two have declines in output, mainly due to the corrections applied to their savings ratios, whereas the UK (as in the case of US) has both a large financial sector and a savings ratio below that is a long way below historical average.

ADAM 2-degree scenario for Europe – policies and impacts
- 331 -
Germany also experiences a significant reduction in output mostly as a result of produce investment goods or components of these goods being negatively affected.
Table 14-1: GDP Annual Growth Rates across EU regions and the world: Baseline
“Trend” versus “Crisis”
2008 2009 2010 2011 2012 2015 2020
Germany Trend 1.5
1.8 2.1 1.6 1.8 1.7 2.4
Crisis -1.2 -2.2 1.0 1.8 1.1 2.3
UK Trend 1.3
3.0 3.2 3.1 2.8 2.6 2.4
Crisis -2.7 -0.6 2.8 2.9 1.7 2.1
France Trend 1.0
2.3 2.9 1.7 1.3 2.5 2.0
Crisis 2.3 -1.1 1.5 1.1 1.3 1.5
Italy Trend 0.3
1.6 2.2 2.6 2.0 2.3 2.0
Crisis -5.0 -1.8 2.3 1.1 1.3 1.0
Rest of Trend 1.5
3.6 4.3 4.1 4.0 4.3 4.9
Crisis -6.2 -4.0 3.1 3.3 3.6 4.7
EU-10 Trend 4.1
2.1 4.2 3.0 3.6 3.6 5.3
Crisis -2.1 -0.4 4.4 3.8 1.9 4.8
EU Trend 2.4
2.6 3.2 2.8 2.7 2.9 3.1
Crisis -2.8 -2.1 2.3 2.3 2.0 2.9
World Trend 3.0
3.3 3.5 3.4 3.3 3.3 3.4
Crisis -1.3 -1.5 2.8 3.2 2.5 3.1
Source: E3MG modelling results

The Effects of the Financial Crisis on Baseline Simulations with Implications for Climate Policy Modelling
- 332 -
Figure 1: World and EU GDP growth rates: Baseline "Trend" versus "Crisis"
-4.0
-3.0
-2.0
-1.0
0.0
1.0
2.0
3.0
4.0
5.0
2006 2007 2008 2009 2010 2011 2012 2013 2014 2015 2016 2017 2018 2019 2020
% p.a.
World GDP: Baseline "Trend" (% annual growth) World GDP: Baseline "Crisis" (% annual growth)EU GDP: Baseline "Trend" (% annual growth) EU GDP: Baseline "Crisis" (% annual growth)
Source: E3MG modelling results
Figure 14-1: World and EU GDP growth rates: Baseline “Trend” versus “Crisis”
At the aggregate sectoral level, the manufacturing and construction sector as well as agriculture appears to be worst hit by the recession (see Table 14-2). The manufacturing and construction sector is the worst affected mostly because it comprises activities that produce investment goods and the more basic manufacturing sectors that produce inputs to the industries. The agricultural sector also suffers particularly due to a decline in export activities partly due to declining world food prices.

ADAM 2-degree scenario for Europe – policies and impacts
- 333 -
Table 14-2: Sectoral output effects across main activities for the EU E3MG regions: effects in 2020: % difference from baseline “Trend”
Germany UK France Italy
Rest of EU-15
EU-10 Total EU
1. Agriculture -24.4% -16.7% -10.2% -26.4% -27.2% -7.8% -23.3%
2. Energy -5.5% -4.4% -4.0% -12.2% -7.5% -3.8% -6.6%
3. Manufacturing & Construction
-26.0% -25.3% -13.7% -28.9% -39.1% -23.4% -29.7%
4. Services (incl. Transport)
-4.8% -14.3% -8.2% -9.4% -15.7% -9.5% -11.1%
Total -13.6% -16.3% -9.8% -17.6% -25.4% -14.2% -17.9%
Source: E3MG modelling results
Furthermore, as clearly illustrated in Figure 14-2, the main driver of the fall in GDP is the investment spending component. This is due to the nature of the financial crisis and how this has been modelled in E3MG, i.e. the collapse of the banking sector affecting first and foremost business sector through deteriorating lending and a generally depressed confidence in the investment environment. The fall of EU (and developed economy) investments as explained in section 3.2 is largely an exogenous inputted shock into the model, which amounts to around 40% from baseline “trend” levels. Global investments decline by less, as developing economies are assumed to be less affected by the nature of the crisis. By contrast, consumer expenditure declines by less during 2010-2020, partly as a reaction to falling prices and unstable economic environment, with consumers preferring to increase their saving rates as an “insurance” strategy against any potential future job losses or a decline in real wages. As the negative effects on employment lag behind GDP effects (as shown below), consumer spending effects also become more visible in latter years, as job prospects gradually deteriorate.

The Effects of the Financial Crisis on Baseline Simulations with Implications for Climate Policy Modelling
- 334 -
-45%
-40%
-35%
-30%
-25%
-20%
-15%
-10%
-5%
0%
2010 2011 2012 2013 2014 2015 2016 2017 2018 2019 2020
% difference from trend
EU Investment Spending: % difference from "trend" Global Investment Spending: % difference from "trend"EU Consumer Expenditure: % difference from "trend" Global Consumer Expenditure: % difference from "trend"
Source: E3MG modelling results
Figure 14-2: Impacts of the recession on EU and Global Investment and Consumption: % differences from baseline “trend”, 2010-2020
The crisis is also expected to lead to substantial unemployment across the global economy, though the levels of reduction in GDP are expected to be much greater than the magnitude of employment cuts. For example, in 2020, GDP levels are around 15% at the global level and 13% for the EU lower in the crisis relative to baseline trend, whereas the corresponding reduction in employment is projected at 3.4% and 2% for the world, and respectively EU (see Table 14-3). Figure 14-3 shows how the unemployment increase lags behind the fall in output, because employers tend to hold on to their workers at the beginning of a depression in the hope that the recovery will emerge. However, as the downturn progresses, this labour hoarding unwinds and hysteresis effects emerge to make the unemployment more persistent. Hysteresis is a long-observed feature of the labour market: as unemployment persists, the unemployed become more and more unemployable as they adapt their life-styles to being unemployed. The crisis is so severe that we expect the higher unemployment to last for 10 years and more. In Table 14-4, absolute changes in terms of millions of people losing employment due to the economic recession are being simulated for the world and EU. As previously mentioned, E3MG indicates towards a gradual increase in employment cuts. The number of people becoming unemployed reaches around 60 million people at the global level and around 8 million people in the EU, in the year 2020. However, unemployment effects are only partly modelled in the version of E3MG used in this report, as there are no wage adjustments in response to unemployment and the mechanisms for employment to come back

ADAM 2-degree scenario for Europe – policies and impacts
- 335 -
are not fully captured. For this reason, unemployment effects are only reported at an aggregated EU level. However, it is expected that impacts on employment tend to follow those on output, with the exception of countries where output has fallen and labour markets are flexible (e.g. UK), where employment effects are likely to exceed output impacts.
Table 14-3: EU and World GDP, Employment and CO2 Emissions Effects in 2020: %
difference from baseline “Trend”
EU World
GDP in 2020: "Crisis" as % difference from "Trend"
-15.4% -12.9%
Employment in 2020: "Crisis" as % difference from "Trend"
-3.4% -2.0%
Total CO2 Emissions in 2020: "Crisis" as % difference from "Trend"
-10.8% -5.6%
Source: E3MG modelling results
Trend , million persons per annum, 2005-2020
-70
-60
-50
-40
-30
-20
-10
0
2008 2009 2010 2011 2012 2013 2014 2015 2016 2017 2018 2019 2020
million people
World Employment: Baseline "Crisis" as difference from "Trend" - million personsEU Employment: Baseline "Crisis" as difference from "Trend" - million persons
Source: E3MG modelling results
Figure 14-3: World and EU Employment effects: “Crisis” as difference form “Trend”, million persons per annum, 2005-2020

The Effects of the Financial Crisis on Baseline Simulations with Implications for Climate Policy Modelling
- 336 -
Table 14-4: Annual World and EU Employment effects in the “crisis” scenario as difference from “trend” (million persons), 2008-2020
World Employment: Baseline "Crisis" as difference from "Trend" - million persons
EU Employment: Baseline "Crisis" as difference from "Trend" - million persons
2008 0.0 0.0
2009 -21.5 -1.3
2010 -43.6 -2.4
2011 -47.9 -3.3
2012 -45.0 -4.0
2013 -45.0 -4.7
2014 -47.7 -5.6
2015 -51.4 -6.2
2016 -57.0 -6.6
2017 -61.3 -7.0
2018 -64.7 -7.5
2019 -64.3 -7.9
2020 -56.3 -8.5
Source: E3MG modelling results
Figure 14-3 shows the effects on global CO2 emissions. There is expected to be a major reduction below trend levels, such that CO2 emissions are over 10% below baseline levels by 2020 for EU as a whole, and around 6% below business-as-usual trends at the world level (see Table 14-3).

ADAM 2-degree scenario for Europe – policies and impacts
- 337 -
30000
32000
34000
36000
38000
40000
42000
44000
46000
48000
2005 2006 2007 2008 2009 2010 2011 2012 2013 2014 2015 2016 2017 2018 2019 2020
World Total CO2 Emissions: Baseline "Trend" (Mt CO2)World Total CO2 Emissions: Baseline "Crisis" (Mt CO2)
Source: E3MG modelling results
Figure 14-4: Total CO2 Emissions for the World and EU: Baseline “Trend” versus “Crisis”, 2005-2020
14.5 Discussion and conclusions on macro-economic level
The collapse of the global investment banks, with the consequent reduction in lending, instability of prices and falls in investment and trade, has led to reductions in industrial output, personal incomes, household expenditures, and hence in energy use and in greenhouse gas emissions. Since there is a data lag in the reporting of emissions, it is not yet clear how large the reduction will be, but it is likely to undermine earlier scenarios of continuous increases in emissions assumed in IPCC reports and other scenarios. However, at the same time, the global price of oil has fallen substantially from the highs in 2008 of $140/bbl to $50/bbl or lower in April 2009. Lower oil, gas and coal prices are encouraging a switch back to fossil fuels in energy demand, offsetting the effect of the reduction in overall energy demand on CO2 emissions.
The long-term effect will depend on the length and depth of the global recession. During the Great Depression, from 1929-1934, global CO2 emissions fell by 25%, but in the current crisis, which is expected to last at least until 2012, the energy system is substantially different, with coal use largely confined to electricity generation, and transportation a much larger share of overall energy demand. Both sources of demand for fossil fuels are likely to be more responsive to the fall in demand than in the Great Depression, but the industrial use of coal, which collapsed in the US 1929 to 1934, is much less important now. In addition, the lower relative cost of coal, the dominant source of CO2 emissions, and the greater potential for substitution towards coal in modern electricity generation, may lead to more use of coal

The Effects of the Financial Crisis on Baseline Simulations with Implications for Climate Policy Modelling
- 338 -
instead of gas and capital-intensive renewals, especially in developing countries. In other words it is not yet clear how much CO2 emissions will fall over the next year or so. Much depends on the responses of developing country governments to the crisis. If they take the opportunity to modernise or replace their polluting coal-fired electricity plants, switching to gas and renewables, then the emissions may fall rapidly.
Our analysis uses a global energy-environment-economy model (E3MG) to assess these effects and finds that the long-term effect of the crisis is to reduce CO2 emissions by some 10% below a trend baseline by 2020. However, the recession is just beginning and it is far from clear how governments will react in their policies towards the energy sector, and whether the old coal-burning plant will be retired never to return. CO2 emissions could well be much lower relative to trend than reported above, and new data needs to be incorporated in future simulations of E3MG to model this. An uncertainty analysis on modelling the financial crisis to account for such ranges is expected to be carried out in the next phases of using the E3MG model.
14.6 Impacts of economic crisis on sectoral level Authors: Wolfgang Schade, Giacomo Catenazzi, Tobias Fleiter, Anne Held, Martin Jakob, Eberhard Jochem, Ulrich Reiter, Hal Turton.
This section briefly transfers the impacts identified on the macroeconomic level in the previous sections onto the findings obtained by the bottom-up models of the ADAM-HMS. For each sectoral analysis a brief conclusion on the potential impacts of the crisis on energy demand and GHG emissions in the specific sector is drawn. Given the uncertainty reported for the macro-economic results in the previous sections (-15.4% loss of GDP in 2020 compared with trend) and the introduction of economic stimulus programmes the sectoral analyses below assumed a GDP loss of about -10% until 2020, i.e. the level of GDP in the EU27+2 would be -10% lower than in the Reference Scenario, without the crisis.
14.6.1 Impact of crisis on residential sector
The impact of the economic crisis on energy demand and CO2-emissions of the residential sector differs between the Reference scenario and the 2-degree scenario.
In the Reference case without stringent mitigation policy energy demand and direct and indirect greenhouse gas emissions are affected by the disposable income of households and building owners, which would be reduced. Moreover the financial sector and thus the market for loans and mortgages lacks capital or pursues a more conservative policy which results in higher capital costs (as higher risk premiums are required) and rerstricted access to capital. Further, immigration could be negatively affected which would lead to a slightly lower population growth.

ADAM 2-degree scenario for Europe – policies and impacts
- 339 -
These economic boundary conditions have several effects on both physical drivers and specific energy demand levels. These effects oppose each other to a certain extent.
• On the one hand side energy demand and GHG emissions are mitigated due to attenuated construction of new building and due to new flats and houses which will be smaller in size. Energy consuming appliances including those to adapt to climate change are purchased to a lower degree and are smaller in size.
• On the other hand, energy demand and emissions are tend to increase as building owners and consumers are more reluctant to invest in more energy-efficiency or renewable energies. Indeed, both energy-efficient buildings and appliances and renewable energy technologies are characterized by higher up-front costs which might be perceived as a more pronounced barrier in times of economic crisis. In periods with economic uncertainties owners and consumers are usually more risk averse and higher (implicit) discount rates negatively affect the economic viability of such investments or purchases. This effect is intensified if additionally prices of (fossil) energies are negatively affected.
Note however that some of the arguments also might turn out the other way round. For instance, financial markets, investors and consumers might shift their priorities away from shares and other financial products and into more down-to-earth investments such as the real estate sector, individual homes, and energy-efficiency and renewable energy technologies. In this case the (physical) drivers are mitigated less and energy-efficiency und renewable energy choice are affected less than described above. In any case it can be affirmed that the effect of the financial and economic crisis will be limited (some few percentage points of investment at the most).
In the Mitigation scenario the second argument of reduced levels of energy-efficiency and renewable energies gains weight as compared to the Reference scenario. However, in addition to the effects as described above, the impact of the economic crisis in the mitigation scenario also strongly depends on the reaction of policy makers. Remember at this stage that quite broad and intensive policy measures underly the Mitigation scenario. Two outcomes are conceivable:
• Either policy makers react conservatively and cancel policy measures or lower their intensity in the light of the economic crisis. In this case mitigation intensity would be lower than projected in the 2°C scenario.
• Or policy makers view mitigation measures as an economic and fiscal opportunity and foster policy measures. Indeed energy-efficiency measures and investments in renewable energies are more labour intensive as compared to imported fossil fuels. Linking taxes and levies to the consumption of non-renewable resources rather than on labour or income results in more stable fiscal incomes.
To conclude, the economic crisis may negatively affect energy demand and GHG emissions, but to a large extent the impact also depends on the actual choices of policy makers, building

The Effects of the Financial Crisis on Baseline Simulations with Implications for Climate Policy Modelling
- 340 -
owners, financial institutes and consumers and whether they understand the economic crisis as an opportunity to shift their preferences in direction to a more sustainable path.
14.6.2 Impact of crisis on services sector
Buildings are a major contributor to energy demand and GHG emissions of the service sector as is the case in the residential sector. Hence, there are some similarities regarding the impact of the economic crisis on energy demand and emissions (see section 14.6.1). The economic (and financial) crisis curbs the disposable income (i.e. value added, profits) of both of the private and the public sector and reduces the availability of capital. As in the case of the Residential sector these changes in the economic boundary conditions may affect quantitative (physical) drivers, energy use and energy-efficiency levels and, possibly, the attitude and priorities of policy makers and other actors that determine policies, investments and energy use.
Quantitative drivers are negatively affected by lower economic growth, but only to a limited extent. Indeed it can be assumed that labour force in the service sector is slightly negatively affected on the long run by the lower level of GDP though the floor area of buildings as a long lasting capital good is less attenuated. To a certain extent also the use of energy might be reduced due to lower employment and due to a more careful use of resources. Note however that energy use is rather related to buildings (and floor area) than to the number of building users which limits this latter effect.
On the other hand the intensity of investments into energy-efficiency and the shift towards renewable energies might be lowered to a certain extent, since upfront add-on costs are often rather avoided in times of economic uncertainty.
Hence, in the case of the service sector, the overall impact on energy demand and emissions is presumably much less than the impact on economic growth, especially in the reference scenario. In the case of the 2-degree scenarios this statement still holds unless it is assumed that policy measures are cancelled or strongly weakened in their intensity.
14.6.3 Impact of crisis on industry sector
Although the economic crisis was not explicitly modelled in the scenarios, the main impacts on industrial energy demand as well as GHG emissions are described in the following.
Of all the sectors, the industrial sector shows the biggest impacts from the economic crisis on the emission level. This is mainly due to the fact that if the value added decreases, physical production also goes down and thus also energy demand and GHG emissions. In other words, there is a strong correlation between economic activity and level of emissions in industry. This correlation is even stronger, when considering structural effects with industry, as it can be observed that the demand for as well as the production of the most CO2 intensive products

ADAM 2-degree scenario for Europe – policies and impacts
- 341 -
like steel or cement may decrease significantly more than the other industrial sectors. This is particularly true in the short term. Effects in the longer term are mainly determined by the lower growth path of the economy that directly effects the emission level as described above. Another long term effect comes from the investment behaviour of companies, as in times of economic downturn they are reluctant to invest in new and more efficient production facilities and consequently the annual improvements in technical energy efficiency are lower. However, this effect is slightly offset by the fact that during the economic crisis mainly the least efficient and productive plants are closed, while they are replaced during times of the following economic upturn by new and more efficient ones.
To conclude, if in the long-term, the growth of industrial value added is lower by about 10% in comparison to the development without the crisis (e.g. up to the year 2020) this would probably have an effect on the emission level in a similar order of magnitude or somewhat less to to the different counteracting effects mentioned.
14.6.4 Impact of crisis on transport sector
The transport sector was hit similarly heavily by the economic crisis to the industry sector, in particular as industry sectors with high levels of transport demand were hit hardest (e.g. steel procuers, car manufacturers, some bulk chemicals). Manufacturers of trucks reported losses of sales of new trucks of up to -80% for some months in the first half of 2009. The German railway company DB had to rent 170 km of tracks just to park 8000 freight wagons at the end of 2008 that were not needed anymore due to the crisis as rail freight transport lost some 20 to 30% of demand. About 15% of world merchant fleet is currently idling in front of the ports, because of lack of demand in particular for container transport.
Obviously such a reduction in freight transport demand will reduce the GHG emissions of freight transport by a similar magnitude i.e. by about -10 to -25% compared with a case without the crisis. Since freight transport accounts for about one third of GHG emissions this would imply a reduction of -3 to -8% of transport GHG emissions. This situation would be largely maintained with the assumption that GDP remains -10% below the Reference Scenario development. Only in case of catch-up of GDP would the GHG emissions also catch-up to the levels in the Reference Scenario. A second issue concerns technical progress. The retiring of vehicles will start with the less efficient and thus more costly ones such that the specific emission levels of the remaining fleet should be lower than without crisis. This effect should be permanent, given that we assume a permanently lower level of GDP.
Passenger transport is affected less than freight transport. However, the main drivers of passenger transport, i.e. income and employment, are also expected to be reduced in the medium-term by a permanent crisis with a loss of 10% of GDP. Secondly, some of the economic stimulus packages include scrappage schemes providing subsidies for old car

The Effects of the Financial Crisis on Baseline Simulations with Implications for Climate Policy Modelling
- 342 -
scrapping in case of the purchase of a new car. This leads to a renewal of the fleets and thus should lower the specific consumption and GHG emissions, though in most schemes the option, which would have been very promising in terms of contibuting to climate policy, to require that the new car is fuel and GHG efficient, was not considered. Thus the potential to save GHG was reduced. Overall it can be expected that also passenger transport would reduce its GHG emissions by -5 to -10% compared with a no-crisis scenario.
Overall, it seems that transport should reduce its GHG emissions by about -4 to -10% in a scenario with economic crisis compared with a no-crisis scenario.
Finally, it should be pointed out that the transport sector required government support for a number of mitigation measures (e.g. subsidies for electric vehicles, support of R&D into vehicle efficiency and batteries), which might not be provided in a crisis scenario, in which governments are facing high debt due to funding economic stimulus programmes and reduced tax revenues, because of the crisis. This could reduce the potentials to save GHG in the 2-degree scenario.
14.6.5 Impact of crisis on energy conversion sector
The ongoing economic crisis potentially has several impacts on the energy conversion sector. In our results for the Reference Scenario and 2-degree Scenarios (see chapter 11) we show the need of investments in the range of €500-600 billion until 2020 to install additional generation capacity and to build up renewable capacities. Due to the economic crisis, these investments are likely to be delayed given limited availability of finance. In particular, projects for riskier technologies (i.e., where the technologies are less mature or dependent on uncertain government subsidies) are even more likely to be postponed or even canceled. To balance final energy demands, existing power plants with lower efficiencies and higher emissions per kWh are therefore likely to be operated for longer and retired later, resulting in higher emissions.
The impact of the crisis on projects for renewable generation capacities remains unclear for the moment. Private investors are likely to postpone investments in renewable electricity generation if there are increasing doubts about whether governments will maintain policy support, such as assuring stable feed in tariffs or subsidies for these costlier technologies. Since governments are likely to be under pressure to reduce budget deficits, it is unclear if measures supporting renewables are likely to be maintained. Similarly, the higher energy costs for consumers from feed-in-tariffs may become difficult to justify in the face of reductions in income. On the other hand, renewables may find additional support through various ‚green’ financial stimulus packages under discussion or in the process of implementation.

ADAM 2-degree scenario for Europe – policies and impacts
- 343 -
It was shown within the ADAM project that greenhouse gas emissions already need to be reduced in the short term to mitigate climate change which then leads to the introduction of effective emission prices. Important in this respect is a timely international agreement on stringent abatement targets (and hence high CO2 prices) which could be either achieved by emission taxes or a cap and trade system. In the context of the crisis, governments may be more willing to embrace such measures since they may provide an important source of additional revenue, to make up for the shortfalls in income and corporate tax revenue, and higher outlays. However, it will be critical to address concerns regarding the introduction of new taxes or levies during a time of economic weakness. It will also be necessary to ensure that a large share of any carbon tax revenue is reinvested in the energy conversion sector to facilitate the change to a more sustainable energy system.
It is also worth mentioning that the drop in economic output from the crisis is leads to reductions in demands for electricity and fossil fuels across the industry or services sectors (see above sections). This in itself is likely to lower annual emissions at least during the crisis and shortly afterwards. This may persist longer if the recovery is slow and the long-run growth potential of the economy is lower than anticipated prior to the crisis. Accordingly, the high emission levels seen in Europe before the crisis may take some time to be reached again. At the same time, however, the lower rate of economic growth is likely to coincide with a slower rate of technological innovation and deployment of new technologies, leading to a slower reduction in energy intensity.
14.7 Conclusion on impacts of crisis on the sectoral level
The sectoral analysis concluded that the economic crisis will reduce the GHG emissions in the short-term and under a scenario of a permanent loss of GDP by -10% also in the long-term. The sectors reducing GHG emissions most due to the crisis would be industry and transport, which could reduce GHG emissions in the same order of magnitude as GDP.
In some cases, the crisis itself as well as the economic stimulus programmes will contribute to permanent reductions of GHG emissions by putting high polluting vehicles of facilities out of service when their capacity is not needed anymore due to the crisis as well as by funding the renewal of vehicle fleets.
However, for the 2-degree scenarios there is also the major risk that lack of funding due to the crisis (e.g. because of reduced government budget) and increased risk averseness of investors or households will hamper the implementation of measures required to achieved the GHG emission reductions. This means, if policy does not put particular emphasis on mitigation policy the “conventional” way of handling the crisis would significantly reduce the chance that such 2-degree scenarios can be achieved.

The Effects of the Financial Crisis on Baseline Simulations with Implications for Climate Policy Modelling
- 344 -
One option to link mitigation policy and crisis managment would be to follow the idea of the “Green New Deal”, which is to always link the economic stimulus with the requirement to introduce green technologies and GHG lean processes.

ADAM 2-degree scenario for Europe – policies and impacts
- 345 -
15 Conclusions and policy recommendations
Authors: Wolfgang Schade, Eberhard Jochem, Wolfgang Eichhammer, Tobias Fleiter, Anne Held, Martin Jakob, Silvana Mima, Ulrich Reiter, Hal Turton.
The broad message of the sectoral analyses performed for Europe using the ADAM Hybrid Model System (ADAM-HMS) and the POLES model is the same: a pathway to reach the 2°C target is technologically feasible. However, there is no silver bullet in climate policies to achieve the goal and to optimize costs and benefits. All the options of emission reductions will have to be forcefully activated and sustained over a long time horizon. A broad package of policies to stimulate technological change as well as behavioural change has to be implemented by the EU, the Member States, municipal governments and numerous actors from the public and the private sectors.
The above fundamental outcome is explored in detail in the following sections. The conclusions start with a section on methodological conclusions followed by the conclusions for the sectoral level, the macro-economic level and the impact of the crisis on climate policy. The final section presents policy recommendations.
15.1 Conclusions and recommendations on the methodology
Our work tackled a number of important methodological challenges, some of them for the first time in that detail in climate policy analysis. A clear advantage of the chosen approach has been the parallel application of two methodologies to answer the question of the technological pathways and feasibility to achieve the 2-degree target for Europe: (1) the ADAM Hybrid Model System (ADAM-HMS), and (2) the POLES model. This approach enabled the results of the other parallel approach to be questioned and the technical solution to be verified. The outcome was that our work identified two feasible and economically viable technological pathways towards the 2-degree target.
The greatest methodological challenge was the integration of eight sectoral detailed bottom-up models and one macro-economic model into one interacting and integrated model system that is able to deliver consistent scenario results within a limited timeframe. We call this system the ADAM Hybrid Model System. The nine models are coupled via a web interface, which currently has to be applied by a central (human) operator. The interface is called Virtual Model Server (VMS). Each model result is delivered in a structured way to the VMS, is then processed and forwarded again in a structured way to the subsequent client models of the VMS. The VMS handles the data exchange in any direction i.e. from top-down to bottom-up, vice versa or in between the bottom-up models. To our knowledge this is the first time that such a hybrid system was successfully made operational for climate policy analysis.

Conclusions and policy recommendations
- 346 -
The main requirements for improvements of the methodology are the automation of the VMS and having the system accessible in a decentralised manner via a web-interface instead of having a repository to deliver and receive the data to and from the operator. Further, the number of iterations that have been made in ADAM for generating the results should be increased, as the convergence achieved in particular for the CO2 certificate prices could and should still be improved.
15.2 Conclusions from the bottom-up analyses
In the details of how and when, the two bottom-up analyses with the ADAM-HMS and the POLES model provide mostly consistent, but also partially divergent answers. Common to both approaches is the underlying pre-requisite of stringent policies and support to be able to meet the targets set by the European Commission.
In the ADAM-HMS, climate change mitigation concentrates on fostering a broad portfolio of renewable energies (including geo thermal and solar thermal) and efficiency technologies and practice (e.g. fuel efficiency standards of cars, insulation of buildings, top runner approach to electric appliances, energy service management systems), while, in POLES, energy-efficiency plays a smaller role and more weight is given to the use of biomass (including imports from outside of Europe) and to carbon capture and storage technologies.
Hence, the outcome of the ADAM-HMS is based on the findings that large energy and material efficiency options are available at a profitable level or low cost (partly used already in the Reference Scenario) and that large renewable energy potentials (both thermal and for electricity generation) can be tapped by adequate promotion measures which in turn reduce their costs by learning and economy of scale effects. The ADAM-HMS is mainly based on technologies and practices which are already present in the market place even though techno-economic progress is assumed. New energy- and material-efficient technologies as well as renewable energy technologies that might enter the market in the next decades are not a pre-requisite of the outcome, but would ease its realisation. Indeed, the literature is optimistic about the speed of market penetration of energy-efficiency and renewable energies.
Energy-efficiency is increased in the POLES model also, but to a lower extent and starting later and from a less efficient Reference Scenario. Fossil fuels in the end use sectors are displaced by biomass and electricity (also in cars and heat pumps) which is produced by nuclear energy, biomass, other renewables and fossil primary energy. CO2-emissions from such fossil energy use are assumed to be captured and stored in aquifers.
The difference between the two proposed pathways of the ADAM-HMS and POLES are well illustrated by their contributions of emission cuts (Figure 15-1).

ADAM 2-degree scenario for Europe – policies and impacts
- 347 -
0
500
1000
1500
2000
2500
3000
3500
4000
4500
5000
5500
6000
2005 2010 2020 2030 2040 2050
Categories of savings in ADAM‐HMS in EU27[Mt CO2]
Other (incl. CCS)
Demand shift
Energy Efficiency
Fuel switch (incl. Renewables, biofuels)
400ppm
0
500
1000
1500
2000
2500
3000
3500
4000
4500
5000
5500
6000
2005 2010 2020 2030 2040 2050
Categories of savings in POLES in EU27[Mt CO2]
Other (incl. CCS)
Demand shift
Energy Efficiency
Fuel switch (incl. Nuclear, Renewables)
400ppm
Source: ADAM-HMS and POLES
Figure 15-1: Comparison of categories of CO2 savings in EU27 in ADAM-HMS (left) and
POLES (right), 2000 to 2050, 400 ppm variant of the 2°C Scenario
The reasons for divergence between the two model systems must be looked for in the different expectations of how barriers to implement technologies can be overcome. Such barriers could be technological, economic or acceptance barriers, which require different and sector specific approaches. Thus the results of the two analyses can be interpreted as two possible storylines on how to reach the 2°C target which emphasise different, alternative mitigation options and related policies.
The baseline for both storylines is that carbon, or GHG emissions, have to be given a price, either in the form of an ETS or a greenhouse gas tax. However, such a policy on its own does not seem to be sufficient since (1) the price signals of an ETS in the first decades would be far too low to stimulate sufficient policy support for new technologies and sufficient behavioural change to implement sectoral policies. (2) Pricing systems are intended to affect markets, but markets in general apply a short-term perspective, looking at short-term rates of return and short-term break-even points, while the system transitions necessary for climate policy require a long-term perspective and can only be implemented over a long time horizon. Thus putting a price on greenhouse gases has to be accompanied by sectoral policies that give a powerful stimulus to new technologies and behavioural change from now until 2050.
The first storyline relates to the results of the ADAM-HMS. It concludes that the 2°C- Scenario for Europe can be achieved by: (1) immediate action investing in: (2) energy efficiency, (3) renewables, and (4) material efficiency. In case of partial failure to deliver or in case of delays, the second storyline from POLES could be followed, which argues that Europe can achieve the 2°C Scenario by (1) increased electrification, (2) high use of biomass (also from imports), and (3) substantial use of carbon capture and storage technologies (CCS).
To maintain the most economic options Europe would have to invest in R&D and large scale demonstration sites to further develop renewable technologies such as geothermal and wave energy and the CCS technology. Lastly, it should be mentioned that CCS constitutes only a transition technology because CO2 storage capacities are finite and limit CCS in the long run.

Conclusions and policy recommendations
- 348 -
15.3 Economic impact of mitigation in Europe
The basic conclusion from an economic point of view is that mitigation measures needed to meet the 2-degree target of the EU will not fundamentally alter Europe’s economic development path. Some European regions will actually be better off with mitigation than without mitigation. A loss of GDP in EU27 of -1.7% and -2.7% in the 450 ppm and 400 ppm variants of the 2°C Scenario respectively at the end of the period in 2050, is acceptable considering that the financial crisis caused losses of GDP of -4% to -6% in the EU27 within less than 2 years, while the impact of mitigation remains less than half of this over a period of 40 years.
The impact on employment remains even more limited than on GDP. It is projected to be between +0.2%, i.e. mitigation fosters employment growth, and -0.3% of employment change until 2050 for the different regions of the EU. However, the sectors display considerable variation. Agriculture and industry gain employment because of the increased use of biomass and the mitigation investment into all kinds of machinery and electric appliances. The energy sector and other market services loose in employment: energy because of the reduced demand for energy and the services sector because of the price increase of services induced by the mitigation investment of the service sectors. It should be noticed that the service sectors face significantly higher price increases due to mitigation investment than the manufacturing sectors.
It should be pointed out that there are arguments that our results for the impact of the 2°C Scenario would be at the lower bound of possible changes of GDP. In particular model limitations may have led to double counting of avoided investment in the energy sector, so investment could be higher than projected here. A laissez-faire approach of government in response to the deterioration of its tax base related to fuel taxes rather than assuming revenue neutrality as in the current analysis (i.e. just accepting the reduction in revenues, leading to a reduction in deadweight losses from taxation) provide the arguments for the potential to develop economic scenarios in which mitigation might even generate a positive economic impact.
Comparing the cumulative amount of mitigation investment and savings of fossil energy imports it can be observed that before 2040 the cumulative mitigation investments are significantly higher, but this is turned around by 2050 when the cumulative savings of energy imports become higher than the mitigation investment. This trend should continue after 2050 and in this sense, mitigation measures represent a pre-investment into a profitable future which constitutes a strong argument for mitigation in Europe, as it contributes to both the two major objectives of the EU: winning the battle against climate change and securing Europe’s energy supply.

ADAM 2-degree scenario for Europe – policies and impacts
- 349 -
15.4 Impact of the economic crisis on climate policy
The collapse of the global investment banks, with the consequent reduction in lending, instability of prices and falls in investment and trade, has led to reductions in industrial output, personal incomes, household expenditures, and hence in energy use and in greenhouse gas emissions. Since there is a data lag in the reporting of emissions, it is not yet clear how large the reduction will be, but it is likely to undermine earlier scenarios of continuous increases in emissions assumed in IPCC reports and other scenarios.
The long-term effect will depend on the length and depth of the global recession. During the Great Depression, from 1929-1934, global CO2 emissions fell by 25%, but in the current crisis, which is expected to last at least until 2012, the energy system is substantially different, with coal use largely confined to electricity generation, and transportation a much larger share of overall energy demand. Both sources of demand for fossil fuels are likely to be more responsive to the fall in demand than in the Great Depression, but the industrial use of coal, which collapsed in the US 1929 to 1934, is much less important now. It is not yet clear how much CO2 emissions will fall over the next year or so. Much depends on the responses of developing country governments to the crisis. If they take the opportunity to modernise or replace their polluting coal-fired electricity plants, switching to gas and renewables, then the emissions may fall rapidly.
Our macro-economic analysis of the current crisis uses a global energy-environment-economy model (E3MG) to assess these effects and finds that the long-term effect of the crisis is to reduce CO2 emissions by some 10% below a trend baseline by 2020. However, the recession is just beginning and it is far from clear how governments will react in their policies towards the energy sector, and whether the old coal-burning plant will be retired never to return.
The sectoral analysis of the potential impacts of the economic crisis concluded that it will reduce the GHG emissions in the short-term and under a scenario of a permanent loss of GDP of -10% also in the long-term. The sectors reducing GHG emissions most due to the crisis would be industry and transport, where reductions in GHG emissions of the same order of magnitude as GDP are estimated.
In some cases, the crisis itself as well as the economic stimulus programmes will contribute to permanent reductions of GHG emissions by accelerating retirement of vehicles or facilities when their capacity is not needed anymore due to the crisis as well as by funding the renewal of vehicle fleets.
However, for the 2-degree scenarios there is also the major risk that lack of funding due to the crisis (e.g. because of reduced government budget) and increased risk averseness of investors or households will hamper the implementation of measures required to achieve the GHG emission reductions. This means, if policy does not put particular emphasis on mitigation

Conclusions and policy recommendations
- 350 -
policy the “conventional” way of handling the crisis will significantly reduce the chance that such 2-degree scenarios can be achieved. Therefore, policy has to aim for policy
programmes that integrate mitigating the crisis and mitigating climate change.
One option to link climate mitigation policy and crisis management would be to follow the idea of the “Green New Deal”, which is to always link the economic stimulus with the requirement to introduce green technologies and GHG lean processes.
15.5 Policy suggestions
From the bottom-up analysis of climate change mitigation options in Europe we recommend the pursuit of the following strategy and principles to achieve the ambitious goal of the 2°C stabilization target. It is emphasised that these items are not optional, but it is a pre-requisite to take up all of them in order to maintain a coherent set and to assure success.
• Set the correct economic incentives : Assign carbon (or GHGs) a price as this translates the environmental constraints into a market signal.
• Set the necessary boundary conditions: level the playing field by implementing a coherent set of policy measures to overcome barriers and to guide (economic) incentives and to provide certainty for investors.
• New technologies play an important role in achieving the goals of ambitious climate policy economically. Thus considerable investments for public and private R&D are required for efficiency technologies, new renewables and, to limited extent, also CCS.
• Take immediate action since each year lost before shifting the transition pathway towards a low carbon society mean that even stronger action must be taken in the subsequent years.
Ultimately the goal of these policy strategies should be market transformation, i.e. enabling a take-up of low carbon technologies by the markets.
Coherent set of policy measures
There is a wide set of policy measures available that has been developed by the community and that has been explored in various countries (see various publications from the IEA, Fraunhofer ISI, and others). This includes codes and standards including mandatory energy performance standards (MEPS), financial instruments such as preferential loans and others, information instruments such as labels and public awareness campaigns, and professional training in various sectors (construction, energy conversion and use, financial, public administration). Ultimately limited time frame subsidy schemes that could be financed by a carbon levy might be necessary to achieve underlying ambitious assumptions. The optimal

ADAM 2-degree scenario for Europe – policies and impacts
- 351 -
choice of these instruments depends on the situation of the countries considered and on the existing obstacles in individual sectors and target groups.
It is crucial to understand that not one or some few policy measures should be implemented, but a bundle of policy measures to address multiple barriers and the challenge which is multi-dimensional. Such a bundle should form a coherent set where individual measures are related to each other. The following paragraphs provide the concept of such a policy bundle, which is detailed in sections 5 to 11 of this report.
Residential and service sector
Policy instruments are structured according to the specifics of the energy use in the residential and the service sector: buildings, building technologies such as ventilation and cooling and appliances in households and offices. As mentioned above a pre-requisite of these sector-specific measures is an adequate economic framework (i.e. carbon pricing).
Whereas in the case of new buildings the adequate policy instrument is quite straightforward (codes and standards combined with labels and professional training), implementation of energy efficiency renewable energies in existing buildings poses several unique challenges. Policy measures in this sector include:
• Address the principal-agent problems between builders and investors and between building owners and tenants.
• Energy audits to point out inefficiencies and to provide technical and financial information to investors and building owners about what actions can be taken to reduce their energy bills and at what cost.
• Information campaigns to foster public awareness and local information centres that provide advice to households and small-to-medium size enterprises.
• Professional training for architects, planners and craftsmen.
• Financial instruments including preferential loans, contracting and ultimately subsidies to address the barrier of higher initial investment costs. This requires the participation of private banks.
Regarding electrical appliances, the following policy measures have been assumed in the projections and are subject to our policy recommendations:
• Establish regularly updated minimum energy performance standards (MEPS) to ensure phase out of inefficient equipment and products.
• Design labels (comparison labels and endorsement labels) to inform consumers of the costs and benefits of the most and least efficient appliances on the market.

Conclusions and policy recommendations
- 352 -
• Encourage well monitored voluntary or negotiated agreements with appliance manufacturers to enhance the overall efficiency of products.
• Support research and development, including encouraging manufacturers to integrate energy efficiency considerations into the early stages of product design.
Apart from the instruments stated above which are valid for both residential and commercial buildings, the following instruments are specifically targeting the buildings of the service sector including the public sector:
• Encourage integral planning and commissioning of new buildings to establish energy-efficient operation.
• Stimulate continuous monitoring and optimisation of building technology operation to avoid energy consumption without use.
• Promote the use of renewable energies including ambient air and ground sources in the context of (free) cooling and managing heating and cooling needs.
To conclude: A very active energy efficiency and renewable energy policy is needed by all the European countries regarding buildings in the service sector, as the re-investment cycle of buildings and building technologies is quite long (20 to more than 60 years). It must be stressed that the intensity of policy measures has to be augmented considerably compared to past and present activities in order to be able to achieve the improvements and emission reductions described in this section.
Industry and material efficiency
The emission and energy demand reductions of the industrial sector in the 2°C Scenario are enormous and will need strong policies to be achieved. Policies on material efficiency have still not received the necessary attention as a climate change policy element reducing the industrial energy demand by some 20 %. Energy efficiency has to improve a lot faster than economic growth by applying the relevant policies. This constitutes a major challenge in the light of past developments.
Policy instruments are differentiated between large energy-intensive companies that may participate in the EU emission trading system (ETS), and other, small and medium sized enterprises. For companies under the ETS regime increasing certificate prices will render mitigation options profitable to a large extent.
For others the ETS provides no incentives due to the non-economic nature of the barriers. Often, cost-effective options are neglected by company decision makers, because they are not in their core interest. Here additional policies are required, such as a set of policies to exploit

ADAM 2-degree scenario for Europe – policies and impacts
- 353 -
the frequently cost-effective saving potentials due to optimisation of motor and lighting systems as well as steam and heat supply systems:
• Instruments like the energy efficiency networks, energy efficiency funds and energy management systems as well as wider use of contracting are very effective with respect to reducing transaction costs, to raise and direct awareness of companies and to overcome financial bottlenecks.
• Efficiency potentials of mass produced investments goods such as electrical motors, pumps, fans, compressors can most efficiently be realised by standards and labelling. The minimum energy performance standards (MEPS) for electric motors are one example.
• In particular, to boost industrial process innovations and to improve energy efficiency in the long-term, R&D spending need to increase significantly. A time frame of 10-20 years for the development of new marketable production processes together with a high risk of failure is not unusual. In order to undertake these long-term investments companies mostly need public R&D support.
• Besides the strong energy efficiency improvements, a comprehensive material efficiency strategy plays a key role in reducing the demand for emission intensive products, also by substituting certain products with low carbon products or materials. The policy instruments needed are quite similar to those in improving energy efficient solutions (e.g. technical standards for recycling, professional training, information campaigns, financial incentives, learning networks, and R&D).
Transportation
In the past, the transport sector has been excluded from the international greenhouse gas emission agreements. Thus its emissions have continued to increase strongly and it is a growing obstacle to climate policy. Recent studies have shown the large GHG reduction potentials in the transport sector. This is confirmed by our analysis. However, including transport in the EU-ETS is not sufficient to transform it into a low carbon and climate-friendly activity. Thus besides including transport in the EU-ETS, a package of transport-focussed policy measures has to be implemented, including regulation, taxation, R&D support and information campaigns. One main issue is that policy-makers have to make it very clear to decision-makers in companies and households that climate protection policies in the transport sector are not a short-term policy fashion, but will be pursued forcefully and over the medium and long term.
In this summary only the core policy measures to be taken in the transport sector should be spelled out:

Conclusions and policy recommendations
- 354 -
• Energy efficiency improvements: even with current combustion engine technology large efficiency gains of vehicles can be achieved. Setting CO2 emission limits for cars, light duty vehicles and heavy trucks should be the key priority in the short- to medium-term.
• Fuel switch and new technologies: in the medium to long-term this will play the largest role. The development of electric vehicles and - assuming that the battery capacity problem can not be solved – hydrogen fuel cell vehicles should be fostered by R&D , feebates and similar market introduction programmes. This holds for cars and light duty vehicles.
• Efficient logistics and demand shift: the EU has successfully implemented measures to improve the competitiveness of railways. Together with logistics improvements for road, ship and rail this should be continued to shift more long-distance freight transport towards rail and to reduce vehicle-km by improved load factors and reduced empty trips.
• Biofuels: since for heavy trucks and air transport technical options are limited and/or require very long time scales the binding use of biofuels (full plants/2nd generation and algae/3rd generation) should be introduced by setting quotas of blended fuel.
The European power conversion sector including renewable energy sources
A number of important changes are required in the conversion sector to achieve the stringent mitigation targets explored in this analysis. These include phase-out of CO2 emitting fossil generation, a continued deployment of nuclear energy and large-scale deployment of renewables. To achieve the required changes, we recommend the application of the following policy measures in the conversion sector:
• address concerns regarding waste disposal, risk of accidents and nuclear proliferation with regard to the use of nuclear energy and thus ensure sufficient public support for this technology.
• set high and stable CO2 prices which are likely to be achieved by CO2 taxes or cap and trade systems to bring forward the phase-out of CO2 emitting fossil generation.
• support open and efficient markets for international electricity trading. Thus, additional flexibility where countries have lower access to power plants that can be operated more or less on demand, such as hydroelectric power plants with pump storage, can be provided. Electricity trading also enables the exploitation of the renewable potentials in those regions where they are highest.
Increasing the share of renewable energy sources in the electricity mix was identified as a crucial factor within the conversion sector which could make a substantial contribution to mitigating climate change. However, the sole application of the European emission trading

ADAM 2-degree scenario for Europe – policies and impacts
- 355 -
scheme does not provide sufficient incentives to make most renewables options competitive with other conversion technologies at least during the next two decades. The enhanced use of renewable energy sources requires the implementation of various additional policy measures including:
• the application of sectoral policy measures adapted to the specific requirements of renewables, such as feed-in tariff systems. These policies should be technology-specific and provide sufficient investment security. The policy measures should be based on a financial support level which is designed such that renewables projects become profitable without overcompensating investors.
• Implement research and development (R&D) policies for emerging technologies. Owing to the fact that the policy assumptions in the 2° Scenario reflect very ambitious climate targets, this would be likely to happen.
• Consider further alternatives, such as importing green electricity from outside the EU, to a limited extent.
Forestry
Improved forest management in all European countries would increase the potential for wood fuels in the form of a CO2 neutral fuel. New technologies and policy efforts would enlarge the potential. Such efforts include full-service contracts to small private forest owners, support to ownership co-operations, support in making management plans, awareness campaigns about the environmental benefits of biomass harvest, and stimulation of integration of different types of measures with biomass removal (nature conservation measures, fuel reduction against forest fires).
Cross-cutting and long-term policy aspects
Energy subsidies of the fossil fuel industry are still substantial – whether direct or indirect - in many European countries. Phasing out these subsidies by realigning fuel prices would stimulate both supply- and demand-side energy efficiency investments.
Foster the system transition of urban structures since (1) more than 50 % of persons live in urban areas and their share will grow; (2) the integrated development of city structures and transport infrastructures reduce the need for motorized transport and paves the way for new forms of mobility (e.g. car- and bike-sharing, electric city and delivery vehicles, barrier-free, multi-modal transport); (3) the creative potential of urban areas attracts qualified and young/innovative groups of people open to transitions of urban structures.

Conclusions and policy recommendations
- 356 -
Multi-stakeholder collaborative efforts that facilitate technology diffusion to emerging market economies and developing countries where commercial market opportunities exist should be considered as a way to reduce costs by additional economies of scale. Also the opposite should be explored given very large mass consumer markets in Asia or low labour cost to produce labour–intensive efficiency goods (e.g. heat exchangers). Such initiatives should focus on increasing the scope of the technology transfer process to include small and medium entrepreneurs, large multi-national energy companies, and other stakeholders such as research institutions and financial institutions.
The measures suggested in this report are not science fiction. However, they need strong support by todays policy-makers, who have the most difficult task. They will have to promote such policies even though visible climate impacts are limited, yet, and knowledge of the possible impacts is limited as well. Future generations of policy-makers - and private decision-makers - will have an easier task, as climate change will be more visible. On the other hand, for future policy-makers it would be too late to mitigate climate change, if today’s policy-makers do not start to implement our suggested mitigation measures.

ADAM 2-degree scenario for Europe – policies and impacts
- 357 -

Annexes
- 358 -
ADAM 2-degree scenario for Europe – policies and impacts
- 359 -
16 Annexes
Authors: Nicki Helfrich, Wolfgang Schade, Laura Quandt
16.1 Details of the Virtual Model Server (VMS) Managing and automating the exchange of data between the models was a major challenge within the ADAM M1 project, since 7 to 9 models covering different fields of specialisation were exchanging data. This exchange had to be done repeatedly, resulting in iterations of model simulations in order to achieve convergence, harmonise the model’s assumptions and generate consistent results. Manual transformation of the repeatedly exchanged huge amounts of data would have been highly repetitious work, which naturally is extremely error-prone and time consuming.
Therefore, a configurable software – the Virtual Model Server (VMS) – was developed for the data exchange and used as described in the two subsequent sections. The full documentation is provided in [Helfrich/Reusch 2009].
16.1.1 Virtual Model Server – automated data exchange The virtual model server – VMS – was developed by Nicki Helfrich and Jan Reusch of Fraun-hofer ISI in order to automate complex data transformations when passing data from one model to another and to manage sequences of transformation steps for running models in series, each model using the output of it predecessor as input. With this software the iteration of model simulations is also possible, i.e. a sequence of simulations in which the starting model eventu-ally receives data from another model calculated based on the first models results. This is depic-ted as an abstract example in Figure 16-1. Here, models 1 and 2 start the iteration and send their resulting data to the VMS. The server transforms the data into the format needed by models 3 and 4, each receiving different input formats and different subsets of the data provided by mod-els 1 and 2. Then, models 3 and 4 can run their simulations and send their results to the VMS, for the compilation of input for the next models in the sequence, in our example models 1 and 2, which started the sequence. These two can then calculate again and continue the simulation loop.

Annexes
- 360 -
Source: own illustration
Figure 16-1: Virtual Model Server – abstract data flow
16.1.1.1 Technical details
The VMS was developed purely in Java as a web application for the Tomcat Application Server with a MySQL database as data storage backend, all following the open source philosophy. It builds on a variety of open source libraries for various functionalities. Most importantly, it uses Hibernate along with Spring for persistent data.
16.1.1.2 Design philosophy
The development of the software was driven by the idea of creating a highly configurable tool, which should not be specific to certain interfacing and transformation tasks. This design enables the adoption of model output transformation definitions without changing neither the source code of the source model nor of the target model. All transformations are defined using an XML subset specifically developed for this purpose. With this design philosophy, we managed to create a highly reusable tool as it is possible to integrate new models into the data exchange. Thus the VMS enormously facilitates the data transformation tasks when integrating two or more models into an interacting hybrid model system.
16.1.1.3 Functionality
For defining the transformations, three major parts are necessary. First, for each model all rele-vant input attributes have to be defined. This is done in the model definition. Second, the data transformations have to be defined on a variable by variable base, describing for each input variable of the subsequent model in the iteration sequence how it is composed of the output variables of the preceding models. This is the transformation definition. And third, the sequence

ADAM 2-degree scenario for Europe – policies and impacts
- 361 -
of transformations has to be defined in the sequence definition. The latter is important when the sequence of running the models plays a role for generating results, which is most often the case.
Model definition
For each model, a definition file is compiled containing the following information:
• Variables and the dimensions they are defined on
• Dimensions e.g. indexes for countries or economic sectors
• Timeframe and time intervals
• File Format
An example is given in Source: VMS, Fraunhofer-ISI
Figure 16-2It shows an extraction of the definition of the ASTRA model for the VMS. The root knot (or object) is model, containing the name, timescope, dimensions, variables and fileFor-mats knot. Within dimensions, the two dimensions EUCoun and IOSector are defined with their according elements. These are then referred to within the knot variables, containing definitions for the two variables MAC_emp_Employment_per_Country and MAC_emp_Employment_Sectoral_incl_Part_Time. The first variable is only defined based on the EUCoun dimension (EU27+2 countries), the second based on both EUCoun and IOSector (25 economic sectors). And eventually the last knot fileFormats includes references to XML files defining the data structure of the ASTRA model, in this case in- and output data structure being the same.

Annexes
- 362 -
<model> <name>ASTRA</name> <timescope> <startyear>1990</startyear> <endyear>2050</endyear> <timesteps>1</timesteps> </timescope> <dimensions> <dimension name="EUCoun"> <element_list> AUT, BLX, DNK, ESP, FIN, FRA, GBR, GER, GRC, IRL, ITA, NLD, PRT, SWE, BLG, CHE, CYP, CZE, EST, HUN, LAT, LTU, MLT, NOR, POL, ROM, SLO, SVK </element_list> </dimension> <dimension name="IOSector"> <element_list> Agriculture, Energy, Metals, Minerals, Chemicals, Metal_Products, Industrial_Machines, Computers, Electronics, Vehicles, Food, Textiles, Paper, Plastics, Other_Manufacturing, Construction, Trade, Catering, Transport_Inland, Transport_Air_Maritime, Transport_Auxiliary, Communication, Banking, Other_Market_Services, Non_Market_Services </element_list> </dimension> </dimensions> <variables> <variable name="MAC_emp_Employment_per_Country"> <dimension_ref ref="EUCoun" /> </variable> <variable name="MAC_emp_Employment_Sectoral_incl_Part_Time"> <dimension_ref ref="EUCoun" /> <dimension_ref ref="IOSector" /> </variable> </variables> <fileFormats> <input file="Astra-output.xml" /> <output file="Astra-output.xml" /> </fileFormats> </model>
Source: VMS, Fraunhofer-ISI
Figure 16-2: Model definition – XML example file
Transformation definition
The core functionality of the VMS is the ability to transform data in an automated way. There-fore, a definition language was developed in order to describe the transformations based on XML. VMS features the following operations:
• Basic arithmetic operations: addition, subtraction, multiplication, division.
• Dimension mapping, i.e. the definition of how one dimension of model A refers to a related but differently named or aggregated dimension of model B. This definition is described as a matrix stored in an MS Excel spreadsheet.
• MAC_emp_Employment_Sectoral_incl_Part_Time, defined on EUCoun and IOSector to a one-dimensional variable defined on EUCoun by adding up all elements of IOSector.

ADAM 2-degree scenario for Europe – policies and impacts
- 363 -
• Splitting dimensions, i.e. the inverse operation of the aggregation, producing e.g. a two-dimensional variable based on a one-dimensional variable with fixed split factors for the elements of the new dimension.
• Intermediate variables for calculating various steps with the VMS, where the output of one calculation is the input for the next calculation.
• Index calculation, i.e. the ability to calculate an index on a given base year of a variable.
• Temporal interpolation, i.e. filling years not covered by the output of model A but needed in the subsequent model B. This is done as linear interpolation.
<modelTransformation> <model ref="EuroMM" /> <variables> <add variable="DSELHT"> <summand> <var model="cepe" variable="EE_SERV-h"> <dimensions> <map from="CountryCode" to="Region" mapping="to_euromm.xls" factor="1" /> <join from="Fuels" fixedElement="Electricity" /> </dimensions> </var> </summand> <summand> <var model="cepe" variable="EE_SERV-h"> <dimensions> <map from="CountryCode" to="Region" mapping="to_euromm.xls" factor="1" /> <join from="Fuels" fixedElement="El.HP" /> </dimensions> </var> </summand> </add> <add variable="DTGSL"> <summand> <var model="ASTRA" variable="ENV_FC_Gasoline_Mtoe"> <dimensions> <map from="EUCoun" to="Region" mapping="to_euromm.xls" factor="41.868" /> </dimensions> </var> </summand> </add> </variables> </modelTransformation>
Figure 16-3: Transformation definition – XML example file
The transformations are organized by target model, i.e. for each input data set generated for a model, one transformation file is set up, containing all definitions of how to compile that input based on the output of the preceding models within the sequence. An example is given in Figure 16-3, including an extraction of the transformations defining the calculation of the input for the model EuroMM. The example shows how an addition works. The first case showing how two elements of the dimension Fuels are added up. The variable DSELHT is calculated as the sum of dimension Electricity and of El.HP of the variable EE_SERV-h. The second case shows a trans-formation from ASTRA variable ENV_FC_Gasoline_Mtoe to the EuroMM variable DTGSL

Annexes
- 364 -
based on a dimension mapping from EUCoun (ASTRA index of countries) to Region (EuroMM index of countries). This mapping is shown in Table 16-1. There, the first column contains the elements of the dimension EUCoun, the first row contains the elements of the EuroMM dimen-sion Region. Both dimensions refer to the spatial resolution of the model, but the definitions are not equal. Therefore, this mapping is needed. It defines, e.g., that the code SCA of EuroMM will be calculated as the sum of DNK and FIN of the ASTRA model. With a factor <1 a split of one dimension to various dimensions can be defined. This mapping is applied during the trans-formation of the ASTRA to the EuroMM variable due to the map knot within the dimensions knot in the example.
Table 16-1: Dimension mapping example - from ASTRA EUCoun to EuroMM Region
to
AUT
BAL
BELU
BURO
CZSL
FR
GBI
GER
GRC
HUSLE
IBE
ITA
MC
NDL
NOR
POL
SCA
SWI
ROW
from AUT 1 BLG 1 BLX 1 CHE 1 CYP 1 CZE 1 DNK 1 ESP 1 EST 1 FIN 1 FRA 1 GBR 1 GER 1 GRC 1 HUN 1 IRL 1 ITA 1 LAT 1 LTU 1 MLT 1 NLD 1 NOR 1 POL 1 PRT 1 ROM 1 SLO 1 SVK 1 SWE 1
Source: VMS, Fraunhofer-ISI
For all further functionality, similar XML definitions were developed. It would be to lengthy to describe the whole syntax in detail in the scope of this document. Therefore, we refer to the complete documentation of the VMS [Helfrich/Reusch 2009].
Sequence definition
Eventually, the order in which
• the individual models calculate results,

ADAM 2-degree scenario for Europe – policies and impacts
- 365 -
• deliver the results to the VMS,
• the VMS transfers these results and hands them over to the next model
has to be defined. This is done in the sequence definition, another XML file. A reduced example is shown in Figure 16-4. It defines that in step 0, the initialization, the models ASTRA, Cepe and ISIndustry calculate initial results. Step 1 then consists of the transformations according to the file mappings/to_euromm.xml which result in one input file for EuroMM. The sequence then continues with further step elements.
<scenarioTrackerDefinitions> <track> <iterations>1</iterations> <step number="0"> <subStep> <model ref="ASTRA" /> </subStep> <subStep> <model ref="cepe" /> </subStep> <subStep> <model ref="ISIndustry" /> </subStep> </step> <step number="1"> <subStep> <model ref="EuroMM" /> <transformation file="mappings/to_euromm.xml"> <requiredModel ref="ASTRA" /> <requiredModel ref="cepe" /> <requiredModel ref="ISIndustry" /> </transformation> </subStep> </step> </track> </scenarioTrackerDefinitions>
Figure 16-4: Sequence definition – XML example file
16.1.2 Data flow between models Using the Virtual Model Server described in the previous section, a large amount of data was exchanged between the various models collaborating during the project. The details about which data was exchanged in what sequence are described in this section. Table 16-2 gives a high level overview of which data is exchanged by the individual models. As can be seen there, PowerACE delivers data to EuroMM and ASTRA. ISIndustry provides data to PowerACE, EuroMM and ASTRA. CEPE models hand over data to PowerACE, EuroMM and ASTRA. From EuroMM, data is transferred to PowerACE, CEPE models and ASTRA. From ASTRA, data is carried over to PowerACE, ISIndustry, CEPE models and EuroMM. Most data is pro-vided as yearly figures, with the exceptions of EuroMM data, which is provided (required) as 5 year aggregates or data for every 5th year. The details of what data is transferred between the models for each direct bilateral link are summarized in Table 16-3.

Annexes
- 366 -
Table 16-2: Data flow between models – high level overview
to Power ACE ISIndustry CEPE models EuroMM ASTRA
from Power ACE ISIndustry CEPE models EuroMM ASTRA
Source: Own compilation, CEPE models: RESIDENT, SERVE, RESAppliance
The following list describes the implemented transfer of data for the ADAM-HMS that are han-dled by the VMS (Table 16-3 provides an overview):
• EuroMM provides the CEPE models with prices for electricity. These are provided per country both as separate electricity prices for industry as well as for households. Since the two models use different country groups, a mapping from the countries of EuroMM to the countries of the CEPE models had to be defined. Further, the currency had to be converted from US$ 2000 to Euro 2005.
• ASTRA delivers Value added and Employment to the CEPE models. The data is disaggre-gated per country and per sector. Both countries and sectors are defined differently in the two models, therefore, mappings for both dimensions were developed. Both variables were delivered to CEPE as index variables with the value of 2004 as a base year.
• ISIndustry supplies PowerACE with data on the electricity consumption of the industry per country. Due to differing country definitions, a mapping was developed, and the unit was converted from Mtoe to GWh.
• The CEPE models give data on the electricity demand of the service sector as well as the residential sector to the PowerACE model. The unit is converted from PJ to GWh and the countries were mapped to bridge the differing country groups.
• From ASTRA, data on the electricity demand of the transport sector is handed over to PowerACE. This is differentiated by countries. These differ in the way they are grouped, wherefore a specific mapping was developed. The unit was converted from Mtoe to GWh.
• PowerACE is provided with the amount of generated electricity by EuroMM. A specific country mapping was elaborated. The data coming from EuroMM is disaggregated by elec-tricity producing technology, but since this information is not needed by PowerACE, all

ADAM 2-degree scenario for Europe – policies and impacts
- 367 -
quantities were aggregated into one figure per country for PowerACE. The unit was con-verted from PJ to GWh.
• ASTRA receives data on Investments into renewable energy technologies from PowerACE distinguished by country and by technology. Both country and technology group definitions differ in the two models, wherefore a mapping for both dimensions was developed. Addi-tionally, the currency was converted from constant Euro 2005 to constant Euro 1995.
• ASTRA is further supplied by ISIndustry with data on energy consumption of the industry, distinguished by country, industry sector and energy type, as well as investment figures for CCS, electrical appliances and for general equipment. The investments are disaggregated to specific countries, with the general investment figures additionally disaggregated by indus-try sector. For the sectoral aggregations, a mapping was needed due to differing sectoral ag-gregations in the two models. While the energy figures are kept in Mtoe figures, the invest-ments were converted from constant Euro 2000 to constant Euro 1995.
• Furthermore, ASTRA receives data from CEPE on investments into air conditioning, effi-ciency improvements and fuel substitution, on expenditures for energy and energy demand, both given fuels and for electricity. All data is provided by country, for which a mapping to the ASTRA countries was developed. Additionally, the investment figures are also disag-gregated by sectors, which were mapped to the ASTRA sectors. The monetary figures were converted from Euro 2005 to Euro1995 and energy variables from PJ to Mtoe.
• Also, ASTRA receives data from EuroMM on energy costs, energy demand, expenditures for energy, CO2 certificate prices, energy imports and on investments. All data is provided per country. A mapping from EuroMM countries to ASTRA countries was developed. En-ergy costs are provided by energy type in a more disaggregated way than needed by ASTRA, therefore average costs were calculated, weighted with the energy demand, and aggregated to energy use groups as needed by ASTRA. Energy import data is provided dif-ferentiated by origin and destination country, but needed only by destination country. Therefore an aggregation was defined, aggregating all imports into one country into one figure. The investment figures which are provided by EuroMM differentiated by technology were aggregated into one figure by country. Investments and CO2 certificate prices were converted from US$ 2000 to Euro 1995. For the energy values the relative change between scenarios was provided to ASTRA. All figures except investments were provided for each 5th year. Therefore, the missing years were filled with interpolated data. The investment fig-ures were provided as 5 year aggregates, therefore the values were evenly distributed among the five years represented by the EuroMM output value.

Annexes
- 368 -
• EuroMM uses data from PowerACE, ISIndustry, the CEPE models and from ASTRA. PowerACE delivers capacity extensions in the renewable energy sector to EuroMM, by country and technology.
• ISIndustry provides EuroMM with data on the energy consumption of the industry for each energy type. The countries are mapped from ISIndustry country groups to EuroMM country groups, and the unit is converted from Mtoe to PJ. Only data for every 5th year is given to EuroMM.
• CEPE supplies EuroMM with data on the energy consumption of the service sector and the households. The data is disaggregated by country and energy type. The country definitions are mapped from CEPE to EuroMM countries. For each combination of usage area (service sector, household) and energy type, one variable is given to EuroMM.
• From ASTRA, EuroMM receives data on the consumption of transport fuels differentiated by fuel type and on the transport performance, differentiated by transport mode. The coun-tries are mapped from ASTRA countries to EuroMM countries, and the energy figures are converted from Mtoe to PJ. The transport performance was only delivered initially and was not part of the iteration process, since the adoption of these numbers is not highly signifi-cant to the model results.
• Also, ASTRA data on gross value added was handed over to ISIndustry. The data is avail-able disaggregated by country and by industry sector. Therefore, two mappings for these two dimensions were needed, transforming ASTRA to ISIndustry countries and sectors. The currency was converted from Euro1995 to Euro 2000.

ADAM 2-degree scenario for Europe – policies and impacts
- 369 -
Table 16-3: Data flow between models – details
Source: own compilation, VMS, Fraunhofer-ISI
Sou
rce
Targ
etD
ata
exch
ange
dS
ourc
eS
ourc
eS
ourc
eTa
rget
Targ
etTa
rget
Mod
elM
odel
Dis
sagr
egat
ion
Uni
tte
mp.
reso
l.D
issa
greg
atio
nU
nit
tem
p. re
sol.
Eur
oMM
CE
PE
Ele
ctric
ity p
rices
per c
ount
ry20
00$U
S M
/PJ
year
lype
r cou
ntry
Eur
o 20
05 /
GJ
year
lyfo
r Hou
shol
ds a
nd In
dust
rype
r cou
ntry
2000
$US
M/P
Jye
arly
per c
ount
ryE
uro
2005
/ G
Jye
arly
AS
TRA
CE
PE
Val
ue a
dded
pe
r cou
ntry
per s
ecto
rM
io E
uro
1995
year
lype
r cou
ntry
per s
ecto
rIn
dex
2004
year
lyE
mpl
oym
ent
per c
ount
rype
r sec
tor
Per
sons
year
lype
r cou
ntry
per s
ecto
rIn
dex
2004
year
lyIS
Indu
stry
Pow
erA
CE
Ele
ctric
ity c
onsu
mpt
ion
of in
dust
rype
r cou
ntry
Mto
eye
arly
per c
ount
ryG
Wh
year
lyC
EP
EP
ower
AC
EE
lect
ricity
dem
and
per c
ount
ryP
Jye
arly
per c
ount
ryG
Wh
year
lyby
Ser
vice
and
Res
iden
tial S
ecto
rA
STR
AP
ower
AC
EE
lect
ricity
dem
and
of tr
ansp
ort s
ecto
rpe
r cou
ntry
Mto
eye
arly
per c
ount
ryG
Wh
year
lyE
uroM
MP
ower
AC
EE
lect
ricity
gen
erat
ion
per c
ount
ryTe
chno
logy
PJ
each
5th
yea
rpe
r cou
ntry
GW
hea
ch 5
th y
ear
Pow
erA
CE
AS
TRA
Add
ition
al In
vest
men
ts
per c
ount
rype
r tec
hnol
ogy
Mio
Eur
o 20
05pe
r cou
ntry
per t
echn
olog
yM
io E
uro
1995
into
rene
wab
le e
nerg
y te
chch
nolo
gies
ISIn
dust
ryA
STR
AE
nerg
y co
nsum
ptio
n of
Indu
stry
per
ene
rgy
type
per c
ount
rype
r sec
tor
Mto
eye
arly
per c
ount
rype
r sec
tor
Mto
eye
arly
Inve
stm
ent i
nto
CC
Spe
r cou
ntry
Mio
Eur
o 20
00ye
arly
per c
ount
ryM
io E
uro
1995
year
lyIn
vest
men
t int
o el
ectri
cal a
pplia
nces
per c
ount
ryM
io E
uro
2000
year
lype
r cou
ntry
Mio
Eur
o 19
95ye
arly
Gen
eral
inve
stm
ent d
eman
dpe
r cou
ntry
per s
ecto
rM
io E
uro
2000
year
lype
r cou
ntry
per s
ecto
rM
io E
uro
1995
year
lyC
EP
EA
STR
AIn
vest
men
ts in
tope
r cou
ntry
per s
ecto
rM
io E
uro
2005
year
lype
r cou
ntry
per s
ecto
rM
io E
uro
1995
- Air
cond
ition
ing
- Effi
cien
cy im
prov
emen
ts- F
uel s
ubst
itutio
nfo
r Ser
vice
Sec
tor a
nd H
oush
olds
Exp
endi
ture
s fo
r pe
r cou
ntry
Mio
Eur
o 20
05ye
arly
per c
ount
ryM
io E
uro
1995
- Fue
l- E
lect
ricity
by S
ervic
e S
ecto
r and
by
Hou
shol
dsE
nerg
y de
man
d fo
r pe
r cou
ntry
PJ
year
lype
r cou
ntry
Mto
e- F
uel
- Ele
ctric
ityby
Ser
vice
Sec
tor a
nd b
y H
oush
olds
Eur
oMM
AS
TRA
Ene
rgy
cost
spe
r cou
ntry
Ene
rgy
type
2000
$US
M/P
Jea
ch 5
th y
ear
per c
ount
ryE
nerg
yTyp
e_S
ecto
rFa
ctor
- ch
ange
year
lyE
nerg
y de
man
dpe
r cou
ntry
Ene
rgy
type
PJ
each
5th
yea
rpe
r cou
ntry
Ene
rgyT
ype_
Sec
tor
Fact
or -
chan
geye
arly
Ene
rgy
expe
nditu
res
per c
ount
ryE
nerg
y ty
pe20
00$U
Sea
ch 5
th y
ear
per c
ount
ryE
nerg
yTyp
e_S
ecto
rFa
ctor
- ch
ange
year
lyC
O2
Cer
tific
ate
Pric
espe
r cou
ntry
2000
$US
each
5th
yea
rpe
r cou
ntry
Eur
o199
5ye
arly
Ene
rgy
impo
rts in
to c
ount
rype
r cou
ntry
Ene
rgy
carri
ers
PJ
each
5th
yea
rpe
r cou
ntry
Fact
or -
chan
geye
arly
Inve
stm
ents
per c
ount
rype
r tec
hnol
ogy
2000
$US
M5
year
agg
per c
ount
ryM
io E
uro1
995
year
lyP
ower
AC
EE
uroM
MC
apac
ity e
xten
sion
in re
new
able
ene
rgy
sect
orpe
r cou
ntry
per t
echn
olog
yM
Wye
arly
per c
ount
rype
r tec
hnol
ogy
MW
5 ye
ar a
ggIS
Indu
stry
Eur
oMM
Ene
rgy
cons
umpt
ion
of In
dust
rype
r cou
ntry
Mto
eye
arly
per c
ount
ryP
Jea
ch 5
th y
ear
per e
nerg
y ty
peC
EP
EE
uroM
ME
nerg
y de
man
d of
per c
ount
ryP
Jye
arly
per c
ount
ryP
Jea
ch 5
th y
ear
- Ser
vice
sect
or- H
oush
olds
disa
ggre
gate
d pe
r ene
rgy
type
AS
TRA
Eur
oMM
Tran
spor
t Fue
l Con
sum
ptio
npe
r cou
ntry
Mto
eye
arly
per c
ount
ryP
Jea
ch 5
th y
ear
per F
uel T
ype
Tran
spor
t Per
form
ance
(not
iter
ated
)pe
r cou
ntry
per m
ode
pkm
or t
kmye
arly
per c
ount
rypk
m o
r tkm
year
lyA
STR
AIS
Indu
stry
Gro
ss V
alue
add
ed
per c
ount
rype
r sec
tor
Mio
Eur
o 19
95ye
arly
per c
ount
rype
r sec
tor
Mio
Eur
o 20
00ye
arly

Annexes
- 370 -
16.2 Detailed Results from the MATEFF model More detailed data of the MATEFF model assumptions and results are presented here (see Chapter 5.2).
16.2.1 Assumptions of the Reference Scenario – 2000 to 2050 The results of this scenario reflect the trend to material efficiency and intra-industrial structural changes without any additional attempt to reduce the demand of energy-intensive materials.
Assumptions about the drivers of steel production in Europe
At present (and expected to remain that way in the future), Greece, Norway, and Switzerland only produce recycled steel using electricity, which means the crude steel production of these countries matches their electrical steel production (Table 16-4 and Table 16-5). In contrast, the Baltic States produce exclusively crude steel. Latvia is the leading steel manufacturer among the Baltic States. Portugal (at present), Slovenia (at present), Spain (from 2015) and Italy (from 2030) produce a very high share of electrical steel. The percentage of electrical steel in these countries averages more than 80 % of total steel production and their electrical steel production is projected to grow by 0.3 % per year.
Malta/Cyprus do not produce steel at all, neither oxygen steel nor electrical steel. Denmark does not produce any crude steel at present either. Denmark's oxygen steel plants were closed in 1980 and electrical steel ceased to be produced here in 2003. Ireland stopped producing crude steel in 2002 (oxygen steel before 1990 and electrical steel in 2002, see Table 16-4).
The per capita electrical steel production of many European countries (Austria, Belgium/-Luxembourg, Finland, France, Germany, the Netherlands, Sweden, United Kingdom, the Czech Republic, Hungary, Poland, Slovakia, Romania and Turkey) increases by an average of 0.6 % per year (see Table 16-5).
Assumptions about the drivers of aluminium production in Europe
Most other countries (Greece, Italy, the Netherlands, Poland, Slovakia, Slovenia, Sweden and Switzerland) maintain a constant level of aluminium production after 2020. The United King-dom shows a constant level of primary aluminium production for the entire period.
Only Norway and Turkey feature increasing primary aluminium production throughout the pe-riod 2005 to 2050 due to the inexpensive electricity from hydropower in Norway and the high domestic demand in Turkey with new, efficient power stations. Over the same period, the pri-mary aluminium production in Germany decreases by about 45 %.
Belgium/Luxembourg, Ireland and Cyprus/Malta do not have any secondary aluminium produc-tion. Belgium stopped producing secondary aluminium in 2005 and Switzerland in 2002. Based on the production of secondary aluminium in the year 2005, its development was estimated for

ADAM 2-degree scenario for Europe – policies and impacts
- 371 -
EU27 (+ Norway, Switzerland, Turkey). Again, the development of production between the estimated values for each decade is calculated as a linear increase or decrease.
The data concerning the secondary aluminium production of the Eastern European countries (the Baltic States, Slovakia, Slovenia and Turkey) are not specified (see Table 16-6: ). It is estimated that Turkey will start producing secondary aluminium in 2020, which may be a rather conservative estimate.
Table 16-4: Estimated production of crude steel in tonnes per capita in EU27 + Norway,
Switzerland and Turkey, Reference Scenario 2005 – 2050
Country or Country group 2005 2030 2050 Austria 0.86 0.60 0.50 Baltic States 0.24 0.20 0.20 Belgium/Luxembourg 5.72 5.50 4.95 Bulgaria 0.26 0.30 0.30 Czech Republic 0.61 0.50 0.45 Denmark – – – Finland 0.90 0.70 0.60 France 0.32 0.30 0.25 Germany 0.54 0.56 0.56 Greece 0.20 0.17 0.24 Hungary 0.20 0.20 0.20 Ireland – – – Italy 0.50 0.45 0.40 Malta/Cyprus – – – the Netherlands 0.42 0.40 0.40 Norway 0.15 0.15 0.15 Poland 0.22 0.30 0.27 Portugal 0.13 0.10 0.11 Romania 0.29 0.30 0.30 Slovakia 0.80 0.65 0.41 Slovenia 0.29 0.36 0.30 Spain 0.42 0.40 0.40 Sweden 0.63 0.55 0.50 Switzerland 0.14 0.18 0.20 United Kingdom 0.22 0.22 0.20 Turkey 0.29 0.50 0.45
Source: BSR Sustainability GmbH

Annexes
- 372 -
Table 16-5: Estimated production of electrical steel in tonnes per capita in EU27 + Norway,
Switzerland and Turkey, Reference Scenario 2005 – 2050
Country or Country group 2005 2030 2050 Austria 0.08 0.09 0.10 Baltic States – – – Belgium/Luxembourg 0.45 0.49 0.54 Bulgaria 0.10 0.14 0.19 Czech Republic 0.06 0.07 0.09 Denmark – – – Finland 0.27 0.30 0.35 France 0.12 0.13 0.15 Germany 0.17 0.20 0.23 Greece 0.20 0.22 0.24 Hungary 0.03 0.04 0.05 Ireland – – – Italy 0.30 0.36 0.42 Malta/Cyprus – – – Netherlands 0.01 0.01 0.01 Norway 0.15 0.15 0.15 Poland 0.09 0.11 0.14 Portugal 0.07 0.09 0.11 Romania 0.08 0.10 0.14 Slovakia 0.07 0.08 0.10 Slovenia 0.30 0.36 0.43 Spain 0.31 0.34 0.37 Sweden 0.20 0.21 0.23 Switzerland 0.14 0.18 0.20 United Kingdom 0.05 0.05 0.05 Turkey 0.21 0.19 0.19
Source: BSR Sustainability GmbH

ADAM 2-degree scenario for Europe – policies and impacts
- 373 -
Table 16-6: Estimated development of secondary aluminium production in EU27 + Norway,
Switzerland and Turkey in 1000 tonnes, Reference Scenario 2005 – 2050
Country or Country group 2005 2020 2030 2040 2050
Austria 151 2005-2030: + 1.5% per year
2030-2050: + 1% per year
Baltic States not specified Belgium/Luxembourg – – – – – Bulgaria 8 20 40 Czech Republic 40 60 70 Denmark 20 20 20 20 20 Finland 35 44 44 44 France 222 270 270 270 Germany 712 2005-2050: + 7.5 per year Greece 9 11 13 Hungary 20 50 60 Ireland – – – – – Italy 654 2005-2030:
+ 6 per year 2030-2050: + 2 per year
Malta/Cyprus – – – – – Netherlands 50 60 60 60 60 Norway 362 500 600 Poland 7 30 70 80 Portugal 18 2005-2030:
+ 0.5 per year 2030-2050:
+ 0.2 per year Romania 7 25 50 60 Slovakia not specified Slovenia not specified Spain 243 350 400 Sweden 32 2005-2030:
+ 0.0003 per year 2030-2050:
+ 0.0001 per year Switzerland – – – – – United Kingdom
205 2005-2030: + 1 per year
2030-2050: constant level
Turkey not specified 50 80
Source: BSR Sustainability GmbH
Assumptions about the drivers of cement production in Europe
The data between the reference points were calculated as linear increases or decreases. The fig-ures for Austria, Denmark, Germany, the Netherlands and Norway show a constant level of cement production per capita throughout the whole period. In contrast, the cement production per capita increases to start with in Belgium/Luxembourg, the Czech Republic and Hungary and then levels out after 2040 (see Table 16-7). All other countries have a constant level of cement production per capita after 2030. The cement production per capita in Turkey gradually de-

Annexes
- 374 -
creases from 2000 until 2050 assuming that the most intensive phase of construction occurs between 2000 and 2010.
Table 16-7: Estimated cement production in tonnes per capita in EU27 + Norway, Switzer-
land and Turkey, Reference Scenario 2005 – 2050
Country or Country group 2000 2020 2030 2040 2050
Austria 0.48 0.48 0.48 0.48 0.48 Baltic States 0.25 0.35 0.35 Belgium /Luxembourg 0.80 0.60 0.60 0.60 Bulgaria 0.30 0.38 0.38 0.38 Czech Republic 0.35 0.45 0.35 0.35 Denmark 0.38 0.38 0.38 0.38 0.38 Finland 0.25 0.35 0.35 0.35 France 0.34 0.38 0.38 0.38 Germany 0.40 0.40 0.40 0.40 0.40 Greece 1.42 0.50 0.50 0.50 Hungary 0.36 0.45 0.35 0.35 Ireland 0.96 0.40 0.40 0.40 Italy 0.75 0.60 0.60 0.60 Malta / Cyprus 2.10 1.50 1.50 1.50 Netherlands 0.20 0.20 0.20 0.20 0.20 Norway 0.40 0.40 0.40 0.40 0.40 Poland 0.30 0.35 0.35 0.35 Portugal 0.89 0.50 0.50 0.50 Romania 0.30 0.35 0.35 0.35 Slovakia 0.60 0.50 0.50 0.50 Slovenia 0.70 0.55 0.55 0.55 Spain 1.00 0.60 0.60 0.60 Sweden 0.30 0.38 0.38 0.38 Switzerland 0.55 0.50 0.50 0.50 United Kingdom 0.22 0.28 0.28 0.28 Turkey 0.50 0.40
Source: BSR Sustainability GmbH
Assumptions about the drivers of paper production in Europe
In the period 2030-2050, the richer countries (Austria, Belgium/Luxembourg, Denmark, France, Finland, Germany, Greece, Ireland, Italy, the Netherlands, Spain, Portugal, Sweden, United Kingdom, Cyprus, Hungary, Poland, Norway and Switzerland) are calculated with lower elas-ticities of annual economic growth compared to the Central European countries (Czech Repub-lic, the Baltic States, Malta, Slovakia, Slovenia, Bulgaria and Romania). It is estimated that the growth of paper production will slow down in the last decade even more in some countries. In Belgium/Luxembourg, Finland, France, Greece, Portugal, Norway and Switzerland, the elastic-

ADAM 2-degree scenario for Europe – policies and impacts
- 375 -
ity is fixed at 10 % of the annual economic increase from 2040 on. The elasticity is reduced to 20 % of the annual economic growth in the Czech Republic, Estonia, Slovakia, Slovenia, Bul-garia and Romania. In contrast, some countries (Austria, Denmark, Germany, Ireland, Italy, Spain, Sweden, United Kingdom, Cyprus, Hungary, and Poland) show a constant level of paper industry growth.
Bulgaria, Latvia, Lithuania, Cyprus and Malta are exceptions, which are not in line with the developed paper production equation:
• Malta has no paper production.
• Cyprus (which started producing paper in 2003), Latvia and Lithuania do not seem to pro-duce wood pulp or pulp according to the statistics. Therefore, these countries only produce paper on the basis of recycled paper and imported wood pulp or imported pulp. The paper production of Cyprus remains at a constant level of 5,000 tonnes per year from 2005 to 2030. Afterwards, paper production increases by about 100 tonnes per year for the next twenty years.
• Latvia: Paper production grows at a rate of 0.5 % per year from 2005 to 2030. For 2030-2050, the growth factor is 1 % per year. Lithuania: Paper production remains constant until 2030. Thereafter it grows at 0.4 % per year.
• Bulgaria: Paper production shows a constant increase of 2 % per year from 2005 to 2030. Between 2030 and 2050, the growth factor is only 1 % per year.
For the European countries, assumptions had to be made about the development of recycled paper, pulp and additives. These estimates were based on past developments in the composition of new paper (recycled paper, pulp, additives, mechanical pulp; see Table 16-8 based on the ex-ample of Germany) as well as on national sources projecting future shares of recycled paper.
Table 16-8: Consumption of the paper industry in Germany in percent (VDP, 2004)
Year Recycled paper pulp additives mechanical pulp 1985 39.0 30.0 18.0 13.0 2004 56.6 19.6 17.1 6.6
Source: BSR Sustainability GmbH
The insertion quota of additives is assumed to be 18.0 % in 2005. This quota decreases to 17.0 % in 2030 and 16.5 % in 2050. In countries which already have a high insertion quota of recycled paper of about 80 % (Denmark, Ireland, Spain, United Kingdom, Cyprus and Lithua-nia), the insertion quota of additives is estimated to be 15 % in 2005. This quota decreases to 14.4 % in 2030 and 14.0 % in 2050. The insertion quotas of recycled paper are taken from the German Association of the Paper Industry VDP or national sources. In countries with a high insertion quota of recycled paper (Denmark, Ireland, United Kingdom, Cyprus, Hungary, Lat-via, Lithuania, Bulgaria and Switzerland), the maximum insertion quota was estimated to be constant at about 80 %.

Annexes
- 376 -
Assumptions about the drivers of glass production in Europe
From 2030 to 2050, an elasticity of 20 % of the annual economic increase is assumed for the Western European countries (Austria, Belgium/Luxembourg, Denmark, Finland, France, Ger-many, Ireland, Italy, the Netherlands, Sweden, United Kingdom, Norway and Switzerland) and 25 % for the Central European countries (Greece, Portugal, Spain, Czech Republic, the Baltic States, Hungary, Slovakia, Slovenia, Bulgaria and Romania).
If glass production data were not available for intermittent years or countries, total glass was normally calculated as 26 % flat glass, 61 % container glass and 13 % other glass. Some coun-tries show different subdivisions. This production structure was adopted from an older study of the glass market in Europe (see Table 16-9).
Table 16-9: Historical basis data for future glass production estimates
Country or country group
Basis year of production Subdivision of glass (%) flat container other
Bulgaria container glass 2005 & flat glass 2006
26 61 13
Greece container glass 2005 26 61 13 Netherlands container glass 2005 &
total glass 2003 12 74 14
Portugal container glass 2003-2006 11 76 13 Spain container glass 2002-2006 26 67 7 United Kingdom container glass 2003-2006 &
other glass 2005 26 61 13
Poland container glass 2005-2006 26 61 13 Romania container glass 2005 34 52 14 Switzerland total glass 2005 26 61 13 Turkey container glass 2003-2006,
total glass 2000-2003 & other glass 2003
45 28 27
Source: BSR Sustainability GmbH
Detailed historical data of physical glass production (2000 - 2005), which were collected from different sources, are available for Austria (some data were calculated for the years 2001 - 2003), Belgium, France, Germany, Italy and the Czech Republic. Only the total glass produc-tion of the year 2000 was found for the following countries: Denmark, Finland (flat glass: 8 %, container glass: 46 %, other glass: 46 %), Ireland, Luxembourg, Sweden (flat glass: 55 %, con-tainer glass: 29 %, other glass: 16 %), the Baltic States, Hungary, Slovakia, Slovenia and Nor-way (flat glass: 9 %, container glass: 81 %, other glass: 10 %).
In Bulgaria (flat glass: 5 %, container glass: 94 %, other glass: 1 %), most glass factories have been closed for a number of years (British Glass: Overview of Glass Container – Production in the EU: 2006). Until 2005, the entire demand of Bulgaria was satisfied by imports from Turkey, France, the Czech Republic, Germany and China. At present, Sisecam is in the process of build-

ADAM 2-degree scenario for Europe – policies and impacts
- 377 -
ing several factories for various types of glass (British Glass: Overview of Glass Container – Production in the EU: 2006).
16.2.2 Production changes in energy-intensive products - Reference Scenario 2000 to 2050
Steel production
Table 16-10: Production of crude steel in EU27 + Norway, Switzerland and Turkey in
1000 tonnes, Reference Scenario, 2000 – 2050
Country or country group 2000 2010 2020 2030 2050
Austria 5,710 6,050 5,540 5,000 4,040 Baltic States 500 480 440 400 340 Belgium/Luxembourg 14,210 13,590 13,510 13,350 12,670 Bulgaria 2,020 2,090 1,990 1,870 1,520 Czech Republic 6,210 5,760 5,300 4,770 3,800 Denmark 800 – – – – Finland 4,100 4,420 4,150 3,820 3,200 France 20,980 19,690 19,520 19,110 15,780 Germany 46,380 47,140 46,630 46,380 46,380 Greece 1,090 2,350 2,150 1,930 2,570 Hungary 1,870 1,990 1,930 1,840 1,650 Ireland 360 – – – – Italy 26,760 28,100 26,640 24,920 21,000 Malta/Cyprus – – – – – Netherlands 5,670 6,640 6,800 6,920 6,860 Norway 680 710 740 800 820 Poland 10,500 10,740 10,940 10,880 8,620 Portugal 1,090 910 990 1,050 1,150 Romania 4,670 6,110 5,990 5,790 5,030 Slovakia 3,730 4,810 4,120 3,360 1,880 Slovenia 520 660 670 660 490 Spain 15,920 17,600 17,770 17,600 17,020 Sweden 5,230 5,350 5,370 5,370 5,030 Switzerland 1,000 1,200 1,280 1,350 1,460 United Kingdom 15,160 13,740 13,980 14,250 13,430
EU27 + 2 195,140 200,110 196,430 191,400 174,720 Turkey 14,330 27,560 37,000 46,910 45,540
Total Europe 209,460 227,670 233,430 238,300 220,270
Source: BSR Sustainability GmbH

Annexes
- 378 -
Table 16-11: Production of recycled steel in EU27 + Norway, Switzerland and Turkey in 1000
tonnes, Reference Scenario, 2000 – 2050
Country or country group 2000 2010 2020 2030 2050 Austria 560 640 680 720 810 Baltic States – – – – – Belgium/Luxembourg 5,300 4,950 5,190 5,440 5,980 Bulgaria 600 760 810 860 970 Czech Republic 520 580 610 650 730 Denmark 800 – – – – Finland 970 1,460 1,550 1,650 1,860 France 8,490 7,520 7,990 8,480 9,560 Germany 13,320 14,080 14,950 15,870 17,890 Greece 1,090 2,300 2,370 2,440 2,590 Hungary 230 330 350 370 420 Ireland 360 – – – – Italy 16,010 18,030 19,140 20,200 19,000 Malta/Cyprus – – – – – Netherlands 160 150 150 160 190 Norway 680 710 740 780 820 Poland 3,290 3,560 3,780 4,010 4,520 Portugal 500 780 870 970 1,130 Romania 1,330 1,780 1,890 2,010 2,260 Slovakia 290 380 400 420 480 Slovenia 520 660 670 660 700 Spain 11,670 13,880 14,430 14,860 15,780 Sweden 1,950 1,820 1,930 2,050 2,310 Switzerland 1,000 1,200 1,280 1,350 1,460 United Kingdom 3,640 2,780 2,950 3,130 3,530 EU-27 + 2 73,280 78,330 82,730 87,090 92,980 Turkey 9,090 15,450 16,400 17,410 19,620 Total Europe 82,370 93,780 99,130 104,500 112,600
Source: BSR Sustainability GmbH

ADAM 2-degree scenario for Europe – policies and impacts
- 379 -
Table 16-12: Production of primary aluminium in EU27 + Norway, Switzerland and Turkey
in 1000 tonnes, Reference Scenario, 2000 – 2050
Country or country group 2000 2010 2020 2030 2050
Austria – – – – – Baltic States – – – – – Belgium/Luxembourg – – – – – Bulgaria – – – – – Czech Republic – – – – – Denmark – – – – – Finland – – – – – France 440 450 460 470 470 Germany 640 620 550 490 360 Greece 160 170 170 170 170 Hungary 30 30 30 40 40 Ireland – – – – – Italy 190 200 200 200 200 Malta/Cyprus – – – – – Netherlands 300 340 350 350 350 Norway 1,030 1,580 1,990 2,400 3,000 Poland 50 60 60 60 60 Portugal – – – – – Romania 180 250 250 260 260 Slovakia 110 160 160 160 160 Slovenia 80 140 140 140 140 Spain 370 400 400 400 400 Sweden 100 110 110 110 110 Switzerland 40 50 50 50 50 United Kingdom 310 370 370 370 370 EU27 + 2 4,020 4,900 5,290 5,650 6,130 Turkey 60 60 70 70 90 Total Europe 4,090 4,960 5,350 5,720 6,220
Source: BSR Sustainability GmbH

Annexes
- 380 -
Table 16-13: Production of secondary aluminium in EU27 + Norway, Switzerland and Tur-
key in 1000 tonnes, Reference Scenario 2000 – 2050
Country or Country group 2000 2010 2020 2030 2050
Austria 160 160 170 190 210 Baltic States not specified Belgium/Luxembourg 1 – – – – Bulgaria 10 10 20 30 40 Czech Republic 40 40 50 60 70 Denmark 30 20 30 20 20 Finland 40 40 40 40 40 France 270 230 250 270 270 Germany 570 750 820 900 1.050 Greece 10 10 10 10 10 Hungary 40 30 40 50 60 Ireland – – – – – Italy 600 680 740 800 840 Malta/Cyprus not specified Netherlands 100 50 60 60 60 Norway 260 390 450 500 600 Poland 10 20 30 50 80 Portugal 20 20 30 30 30 Romania 2 10 30 40 60 Slovakia not specified Slovenia not specified Spain 240 260 310 350 400 Sweden 30 30 30 30 30 Switzerland 10 – – – – United Kingdom 240 210 220 230 230 EU27 + 2 2,670 2,970 3,320 3,660 4,120 Turkey not specified not specified 50 60 80 Total Europe not specified not specified 3,370 3,720 4,200
Source: BSR Sustainability GmbH

ADAM 2-degree scenario for Europe – policies and impacts
- 381 -
Table 16-14: Production of cement in EU27 + Norway, Switzerland and Turkey in 1000 ton-
nes, Reference Scenario, 2000 – 2050
Country or Country group 2000 2010 2020 2030 2050
Austria 3,890 3,960 3,990 4,000 3,880 Baltic States 1,810 1,900 1,990 2,030 1,880 Belgium/Luxembourg 8,590 8,060 7,410 6,720 6,610 Bulgaria 2,400 2,440 2,430 2,370 1,930 Czech Republic 3,590 4,060 4,470 3,810 2,960 Denmark 2,030 2,090 2,140 2,190 2,220 Finland 1,290 1,500 1,710 1,910 1,860 France 20,140 21,720 23,060 24,190 23,960 Germany 32,940 33,080 32,910 32,610 31,510 Greece 15,580 12,470 9,050 5,560 5,370 Hungary 3,680 4,030 4,330 3,690 2,890 Ireland 3,650 3,420 2,870 2,100 2,300 Italy 43,290 40,720 37,140 33,250 30,550 Malta/Cyprus 2,470 2,450 2,380 2,230 2,400 Netherlands 3,180 3,320 3,400 3,460 3,430 Norway 1,800 1,890 1,980 2,080 2,170 Poland 11,610 12,160 12,580 12,700 11,180 Portugal 9,100 8,140 6,870 5,470 5,360 Romania 6,640 6,750 6,810 6,760 5,870 Slovakia 3,240 3,060 2,860 2,600 2,310 Slovenia 1,380 1,270 1,150 1,010 900 Spain 40,730 38,140 32,590 26,420 25,540 Sweden 2,670 3,000 3,360 3,720 3,820 Switzerland 3,940 3,890 3,800 3,700 3,620 United Kingdom 12,910 14,520 16,250 18,110 18,800 EU-27 + 2 242,540 238,060 227,510 212,660 203,320 Turkey 34,120 37,480 39,920 41,310 40,480 Total Europe 276,650 275,540 267,430 253,960 243,810
Source: BSR Sustainability GmbH

Annexes
- 382 -
Table 16-15: Production of paper in EU27 + Norway, Switzerland and Turkey in 1000 tonnes,
Reference Scenario, 2000 – 2050
Country or country group 2000 2010 2020 2030 2050
Austria 4,390 5,370 6,030 6,700 8,380 Baltic States 120 220 220 230 370 Belgium/Luxembourg 1,730 1,900 2,250 2,620 3,170 Bulgaria 140 360 440 540 650 Czech Republic 540 800 850 860 1,190 Denmark 260 410 500 540 630 Finland 13,510 13,010 14,840 15,730 17,850 France 10,010 10,430 11,560 11,800 13,970 Germany 18,180 23,370 23,170 25,360 28,260 Greece 500 550 590 670 810 Hungary 510 600 620 700 1,040 Ireland 40 50 50 50 60 Italy 9,130 11,390 14,180 17,560 20,740 Malta/Cyprus – 10 10 10 10 Netherlands 3,330 3,630 3,870 4,140 4,450 Norway 2,300 2,180 2,340 2,520 2,820 Poland 1,930 2,830 3,040 3,020 4,300 Portugal 1,290 1,830 2,570 3,370 4,380 Romania 340 400 640 880 1,220 Slovakia 930 890 910 860 1,720 Slovenia 410 650 650 640 800 Spain 4,770 5,870 8,090 8,630 10,910 Sweden 10,790 13,210 16,550 18,110 19,930 Switzerland 1,620 1,730 1,840 1,820 2,470 United Kingdom 6,610 6,670 6,600 6,770 8,310 EU27 + 2 93,350 108,340 122,390 134,110 158,430
Source: BSR Sustainability GmbH

ADAM 2-degree scenario for Europe – policies and impacts
- 383 -
Table 16-16: Production of total glass in EU27 + Norway, Switzerland and Turkey in 1000
tonnes, Reference Scenario, 2000 – 2050
Country or country group Glass category 2000 2010 2020 2030 2050
Austria Total Glass 480 500 530 560 620 Baltic States Total Glass 70 80 80 80 90 Belgium/Luxembourg Total Glass 1,760 1,890 2,050 2,170 2,310 Bulgaria Total Glass 240 770 900 1,090 1,280 Czech Republic Total Glass 1,200 1,750 1,850 1,900 2,250 Denmark Total Glass 190 190 210 220 240 Finland Total Glass 140 150 160 160 170 France Total Glass 5,530 5,780 6,130 6,390 6,760 Germany Total Glass 7,680 7,000 7,350 7,700 8,070 Greece Total Glass 290 330 340 370 400 Hungary Total Glass 960 1,060 1,060 1,080 1,260 Ireland Total Glass 190 240 270 290 320 Italy Total Glass 4,910 5,550 6,010 6,350 6,860 Malta/Cyprus Total Glass – – – – – Netherlands Total Glass 1,360 980 1,060 1,140 1,270 Norway Total Glass 90 80 80 80 80 Poland Total Glass 1,580 1,910 1,940 1,930 2,160 Portugal Total Glass 1,140 1,480 1,720 1,940 2,040 Romania Total Glass 280 340 360 390 410 Slovakia Total Glass 170 190 200 200 220 Slovenia Total Glass 120 140 130 130 150 Spain Total Glass 2,940 3,380 3,850 4,290 4,860 Sweden Total Glass 350 380 430 440 470 Switzerland Total Glass 410 320 320 320 390 United Kingdom Total Glass 2,960 3,560 3,750 4,030 4,400 EU-27 + 2 Total Glass 35,020 38,060 40,790 43,230 47,080 Turkey Total Glass 1,600 2,240 3,010 4,050 6,010 Total Europe Total Glass 36,620 40,300 43,800 47,280 53,100
Source: BSR Sustainability GmbH

Annexes
- 384 -
16.2.3 Production in energy-intensive products - 2°C Scenario – 2000 to 2050
Table 16-17: Production of crude steel in EU27 + Norway, Switzerland and Turkey in 1000
tonnes, 2°C Scenario, 2000 – 2050
Country or country group 2000 2010 2020 2030 2050
Austria 5,710 6,030 5,340 4,590 3,280
Baltic States 500 0 0 0 0
Belgium/Luxembourg 14,210 13,540 12,930 12,120 10,090
Bulgaria 2,020 2,080 1,900 1,700 1,190
Czech Republic 6,210 5,740 5,110 4,380 3,090
Denmark 800 0 0 0 0
Finland 4,100 4,410 3,970 3,460 2,520
France 20,980 19,620 18,680 17,330 12,440
Germany 46,380 46,970 44,710 42,250 37,170
Greece 1,090 2,290 2,240 2,160 1,980
Hungary 1,870 1,990 1,850 1,690 1,340
Ireland 360 0 0 0 0
Italy 26,760 27,980 25,320 22,230 16,170
Malta/Cyprus – 0 0 0 0
Netherlands 5,670 6,620 6,570 6,400 5,650
Norway 680 710 700 690 620
Poland 10,500 10,700 10,480 9,900 6,830
Portugal 1,090 770 820 860 860
Romania 4,670 6,090 5,740 5,280 4,010
Slovakia 3,730 4,800 3,970 3,090 1,520
Slovenia 520 650 630 590 540
Spain 15,920 17,520 16,850 15,670 13,080
Sweden 5,230 5,330 5,150 4,880 4,010
Switzerland 1,000 1,190 1,210 1,190 1,120
United Kingdom 15,160 13,690 13,440 13,060 10,860
EU27 + 2 195,140 198,690 187,610 173,500 138,380
Turkey 14,330 27,450 35,380 42,680 36,380
Total Europe 209,460 226,140 222,980 216,180 174,750
Source: BSR Sustainability GmbH

ADAM 2-degree scenario for Europe – policies and impacts
- 385 -
Table 16-18: Production of recycled steel in EU27 + Norway, Switzerland and Turkey in 1000
tonnes, 2°C Scenario, 2000 – 2050
Country or country group 2000 2010 2020 2030 2050
Austria 560 640 640 640 620
Baltic States – 0 0 0 0
Belgium/Luxembourg 5,300 4,930 4,900 4,810 4,570
Bulgaria 600 760 760 760 740
Czech Republic 520 570 580 570 560
Denmark 800 0 0 0 0
Finland 970 1,460 1,470 1,460 1,420
France 8,490 7,480 7,540 7,490 7,300
Germany 13,320 14,010 14,110 14,030 13,670
Greece 1,090 2,290 2,240 2,160 1,980
Hungary 230 330 330 330 320
Ireland 360 0 0 0 0
Italy 16,010 17,940 18,070 17,860 14,520
Malta/Cyprus – 0 0 0 0
Netherlands 160 150 150 150 140
Norway 680 710 700 690 620
Poland 3,290 3,540 3,560 3,540 3,450
Portugal 500 770 820 860 860
Romania 1,330 1,770 1,780 1,770 1,730
Slovakia 290 370 380 380 370
Slovenia 520 650 630 590 540
Spain 11,670 13,810 13,620 13,140 12,060
Sweden 1,950 1,810 1,830 1,820 1,770
Switzerland 1,000 1,190 1,210 1,190 1,110
United Kingdom 3,640 2,770 2,790 2,770 2,700
EU27 + 2 73,280 77,940 78,100 76,990 71,040
Turkey 9,090 15,370 15,480 15,390 14,990
Total Europe 82,370 93,310 93,580 92,380 86,030
Source: BSR Sustainability GmbH

Annexes
- 386 -
Table 16-19: Production of primary aluminium in EU27 + Norway, Switzerland and Turkey
in 1000 tonnes, 2°C Scenario, 2000 – 2050
Country or country group 2000 2010 2020 2030 2050
Austria – 0 0 0 0
Baltic States – 0 0 0 0
Belgium/Luxembourg – 0 0 0 0
Bulgaria – 0 0 0 0
Czech Republic – 0 0 0 0
Denmark – 0 0 0 0
Finland – 0 0 0 0
France 440 450 450 450 420
Germany 640 610 540 460 320
Greece 160 170 170 160 150
Hungary 30 30 30 30 30
Ireland – 0 0 0 0
Italy 190 200 200 190 180
Malta/Cyprus – 0 0 0 0
Netherlands 300 340 340 330 310
Norway 1,030 1,580 1,950 2,270 2,660
Poland 50 60 60 60 50
Portugal – 0 0 0 0
Romania 180 250 250 250 230
Slovakia 110 160 160 150 140
Slovenia 80 140 140 130 120
Spain 370 400 390 380 360
Sweden 100 110 110 100 100
Switzerland 40 50 40 40 40
United Kingdom 310 370 360 350 330
EU27 + 2 4,020 4,890 5,170 5,350 5,430
Turkey 60 60 60 70 80
Total Europe 4,090 4,950 5,230 5,420 5,510
Source: BSR Sustainability GmbH

ADAM 2-degree scenario for Europe – policies and impacts
- 387 -
Table 16-20: Production of secondary aluminium in EU27 + Norway, Switzerland and Tur-
key in 1000 tonnes, 2°C Scenario, 2000 – 2050
Country or country group 2000 2010 2020 2030 2050
Austria 160 160 170 180 190 Baltic States not specified
Belgium/Luxembourg 1 0 0 0 0
Bulgaria 10 10 20 30 40
Czech Republic 40 40 50 60 60
Denmark 30 20 20 20 20
Finland 40 40 40 40 40
France 270 230 250 260 240
Germany 570 750 810 860 940
Greece 10 10 10 10 10
Hungary 40 30 40 50 50
Ireland – 0 0 0 0
Italy 600 680 730 770 760
Malta/Cyprus not specified
Netherlands 100 50 60 60 50
Norway 260 390 440 480 540
Poland 10 20 30 50 70
Portugal 20 20 30 30 30
Romania 2 10 20 40 50
Slovakia not specified
Slovenia not specified
Spain 240 260 300 340 360
Sweden 30 30 30 30 30
Switzerland 10 0 0 0 0
United Kingdom 240 210 220 200 210
EU27 + 2 2,670 2,960 3,250 3,510 3,700
Turkey not specified not specified 50 60 70 Total Europe not specified not specified 3,290 3,570 3,770
Source: BSR Sustainability GmbH

Annexes
- 388 -
Table 16-21: Production of cement in EU27 + Norway, Switzerland and Turkey in 1000 ton-
nes, 2°C Scenario, 2000 – 2050
Country or country group 2000 2010 2020 2030 2050
Austria 3,890 3,940 3,770 3,580 3,080
Baltic States 1,810 1,890 1,880 1,810 1,490
Belgium/Luxembourg 8,590 8,010 7,010 6,010 5,260
Bulgaria 2,400 2,420 2,290 2,130 1,530
Czech Republic 3,590 4,040 4,220 3,410 2,350
Denmark 2,030 2,080 2,020 1,960 1,770
Finland 1,290 1,490 1,620 1,710 1,480
France 20,140 21,610 21,790 21,650 19,050
Germany 32,940 32,920 31,100 29,180 25,050
Greece 15,580 12,410 8,550 4,970 4,270
Hungary 3,680 4,010 4,090 3,300 2,300
Ireland 3,650 3,400 2,710 1,880 1,830
Italy 43,290 40,520 35,090 29,760 24,290
Malta/Cyprus 2,470 2,440 2,250 1,990 1,910
Netherlands 3,180 3,300 3,210 3,100 2,730
Norway 1,800 1,880 1,880 1,860 1,730
Poland 11,610 12,100 11,890 11,370 8,890
Portugal 9,100 8,100 6,490 4,890 4,260
Romania 6,640 6,710 6,430 6,050 4,660
Slovakia 3,240 3,050 2,700 2,320 1,840
Slovenia 1,380 1,270 1,090 910 710
Spain 40,730 37,950 30,800 23,650 20,300
Sweden 2,670 2,980 3,170 3,330 3,040
Switzerland 3,940 3,870 3,600 3,310 2,880
United Kingdom 12,910 14,450 15,350 16,210 14,950
EU27 + 2 242,540 236,870 215,000 190,330 161,640
Turkey 34,120 37,290 37,720 36,970 32,180
Total Europe 276,650 274,160 252,720 227,300 193,830
Source: BSR Sustainability GmbH

ADAM 2-degree scenario for Europe – policies and impacts
- 389 -
Table 16-22: Production of paper in EU27 + Norway, Switzerland and Turkey in 1000 tonnes,
2°C Scenario, 2000 – 2050
Country or country group 2000 2010 2020 2030 2050
Austria 4,390 5,350 5,690 5,920 6,220 Baltic States 120 220 210 210 280 Belgium/Luxembourg 1,730 1,890 2,120 2,320 2,360 Bulgaria 140 360 410 470 490 Czech Republic 540 790 800 760 890 Denmark 260 410 470 470 470 Finland 13,510 12,940 14,010 13,890 13,260 France 10,010 10,380 10,920 10,420 10,380 Germany 18,180 23,250 21,870 22,400 21,000 Greece 500 550 560 590 600 Hungary 510 590 580 620 780 Ireland 40 50 50 50 40 Italy 9,130 11,330 13,380 15,510 15,410 Malta/Cyprus – 10 10 4 10 Netherlands 3,330 3,610 3,660 3,660 3,300 Norway 2,300 2,170 2,210 2,220 2,090 Poland 1,930 2,810 2,870 2,670 3,200 Portugal 1,290 1,820 2,430 2,970 3,260 Romania 340 390 600 780 910 Slovakia 930 890 860 760 1,280 Slovenia 410 650 610 570 590 Spain 4,770 5,840 7,630 7,620 8,100 Sweden 10,790 13,150 15,630 15,990 14,810 Switzerland 1,620 1,720 1,730 1,610 1,840 United Kingdom 6,610 6,630 6,230 5,980 6,170 EU27 + 2 93,350 107,790 115,540 118,420 117,720
Source: BSR Sustainability GmbH

Annexes
- 390 -
Table 16-23: Production of total glass in EU27 + Norway, Switzerland and Turkey in 1000
tonnes, 2°C Scenario, 2000 – 2050
Country or country group
Glass category 2000 2010 2020 2030 2050
Austria Total Glass 480 500 520 510 480
Baltic States Total Glass 70 80 80 80 80
Belgium/Luxembourg Total Glass 1,760 1,890 2,070 2,220 2,460
Bulgaria Total Glass 240 760 850 950 960
Czech Republic Total Glass 1,200 1,750 1,880 1,970 2,220
Denmark Total Glass 190 190 200 210 200
Finland Total Glass 140 150 150 150 150
France Total Glass 5,530 5,760 5,960 5,950 5,580
Germany Total Glass 7,680 6,980 7,230 7,330 7,060
Greece Total Glass 290 330 340 350 340
Hungary Total Glass 960 1,060 1,100 1,120 1,210
Ireland Total Glass 190 240 260 270 260
Italy Total Glass 4,910 5,530 5,810 5,850 5,530
Malta/Cyprus Total Glass – 0 0 0 0
Netherlands Total Glass 1,360 840 880 890 840
Norway Total Glass 90 80 80 70 60
Poland Total Glass 1,580 2,030 2,080 2,050 2,100
Portugal Total Glass 1,140 1,490 1,650 1,730 1,530
Romania Total Glass 280 390 420 430 430
Slovakia Total Glass 170 190 200 200 200
Slovenia Total Glass 120 130 130 130 130
Spain Total Glass 2,940 3,340 3,660 3,840 3,780
Sweden Total Glass 350 380 420 440 480
Switzerland Total Glass 410 320 330 330 350
United Kingdom Total Glass 2,960 3,560 3,700 3,800 3,750 EU27 + 2 Total Glass 35,020 37,980 40,000 40,880 40,190 Turkey Total Glass 1,600 2,220 2,720 3,310 4,220 Total Europe Total Glass 36,620 40,200 42,720 44,180 44,410
Source: BSR Sustainability GmbH
16.3 Economic sectors used in the ASTRA model The national economies of the EU27+2 countries modelled by the ASTRA model are divided into 25 economic sectors according to the NACE-CLIO categorisation (General Industrial Clas-sification of Economic Activities in the European Communities - version used for the input-output tables). It includes 14 manufacturing sectors, 9 service sectors and 2 other sectors, which are presented in the following list:

ADAM 2-degree scenario for Europe – policies and impacts
- 391 -
Manufacturing sectors:
• Energy, gas and water
• Ferrous and non-ferrous ores and metals
• Non-metallic mineral products
• Chemical products
• Metal products except machinery
• Agricultural and industrial machinery
• Optical goods, office+data processing mach.
• Electrical goods
• Transport equipment
• Food, beverages, tobacco
• Textiles and clothing, leather and footwear
• Paper and printing products
• Rubber and plastic products
• Other manufacturing products
Service sectors:
• Recovery, repair services, wholesale, retail
• Lodging and catering services
• Inland transport services
• Maritime and air transport services
• Auxiliary transport services
• Communication services
• Services of credit and insurance institutions
• Other market services
• Non-market services
Other sectors:
• Agriculture, forestry and fishery products
• Building and construction

References
- 392 -

ADAM 2-degree scenario for Europe – policies and impacts
- 393 -
17 References
ACEA (2009): Overview of CO2 based motor vehicle taxes in the EU. download: www.acea.be/images/uploads/files/20090202_CO2_tax_overview.pdf
Adnot, J. (editor) (2003): Energy Efficiency and Certification of Central Air Conditioners, ARMINES, Paris Cedex, France
Adnot, J., Riviere, P., Marchio, D., Holmstrom, M., Naeslund, J., Saba, J., Becirspahic, S., Lo-pes, C., Blanco, I., Perez-Lombard, L., Ortiz, J., Papakonstantinou, N., Doukas, P., Jop-polo, C. M., Casale, C., Benke, G., Giraud, D., Houdant, N., Colomines, F., Gavriliuc, R., Popescu, R., Burchiu, S., Georges, B., Hitchin, R. (2003): Energy Efficiency and Certifi-cation of Central Air Conditioners (EECCAC). Study for the D.G. Transportation-Energy (DGTREN) of the Commission of the E.U., Paris.
Aebischer, B., (1999): Analyse und Entwicklung des Energieverbrauchs im Dienstleistungssek-tor. In: R. Meier, M. Renggli, P. Previdoli (Hrsg.), Energie, Wirtschaft, Nachhaltigkeit, Verlag Ruegger, Chur/Zürich.
Aebischer, B., Catenazzi, G. (2006): Energieverbrauch der Dienstleistungen und der Landwirt-schaft. Ergebnisse der Szenarien Ia und Ib und Entwurf der Ergebnisse von Szenario II. Bundesamt für Energie, Bern, Stand 6. 1. 2006 http://www.energie-schweiz.ch/imperia/md/content/ statistikperspektiven/34.pdf
Aebischer, B., Catenazzi, G. (2007a): Der Energieverbrauch der Dienstleistungen und der Landwirtschaft, 1990 – 2035. Ergebnisse der Szenarien I bis IV und der zugehörigen Sen-sitivitäten BIP hoch, Preise hoch und Klima wärmer. Bundesamt für Energie, Bern, März.
Aebischer, B., Henderson, G., Catenazzi, G. (2006): Impact of climate change on energy de-mand in the Swiss service sector – and application to Europe. Download: http://www.cepe.ethz.ch/publications/IEECB06_paper_Aebischer_9-3-06.pdf
Aebischer, B., Jakob, M., Catenazzi, The late G. Henderson (2007b): Impact of climate change on thermal comfort, heating and cooling energy demand in Europe. Proceedings eceee Summer Study 2007, Colle sur Loup, France, June (ISBN 978-91-633-0899-4).
Aebischer, B., Schwarz, J. (1998): Dokumentation zur Studie: Perspektiven der Energienachfra-ge des tertiären Sektors f¨ur Szenarien I bis III 1990 – 2030. ETHZ, Zurich.
Aebischer, B., Schwarz, J., Spreng, D. (1996): Perspektiven der Energienachfrage des tertiären Sektors für Szenarien I bis III 1990-2003. Bundesamt für Energie, Bern, Oktober.
Almeida, A.T., Ferreira, F., Fong, J., Fonseca, P. (2007): EUP Lot 11 Motors, Coimbra.

References
- 394 -
Almeida, A.T., Fonseca, P., Ferreira, F., Guisse, F., Blaise, J., Clair, E., Diop, A., Previ, A., Dominioni, A.C., Di Pillo, M., Russo, S., Falkner, H., Reichert, J., Tönsing, E., Malmose, K. (2001): Improving the penetration of energy-efficient motors and drives - In Coopera-tion with University of Coimbra / Department of Electrical Engineering; Electricite de France; ENEL (Italy); ETSU (UK); NESA (Denmark), Fraunhofer ISI (Germany), Coim-bra(Portugal): University of Coimbra.
Almeida, A.T.D., Ferreira, F., Fonseca, P., Chretien, B., Souet, P., Falkner, H., Reichert, J., Peterson, C.T., Both, D. (2000): VSDs for electric motor systems, ISR-University of Coimbra (Portugal); Agence de l'Environnement et de la Maîtrise de l'Energie (France); ETSU; Fraunhofer-Institut für Systemtechnik und Innovationsforschung (Karlsruhe) (Hrsg.), Coimbra, Portugal: ISR-University of Coimbra.
Arnell, N. (2006): Regional Climate Change Impacts on Energy Requirements. In: Understand-ing the regional impacts of climate change. Research Report Prepared for the Stern Re-view on the Economics of Climate Change. Tyndall Centre for Climate Change Research. Working Paper 90.
Barker, T. (2008): The economics of avoiding dangerous climate change. An editorial essay on The Stern Review, Climatic Change (2008) 89:173-194. DOI: 10.1007/s10584-008-9433-x
Barker, T. (2009a): Will the reconstruction of the global economy be positive for mitigating climate change? In: Building a low carbon future: the politics of climate change edited by Anthony Giddens, Simon Latham, and Roger Liddle.
Barker, T. (2009b): Understanding and resolving the Big Crunch. Paper presented to a confer-ence on “The Big Crunch”, Cambridge. Download: www.neweconomicthinking.org/downloads/Big_Crunch%20.pdf
Barker, T., Dagoumas, A., Rubin, J. (2009): The macroeconomic rebound effect and the world economy. Energy Efficiency. DOI: 10.1007/s12053-009-9053-y
Barker, T., Løfsnæs, O., Pollitt, H. (2007): The ETM in E3ME43. Cambridge Econometrics paper. Download: http://www.camecon.com/suite_economic_models/e3me/pdf%20files/ETM.pdf
Barker, T., Pan, H., Köhler, J., Warren, R., Winne, S. (2005): Avoiding dangerous climate change by inducing technological progress: scenarios using a large-scale econometric model. In: H.J. Schellnhuber et al (eds.) Avoiding Dangerous Climate Change. Cam-bridge University Press, Ch. 38.

ADAM 2-degree scenario for Europe – policies and impacts
- 395 -
Barker, T., Pan, H., Köhler, J., Warren, R., Winne, S. (2006): Decarbonising the global econ-omy with induced technological change: Scenarios to 2100 using E3MG. In: The Energy Journal, Vol. 27, p. 143-160.
Barker, T., Scrieciu, S. S. (2009): Modelling Low Stabilisation with E3MG: Towards a ‘New Economics’ Approach to Simulating Energy-Environment-Economy System Dynamics. In: The Energy Journal special issue (forthcoming).
Barker, T., Scrieciu, S. S., Taylor, D. (2008): Climate change, social justice and development. Development special issue 51(3), p. 317-324.
Berger, S. (2008): Circular Cumulative Causation (CCC) à la Myrdal and Kapp — Political Institutionalism for minimizing social costs. In: Journal of Economic, Issue XLII, No.2.
BMU – German Federal Ministry for the Environment, Nature Conservation and Nuclear Safety (2007): Key Elements of an Integrated Energy and Climate Programme -Decision of German Cabinet on August 23rd/24th 2007 at Meseberg. http://www.bmu.de/files/pdfs/ allgemein/application/pdf/klimapaket_aug2007_en.pdf.
Bossel, H. (1994): Modellbildung und Simulation – Konzepte, Verfahren und Modelle zum Verhalten dynamischer Systeme. 2nd edition, Vieweg, Brunswick.
Brunner et al. (2009): Betrieb ohne Nutzen (BON) im Dienstleistungssektor (operation without use (OWU) in the service sector, in German). Report on behalf of the Swiss Federnal Of-fice of Energy, Bern, January.
Cambridge Econometrics (2007): E3ME manual. Download: http://www.camecon-e3memanual.com/cgi-bin/EPW_CGI
Carbon Trust (2006): Energy saving fact sheet - lighting, London: Carbon Trust. Online: http://www.thecarbontrust.co.uk/publications (Stand: 27.10.2006).
Cartalsi, C., Synodinou, A., Proedrou, M., Tsangrassoulis, A., Santamouris, M., (2001): Modifi-cations in energy demand in urban areas as a result of climate change: an assessment for the southeast Mediterranean region. Energy Conversion and Management 42 1647-1656.
Center for Public Integrity (2009): Who’s behind the financial meltdown: the top 25 subprime lenders and their Wall St backers. Washington, DC. Download: http://www.publicintegrity.org/projects/entry/1349/
COWI (2002): Fiscal measures to reduce CO2 emissions from new passenger cars. Report for Directorate-General for Environment.

References
- 396 -
Criqui, P., Mima, S. (2009): Exploring the energy security – climate policy nexus with the POLES model. Communication à International energy workshop. Venise, 17-19 juin 2009.
Criqui, P., Mima, S., Menanteau, P. (2009): The trajectories of new energy technologies in carbon constraint cases with the POLES world energy model. Communication à Climate change : global risks, challenges and decisions. University of Copenhagen, Copenhague, 10-12/03/2009.
Criqui, P., Mima, S., Kitous, A. (2007): The European energy system in the context of long term climate policies. Communication à Energy Markets and Sustainability in a Larger Europe, 9th IAEE European Energy Conference. International Association of Energy Economists, Florence, 10-13 juin 2007.
Criqui, P., Mima, S., Kitous, A. (2009) : Scénarios d’émission pour les chroniques de la valeur tutélaire du carbone. In. La valeur tutélaire du carbone : rapport de la commission prési-dée par Alain Quinet. Paris : La Documentation française. pp. 220-271.
Criqui, P., Mima, S., Menanteau, P., Kitous, A. (2007) : Carbon constrained scenarios and the future of the materials producing industries. Communication à First SAM Seminar, SOVAMAT. Séville, 6-7 mars 2007. pdf
Crutzen, P. J., Mosier, A. R., Smith, K. A., Winiwarter, W. (2007): N2O release from agro-biofuel production negates global warming reduction by replacing fossil fuels. In: Atmos. Chem. Phys. Discuss., Vol. 7, p. 11191–11205.
Danko, J.L.P. (2005): Combined heat and power (CHP) electricity generation in the EU-25 in 2002 to-talled 299.2 TWh, 9.9% of total gross electricity generation, Eurostat (Hrsg.), Environment and Energy, Luxembourg: European Communities.
Davis, W. B., Levine, M. D., Train, K., Duleep, K. G. (1995): Effects of feebates on vehicle fuel economy, carbon dioxide emissions, and consumer surplus (DOE/PO-0031). Office of Policy, US Department of Energy, Washington, DC.
De Almeida, Anibal T., et al. (2008): EuP Lot 11: Motors, Technical Study for Ecodesign Di-rective, mandated by European Commission, Coimbra Portugal, April.
de Haan, P., Mueller, M. G., Scholz, R. W. (2009): How much do incentives affect car pur-chase? Agent-based microsimulation of consumer choice of new cars, part II: forecasting effects of feebates based on energy-efficiency. In: Energy Policy, Vol. Vol. 37, p. 1083–1094.

ADAM 2-degree scenario for Europe – policies and impacts
- 397 -
de Haan, P., Müller, M. G., Peters, A. (2007): Anreizsysteme beim Neuwagenkauf: Wirkungsar-ten, Wirksamkeit und Wirkungseffizienz. Bericht zum Schweizer Autokaufv-erhalten Nr. 14. EHT Zürich, IED-NSSI, report EMDM1561. Download: www.nssi.ethz.ch/res/emdm/
DeCicco, J.M., Geller, H.S., Morrill, J.H. (1993): Feebates for fuel economy: market incentives for encouraging production and sales of efficient vehicles (T921). American Council for an Energy-Efficient Economy, Washington, DC.
DENA – Deutsche Energie Agentur (2009): Energieeffiziente Mobilität im toten Winkel. Ana-lyse der Auto- und Verkehrsberichterstattung großer deutscher Tageszeitungen. Media analysis of the project “ich und mein auto” undertaken by Ausschnitt Medienbeobachtung on behalf of DENA.
E.V.A. (Energieverwertungsagentur) (1999): Energy Efficiency of Passenger Cars. Labelling and its Impacts on Fuel Efficiency and CO2-Reduction, Study for the Directorate General for Energy /DGXVII) of the Commission of the European Communities, Contract No. SAVE-XVII/4.1031/Z/96-005, Wien.
EC – European Commission (2006): European Commission: Annexes to the report from the Commission to the Council on the review of the energy crops scheme. SEC(2006) 1167.
EC – European Commission (2007): Energy and Transport in Figures 2007. Joint publication of EC DG TREN and EUROSTAT.
EC – European Commission (2007): Limiting Global Climate Change to 2 degrees Celsius The way ahead for 2020 and beyond. EC Communication COM(2007)2, http://eur-lex.europa.eu/LexUriServ/LexUriServ.do?uri=COM:2007:0002:FIN:EN:PDF.
EC - European Commission (2008): 20 20 by 2020 Europe's climate change opportunity. EC Communication COM(2008)30, http://eur-lex.europa.eu/LexUriServ/LexUriServ.do?uri =COM:2008:0030:FIN:EN:PDFNOT
EC – European Commission (2009): Towards a comprehensive climate change agreement in Copenhagen. EC Communication COM(2009)39, http://eur-lex.europa.eu/ LexUri-Serv/LexUriServ.do?uri=COM:2009:0039:FIN:EN:PDF.
EEA - European Environment Agency (2006): How much bioenergy can Europe produce with-out harming the environment, EEA Report Nr. 7, Luxembourg: Office for Official Publi-cations of the European Communities.
EEAP-NL (2007): The Netherlands Energy Efficiency Action Plan 2007. The Hague, Septem-ber.

References
- 398 -
Ergungor, O. E. (2007): On the resolution of financial crises: The Swedish experience. Federal Reserve Bank of Cleveland, Policy Discussion Paper, Number 21.
Ergungor, O.E., Cherny, K. (2009): Effective Practices in Crisis Resolution and the Case of Sweden, Economic Commentary, Federal Reserve Bank of Cleveland. Download: http://www.clevelandfed.org/research/commentary/2009/0209.cfm
Ergungor, O.E., Thomson, J. B. (2006): Systemic banking crises. In: Andrew H. Chen, ed., Re-search in Finance, Vol. 23, p. 279–310, Bingley, Emerald.
ETSU; CETIM; D.T.Reeves; NESA; Technical University Darmstadt (2001): Study on improv-ing the energy efficiency of pumps, Brüssel: European Commission.
EU – European Union (2003): Establishing a scheme for greenhouse gas emission allowance trading within the Community. Directive 2003/87/EU of the European Parliament and of the Council. In: Official Journal of the European Union, 13th October 2003, http://eur-lex.europa.eu/LexUriServ/LexUriServ.do?uri=OJ:L:2003:275:0032:0046:EN:PDF.
EU – European Union (2006): Directive on energy end-use efficiency and energy services. Di-rective 2006/32/EC of the European Parliament and of the Council. In: Official Journal of the European Union, 5th April 2006 http://eur-lex.europa.eu/ LexUriS-erv/LexUriServ.do?uri=OJ:L:2006:114:0064:0085:EN:PDF.
EU – European Union (2009): Setting emission performance standards for new passenger cars as part of the Community’s integrated approach to reduce CO2 emissions from light-duty vehicles. Regulation (EC) No 443/2009 of the European Parliament and of the Council. In: Official Journal of the European Union, 23rd April 2009 http://eur-lex.europa.eu/ LexUriServ/LexUriServ.do?uri=OJ:L:2006:114:0064:0085:EN:PDF.
Eurostat (2001): Combined heat and power production (CHP) in the EU, Luxembourg: Euro-pean Com-munities.
Eurostat (2005): Temperature correction of final energy consumption.
Eurostat (2007). Energy Balance, Data 2004-2005, ISBN 978-92-79-05730-4, Eurostat, Office for Official Publications of the European communities.
EWG – Energy Watch Group (2007): „Crude Oil – the Supply Outlook“. LBST, Ottobrunn, www.energywatchgroup.org.
Falkner, H. (2007): EuP Lot 11: Water pumps (in commercial buildings, drinking water pump-ing, food industry, agriculture).

ADAM 2-degree scenario for Europe – policies and impacts
- 399 -
Fishbone, L.G., Giesen, G., Goldstein, G.A., Hymmen, H.A., Stocks, K.J., Vos, H., Wilde, D., Zolcher, R., Balzer, C. & Abilock, H. (1983). User's guide for MARKAL A Multi-period, linear programming model for energy systems analysis (BNL/KFA Version 2.0). BNL 51701, Brook-haven National Laboratory and Kernforschungsanlage Jülich, Brookhaven, USA.
Fleiter, T. (2008): Wirtschaftlichkeitsvergleich der langfristigen Stromeinsparpotenziale bei Elektromo-torsystemen und Beleuchtungsanlagen in der Industrie, 10. Symposium Ener-gieinnovationen der Universität Graz 13-15.02.2008, Graz.
Foley, D. (2006): Adam’s fallacy: a guide to economic theology. In: Harvard University Press, Massachusetts.
Frank, Th. (2005): Climate change impacts on building heating and cooling energy demand in Switzerland. Energy and Buildings 37 (2005) pp 1175-1185.
Fraunhofer ISI (2003): Druckluft Effizient: Druckluftanwendung, Fraunhofer-Institut für Sys-tem- und Innovationsforschung (Karlsruhe) (Hrsg.), Karlsruhe. Online: http://www.druckluft-effizient.de/fakten/fakten-00-09.pdf (Stand: 16.01.2007).
Germany Solar Energy Society. (2005): Planning and Installing Solar Thermal Systems: a Guide for Installers, Architects, and Engineers. London: Earthscan.
Giblin, S., McNabola, A. (2009): Modelling the impacts of a carbon emission-differentiated vehicle tax system on CO2 emissions intensity from new vehicle purchases in Ireland. In: Energy Policy, Vol. 37, p. 1404–1411.
Gilbert, N. (2007): Agent-based models: Sage Publ., Newbury Park, London, New Dehli.
Greene, D.L., Patterson, P.D., Singh, M., Li,. J. (2005): Feebates, rebates and gas-guzzler taxes: a study of incentives for increased fuel economy. In: Energy Policy, Vol. 33, p. 757–775.
Grubb, M., Köhler, J., Anderson, D. (2002): Induced Technical Change in Energy and Envi-ronmental Modelling: Analytic Approaches and Policy Implications. In: Annual Review of Energy Environment, Vol. 27, p. 271-308.
Gruber, E., Jochem, E. et al. (2006): Marktstudie "Sonderfonds für Energieeffizienz in Industrie und Gewerbe". Bericht an die KfW Bankengruppe, Karlsruhe, Fraunhofer ISI.
Gudbjerg, E.; Andersen, H. (2007): Using coatings to reduce energy consumption in pumps and ventila-tors, ECEEE Summer Study, La Colle sur Loup.
Gül, T. (2008): An energy-economic scenario analysis of alternative fuels for transport. PhD thesis No. 17888, ETH Zürich / Switzerland.

References
- 400 -
Heimann, M., Reichstein, M. (2008): Terrestrial ecosystem carbon dynamics and climate feed-backs. In: Nature 451, 289-292 (17 January 2008).
Hektor, E., Berntsson, T. (2007): Future CO2 removal from pulp mills – process integration consequences. In Energy Conversion and Management 48, p 3025-3033, Elsevier
Held, A., Krause, H., Ragwitz, M. (2008): Deriving Cost-Resource Curves for Wind-Onshore Energy in the EU using a Geographical Information System. Proceedings of the 31st IAEE International Conference, Istanbul.
Helfrich, N., Reusch, J. (2009): Documentation and User Manual for the Virtual Model Server. Under preparation, Fraunhofer-ISI, Karlsruhe.
HLB Decision Economics Inc. (1999): Assessment of a feebate scheme for Canada. Final report prepared for Natural Resources Canada, Ottawa, Ontario.
HM Treasury (2006): “Stern Review on the economics of climate change”. http://www.hmtreasury.gov.uk/independent_reviews/stern_review_economics_climate_change/stern_review_report.cfm.
Hofer, R. (1994): Analyse der Potenziale industrieller Kraft-Wärme Kopplung, 28, IFE Schriftenreihe.
Hoffmann, C., Pfitzner, G. (1994): Ventilatoren, Instrumente für Klimagas-Reduktionsstrategien Teilpro-jekt 8., Querschnittstechniken, Jülich: Forschungszentrum, Zentralbibliothek.
Hofstetter, P., Jakob, M. (2006): Klimaschutz spart Geld beim Wohnen, WWF Schweiz, Zurich
Hoogwijk, M., Vuuren, D.v., Boeters, S., Blok, K., Blomen, E., Barker, T., Chateau, J., Masui, T., Nabuurs, G.J., Novikova, A., Riahi, K., de la Rue du Can, S., Sathaye, J., Scrieciu, S.S., Urge-Vorsatz, D. (2008): Sectoral Emission Mitigation Potentials: Comparing Bot-tom-Up and Top-Down Approaches. In: Report for the Netherlands Research Programme on Scientific Assessment and Policy Analysis for Climate Change. Download: www.mnp.nl
HSBC (2009): A Climate for Recovery The colour of stimulus goes green.
IEA – International Energy Agency (2006): Light's labour's lost - policies for energy efficient lighting, International Energy Agency (Hrsg.), Energy efficiency policy profiles, Paris: IEA.
IEA – International Energy Agency (2007): Tracking Industrial Energy Efficiency and CO2 Emissions, Paris: International Energy Agency (IEA).

ADAM 2-degree scenario for Europe – policies and impacts
- 401 -
IEA – International Energy Agency (2008): Medium-Term Oil Market Report 2008. http://www.iea.org/textbase/publications/free_new_Desc.asp? PUBS_ID=2107.
IPCC – Intergovernmental Panel on Climate Change (2007): "Climate Change 2007: Synthesis Report". Pachauri, R.K. and Reisinger, A. (Eds.), IPCC Fourth Assessment Report (AR4), Geneva. http://www.ipcc.ch/pdf/assessment-report/ar4/syr/ar4_syr.pdf.
Irrek, W., Thomas, S. (2006): Der EnergieSparFonds für Deutschland. Hans-Böckler-Stiftung 169, Düsseldorf.
Isaac, M., Vuuren, D. v. (2008): Modeling global residential sector energy demand for heating and air conditioning in the context of climate change. In: Energy Policy, Vol. 37, p. 507-521.
Iten, R., Hammer, S., Sammer, K., Wüstenhagen, R. (2005): Evaluation energieEtikette - Mass-nahmen zur Absenkung des Flottenverbrauchs, Bericht im Auftrag des Bundesamtes für Energie, Bern/Zürich/St. Gallen.
IZT Institute for Futures Studies and Technology Assessment gGmbH; COGEN Europe – European As-sociation for the Promotion of Cogeneration; RISØ National Laboratory; ECN Netherlands Energy Research Foundation; unit[e] unit energy europe agJenbacher AG (2002): Decentralised Generation Technologies - Potentials, Success Factors and Im-pacts in the Liberalised EU Energy Markets, Berlin: IZT.
Jakob (2008): Societal requirements and constraints and the policy instruments required to mod-ify the current state of art. Input paper to the EFONET Workshop held in Rome on 1-2 October 2008, December.
Jakob, M. (2006): Marginal costs and co-benefits of energy efficiency investments - The case of the Swiss residential sector. Energy Policy 34, 172–187.
Jakob, M., Baumgartner, A., Menti, U.P., Plüss, I. (2006b): Integral Planning of Energy Effi-ciency, Cost and Comfort - A Comprehensive Cost and Benefit Evaluation. "Improving Energy Efficiency in Commercial Buildings". Proceedings of the international conference (IEECB’06), Frankfurt, 26 - 27 April 2006.
Jakob, M., Catenazzi, G., Jochem, E., Shukla, A. (2008): Adaptation to and mitigation of cli-mate change in the tertiary sector of Europe. Proceedings of the IEECB’08 - Fifth Inter-national Conference on Improving Energy Efficiency in Commercial Buildings, Frank-furt, April.

References
- 402 -
Jakob, M., Jochem, E. (2003): Erneuerungsverhalten im Bereich Wohngebäude – eine quantita-tive Erhebung (Renovation Pattern in the Case of Residential Buildings – A Quantitaitve Survey, in German). Report on behalf of Bundesamt für Energie (BFE) (Swiss Federal Office of Energy, SFOE), Bundesamt für Wohnungswesen (BWO) (Swiss Federal Office of Housing Affairs) and Cantons AG, BE, BL, TG, ZH
Jakob, M., Jochem, E., Honegger, A., Baumgartner, A., Menti, U., Plüss, I. (2006): Grenzkosten bei forcierten Energie-Effizienz-Massnahmen und optimierter Gebäudetechnik bei Wirt-schaftsbauten. Bundesamt für Energie (Hrsg.), Bern, November.
Janssen, A., Lienin, S., Gassmann, F., Wokaun, A. (2006): Model aided policy development for the market penetration of natural gas vehicles in Switzerland. In: Transportation Re-search, Part A - Policy and Practice, Vol. 40, p. 316-333.
Janssen, M.A.; Ostrom, E. (2006): Empirically based, agent-based models. In: Ecology and Society, 11 (2).
Jochem, E., Barker, T. Scrieciu, S., Schade, W., Helfrich, N., Edenhofer, O., Bauer, N., Mar-chand, S., Neuhaus, J., Mima, S., Criqui, P., Morel, J., Chateau, B., Kitous, A., Nabuurs, G. J., Schelhaas, M. J., Groen, T., Riffeser, Reitze, F., Jochem, E., Catenazzi, G., Jakob, M., Aebischer, B., Kartsoni, K., Eichhammer, W., Held, A., Ragwitz, M., Reiter, U., Kypreos, S., Turton, H. (2007): EU-Project ADAM: Adaptation and Mitigation Strate-gies: Supporting European Climate Policy - Deliverable M1.1: Report of the Base Case Scenario for Europe and full description of the model system. Fraunhofer ISI, Karlsruhe, November.
Jochem, E., Barker, T., Scrieciu, S., Schade, W., Helfrich, N., Edenhofer, O., Bauer, N., Mar-chand, S., Neuhaus, J., Mima, S., Criqui, P., Morel, J., Chateau, B., Kitous, A., Nabuurs, G. J., Schelhaas, M.J., Groen, T., Riffeser, L., Reitze, F., Jochem, E., Catenazzi, G., Ja-kob, M., Aebischer, B., Kartsoni, K., Eichhammer, W., Held, A., Ragwitz, M., Reiter, U., Kypreos, S., Turton, H. (2008): EU-Project ADAM: Adaptation and Mitigation Strate-gies: Supporting European Climate Policy - Deliverable M1.2: Report of the Reference Case Scenario for Europe. Fraunhofer ISI, Karlsruhe, November 2008, revised May 2009.
Jochem, E., Gruber, E. (2007): Local Learning-networks on energy effi-ciency in industry – Successful initiative in Germany. In Applied Energy Vol 84 S.806-816.
Jochem, E., Jäger, C., Schade, W., Battaglini, A., Köwener, D. et al. (2008): Investitionen für ein klimafreundliches Deutschland. Final report of the KlimInvest 2020 project on behalf of German Federal Ministry for the Environment, Nature Conservation and Nuclear Safety, Karlsruhe, Berlin. http://www.kliminvest.net/download.html.

ADAM 2-degree scenario for Europe – policies and impacts
- 403 -
Jochem, E., Schade, W., Barker, T., Catenazzi, G., Chateau, B., Criqui, P., Eichhammer, W., Groen, T., Held, A., Helfrich, N., Jakob, M., Kitous, A., Köhler, J., Mima, S., Morel, J., Nabuurs, G. J., Quandt, L., Ragwitz, M., Reiter, U., Reitze, F., Schelhaas, M.J., Turton, H. (2009): Report of the Reference and 2°C Scenario for Europe". Deliverable D-M1.2 of the ADAM project, Fraunhofer ISI, Karlsruhe, May.
Johnson, K. C. (2006): Feebates: an effective regulatory instrument for cost-constrained envi-ronmental policy. In: Energy Policy, Vol. 34, p. 3965–3976.
Kaldor, N. (1957): A Model of Economic Growth. In: The Economic Journal 67 (268), p. 591-624.
Kaldor, N. (1972): The irrelevance of equilibrium economics. In: The Economic Journal 52, p. 1237-55.
Kaldor, N. (1985): Economics without equilibrium. In: Cardiff Press, UK.
Knopf, B., Edenhofer, O., Barker, T., Bauer, N., Baumstark, L., Criqui, P., Held, A., Isaac, M., Jakob, M., Jochem, E., Kitous, A., Kypreos, S., Leimbach, M., Magné, B., Mima, S., Schade, W., Scrieciu, S. S., Turton, H., Vuuren, D. v. (2009): The Economics of Low Stabilisation: Implications for Technological Change and Policy. In: The Energy Journal special issue (forthcoming).
Köhler, J., Barker, T., Anderson, D., Pan, H. (2006): Combining Energy Technology Dynamics and Macroeconometrics: The E3MG Model. In: The Energy Journal, Special Issue 2.
Köhler, J., Grubb, M., Popp, D., Edenhofer, O. (2006a): The Transition to Endogenous Techni-cal Change in Climate-Economy models: a Technical overview to the Innovation Model-ling Comparison Project. In: The Energy Journal, Special Issue (Endogenous Technologi-cal Change and the Economics of Atmospheric Stabilisation), p. 17-55.
Krail, M., Schade, W., Fiorello, D., Fermi, F., Martino, A., Christidis, P., Schade, B., Purwanto, J., Helfrich, N., Scholz, A., Kraft, M. (2007): Outlook for Global Transport and Energy Demand. Deliverable 3 of TRIAS (Sustainability Impact Assessment of Strategies Inte-grating Transport, Technology and Energy Scenarios). Funded by European Commission 6th RTD Programme. Karlsruhe, Germany.
Kurani, K. S. (1992): Application of a behavioral market segmentation theory to new transpor-tation fuels in New Zealand. Ph.D. Dissertation, ITS-RR-92-05. University of California, Institute of Transportation Studies, Davis, CA.
Kurani, K. S., Sperling, D. (1988): The rise and fall of diesel cars in the USA: a consumer choice analysis. In: Transportation Research Record, Vol. 1175, p. 23–32.

References
- 404 -
Langer, T. (2005): Vehicle efficiency incentives: An update on feebates for states. Report Num-ber T051. American Council for an Energy-Efficient Economy, Washington, DC.
Lapillonne, B., coord., Chateau, B., collab., Kitous, A., collab., Criqui, P., collab., Mima, S, collab., Menanteau, P., collab., et al. (2007) : World energy technology outlook - 2050 - WETO-H2. Bruxelles : Commission européenne ; Grenoble : LEPII-EPE, collab. ; et al. 161 p. EUR 22038. http://ec.europa.eu/research/energy/pdf/weto-h2_en.pdf
Lehman, C., McLoughlin, K., Dewhurst, M. (2003): Assessing the impact of graduated vehicle excise duty: Quantitative report. Download: http://www.dft.gov.uk/pgr/roads/environment/research/ consumerbehav-iour/assessingtheimpactofgraduate3817.
Loulou, R., Goldstein, G., Noble, K. (2004). Documentation for the MARKAL Family of Mod-els. Energy Systems Technology Analysis Programme (ETSAP). International Energy Agency (IEA). http://www.etsap.org/MrklDoc-I_StdMARKAL.pdf
Ma, T., Nakamori, Y. (2005): Agent-based modeling on technological innovation as an evolu-tionary process. In: European Journal of Operational Research, 166 (3), 741-755.
Marchio, D. (2004): Climatisation à haute efficacité énergétique et à faible impact environne-mental: chiffres clés de la climatisation dans le monde, en Europe et en France. Download: http://www-cep.ensmp.fr/francais/themes/syst/html/cles.htm
McNeil, M. A., Letschert, V. E. (2008): Future air conditioning energy consumption in develop-ing countries and what can be done about it: the potential of efficiency in the residential sector. Download: http://repositories.cdlib.org/cgi/viewcontent.cgi?article=6379&context=lbnl
ME&P (2000): "SCENES European Transport Forecasting Model and Appended Module: Technical Description", Deliverable D4 of SCENES (Modelling and methodology for analysing the interrelationship between external developments and European transport) project funded by the European Commission 4th RTD framework, Cambridge.
Meinshausen, M., Meinshausen, N., Hare, W., Raper, S.C.B., Frieler, K., Knutti, R., Frame, D.J., Allen, M.R. (2009): Greenhouse-gas emission targets for limiting global warming to 2 °C. In: Nature, 458, pp. 1158-1163.
Meyer, J., Kruska, M., Kuhn, H.-G., Sieberger, B.-U., Bonczek, P. (2000): Rationelle Ener-gienutzung in der Ernährungsindustrie - Leidfaden für die betriebliche Praxis, Braun-schweig: Vieweg.

ADAM 2-degree scenario for Europe – policies and impacts
- 405 -
Mima, S., Criqui, P. (2003): The future of fuel cells in a long term intertechnology competition framework. In : The economic dynamics of fuel cells technologies. Avadikyan, B., Cohendet, P., Héraud, J.-A., eds. Heidelberg : Springer-Verlag, p. 43-79.
Mima, S., Criqui, P. (2007): Scenario modelling : the impact of the carbon constrained scenarios on steel industry. Communication to ULCOS Trollfjord Seminar. Norway, 26-28 mars 2007. pdf
Mima, S., Criqui, P. (2009): Assessment of the impacts of climate change on the energy systems with POLES model. Communication à International energy workshop. Venise, 17-19 juin 2009.
Nabuurs, G.J., Pussinen, A., Van Brusselen, J., Schelhaas, M.J. (2007): Future harvesting pres-sure on European forests. European Journal of Forest Research 126, 391-400
NEF (2008): A Green New Deal, New Economics Foundation, London.
Nitsch, J. (2008): „Leitstudie 2008 - Weiterentwicklung der `Ausbaustrategie Erneuerbare Energien` vor dem Hintergrund der aktuellen Klimaschutzziele Deutschlands und Euro-pas.“ Baseline Scenario Study on Renewables on behalf of the German Ministry of Envi-ronment, Nature Conservation and Nuclear Safety, DLR, Stuttgart.
Ortuzar, J. D., Willumsen, L. G. (2004): Modelling Transport. 3rd edition, Wiley, Chichester.
Peters, A., Mueller, M.G., de Haan, P., Scholz, R.W. (2008): Feebates promoting energy-efficient cars: Design options to address more consumers and possible counteracting ef-fects. In: Energy Policy, Vol. 36, p. 1355–1365.
Pollitt, H., Barker, T. (2009): Modelling the financial crisis with the global, econometric E3MG model. In: International Journal of Applied Economics (forthcoming).
Prasad, E., Sorkin, I. (2009): Assessing the G-20 Stimulus Plans: A Deeper Look, The Brook-ings Institution, Washington D.C. Download: http://www.brookings.edu/articles/2009/03_g20_stimulus_prasad.aspx
Pussinen, A., Schelhaas, M.J., Verkaik, E., Heikkinen, E., Liski, J., Karjalainen, T., Päivinen, R., and Nabuurs, G.J. (2001): Manual for the European Forest Information Scenario Model (EFISCEN 2.0). European Forest Institute Internal Report No. 5
Quayle, G., Diaz, H. F. (1979): Heating Degree Day Data Applied to Residential Heating En-ergy Consumption. In: Journal of Applied Meteorology, Vol. 19, p. 241–246.
Radgen, P. (2002): Market study for improving energy efficiency for fans, Stuttgart: Fraunhofer IRB Verl.

References
- 406 -
Radgen, P., Blaustein, E. (2001): Compressed air systems in the European Union, Stuttgart: LOG_X.
Radgen, P., Oberschmidt, J., Corry, W.T.W. (2007): EuP Lot 11: Fans for ventilation in non residential buildings, Karlsruhe.
Ragwitz, M., Resch, G. (2006): Economic analysis of reaching a 20% share of renewable en-ergy sources in 2020 - Annex 1 to the final report: Methodological aspects & database for the scenarios of RES deployment.
Ragwitz, M., Schade, W., Breitschopf, B., Walz, R., Helfrich, N., Rathmann, M., Resch, G., Panzer, C., Faber, T., Haas, R., Nathani, C., Holzhey, M., Konstantinaviciute, I., Zagamé, P., Fougeyrollas, A., Le Hir, B. (2009): EmployRES - The impact of renewable energy policy on economic growth and employment in the European Union. Final report of the EmployRES project on behalf of the European Commission DGTREN, Karlsruhe.
Reiter, U., Held, A., Turton H. (2009): Adaptation and mitigation options for the European energy conversion sector. To be submitted.
Rivière, A. et al. (2008): Preparatory study on the environmental performance of residential room conditioning appliances (airco and ventilation), Tasks 1 to 5. Draft reports as of July 2008.
Schade, W. (2005): Strategic Sustainability Analysis: Concept and application for the assess-ment of European Transport Policy. NOMOS-Verlag, ISBN 3-8329-1248-7, Baden-Baden.
Schade, W., Fiorello, D., Beckmann, R., Fermi, F., Köhler, J., Martino, A., Schade, B., Walz, R., Wiesenthal, T. (2008): High Oil Prices: Quantification of direct and indirect impacts for the EU. Deliverable 3 of HOP! (Macro-economic impact of high oil price in Europe). Funded by European Commission 6th RTD Programme. Karlsruhe, Milan, Italy.
Schelhaas, M. J., Eggers, J., Lindner, M., Nabuurs, G.J., Pussinen, A., Päivinen, R., Schuck, A., Verkerk, P.J., Van der Werf, D.C., Zudin S. (2007): Model documentation for the Euro-pean Forest Information Scenario model (EFISCEN 3.1.3). Alterra report
Sorrell, O’Malley, Schleich, Scott (2004): The economics of Energy Efficiency – Barriers to Cost-Effective Investment. Edward Elgar Publishing.
Staiß, F. (2007): Jahrbuch Erneuerbare Energien 2007, Radebeul: Bieberstein. -
Stankeviciute, L., Kitous, A., Criqui, P. (2008) : The fundamentals of the future international emissions trading system. Energy Policy, vol. 36 n° 11, pp. 4272-4286.

ADAM 2-degree scenario for Europe – policies and impacts
- 407 -
Struben, J., Sterman, J. D. (2008): Transition challenges for alternative fuel vehicle and trans-portation systems. In: Environment and Planning B: Planning and Design, Vol. 35, p. 1070-1097.
Sulzer Management, A.G.; (Winterthur) (1997): Sulzer-Kreiselpumpen-Handbuch, 4. Aufl, Essen: Vul-kan-Verl.
TNO Science and Industry (2006): "Review and analysis of the reduction potential and costs of technological and other measures to reduce CO2-emissions from passenger cars". Studie im Auftrag der Europäischen Kommission. Delft.
Train, K. E., Davis, W.B., Levine, M. D. (1997): Fees and rebates on new vehicles: impacts on fuel efficiency, carbon dioxide emissions, and consumer surplus. In: Transportation Re-search Part E, Vol. 33, p. 1–13.
Turrentine, T. S., Kurani, K. S. (2007): Car buyers and fuel economy? In: Energy Policy, Vol. 35, p. 1213–1223.
UN - United Nations (1992): United Nations Framework Convention on Climate Change. http://unfccc.int/resource/docs/convkp/conveng.pdf.
UN – United Nations (1998): Kyoto Protocol to the United Nations Framework Convention on Climate Change. http://unfccc.int/resource/docs/convkp/kpeng.pdf.
UNFPA - United Nations Population Fund (2008): State of world population 2008 - Reaching Common Ground: Culture, Gender and Human Rights.
Urge-Vorsatz, D., Metz, B. (2009): Energy efficiency: how far does it get us in controlling climate change? Energy Efficiency 2:87–94.
Van Tichelen, P., Jansen, B. et al. (2007): Preparatory Studies for Eco-design Requirements of EuPs – Final Report Lot 8: Office lighting. Mol, Belgium, April.
Weiss, G. (2000): Multiagent systems a modern approach to distributed artificial intelligence, Cambridge, Mass.: MIT Press. -
Wellig, B., Kegel, B. et al. (2006): Verdopplung der Jahresarbeitszahl von Klimakälteanlagen durch Ausnützung eines kleinen Temperaturhubs, Ernst Basler + Partner, Zürich, i.A. Forschungsprogramm UAW, Bundesamt für Energie, Bern.
Werner W., M. R. (2008): Processes Heat Collectors, State of the Art Within Task 33/IV. Gleisdorf: AEE INTEC.
Wooldridge, M.J. (2005): An introduction to multiagent systems: John Wiley & Sons, Chiches-ter, New York, Weinheim, Brisbane.

References
- 408 -
World energy technology outlook - 2050 - WETO-H2. Bruxelles (2007) : Commission euro-péenne ; Grenoble : LEPII-EPE, Enerdata, et al., 161 p. EUR 22038. Blanchard O., Criqui P., Kitous A., Mima S. (2006). Impact des politiques climatiques sur le prix du carbone et les marchés de l’énergie. Revue d’économie financière, n° 83, p. 91-113.
Yeh, S. (2007): An empirical analysis of the adoption of alternative fuel vehicles: The case of natural gas vehicles. In: Energy Policy, Vol. 35, p. 5865-5875.
Related Documents


