IJSRST173634 | 19 July 2017 | Accepted: 29 July 2017 | July-August-2017 [(3)6 : 147-154] © 2017 IJSRST | Volume 3 | Issue 6 | Print ISSN: 2395-6011 | Online ISSN: 2395-602X Themed Section: Science and Technology 147 Active Fault Analysis through Quantitative Assessment Method in Cikapundung Sub Watershed Nana Sulaksana 1 , Supriyadi 2 , Ismawan 3 , Pradnya Paramarta Raditya Rendra 4 , Murni Sulastri 5 1,2,3,4,5 Faculty of Geological Engineering, Padjadjaran University, Jalan Raya Bandung-Sumedang Km.21, Jatinangor, Indonesia ABSTRACT Cikapundung sub-watershed is one of the sub-watersheds at the upper of the Citarum River adjacent to an active regional fault, Lembang Fault. Active fault is a major factor in landform control in area that affected by tectonic activity. Therefore, an approach to identify tectonic activity in the research area through quantitative analysis (morphometry) is required. The morphometric analysis used to identify Index of active tectonics (IAT) uses four parameters, namely: Asymmetry factor (Af), Ratio of valley width and valley height (Vf), Basin shape index (Bs), and Mountain front sinuosity (Smf). Based on the parameters of Index of active tectonics (IAT), it can be concluded that 10 basins of the Cikapundung sub watershed has a class of low tectonic activity which may still be affected by the active Lembang fault. However, its existence should be noticed by the surrounding community and government, because the major earthquakes can occur anytime. In addition, the variation of Smf and Vf values caused by lithologic responses that are less resistant to weathering and erosion. Keywords: Active fault, IAT, Cikapundung sub-watershed I. INTRODUCTION Tectonic geomorphology is defined as the study of landforms produced by tectonic processes, or the application of geomorphic principles to the solution of tectonic problems (Keller & Pinter 1996). According to Keller and Pinter (1996 ) Active fault is a fault that has moved in the past 10,000 years. Soehaimi (2011) states that the active fault in West Java which is the source of the earthquake is the Cimandiri, Baribis, and Lembang active fault. Therefore it is important to analyze the tectonic's active level in the Cikapundung Sub-Basin which is most likely still affected by the Lembang fault. The approach used to identify tectonic activity with quantitative analysis (morphometry). The quantitative measurement of landform is based on the calculation of geomorphic indices using topographic maps, aerial photos, satellite images and field observation. Geomorphic indices are extremely useful for the study of drainage basins. The quantitative measurement of landform allows geomorphologists to calculate parameters, or geomorphic indices, which are useful in establishing the characteristics of an area (Baioni, 2007). The purpose of this study was to determine Index of active tectonics (IAT) with morfometric analysis in Cikapundung Sub-watershed. Geological Setting Geographically, the Cikapundung Sub- watershed located at 107° 35'40"-107° 44'40" East longitude and - 6 °46'00 "- 6 ° 53'20" South latitude with a research area of 103.1 km 2 . Administratively, the research area is a part of Lembang sub-district, West Bandung regency. Based on regional physiography, the research area is a part of the Bandung Zone. According to Silitonga (1973), the oldest lithology in regional research area is an undifferentiated old volcanic products (Qvu) consists of volcanic breccia, lahar, and lava repeatedly interlayered This rock unit occurs in the Pleistocene Age. Furthermore, rock unit in the research are follwed by an undifferentiated young volcanic products (Qyu) consist of sandy tuff (Qyd), lapili, breccia, lava, and agglomerate, and pumiceous tuff (Qyt). This unit is Holocene. After that, lithology in research area is followed by the colluvium (Qc) in Holocene age, where the collovium deposition is relatively older than the alluvium deposition.

Welcome message from author
This document is posted to help you gain knowledge. Please leave a comment to let me know what you think about it! Share it to your friends and learn new things together.
Transcript
IJSRST173634 | 19 July 2017 | Accepted: 29 July 2017 | July-August-2017 [(3)6 : 147-154]
© 2017 IJSRST | Volume 3 | Issue 6 | Print ISSN: 2395-6011 | Online ISSN: 2395-602X Themed Section: Science and Technology
147
Active Fault Analysis through Quantitative Assessment Method in
Cikapundung Sub Watershed Nana Sulaksana
1, Supriyadi
2, Ismawan
3, Pradnya Paramarta Raditya Rendra
4, Murni Sulastri
5
1,2,3,4,5Faculty of Geological Engineering, Padjadjaran University, Jalan Raya Bandung-Sumedang Km.21, Jatinangor,
Indonesia
ABSTRACT
Cikapundung sub-watershed is one of the sub-watersheds at the upper of the Citarum River adjacent to an active
regional fault, Lembang Fault. Active fault is a major factor in landform control in area that affected by tectonic
activity. Therefore, an approach to identify tectonic activity in the research area through quantitative analysis
(morphometry) is required. The morphometric analysis used to identify Index of active tectonics (IAT) uses four
parameters, namely: Asymmetry factor (Af), Ratio of valley width and valley height (Vf), Basin shape index (Bs),
and Mountain front sinuosity (Smf). Based on the parameters of Index of active tectonics (IAT), it can be concluded
that 10 basins of the Cikapundung sub watershed has a class of low tectonic activity which may still be affected by
the active Lembang fault. However, its existence should be noticed by the surrounding community and government,
because the major earthquakes can occur anytime. In addition, the variation of Smf and Vf values caused by
lithologic responses that are less resistant to weathering and erosion.
Keywords: Active fault, IAT, Cikapundung sub-watershed
I. INTRODUCTION
Tectonic geomorphology is defined as the study of
landforms produced by tectonic processes, or the
application of geomorphic principles to the solution of
tectonic problems (Keller & Pinter 1996). According to
Keller and Pinter (1996 ) Active fault is a fault that has
moved in the past 10,000 years. Soehaimi (2011) states
that the active fault in West Java which is the source of
the earthquake is the Cimandiri, Baribis, and Lembang
active fault. Therefore it is important to analyze the
tectonic's active level in the Cikapundung Sub-Basin
which is most likely still affected by the Lembang fault.
The approach used to identify tectonic activity with
quantitative analysis (morphometry).
The quantitative measurement of landform is based on
the calculation of geomorphic indices using topographic
maps, aerial photos, satellite images and field
observation. Geomorphic indices are extremely useful
for the study of drainage basins. The quantitative
measurement of landform allows geomorphologists to
calculate parameters, or geomorphic indices, which are
useful in establishing the characteristics of an area
(Baioni, 2007). The purpose of this study was to
determine Index of active tectonics (IAT) with
morfometric analysis in Cikapundung Sub-watershed.
Geological Setting
Geographically, the Cikapundung Sub- watershed
located at 107° 35'40"-107° 44'40" East longitude and -
6 °46'00 "- 6 ° 53'20" South latitude with a research area
of 103.1 km2. Administratively, the research area is a
part of Lembang sub-district, West Bandung regency.
Based on regional physiography, the research area is a
part of the Bandung Zone.
According to Silitonga (1973), the oldest lithology in
regional research area is an undifferentiated old volcanic
products (Qvu) consists of volcanic breccia, lahar, and
lava repeatedly interlayered This rock unit occurs in the
Pleistocene Age. Furthermore, rock unit in the research
are follwed by an undifferentiated young volcanic
products (Qyu) consist of sandy tuff (Qyd), lapili,
breccia, lava, and agglomerate, and pumiceous tuff (Qyt).
This unit is Holocene. After that, lithology in research
area is followed by the colluvium (Qc) in Holocene age,
where the collovium deposition is relatively older than
the alluvium deposition.
International Journal of Scientific Research in Science and Technology (www.ijsrst.com)
148
Figure 1. Geological Map Regional Research Scale 1:
200.000 (Based on Geological Map Scale 1: 100,000
Bandung By Silitonga, 1973)
II. METHODS AND MATERIAL
All data Used for calculation of morphometric
parameters, then the result of analysis is used to get
Index of Active Tectonics (IAT). The Several
indications of morphological appearance in the active
tectonic area can be studied using four morphometric
parameters, as follows:
Asymmetry factor (Af)
Ratio of valley width and valley height (Vf),
Basin Shape index (Bs)
Mountain front sinuosity (Smf)
The morphometric parameters Calculation include
watershed area, river length, elevation or altitude,
Mountain front sinuosity and long axis watershed. The
calculation uses Mapinfo and Microsoft Excel software.
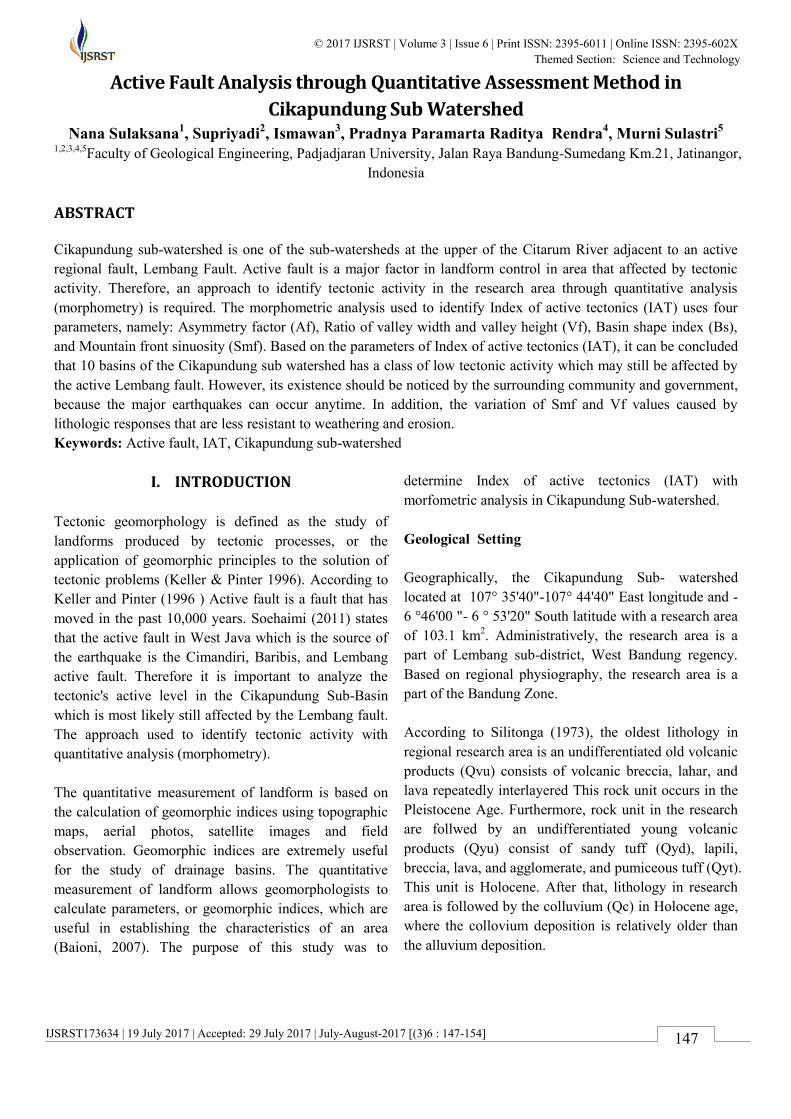
Asymmetry factor (Af)
Asymmetry factor index was developed to detect
tectonic tilting at drainage basin scale or larger scale
area (Hare & Gardner, 1985). This index is related to
two tectonic and non-tectonic factors, Non-tectonic
factors may be related to lithology and rock fabrics
(Ghanavati, et al., 2016).
The asymmetric factor can be used to evaluate tectonic
tilting at the scale of a drainage basin (Hare & Gardner,
1985; Keller & Pinter, 2002). The asymmetry factor is
sensitive to the direction of the asymmetry and in
drainage basins that display change of direction
throughout the river; the opposite directions will
compensate each other giving a lower value of Af. For
this reason, the asymmetry factor is useful mostly in
drainage basins where the asymmetry has the same
direction (Baioni, 2007). The method maybe applied
over a relatively large area (Hare & Gardner, 1985;
Keller & Pinter, 2002).
Figure 2. Illustration method of Asymmetric factor (AF)
according to Keller and Pinter (1996)
The index is defined as follows:
Af= (Ar/At) 100
Where Ar is the right side area of the basin of the master
stream (looking downstream) and At is total area of the
basin that can be measured by ArcGIS software
(Omidali et al., 2015).
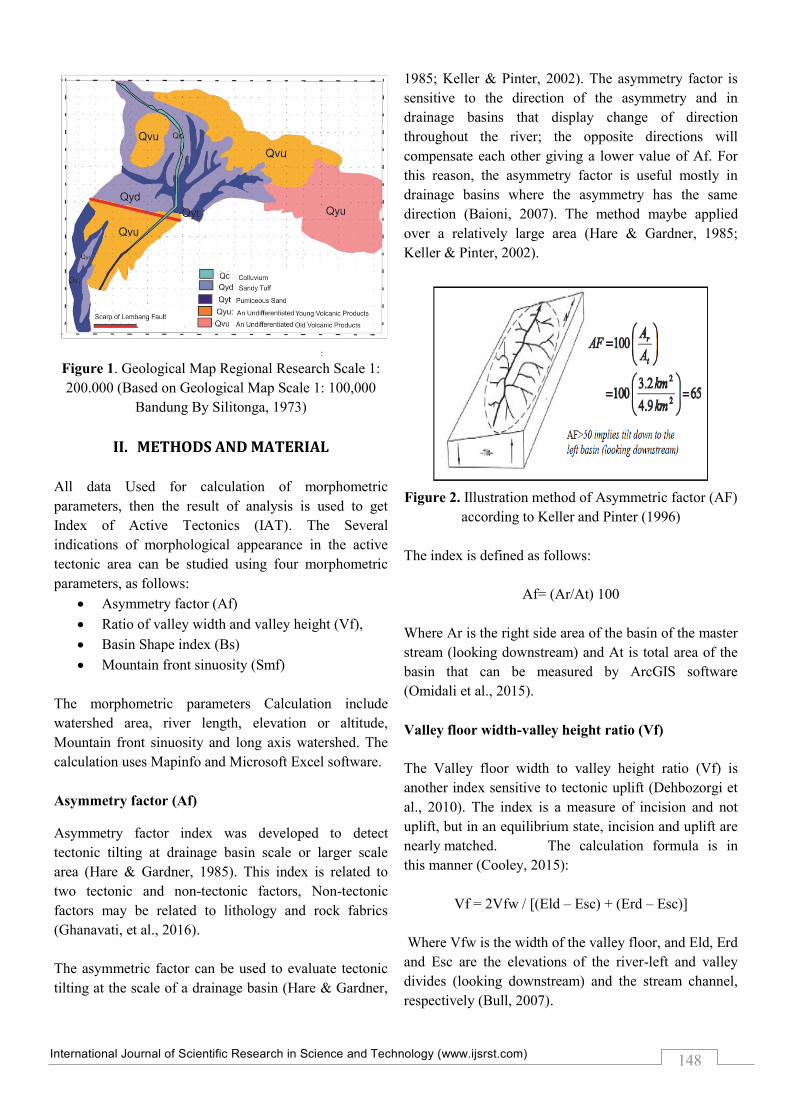
Valley floor width-valley height ratio (Vf)
The Valley floor width to valley height ratio (Vf) is
another index sensitive to tectonic uplift (Dehbozorgi et
al., 2010). The index is a measure of incision and not
uplift, but in an equilibrium state, incision and uplift are
nearly matched. The calculation formula is in
this manner (Cooley, 2015):
Vf = 2Vfw / [(Eld – Esc) + (Erd – Esc)]
Where Vfw is the width of the valley floor, and Eld, Erd
and Esc are the elevations of the river-left and valley
divides (looking downstream) and the stream channel,
respectively (Bull, 2007).
International Journal of Scientific Research in Science and Technology (www.ijsrst.com)
149
Figure 3. Illustration method of Valley floor width-
valley height ratio (Vf) according to Keller and Pinter
(1996)
Bull and McFadden (1977) found significant differences
in Vf between tectonically active and inactive mountain
fronts. Also, they found significant differences in Vf
between tectonically active and inactive mountain fronts,
because a valley floor is narrowed due to rapid stream
downcutting. Valleys upstream from the mountain front
tend to be narrow (Ramirez-Herrera, 1998), and Vf is
usually computed at a given distance upstream from the
mountain front (Silva et al., 2003).
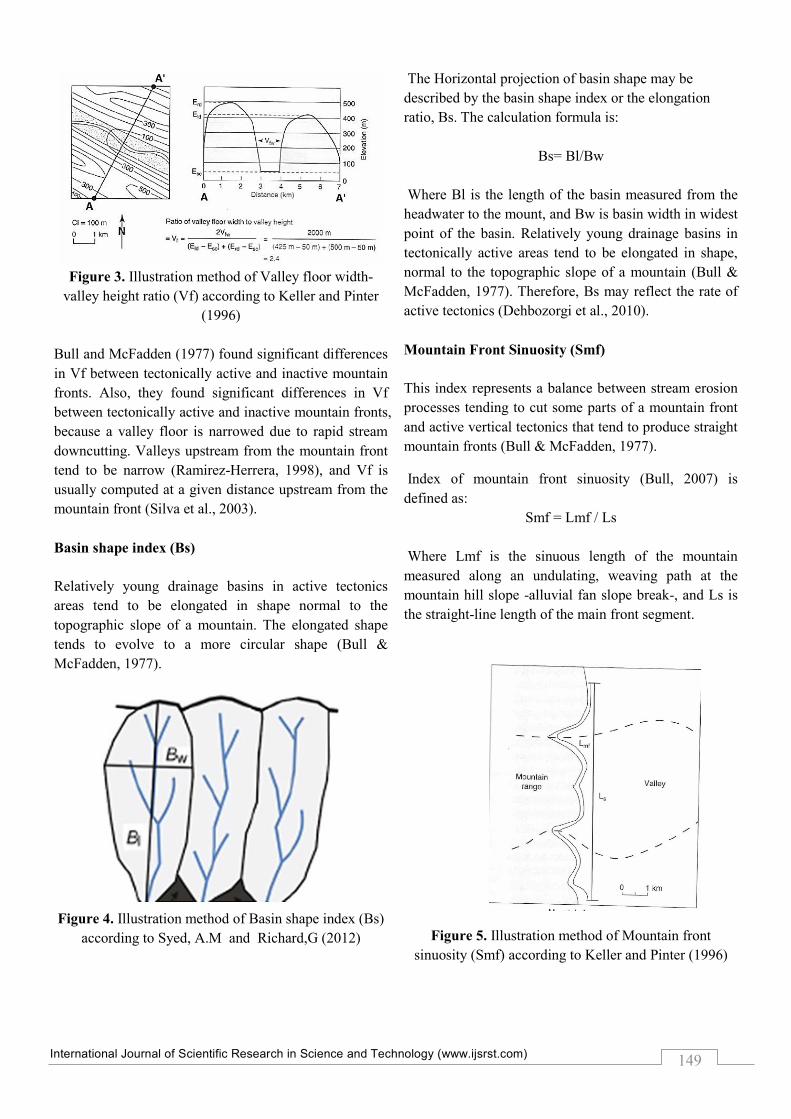
Basin shape index (Bs)
Relatively young drainage basins in active tectonics
areas tend to be elongated in shape normal to the
topographic slope of a mountain. The elongated shape
tends to evolve to a more circular shape (Bull &
McFadden, 1977).
Figure 4. Illustration method of Basin shape index (Bs)
according to Syed, A.M and Richard,G (2012)
The Horizontal projection of basin shape may be
described by the basin shape index or the elongation
ratio, Bs. The calculation formula is:
Bs= Bl/Bw
Where Bl is the length of the basin measured from the
headwater to the mount, and Bw is basin width in widest
point of the basin. Relatively young drainage basins in
tectonically active areas tend to be elongated in shape,
normal to the topographic slope of a mountain (Bull &
McFadden, 1977). Therefore, Bs may reflect the rate of
active tectonics (Dehbozorgi et al., 2010).
Mountain Front Sinuosity (Smf)
This index represents a balance between stream erosion
processes tending to cut some parts of a mountain front
and active vertical tectonics that tend to produce straight
mountain fronts (Bull & McFadden, 1977).
Index of mountain front sinuosity (Bull, 2007) is
defined as:
Smf = Lmf / Ls
Where Lmf is the sinuous length of the mountain
measured along an undulating, weaving path at the
mountain hill slope -alluvial fan slope break-, and Ls is
the straight-line length of the main front segment.
Figure 5. Illustration method of Mountain front
sinuosity (Smf) according to Keller and Pinter (1996)
International Journal of Scientific Research in Science and Technology (www.ijsrst.com)
150
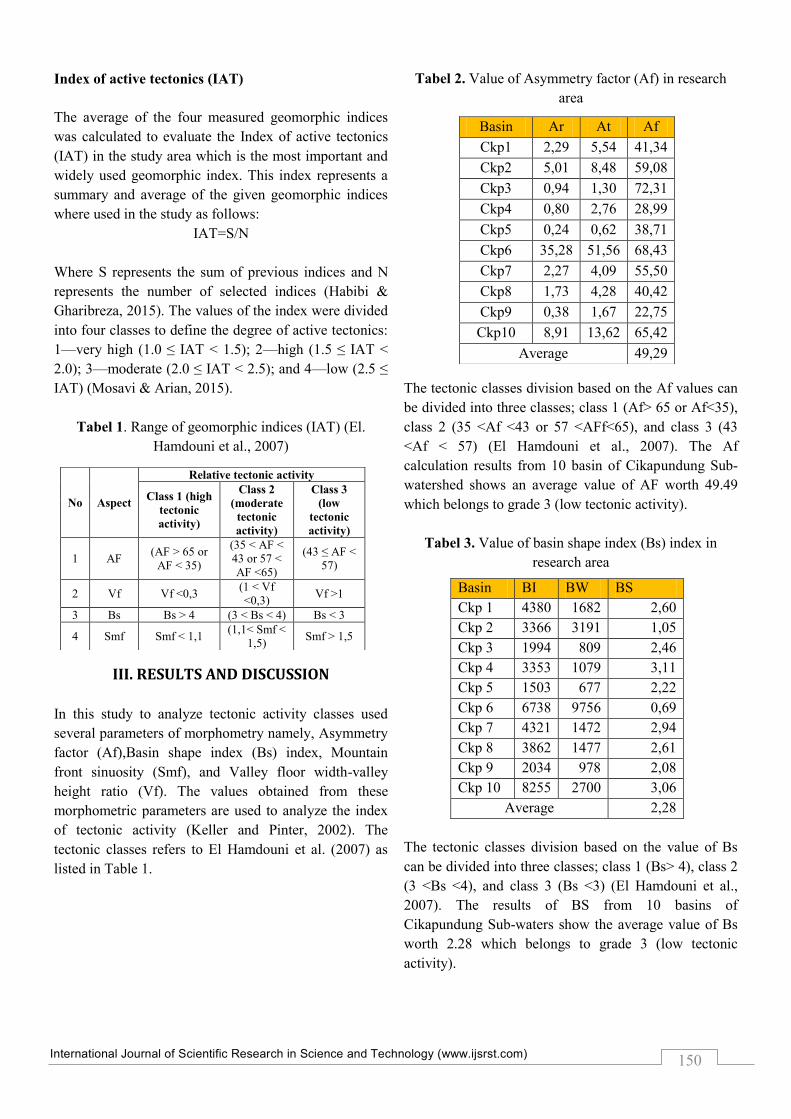
Index of active tectonics (IAT)
The average of the four measured geomorphic indices
was calculated to evaluate the Index of active tectonics
(IAT) in the study area which is the most important and
widely used geomorphic index. This index represents a
summary and average of the given geomorphic indices
where used in the study as follows:
IAT=S/N
Where S represents the sum of previous indices and N
represents the number of selected indices (Habibi &
Gharibreza, 2015). The values of the index were divided
into four classes to define the degree of active tectonics:
1—very high (1.0 ≤ IAT < 1.5); 2—high (1.5 ≤ IAT <
2.0); 3—moderate (2.0 ≤ IAT < 2.5); and 4—low (2.5 ≤
IAT) (Mosavi & Arian, 2015).
Tabel 1. Range of geomorphic indices (IAT) (El.
Hamdouni et al., 2007)
III. RESULTS AND DISCUSSION
In this study to analyze tectonic activity classes used
several parameters of morphometry namely, Asymmetry
factor (Af),Basin shape index (Bs) index, Mountain
front sinuosity (Smf), and Valley floor width-valley
height ratio (Vf). The values obtained from these
morphometric parameters are used to analyze the index
of tectonic activity (Keller and Pinter, 2002). The
tectonic classes refers to El Hamdouni et al. (2007) as
listed in Table 1.
Tabel 2. Value of Asymmetry factor (Af) in research
area
The tectonic classes division based on the Af values can
be divided into three classes; class 1 (Af> 65 or Af<35),
class 2 (35 <Af <43 or 57 <AFf<65), and class 3 (43
<Af < 57) (El Hamdouni et al., 2007). The Af
calculation results from 10 basin of Cikapundung Sub-
watershed shows an average value of AF worth 49.49
which belongs to grade 3 (low tectonic activity).
Tabel 3. Value of basin shape index (Bs) index in
research area
The tectonic classes division based on the value of Bs
can be divided into three classes; class 1 (Bs> 4), class 2
(3 <Bs <4), and class 3 (Bs <3) (El Hamdouni et al.,
2007). The results of BS from 10 basins of
Cikapundung Sub-waters show the average value of Bs
worth 2.28 which belongs to grade 3 (low tectonic
activity).
No Aspect
Relative tectonic activity
Class 1 (high
tectonic
activity)
Class 2
(moderate
tectonic
activity)
Class 3
(low
tectonic
activity)
1 AF (AF > 65 or
AF < 35)
(35 < AF <
43 or 57 <
AF <65)
(43 ≤ AF <
57)
2 Vf Vf <0,3 (1 < Vf
<0,3) Vf >1
3 Bs Bs > 4 (3 < Bs < 4) Bs < 3
4 Smf Smf < 1,1 (1,1< Smf <
1,5) Smf > 1,5
Basin Ar At Af
Ckp1 2,29 5,54 41,34
Ckp2 5,01 8,48 59,08
Ckp3 0,94 1,30 72,31
Ckp4 0,80 2,76 28,99
Ckp5 0,24 0,62 38,71
Ckp6 35,28 51,56 68,43
Ckp7 2,27 4,09 55,50
Ckp8 1,73 4,28 40,42
Ckp9 0,38 1,67 22,75
Ckp10 8,91 13,62 65,42
Average 49,29
Basin BI BW BS
Ckp 1 4380 1682 2,60
Ckp 2 3366 3191 1,05
Ckp 3 1994 809 2,46
Ckp 4 3353 1079 3,11
Ckp 5 1503 677 2,22
Ckp 6 6738 9756 0,69
Ckp 7 4321 1472 2,94
Ckp 8 3862 1477 2,61
Ckp 9 2034 978 2,08
Ckp 10 8255 2700 3,06
Average 2,28
International Journal of Scientific Research in Science and Technology (www.ijsrst.com)
151
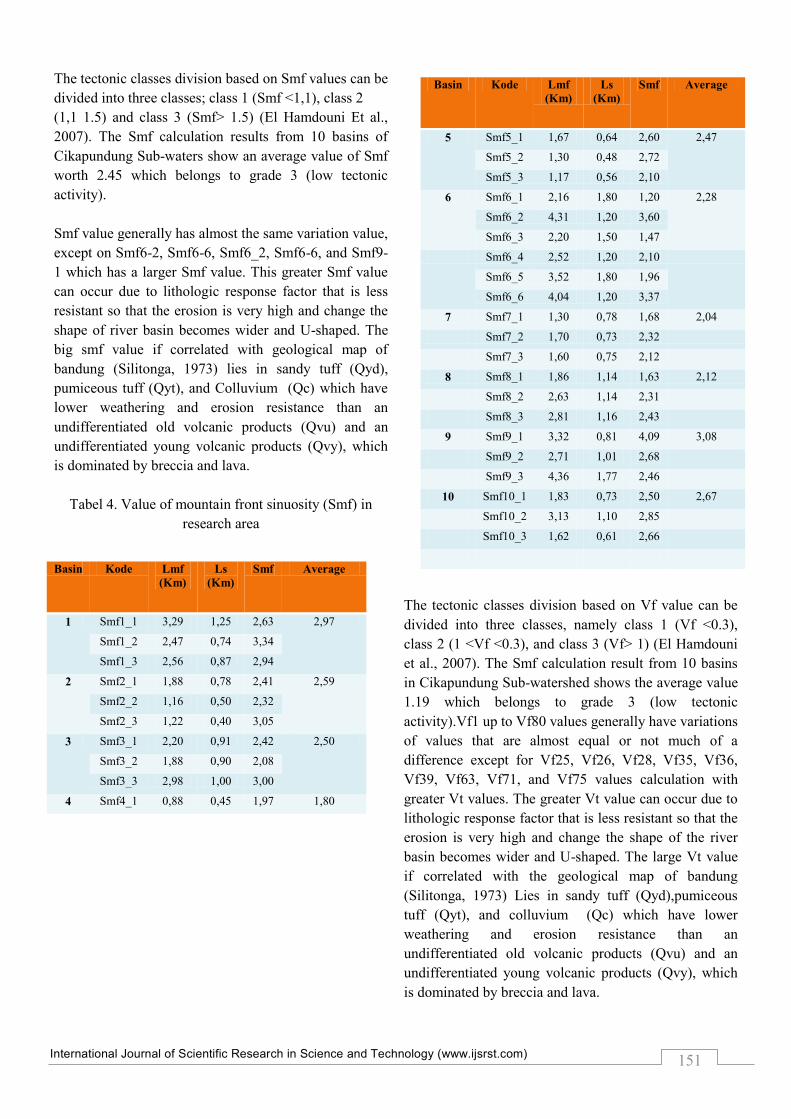
The tectonic classes division based on Smf values can be
divided into three classes; class 1 (Smf <1,1), class 2
(1,1 1.5) and class 3 (Smf> 1.5) (El Hamdouni Et al.,
2007). The Smf calculation results from 10 basins of
Cikapundung Sub-waters show an average value of Smf
worth 2.45 which belongs to grade 3 (low tectonic
activity).
Smf value generally has almost the same variation value,
except on Smf6-2, Smf6-6, Smf6_2, Smf6-6, and Smf9-
1 which has a larger Smf value. This greater Smf value
can occur due to lithologic response factor that is less
resistant so that the erosion is very high and change the
shape of river basin becomes wider and U-shaped. The
big smf value if correlated with geological map of
bandung (Silitonga, 1973) lies in sandy tuff (Qyd),
pumiceous tuff (Qyt), and Colluvium (Qc) which have
lower weathering and erosion resistance than an
undifferentiated old volcanic products (Qvu) and an
undifferentiated young volcanic products (Qvy), which
is dominated by breccia and lava.
Tabel 4. Value of mountain front sinuosity (Smf) in
research area
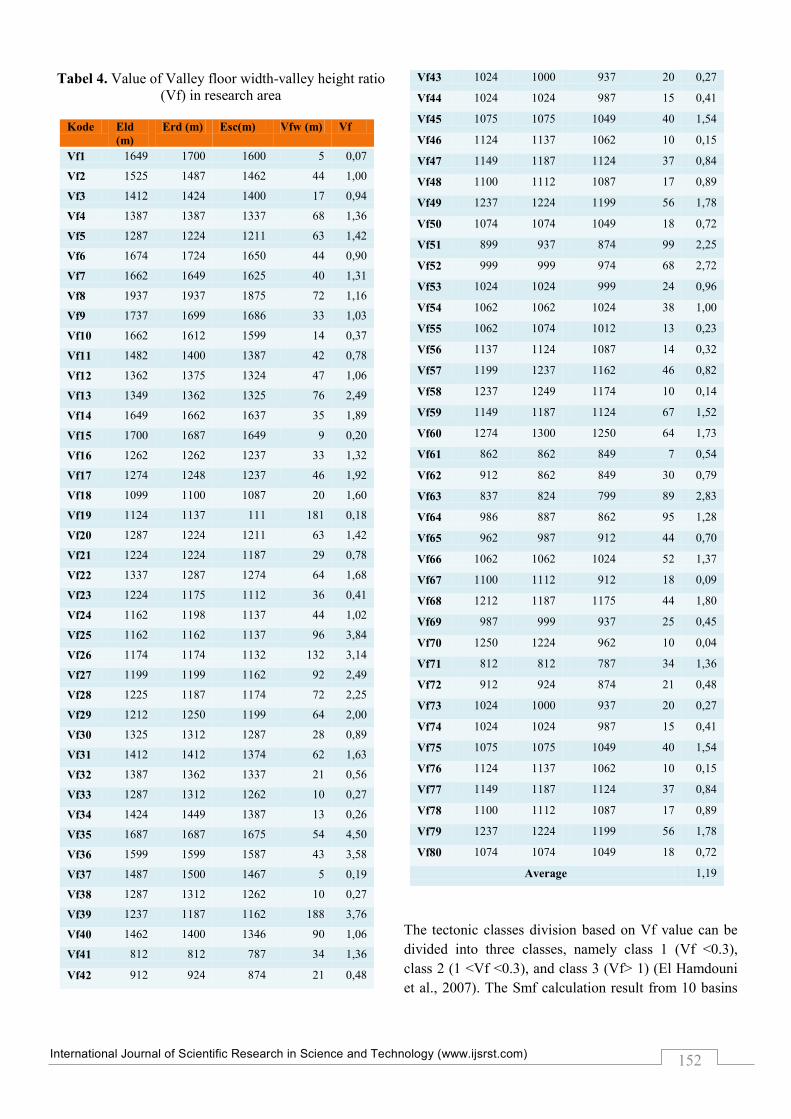
The tectonic classes division based on Vf value can be
divided into three classes, namely class 1 (Vf <0.3),
class 2 (1 <Vf <0.3), and class 3 (Vf> 1) (El Hamdouni
et al., 2007). The Smf calculation result from 10 basins
in Cikapundung Sub-watershed shows the average value
1.19 which belongs to grade 3 (low tectonic
activity).Vf1 up to Vf80 values generally have variations
of values that are almost equal or not much of a
difference except for Vf25, Vf26, Vf28, Vf35, Vf36,
Vf39, Vf63, Vf71, and Vf75 values calculation with
greater Vt values. The greater Vt value can occur due to
lithologic response factor that is less resistant so that the
erosion is very high and change the shape of the river
basin becomes wider and U-shaped. The large Vt value
if correlated with the geological map of bandung
(Silitonga, 1973) Lies in sandy tuff (Qyd),pumiceous
tuff (Qyt), and colluvium (Qc) which have lower
weathering and erosion resistance than an
undifferentiated old volcanic products (Qvu) and an
undifferentiated young volcanic products (Qvy), which
is dominated by breccia and lava.
Basin Kode Lmf
(Km)
Ls
(Km)
Smf Average
1 Smf1_1 3,29 1,25 2,63 2,97
Smf1_2 2,47 0,74 3,34
Smf1_3 2,56 0,87 2,94
2 Smf2_1 1,88 0,78 2,41 2,59
Smf2_2 1,16 0,50 2,32
Smf2_3 1,22 0,40 3,05
3 Smf3_1 2,20 0,91 2,42 2,50
Smf3_2 1,88 0,90 2,08
Smf3_3 2,98 1,00 3,00
4 Smf4_1 0,88 0,45 1,97 1,80
Basin Kode Lmf
(Km)
Ls
(Km)
Smf Average
5 Smf5_1 1,67 0,64 2,60 2,47
Smf5_2 1,30 0,48 2,72
Smf5_3 1,17 0,56 2,10
6 Smf6_1 2,16 1,80 1,20 2,28
Smf6_2 4,31 1,20 3,60
Smf6_3 2,20 1,50 1,47
Smf6_4 2,52 1,20 2,10
Smf6_5 3,52 1,80 1,96
Smf6_6 4,04 1,20 3,37
7 Smf7_1 1,30 0,78 1,68 2,04
Smf7_2 1,70 0,73 2,32
Smf7_3 1,60 0,75 2,12
8 Smf8_1 1,86 1,14 1,63 2,12
Smf8_2 2,63 1,14 2,31
Smf8_3 2,81 1,16 2,43
9 Smf9_1 3,32 0,81 4,09 3,08
Smf9_2 2,71 1,01 2,68
Smf9_3 4,36 1,77 2,46
10 Smf10_1 1,83 0,73 2,50 2,67
Smf10_2 3,13 1,10 2,85
Smf10_3 1,62 0,61 2,66
International Journal of Scientific Research in Science and Technology (www.ijsrst.com)
152
Tabel 4. Value of Valley floor width-valley height ratio
(Vf) in research area
Kode Eld
(m)
Erd (m) Esc(m) Vfw (m) Vf
Vf1 1649 1700 1600 5 0,07
Vf2 1525 1487 1462 44 1,00
Vf3 1412 1424 1400 17 0,94
Vf4 1387 1387 1337 68 1,36
Vf5 1287 1224 1211 63 1,42
Vf6 1674 1724 1650 44 0,90
Vf7 1662 1649 1625 40 1,31
Vf8 1937 1937 1875 72 1,16
Vf9 1737 1699 1686 33 1,03
Vf10 1662 1612 1599 14 0,37
Vf11 1482 1400 1387 42 0,78
Vf12 1362 1375 1324 47 1,06
Vf13 1349 1362 1325 76 2,49
Vf14 1649 1662 1637 35 1,89
Vf15 1700 1687 1649 9 0,20
Vf16 1262 1262 1237 33 1,32
Vf17 1274 1248 1237 46 1,92
Vf18 1099 1100 1087 20 1,60
Vf19 1124 1137 111 181 0,18
Vf20 1287 1224 1211 63 1,42
Vf21 1224 1224 1187 29 0,78
Vf22 1337 1287 1274 64 1,68
Vf23 1224 1175 1112 36 0,41
Vf24 1162 1198 1137 44 1,02
Vf25 1162 1162 1137 96 3,84
Vf26 1174 1174 1132 132 3,14
Vf27 1199 1199 1162 92 2,49
Vf28 1225 1187 1174 72 2,25
Vf29 1212 1250 1199 64 2,00
Vf30 1325 1312 1287 28 0,89
Vf31 1412 1412 1374 62 1,63
Vf32 1387 1362 1337 21 0,56
Vf33 1287 1312 1262 10 0,27
Vf34 1424 1449 1387 13 0,26
Vf35 1687 1687 1675 54 4,50
Vf36 1599 1599 1587 43 3,58
Vf37 1487 1500 1467 5 0,19
Vf38 1287 1312 1262 10 0,27
Vf39 1237 1187 1162 188 3,76
Vf40 1462 1400 1346 90 1,06
Vf41 812 812 787 34 1,36
Vf42 912 924 874 21 0,48
Vf43 1024 1000 937 20 0,27
Vf44 1024 1024 987 15 0,41
Vf45 1075 1075 1049 40 1,54
Vf46 1124 1137 1062 10 0,15
Vf47 1149 1187 1124 37 0,84
Vf48 1100 1112 1087 17 0,89
Vf49 1237 1224 1199 56 1,78
Vf50 1074 1074 1049 18 0,72
Vf51 899 937 874 99 2,25
Vf52 999 999 974 68 2,72
Vf53 1024 1024 999 24 0,96
Vf54 1062 1062 1024 38 1,00
Vf55 1062 1074 1012 13 0,23
Vf56 1137 1124 1087 14 0,32
Vf57 1199 1237 1162 46 0,82
Vf58 1237 1249 1174 10 0,14
Vf59 1149 1187 1124 67 1,52
Vf60 1274 1300 1250 64 1,73
Vf61 862 862 849 7 0,54
Vf62 912 862 849 30 0,79
Vf63 837 824 799 89 2,83
Vf64 986 887 862 95 1,28
Vf65 962 987 912 44 0,70
Vf66 1062 1062 1024 52 1,37
Vf67 1100 1112 912 18 0,09
Vf68 1212 1187 1175 44 1,80
Vf69 987 999 937 25 0,45
Vf70 1250 1224 962 10 0,04
Vf71 812 812 787 34 1,36
Vf72 912 924 874 21 0,48
Vf73 1024 1000 937 20 0,27
Vf74 1024 1024 987 15 0,41
Vf75 1075 1075 1049 40 1,54
Vf76 1124 1137 1062 10 0,15
Vf77 1149 1187 1124 37 0,84
Vf78 1100 1112 1087 17 0,89
Vf79 1237 1224 1199 56 1,78
Vf80 1074 1074 1049 18 0,72
Average 1,19
The tectonic classes division based on Vf value can be
divided into three classes, namely class 1 (Vf <0.3),
class 2 (1 <Vf <0.3), and class 3 (Vf> 1) (El Hamdouni
et al., 2007). The Smf calculation result from 10 basins
International Journal of Scientific Research in Science and Technology (www.ijsrst.com)
153
in Cikapundung Sub-watershed shows the average value
1.19 which belongs to grade 3 (low tectonic
activity).Vf1 up to Vf80 values generally have variations
of values that are almost equal or not much of a
difference except for Vf25, Vf26, Vf28, Vf35, Vf36,
Vf39, Vf63, Vf71, and Vf75 values calculation with
greater Vt values. The greater Vt value can occur due to
lithologic response factor that is less resistant so that the
erosion is very high and change the shape of the river
basin becomes wider and U-shaped. The large Vt value
if correlated with the geological map of bandung
(Silitonga, 1973) Lies in sandy tuff (Qyd), pumiceous
tuff (Qyt), and colluvium (Qc) which have lower
weathering and erosion resistance than an
undifferentiated old volcanic products (Qvu) and an
undifferentiated young volcanic products (Qvy), which
is dominated by breccia and lava.
IV. CONCLUSION
It seems that the calculated geomorphic indices by using
GIS are suitable for assessment of the tectonic activity in
the study area. The geomorphic indices such as
Asymmetry factor (AF), Ratio of valley width and
valley height (Vf), Basin shape index (Bs), and
Mountain front sinuosity (Smf) are calculated 10 basins
of the Cikapundung Sub watershed. Based on the
morphometric analysis, Index of active tectonics (IAT)
in research area includes a low tectonic class (class 3).
Whereas the larger Smf and Vf calculations may
indicate a lower rock resistance effect on the erosion and
weathering process to form a U-shaped basin.
V. REFERENCES
[1]. Baioni, D. (2007). Drainage basin asymmetry and
erosion processes relationship through a new
representation of two geomorphic indices in the
Conca river (northern Apennines). Ital J Geosci,
126(3): 573-579.
[2]. Bull, W.B., McFadden, L.D. (1997). Tectonic
geomorphology north and south of the Garlock
fault, California, In: Doehring. D.C. (Ed.),
Geomorphology in Arid Regions, Proceeding 8th
Annual Geomorphology Symposium, State
University of New York, Binghamton, NY: 115-
137.
[3]. Bull, W., B. (2007). Tectonic geomorphology of
mountains: a new approach to paleoseismology.
Blackwell, Malden.
[4]. Dehbozorgi, M., Pourkermani, M., Arian, M.,
Matkan, A., Motamedi, H., Hosseiniasl, A. (2010).
Quantitative analysis of relative tectonic activity
in the Sarvestan area, central Zagros, Iran.
Geomorphology, 21(3-4): 329-341.
doi:10.1016/j.geomorph.2010.05.002.
[5]. El. Hamdouni, R., Irigaray, C., Fernandez, T.,
Chacón, J., Keller, E. (2007). Assessment of
relative active tectonics, southwest border of
Sierra Nevada (southern Spain). Geomorphology
96: 150–173.
[6]. Ghanavati, et al., (2016) Quantitative assessment
of relative tectonic activity in the Alamarvdasht
river basin, south of Iran. Natural Environment
Change, Vol. 2, No. 2, Summer & Autumn 2016,
pp. 99- 110
[7]. Hare, P.W., Gardner, T.W. (1985). Geomorphic
indicators of vertical neotectonism along
converging plate margins, Nicoya Peninsula,
Costa Rica. In: Morisawa M, Hack JT (Eds.)
Tectonic Geomorphology. Proceedings of the 15th
Annual Binghamton Geomorphology Symposium.
Allen and Unwin, Boston,123-134.
[8]. Keller, E.A., Pinter, N. (2002). Active Tectonics:
Earthquakes, Uplift, and Landscape (2nd Ed.).
Prentice Hall, New Jersey.
[9]. Keller, E.A., Pinter, N. (1996). Active Tectonics:
Earthquakes, Uplift, and Landscape. Prentice Hall,
New Jersey.
[10]. Mosavi, E.J., Arian, M., Ghorshi, M., Nazemi, M.
(2015). Neotectonics of Tabas Area, Central Iran
by Index of Active Tectonics (IAT). Open Journal
of Geology, 5: 209-223.
[11]. Omidali, M., Arian, M., Sorbi, A. (2015).
Neotectonics of Boroujerd Area, SW Iran by
Index of Active Tectonics. Open Journal of
Geology, 5: 309-324.
[12]. Soehaemi, A,2011. Seismotektonik Jawa Barat
dan mikrozonasi potensi bencana gempa bumi
DKI Jakarta. Pusat Survei Geologi. Badan
Geologi. Bandung.
[13]. Silitonga. 1973. Peta Lembar Geologi Skala 1
:100000 Lembar Bandung. Pusat Penelitian dan
Pengembangan Geologi : Bandung
[14]. Silva, P.G., Goy, J.L., Zazo, C., Bardají, T., 2003.
Fault-generated mountain fronts in southeast
Spain: geomorphologic assessment of tectonic and
seismic activity. Geomorphology 50, 203–225.
[15]. Syed, A.M and Richard,G (2012). Appraisal of
active tectonics in Hindu Kush: Insights from
DEM derived geomorphic indices and drainage
analysis. Geoscience Frontiers 3(4) (2012)
407e428

International Journal of Scientific Research in Science and Technology (www.ijsrst.com)
154
Author Profile
Nana Sulaksana received the Undergraduate
of Geological Engineering, Padjadjaran
University in 1973, Master degree in 1988
from Planology Department -Institute of
Technology Bandung, and Doctor Degree in
2011 from Postgraduate Program of Geological Engineering-
Padjadjaran University. Now, he is a senior lecturer in
Faculty of Geological Engineering, Padjadjaran University.
Interest research: geomorphology, remote sensing,
volcanology, landuse planning, and mitigation of geohazard.
Supriyadi is Student in Faculty of Geological
Engineering, Padjadjaran University. Now, he is
a lecturer assistant in Laboratory of
Paleontology, Faculty of Geological
Engineering, Padjadjaran University. Interest
research: geomorphology, remote sensing, geohazard,
Geochemistry of petroleum.
Ismawan, Pekalongan, 20 September 1959,
received the Undergraduate of Geological
Engineering, Padjadjaran University in 1990
and Master degree of Geological Engineering,
Padjadjaran University in 2013. Now, he is a
senior lecturer in Faculty of Geological Engineering,
Padjadjaran University. Interest research: stuctural
geology,and tectonic.
Pradnya Paramarta Raditya Rendra received
the Bachelor of Engineering in Faculty of
Geological Engineering, Padjadjaran University
in 2012 and Master degree of Geological
Engineering, Padjadjaran University in 2017.
Now, he is a lecturer in Laboratory of Geomorphology and
Remote Sensing, Faculty of Geological Engineering,
Padjadjaran University. Interest research: geomorphology,
remote sensing, geohazard.
Murni Sulastri received the Undergraduate
and Postgraduate in Geological Engineering,
Padjadjaran University Padjadjaran University
in 2014 and Master degree of Geological
Engineering, Padjadjaran University in
2017.Now, she is a lecturer in Laboratory of Geomorphology
and Remote Sensing, Faculty of Geological Engineering,
Padjadjaran University. Interest research: geomorphology,
remote sensing, geohazard.
Related Documents