ACS Cancer Screening Update Georgia Chapter of the American College of Physicians Pine Mountain, GA October 26, 2014 Robert A. Smith, PhD American Cancer Society

Welcome message from author
This document is posted to help you gain knowledge. Please leave a comment to let me know what you think about it! Share it to your friends and learn new things together.
Transcript
ACS Cancer Screening Update
Georgia Chapter of the American College of Physicians
Pine Mountain, GA October 26, 2014
Robert A. Smith, PhD
American Cancer Society

Disclosures
• No financial disclosures or conflicts of interest to declare

Cancer Screening—A Sampling of Current Issues
• Cancer in Georgia…how does GA compare with the rest of the U.S.?
• ACS and USPSTF Guidelines—What are they, how do they differ, and why do they differ?
• What is the underlying evidence supporting the current recommendations?
• What factors influence screening in the population?
• What’s on the horizon?

Female Breast Cancer, Colorectal Cancer, Lung Cancer and Prostate Cancer Incidence, Georgia, 2011
Breast Cancer Colorectal Cancer
Lung Cancer Prostate Cancer
21st 19th
19th 10th

Female Breast Cancer, Colorectal Cancer, Lung Cancer and Prostate Cancer Mortality, Georgia, 2011
Breast Cancer Colorectal Cancer
Lung Cancer Prostate Cancer
21st
16th
6th
16th
ACS/USPSTF Cancer Screening Guidelines for Average Risk Adults—Breast, Colorectal,
Prostate & Lung
Breast Cancer Screening

Breast Cancer Screening in Average Risk Women: ACS (2003); USPSTF (2009)
Recommendation ACS USPSTF
Breast Self Exam
(BSE)
Not recommended
Against clinicians teaching
BSE (D)
Clinical Breast
Exam (CBE)
Ages 20-39: Every 3 yrs.
Ages 40+: Annual
Insufficient evidence (I)
Mammography Ages 40+: Annual
End screening when
curative therapy would
not be offered due to life-
limiting co-morbidity
Against routine screening in
women ages 40-49 (C)
Ages 50-74: Biennial (B)
Ages 75+ : Routine screening
not recommended (C)
Ages 85+ Not recommended
(D)
Updates expected from ACS and USPSTF in 2015

The USPSTF argument against screening women in their 40s
• Risk of developing and dying from breast cancer during the decade of the 40s is low
• While the reduced risk of dying from breast cancer associated with screening in women ages 40-49 is similar to women ages 50-59, the absolute benefit is lower
• The risk of harms (false positives, etc.) is high
• Thus, the balance of benefits and harms indicates a recommendation against routine screening (C rating)

Premature mortality and incidence based mortality from breast cancer, U.S Women
• Percent of deaths from breast cancer by age at diagnosis, U.S., 2005-2006 – < 40 7.7% – 40-49 17.8% – 50-59 22.3% – 60-69 19.0% – 70-79 18.8% – 80+ 14.5%
Source: SEER Cancer Statistics Review,1975-2006.

The Evolving Evidence for Breast Cancer
Screening—Benefits & Harms
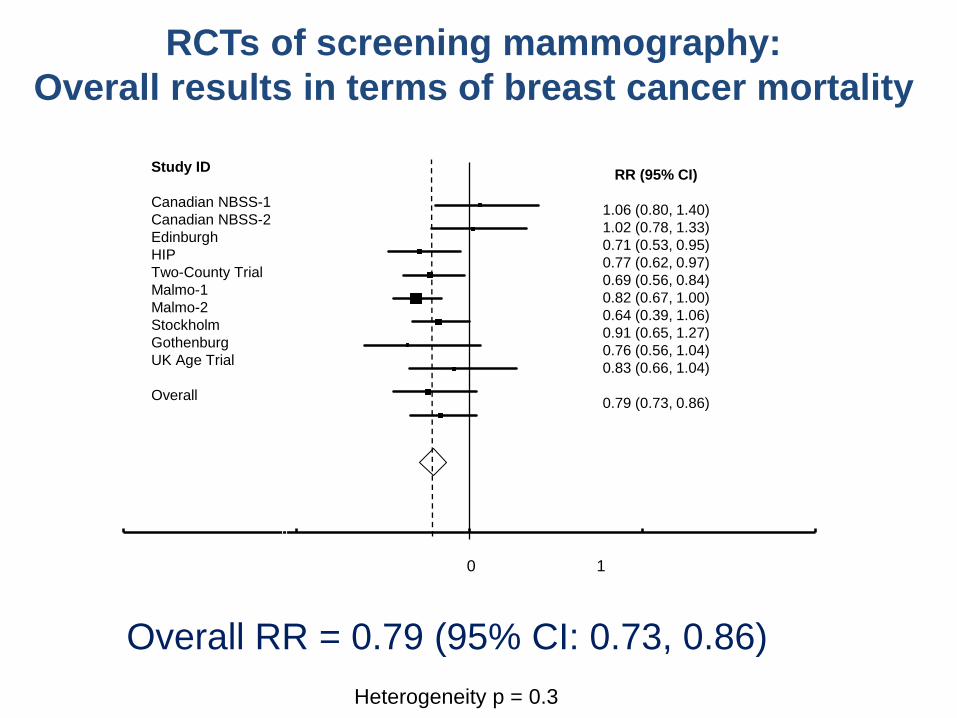
RCTs of screening mammography:
Overall results in terms of breast cancer mortality
Overall RR = 0.79 (95% CI: 0.73, 0.86)
Heterogeneity p = 0.3
0
2
4
6
8
10
12
14
16
-1.0 0.0 1.0 2.0 3.0
0 1
Study ID
Canadian NBSS-1
Canadian NBSS-2
Edinburgh
HIP
Two-County Trial
Malmo-1
Malmo-2
Stockholm
Gothenburg
UK Age Trial
Overall
RR (95% CI)
1.06 (0.80, 1.40)
1.02 (0.78, 1.33)
0.71 (0.53, 0.95)
0.77 (0.62, 0.97)
0.69 (0.56, 0.84)
0.82 (0.67, 1.00)
0.64 (0.39, 1.06)
0.91 (0.65, 1.27)
0.76 (0.56, 1.04)
0.83 (0.66, 1.04)
0.79 (0.73, 0.86)

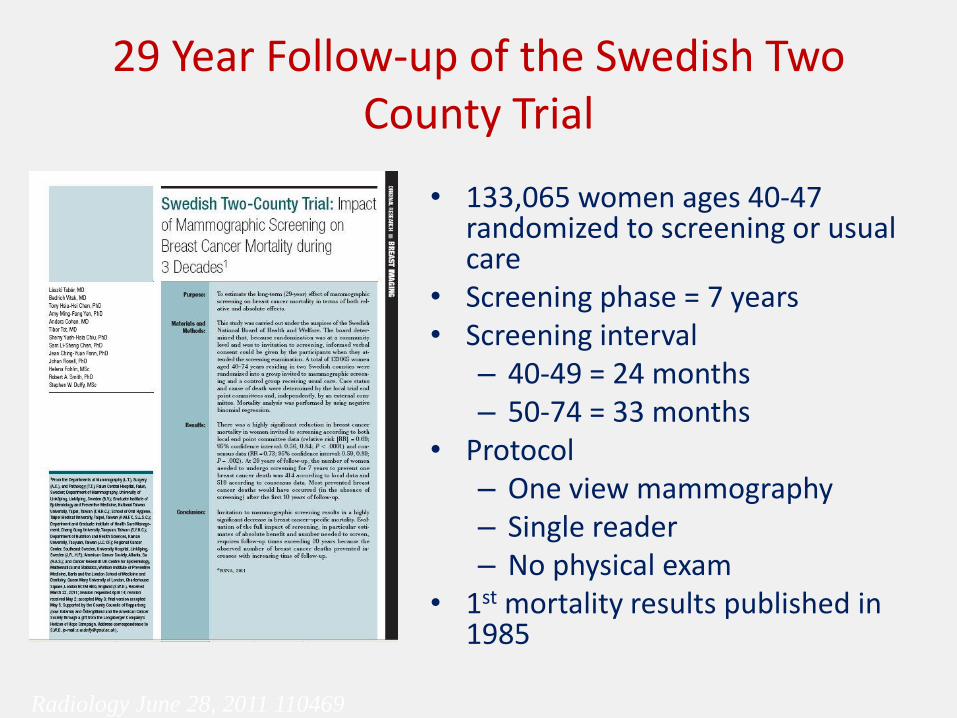
29 Year Follow-up of the Swedish Two County Trial
• 133,065 women ages 40-47 randomized to screening or usual care
• Screening phase = 7 years • Screening interval
– 40-49 = 24 months – 50-74 = 33 months
• Protocol – One view mammography – Single reader – No physical exam
• 1st mortality results published in 1985
Radiology June 28, 2011 110469

• Two important points:
– Long term follow-up is necessary to measure the full benefit of breast cancer screening
– With long follow-up, the number-needed-to-screen to save one life steadily improves
Radiology June 28, 2011 110469
31% fewer deaths After 29 years
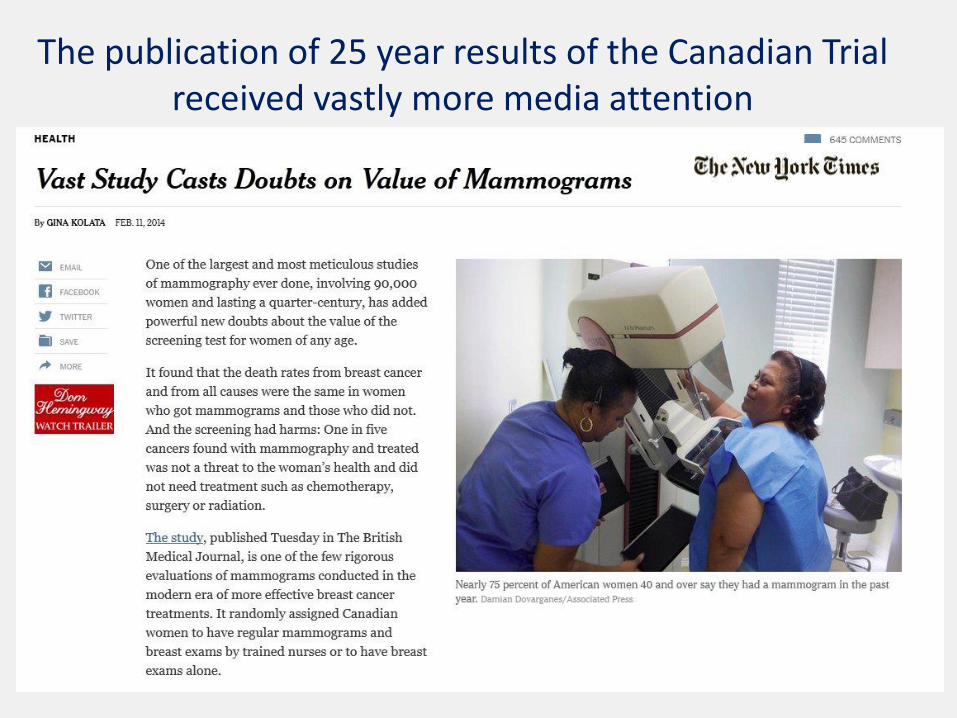
The publication of 25 year results of the Canadian Trial received vastly more media attention

25 Year Follow-up of the Canadian NBSS 1 & 2 Trials
• 89,835 volunteer women ages 40-59 were provided with a physical exam, including clinical breast exam and instruction in BSE, and then randomized (unblinded) to: – 40-49: Annual mammography and
CBE vs. usual care – 50-59: Annual mammography + CBE
vs. annual CBE only
• Protocol: 15 screening centers – 4 screening rounds – Two view mammography – Single reader
• 1st mortality results published in 1992
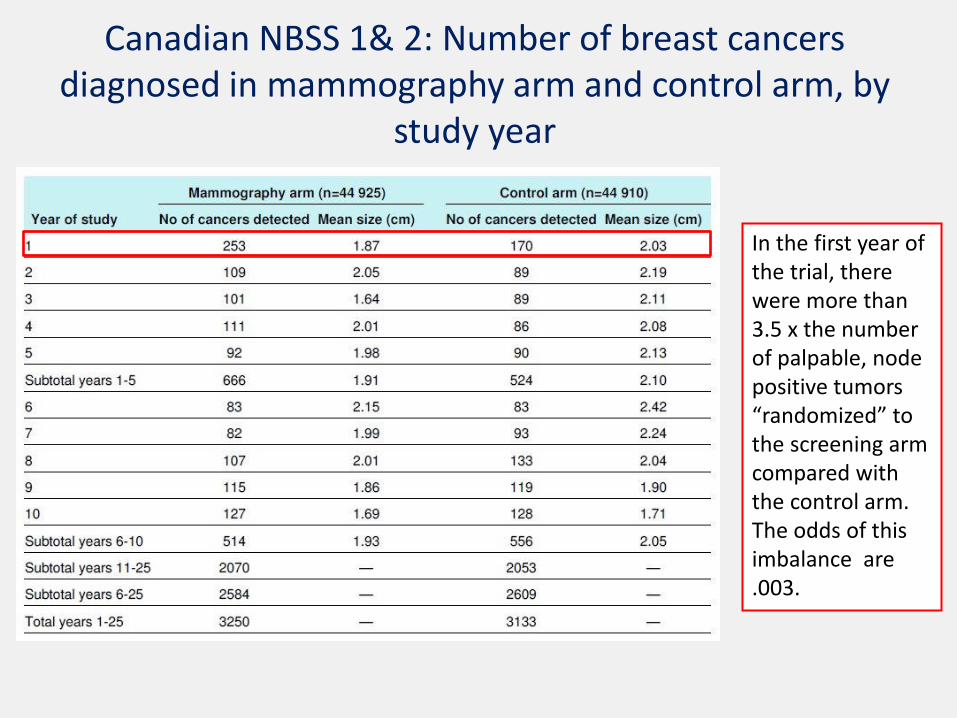
Canadian NBSS 1& 2: Number of breast cancers diagnosed in mammography arm and control arm, by
study year
In the first year of the trial, there were more than 3.5 x the number of palpable, node positive tumors “randomized” to the screening arm compared with the control arm. The odds of this imbalance are .003.

Canadian NBSS 1& 2: Overdiagnosis in the Mammography Arm
Overdiagnosis was measured at 15 years of follow-up, and estimated to be 22% However, at 25 years of follow-up, the difference in the 2 arms is a non-significant 3.7%
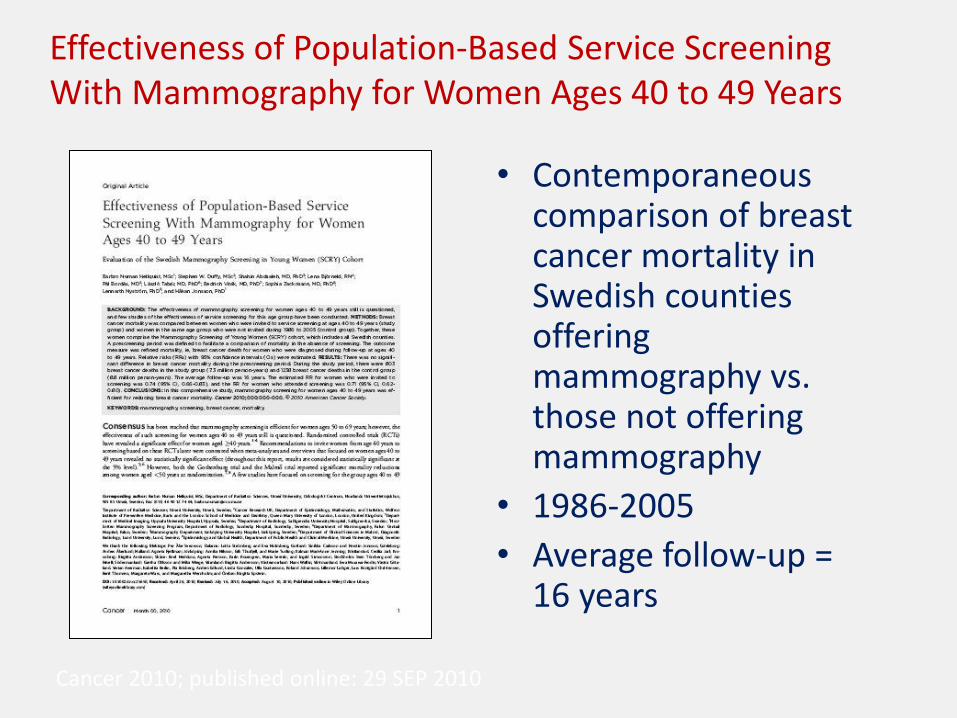
Effectiveness of Population-Based Service Screening With Mammography for Women Ages 40 to 49 Years
• Contemporaneous comparison of breast cancer mortality in Swedish counties offering mammography vs. those not offering mammography
• 1986-2005
• Average follow-up = 16 years
Cancer 2010; published online: 29 SEP 2010

Effectiveness of Population-Based Service Screening With Mammography for Women Ages
40 to 49 Years
• No difference in breast cancer mortality in the counties prior to the introduction of screening
• During the study period
– 803 breast cancer deaths in the study group (7.3 million person-years)
– 1238 breast cancer deaths in the control group (8.8 million person-years).
Cancer 2010; published online: 29 SEP 2010
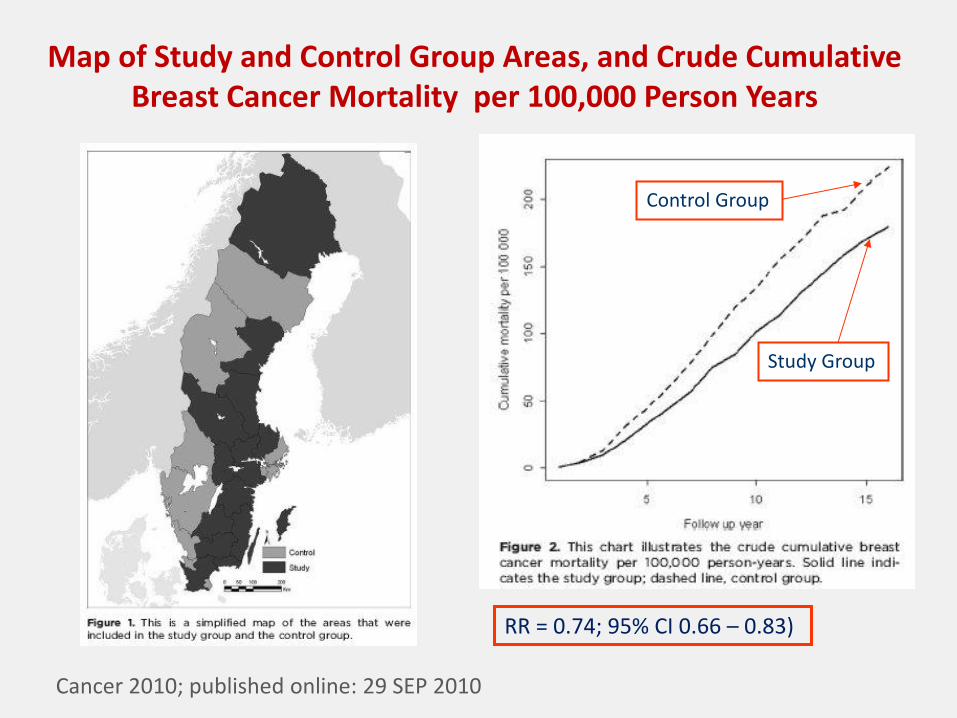
Map of Study and Control Group Areas, and Crude Cumulative Breast Cancer Mortality per 100,000 Person Years
Cancer 2010; published online: 29 SEP 2010
RR = 0.74; 95% CI 0.66 – 0.83)
Control Group
Study Group

Relative and absolute reduction in mortality
• Most overviews/meta-analyses of the trials find an approximate 20% relative reduction in breast cancer mortality associated with an invitation to screening – The Nordic Cochrane Institute’s estimate of 19% was
downgraded to 15% based on opinion.
• The “controversial” issue is the estimate of the absolute reduction in the risk of dying of breast cancer

Number Needed to Screen (NNS) vs. Number Needed to Invite (NNI) to Avoid One Breast Cancer Death
Age Group Swedish data
(NNS)1
USPSTF
(NNI)2
Overall 464 1224
40-49 726 1,904
50-59 260 1,339
60-69 198 377
1 Number Needed to Screen (NNS) Every 2 Years (40-49—18 mos.) for a Period
of Ten Years, with 20 Years of Follow-up, to Save One Life.
2 Number Needed to Invite (NNI), estimated from randomized trial data with
variable screening intervals, variable screening rounds, different rates of
adherence and non-compliance, and variable periods of follow-up (14 yrs.)
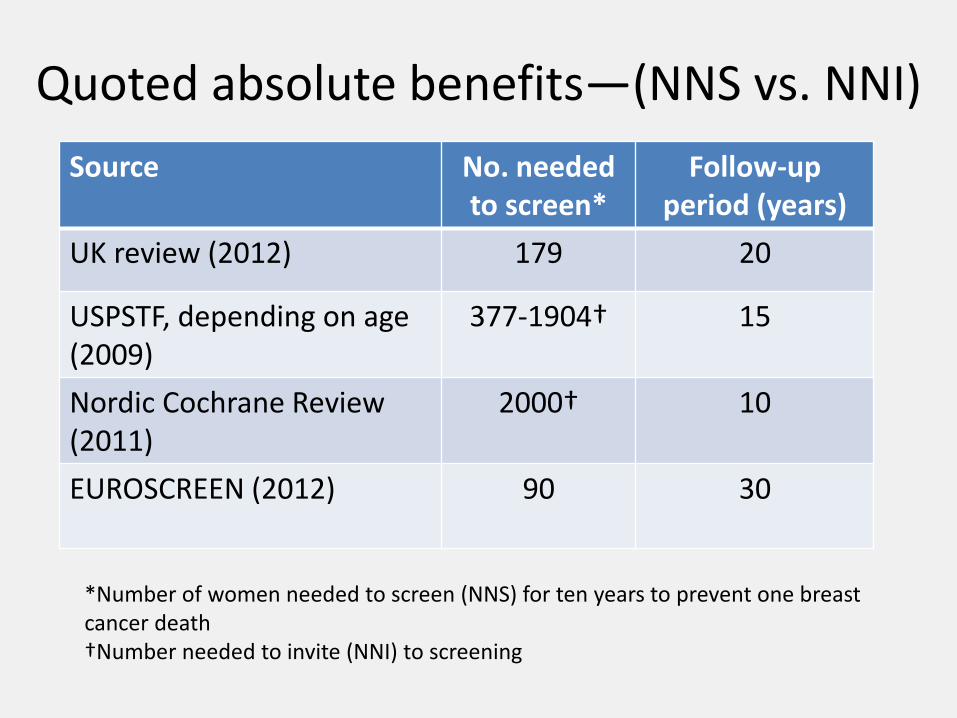
Quoted absolute benefits—(NNS vs. NNI)
Source No. needed to screen*
Follow-up period (years)
UK review (2012) 179 20
USPSTF, depending on age (2009)
377-1904† 15
Nordic Cochrane Review (2011)
2000† 10
EUROSCREEN (2012) 90 30
*Number of women needed to screen (NNS) for ten years to prevent one breast cancer death †Number needed to invite (NNI) to screening

Adjusted absolute risk estimates of the number needed to screen to save one life based on UK Review Standard*
Source No. needed to
screen/invite(original)*
No. needed to screen
(adjusted)
UK review (2012) 180 180
USPSTF, depending on age (2009)
377-1904 193
Nordic Cochrane Review (2011)
2000† 257
EUROSCREEN (2012) 90 64-96
* Original estimates are adjusted to the same scenario used in the UK Independent Review, i.e., the impact of screening UK women ages 50-51 every 3 years for 20 years on mortality in women ages 55-79.

Adverse Effects and Harms
• False positive findings
• Anxiety
• Overdiagnosis
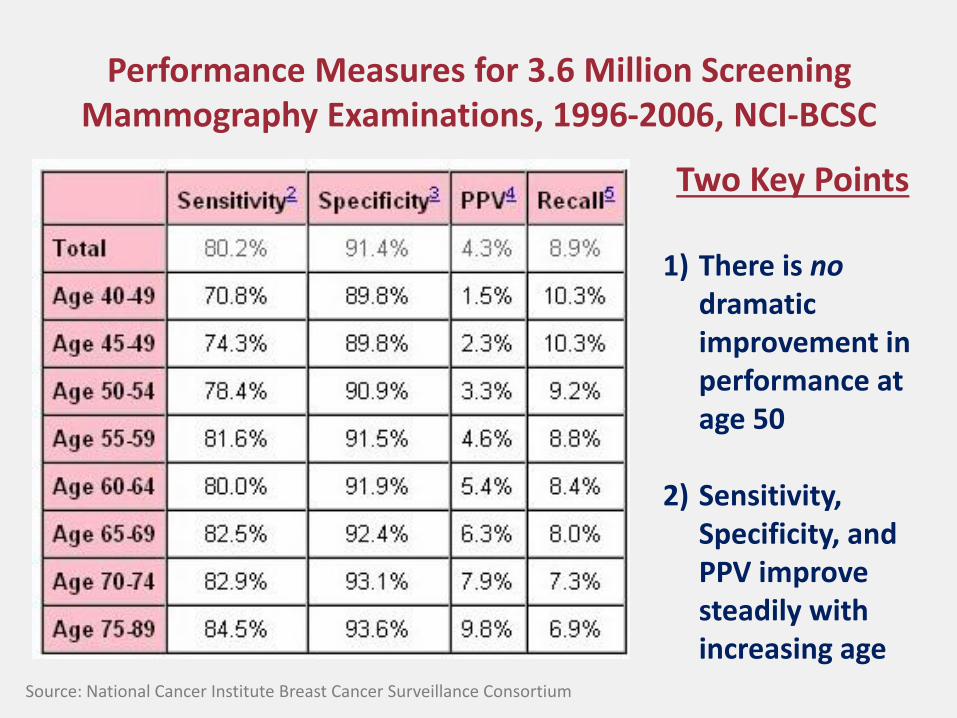
Performance Measures for 3.6 Million Screening Mammography Examinations, 1996-2006, NCI-BCSC
Two Key Points
1) There is no dramatic improvement in performance at age 50
2) Sensitivity, Specificity, and PPV improve steadily with increasing age
Source: National Cancer Institute Breast Cancer Surveillance Consortium
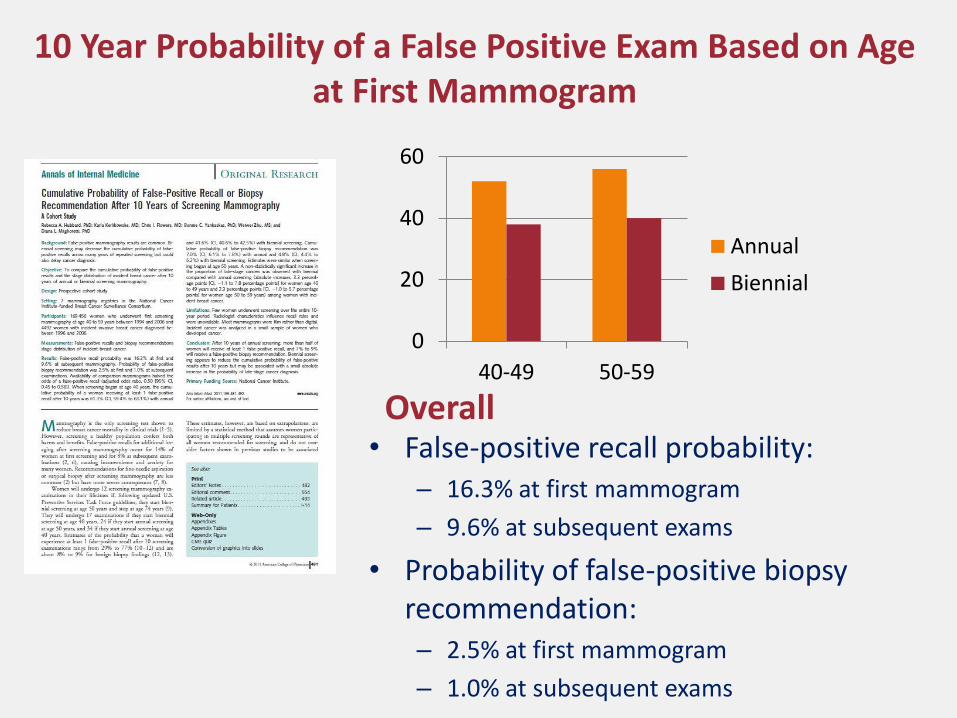
10 Year Probability of a False Positive Exam Based on Age at First Mammogram
• False-positive recall probability: – 16.3% at first mammogram
– 9.6% at subsequent exams
• Probability of false-positive biopsy recommendation: – 2.5% at first mammogram
– 1.0% at subsequent exams
0
20
40
60
40-49 50-59
Annual
Biennial
Overall


Schwartz & Colleagues found:
– Women had high awareness of false positives from mammography
– Women were highly tolerant of false positives • 63% felt 500 FP per life saved was reasonable
• 37% felt 10,000 FP per life saved was reasonable
– Women who had had experienced a FP result had the same level of tolerance as women who had not had experienced a FP
– 63% did not regard false positives as an important factor in decisions about screening

Overdiagnosis
• Estimates of overdiagnosis of screen detected breast tumors range from 0 - > 50%, with some claiming that it is the major harm of screening
• Overdiagnosis- is diagnosis by screening of cancer that never would have arisen symptomatically in the person’s lifetime, and never would have been detected if screening had not taken place
• Reality: To estimate overdiagnosis, we must examine incidence rates over time, and adjust for: – Pre-existing trend of increasing incidence – Lead time
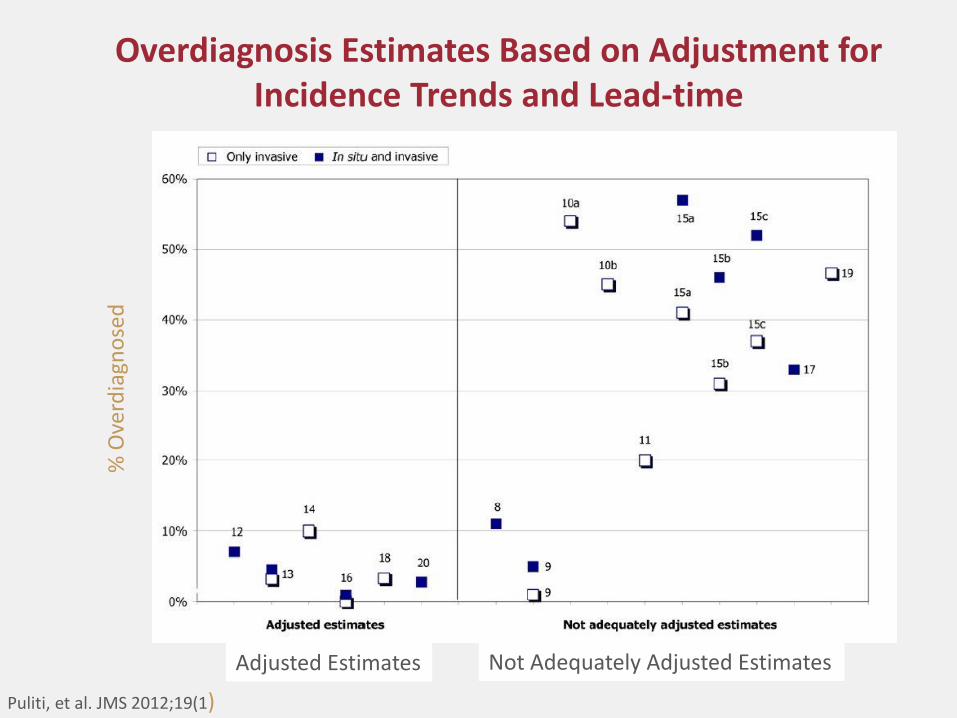
Overdiagnosis Estimates Based on Adjustment for Incidence Trends and Lead-time
% O
verd
iagn
ose
d
Puliti, et al. JMS 2012;19(1)
Adjusted Estimates Not Adequately Adjusted Estimates
Are there harms from not screening?
• A study on 1977 women aged 40-49 diagnosed with breast cancer compared the tumor characteristics, treatment regimens used, and long-term outcome of women with symptomatic versus women with mammographically detected breast cancer.
• Women with symptomatically detected breast cancer had:
– A higher rate of mastectomy (47% vs. 25%)
– Larger average tumor size (3.02 vs. 1.63 cm)
– Significantly worse disease survival
Radiology 2012;262:797-806.)
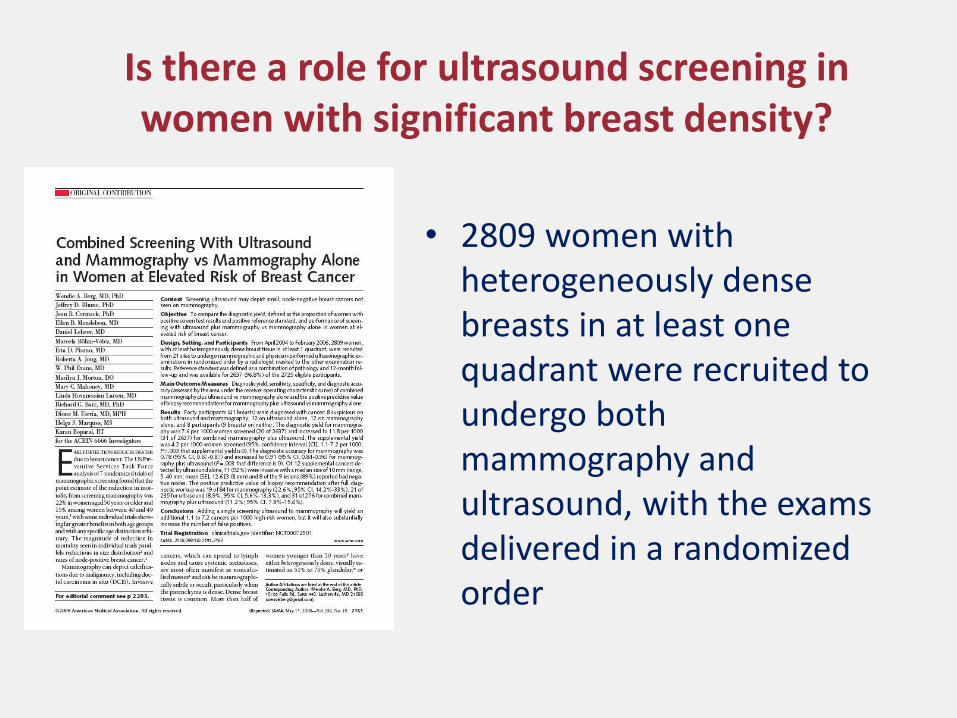
Is there a role for ultrasound screening in women with significant breast density?
• 2809 women with heterogeneously dense breasts in at least one quadrant were recruited to undergo both mammography and ultrasound, with the exams delivered in a randomized order

Performance of Screening With Combined Mammography and Ultrasound vs. Mammography or Ultrasound Alone
Berg W, et al. JAMA 2008;299:18
*
*
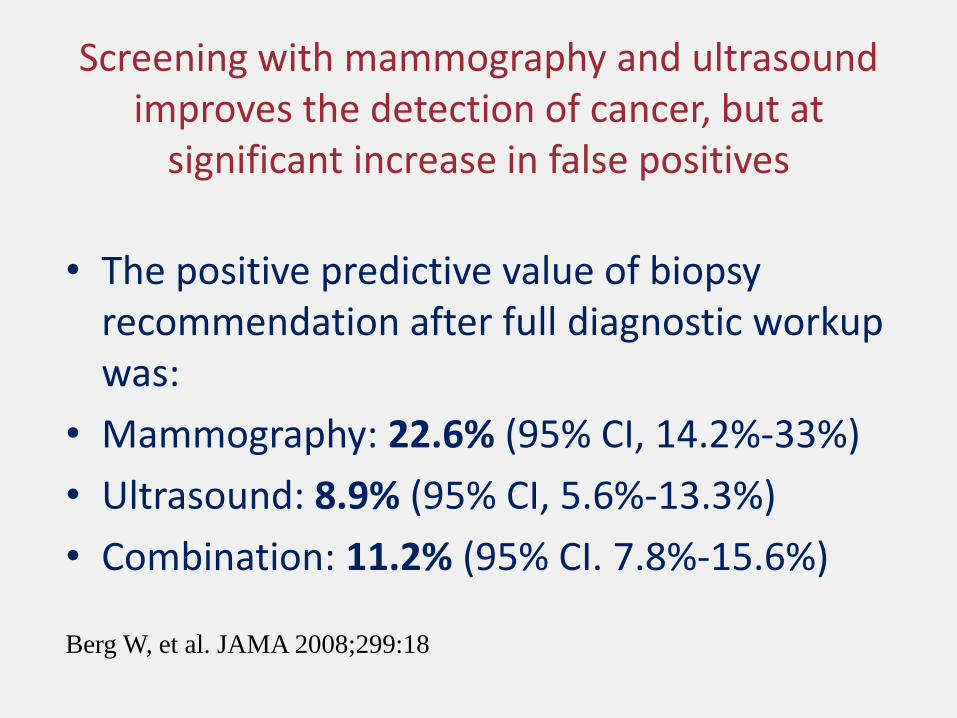
Screening with mammography and ultrasound improves the detection of cancer, but at
significant increase in false positives
• The positive predictive value of biopsy recommendation after full diagnostic workup was:
• Mammography: 22.6% (95% CI, 14.2%-33%)
• Ultrasound: 8.9% (95% CI, 5.6%-13.3%)
• Combination: 11.2% (95% CI. 7.8%-15.6%)
Berg W, et al. JAMA 2008;299:18

What is State of the Art Breast Cancer Screening?
• Take and regularly update family history
– Include maternal and paternal sides for 3 generations
• Counsel your patients about signs and symptoms of breast cancer
• Follow ACS (preferred) or USPSTF guidelines, with particular attention to adherence
• Identify a screening services with radiologists who specialize in breast imaging
• Advise patients to regularly use the same service, which reduces the odds of false positives
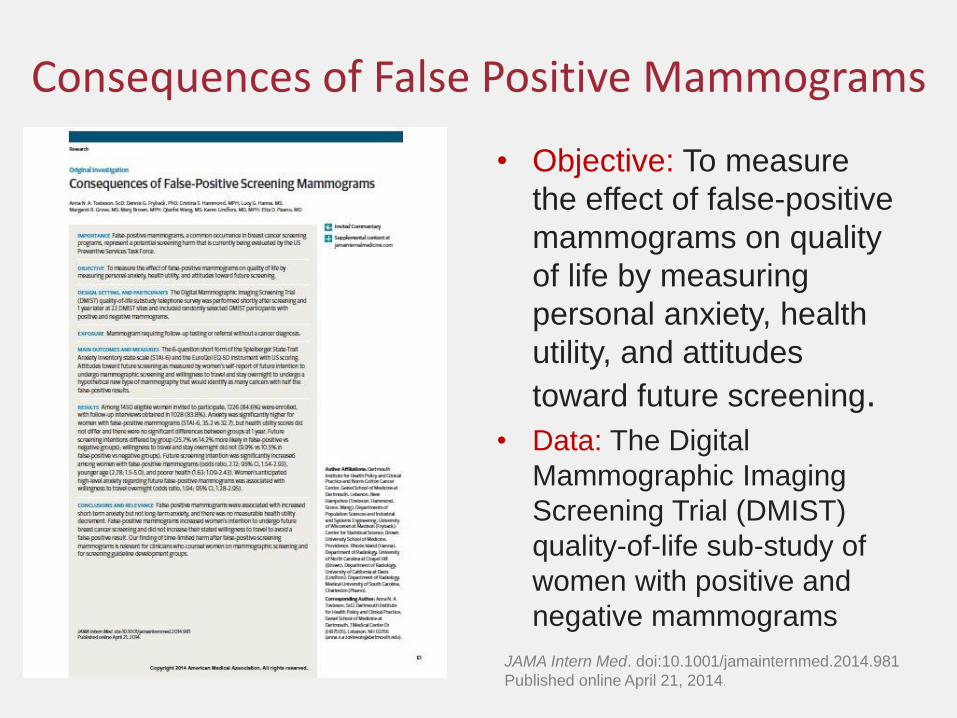
Consequences of False Positive Mammograms
• Objective: To measure
the effect of false-positive
mammograms on quality
of life by measuring
personal anxiety, health
utility, and attitudes
toward future screening.
• Data: The Digital
Mammographic Imaging
Screening Trial (DMIST)
quality-of-life sub-study of
women with positive and
negative mammograms
JAMA Intern Med. doi:10.1001/jamainternmed.2014.981
Published online April 21, 2014.

Consequences of False Positive Mammograms
• False-positive mammograms were
associated with increased short-
term anxiety but not long-term
anxiety
• There was no measurable health
utility decrement.
• False-positive mammograms
increased women’s intention to
undergo future breast cancer
screening, and did not increase
their stated willingness to travel to
avoid a false-positive result.
JAMA Intern Med. doi:10.1001/jamainternmed.2014.981
Published online April 21, 2014.

Colorectal Cancer Screening (Last update, 2008)

Colorectal Screening in Average Risk Adults: Update 2008
Recommendation ACS, USMSTF, ACR USPSTF
Age to begin and
end screening
Begin screening at age
50
End screening at a
point where curative
therapy would not be
offered due to life-
limiting co-morbidity
Begin screening at age
50 (A)
Routine screening in
adults aged 76-85 is not
recommended (C).
There may be
considerations that
support screening in an
individual patient.
Screening after age 85
is not recommended (D)

CRC Screening in Average Risk Adults: Update 2008
Recommendation ACS, USMSTF, ACR USPSTF
Stool Testing
• gFOBT
• FIT
Annual screening with
high sensitivity gFOBT or
FIT
Low sensitivity gFOBT
not recommended
Annual screening with
high sensitivity gFOBT or
FIT
Flexible
sigmoidoscopy
Screening every 5 years
Screening every 5 years,
with annual gFOBT or FIT
is an option
Screening every 5 years,
with gFOBT or FIT every
3 years
Colonoscopy Screening every 10 years
Screening every 10 years
CT Colonography Screening every 5 years Insufficient evidence (I)
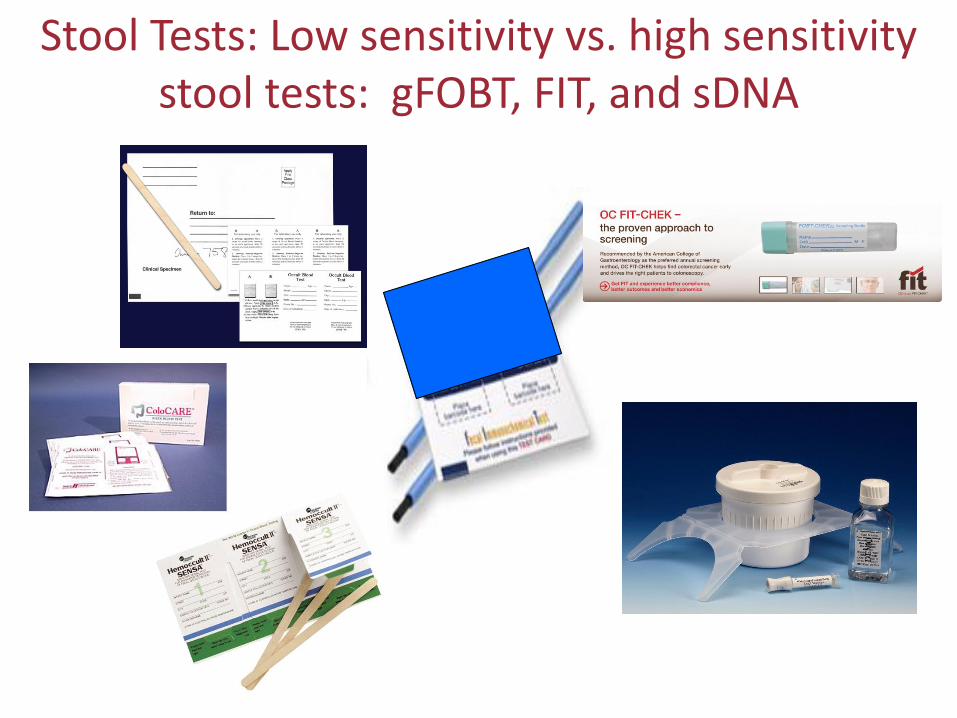
Stool Tests: Low sensitivity vs. high sensitivity stool tests: gFOBT, FIT, and sDNA

Source: Castells A. 2nd CRC Patient Conference, Barcelona, 2013

Single Test Performance Characteristics of gFOBT Variants: Hemoccult & Hemoccult II
• Low test sensitivity (vs. program sensitivity)
• Sensitivity improved with rehydration, but specificity suffers
• Dietary restrictions reduce patient adherence
• Interpretation of test results is subjective
• Lower patient completion compared with FIT
• Low Sensitivity gFOBT NOT RECOMMENDED BY ACS or USPSTF FOR CRC SCREENING
• Single sample In-Office stool testing NOT RECOMMENDED
Study with
One-Time
Testing
Sensitivity for
Cancer
Specificity
Collins, et
al. AIM,
2005
9.5%
[ In Office,
Single Panel
gFOBT]
97.5%
Lieberman,
et al. NEJM,
2001
50%
(w/rehydration)
93.8%
Imperiale,
et al.
NEJM, 2004
14.1% 95.2%
Allison, et
al.
NEJM, 1996
37.1% 97.7%

Stool Test: Immunochemical (FIT)
• Specific for human blood and for lower GI bleeding
• Results not influenced by foods or medications
• Some types require only 1 or 2 stool specimens
• Higher sensitivity for cancer & adenomas than older forms of guaiac-based FOBT
• Slightly more costly than guaiac tests
• Patients prefer FIT to gFOBT

• Diagnostic characteristics of FIT tests have been difficult to estimate, with reported sensitivities ranging from 25% to 100% for CRC and specificities usually exceeding 90%
• Study Selection: All studies evaluating the diagnostic accuracy of FITs for CRC in asymptomatic, average-risk adults.
• Data Sources: Online databases, including MEDLINE and EMBASE, and bibliographies of included studies from 1996 to 2013.
• Nineteen eligible studies were included and meta-analyzed.
Ann Intern Med. 2014;160:171-181.
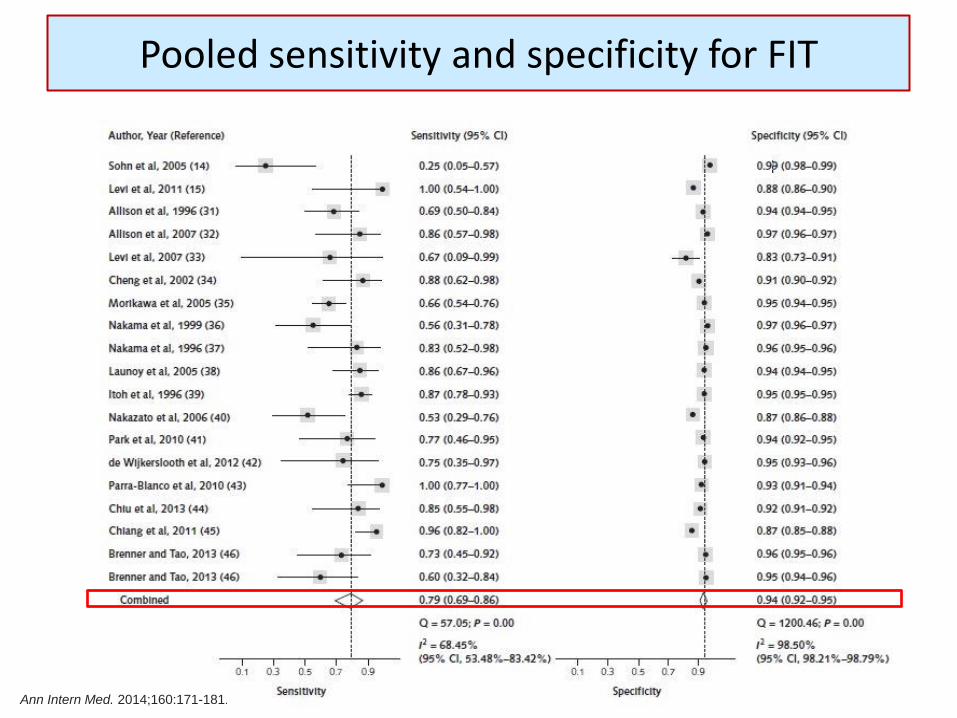
Pooled sensitivity and specificity for FIT
Ann Intern Med. 2014;160:171-181.
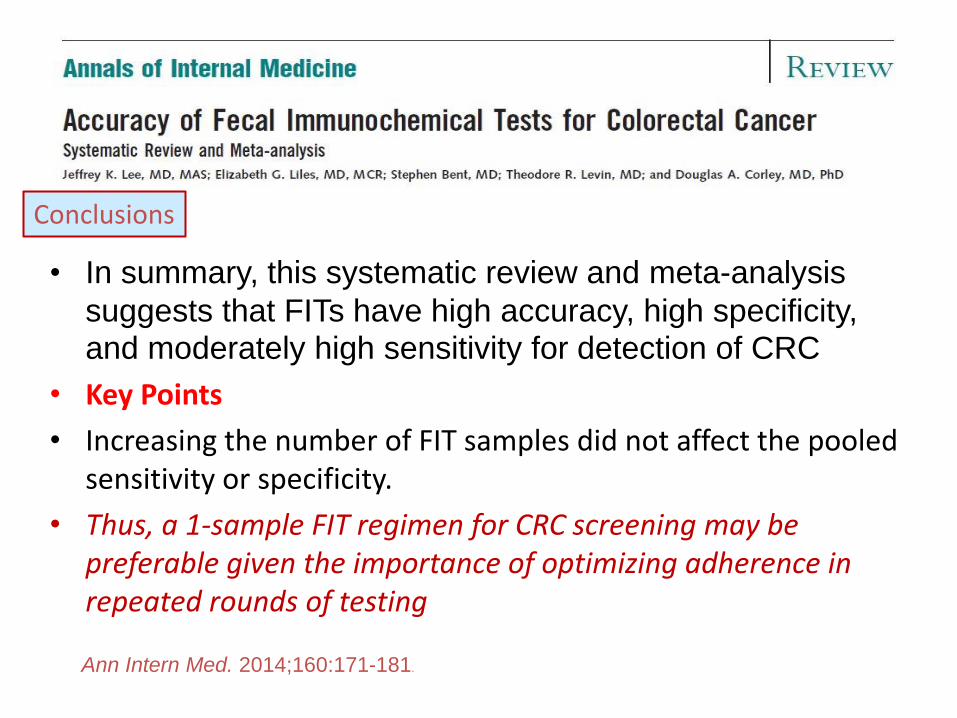
• In summary, this systematic review and meta-analysis
suggests that FITs have high accuracy, high specificity, and moderately high sensitivity for detection of CRC
• Key Points
• Increasing the number of FIT samples did not affect the pooled sensitivity or specificity.
• Thus, a 1-sample FIT regimen for CRC screening may be preferable given the importance of optimizing adherence in repeated rounds of testing
Ann Intern Med. 2014;160:171-181.
Conclusions

Adherence with FIT is consistently better than with guaiac-based stool tests
Adherence
Study FIT Guaiac
Hoffman (2010) 61.4% 50.5%
Hol (2010) 61.5% 49.5%
Van Rossum (2008) 59.6% 49.6%
Cole (2003) 39.6% 23.4%
Source: TR Levin, MD

FITs are an evolving technology with a range of characteristics
• The diversity in fecal immunochemical tests makes performance data and clinical study outcomes difficult to compare
• FITs differ in terms of: – fecal collection technique
– number of samples collected
– hemoglobin stability after collection
– susceptibility to temperature
– device technology
– analytical methodology
– the technique to determine the analytical result
– antibody characteristics, and
– calibration material and derivation of its assigned hemoglobin concentration
Fraser C, et al. JNCI Vol. 104, Issue 11 | June 6, 2012

Some remaining challenges with Quantitative FIT
• Screening programs commonly accept manufacturer’s cut point for a positive test, thus quantitative FIT is used like a qualitative FIT
• Interpretation of test results, i.e., x ng hemoglobin per mL buffer is not standardized--variations in mass of stool and volume of buffer--making comparisons between tests difficult
• The same device may produce different results based on geographical, climatic, sample handling techniques, storage arrangements, and transport protocols
Fraser C, et al. JNCI Vol. 104, Issue 11 | June 6, 2012

Colonoscopy
• Polypectomy prevents Colorectal Cancer
• The National Polyp Study observed a 76-90% reduction in CRC incidence after polypectomy
Winawer et al, NEJM 1993

Influence of colonoscopic polypectomy on risk of death from colorectal cancer
Colonoscopic polypectomy was
associated with a 53% reduction in
colorectal cancer mortality
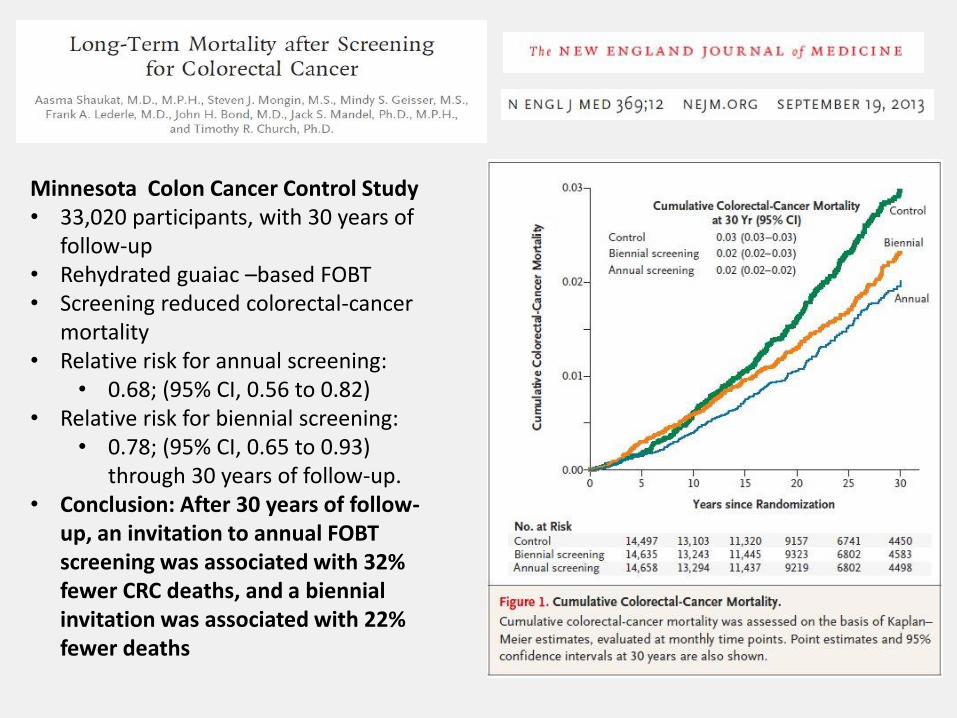
Minnesota Colon Cancer Control Study • 33,020 participants, with 30 years of
follow-up • Rehydrated guaiac –based FOBT • Screening reduced colorectal-cancer
mortality • Relative risk for annual screening:
• 0.68; (95% CI, 0.56 to 0.82) • Relative risk for biennial screening:
• 0.78; (95% CI, 0.65 to 0.93) through 30 years of follow-up.
• Conclusion: After 30 years of follow-up, an invitation to annual FOBT screening was associated with 32% fewer CRC deaths, and a biennial invitation was associated with 22% fewer deaths

Over- and Under-utilization of Colonoscopy
• Among 24,000 Medicare beneficiaries who had normal colonoscopy between 2001-2003, 46.2% underwent repeat colonoscopy within 7 years – Goodwin J, et al. Arch Internal Med, May 11, 2011
• Among 12,071 Medicare beneficiaries 70 + who underwent polypectomy or biopsy during 2001-2004, only 45.7% had undergone another colonoscopy within 5 years. – Cooper G, et al. Cancer 2013; DOI: 10.1002/cncr.27990
• Among gastroenterologists and surgeons who perform screening colonoscopy, 24% of gastroenterologists and 54% of surgeons recommended surveillance for a hyperplastic polyp. – Mysliwiec P, et al. Ann Intern Med. 2004;141:264-271

Problems with the quality of colonoscopy are well documented

Quality Issues with Colonoscopy
• Poor pre-procedure documentation • Poor prep • Failure to reach the cecum • Rapid withdrawal time • Adverse events • Highly variable adenoma detection rate • Interval cancers • Over and under utilization of the
procedure • Highly variable reports • Poor feedback • Most endoscopists are unaware of “their
numbers,” since most facilities do not track their data.
What do the quality data on colonoscopy show?
• Adenoma detection rate (ADR) is highly variable.
• In one large series, ADR varied from 7% - 52%
– 8% interval cancer rate
– ADR inversely associated with the interval cancer rate
– ADR inversely associated with colorectal cancer death

Key Quality Indicators
• Adenoma Detection Rate (ADR) – Entire Unit and Individual Endoscopists
– Improvement plans are initiated if ADR rate is not ≥ 25% for men and ≥ 15% for women, or > 20% overall
• Cecal Intubation Rate (CIR) – Improvement plans are initiated if complete colonoscopy is not
accomplished in > 90% of all patients and > 95% of those undergoing screening and surveillance procedures, for both the unit as a whole and for each individual endoscopist
• Quality of Preparation – Improvement plans are initiated if prep quality is not “adequate for
detection of all polyps > 5 mm” in > 90% of patients.
Key Quality Indicators
• Complete Procedure Documentation – Patient demographics
– ASA Score (assessment of procedural risk)
– Procedure Indications (screening, surveillance, symptoms, etc.)
– Procedural Technical Description (medications, extent of exam, adequacy of preparation, ease and tolerance, retroflexion, other maneuvers)
– Colonoscopic Findings
– Diagnosis and Assessment
– Unplanned Events
– Follow-up Plan
• Incomplete unit or endoscopist documentation shall initiate improvement plan

The National Colorectal Cancer Round Table Evidence-Based
Toolkit and Guide to Increase Colorectal Cancer Screening Rates
Available at http://nccrt.org

Current Guidelines for Prostate Cancer Screening

Prostate Cancer Screening in Average and High Risk Men: ACS (2010); USPSTF (2012)
Recommendation ACS USPSTF
PSA Testing Shared Decision Making Asymptomatic men who have at least a 10-year life expectancy should have an opportunity to make an informed decision with their health care provider about whether to be screened for prostate cancer, after receiving information about the uncertainties, risks, and potential benefits associated with prostate cancer screening.
Recommends against prostate-specific antigen (PSA)-based screening for prostate cancer (D).
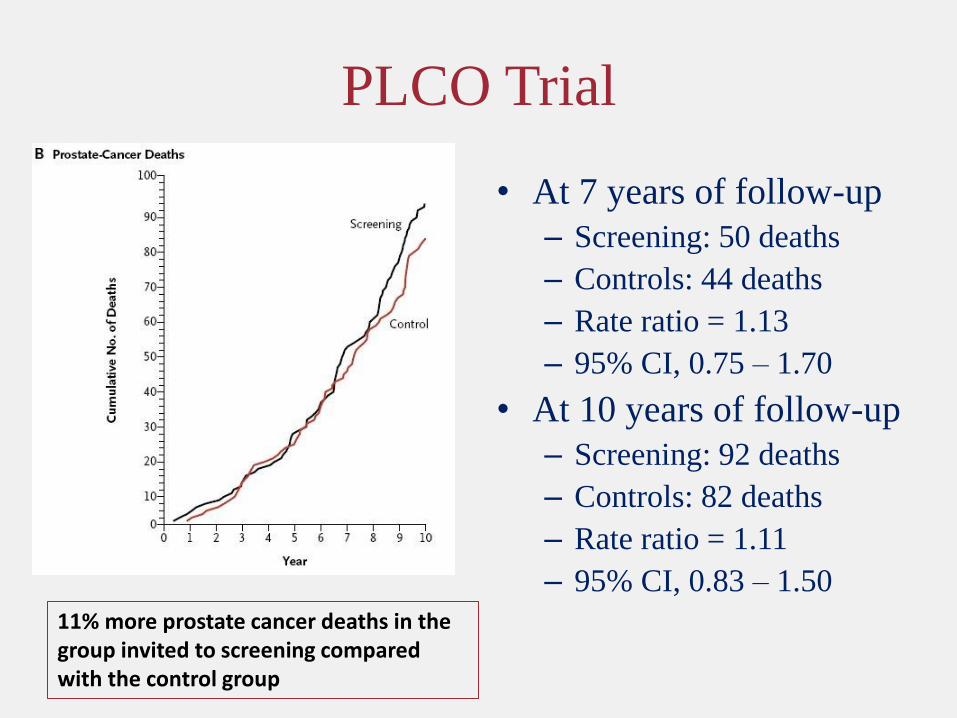
PLCO Trial
• At 7 years of follow-up
– Screening: 50 deaths
– Controls: 44 deaths
– Rate ratio = 1.13
– 95% CI, 0.75 – 1.70
• At 10 years of follow-up
– Screening: 92 deaths
– Controls: 82 deaths
– Rate ratio = 1.11
– 95% CI, 0.83 – 1.50
11% more prostate cancer deaths in the group invited to screening compared with the control group

Cumulative risk from prostate cancer in
the ERSPCS
• As of 12/2006
– Average follow-up of 8.8 years
– 214 deaths in the screening group vs. 326 in the control group
– The adjusted rate ratio for prostate specific mortality was 0.80, (95% CI, 0.65 – 0.98, P = 0.04)
– Adjusted for non-compliance, RR = 0.73, (95% CI, 0.56 – 0.90) 20% fewer prostate cancer deaths in the
group invited to screening compared with the control group

Cumulative Incidence of Prostate Cancer Mortality in the Screening Group vs. the Control Group
• The absolute cumulative risk reduction of death from prostate cancer at 14 years was 0·40% (95% CI 0·17–0·64), from 0·90% in the control group to 0·50% in the screening group.
• The rate ratio for death from prostate cancer was 0·56 (95% CI 0·39–0·82; p=0·002) in the screening compared with the control group.
• The rate ratio of death from prostate cancer for attendees compared with the control group was 0·44 (95% CI 0·28–0·68; p=0·0002).
• Overall, 293 (95% CI 177–799) men needed to be invited for screening and 12 to be diagnosed to prevent one prostate cancer death.
Hugosson J, et al. Lancet Oncol 2010;11:725-32.
44% fewer prostate cancer deaths in the group invited to screening compared with the control group
Critique of the USPSTF’s D Rating for Prostate Cancer Screening
• Erroneous conclusions when addressing time-to-event data – The USPSTF stated, “48 men received treatment for every
prostate cancer-specific death prevented.”
– This is incorrect, since the number represents men diagnosed, not treated (many were on surveillance protocols).
– Further, number needed to treat is highly dependent on the duration of follow-up
• ERSPC at 11 years (NND = 37)
• Göteborg at 14 years (NND = 12)
See Carlsson, S. Journal of Clinical Oncology, Vol. 30, No 21 (July 20), 2012: pp. 2581-2584
Critique of the USPSTF’s D Rating for Prostate Cancer Screening
• Overestimation of harms
– The USPSTF estimated the 30-day perioperative mortality rate after radical prostatectomy as 0.5%, a outcome based on Medicare data from 1991-1994 (i.e., 20 years ago).
– Today, men 65+, who are at higher risk for adverse outcomes, are a minority of the radical prostatectomy series
– Contemporary estimates based on all men are closer to 0.1%
See Carlsson, S. Journal of Clinical Oncology, Vol. 30, No 21 (July 20), 2012: pp. 2581-2584
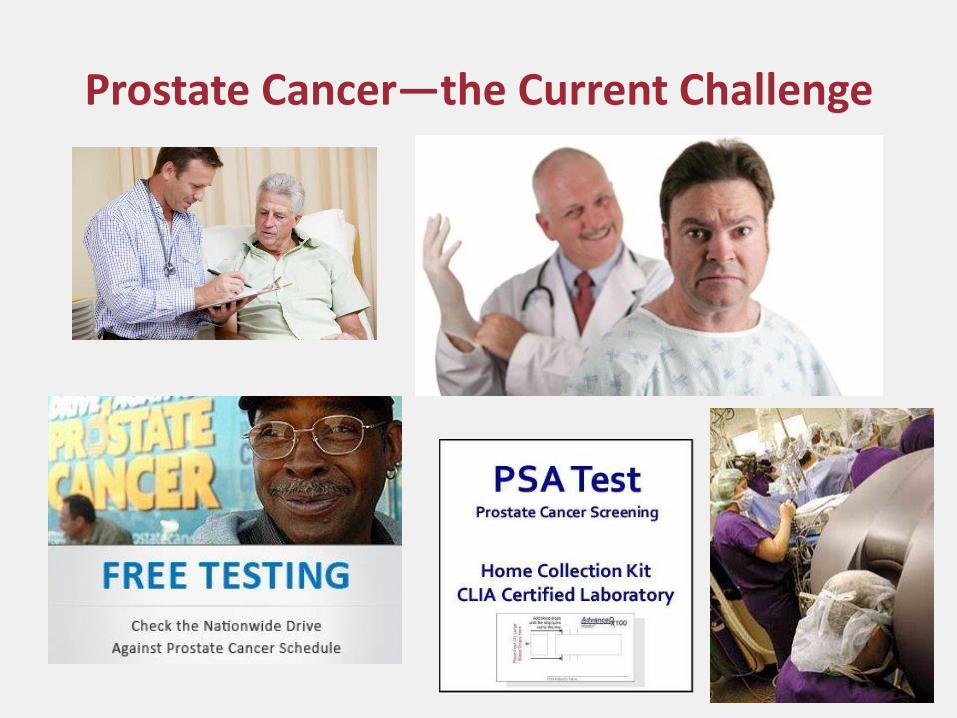
Prostate Cancer—the Current Challenge

PSA testing today
• While there is a sound basis to disagree with the USPSTF recommendations, PSA testing in the U.S. does not commonly adhere to any recommendation: – PSA testing begins too early, stops too late, and too many men
with limited life expectancy or significant co-morbidity are being tested.
– Little evidence that shared decision making is taking place
– Patients report that their doctors tend to encourage PSA testing
– Men with elevated PSA commonly are encouraged to undergo radical treatment

The real problem with the PSA test is how we’re using it
• Two observations: – PSA levels are very strongly correlated with clinically
significant prostate cancer
– PSA has only modest diagnostic specificity and positive predictive value at commonly used thresholds for a positive finding.
• Routine screening with PSA leads to an excessive number of negative biopsies, and an excessive rate of diagnosis of indolent cancers
• How might we screen more effectively and in particular, put PSA to better use?

State of the Art Screening for Prostate Cancer
• Take and regularly update family history, beginning at an early age
• Follow ACS or ACP guidelines—Understand the issues and provide opportunities for shared decision making
• For men who choose to be screened for prostate cancer after considering the possible benefits and risks:
– Screening is recommended with PSA with or without DRE.

State of the Art Screening for Prostate Cancer
• For men whose PSA is less than 2.5 ng/mL, screening intervals can be extended to every 2 years.
• Screening should be conducted yearly for men whose PSA level is 2.5 ng/mL or greater.
• For PSA levels between 2.5 ng/mL and 4.0 ng/mL, health care providers should consider an individualized risk assessment that incorporates other risk factors for prostate cancer, particularly for high-grade cancer, that may be used to recommend a biopsy.
• A PSA level of 4.0 ng/mL or greater historically has been used to recommend referral for further evaluation or biopsy, which remains a reasonable approach for men at average risk for prostate cancer.
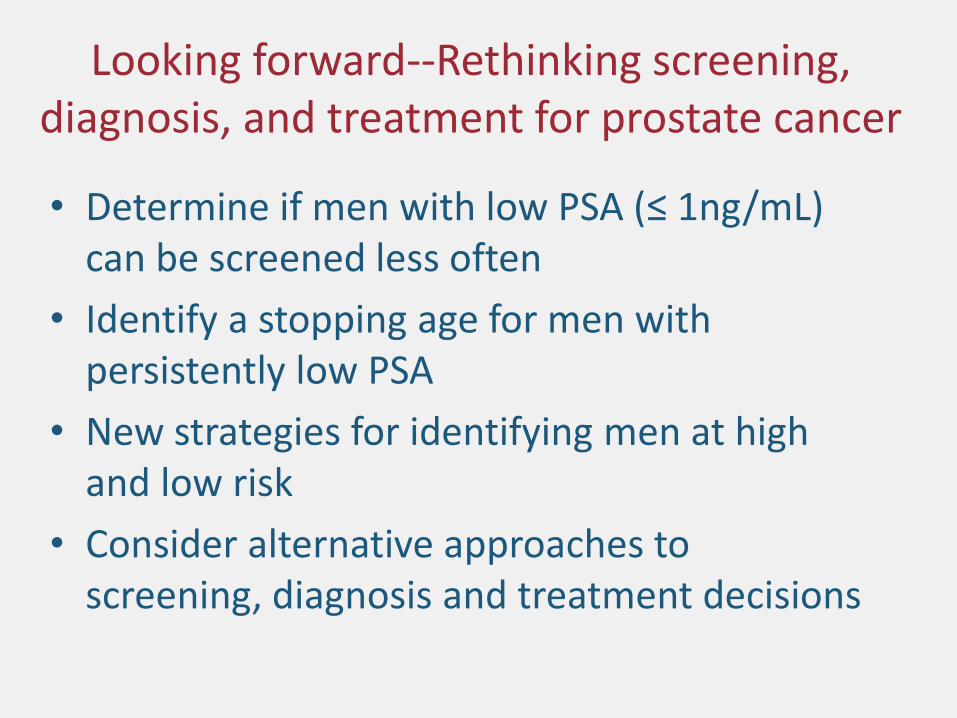
Looking forward--Rethinking screening, diagnosis, and treatment for prostate cancer
• Determine if men with low PSA (≤ 1ng/mL) can be screened less often
• Identify a stopping age for men with persistently low PSA
• New strategies for identifying men at high and low risk
• Consider alternative approaches to screening, diagnosis and treatment decisions
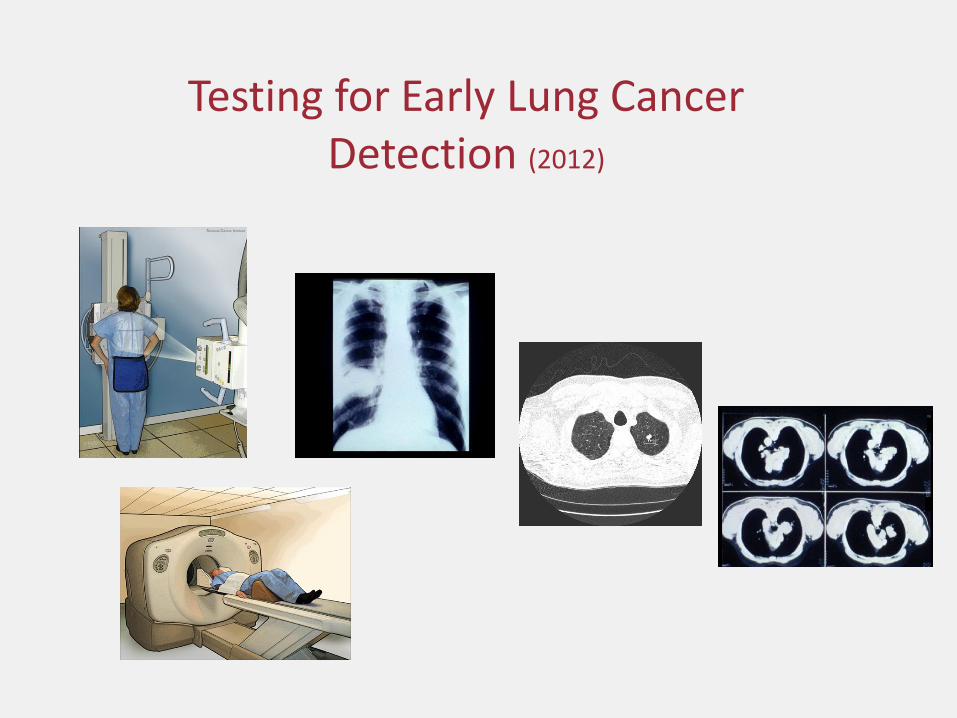
Testing for Early Lung Cancer Detection (2012)

ACS Lung Cancer Screening Guidelines, 2013
• Clinicians with access to high-volume, high-quality lung cancer screening and treatment centers should initiate a discussion about screening with apparently healthy patients aged 55 years to 74 years who have at least a 30–pack-year smoking history and who currently smoke or have quit within the past 15 years.
• A process of informed and shared decision-making with a clinician related to the potential benefits, limitations, and harms associated with screening for lung cancer with low-dose computed tomography should occur before any decision is made to initiate lung cancer screening.
• Smoking cessation counseling remains a high priority for clinical attention in discussions with current smokers, who should be informed of their continuing risk of lung cancer. Screening should not be viewed as an alternative to smoking cessation.

Table 1: Eligibility Criteria for the National Lung Screening Trial
Age 55-74
Smoking history
30 pack years. (A pack year is the equivalent of 1 pack of cigarettes per day per year. 1 pack per day for 30 years or 2 packs per day for 15years would both be 30 pack-years).
Former smoker
Must have quit within 15 years
General health exclusions
Metallic implants or devices in the chest or back Requirement for home oxygen supplementation Prior history of lung cancer or other lung cancer symptoms

There were 20% fewer lung cancer deaths in the LDCT arm compared with the CXR arm. There were 6.7% fewer deaths from all causes in the LDCT arm compared with the CXR arm.

One of the most significant challenges in the implementation of lung cancer screening will be the management of positive findings
Approximately 40% of adults experienced a false positive finding during 3 rounds of LDCT screening.
Nodule Size vs. Volume
• Historically, workup and surveillance has been based on nodule size and growth. – Fleishner Society
– IELCAP
– NLST
– Nagano, Japan
– Italian RCTs
– Mayo
– Etc
• Newer nodule management protocols are based on tumor volume and volume doubling time

Using Lung Lesion Size Alone as the Definition of a Positive Result
• Objective: Assess alternative thresholds for the definition of a positive test.
• Measure the frequency of solid and part-solid pulmonary nodules and the rate of lung cancer diagnosis by using current (5 mm) and more restrictive (7 – 8 mm) thresholds of nodule diameter
Ann Intern Med. 2013;158:246-252.

In the ELCAP Study, there were 21,136 participants, 12, 078 with a nodule ≥ 1 cm, and
3,396 with a nodule ≥ 5 cm
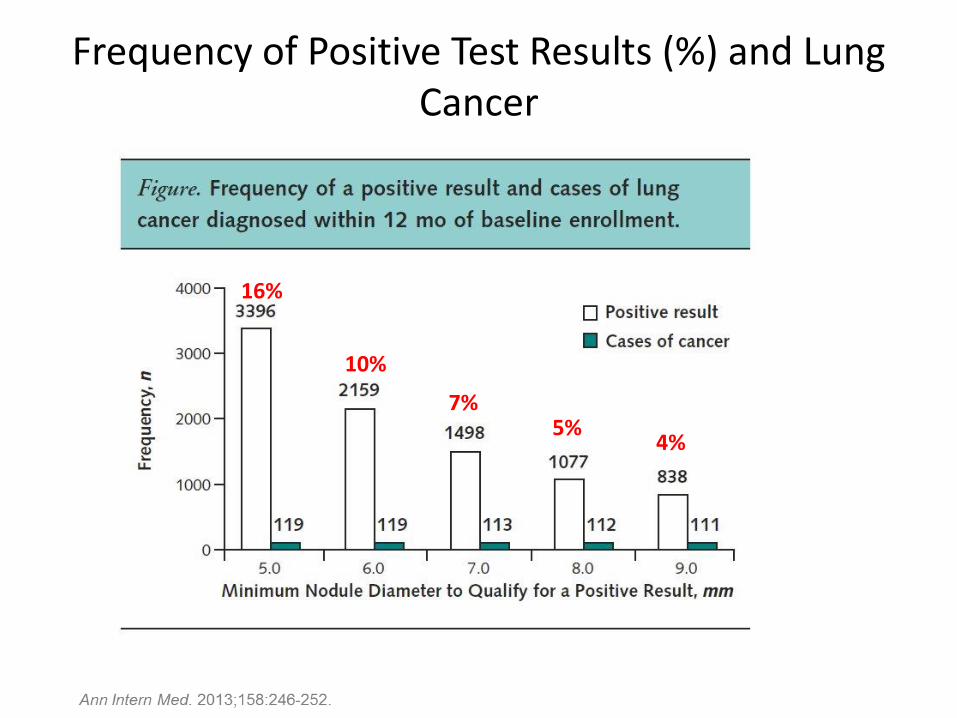
Frequency of Positive Test Results (%) and Lung Cancer
16%
10%
7% 5%
4%
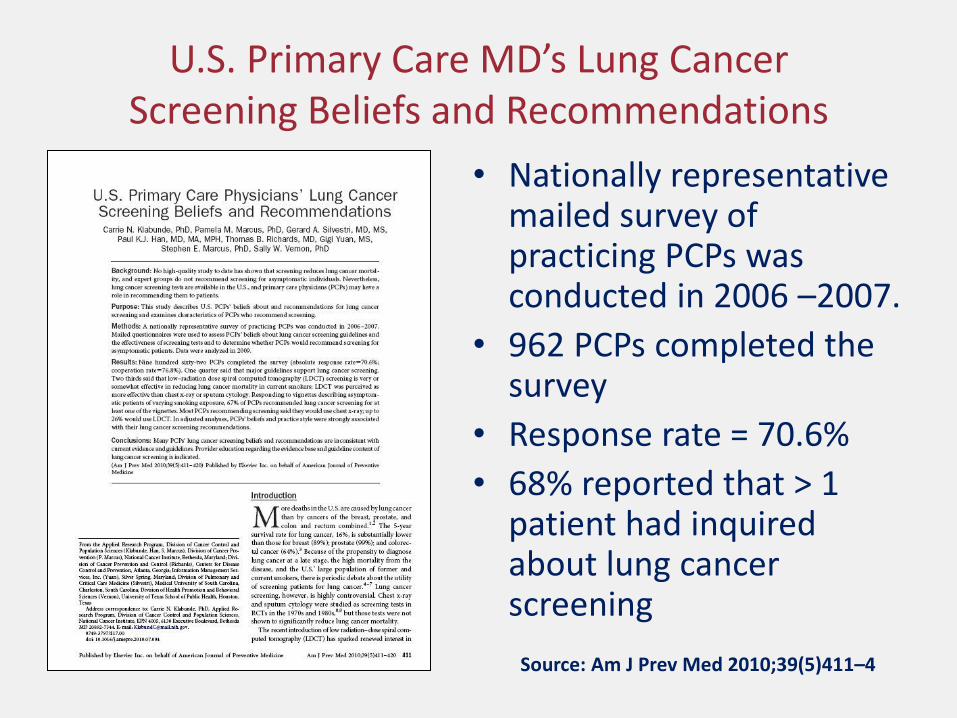
U.S. Primary Care MD’s Lung Cancer Screening Beliefs and Recommendations
• Nationally representative mailed survey of practicing PCPs was conducted in 2006 –2007.
• 962 PCPs completed the survey
• Response rate = 70.6%
• 68% reported that > 1 patient had inquired about lung cancer screening
Source: Am J Prev Med 2010;39(5)411–4

Primary care physicians’ recommendations for lung cancer screening, by patients’ smoking status
Vignette % Recommending
Screening
Healthy never smoker aged 50 years 17.4
Healthy never smoker aged 50 years with smoking
spouse 48.3
Otherwise healthy former smoker aged 50 years with
20 pack-year history who quit smoking 15 years ago
52.8
Otherwise healthy former smoker aged 50 years with
20-packyear history who quit smoking 1 year ago
63.8
Otherwise healthy current smoker aged 50 years who
has smoked 1 pack of cigarettes per day for 20 years
66.3
Source: Am J Prev Med 2010;39(5)411–4

This slide is from an imaging center in Atlanta, using GROUPON to
promote its services
Posted on May 29, 2013


Cancer Screening in the U.S….How are we doing?
• The Healthy People 2020 target of 81% screening rate for breast cancer was not met in 2010, which reached 72.4%.
• The rate for cervical cancer was 83% compared to the 93% target.
• The rate for colorectal cancer was 58.6% compared to a target of 70.5%.

Interventions to Increase Preventive Care
• Opportunistic Screening (i.e., coincidental) is inherently limited compared with Organized Screening – Encounter based, not population based
– Situational context of encounter is a limiting factor
– Depends on MD (preoccupation, forgetfulness, lack of familiarity with recommendations, and most important , lack of systems)
– Partial adherence is more likely than complete adherence, i.e., some screening tests but not all screening tests
– More complex situations (follow-up, greater risk, etc.) are less likely to be properly addressed

The Current Challenge
• There are a number of effective interventions to increase cancer screening, but their individual impact is modest
• Multi-modal interventions hold the greatest promise
• The current system does not support the most effective interventions
– A health care professional engaged with your care
– Supportive reminder and tracking systems

The Current Challenge
• Health care reform, and in particular, the ACA and the Medical Home, offer great potential to increase rates of regular screening through:
– Access
– Personalized preventive health plans
– Time for prevention
– Systems
• However, Payment models must accommodate these needs

Thank you
Related Documents