Investor Presentation March 2020 Acquisition/disposition/valuation/lending services for surplus and distressed assets

Welcome message from author
This document is posted to help you gain knowledge. Please leave a comment to let me know what you think about it! Share it to your friends and learn new things together.
Transcript

Investor PresentationMarch 2020
Acquisition/disposition/valuation/lending services for
surplus and distressed assets
2 Heritage Global Inc. | www.hginc.com
Forward-Looking Statements
This communication includes forward-looking statements based on our current expectations and projections about
future events. For these statements, Heritage Global Inc. (the “Company”) claims the protection of the safe harbor
for forward-looking statements contained in the Private Securities Litigation Reform Act of 1995.
The forward-looking statements contained in this communication are based on knowledge of the environment in
which the Company currently operates and are subject to change based on various important factors, including
variability in magnitude and timing of asset liquidation transactions, the impact of changes in the U.S. national and
global economies (including the uncertain conditions created by the coronavirus [COVID-19] pandemic), interest
rate and foreign exchange rate sensitivity, as well as other factors beyond the Company's control.
Unless required by law, we undertake no obligation to update or revise any forward-looking statements, whether as
a result of new information, future events or otherwise.
In light of these risks, uncertainties and assumptions, you should not place undue reliance on these forward-
looking statements, which speak only as of the date of this presentation.
Although we believe that our expectations are based on reasonable assumptions, we can give no assurance that
our expectations will materialize. For more details on factors that could affect these expectations, please see our
filings with the Securities and Exchange Commission including the “Risk Factors” section in our most recent annual
report on Form 10-K.

3 Heritage Global Inc. | www.hginc.com
Company Overview
Heritage Global Inc. is a diversified financial services company providing acquisition, disposition, valuation, and
lending services for surplus and distressed assets.
Specialty
Financing
Solutions
SPECIAL
SITUATIONSCharged-Off
Portfolios
Auction
ServicesASSET ADVISORY Valuations
Intellectual
Property
ADVISORY/
MONETIZATIONDistressed
Real Estate
Asset Sales
Valuation Services
Advisory
Specialty Lending
4 Heritage Global Inc. | www.hginc.com
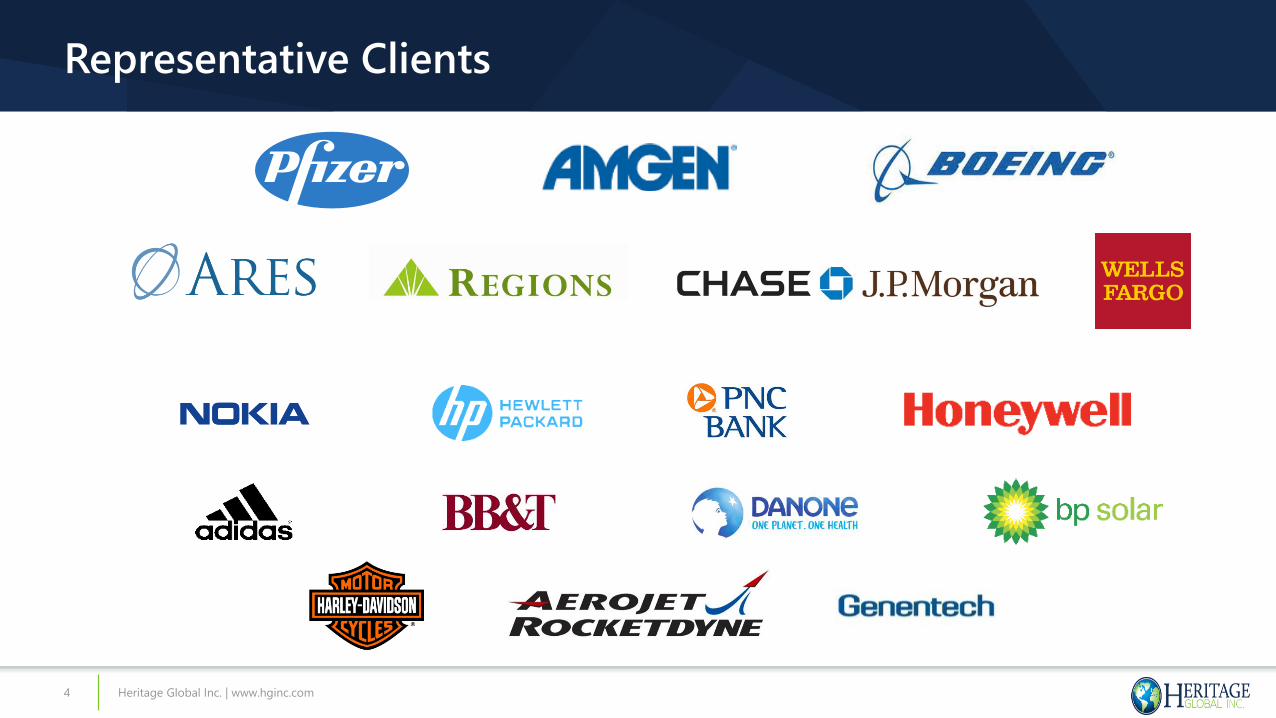
Representative Clients

5 Heritage Global Inc. | www.hginc.com
Value Creation – Investment Highlights
Competitive
Advantages
Sustainable
Growth
Financial
Performance
Shareholder
Value
Global
Platform
• OTCQB: HGBL
• CSE: HGP
Tickers
• $0.75
Price
• $22 Million
Market Cap
MARKET DATA1 FINANCIAL TRENDS2
• $26.2 Million
Revenue
• $3.9 Million
Net Income
• $4.2 Million
Adjusted EBITDA3
• $0.13
Diluted EPS
1 In US dollars as of 3/19/20.2 Represents fiscal year ended December 31, 2019.3 See “Reconciliations of Non-GAAP Measures” in the Appendix of this presentation.
6 Heritage Global Inc. | www.hginc.com
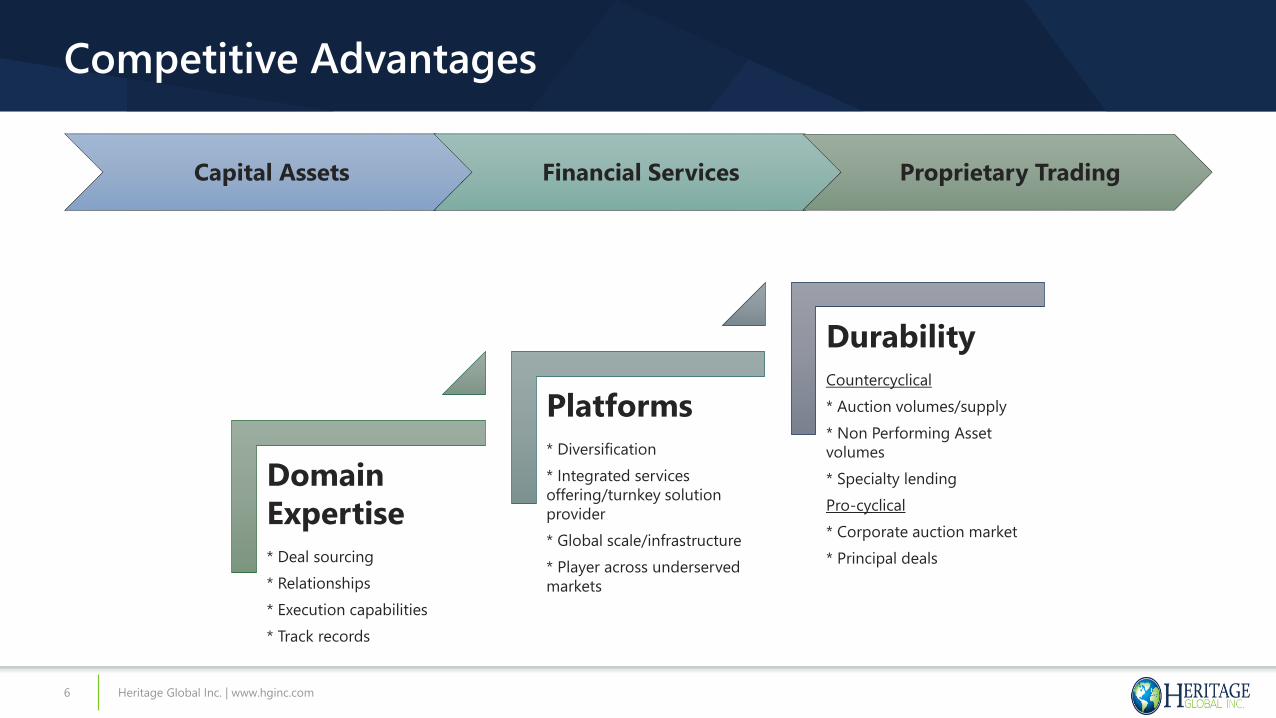
Capital Assets Financial Services Proprietary Trading
Domain
Expertise
* Deal sourcing
* Relationships
* Execution capabilities
* Track records
Platforms
* Diversification
* Integrated services
offering/turnkey solution
provider
* Global scale/infrastructure
* Player across underserved
markets
Durability
Countercyclical
* Auction volumes/supply
* Non Performing Asset
volumes
* Specialty lending
Pro-cyclical
* Corporate auction market
* Principal deals
Competitive Advantages

7 Heritage Global Inc. | www.hginc.com
Leadership Team
• Over 30 years experience in
the auction industry.
• Managed more than 4,000
industrial auctions in 30
countries.
• Previously served as
Chairman and CEO of
DoveBid, an industrial asset
and commercial property
auction company.
• Received a degree from
Washington State University.
Ross Dove
Chief Executive Officer
• Over 30 years experience in
the auction industry.
• Managed more than 4,000
industrial auctions in 30
countries.
• Previously served as President
of DoveBid, and as a Senior
Account Executive at Merrill
Lynch directing a client base
of over 600 individuals.
• Holds a Bachelors of Science
degree in Business from North
Illinois University.
Kirk Dove
Chief Operating Officer
• Over 25 years executive
financial accounting and
business management
experience serving various
public and private equity
funded companies.
• Previously spent 11 years at
Ernst & Young working on a
large number of IPO and
M&A transactions.
• Holds a Bachelors of Science
degree in Accounting from
Arizona State University.
Scott West
Chief Financial Officer
• Over 25 years of legal
experience serving asset
advisory and auction firms.
• Previously spent 12 years with
GoIndustry-DoveBid as legal
counsel.
• Holds a juris doctorate degree
with cum laude honors from
Wayne State University Law
School and a Bachelor of
Science in Economics from the
Wharton School of the
University of Pennsylvania.
James Sklar
General Counsel

8 Heritage Global Inc. | www.hginc.com
Positioned to Grow in All Cycles
Macro
Headwinds
HGBL
Tailwinds
Wider spreads on principal asset/loan
activities
Favorable lending cycle
Higher nonperforming assets/net
charge-offs
Building surplus inventories and
bankruptcies
Lower asset prices/volumes
Pressure on Net Interest Margins
Declining Net Interest Income

9 Heritage Global Inc. | www.hginc.com
Sustainable Growth
Vision: Become the dominant solution and most respected and trusted firm to corporations,
trustees and lenders needing to monetize challenged assets across all classes and geographies.
Principal Deals
Product &
Services
Development
Target Market
Extensions
Business
Development
External
Growth
Opportunities Growth
Drivers
10 Heritage Global Inc. | www.hginc.com
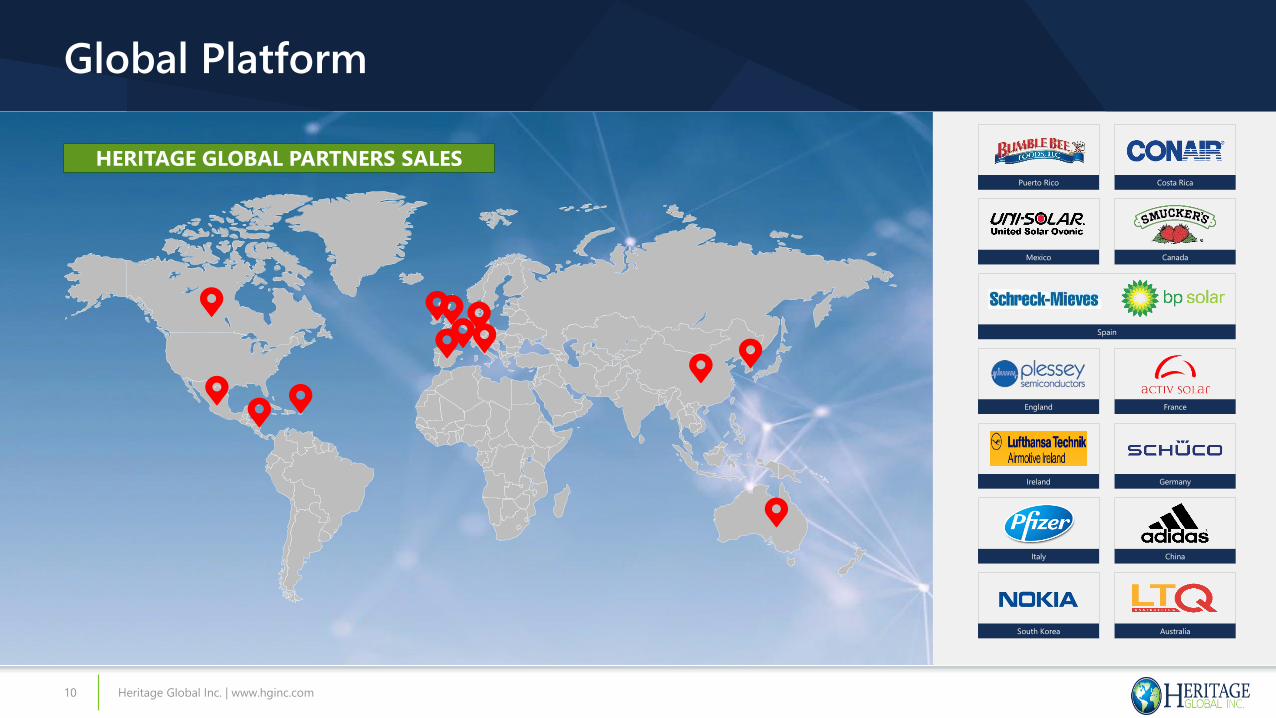
Global Platform
Puerto Rico Costa Rica
Mexico Canada
Spain
England France
Ireland Germany
Italy China
South Korea Australia
HERITAGE GLOBAL PARTNERS SALES

11 Heritage Global Inc. | www.hginc.com
Financial Performance
1 Profitability• Inflection point
• Building scale across platforms
• Rising operating leverage
2 Diversification• Across/within business units
• Agency vs. principal revenue streams
• More predictable and forecastable
revenues, margins, and earnings
3 Financial Flexibility• Building EBITDA1
• Strong balance sheet
• Recently upsized credit facility
• Strategic M&A
1 See “Reconciliations of Non-GAAP Measures” in the appendix of this presentation.

12 Heritage Global Inc. | www.hginc.com
Financial Performance – Operating Efficiencies
Build Scale
• Within businesses
• Across platforms
Manage
Expenses
• Corporate level
• Business unit level
Drive
Operating
Leverage
• Maintain high
incremental
margins
• Favorable business
mix shift
Increasingly
Leverage
Synergies
• Processes &
systems
• Centralized
database
Action Plan

13 Heritage Global Inc. | www.hginc.com
Value Creation
Financial
Performance
* Healthy & achievable
growth projections
Improving EPS
Quality,
Visibility, &
Sustainability
* More balanced
agency vs. principal
revenue streams
* More predictable
events = smoother
revenue & earnings
* Specialty lending
platform provides
increased predictability
with “flow” transactions
* Forward flow
contracts
* Date-certain events
Strengthening
& Leveraging
the Balance
Sheet
* Upsized credit facility
* Business lines of
credit
* Capital management
Investor
Relations
* Investor targeting &
outreach
* Enhance messaging,
disclosures, reporting

Appendix

15 Heritage Global Inc. | www.hginc.com
Heritage Global Partners
3 Growth Drivers• Shift toward higher-contribution principal deals
• Recent alliance with Napier Park to acquire
industrial equipment and real estate assets
• Building surplus equipment assuming accelerating
Pharma M&A to refill pipelines
• Increasingly leveraging Capital Asset Redeployment
Enterprise (CARE) software package
1 ServicesHeritage Global Partners is a full service, global
auction and asset advisory firm.
2 Differentiating FactorsDomain expertise and infrastructure via
management’s experience, expertise, relationships,
and track records. Broadly diversified across sectors.
Aerospace & Aviation Biotech & Pharma
Machine Tools Semiconductor & Electronics
16 Heritage Global Inc. | www.hginc.com
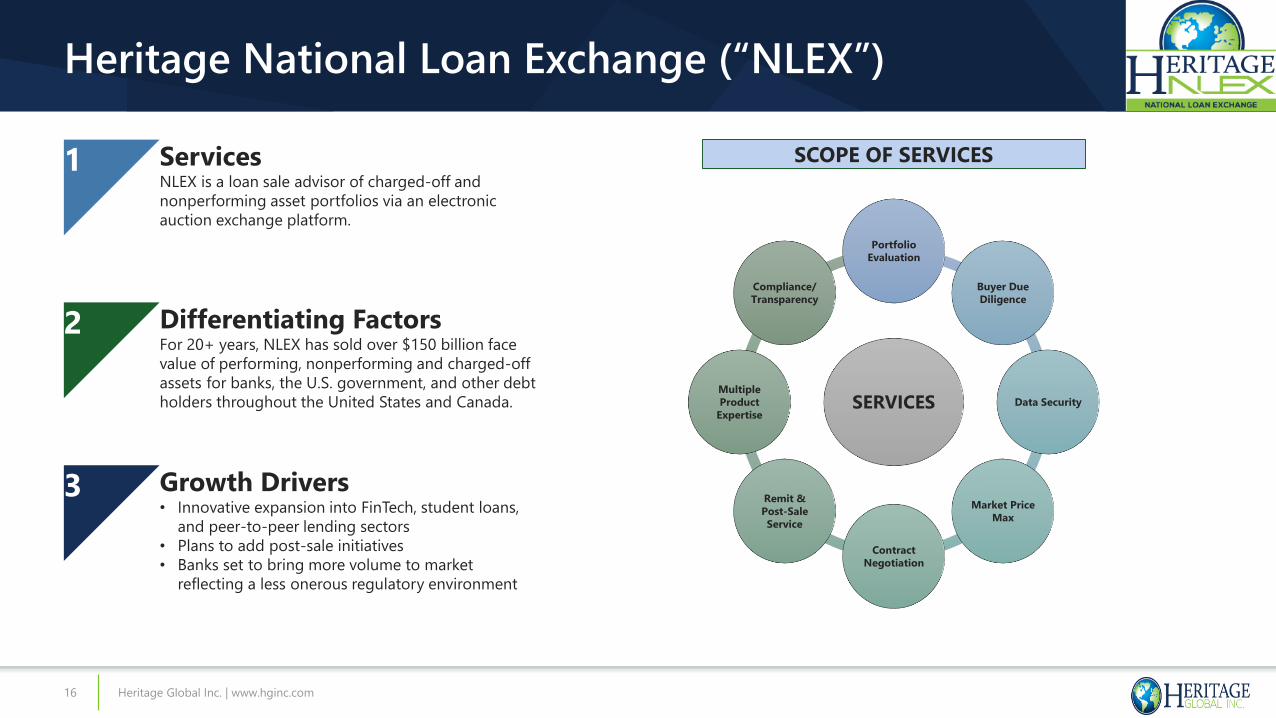
Heritage National Loan Exchange (“NLEX”)
3 Growth Drivers• Innovative expansion into FinTech, student loans,
and peer-to-peer lending sectors
• Plans to add post-sale initiatives
• Banks set to bring more volume to market
reflecting a less onerous regulatory environment
1 ServicesNLEX is a loan sale advisor of charged-off and
nonperforming asset portfolios via an electronic
auction exchange platform.
2 Differentiating FactorsFor 20+ years, NLEX has sold over $150 billion face
value of performing, nonperforming and charged-off
assets for banks, the U.S. government, and other debt
holders throughout the United States and Canada. SERVICES
Portfolio
Evaluation
Buyer Due
Diligence
Data Security
Market Price
Max
Contract
Negotiation
Remit &
Post-Sale
Service
Multiple
Product
Expertise
Compliance/
Transparency
SCOPE OF SERVICES

17 Heritage Global Inc. | www.hginc.com
Heritage Global Capital
1 ServicesHeritage Global Capital provides specialty financing
solutions to small- and medium-sized investors in
charged-off and nonperforming asset portfolios and
other asset-based classes.
2 Differentiating FactorsDecades of domain expertise and the ability to
leverage established relationships from the HGC
executive team who have participated in over $400
million in fundings and have extensive Industry
relationships.
FUNDING PROCESS
3 Growth Drivers• Increasingly penetrating an underserved growing
market – smaller buyers of charged-off receivables
• Providing more economic financing options
• Providing a greater variety of funding solutions
which allows our Clients to stretch their equity,
creating growth
• Banks set to bring more volume to market
reflecting a less onerous regulatory environment
18 Heritage Global Inc. | www.hginc.com
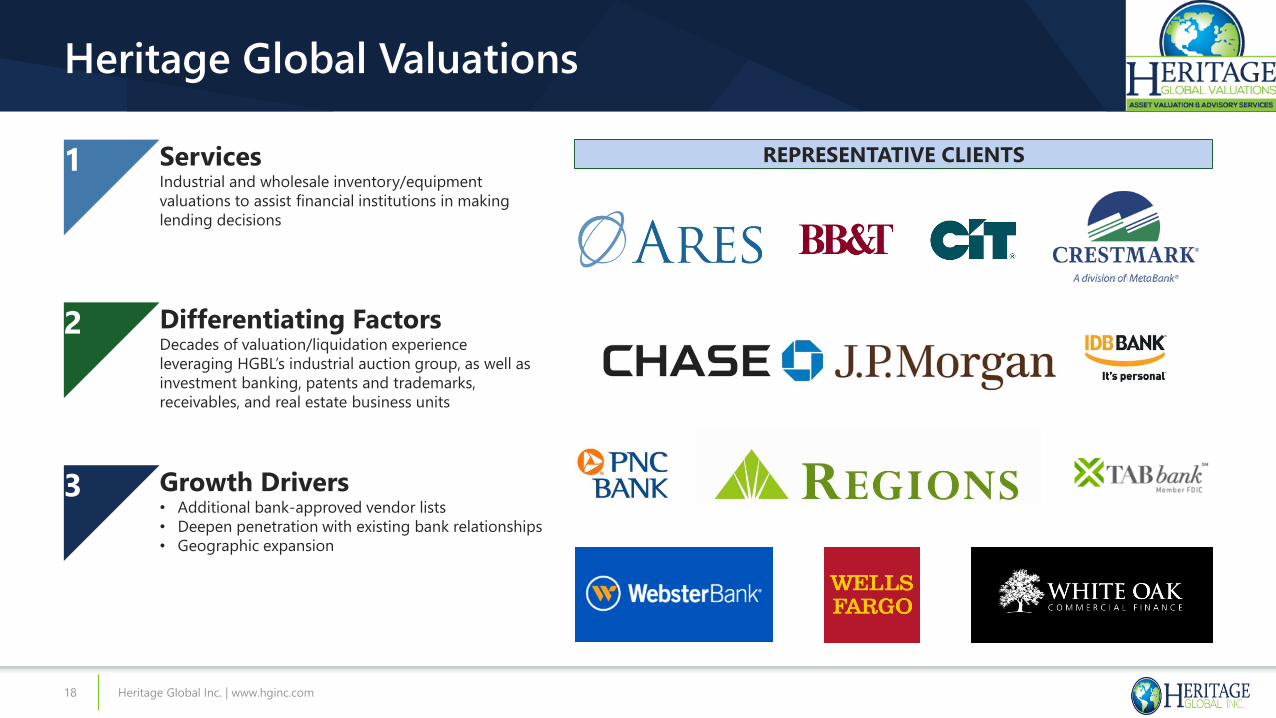
Heritage Global Valuations
3 Growth Drivers• Additional bank-approved vendor lists
• Deepen penetration with existing bank relationships
• Geographic expansion
1 ServicesIndustrial and wholesale inventory/equipment
valuations to assist financial institutions in making
lending decisions
2 Differentiating FactorsDecades of valuation/liquidation experience
leveraging HGBL’s industrial auction group, as well as
investment banking, patents and trademarks,
receivables, and real estate business units
REPRESENTATIVE CLIENTS

19 Heritage Global Inc. | www.hginc.com
Heritage Zetabid Realty & Auction Services
3 Growth Drivers• Client acquisition
• Broader/deeper relationships with existing clients
1 ServicesHybrid auction/brokerage solution to sell commercial
and residential real estate on an accelerated timeline
2 Differentiating FactorsBoutique approach allows for targeted marketing
under the banner of an auction to maximize buyer
attention, pricing, and close rates

20 Heritage Global Inc. | www.hginc.com
3 Growth Drivers• Expand relationships with National Association of
Bankruptcy Trustees
• Increase sales of non-commercialized patents in
Global 1000
Heritage Global Patents & Trademarks
1 ServicesProactively manage/streamline corporate Intellectual
Property portfolios via sealed-bid and online auctions
2 Differentiating FactorsPioneered the development of Intellectual Property
auctions in the early 2000s, with a focus on “Date-
Certain Events”
OIM Squared
Artificial Intelligence
Receivership
Sold $1,040,000 to credit bidder
Wisewear
Internet of Things/Smart Jewelry
Chapter 11
Sold $110K
Sheer Wind
Renewable Energy
Chapter 7
Sold $20K
RECENT SALES

21 Heritage Global Inc. | www.hginc.com
Peer Comparables
Valuation ComparisonsDate: 3/19/20
EV/EBITDA Price/EPS EPS % Chg
2019 2020 2021 2019 2020 2021 2019 2020 2021 20/19 21/20 2019 YTD
Auctioneers
KAR Auction Services, Inc. KAR $13.16 $1,696 $4,906 9.9x 9.7x 9.0x 12.7x 10.3x 8.8x $1.04 $1.28 $1.50 23.2% 16.8% -54.3% -39.6% 5.4%
Liquidity Services, Inc. LQDT $3.96 $135 $98 N/A N/A 14.2x N/A N/A N/A -$0.22 -$0.33 -$0.04 N/A N/A -3.4% -33.6% 0.0%
Ritchie Bros. Auctioneers RBA $27.91 $3,062 $3,424 11.4x 10.9x 9.9x 21.0x 19.1x 16.7x $1.33 $1.46 $1.67 9.9% 14.2% 31.3% -35.0% 2.9%
MEDIANS 10.6x 10.3x 9.9x 16.8x 14.7x 12.8x 16.5% 15.5% -3.4% -35.0% 2.9%
AVERAGES 10.6x 10.3x 11.0x 16.8x 14.7x 12.8x 16.5% 15.5% -8.8% -36.1% 2.8%
Heritage Global Inc. HGBL $0.70 $21 $20 4.7x 5.4x N/A N/A $0.13 N/A N/A N/A N/A 115.2% -28.4% 0.0%
Exchanges
Cboe Global Markets Inc CBOE $81.75 $9,028 $9,651 11.5x 11.1x 10.4x 17.3x 16.5x 15.2x $4.73 $4.95 $5.37 4.7% 8.4% 22.7% -31.9% 1.8%
eBay Inc. EBAY $30.21 $24,050 $29,647 8.3x 8.4x 7.9x 10.7x 10.0x 9.0x $2.83 $3.02 $3.38 6.7% 11.8% 28.6% -16.3% 2.0%
MarketAxess Holdings Inc. MKTX $312.30 $11,843 $11,667 40.3x 34.7x 31.0x 57.8x 51.0x 45.5x $5.40 $6.12 $6.87 13.4% 12.2% 79.4% -17.6% 0.8%
Nasdaq, Inc. NDAQ $86.57 $14,285 $17,702 14.1x 13.1x 12.4x 17.3x 16.0x 14.9x $5.00 $5.41 $5.83 8.2% 7.7% 31.3% -19.2% 2.1%
Tradeweb Markets, Inc. Class A TW $38.76 $2,721 $7,262 19.6x 16.9x 15.3x 38.8x 31.9x 29.0x $1.00 $1.21 $1.34 21.4% 10.2% N/A -16.4% 0.9%
MEDIANS 14.1x 13.1x 12.4x 17.3x 16.5x 15.2x 8.2% 10.2% 30.0% -17.6% 1.8%
AVERAGES 18.8x 16.8x 15.4x 28.4x 25.1x 22.7x 10.9% 10.1% 40.5% -20.3% 1.5%
Heritage Global Inc. HGBL $0.70 $21 $20 4.7x 5.4x N/A N/A $0.13 N/A N/A N/A N/A 115.2% -28.4% 0.0%
Boutique Advisors
Evercore Inc Class A EVR $38.11 $1,549 $1,187 2.1x 1.9x 1.9x 4.9x 4.6x 4.4x $7.70 $8.36 $8.71 8.6% 4.1% 4.5% -49.0% 6.5%
Greenhill & Co., Inc. GHL $9.90 $186 $461 9.0x 5.9x 6.0x 22.0x 5.6x 4.9x $0.45 $1.78 $2.01 296.1% 12.9% -30.0% -42.1% 2.3%
Houlihan Lokey, Inc. Class A HLI $48.64 $2,135 $3,070 15.7x 14.6x 13.7x $3.11 $3.34 $3.55 7.6% 6.4% 32.8% -0.5% 2.7%
Lazard Ltd Class A LAZ $25.51 $2,672 $3,792 6.3x 5.8x 5.6x 7.8x 6.6x 6.0x $3.28 $3.86 $4.27 17.8% 10.6% 8.3% -36.2% 7.7%
Moelis & Co. Class A MC $25.57 $1,358 $1,338 6.6x 4.1x 3.9x 13.0x 9.7x 9.0x $1.96 $2.65 $2.83 35.1% 6.9% -7.2% -19.9% 8.6%
PJT Partners, Inc. Class A PJT $27.46 $628 $1,158 11.4x 9.0x 7.8x $2.41 $3.06 $3.53 27.0% 15.5% 16.4% -39.2% 0.8%
MEDIANS 6.4x 5.0x 4.7x 12.2x 7.8x 6.9x 22.4% 8.8% 6.4% -37.7% 4.6%
AVERAGES 6.0x 4.4x 4.3x 12.5x 8.3x 7.6x 65.4% 9.4% 4.1% -31.1% 4.8%
Heritage Global Inc. HGBL $0.70 $21 $20 4.7x 5.4x N/A N/A $0.13 N/A N/A N/A N/A 115.2% -28.4% 0.0%
Source: FactSet. Forward EBITDA/EPS figures based on consensus estimates.
Company TickerStock
Price
Mkt Cap
($M)
EV
($M)
Dividend
Yield

22 Heritage Global Inc. | www.hginc.com
Reconciliation of EBITDA and Adjusted EBITDA (Non-GAAP Measures)
($ thousands)
2Q18 3Q18 4Q18 1Q19 2Q19 3Q19 4Q19 2016 2017 2018 2019
Net Income $1,685 $369 $408 $612 $1,494 $1,216 $577 $14 ($249) $3,751 $3,899
Add back:
Depreciation & amortization 76 79 80 76 76 74 79 316 313 319 305
Interest & other expense, net 38 47 13 23 22 12 7 63 95 214 64
Income tax expense (benefit) 64 0 206 24 54 39 (1,030) 21 (420) 270 (913)
EBITDA 1,863 495 707 735 1,646 1,341 (367) 414 (261) 4,554 3,355
Management add back:
Stock-based compensation 85 73 70 71 76 63 73 99 246 289 283
Settlement accrual 0 0 0 0 0 0 0 0 1,142 0 0
Fair value adjustment of contingent consideration (157) 0 0 0 0 0 0 92 938 (157) 0
Impairment of goodwill 0 0 0 0 0 0 573 0 0 0 573
Adjusted EBITDA $1,791 $568 $777 $806 $1,722 $1,404 $279 $605 $2,065 $4,686 $4,211
Source: Company reports.
Reconciliations of Non-GAAP Measures
1
1 The Company uses the non-GAAP financial measure “Adjusted EBITDA” in assessing its results because the Company believes that Adjusted EBITDA is relevant and useful supplemental information for
our investors. The Company believes that the presentation of this non-GAAP financial measure, when considered together with our GAAP financial measures and the reconciliation to the most directly
comparable GAAP financial measure, provides a more complete understanding of the factors and trends affecting the Company than could be obtained absent these disclosures. The Company’s use of
Adjusted EBITDA is not meant to be, and should not be, considered in isolation or as a substitute for, or superior to, any GAAP financial measure. Because non-GAAP financial measures are not
standardized, it may not be possible to compare these financial measures with other companies’ non-GAAP financial measures having the same or similar names.

Related Documents