Acoustic Emission Time-load Behavior and Material Stabilization after Damage in Composite Material ASNT, Seattle, May 2017 Dr. Adrian Pollock, MISTRAS Group Inc.

Welcome message from author
This document is posted to help you gain knowledge. Please leave a comment to let me know what you think about it! Share it to your friends and learn new things together.
Transcript

Acoustic Emission Level I
Acoustic Emission Time-load Behavior and Material Stabilization after Damage in
Composite Material
ASNT, Seattle, May 2017
Dr. Adrian Pollock, MISTRAS Group Inc.

Synopsis
• Basic concepts of acoustic emission, equilibrium, stability • AE from CFRP beam subjected to a series of rising loads • Kaiser and Felicity Effects, typical behavior • AE continues during load hold, with rate decaying • Exponential model for decay of AE rate during load hold • Viscoelastic nature of the resin and material models
(standard linear solid SLS, and network of frangible SLS’s) • Anatomy of an extended damage event: foreshocks,
aftershocks and stabilization; indications of distress • The “energy account” graph • Stabilization after an exceptionally large damage event:
“background energy”

Basic Concept of Acoustic Emission
Other NDT methods produce images of the test object. AE “listens” as it responds to stress.

Basic Concepts of Equilibrium and Stability
Unstable Equilibrium Metastable
Equilibrium Stable Equilibrium
These ones will fall with a bang

Test Article
• Cantilever beam, hollow thick wall construction • Carbon epoxy, unidirectional and woven laminate • Loaded in bending

CFRP Beam Subjected to a Series of Rising Loads
130% 100% 115% 80% 60% 40% 20%

Kaiser Effect at 80%; Felicity Effect above 100%
80%
100%

Another Way of Plotting the Data Load on the X Axis

Felicity Effect on the Activity vs Load Plot

Another Test on a Similar Article but with Extended Load Holds
During the load holds, AE continues, with decaying rate

Load Holds: AE Continues, with Decaying Rate The Higher the Stress, the Slower the Decay
2200 lbs
3300 lbs
2800 lbs
(A third test article)

AE Rate Decays During Load Hold The Higher the Stress, the Slower the Decay

Hold at 1050-1170s (3300 lbs) Channel B R2 Result
PASSPASSPASS PASSPASS PASS
• Cumulative events and energies of the AE during load hold periods are fitted to the exponential decay form: y = AeBt + C (In this equation, the time constant of the exponential decay is 1/B.)
• Codes such as ASME X, Appendix 8 specify acceptance values for B and for the goodness of fit R2.
Rate of Exponential Decay can be used as an Acceptance Criterion

K1
K2
The Cause of AE during Load Hold: Explanation lies in the Viscoelastic Nature of the Resin
• Many solids have not only “springiness” but also a “flowing” quality in their nature.
• Such solids will take time to reach equilibrium under load.
• See here the defining equations of the components of an SLS, along with an example of how the assembly might behave.
• “Standard Linear Solid” • A spring-and-dashpot model
with parameters K1, K2, η
Time
Lp /K1 Spring: Xs = Ls/Ks
Dashpot: dXd/dt = Ld/ηd
Lp
Lp/(K1+K2)
Extension X Load L
Load finally applied Extension - Rate of Change
Load Viscosity term

Felicity Effect Explained by (a) Viscoelasticity, (b) Friction at Damage Sites
• If a viscoelastic solid is quickly loaded, quickly unloaded and then reloaded, AE may be seen at loads below the previous maximum. This could be because the material didn’t have time to reach equilibrium the first time.
• AE at loads below the previous maximum is called Felicity effect.
• This is contrary to the Kaiser effect. Kaiser saw AE only when he reloaded his specimens above the previous maximum.
• “Standard Linear Solid” • A spring-and-dashpot model
K1
K2

Representation of AE Requires making the Standard Linear Solid Frangible
The Standard Linear Solid (SLS) provides a model of springiness and flow, but not of the sudden local damage events (micro-fractures) that are the essence of the AE phenomenon. To represent AE we therefore introduce a “Frangible SLS” whose upper “spring” will suddenly break at a given load (in the material, a given local stress) or extension (in the material, a given local strain). But this is still not enough to account for multiple sources generating AE before fracture of the stressed body . . .
K1
K2
“Standard Linear Solid”
“Frangible Standard Linear Solid”

Network of Frangible SLS’s has the potential to model many aspects of AE behavior
To represent an extended material with many potential AE sites, one can envision a network of frangible SLS’s . . . this concept is readily extended to cover load redistribution and stabilization around areas of local damage . . .
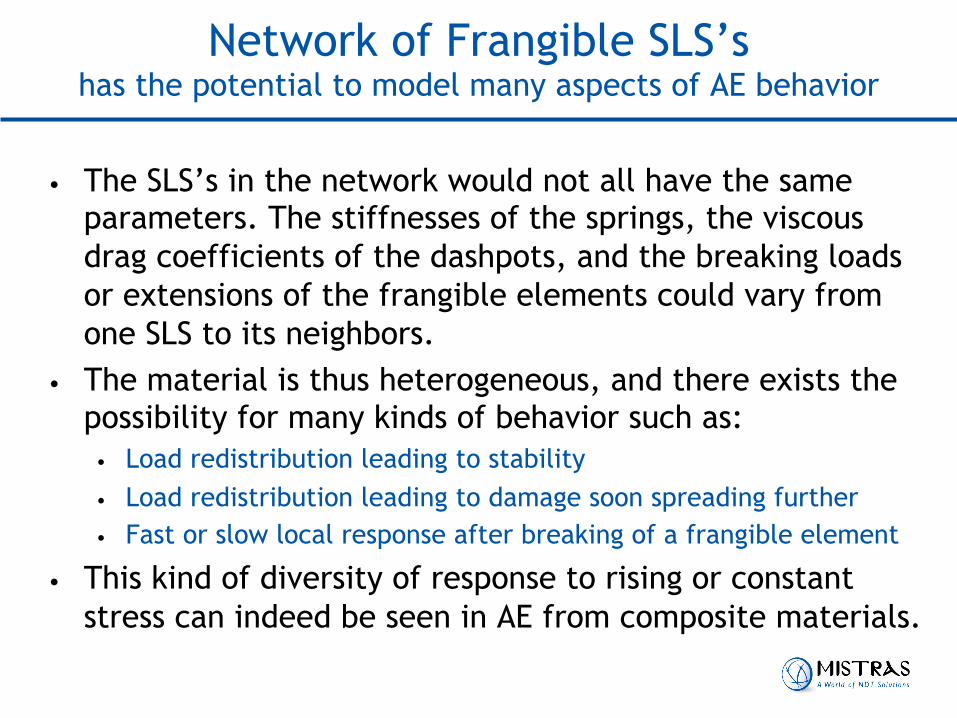
• The SLS’s in the network would not all have the same parameters. The stiffnesses of the springs, the viscous drag coefficients of the dashpots, and the breaking loads or extensions of the frangible elements could vary from one SLS to its neighbors.
• The material is thus heterogeneous, and there exists the possibility for many kinds of behavior such as: • Load redistribution leading to stability • Load redistribution leading to damage soon spreading further • Fast or slow local response after breaking of a frangible element
• This kind of diversity of response to rising or constant stress can indeed be seen in AE from composite materials.
Network of Frangible SLS’s has the potential to model many aspects of AE behavior

AE from Damage in Composites - Typical Signals
• Typical AE signals occur singly and have fast rise and slower decay. Typical AE signals occur singly and have fast rise and slower decay.
• But there are also non-typical processes, which are the
main subject of interest in this presentation.

Anatomy of some Less Common Damage Events: Foreshock (Example 1 of 3)
• Definition: a foreshock precedes the main shock and has a lower amplitude
• Here a 52 dB foreshock is followed after 500 µs by a 62 dB main shock
• The implication is that the foreshock, though relatively small in itself, triggers the main shock.

Foreshocks (Examples 2,3 3)
Example # Amplitude (Foreshock)
Amplitude (Main Shock)
InterveningTime (µs)
1 52 62 500
2 68 72 600
3 51 58 400

Same Signal Shape, Therefore Same Source
These signals had practically identical waveforms, indicating that they came from the same source. They occurred 6 ms apart, the first 7 dB larger than the second.

Plotting Time Between Hits Reveals “Cascades”

Characteristic Indication of Distress A Cascade of AE Events Indicating Difficulty Stabilizing
61% of failure load
7 closely spaced events in 21 ms at 61% of failure load

Characteristic Indication of Distress A Cascade of AE Events Following a Very Large One
10 closely spaced events in 30 ms at 68% of failure load; main shock 92 dB 10 closely spaced events in 51 ms at 68% of failure load; main shock 100 dB
68% of failure load
68% of failure load

Very Large Events are Apparent on the “Energy Account” Graph
In the first 500 s of this test – from the start until half way through the final hold – more than half of the AE energy is
The “energy account” graph has energy on both axes. It shows how the total AE energy is divided between high-energy events and low-energy events.
concentrated into three exceptionally large events. It is believed that events like these are caused by breaking of complete fiber tows, on the damage path that leads to the final failure of the test article. In the final part of this discussion we will examine what happened right after one of these exceptionally large events.

Stabilization with Continuous AE Background Energy (1)
• Gorman has observed that beyond about 60% of the failure load, the stabilization after a damage event can generate continuous emission. This emission is measured with a technique known as “background energy”.
• Background energy “oscillations” have been documented as a warning of failure.
We will examine this part of the test

Expanding the time base, we find the very large event followed by a series of six AE smaller events with the last five showing monotonically decreasing background energy. This can be an example of a “background energy oscillation”. These events took place within a timespan of 14 ms. The load is 68% of the failure load.
Stabilization with Continuous AE Background Energy (2)

Stabilization with Continuous AE Background Energy (3)
The six waveforms will next be examined in turn.

The Sequence Begins with a 100 dB Hit . . .
. . . that still shows ~100mV reverberation at the end of the waveform. The half-time of the reverberation decay is on the order of 120 µs.

The Second Hit in the Sequence . . .
. . . Has an amplitude of only 58 dB, but the waveform shows ~2 mV continuous signal both before and after the impulse. This comes far too late to be an acoustic reverberation from the 100 dB event 5.7 ms earlier.

The Third Waveform in the Sequence . . .
. . . like the second, shows continuous AE both before the crossing of the threshold and after the ringdown of the signal that caused the hit.

The Fourth Waveform in the Sequence . . .
. . . shows a double event so its end is obscured; but the pre-trigger period does hold energy greater than the background electronic level.

The Fifth Waveform in the Sequence . . .
. . . gives a hint of continuing energy release in its tail, but the signal in the pre-trigger period has fallen to the level of the background electronic noise, 14 ms after the 100 db hit.

The Sixth Waveform in the Sequence . . .
. . . is similar to the fifth; pre-trigger signal is electronic noise, and there is just a hint of AE energy release continuing into the tail.

Summary of the Stabilization Process after this Very Large Damage Event
• The initial, 100 dB damage event took place without warning. The preceding event was a full 640 ms earlier.
• Within the next 14 ms, 5 events were detected. The amplitudes of these events were in the range 56-62 dB. Apart from their status as aftershocks, these events also made it possible to observe continuous emission just above the background noise level.
• The continuous emission as the material settled after the very large (100 dB) damage event was initially about twice the level of the background electronic noise. After 9-12 ms this signal subsided into the electronic noise and was hardly perceptible.

General Summary
• Except in cases of imminent failure, acoustic emission rates decay as the material stabilizes after damage events.
• Four kinds of stabilization process can be distinguished on the basis of their timeframes and other features: • Whole-structure settling during load hold periods; time constants
observed here were on the order of 25-50 s. • “Aftershock” behavior: cascades of up to a dozen causality related
AE events (recognized by the short time between them) settling down over a timeframe on the order of 15 ms.
• Continuous type (not burst type) emission – observably persisting for ~10 ms in the wake of a large damage event.
• Examples were shown of foreshocks and a “double event” where the time separation involved was ~500 µs.
• A rudimentary micromechanics model is proposed that can in principle account for this variety of behavior.

Thank you for your attention !
Questions, Discussion ?
Related Documents