Dlt€ Acid/Base Balance osJ€*Tt1f€s , 3. 4. 5. 6. 7,i 8. 9. To deline pH and idqntrfu the normal iange of human blood pH levels. To define acrd and base, and explain what characterizes each of the fol- lowing: strong acid, weak acid, strong base, weak base. To explain how chemicaland physiological bufferingsystems help regu- latethe body's pH levels. -To define the conditions of aCidosls and alkalosis. : ' To explain the difference between respintoryacrdosis and alkalosis and metabolicacidosii and alkalosis. To understand the causes of respiratory acidosisand alkalosis. To explainhow the renalsystem compensates for respiratory acidosis and alkalosis. i To understand the causes of metabolicacidosisand alkalosis. To explain how the respiratory system compensates for metabolic aci- dosis and alkalosis. he term pH is usedto denote the hydrogen ion concentration [H+] in body fluids. pH values are the reciprocal of [H*] and follow the formula pH - log(l/[H-l) At a pH of 7 .4, [H-l is about 40 nanomolars (nl1) per liter. Because the relation- ship is reciprocal, [H*] is higher at lower pH values (indicating higher acid lev- els) and lower at higher pH values (indicating lower acid levels). The pH of a body's fluids is also referred to as its acid/base balance. An acid is a substance that releases H+ in solution (such as in body fluids). A baseo often a hydroxyl ion (OH-) or bicarbonate ion (HCO3-), is a substance that binds to H* . A strong acid is one that completely dissociatesin solution, releas- ing all of its hydrogen ions and thus lowering the solution's pH leyel. Aweak acid dissociates incompletely and does not releaseall of its hydrogen ions in solufion. A strong base has a strong tendency to bind to H*, which has the effect of rais- ing the pH value of the solution.Aryeakbase binds less of the H+, having a lesser effect on solution pH. The body's pH levels are very tightly regulated. Blood and tissue fluids nor- mally have pH values befween 7.35 and 7.45. Under pathological conditions, blood pH values as low as 6.9 or as high as 7 .8 bave been recorded; however, val- ues higher or lower than these cannot sustain human life. The narrow range of 7.35-:7.45is remarkable when one considersthe vast number of biochemical re- actions that take place in the body. The human body normally produces alarge amount of H* as the result of metabolic processes, ingested acids, and the prod- ucts of fat,.sugar, and amino acid metabolism. The regulation of a relatively con- stant intemal pH environment is one of the major physiological functions of the body's organsystems. To maintain pH homeostasis, the body utilizes both chemical and physiotog- icalbutreing sytems. Chemical buffers are composedof a mixture of weak acids and weak bases. They help regulate body pH levels by binding H+ and removing it from solution as its concentration begins to rise, or releasing H- ilto solution 129

Welcome message from author
This document is posted to help you gain knowledge. Please leave a comment to let me know what you think about it! Share it to your friends and learn new things together.
Transcript

Dlt€
Acid/Base Balance
osJ€*Tt1f€s
,
3.
4.5.
6.7,i
8.
9.
To deline pH and idqntrfu the normal iange of human blood pH levels.
To define acrd and base, and explain what characterizes each of the fol-lowing: strong acid, weak acid, strong base, weak base.
To explain how chemical and physiological buffering systems help regu-late the body's pH levels.
-To define the conditions of aCidosls and alkalosis. : '
To explain the difference between respintoryacrdosis and alkalosis andmetabolic acidosii and alkalosis.
To understand the causes of respiratory acidosis and alkalosis.
To explain how the renal system compensates for respiratory acidosisand alkalosis.
i To understand the causes of metabolic acidosis and alkalosis.
To explain how the respiratory system compensates for metabolic aci-dosis and alkalosis.
he term pH is used to denote the hydrogen ion concentration [H+] in bodyfluids. pH values are the reciprocal of [H*] and follow the formula
pH - log(l/[H-l)
At a pH of 7 .4, [H-l is about 40 nanomolars (nl1) per liter. Because the relation-ship is reciprocal, [H*] is higher at lower pH values (indicating higher acid lev-els) and lower at higher pH values (indicating lower acid levels).
The pH of a body's fluids is also referred to as its acid/base balance. Anacid is a substance that releases H+ in solution (such as in body fluids). A baseooften a hydroxyl ion (OH-) or bicarbonate ion (HCO3-), is a substance thatbinds to H* . A strong acid is one that completely dissociates in solution, releas-ing all of its hydrogen ions and thus lowering the solution's pH leyel. Aweak aciddissociates incompletely and does not release all of its hydrogen ions in solufion.A strong base has a strong tendency to bind to H*, which has the effect of rais-ing the pH value of the solution. Aryeakbase binds less of the H+, having a lessereffect on solution pH.
The body's pH levels are very tightly regulated. Blood and tissue fluids nor-mally have pH values befween 7.35 and 7.45. Under pathological conditions,blood pH values as low as 6.9 or as high as 7 .8 bave been recorded; however, val-ues higher or lower than these cannot sustain human life. The narrow range of7.35-:7.45 is remarkable when one considers the vast number of biochemical re-actions that take place in the body. The human body normally produces alargeamount of H* as the result of metabolic processes, ingested acids, and the prod-ucts of fat,.sugar, and amino acid metabolism. The regulation of a relatively con-stant intemal pH environment is one of the major physiological functions of thebody's organ systems.
To maintain pH homeostasis, the body utilizes both chemical and physiotog-icalbutreing sytems. Chemical buffers are composed of a mixture of weak acidsand weak bases. They help regulate body pH levels by binding H+ and removingit from solution as its concentration begins to rise, or releasing H- ilto solution
129

i i 'i i . .' i i , ;,
130 Exercise 10
as its concentration begins to fall. The body's three majorchemical buffering sysf.ems are the bicarbonate, phosphate,and protein buffer systems. We will not focus on chemicalbuffering systems in this lab, but keep in mind that chemicalbuffers are the fastest form of compensation and can returnpH to normal levels within a fraction of a second.
The body's two major physiological buffering systemsare the renal and respiratory systems. The renal system is theslower of the two, taking hours to days to do its work. Therespiratory system usually works within minutes, but cannothandle the amount of pH change that the renal system can.These physiological buffer systems help regulate body pH bycontrolling the output of acids, bases, or CO2 from the body.For example, if there is too much acid in the body, the renalsystem may respond by excreting more H+ from the body inurine. Similarly, if there is too much carbon dioxide in theblood, the respiratory system may respond by breathingfaster to expel the excess carbon dioxide. Carbon dioxide lev-els have a direct effect on pH levels because the addition ofcarbon dioxide to the blood results in the seneration of moreH+. The following reaction shows what hipp"nt in the respi-ratory system when carbon dioxide combines with water inthe blood:
H2O + COz ? H2CO3 e H* + HCO3-
"lo.if" bicarbonate
This is a reversible reaction and is useful for remember-ing the relationships between CO2 and H+. Note that as moreCO2 accumulates in the blood (which frequently is caused byreduced gas exchange in the lungs), the reaction moves to theright and more H- is produced, lowering the pH:
Hzo + CO2 -+H2co3-+ H+ + HCo3-
"*jff bicarbonate
Conversely, as [H*l increases, more carbon dioxide willbe present in the blood:
H2o + CO2 <- H2co3 e- H+ + Hco3-
"*if" bicarbonate
Disruptions of acid/base balance occur when the body'spH levels fall below or above the normal pH range of7.35-:7.45. When pH levels fall below 7.35, the body is saidto be in a state of acidosis. When pH levels rise above 7 .45,the body is said to be in a state of alkalosis. Respiratory aci-dosis and respiratory alkalosis are the result ofthe respira-tory systsm accumulating too much or too little carbon diox-ide in the blood. Metabolic acidosis and metabolic alkalosisrefer to a1l other conditions of acidosis and alkalosis (i.e.,those not caused by the respiratory system). The experimentsin this lab will focus on these disruptions of acid/base bal-ance, and on the physiological buffer systems (renal and res-piratory) that compensate for such imbalances (Figure 10.lband c).
Respiratory Acidosis andAlkalosisRespiratory acidosis is the result of impaired respiration, orhypoventilation, which leads to the accumulation of too muchcarbon dioxide in the blood. The causes of impaired respira-tion include airway obstruction, depression of the respiratorycenter in the brain stem, lung disease, and drug overdose. Re-call that carbon dioxide acts as an acid by forming carbonicacid when it combines with water in the body's blood. Thecarbonic acid then forms hydrogen ions plus bicarbonate ions:
H2O + CO2 -+ H2Co3 -+ H+ + HCo3-
"*if" bicarbonate
Because hypoventilation results in elevated carbon diox-ide levels in the blood, the H+ levels increase, and the pHvalue of the blood decreases.
Respiratory alkalosis is the condition of too little car-bon dioxide in the blood. It is commonly the result of travel-ing to a high altitude (where the air contains less oxygen) orhyperventilation, which may be brought on by fever or anxi-ety. Hyperventilation removes more carbon dioxide from theblood, reducing the amount of H+ in the blood and thus in-creasing the blood's pH level.
In this frst set of activities, we focus on the causes ofrespiratory acidosis and alkalosis. Follow the instructions inthe Getting Started section at the beginning of this lab man-ual. From the Main Menu, select Acid/Base Balance, Youwill see the opening screen for "Respiratory Acidosis/Alkalo-sis" (Figure 10.1). If you have already completed PhysioExExercise 7 on respiratory system mechanics, this screenshould look familiar. At the left is a pair of simulated lungs,which look like balloons, connected by a tube that looks likean upside-down Y. Air flows in and out of this tube, whichsimulates the trachea and other air passageways into thelungs. Beneath the "lungs" is a black platform simulating thediaphragm. The long, U-shaped tube containing red fluid rep-resents blood flowing though the lungs. At the top left of theU-shaped tube is a pH meter that will measure the pH level ofthe blood once the experiment is begun (experiments are be-gun by clicking the Start button at the left of the screen). Tothe right is an oscilloscope monitor, which will graphicallydisplay respiratory volumes. Note that respiratory volumesare measured in liters (l) along the Y-axis, and time in secondsis measured along the X-axis. Below the monitor are threebuttons: Normal Breathing, Hyperventilation, and Re-breathing. Clicking any one of these buttons will induce thegiven pattern of breathing. Next to these buttons are threedata displays for Pse, $artial pressure of carbon dioxide)-these will give us the levels of carbon dioxide in the bloodover the course of an experimental run. At the very bottom ofthe screen is the data collection gfid, where you may recordand view vour data after each activitv.
ItI t
; ,

Acid/Base Balance 131
Generation of HCO; causesan increase in plasrira pH
Hyperventilation Secretion of H+ intocauses a decreasein Pcoe li#S#i;'i'3i'" o*
Generation of H+ causes adecrease in plasma pH
Hypoventilation Secretion of HCO: intocauses an increase urine causes a deBreasein P^^vvo in plasma pH
(b) Respiratory and renal response to acidosis (c) Respiratory and renal response to alkalosis
p I & qi ft * 1 S.': Maintaining acid-base balance. (a) Opening screen of the RespiratoryAcidosis/Alkalosis experiment. (b) Compensatory mechanisms for acidosis. (c) Compensatory mechanismsfor alkalosis.
Exercise 10
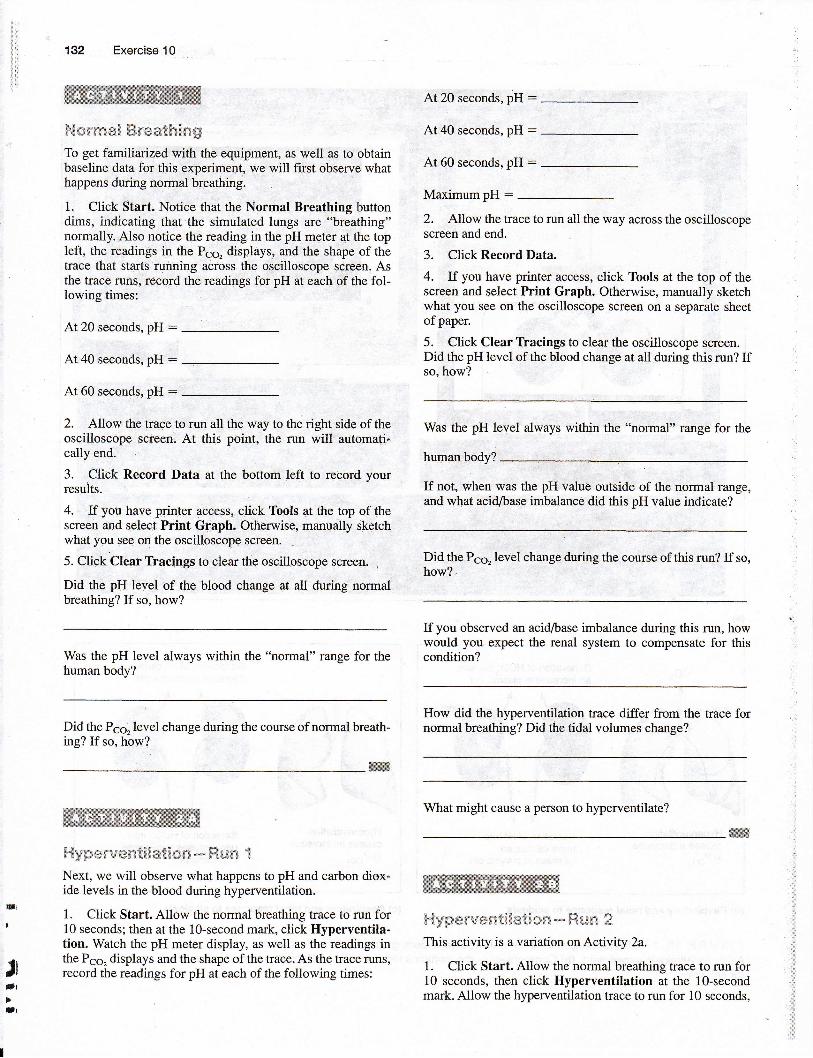
$v$*rrc*E ffir'**B*rfi*gTo get familiarized with the equipment, as well as to obtainbaseline data for this experiment, we will first observe whathappens during normal breathing.
1. Click Start. Notice that the Normal Breathing buttondims, indicating that the simulated lungs are "breathing"normally. Also notice the reading in the pH meter at the topleft, the readings in the Psq, displays, and the ghape of thetrace that starts running across the oscilloscope screen. Asthe trace runs, record the readings for pH at each of the fol-lowinE times:
At 20 seconds, pH :
At 40 seconds, pH :
At 60 seconds, pH :
2. Allow the trace to run all the way to the right side of theoscilloscope screen. At this point, the run will automati.cally end.
3. Click Record Data at the bottom left to recold yourresults.
4. If you have printer access, click Tools at the top of thescreer and select Print Graph. Otherwise, manually sketchwhat you see on the oscilloscope screen.
5. Click Clear Tbacings to clear the oscilloscope screen.
Did the pH level of the blood change at all during normalbreathing? If so, how?
Was the pH level always within the "normal" range for thehuman bodv?
Did the Pse, level change during the course of normal breath-ing? If so, how?
wffiw
$4gg:*rnw*x€{€**? *cr * ffi ax m tNext, we will observe what happens to pH and carbon diox-ide levels in the blood during hyperventilation.
1. Click Start. Allow the normal breathing trace to run for10 seconds; then at the 10-second mark, click Hyperventila-tion. Watch the pH meter display, as well as the readings inthe P66, displays and the shape of the trace. As the trace runs,record the readings for pH at each of the following times:
At 20 seconds, pH :
At 40 seconds, pH :
At 60 seconds, pH :
MaximumpH:
2. Allow the trace to run all the way across the oscilloscopescreen and end.
3. Click Record Data.
4. If you have printer access, click Tools at the top of thescreen and select Print Graph. Otherwise, manually sketchwhat you see on the oscilloscope screen on a separate sheetof paper.
5. Click Clear Tracings to clear the oscilloscope screen.Did the pH level of the blood change at all during this run? [fso. how?
Was the pH level always within the "nomal" range for the
human body?
If not, when was the pH value outside of the normal range,and what acid/base imbalance did this pH value indicate?
Did the Pqe, level change during the course of this run? If so,how?.
If you observed an acid&ase imbalance during this run, howwould you expect the renal system to compensate for thiscondition?
How did the hyperventilation trace differ from the trace fornormal breathing? Did the tidal volumes change?
What might cause a person to hyperventilate?
ffi lgp* r"vmmti f *tf wm * ffi'*v+ #.This activity is a variation on Activify 2a.
1. Click Start. Allow the normal breathing trace to run for10 seconds, then click Hyperventilation at the lO-secondmark. Allow the hyperventilation trace to run for 10 seconds,
ffiffiffi
tlf r
t
l lartt l
)Jl

then click Normal Breathing at the 2O-second mark. Allowthe trace to finish its run across the oscilloscope screen. Ob-serve the changes in the pH meter and the Pqs, displays.
2. Click Record Data.
3. If you have printer access, click Tools at the top of thescreen and select Print Graph. Otherwise, manually sketchwhat you see on the oscilloscope screen.
4. Click Clear Thacings to clear the oscilloscope screen.
Describe the trace after the 2O-second mark when youstopped the hyperventilation. Did the breathing refum to nor-mal immediately? Explain your observation.
ffi
If not, when was the pH value outside of the normal range,and what acid/base imbalance did this pH value indicate?
Acid/Base Balance l3g
Did the P6e, level change during the course of this run? If so,how?
If you observed an acid/basewould you expect the renalcondition?
imbalance during this run, howsystem to compensate for this
How did the rebreathing trace differ from the trace for normalbreathing? Did the tidal volumes change?
Give examples of respiratorypH and Ps6, pattems similarrebreathing.
problems that would result into what you observed during
ffi*hn*atk*e"rgRebreathing is the action of breathing in air that was just ex-pelled from the lungs. Breathing into a paper bag is a4 exampleof rebreathing. In this activiry we will obsewe what happens topH and carbon dioxide levels in the blood during rebreathing.
1. Click Start. Allow the normal breathing trace to ryn for10 seconds; then at the 10 second mark, click Rebreathing.Watch the pH meter display, as well as the readings in thePge, displays and the shape of the trace. As the kace runs,record the readings for pH at each of the following times:
6. To print out all of the recorded data from this activiff,click Tools and then Print Data. W
In the nexi set of activities, we will focus on the body's pri-mary mechanism of compensating for respiratory acidosii oralkalosis : renal compensation.
Renal $ystem SarnpensatianThe kidneys play a major role in maintaining fluid and elec-trolyte balance in the body's internal environment. By regu-lating the amount of water lost in the urine, the kidneys de-fend the body against excessive hydration or dehydration.By regulating the excretion of individual ions, the kidneysmaintain normal electrolyte patterns of body fluids. By reg-ulating the acidity of urine and the rate of electrolyte excre-tion, the kidneys maintain plasma pH levels within normallimits. Renal compensation is the body's pdmary method ofcompensating for conditions of respiratory acidosis or respi-ratory alkalosis. (Although the renal system also compen-sates for metabolic acidosis or metabolic alkalosis. a moreimmediate mechanism for compensating for metabolic acid/base imbalances is the respiratory system, as we will see in alater experiment.)
The activities in this section examine how the renal sys-tem compensates for respiratory acidosis or alkalosis. Theprimary variable we will be working with is Pqq, (the pa"rtialpressure of carbon dioxide in the blood). We will observehow increases and decreases in Pq6, affect the levels of [H+Jand [HCOr-] (bicarbonate) that the kidneys excrete in urine.
At 20 seconds, pH :
At 40 seconds, pH :
At 60 seconds, pH :
2. Allow the trace to run all the way across the oscilloscopescreen and end.
3. Click Record Data.
4. If you have printer access, click Tools at the top of thescreen and select Print Graph. Otherwise, manually sketchwhat you see on the oscilloscope screen.
5. Click Clear Thacings to clear the oscilloscope screen.
Did the pH level of the blood change at all during this run? Ifso, how?
Was the pH level always within the "normal" range for the
human bodv?

134 Exercise 10
FIGUSE t O.g Opening screen of the Renal Compensation experiment.
Click on Experiment at the top of the screen and selectRenal System Compensation. You will see the screenslrown in Figure t0.2. It you completed Exercise 9 on renalphysiology, this screen should look familiar. There are twobeakers on the left side of the screen, one of which is filledwith blood, simulating the body's blood supply to the kid-neys. Notice that the Pqe, level is currently set to 40, andthat the corresponding pH value is 7.4-both "normal" val-ues. By clicking Start, you will initiate the process of deliv-ering blood to the simulated nephron at the right side of thescreen. As blood flows through the glomerulus of thenephron, you will see the filtration from the plasma of every-thing except proteins and cells (note that the moving red dotsin the animation do zrol include red blood cells). Blood willthen drain from the glomerulus to the beaker at the right ofthe original beaker. At the end of the nephlon tube, you willsee the collection of urine in a small beaker. Keep in mindthat although only one nephron is depicted here, there are ac-tually over a million nephrons in each human kidney. Belowthe urine beaker are displays for H* and HCO3-, which willtell us the relative levels ofthese ions present in the urine.
$Q*na$ ffi**gx**x* €* ffi*nm**A*gdr"ffi*s* ffieEmat*ml. Increase or decrease Pco, by clicking the (-) or (*) but*tons. (Notice that as Pse, changes, so does the blood pHlevel.)
2. Click Start and allow the run to finish.
3. At the end of the run, click Record Data.At normal Pg6, and pH levels, was the level of H* presentin the urine normal?
What level of [HCOg-] was present in the urine?
It
I
Why does the blood pH value change as Pse, changes?

How does the blood pH value change as Pco, changes?
4. Click Refill to prepare for the next activity. @
ffi*sr*l fll*wp*n*m ** ffi*wpirwt*ry &$kmf**isIn this activity, we will simulate respiratory alkalosis by set-ting the Ps6, to values lower than normal (thus, blood pH willbe higher than normal). We will then observe the renal sys-tem's response to these colditions.
1. Set Pg6" to 35 by clic-king the (-) button. Notice rhat thecorresponding blood pH value is approximately 7.5.
2. Click Start.
3. At the end of the run, click Record Data.
4. Click Refill.
5. Repeat steps 1-4, setting Ps6, to increasingly lowervalues (i.e, sef Pse, to 30 and then 20, the lowest valueallowed).
What level of [H*] was present in the urine at each of thesePse"/pH levels?
What level of [HCO3-] was present in the urine at each ofthese Pse,/pH levels?
Recall that it may take hours or even days for the renal sys-tem to respond to disruptions in acid/base balance. Assumingthat enough time has passed for the renal system to fullycompensate for respiratory alkalosis, would you expect Ps6,levels to increase or decrease? Would you expect blood pHlevels to increase or decrease?
Recall your activities in the first experiment on respiratoryacidosis and alkalosis. Which type of breathing resulted inPs6, levels closest to the ones we experimented with in thisactivity-normal breathing, hyperventilation, or rebreathing?
Acid/Base Balance 135
$&*ffi** ffie*p*x*e t* ffi**p*r*€*p"y &*E*m*$mIn this activrty, we will simulate respiratory acidoiis by set-ting the Pso: values higher than normal (thus, blood pH willbe lower than normal). We will then observe the renal sys-tem's response to these conditions.
1. Make sure the left beaker is filled with blood. If not.click Refill.
2. Set Pse, to 60 by clicking the (f ) button. Notice that rhecorresponding blood pH value is 7.3.
3. Click Start.
4. At the end of the run, click Record Data.
5. Click Refill.
6. Repeat steps 1-5, setting Ps6, to increasingly higher val-ues (i.e., set Pqe, to 75 and then 90, the highest value al-lowed).
What level of [H+] was present in the urine at each of thesePqe,/pH levels?
What level of [HCO3-] was present in the urine at each ofthese Pgs,/pH levels?
Recall that it may take hours or even days for the renal sys-tem to respond to disruptions in acid/base balance. Assumingthat enough time has passed for the renal system to fullycompensate for respiratory acidosis, would you expect Pss,lqvels to increase or decrease? Would you expect blood pHlevels to increase or decrease?
Recall your activities in the first experiment on respiratoryacidosis and alkalosis. Which type of breathing resulted inP66, levels closest to the ones we experimented with in thisactivity-normal breathing, hyperventilation, or rebreathing?
Explain why this type of breathing resulted in acidosis.
7. Before going on to the next activity, select Tools and thenPrint Data in order to save a hard copy of your data results.W
Explain why this type of breathing resulted in alkalosis.
W
136 Exercise 10
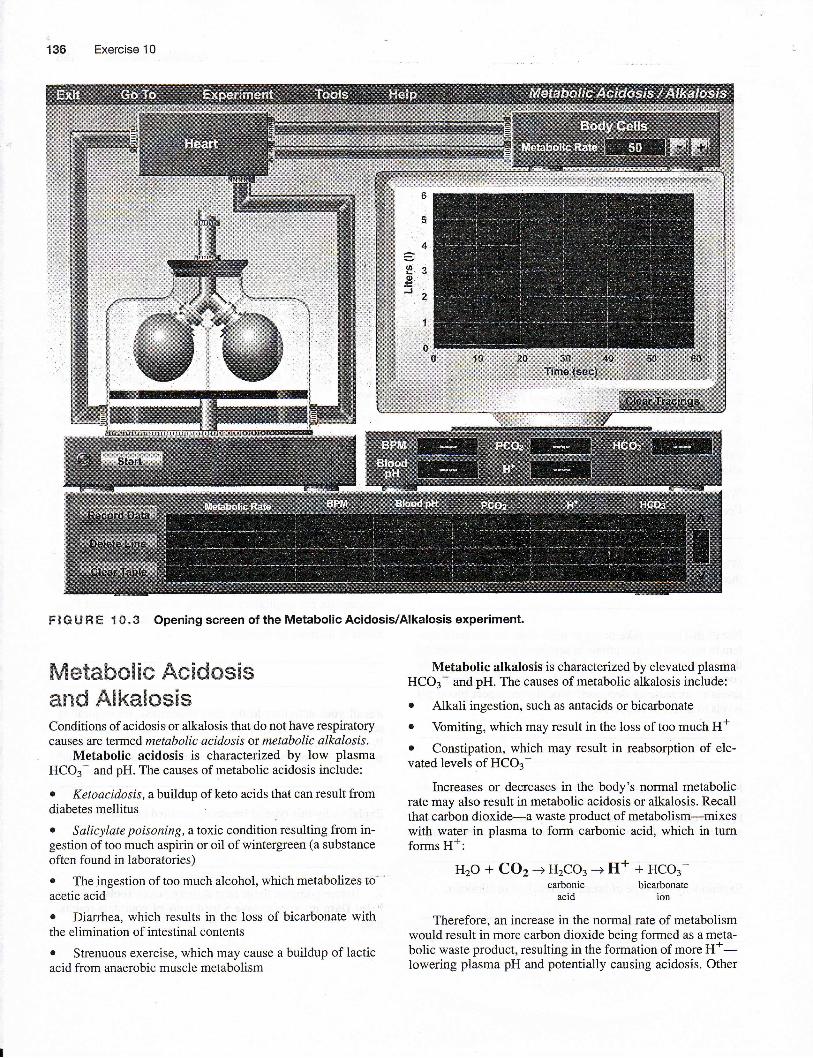
F lG U fr e '! S.3 Opening screen of the Metabolic Acidosis/Alkalosis experiment.
h#etahmlic &****sisffiild &lkml*si*Conditions of acidosis or alkalosis that do not have respiratorycauses are termed metabolic acidosis or metabolic alka.losis.
Metabolic acidosis is characterized by low plasmaHCO3- and pH. The causes of metabolic acidosis include:
o Ketoacidosis, a buildup of keto acids that can result frorndiabetes mellitus
o Salicylate poisoning,a toxic condition resulting from in-gestion of too much aspirin or oil of wintergreen (a substanceoften found in laboratories)
o The ingestion of too much alcohol, which metabolizes toacetic acid
r Diarrhea, which results in the loss of bicarbonate withthe elimination of intestinal contents
r Sffenuous exercise, which may cause a buildup of lacticacid from anaerobic muscle metabolism
Metabolic alkalosis is characterized by elevated plasmaHCO3* and pH. The causes of metabolic alkalosis include:
o Alkali ingestion, such as antacids or bicarbonate
o Vomiting, which may result in the loss of too much H+
o Constipation, which may result in reabsorption of ele-vated levels of HCO3-
Increases or decreases in the body's normal metabolicrate may also result in metabolic acidosis or alkalosis. Recallthat carbon dioxide-a waste product of metabolism-mixeswith water in plasma to form carbonic acid, which in tumforms H*:
Hzo + CO2+H2CO3 +H+ + HCo3-
"*rrf" bicarbonate
Therefore, an increase in the normal rate of metabolismwould result in more carbon dioxide being formed as a meta-bolic waste product, resulting in the formation of more H+-Iowering plasma pH and potentially causing acidosis. Other

acids that are also normal metabolic waste products, such asketone bodies and phosphoric, uric, and lactic acids, wouldlikewise accumulate with an increase in metabolic rate. Con-versely, a decrease in the normal rate of metabolism wouldresult in less carbon dioxide being formed as a metabolicwaste product, resulting in the formation of less H--raisingplasma pH and potentially causing alkalosis. Many factorscan affect the rate of cell metabolism. For example, fever,stress, or the ingestion of food all cause the rate of cell me-tabolism to increase. Conversely, a fall in body temperatureor a decrease in food intake causes the rate of cell metabolismto decrease.
The respiratory system compensates for metabolic aci-dosis or alkalosis by expelling or retaining carbon dioxide inthe blood. During metabolic acidosis, respiration increasesto expel carbon dioxide from the blood and decrease [H*] inorder to raise the pH level. During metabolic alkalosis, res-piration decreases to promote the accumulation of carbondioxide in the blood, thus increasing [H*] and decreasingthe pH level.
The renal system also compensates for metabolic acido-sis and alkalosis by conserving or excreting bicarbonate ions.However, in this set of activities we will focus on respiratorycompensation of metabolic acidosis and alkalosis.
To begin, click Experiment at the top of the screen andselect Metabolic Acidosis/Alkalosis. The screen shown inFigure 10.3 will appear. This screen is similar to the screenfrom the first experiment; the rnain differences axe the addi-tion of a box representing the heart; tubes showing the doublecirculation of the heart; and a box representing the body'scells. The default "normat'metabolic rate has been set to 50kcaVh-an arbitrary value, given that "normal" metabolicrates vary widely from individual to individual. The (+) and(-) buttons in the Body Cells box allow you to increase ordecrease the body's metabolic rate. In the following activi-ties, we will observe the respiratory response to acidosis oralkalosis brought on by increases or decreases in the body'smetabolic rate.
ffi*wpir*t*ry ffi**p*n$# g*
ffi * naw** &S *€*RsepE$*rarWe will begin by observing respiratory activity at normalmetabolic conditions. This data will serve as a baselineagainst which we will compare our data inActivities 8 and 9.
1. Make sure the Metabolic Rate is set to 50. which forthe purposes of this experiment we will consider the "nor-mal" value.
2. Click Start to begin the experiment. Notice the arrowsshowing the direction of blood flow. A graph displaying rys-piratory activity will appear on the oscilloscope screen.
3. After the graph has reached the end of the screen, the'ex-periment will automatically stop. Note the data in the dis-plays below the oscilloscope screen:
o The BPM display gives you the breaths-psv-miruils-the rate at which respiration occurred.
o Blood pH tells you the pH value of the blood.
Acid/Base Balance 137
o PCOz (shown &s P6e, in the text) tells you the partialpressure of carbon dioxide in the blood.
. H+ and IICO3- tell you the levels of each of these ionspresent.
4. Click Record Data.
5. Click Tools and then Print Graph in order to print yourgraph.
What is the respiratory rate (BMP)?
What is the blood pH?
' Are the blood pH and Pso, values within normal ranges?
6. Click Clear TFacingsactivity. ffi
before proceeding to the next
fi*xp$v"mt*fly ffi*sp#*s* t*Ev**r*ew*N ffi *effi fu#*issY?
1. Increase the metabolic rate to 60.
2. Click Start to begin the experiment.
3. Allow the graph to reach the end of the oscilloscopescreen. Note the data in the displays below the oscilloscopescreen.
4. Click Record Data.
5. Click Tools and then Print Graph in order to print yourgraph.
6. Repeat steps 1-5 with the metabolic rate set at 70, andthen 80.
As the body's metabolic rate increased:How did respiration change with respect to BPM and tidalvolume?
How did blood pH change?
How did P6e, change?
How did [H+] change?
I
How did [HCO3-] change?
138 Exercise 10
Explain why these changes took place as metabolic rateincreased. Hint: Start with the formation of excess COo wasteaad explain the changes.
Which metabolic rates caused pH levels to decrease to a con-dition of metabolic acidosis?
What were the pH values at each of these rates?
By the time tle respiratory system fully compensated for aci-dosis, how would you expect the pH values to change?
7. Click Clear Tracingsactivity. ffi
before proceeding to the next
ffi*xpBnmt*!.g ffi*sp#fl*s* g#*m*r*ws** ffiwRmfu*$$ssn
1. Decrease the metabolic rate to 40.
2. Click Start to begin the experiment.
3. Allow the graph to reach the end of the oscilloscopescreen. Note the data in the displays below the oscillo-scope screen,
4. Click Record Data.
5. Click Tools and then Print Graph in order to print yourgraph.
6. Repeat steps 1-5 with the metabolic rate set at 30, andthen 20.
As the body's metabolic rate decreased:
How did respiration change?
How did blood pH change?
How did Pse, change?
How did [H-] change?
How did [HCO3-] change?
Explain why these changes took place as the metabolicrate decreased.
Which metabolic rates caused pH levels to increase to a con-dition of metabolic alkalosis?
What were the pH values at each of these rates?
By the time the respiratory system fully compensated for alka-losis, how would you expect the pH values to change?
7. Click Tools + Print Data to print your recorded data.wffiffiffi
Related Documents