J, exp. Biol. (1982), 96, 221-237 221 With 11 figures Printed in Great Britain THE INFLUENCE OF EXPERIMENTAL ANAEMIA ON BLOOD ACID-BASE REGULATION IN VIVO AND IN VITRO IN THE STARRY FLOUNDER (PLATICHTHYS STELLATUS) AND THE RAINBOW TROUT (SALMO GAIRDNERI) BY CHRIS M. WOOD, D. G. McDONALD Department of Biology, McMaster University, Hamilton, Ontario, Canada L8S 4^1 AND B. R. McMAHON Department of Biology, University of Calgary, Calgary, Alberta, Canada T2N 1N4. (Received 27 March 1981) SUMMARY Severe experimental anaemia caused a rise in P c0 and an associated fall in pH (respiratory acidosis) in arterial and venous blood of both flounder and trout in vivo. In some trout, but not in flounder, there was also a rise in blood lactate, indicating metabolic acidosis. In vitro, blood buffer capacities declined with haematocrit, a factor which contributed to the extent of the acidoses in vivo. However, haematocrit did not influence the pK 1 of the plasma HCO3/H 2 COj system or the actual measurement of blood pH. The Donnan ratio for HCO^ varied linearly with pH over the range J-o-j-6, indicating a passive distribution of HCO^ across the trout erythrocyte. The present data, together with other recent results, indicate that the teleost red blood cell does play a role in plasma HCO3 dehydration and CO a excretion, and therefore opposes the theory of Haswell & Randall (1978) that the erythrocyte is functionally impermeable to HCO^. INTRODUCTION Current theory holds that COj excretion at the teleost gill occurs via the dehydration of plasma HCO7 by carbonic anhydrase within the gill epithelium. Erythrocytic carbonic anhydrase is thought not to be involved in this process because the red blood cell appears functionally impermeable to plasma HCOj due to the presence of an unknown plasma inhibitor (Haswell & Randall, 1976, 1978; Haswell, Zeidler & Kim, 1978; Haswell, Randall & Perry, 1980). An important piece of evidence presented in support of this theory was that blood pH and ico, levels in vivo were unaffected by massive experimental depletion of the red cells in the freshwater rainbow trout, Salmo gairdneri (Haswell & Randall, 1978; Haswell et al. 1980). However, in the seawater starry flounder, Platichthys stellatus, we have recently ^hown that similar anaemia produces significant decreases in both arterial and venous 8 EXB 96

Welcome message from author
This document is posted to help you gain knowledge. Please leave a comment to let me know what you think about it! Share it to your friends and learn new things together.
Transcript

J, exp. Biol. (1982), 96, 221-237 221With 11 figures
Printed in Great Britain
THE INFLUENCE OF EXPERIMENTAL ANAEMIA ON BLOODACID-BASE REGULATION IN VIVO AND IN VITRO IN THESTARRY FLOUNDER (PLATICHTHYS STELLATUS) AND THE
RAINBOW TROUT (SALMO GAIRDNERI)
BY CHRIS M. WOOD, D. G. McDONALD
Department of Biology, McMaster University,Hamilton, Ontario, Canada L8S 4^1
AND B. R. McMAHON
Department of Biology, University of Calgary,Calgary, Alberta, Canada T2N 1N4.
(Received 27 March 1981)
SUMMARY
Severe experimental anaemia caused a rise in Pc0 and an associated fallin pH (respiratory acidosis) in arterial and venous blood of both flounderand trout in vivo. In some trout, but not in flounder, there was also a risein blood lactate, indicating metabolic acidosis. In vitro, blood buffercapacities declined with haematocrit, a factor which contributed to theextent of the acidoses in vivo. However, haematocrit did not influence thepK1 of the plasma HCO3/H2COj system or the actual measurement ofblood pH. The Donnan ratio for HCO^ varied linearly with pH over therange J-o-j-6, indicating a passive distribution of HCO^ across the trouterythrocyte. The present data, together with other recent results, indicatethat the teleost red blood cell does play a role in plasma HCO3 dehydrationand COa excretion, and therefore opposes the theory of Haswell & Randall(1978) that the erythrocyte is functionally impermeable to HCO^.
INTRODUCTION
Current theory holds that COj excretion at the teleost gill occurs via the dehydrationof plasma HCO7 by carbonic anhydrase within the gill epithelium. Erythrocyticcarbonic anhydrase is thought not to be involved in this process because the redblood cell appears functionally impermeable to plasma HCOj due to the presenceof an unknown plasma inhibitor (Haswell & Randall, 1976, 1978; Haswell, Zeidler& Kim, 1978; Haswell, Randall & Perry, 1980). An important piece of evidencepresented in support of this theory was that blood pH and ico, levels in vivo wereunaffected by massive experimental depletion of the red cells in the freshwaterrainbow trout, Salmo gairdneri (Haswell & Randall, 1978; Haswell et al. 1980).However, in the seawater starry flounder, Platichthys stellatus, we have recently^hown that similar anaemia produces significant decreases in both arterial and venous
8 EXB 96

222 C. M. WOOD, D. G. MCDONALD AND B. R. MCMAHON
blood pH levels (Wood, McMahon & McDonald, 19796). The aim of the presentstudy was to explore the basis of this apparent difference between trout and flounderby examining the in vivo and in vitro characteristics of the blood during severeexperimental anaemia in the two species. The conclusions cast some doubt on theHaswell & Randall (1978) model of COa excretion in teleost fish.
SYMBOLS
Symbols employed for respiratory parameters follow the system of Dejours (1975)and have been defined in Wood et al. (1979a, b).
MATERIALS AND METHODS
I. Experimental animals
Starry flounder {Platichthys stellatus Pallas; 300-800 g) were collected and accli-mated for at least 10 days to running sea water (salinity = 27+ i%o, temperature =9 ± 1 °C) at Friday Harbor Laboratories, University of Washington, as describedpreviously (Wood et al. 1977, 1979a). Rainbow trout (Salmo gairdneri Richardson;100-350 g) were purchased from Spring Valley Trout Farm, Petersburg, Ontario,and acclimated for at least 2 weeks to running dechlorinated fresh water (tem-perature = 13 ± 1-5 °C) at McMaster University. Flounder were fitted with caudalartery and/or caudal vein catheters (Watters & Smith, 1973; Wood et al. 1977,1979 a) while under 1:15000 MS-222 anaesthesia. After surgery, the flounder wereallowed to recover for at least 72 h in individual chambers (30X30X 15 cm deep)which were filled to a depth of 6 cm with fine beach sand and shielded from theinvestigators. The chambers were continually flushed at > 500 ml/min with seawater ( i^o , = 125—155 torr, PT COi < i-otorr) at acclimation temperature. Duringthe whole experimental period, the flounder remained buried in the sand with onlythe eyes and mouth exposed. Trout were fitted with either dorsal aortic or ventralaortic cannulae (Smith & Bell, 1964; Holeton & Randall, 1967) while under similaranaesthesia, and allowed to recover for 36-48 h before sampling. During recoveryand subsequent experimentation, trout were held in darkened Plexiglas or woodenboxes (40 x 6 x 7 cm deep) supplied with fresh water (PIiOt = 145-175 torr; PTICO, ~2-0-3-5 t o r r ) a t > 3°° rnl/min.
II. In vivo experiments
(i) Platichthys stellatus. Two experimental series were performed. In the first(,/V = 6), flounder fitted with venous catheters only were rendered progressivelyanaemic in 4-6 stages by sequential bleeding and plasma reinfusion as describedby Wood et al. (19796). The final Ht was ~ 1 %. The fish were allowed to stabilizefor at least 24 h at each new Ht before a set of measurements (pH,, Ht, bloodlactate), was taken. In the second series (N = 12) fish representing a range of Htfrom normal to severely anaemic and bearing arterial and/or venous catheters wereexamined. The range in Ht was obtained from a combination of natural variation(Wood et al. 19796), sequential bleeding (as above), and the blood loss accompanying*
Acid-base regulation during anaemia in flounder and trout 223
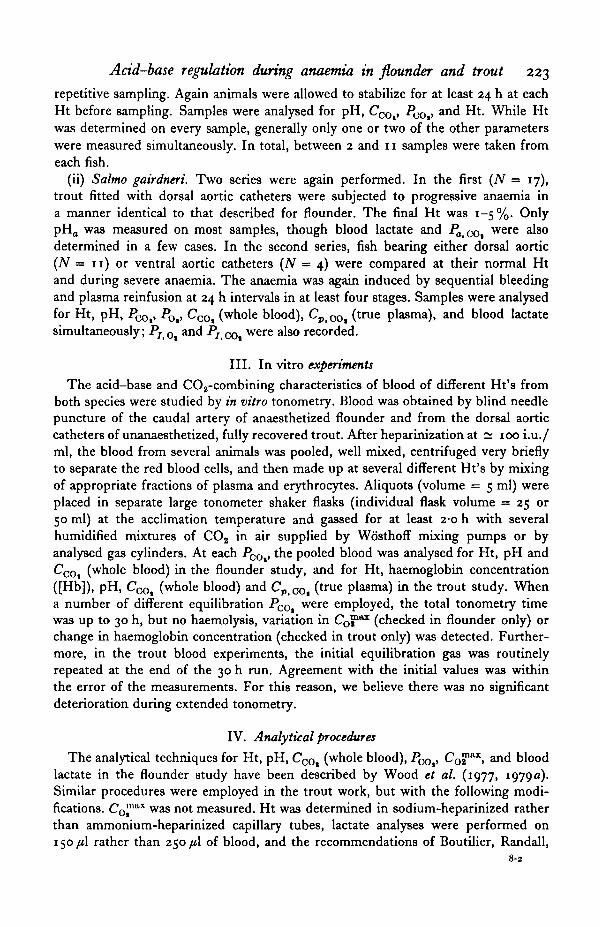
repetitive sampling. Again animals were allowed to stabilize for at least 24 h at eachHt before sampling. Samples were analysed for pH, C ^ , Z^o,, and Ht. While Htwas determined on every sample, generally only one or two of the other parameterswere measured simultaneously. In total, between 2 and 11 samples were taken fromeach fish.
(ii) Salmo gairdneri. Two series were again performed. In the first (N = 17),trout fitted with dorsal aortic catheters were subjected to progressive anaemia ina manner identical to that described for flounder. The final Ht was 1-5%. OnlypHa was measured on most samples, though blood lactate and Pa<Co, were alsodetermined in a few cases. In the second series, fish bearing either dorsal aortic(N = 11) or ventral aortic catheters (JV = 4) were compared at their normal Htand during severe anaemia. The anaemia was again induced by sequential bleedingand plasma reinfusion at 24 h intervals in at least four stages. Samples were analysedfor Ht, pH, ZQO,, POt, COOi (whole blood), CpCOt (true plasma), and blood lactatesimultaneously; PIt 0% and PT COi were also recorded.
III. In vitro experiments
The acid-base and CO2-combining characteristics of blood of different Ht's fromboth species were studied by in vitro tonometry. Blood was obtained by blind needlepuncture of the caudal artery of anaesthetized flounder and from the dorsal aorticcatheters of unanaesthetized, fully recovered trout. After heparinization at ~ 100 i.u./ml, the blood from several animals was pooled, well mixed, centrifuged very brieflyto separate the red blood cells, and then made up at several different Ht's by mixingof appropriate fractions of plasma and erythrocytes. Aliquots (volume = 5 ml) wereplaced in separate large tonometer shaker flasks (individual flask volume = 25 or50 ml) at the acclimation temperature and gassed for at least 2-0 h with severalhumidified mixtures of CO2 in air supplied by Wosthoff mixing pumps or byanalysed gas cylinders. At each Pc 0,, the pooled blood was analysed for Ht, pH andC 0 0 | (whole blood) in the flounder study, and for Ht, haemoglobin concentration([Hb]), pH, COOi (whole blood) and Cp0Ot (true plasma) in the trout study. Whena number of different equilibration Pco, were employed, the total tonometry timewas up to 30 h, but no haemolysis, variation in CQ?1*1 (checked in flounder only) orchange in haemoglobin concentration (checked in trout only) was detected. Further-more, in the trout blood experiments, the initial equilibration gas was routinelyrepeated at the end of the 30 h run. Agreement with the initial values was withinthe error of the measurements. For this reason, we believe there was no significantdeterioration during extended tonometry.
IV. Analytical procedures
The analytical techniques for Ht, pH, CCOt (whole blood), Pcot> Co?**' a n d bloodlactate in the flounder study have been described by Wood et al. (1977, 1979a).Similar procedures were employed in the trout work, but with the following modi-fications. Co™
&* was not measured. Ht was determined in sodium-heparinized ratherthan ammonium-heparinized capillary tubes, lactate analyses were performed on150/fl rather than 250 fi\ of blood, and the recommendations of Boutilier, Randall,
8-2

224 C. M. WOOD, D. G. MCDONALD AND B. R. MCMAHON
Shelton & Toews (1978) with respect to pre-equilibration of the electrode andsample replacement during PCOi measurements were followed. As a result, PCOi deter-minations were more precise on trout (reproducibility ~ ±5%) than on flounder(~ + 15%). POl (Radiometer microelectrode), [Hb] (cyanomethaemoglobin methodusing Hycel reagents), and Cv COi (true plasma) were determined only in the troutstudy. For Cv QQ the sealed haematocrit tube was broken, the plasma aspiratedanaerobically into a Hamilton syringe, and the CO2 content determined via theCameron (1971) method, as with whole blood Cco>. Blood and plasma [HCO^'s werecalculated as:
Ceo, ~ ap, 00, • ̂ co,>
where ap c 0 | is the appropriate solubility coefficient for CO2 in blood plasma(Severinghaus, 1965).
Statistical comparisons have been made on the basis of an experimental designin which each animal (at its normal Ht) is used as its own control (paired Student'stwo-tailed t test). Values are expressed as mean ± 1 s.E. (N).
RESULTS
I. In vivo experiments
(i) Platichthys stellatus. In flounder of the first series (N = 6) fitted with only avenous cannula, a highly significant (P < 0001) fall in pH,, occurred as the fishwere rendered progressively anaemic (Fig. 1 A). On average, pHp declined from7-921+0-009 at Ht = 14-2±2-0% to 7-792±0011 at Ht = 0-710-1%. The effectbecame apparent at an Ht of 5-10% and thereafter became progressively greater.Blood lactate was very low at normal Ht (< 0-30 mM) and did not increase duringanaemia, indicating no development of lactacidosis (Fig. 1B). The pH data mirrorour earlier findings in flounder encumbered with a number of cannulae, electrodes,and a ventilation mask (cf. Fig. 6 of Wood et al. 1979 ft), confirming that the pheno-menon is not an artifact of experimental disturbance.
The second series of flounder (N = 12) demonstrated that the fall in pH inducedby anaemia was associated with an increase in PCOj (Fig. 2 A, B). The effect occurredin both arterial and venous blood, but was more pronounced in the latter. In bothcases, the slopes of the regression relationships of Pco% on Ht were significantlydifferent from zero (P < 0-05), but the relationships did not appear to be linear.For this reason, the lines have been fitted by eye. In venous blood, major increasesin PCOt clearly occurred only at Ht's below 5%. There was a suggestion of a similartrend in arterial blood, but the data were unconvincing. In venous blood, COOi alsotended to increase during anaemia (Fig. 3 B; regression slope significantly differentfrom o, P < 0-05) but remained approximately stable in arterial blood (Fig. 3 A).In agreement with the lactate data (Fig. 1 B), this clearly demonstrates the absenceof a metabolic acidosis, which would have reduced [HCOj] and therefore CcQt.
Fig. 4 illustrates the strong negative correlation (r = —0-789, P < o-ooi) betweenpH and log Pcot for all simultaneous in vivo measurements of the two parameters inthis series, indicating a respiratory acidosis due to COa retention. This relationshipis still highly significant (r = 0712, P < o-coi) even when the three venous pointy

o.
Acid-base regulation during anaemia in flounder and trout 225800
7-95
7-90
7-85
7-80
7-75
0-5
0-4
0-3
0-2
01
00
3
- B
10
Ht(%)
15 20
Fig. 1. The relationships between haematocrit (Ht) and: (A) venous pH (pHr); (B) venousblood lactate concentration in six starry flounder rendered progressively anaemic. Each symbolrepresents data from a single animal.
at very low pH from severely anaemic fish are omitted. Theoretically, slightly curvi-linear relationships are expected between pH and log PCOt (e.g. Figs. 7, 10 A) inblood of a fixed Ht. The in vivo relationship will become even more curvilinear asthe fish becomes progressively anaemic and acidotic, because the slopes of the logt o , vs- pH lines decrease with Ht (e.g. Figs. 7,10 A). Consequently, a linear regressionrelationship has not been fitted to the data.
(ii) Salmo gairdneri. Of the 17 trout in the first series, pHo declined during severeanaemia in 14. For the sake of clarity, the data from individual animals have beenaveraged over 5 % Ht intervals in Fig. 5. The overall fall (N = 17) from 7-861 ± 0-008at Ht = 24-9+1-2% to 7758±o-oi7 at Ht = 2-6±o-3% was highly significant(P < o-ooi). The final Ht in trout was not as low as in flounder because deathcommonly occurred at Ht's less than ~ 2%. As with flounder (Fig. iA), theinflexion point of the pHo vs. Ht relationship was generally at an Ht of 5-10%,though there was much greater variability in the data (Fig. 5). Measurements of

226 C. M. WOOD, D. G. MCDONALD AND B. R. MCMAHON
8
0
k B
0 10 15 20 25
Ht(%)Fig. 2. The relationships between haematocrit (Ht) and: (A) arterial COj tension (Pa,cot)'t(B) venous CO| tension (P,t c^) in starry flounder at a range of Ht's from normal to severelyanaemic. Data were taken from 12 fish. The lines have been fitted by eye.
Pa,cot and blood lactate in a few of these fish suggested an upward trend in bothparameters during severe anaemia. The influence of these factors on blood acid-base status during anaemia was therefore examined in detail in a second experimentalseries.
Severe experimental anaemia again caused a significant acidosis in both arterial(Table 1; N = 11) and venous blood (Table 2; N = 4) of trout in this secondseries. In both cases, there were small but significant increases in PCOt (Tables 1, 2),indicating a definite respiratory acidosis. This effect occurred in the face of a constantP / C O | (Tables 1, 2). As an independent check, PCOt values were also calculated fromCp.co, (plasma) and pH measurements and tabulated values of pK1 (Albers, 1970)and aPico, (Severinghaus, 1965) using the Henderson-Hasselbalch equation (cf.Albers, 1970). While these calculated values were slightly different from the measuredvalues for reasons outlined in Reeves (1977), increases of comparable magnitudeagain occurred during anaemia. In about half the fish, a definite lactacidosis alsooccurred; mean blood lactate levels increased in both groups, although with greatvariability. The overall change was significant only in the arterial group which had

Acid-base regulation during anaemia in flounder and trout 22712
10
$<J
6
4
2
0
10
8
0
•vy-
• • •
10 15 20 25
Ht(%)Fig. 3. The relationships between haematocrit (Ht) and: (A) arterial whole blood COtcontent (C0ioo,)i (B) venous whole blood CO, content (C,,Co,) i" starry flounder at a rangeof Ht's from normal to severely anaemic. Data were taken from the same 12 fish as in Fig. 2,though the measurements were not all simultaneous with those in Fig. 2. The lines havebeen fitted by eye.
a larger N number than the venous group (Tables 1, 2). Nevertheless, CCOi (wholeblood) and CpCOt (plasma) declined significantly in the venous group, providingindirect evidence of metabolic acidosis (Table 2). The overall picture appears tobe that of respiratory acidosis compounded to a highly variable extent by lactacidosis.
II. In vitro experiments
(i) Salmo gairdneri. The studies with trout blood were more extensive than thosewith flounder blood, and so will be dealt with first. Fig. 6 illustrates typical linearrelationships between pH and [HCO7] in whole blood (Fig. 6A) and true plasma(Fig. 6B) for bloods of different Ht's made up from a homogeneous pool and equi-librated at a range of ico,'s- Fig- 7 illustrates, for the same samples, the expectedcurvilinear relationships between log PQQ and pH. Blood buffer capacities wereobviously functions of Ht, -AHCOj/ApH (Fig. 6) and - A log Pco/ApH (Fig. 7)both increasing with red blood cell concentration. These results emphasize that fora given change in metabolic acid (e.g. lactic) or PQQ , a greater change in pH will

228 C. M. WOOD, D. G. MCDONALD AND B. R. MCMAHON
16 i-
A.
• ^ i.
7-3 7-5 7-7
PH
7-9 8 1
Fig. 4. The relationship between blood carbon dioxide tension (Pcot> logarithmic scale) andblood pH for all simultaneous measurements of these two parameters in the same 12 starryflounder as in Figs. 2 and 3. # , Arterial; A. venous. Measurements were made at a rangeof haematocrits from normal to severely anaemic. PCo, tended to rise and pH tended tofall as haematocrit declined. The correlation coefficient (r) between pH and log Pco, was- 0 7 8 9 (JV = 46, P < 0001).
7-9 1-
7-8 -
7-7
•Y
17 S*
/
/
1717I
^ — * -
13 _
_____! I
1 1
3
1 1
10 15 20 25 30 35
Ht(%)Fig. 5. The relationship between haematocrit (Ht) and arterial pH (pHa) in 17 rainbow troutrendered progressively anaemic. For the sake of clarity, the data from individual animalshave been averaged over 5 % Ht intervals, and the resultant means ± 1 s.E. (N) plotted atthe midpoints of the intervals.
occur in anaemic blood than in blood of normal Ht. This factor must have contributedto the extent of the acidoses in vivo, where Pco> and lactate both increased (Tables 1and 2).
For any given set of incubations, the buffer lines for true plasma from differentHt's intersected at a common point where the /QO,, pH, and [HCOj] values werethe same for all Ht's (Fig. 6B, 7). For whole blood of different Ht's, the inter-section point was more diffuse than that for true plasma and always occurred at

Acid-base regulation during anaemia in flounder and trout 229
Table 1. The influence of severe experimental anaemia on blood gas and acid-baseregulation in the arterial blood of rainbow trout in vivo. Means ± 1 S.E. (N)
(N = 11)
Pi.oo, (torr)Pi, O, (torr)Haematocrit (%)pHo•P«,oo,-measured (torr)^'a.oo.-calculated (torr)Co.co.-blood (mM)
o,OOt~P ^inM;
Lactate-blood (mM)Po.0, (torr)
NOTE. Each animal was examined at normal Ht and in severe anaemia, thereby serving as its owncontrol.
• Significance of difference by Student's paired two-tailed t test.
Table 2. The influence of severe experimental anaemia on blood gas and acid-regulationin the venous blood of rainbow trout in vivo. Means ± 1 S.E. (N)
(AT = 4)
Control
2-4710-08161-512-7243 ±17
7887 I00183-4710-18391 10-29908 I047
11-2310-39
097 Ioo8131-6140
Anaemia
2'4S I 0 0 91653 ±0-9
33 ±0-87808 1OO2I
4-10 I024
456 io-2910-5010-6011 07 10-64354 ±097
1449 ±2-4
P*
n.s.n.s.
00010 0 10 0 5
0 0 50 0 1
n.s.0 0 5
0 0 2
Pi, co, (torr)P/.o, (torr)Haematocrit (%)P H ,P*. 00,-measured (torr)Pv 00,-calculated (torr)CtcOj-blood (mM)C.co,-plasma (mM)Lactate-blood (mM)P., o, (torr)
Control
2-6i lo-oii55'O±a-3206 ±4'O
7795 ±00264-6910-21408 ±062961 ±071
11-26 ±0-51• 4 5 +o-8i3 3 ' ± 6 1
Anaemia
27110-06i53-o±i-9
43 ±0-47-666 + 0-027
SS4±o-445-82 ±0908-66 ±0679-i7±o-8i462 ±240232±3-I
P*
n.s.n.s.0 0 5
00010 0 5
0 0 5
0 0 5
0 0 5
n.s.n.s.
NOTE. Each animal was examined at normal Ht and in severe anaemia, thereby serving as its owncontrol.
• Significance of difference by Student's paired two-tailed t test.
lower pH (compare Fig. 6 A with 6B) because of the unequal distribution ofacross the erythrocyte membrane (see below). If the original blood sample was notpre-equilibrated prior to tonometry, the intersection point for true plasma bufferlines of different Ht corresponded closely to the expected in vivo acid-base statusof arterial true plasma (Table 1), which would represent the conditions in the sampleprior to processing. If, on the other hand, the original blood sample was pre-equi-librated to a higher POOt before the whole separation and reconstitution procedureand its acid-base status were recorded (as in the example in Figs. 6 and 7) then theintersection point was shifted to this new, more acidotic position. Thus the inter-section point represented the pH, icxv anc^ plasma HCO^ levels of the originalblood at the time of separation.
In other words, homogeneous trout bloods of different Ht's but the same levelsof PCOi and plasma HCO^ will have identical pH's. This means that Ht does notffect the pH value (actually plasma pH) which can be read on a whole blood sample

230 C. M. WOOD, D. G. MCDONALD AND B. R. MCMAHON
18 r
15 -
12 -
r 9oX
6 -
3 -
06-8
A
\38-3%
11 896.
-
i
Whole blood
•1%
\
\
i i i
(mM
/l)
8"
1 1
7-2 7-6
1 8 r
15 -
12 -
6 -
3 -
08-0 6-8
B V 8 3 %
,231% \
11-8% ^
0-0% ^ ^
^ ^
1
True plasma
\ °
%
I I I )
7-2 7-6 8 0
pH pHFig. 6. Typical m vitro relationships between pH and bicarbonate concentrationfor (A) whole blood and (B) true plasma in homogeneous rainbow trout blood pooled fromfour animals and made up to different haematocrits. Note the common intersection pointfor the straight-line relationships between true plasma [HCOj] and pH at different haema-tocrits (Fig. 6B). Prior to separation and reconstitution, the original blood in this examplewas equilibrated to P o o , = 425 torr, producing pH •= 7640 and true plasma [HCO^] =5-99 HIM (indicated by X) which closely approximated the intersection point after separation,reconstitution, and tonometry.
with a glass electrode. More importantly, it also means that Ht does not influencethe pK1 of the plasma HCO^/H2CO8 system. Neither of these factors therefore con-tributed to the acid-base disturbance during anaemia observed in vivo (Fig. 5;Tables 1, 2). Another way of proving this point is to calculate pK1 at a range ofpH's for each Ht using the [HCO3], pH, and PCOt data and the Henderson-Hassel-balch equation (Albers, 1970). This has been done in Fig. 8 for the data from theincubations in Figs. 6 B and 7; similar relationships were seen in other incubations.Clearly, pK1, while showing the expected negative relationship with pH (Albers,1970), was independent of Ht, and variation in the calculated pKvs was a randomfunction of measurement errors.
At any given Ht, the concentrations of HCO7 for whole blood were always lessthan those for true plasma, indicating a lower [HCO^] inside than outside theerythrocyte (compare Figs. 6 A and 6B). A similar effect was seen in vivo (cf. CCOt
values in Tables 1, 2). However, for any given Ht the whole blood [HCO7] pro-gressively approached the true plasma [HCO7] as pH fell in vitro, indicating thatHCO3 distribution was influenced by pH. As a consequence, the slope of the[HCO7] vs. pH relationship, which represents the non-bicarbonate buffer capacityof the system (/? = -AHCOj/ApH), was always lower for whole blood than for

Acid-base regulation during anaemia in flounder and trout 231
100 r
32
10
3-2
38-3%
,23-1%
6-8 70 7-2 7-4
pH
7-6 7-8 80
Fig. 7. Typical tn vitro relationships between pH and COt tension (Pcot, logarithmic scale)in homogeneous rainbow trout blood at different haematocrits. Data are from the sameexample as Fig. 6; see legend of Fig. 6 for further details. Again, note the close proximity ofthe intersection point to the original equilibration acid-base status (X).
6-30 i -
6-20
610
o =00%• = 11-8%* - 2 3 1 %n =38-3%
7-0 7-2 7-4
PH
7-6 7-8 8 0
Fig. 8. Typical m vitro relationship between pH and pK1 in true plasma from homogeneousrainbow trout blood at different haematocrits. Data are from the same example as Fig. 6; seelegend of Fig. 6 for further details. Note the complete lack of effect of haematocrit on pK1.The dotted line represents the relationship for mammalian true plasma at this temperature(14 °C) reported by Albers (1970) from the data of Severinghaus, Stupfel & Bradley (1956).
232 C. M. WOOD, D. G. MCDONALD AND B. R. MCMAHON
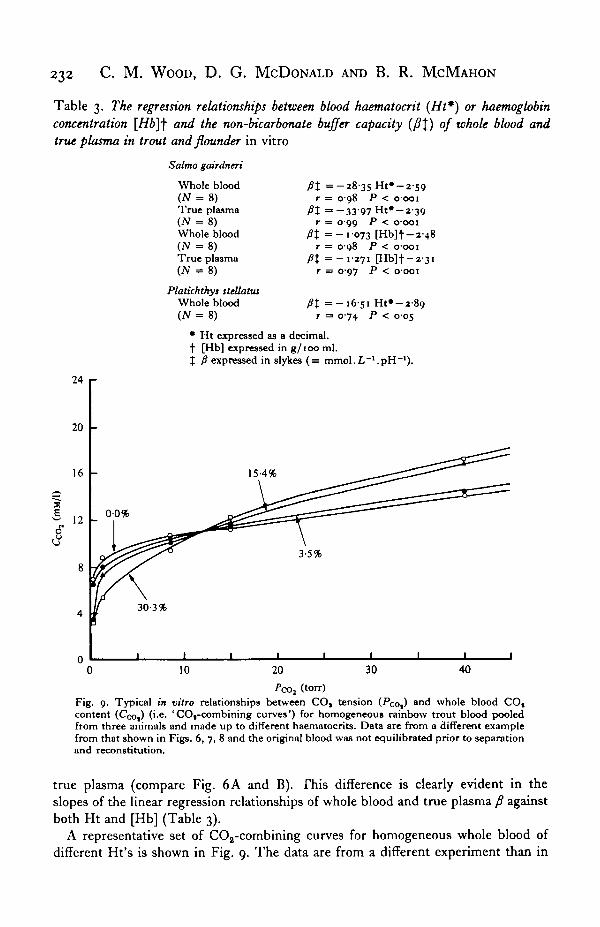
Table 3. The regression relationships between blood haematocrit (Ht*) or haemoglobin
concentration [Hb]-f and the non-bicarbonate buffer capacity (/?J) of whole blood and
true plasma in trout and flounder in vitro
Salmo gcdrdneti
Whole blood(AT = 8)True plasma(N = &)Whole blood(W = 8)True plasma
Platichtkyi ttellatuiWhole blood
ft =-28-35 Ht»-2-59r = 098 P < 0001
ft =-33-97 Ht#-2-39r = 0-99 P < o-ooi
ft =-i°73 [Hb]t-248r = 098 P < 0001
/8J = - 1 2 7 1 [Hb]t-2 '3ir = 097 P < o-ooi
At =-16-51 Ht»-2-89r = 074 P < 005
• Ht expressed as a decimal.•f- [Hb] expressed in g/ioo ml.J ^ expressed in slykes (= mmol.L"'.pH"
24 1-
20
16
12
154%
00%
30-3%
10 20 30 40
(torr)Fig. 9. Typical in vitro relationships between COj tension (Pco,) ar>d whole blood COtcontent (Ceo,) ('-e. 'COt-combining curves') for homogeneous rainbow trout blood pooledfrom three animals and made up to different haematocrits. Data are from a different examplefrom that shown in Figs. 6, 7, 8 and the original blood was not equilibrated prior to separationand reconstitution.
true plasma (compare Fig. 6A and B). This difference is clearly evident in the
slopes of the linear regression relationships of whole blood and true plasma y? against
both Ht and [Hb] (Table 3).
A representative set of COa-combining curves for homogeneous whole blood of
different Ht's is shown in Fig. 9. The data are from a different experiment than in

Acid-base regulation during anaemia in flounder and trout 233
o u
8 0
4 0
2 0
1-0
0-5
" A
- *V^^
-
-
^ ^ ^ 00%
16-0% / \ ^ V \8-7% \ V\\
107-4
0
7-6 8-2
160%
8-7%
0 2 4 6 8
/>co, (torr)Fig. 10. Typical relationships between (A) pH and COi tension (Poo,. logarithmic scale)and between (B) Pc0, and whole blood CO, content (COo,) (ie. ' CO,-combining curves')for homogeneous starry flounder blood made up to different haematocrits. The data in(A) and (B) are taken from the same set of equilibrations. The original blood was notequilibrated prior to separation and reconstitution; the low pH and high Pco. of the commonintersection point in Fig. 9A reflected the m vivo conditions at the time of blood sampling.
Figs. 6 and 7. The curves typically crossed over so that low Ht blood had a higherCCOi at low PCOt (physiological range), with the reverse at high PCOi (Fig. 9). The cross-over resulted from three interacting factors: the change in relative HCO7 distributionacross the erythrocyte with pH, the greater buffer capacity of high Ht blood whichthereby lessened the pH change, and the greater erythrocytic contribution to totalvolume with high Ht whole blood. The crossover was therefore often not as discreteas in Fig. 9. Furthermore, the position of the crossover on the PQQ axis was influencedby the original P(x>, of the blood at the time of separation (although always con-siderably higher than this value). Finally, the position of the curves on the CCOt
axis was a function of the [HCO3] of the original blood.(ii) Platichthys stellatus. While the flounder in vitro studies were less extensive
and dealt only with whole blood, they showed similar basic trends as the trout
234 C. M. WOOD, D. G. MCDONALD AND B. R. MCMAHON
data. Fig. 10 presents typical results. Blood buffering was again a function of Ht(Fig. 10 A, Table 3) though the slope of the regression relationship of /? against Htwas much lower than in trout (Table 3). The intersection point of the buffer curveswas always at a very high PCOt (8-12 torr; e.g. Fig. 10 A), reflecting the PQQ, of theoriginal blood taken from the caudal vein of anaesthetized, air-exposed flounder.The CO2-combining curves (Fig. 10B) were only measured in the physiologicalrange of PQQ , and showed an inverse relationship between Ht and CQQ^ as in troutblood (cf. Fig. 9).
DISCUSSION
The present study has shown that severe experimental anaemia induces a risein PCOt and a resultant drop in pH (respiratory acidosis) in the arterial and venousblood of both Platichthys stellatus and Salmo gairdneri. In the latter, the pH depressionis augmented by lactic acid release (metabolic acidosis) in some animals. In both, thebuffer capacity of the blood falls with anaemia, an effect which must exacerbate theacidosis. The two species therefore respond to anaemia in a similar way, and dif-ferences are only quantitative.
It is difficult to explain the disagreement between the present results and thoseof Haswell & Randall (1978) on trout, for very similar methodology was used. Themost notable difference is that Haswell & Randall (1978) simply recorded Pa<co, anc^pHa in different fish at a variety of Ht's while we employed a paired experimentaldesign which allowed each fish (at normal Ht) to serve as its own control for theeffects of anaemia. The actual changes in acid-base status occurring during anaemiain trout are relatively small, and therefore our technique had a better chance ofdetecting them. Nevertheless, using the approach of Haswell & Randall (1978), wewere still able to detect the acid-base disturbance during anaemia in the flounder.Additionally, the data of Cameron & Randall (1972) on trout also show a clearnegative correlation between Ht and Pa COi, though these authors do not comment onthe trend.
The results therefore indicate that the teleost erythrocyte does play a role inC02 excretion, presumably via dehydration of plasma HCO7 by erythrocytic carbonicanhydrase. This implies that the red cell is permeable to HCO^. Our in vitro studieson trout blood, showing a change in HCO7 distribution across the erythrocytewith pH, lend qualified support to this position. From measurements of whole bloodand true plasma CCOi and Ht, it is possible to calculate the Donnan ratio for HCO^(rHCO-) across the red blood cell membrane (cf. McDonald, Boutilier & Toews,1980). From plots such as those in Fig. 6, this calculation has been performed ata range of pH for the five trout blood samples with highest Ht; the higher the Ht, thegreater the reliability of the estimate. Interpolation of the buffer lines to commonpH (7-0, 7-2, 7-4, 7-6, 7-8) has been employed to allow averaging of the results. Themajor assumptions are that the water content of plasma is 95% and that of theerythrocyte is 70% (Eddy, 1974), that the physical solubility of C02 is the samein plasma and erythrocytic fluid, and that carbamino-CO2 is negligible. Nothingconcrete is known about the latter two assumptions in fish (Albers, 1970; Eddy,1974); errors here will affect the absolute value of the rnco- but should have minorinfluence on any relationship with pH.
Acid-base regulation during anaemia in flounder and trout 235
10 1-
8EE 0-8
3
O
80-4
0-26-8 70 7-2 7-4
PH
7-6 7-8 8-0
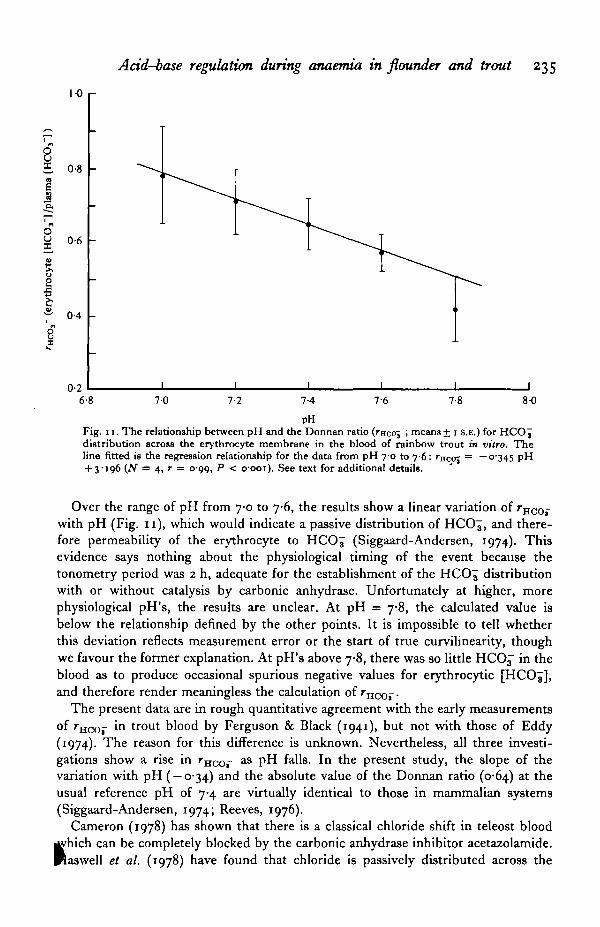
Fig. 11. The relationship between pH and the Donnan ratio (rncoj ', means + i s.E.) for H C O J
distribution across the erythrocyte membrane in the blood of rainbow trout in vitro. Theline fitted is the regression relationship for the data from pH 7 0 to 7 6 : rsca^ = —0-345 pH+ 3-196 (N = 4, r = 0-99, P < o-ooi). See text for additional details.
Over the range of pH from 7-0 to 7-6, the results show a linear variation of rnco-with pH (Fig. 11), which would indicate a passive distribution of HCO7, and there-fore permeability of the erythrocyte to HCO^ (Siggaard-Andersen, 1974). Thisevidence says nothing about the physiological timing of the event because thetonometry period was 2 h, adequate for the establishment of the HCO^ distributionwith or without catalysis by carbonic anhydrase. Unfortunately at higher, morephysiological pH's, the results are unclear. At pH = 7-8, the calculated value isbelow the relationship defined by the other points. It is impossible to tell whetherthis deviation reflects measurement error or the start of true curvilinearity, thoughwe favour the former explanation. At pH's above 7-8, there was so little HCOj in theblood as to produce occasional spurious negative values for erythrocytic [HCOj],and therefore render meaningless the calculation of rHC0-.
The present data are in rough quantitative agreement with the early measurementsof rHCOi- in trout blood by Ferguson & Black (1941), but not with those of Eddy(1974). The reason for this difference is unknown. Nevertheless, all three investi-gations show a rise in rHCO- as pH falls. In the present study, the slope of thevariation with pH ( — 0-34) and the absolute value of the Donnan ratio (0-64) at theusual reference pH of 7-4 are virtually identical to those in mammalian systems(Siggaard-Andersen, 1974; Reeves, 1976).
Cameron (1978) has shown that there is a classical chloride shift in teleost blood^'hich can be completely blocked by the carbonic anhydrase inhibitor acetazolamide.Raswell et al. (1978) have found that chloride is passively distributed across the

236 C. M. WOOD, D. G. MCDONALD AND B. R. MCMAHON
teleost red cell membrane. Obaid, Critz & Crandall (1979) have demonstrated aCI-/HCO3 exchange across the elasmobranch red blood cell and catalysis of plasma[HCO3] to CO2 by dogfish erythrocytic carbonic anhydrase. Combination of theseresults with the present findings that red cell removal causes CO2 retention in vivo,and that HCO3 seems to be passively distributed in vitro, provides a strong argumentagainst the theory of Haswell & Randall (1978).
Two pieces of evidence remain in favour of the concept that the teleost red cellis functionally impermeable to HCO^ and therefore plays no role in CO2 excretion.The first is that Haswell & Randall (1978) found no effect of severe anaemia on netCO2 excretion in trout. The weakness here is that the measurements were made24 h after the induction of anaemia. It seems likely that anaemia would cause atransitory disturbance of net CO2 excretion. The rise in blood ico,> together withthe increased delivery rate of physically dissolved CO2 to the gills by the elevatedcardiac output during anaemia (Cameron & Davis, 1970; Wood et al. 1979 ft) wouldquickly return CO2 excretion to normal. For example, Randall & Wood (1981)found that while carbonic anhydrase was important in CO2 excretion in crabs, nochange in resting CO2 excretion could be detected 12-14 h after blockade of theenzyme with acetazolamide because of a compensatory rise in the diffusion gradient.The second piece of evidence is that both trout and Tilapia red blood cells incubatedwith homologous plasma in vitro failed to dehydrate added HCO^ (Haswell &Randall, 1976; Haswell et al. 1978). This evidence is difficult to discount, becauserat red blood cells did provide normal catalysis in the same assay. Further workwill be needed to solve this problem. However, we believe the weight of evidenceshows that the fish red cell catalyses CO2 excretion in the standard mammalianfashion. This does not mean that catalysis within the gill epithelium (Haswell et al.1980) is unimportant; indeed, it seems likely that both sites are involved, providingthe system with considerable flexibility. This may explain why blood -fco, and pHlevels were not disturbed until rather severe levels of anaemia in the present study.
The in vitro results on acid-base and CO2-combining characteristics of trout andflounder blood at different Ht's deserve little further comment, for they follow thestandard pattern defined for mammalian blood (Siggaard-Andersen, 1974). However,one point which is clearly emphasized by the data is the importance of knowing, andif possible standardizing, the acid-base characteristics and Ht (or [Hb]) of theoriginal blood stock prior to tonometry. These factors can so markedly influencethe position, form, and slope of buffer and COg-combining curves as to make com-parisons virtually meaningless unless this information is known.
The regression relationships between fl and Ht or [Hb] in trout and flounder(Table 3) are presented in the hope they may be of use to other workers performingDavenport (1974) diagram-type analyses of acid-base changes in these species (e.g.Wood et al. 1977; McDonald, Hobe & Wood, 1980; McDonald, Boutilier & Toews,1980). The present trout relationship of fi vs. Ht determined on pooled blood issimilar to but probably more accurate than that reported by McDonald, Hobe &Wood (1980) for individual blood samples from the same species. The two relation-ships give very similar values of y? over the normal physiological range of Ht. How-ever in our experience Ht can fluctuate greatly due simply to swelling of the erythro-cytes with acid-base disturbance, so the use of [Hb] as an index of /? is to be preferred!in future studies. ™

Acid-base regulation during anaemia in flounder and trout 237
We thank the Director, Dr A. 0. D. Willows, and staff of Friday Harbor Labora-tories, University of Washington, for their assistance and hospitality. Financialsupport was provided by grants from the National Research Council of Canadaand the Natural Sciences and Engineering Research Council of Canada to B.R.M.and C.M.W.
REFERENCES
ALBERS, C. (1970). Acid-base balance. In Fish Physiology, vol. iv (ed. W. S. Hoar and D. J. Randall).New York: Academic Press.
BOUTILJER, R. G., RANDALL, D. J., SHELTON, G. & TOEWS, D. P. (1978). Some response characteristicsof CO, electrodes. Resp. Physiol. 32, 381-388.
CAMERON, J. N. (1971). Rapid method for determination of total carbon dioxide in small bloodsamples. J. appl. Physiol. 31, 632-634.
CAMERON, J. N. (1978). Chloride shift in fish blood. J. exp. Zool. 206, 289-295.CAMERON, J. N. & DAVIS, J. C. (1970). Gas exchange in rainbow trout (Salmo gairdneri) with varying
blood oxygen capacity. J. Fish. Res. Bd Can. 27, 1069—1085.CAMERON, J. N. 8c RANDALL, D. J. (1972). The effect of increased ambient CO, on arterial CO, tension,
CO, content and pH in rainbow trout. J. exp. Biol. 57, 673—680.DAVENPORT, H. W. (1974). The ABC of Acid-Base Chemistry, 6th ed. Chicago: University of Chicago
Press.DEJOURS, P. (1975). Principles of Comparative Respiratory Physiology. Amsterdam: North-Holland.EDDY, F. B. (1974). In vitro blood carbon dioxide of the rainbow trout (Salmo gatrdneri). Comp.
Biochem. Physiol. 47 A, 129-140.FERGUSON, J. K. W. & BLACK, E. C. (1941). The transport of CO, in the blood of certain freshwater
fishes. Biol. Bull. mar. biol. Lab., Woods Hole 80, 139—152.HASWELL, M. S. & RANDALL, D. J. (1976). Carbonic anhydrase inhibitor in trout plasma. Resp. Physiol.
28, 17-27.HASWELL, M. S. & RANDALL, D. J. (1978). The pattern of carbon dioxide excretion in the rainbow
trout Salmo gairdneri. J. exp. Biol. 72, 17-24.HASWELL, M. S., RANDALL, D. J. & PERRY, S. F. (1980). Fish gill carbonic anhydrase: acid-base
regulation or salt transport? Am. J. Physiol. 238, R240-R245.HASWELL, M. S., ZEIDLER, R. & KIM, H. D. (1978). Chloride transport in red cells of the teleost,
Tilapia mossambica. Comp. Biochem. Physiol. 61 A, 217-220.HOLETON, G. F. & RANDALL, D. J. (1967). Changes in blood pressure in the rainbow trout during
hypoxia. J. exp. Biol. 46, 297-305.MCDONALD, D. G., BOUTILIER, R. G. & TOEWS, D. P. (1980). The effects of enforced activity on
ventilation, circulation, and blood acid-base balance in the semi-terrestrial anuran Bufo marmus.J. exp. Biol. 84, 273-287.
MCDONALD, D. G., HOBE, H. & WOOD, C. M. (1980). The influence of calcium on the physiologicalresponses of the rainbow trout, Salmo gairdneri, to low environmental pH. J. exp. Biol. 88, 109—131.
OBAID, A. L., CRITZ, A. M. & CRANDALL, E. D. (1979). Kinetics of bicarbonate/chloride exchange indogfish erythrocytes. Am. J. Physiol. 237, R132-R138.
RANDALL, D. J. & WOOD, C. M. (1981). Carbon dioxide excretion in the land crab (Cardisoma carnifex).J. exp. Zool. (In Press.)
REEVES, R. B. (1976). Temperature-induced changes in blood acid-base status: Donnan ra and red• cell volume. J. appl. Physiol. 10, 762-767.
REEVES, R. B. (1977). The interaction of body temperature and acid-base balance in ectothermicvertebrates. A. Rev. Physiol. 39, 559—586.
SEVERINOHAUS, J. W. (1965). Blood gas concentrations. In Handbook of Physiology, section 3, vol. 2(ed. W. O. Fenn and H. Rahn), pp. 1475-1487. Washington, D.C.: American Physiological Society.
SEVERINCHAUS, J. W., STUPFEL, M. & BRADLEY, A. F. (1956). Variations of serum carbonic acid pK1
with pH and temperature. J. appl. Physiol. 9, 197-200.SIOAARD-ANDERSEN, O. (1974). The Acid-Base Status of The Blood, 4th ed. Copenhagen: Munksgaard.SMITH, L. S. & BELL, G. R. (1964). A technique for prolonged blood sampling in free-swimming
salmon. J. Fish. Res. Bd Can. 21, 1775-1790.WAITERS, K. W., JR. & SMITH, L. S. (1973). Respiratory dynamics of the starry flounder Platichthys
stellatus in response to low oxygen and high temperature. Marine Biology 19, 133—148.WOOD, C. M., MCMAHON, B. R. & MCDONALD, D. G. (1977). An analysis of changes in blood pH
following exhausting activity in the starry flounder, Platichthys stellatus. J. exp. Biol. 69, 173-185.WOOD, C. M., MCMAHON, B. R. & MCDONALD, D. G. (1979a). Respiratory gas exchange in the
resting starry flounder, Platichthys stellatus: a comparison with other teleosts. J. exp. Biol. 78,k 167-179.WOOD, C. M., MCMAHON, B. R. & MCDONALD, D. G. (19796). Respiratory, ventilatory, and cardio-
vascular responses to experimental anaemia in the starry flounder, Platichthys stellatus. J. exp. Biol.82, 138-162.
Related Documents