ACES: Pricing and Trading ACES: Pricing and Trading Implications Implications Praveen Kumar, Ph.D. Bank/Tenneco Professor C.T Bauer College of Business Executive Director, GEMI

ACES: Pricing and Trading Implications Praveen Kumar, Ph.D. Bank/Tenneco Professor C.T Bauer College of Business Executive Director, GEMI.
Dec 29, 2015
Welcome message from author
This document is posted to help you gain knowledge. Please leave a comment to let me know what you think about it! Share it to your friends and learn new things together.
Transcript
ACES: Pricing and Trading ACES: Pricing and Trading ImplicationsImplications
Praveen Kumar, Ph.D.
Bank/Tenneco Professor
C.T Bauer College of Business
Executive Director, GEMI

2
Markets in the CT SystemMarkets in the CT System• Primary Markets: Allowances (See Presentation by Professor Flatt)
• Auctions
• Roughly 20% of allowances auctioned cumulatively 2012-2025• This proportion doubles (40%) for 2012-2050
• Allocations:
• Proportion of free allocations rises in 2012-2016, stays about flat till 2026, and then declines at a accelerating pace to attain its lower bound in 2036
• Major sectors: Distribution of allocations is 35% for power sector, 15% for trade-exposed industrials, 9% Natural Gas sector
• Primary Markets: Offsets
• EPA Approval of recommended projects from the Offsets Advisory Board

3

4

5
Markets in the CT SystemMarkets in the CT System
• Secondary Markets:
• Spot market in allowances;
• Spot market in offsets;
• Derivative markets in allowances;
• Derivative markets in offsets (?)

6
Important AspectsImportant Aspects• Section 721(a): Vintage year emission allowances for 2012-2050,
with provisions for regulatory revisions (i.e., not a “property right”)
• No restrictions on Banking (i.e., allowances generally do not expire)
• Borrowing on Section 721(a) allowances, up-to 5 years ahead, no more than 15% of compliance obligations and subject to interest
• Market participation in Auctions and secondary markets not restricted to covered entities
• Emissions allowances, compensatory allowances and offset credits can be sold, exchanged, transferred, held for compliance, or retired
7
Basic Issues Basic Issues Pricing Drivers: Factors underlying pricing in spot and derivative
markets?
Price Discovery: Low pricing errors in the primary and secondary markets through efficient aggregation of dispersed information on allowance values
Liquidity: Relatively low-transactions costs in effecting trades, facilitating price discovery and dampening volatility
Volatility: Excessive volatility can have major economic costs by affecting (real) investment planning of capped entities
Market Manipulation: Possibilities of cornering, squeezes, strategic linked-positions (spot and futures)
8
Pricing DriversPricing DriversNet demand (demand – supply) of
allowances will depend on factors that are:
Fundamentals-related
– Level of economic activity (+)– Oil and gas price levels (+)– Cost of emission reduction (+) – Technological innovation in reducing GHG emission
in production (-)– Availability of reliable, high-performing offsets (-)
9
Pricing DriversPricing Drivers Trading-related
– Expectations of supply constrained allowance market (+)– Frictions in borrowing allowances (+) – Attempts to corner or squeeze markets in anticipation of
market disruptions (+/-)
•Regulation-related
– Regulatory discretion to increase allowance allocations (-)– Expectations on Liberalization of Standards for Offsets (-)
Implications: Allowances• The demand and supply for allowances for a regulated entity (at
any given time) in the secondary market depends on:
– Marginal cost of reducing emissions or meeting the cap by alternative methods;
– Trading price;
– The stock of allowances outstanding (depends on the stock of non-surrendered allowances plus permits banked from previous years plus permits borrowed from future years);
11
Implications: Allowances Implications: Allowances • The Cap starts at 97% of 2005 emissions and declines to 17% of
2005 emissions by 2050
• Consumer emissions of electric and gas LDCs will be included as part of their emissions
• Although overall emissions declined in 2006-2008, certain high GHG-emitting industries, such as upstream O&G, are at a higher level in 2008-2009 because of higher drilling activity etc.
• With the economic recovery in 2010+ time-frame, the cap may become binding for many sectors:
• Electricity LDCs and Merchant Coal Generators
• Oil (upstream and downstream)
• Gas LDCs

12
Implications: Allowances Implications: Allowances
• Substantial free allowance allocation to these sectors will lower their immediate cost exposure but forward projection will indicate difficulties in controlling emissions in the short-to-medium run
• For a gas LDC, emissions will fall only if either customers use less gas or there is a significant increase in energy consumption efficiency
• Resumption of economic growth and customers switching from coal to gas will actually increase gas consumption (higher emissions) while increased consumption efficiency has an uncertain trajectory
• ACES has no provision as of now to incent customer investment in consumption efficiency or provide a rate recovery mechanism for investment by LDCs

13
Implications: Allowances Implications: Allowances
• For the O&G industry, ongoing economic recovery of India and China, and anticipated acceleration of recovery in US in 2010, raises expectations of resumption of drilling activity and increased capacity utilization in refining plants
• Availability of technologies to substantially reduce GHG emissions in E&P and refining at reasonable costs appears unlikely even in the medium term
• Upshot: Likely allowance banking (hoarding) initially (2012-) by firms in the major regulated sectors
• The decline in the cap will therefore imply a tendency toward a supply-constrained market, based on the fundamentals-related factors
14
• Supply constraints on allowances may be relaxed if:
• Rapid progress in technological innovation and development of offsets leading to sharp declines in costs of reducing emissions
• Amendments in the legislation substantially increase allocations to “non-merchant” power sector: public power companies, electricity coops etc.
• Legislation puts caps on rate increases across the board (effectively equals additional allocations)
• Regulators are forced to revise rules for accessing the strategic allowance reserve fund to lower costs (political pressure), dampen volatility etc.
• There is substantial participation in the auctions by non-regulated entities and there is (occasional) forced liquidation of holdings
• The economic recovery is anemic and the slump is much longer and deeper than being currently projected

15
Pricing Trends: Allowances Pricing Trends: Allowances
• Initial price discovery in the auctions process and eventually in the futures markets (the Treasury bill market is a good model here)
• Futures markets lead price discovery in the EU ETS system
• Possibility of over-pricing early on because of limited information, over-estimation of supply constraints, and the winners curse problem
• Winners curse: Winners in auctions ignore less optimistic signals of other bidders ( “I’ll never join a club that accepts my membership”…Groucho Marx)
• Possibility of a (minor) “bubble and burst” price trajectory in the initial phase of the program
• However, underlying trend likely to be positive in the medium-run, 2012-2025

16
The EU Experience: Phase I The EU Experience: Phase I
• Phase I covered January 2005-December 2007 and all 15 member countries participated
• Covered about 12,000 installations, representing approximately 40% of EU CO2 emissions, covering energy activities, production and processing of ferrous metals, mineral industry (cement clinker, glass and ceramic bricks) and pulp, paper and board activities
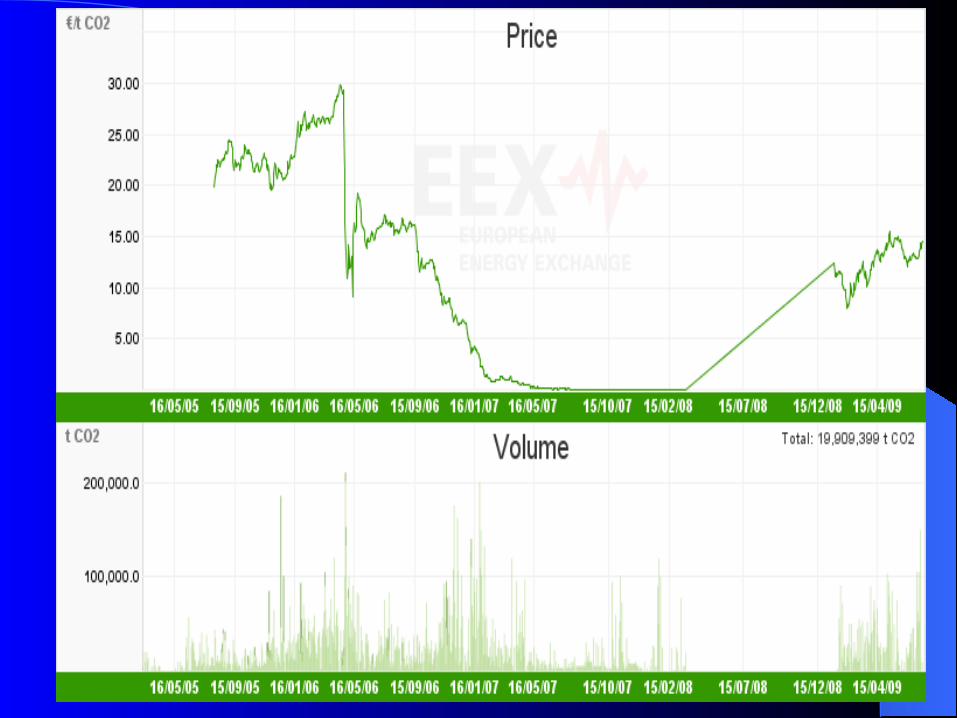
• Price of allowances increased (almost steadily) to a peak level in April 2006 of about €30/ton of CO2
• Prices collapsed in May 2006 to under €10/ton when revealed registries indicated that caps in most countries were generous and allocations were often in excess of business-as-usual emission levels
• Excess (potential) supply of allowances in Phase I continued through 2006 resulting in a trading price of €1.2/ton in March 2007, declining to €0.10 in September 2007
17
The EU Experience: Phase II The EU Experience: Phase II
• Phase II covers January 2008-December 2011
• Expands participation to some non-EU states (e.g., Norway) and expands coverage: Aviation industry is the major new industry to be covered
• Based on the Phase I experience, emission caps tightened, and each country has to get its allocation scheme approved by EU
• Introduced auctions (up-to 10%)
• Prices rose steadily during 2008 and have tracked expectations on economic recovery in 2009
18
Comparison with the ACES SystemComparison with the ACES System• The ACES has allocation and auction targets that are based on much
more aggressive emission reduction targets (17% reduction of 2005 levels by 2025, 83% by 2050) compared to the EU Phase I
• Moreover, the linkage of allocations and auction proportions to these targets is much more transparent than was the case in EU Phase I
• The coverage under ACES also much broader than the EU Phase I coverage
• Thus, lower likelihood of a major “bubble and bust” in the US allowance markets, unlike the May 2006 experience in EU ETS
• However, ACES gives significantly greater role to offsets than EU ETS
• Regulatory uncertainty is greater in the implementation of ACES
Pricing of OffsetsPricing of Offsets
• Basics: Buying an offset is buying a long-term asset that has risky payoffs:
– The “payoff” from the offset in any given year is the incremental saving meeting the emission target/cap through the credit from the offset versus
– Meeting the cap through (costly) activities at the business level or
– Buying an allowance in the future spot market;

Pricing of OffsetsPricing of Offsets
• Example: Greenhouse Galore, Inc. has bought offset in 2011. In 2012, the offset is expected to provide a credit of 100,000 metric tons of CO2 equivalent;
• The company amortizes the purchase price of the offset so that cost per ton of credit in 2012 is $12.
• The company expects that the average price of allowances in the spot market in 2012 to be $20/metric ton of CO2 equivalent;
• Also in 2012, the estimated cost of reducing emissions internally is $35/metric ton of CO2 equivalent;
• The “opportunity gain” of having the offset for 2012 is
= 100,000 x (20-12) = $8,00,000
Pricing of OffsetsPricing of Offsets
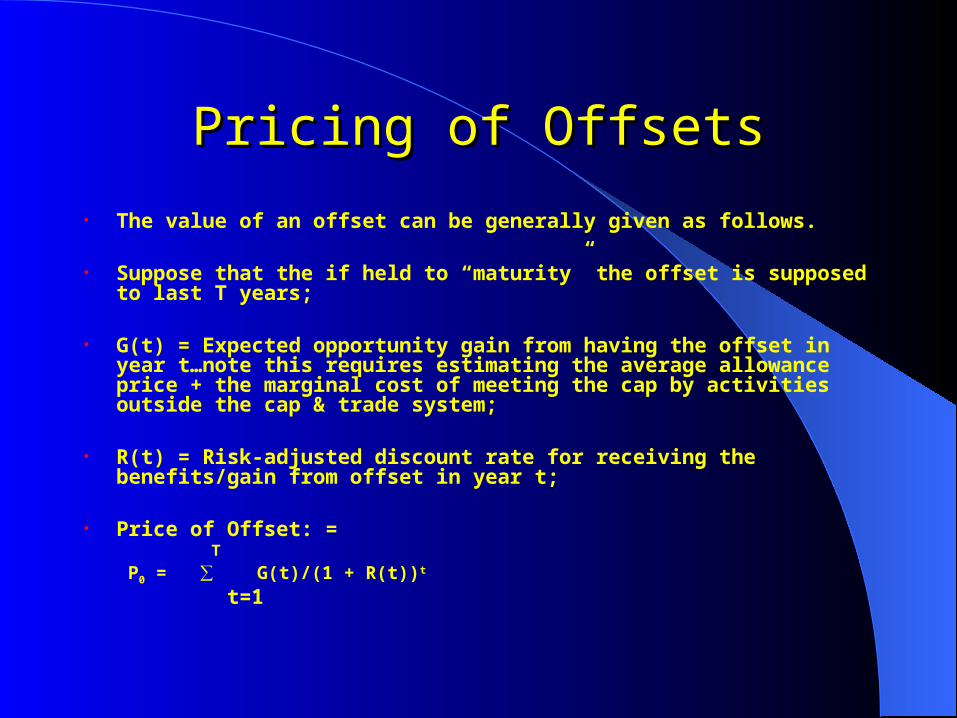
• The value of an offset can be generally given as follows.
• Suppose that the if held to “maturity” the offset is supposed to last T years;
• G(t) = Expected opportunity gain from having the offset in year t…note this requires estimating the average allowance price + the marginal cost of meeting the cap by activities outside the cap & trade system;
• R(t) = Risk-adjusted discount rate for receiving the benefits/gain from offset in year t;
• Price of Offset: = T
P0 = ∑ G(t)/(1 + R(t))t t=1

Pricing of OffsetsPricing of Offsets
• The risk-adjusted discount rate captures:
• $-value of waiting (risk-less interest rate);
• The return from investing in an asset that has the same risk-profile as the offset ;
• In practice, expect
R(t) = Cost of Capital (for the company) + Risk-Premium

Pricing of OffsetsPricing of Offsets
• The Risk-premium will depend on:
• The non-insurable or non-diversifiable failure risk from the offset;
• Note: If the firm has to buy insurance or do costly hedging against failure risk, then those expenses have to be deducted from G(t) ;
• Risk-premium depends on:
Uninsurable performance risk of projects (+);
Regulatory risk (changing rules ex post) (+);
Presence of strong legal framework to protect against performance risk (-)
Effects of Offsets on Allowance PricesEffects of Offsets on Allowance Prices• Offsets and allowances are imperfect substitutes for meeting
emission compliance obligations:
• Unless there is significant ex-post (after issue) regulatory revisions, allowances can vary only in market value
• Offset projects may typically require on-going monitoring and investment
• In the event of performance failure, there may be significant legal and administrative costs
• Hence, offsets pose not only market value risk, but cash flow risk (e.g., unanticipated monitoring, investment or legal costs during tight cash flow periods)
• Generally, expect allowance markets to be more liquid and have better price discovery (e.g., from the futures markets) compared to offsets markets

Effects of Offsets on Allowance PricesEffects of Offsets on Allowance Prices• But the offsets market will be subject to much greater “regulatory
revisions”
• Expansion of lists of acceptable projects
• Changes in the approval process
• Modifications in the liability-incidence (who pays for performance failures etc.) in response to legal challenges and decisions
• Expansion/modification of cross-border (international) fungibility of offset credits as cap and trade markets are established in an increasing number of countries
• Possibility of frequent significant mis-alignment of expectations and outcomes in the offsets market
• Regulatory uncertainty in offsets likely to be a major driver for price volatility in allowance markets

27
Market Manipulation Scenarios Market Manipulation Scenarios
• The possibility of manipulation and “market gaming” increases if :
– Assets that are economically similar (in terms of cost of access and revenue potential, for example) are differentiated by regulatory fiat:
Assets in certain geographic areas are inadmissible Early emission reductions are valued more (e.g., California) Offset value caps (e.g., 3.5% limit on offsets against cap in RGGI) Cap allocation based on complex rules (firm history, industry location etc.)
– Market regulators are known to have ex post discretion to alter trading rules based on specified market developments (e.g., bailouts or loan forgiveness when markets are stressed);
Related Documents