International Journal of Scientific & Engineering Research, Volume 5, Issue 7, July-2014 1283 ISSN 2229-5518 IJSER © 2014 http://www.ijser.org Estimation of Runoff by using SCS Curve Number Method and Arc GIS Ashish Bansode, K. A. Patil Abstract— Rainfall and runoff are important components contributing significantly to the hydrological cycle, design of hydrological structures and morphology of the drainage system. Estimation of the same is carried out to determine and forecast its effects. Estimation of direct rainfall-runoff is always efficient but is not possible for most of the location in desired time. Use of remote sensing and GIS technology can be useful to overcome the problem in conventional methods for estimating runoff. In this paper, modified Soil Conservation System (SCS) CN method is used for runoff estimation that considers parameter like slope, vegetation cover, area of watershed. Index Terms— Arc GIS, AMC, ERDAS, GP-3, Remote Sensing, SCS-CN, SOI. —————————— —————————— 1 INTRODUCTION Runoff is one of the most important hydrologic variables used in most of the water resources applications. Its occur- rence and quantity are dependent on the characteristics of rainfall event, i.e. the intensity, duration and distribution. Apart from these rainfall characteristics, there are number of catchment specific factors, which have a direct effect on the occurrence and volume of runoff. This includes soil type, veg- etation cover, slope and catchment type. SCS-CN provides an empirical relationship for estimating initial abstraction and runoff as a function of soil type and land-use. Curve Number (CN) is an index developed by the Natural Resource Conser- vation Service (NRCS), to represent the potential for storm water runoff within a drainage area. The CN for a drainage basin is estimated using a combination of land use, soil, and antecedent soil moisture condition (AMC). There are four hydrologic soil groups: A, B, C and D. Group A have high in- filtration rates and group D have low infiltration rates. The Soil Conservation Service Curve Number (SCS-CN) method is widely used for predicting direct runoff volume for a given rainfall event. This method was originally developed by the US Department of Agriculture, Soil Conservation Service and documented in detail in the National Engineering Handbook, Sect. 4: Hydrology (NEH-4) SCS, 1956, 1964, 1971, 1985, 1993). Due to its simplicity, it soon became one of the most popular techniques among the engineers and the practitioners, mainly for small catchment hydrology (Mishra and Singh, 2006).The main reasons for its success is that it accounts for many of the factors affecting runoff generation including soil type, land use and treatment, surface condition, and antecedent moisture condition, incorporating them in a single CN parameter. Furthermore, it is the only methodology that features readily grasped and reasonably well documented environmental inputs and it is a well-established method, widely accepted for use in the United States and other countries. On the other hand, the SCS-CN main weak points are the following: it does not consider the impact of rainfall intensity and its temporal distribution, it does not address the effects of spatial scale, it is highly sensitive to changes in values of its sole parameter; and it does not address clearly the effect of adjacent moisture condition (Hawkins, 1993; Ponce and Hawkins, 1996, Michel et al., 2005). 2 DESCRIPTION OF STUDY AREA The study area is bounded by north latitude 19 0 9 ’ 98 ’’ to 20 0 21 ’ and east longitudes 75 0 16 ’ 7 ’’ to 75 0 39’3” falls in the Khuldabad taluka of Aurangabad district in Maharashtra and covered by survey of India toposheet no.46 P/4, 46 P/8, and 47 M/1, 47 M/5 with scale of 1:50,000. The Average annual rainfall of the area is about 707.94 mm. The mean maximum and minimum temperatures recorded in the area are 44 0 C and 9 0 C. location of study area of the watershed is shown in fig. 2.1 while also a toposheet image and LISS-III image of the watershed are shown below it. The total area of the watershed as computed using Arc GIS is 339.75 Km 2 . Towards the west of the catch- ment is a small local hill station which is mostly covered with scrubs and forest with uneven or gentle slope contributes mostly for the surface runoff. Further towards north lies some small developed villages and towns with surfaced roads and people are mostly involved in agriculture activities. The east- ern part has mostly been covered with barren land due to un- even topography of the surface contrary to which the south- west part of the watershed has good ground water potential and even surface land due to which cultivation and livestock practices are being carried out. Almost 90% of the soil is of sandy loam type. The catchment is situated at an elevation of 857 m from the mean sea level. It is situated at about 25 km from the Au- rangabad city in Maharashtra state. The catchment is further classified in 10 mini watersheds. Some of the notable villages within the Khuldabad Taluka are Sirodi, Kingaon, Jafarwadi, Shankarpurwadi, Khirdi, Mahismal, Daregaon, Bajar Sawangi etc. which constitute overall 45 villages. ———————————————— • Author name is Ashish Bansode currently pursuing masters degree pro- gram in Civil (Water Resource) Engineering in Dr.Babasaheb Ambedkar Marathwada University,(M.S.) India, PH- +919850830042. E-mail: au- thor_ [email protected] IJSER

Welcome message from author
This document is posted to help you gain knowledge. Please leave a comment to let me know what you think about it! Share it to your friends and learn new things together.
Transcript

International Journal of Scientific & Engineering Research, Volume 5, Issue 7, July-2014 1283 ISSN 2229-5518
IJSER © 2014 http://www.ijser.org
Estimation of Runoff by using SCS Curve Number Method and Arc GIS
Ashish Bansode, K. A. Patil
Abstract— Rainfall and runoff are important components contributing significantly to the hydrological cycle, design of hydrological structures and morphology of the drainage system. Estimation of the same is carried out to determine and forecast its effects. Estimation of direct rainfall-runoff is always efficient but is not possible for most of the location in desired time. Use of remote sensing and GIS technology can be useful to overcome the problem in conventional methods for estimating runoff. In this paper, modified Soil Conservation System (SCS) CN method is used for runoff estimation that considers parameter like slope, vegetation cover, area of watershed.
Index Terms— Arc GIS, AMC, ERDAS, GP-3, Remote Sensing, SCS-CN, SOI.
—————————— ——————————
1 INTRODUCTION Runoff is one of the most important hydrologic variables used in most of the water resources applications. Its occur-rence and quantity are dependent on the characteristics of rainfall event, i.e. the intensity, duration and distribution. Apart from these rainfall characteristics, there are number of catchment specific factors, which have a direct effect on the occurrence and volume of runoff. This includes soil type, veg-etation cover, slope and catchment type. SCS-CN provides an empirical relationship for estimating initial abstraction and runoff as a function of soil type and land-use. Curve Number (CN) is an index developed by the Natural Resource Conser-vation Service (NRCS), to represent the potential for storm water runoff within a drainage area. The CN for a drainage basin is estimated using a combination of land use, soil, and antecedent soil moisture condition (AMC). There are four hydrologic soil groups: A, B, C and D. Group A have high in-filtration rates and group D have low infiltration rates. The Soil Conservation Service Curve Number (SCS-CN) method is widely used for predicting direct runoff volume for a given rainfall event. This method was originally developed by the US Department of Agriculture, Soil Conservation Service and documented in detail in the National Engineering Handbook, Sect. 4: Hydrology (NEH-4) SCS, 1956, 1964, 1971, 1985, 1993). Due to its simplicity, it soon became one of the most popular techniques among the engineers and the practitioners, mainly for small catchment hydrology (Mishra and Singh, 2006).The main reasons for its success is that it accounts for many of the factors affecting runoff generation including soil type, land use and treatment, surface condition, and antecedent moisture condition, incorporating them in a single CN parameter. Furthermore, it is the only methodology that features readily grasped and reasonably well documented environmental inputs and it is a well-established method, widely accepted for
use in the United States and other countries. On the other hand, the SCS-CN main weak points are the following: it does not consider the impact of rainfall intensity and its temporal distribution, it does not address the effects of spatial scale, it is highly sensitive to changes in values of its sole parameter; and it does not address clearly the effect of adjacent moisture condition (Hawkins, 1993; Ponce and Hawkins, 1996, Michel et al., 2005).
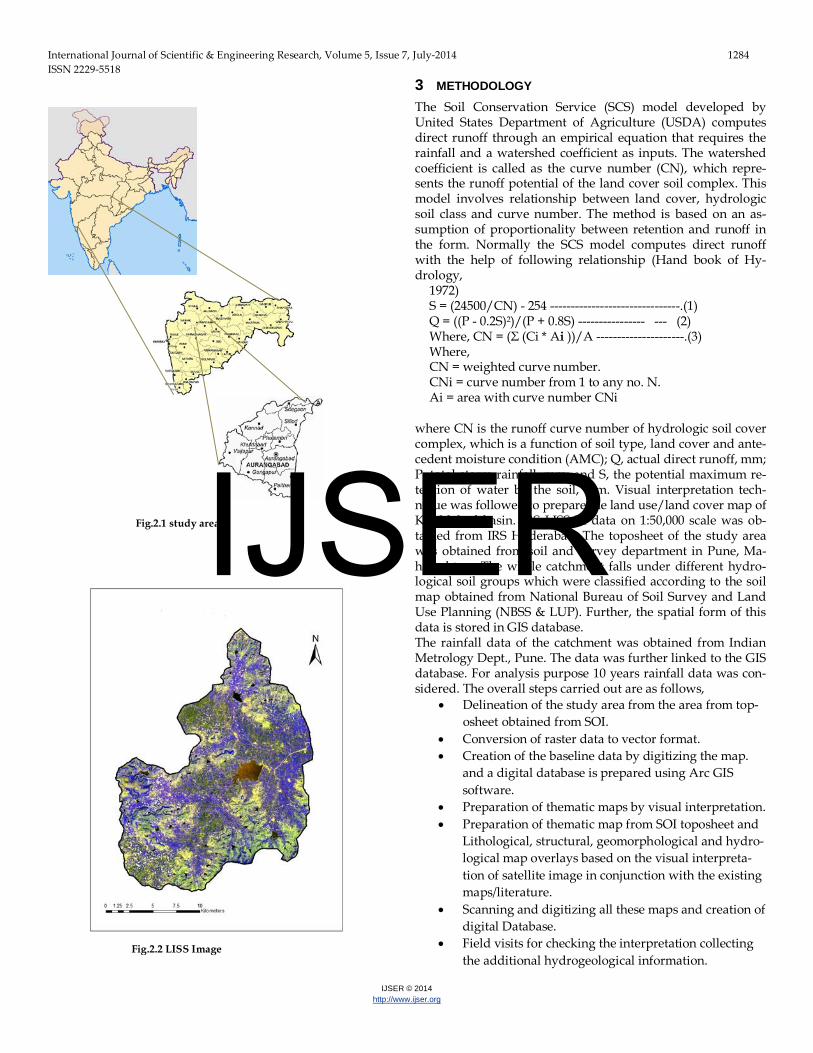
2 DESCRIPTION OF STUDY AREA The study area is bounded by north latitude 190 9’ 98’’ to 20021’ and east longitudes 75016’7’’ to 75039’3” falls in the Khuldabad taluka of Aurangabad district in Maharashtra and covered by survey of India toposheet no.46 P/4, 46 P/8, and 47 M/1, 47 M/5 with scale of 1:50,000. The Average annual rainfall of the area is about 707.94 mm. The mean maximum and minimum temperatures recorded in the area are 440 C and 90 C. location of study area of the watershed is shown in fig. 2.1 while also a toposheet image and LISS-III image of the watershed are shown below it. The total area of the watershed as computed using Arc GIS is 339.75 Km2. Towards the west of the catch-ment is a small local hill station which is mostly covered with scrubs and forest with uneven or gentle slope contributes mostly for the surface runoff. Further towards north lies some small developed villages and towns with surfaced roads and people are mostly involved in agriculture activities. The east-ern part has mostly been covered with barren land due to un-even topography of the surface contrary to which the south-west part of the watershed has good ground water potential and even surface land due to which cultivation and livestock practices are being carried out. Almost 90% of the soil is of sandy loam type.
The catchment is situated at an elevation of 857 m from the mean sea level. It is situated at about 25 km from the Au-rangabad city in Maharashtra state. The catchment is further classified in 10 mini watersheds. Some of the notable villages within the Khuldabad Taluka are Sirodi, Kingaon, Jafarwadi, Shankarpurwadi, Khirdi, Mahismal, Daregaon, Bajar Sawangi etc. which constitute overall 45 villages.
———————————————— • Author name is Ashish Bansode currently pursuing masters degree pro-
gram in Civil (Water Resource) Engineering in Dr.Babasaheb Ambedkar Marathwada University,(M.S.) India, PH- +919850830042. E-mail: au-thor_ [email protected]
IJSER
International Journal of Scientific & Engineering Research, Volume 5, Issue 7, July-2014 1284 ISSN 2229-5518
IJSER © 2014 http://www.ijser.org
Fig.2.1 study area
3 METHODOLOGY The Soil Conservation Service (SCS) model developed by United States Department of Agriculture (USDA) computes direct runoff through an empirical equation that requires the rainfall and a watershed coefficient as inputs. The watershed coefficient is called as the curve number (CN), which repre-sents the runoff potential of the land cover soil complex. This model involves relationship between land cover, hydrologic soil class and curve number. The method is based on an as-sumption of proportionality between retention and runoff in the form. Normally the SCS model computes direct runoff with the help of following relationship (Hand book of Hy-drology,
1972) S = (24500/CN) - 254 -------------------------------.(1) Q = ((P - 0.2S)2)/(P + 0.8S) ---------------- --- (2) Where, CN = (Σ (Ci * Ai ))/A ---------------------.(3) Where, CN = weighted curve number. CNi = curve number from 1 to any no. N. Ai = area with curve number CNi
where CN is the runoff curve number of hydrologic soil cover complex, which is a function of soil type, land cover and ante-cedent moisture condition (AMC); Q, actual direct runoff, mm; P, total storm rainfall, mm; and S, the potential maximum re-tention of water by the soil, mm. Visual interpretation tech-nique was followed to prepare the land use/land cover map of Khuldabad basin. IRS LISS-III data on 1:50,000 scale was ob-tained from IRS Hyderabad. The toposheet of the study area was obtained from soil and survey department in Pune, Ma-harashtra. The whole catchment falls under different hydro-logical soil groups which were classified according to the soil map obtained from National Bureau of Soil Survey and Land Use Planning (NBSS & LUP). Further, the spatial form of this data is stored in GIS database. The rainfall data of the catchment was obtained from Indian Metrology Dept., Pune. The data was further linked to the GIS database. For analysis purpose 10 years rainfall data was con-sidered. The overall steps carried out are as follows,
• Delineation of the study area from the area from top-osheet obtained from SOI.
• Conversion of raster data to vector format. • Creation of the baseline data by digitizing the map.
and a digital database is prepared using Arc GIS software.
• Preparation of thematic maps by visual interpretation. • Preparation of thematic map from SOI toposheet and
Lithological, structural, geomorphological and hydro-logical map overlays based on the visual interpreta-tion of satellite image in conjunction with the existing maps/literature.
• Scanning and digitizing all these maps and creation of digital Database.
• Field visits for checking the interpretation collecting the additional hydrogeological information.
Fig.2.2 LISS Image
IJSER
International Journal of Scientific & Engineering Research, Volume 5, Issue 7, July-2014 1285 ISSN 2229-5518
IJSER © 2014 http://www.ijser.org
• Incorporation of field observations in the thematic
maps. • Final output generation using GIS software.
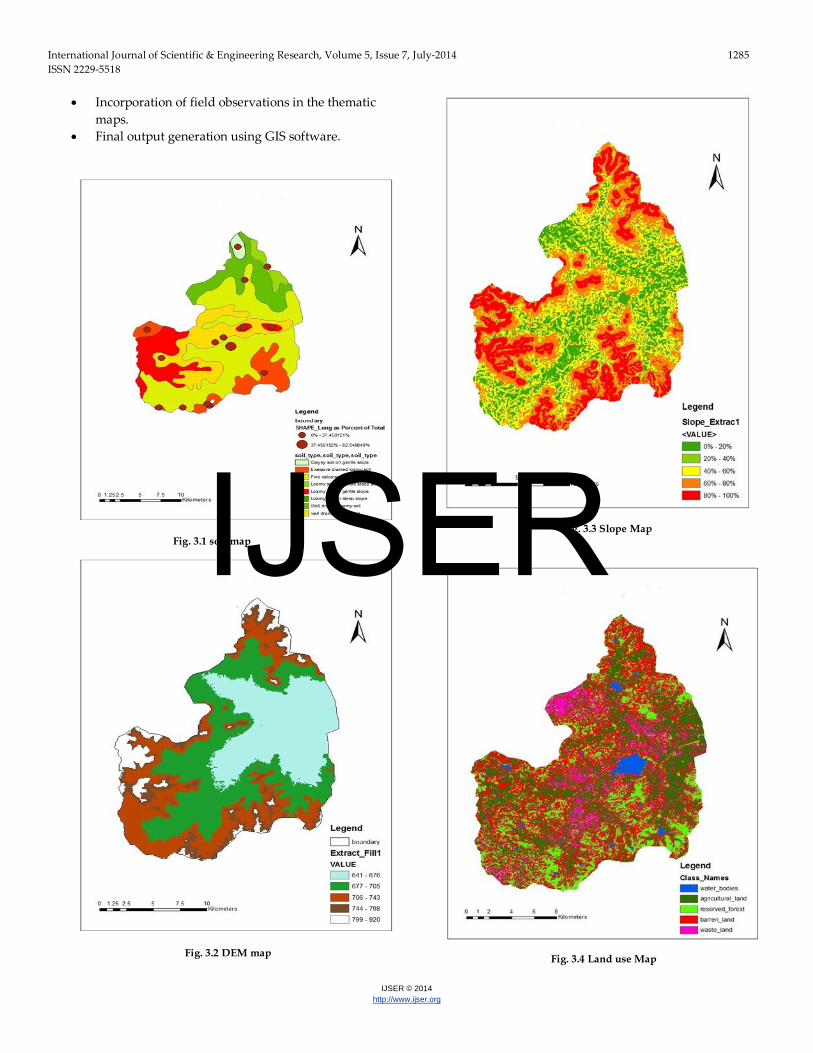
Fig. 3.1 soil map
Fig. 3.2 DEM map
Fig. 3.3 Slope Map
Fig. 3.4 Land use Map
IJSER
International Journal of Scientific & Engineering Research, Volume 5, Issue 7, July-2014 1286 ISSN 2229-5518
IJSER © 2014 http://www.ijser.org
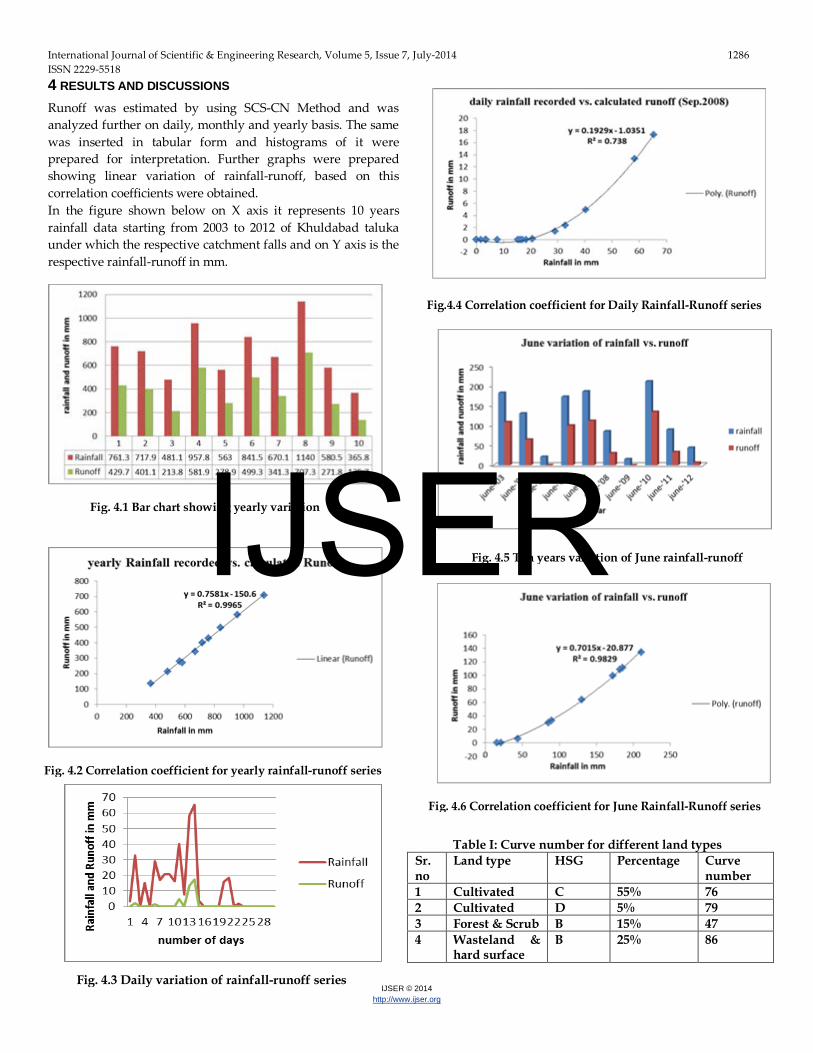
4 RESULTS AND DISCUSSIONS Runoff was estimated by using SCS-CN Method and was analyzed further on daily, monthly and yearly basis. The same was inserted in tabular form and histograms of it were prepared for interpretation. Further graphs were prepared showing linear variation of rainfall-runoff, based on this correlation coefficients were obtained. In the figure shown below on X axis it represents 10 years rainfall data starting from 2003 to 2012 of Khuldabad taluka under which the respective catchment falls and on Y axis is the respective rainfall-runoff in mm.
Fig.4.4 Correlation coefficient for Daily Rainfall-Runoff series
Table I: Curve number for different land types Sr. no
Land type HSG Percentage Curve number
1 Cultivated C 55% 76 2 Cultivated D 5% 79 3 Forest & Scrub B 15% 47 4 Wasteland &
hard surface B 25% 86
Fig. 4.1 Bar chart showing yearly variation
Fig. 4.2 Correlation coefficient for yearly rainfall-runoff series
Fig. 4.3 Daily variation of rainfall-runoff series
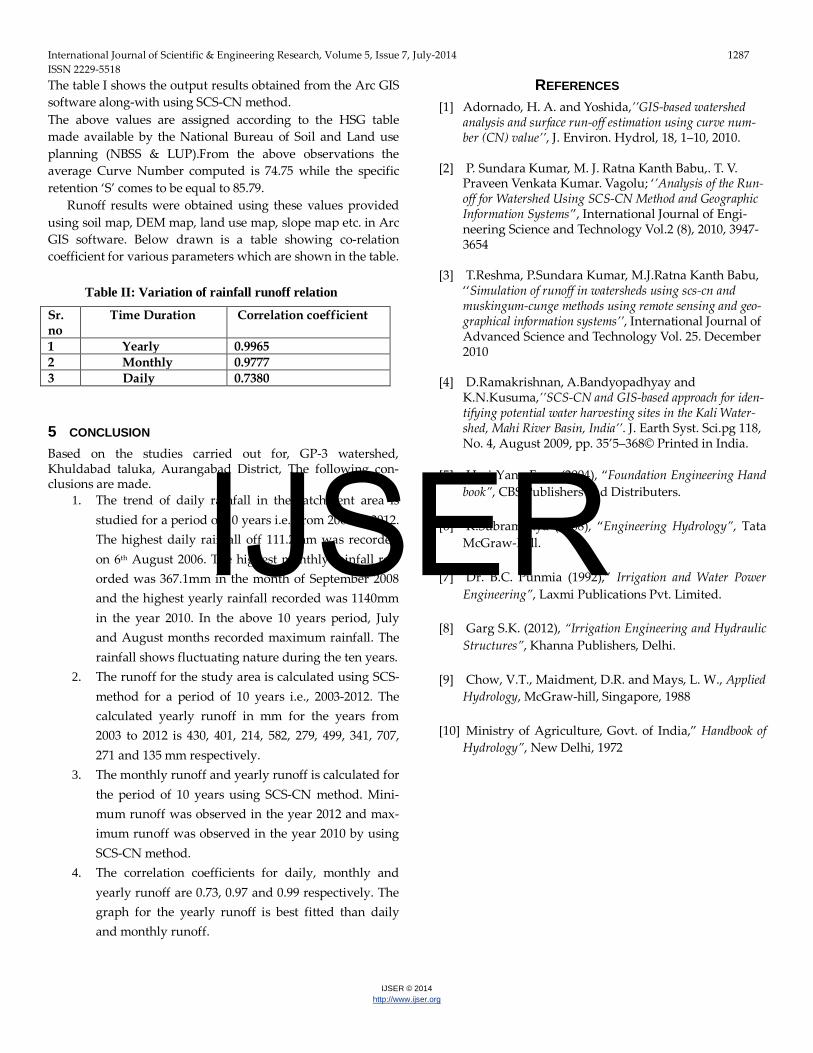
Fig. 4.5 Ten years variation of June rainfall-runoff
Fig. 4.6 Correlation coefficient for June Rainfall-Runoff series
IJSER
International Journal of Scientific & Engineering Research, Volume 5, Issue 7, July-2014 1287 ISSN 2229-5518
IJSER © 2014 http://www.ijser.org
The table I shows the output results obtained from the Arc GIS software along-with using SCS-CN method. The above values are assigned according to the HSG table made available by the National Bureau of Soil and Land use planning (NBSS & LUP).From the above observations the average Curve Number computed is 74.75 while the specific retention ‘S’ comes to be equal to 85.79.
Runoff results were obtained using these values provided using soil map, DEM map, land use map, slope map etc. in Arc GIS software. Below drawn is a table showing co-relation coefficient for various parameters which are shown in the table.
5 CONCLUSION Based on the studies carried out for, GP-3 watershed, Khuldabad taluka, Aurangabad District, The following con-clusions are made.
1. The trend of daily rainfall in the catchment area is studied for a period of 10 years i.e., from 2003 to 2012. The highest daily rainfall off 111.2mm was recorded on 6th August 2006. The highest monthly rainfall rec-orded was 367.1mm in the month of September 2008 and the highest yearly rainfall recorded was 1140mm in the year 2010. In the above 10 years period, July and August months recorded maximum rainfall. The rainfall shows fluctuating nature during the ten years.
2. The runoff for the study area is calculated using SCS-method for a period of 10 years i.e., 2003-2012. The calculated yearly runoff in mm for the years from 2003 to 2012 is 430, 401, 214, 582, 279, 499, 341, 707, 271 and 135 mm respectively.
3. The monthly runoff and yearly runoff is calculated for the period of 10 years using SCS-CN method. Mini-mum runoff was observed in the year 2012 and max-imum runoff was observed in the year 2010 by using SCS-CN method.
4. The correlation coefficients for daily, monthly and yearly runoff are 0.73, 0.97 and 0.99 respectively. The graph for the yearly runoff is best fitted than daily and monthly runoff.
REFERENCES [1] Adornado, H. A. and Yoshida,’’GIS-based watershed
analysis and surface run-off estimation using curve num-ber (CN) value’’, J. Environ. Hydrol, 18, 1–10, 2010.
[2] P. Sundara Kumar, M. J. Ratna Kanth Babu,. T. V.
Praveen Venkata Kumar. Vagolu; ‘’Analysis of the Run-off for Watershed Using SCS-CN Method and Geographic Information Systems’’, International Journal of Engi-neering Science and Technology Vol.2 (8), 2010, 3947-3654
[3] T.Reshma, P.Sundara Kumar, M.J.Ratna Kanth Babu,
‘‘Simulation of runoff in watersheds using scs-cn and muskingum-cunge methods using remote sensing and geo-graphical information systems’’, International Journal of Advanced Science and Technology Vol. 25. December 2010
[4] D.Ramakrishnan, A.Bandyopadhyay and
K.N.Kusuma,’’SCS-CN and GIS-based approach for iden-tifying potential water harvesting sites in the Kali Water-shed, Mahi River Basin, India’’. J. Earth Syst. Sci.pg 118, No. 4, August 2009, pp. 35’5–368© Printed in India.
[5] Hsai-Yang Fang (2004), “Foundation Engineering Hand
book”, CBS Publishers and Distributers.
[6] K.Subramanya (2008), “Engineering Hydrology”, Tata McGraw-Hill.
[7] Dr. B.C. Punmia (1992),” Irrigation and Water Power
Engineering”, Laxmi Publications Pvt. Limited.
[8] Garg S.K. (2012), “Irrigation Engineering and Hydraulic Structures”, Khanna Publishers, Delhi.
[9] Chow, V.T., Maidment, D.R. and Mays, L. W., Applied
Hydrology, McGraw-hill, Singapore, 1988
[10] Ministry of Agriculture, Govt. of India,” Handbook of Hydrology”, New Delhi, 1972
Sr. no
Time Duration Correlation coefficient
1 Yearly 0.9965 2 Monthly 0.9777 3 Daily 0.7380
Table II: Variation of rainfall runoff relation
IJSER
Related Documents