Scholars' Mine Scholars' Mine Masters Theses Student Theses and Dissertations 1940 Absorption of carbon dioxide in a bubble plate tower Absorption of carbon dioxide in a bubble plate tower William Arthur Enderson Follow this and additional works at: https://scholarsmine.mst.edu/masters_theses Part of the Chemical Engineering Commons Department: Department: Recommended Citation Recommended Citation Enderson, William Arthur, "Absorption of carbon dioxide in a bubble plate tower" (1940). Masters Theses. 4750. https://scholarsmine.mst.edu/masters_theses/4750 This thesis is brought to you by Scholars' Mine, a service of the Missouri S&T Library and Learning Resources. This work is protected by U. S. Copyright Law. Unauthorized use including reproduction for redistribution requires the permission of the copyright holder. For more information, please contact [email protected].

Welcome message from author
This document is posted to help you gain knowledge. Please leave a comment to let me know what you think about it! Share it to your friends and learn new things together.
Transcript
Scholars' Mine Scholars' Mine
Masters Theses Student Theses and Dissertations
1940
Absorption of carbon dioxide in a bubble plate tower Absorption of carbon dioxide in a bubble plate tower
William Arthur Enderson
Follow this and additional works at: https://scholarsmine.mst.edu/masters_theses
Part of the Chemical Engineering Commons
Department: Department:
Recommended Citation Recommended Citation Enderson, William Arthur, "Absorption of carbon dioxide in a bubble plate tower" (1940). Masters Theses. 4750. https://scholarsmine.mst.edu/masters_theses/4750
This thesis is brought to you by Scholars' Mine, a service of the Missouri S&T Library and Learning Resources. This work is protected by U. S. Copyright Law. Unauthorized use including reproduction for redistribution requires the permission of the copyright holder. For more information, please contact [email protected].

ABSORPTION OF CARBON DIOXIDE IN A BUBBLE PLATE
TOWER
BY
WILLIAM ARTHUR ENTIERSON
THESIS
submitted to the faculty of the
SCHOOL OF MINES AND METALLURGY OF THE UNIVERSITY OF MISSOURI
in partial fulfillment of the work reqUired for the
Degree of
MASTER OF SCIENCE IN CHEMICAL ENGINEERING
Rolla, Mo.
1940
A:pproved b:rJ~• •!i.:~ .Associate Professor of Chemical Engineering
Acknowledgment
A debt of gratitude is due Dr. F. H. Conrad
in directing and guiding thi,s work and to the
'Various members of the department who willingly
gave their assistance.
w. A. E.
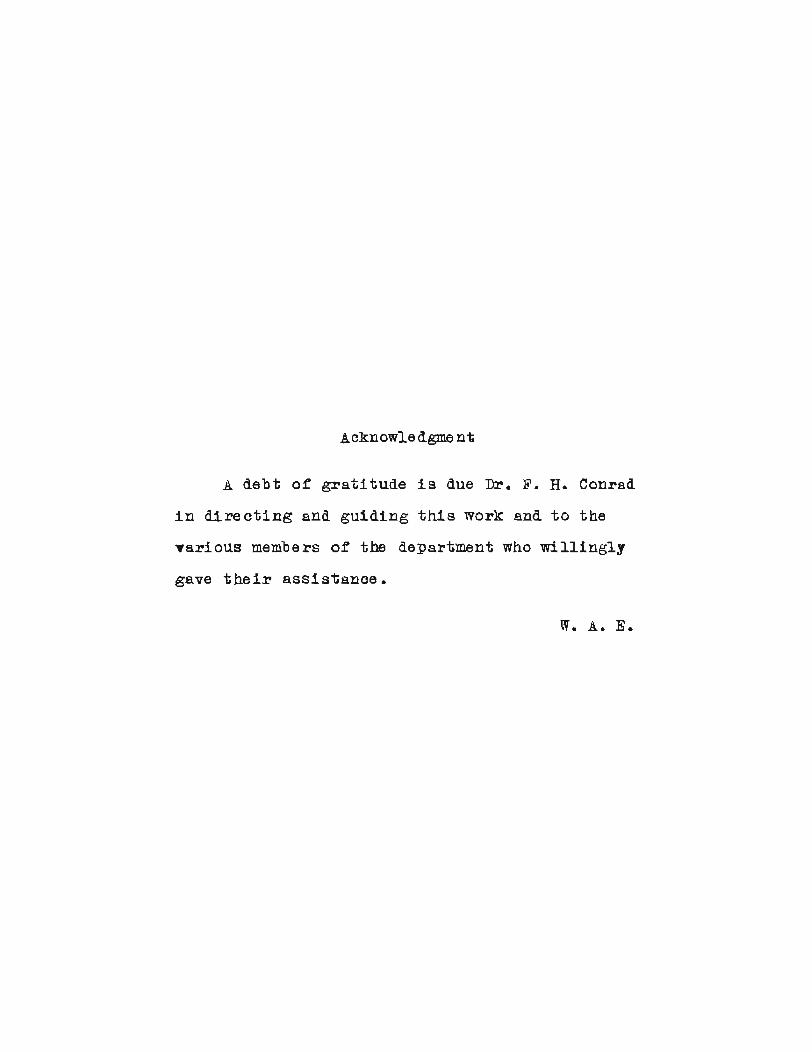
~ABLE OF CONTENTS
Direction for •••••••••••••••••••••••
Equilibrium data ••••••••••••••••••••
Number of theoretical plates ••••••••
Previous work ••••••••••••••••••••••••••••
Page 1
3
8
12
23
24
25
3].
33
35
35
38
38
41
•••••••••••
• • • • • • • • • • • •Experimental runs 1 to 5
Calculation or KLQ ••••••••••••••••••
Data and materia1 balanoe
Experimental runs 6 to 11 •••••••••••
Experimenu~l runs 12 to 16 ••••••••••
Operation ••••••••••••••••••••••••••••••••
Absorption theory ••••••••••••••••••••••••
Construction of unit •••••••••••••••••••••
Results ••••••••••••••••••••••••••••••••••
Introduction •••••••••••••••••••••••••••••
!fhe effect of surface tension on rate of
absorption ••••••••••••••••••••••••••
Theory ••••••••••••••••••••••••••••••
Xxperimenta1 run 17 •••••••••.••••••••
Summary ••••••••••••••••••••••••••••••••••
Bib110graphy .
45
45
47
49
60

1
INTRODUCTION---,. -_ ..-
Gas absorption, one of the chief operations of
chemioRl engineerine, hBS occupied investigators for 2
long time • Results of InH l1Jr experiments on t.he general
subject of gas absorption have been published. However.
relatively few data have appeared in the literature on the
use of bubble cap towers for gas absorption although
they cansti tate one of the three major o12ssifioAtions of
absorption eaUipment. Bubble es-p· to\.i'lers are used exten-
sively in the petroleum industry. More performanoe data
would increase the versatility of eXisting equipment.
The Chemioal Engineering Department of the Wrlssouri
Sohool of J\1Iines and Me-tallurgy possessed 2 tvvelve p18te
column which hSQ been used for distillation. It seemed
desir'able to set this up as s gas absorption unit T.:vi th
two objects in view. First, the resulting pieoe of
equipment coUld be used for experimentation on g8S
absorption for the oourse in ohemical engineering labor-
story. Second, an investig~tion could be carried on
w~th the apparatus to dete~ine its perfo~ance. to
check on the very low values of efficiencies which are
reported for this type of apparatus, and to oompare the
performance wit.h other types of eQ,ulpment.
~he v~riables affecting the r~te of gas absorption
2
and hence the performance of equipment have been inves
tigated at considerable length. but recently Killeffer1
and others have suggested that the surface tension of
the absorbing liquid may have an important effect upon
the rate of gas absorption. In view of the introduction2of newer wetting agents, especially Aerosol G.T. , which
give tremendous lo'Vve ring of surfaoe tension", i twas
desired to make a preliminary investigation of this
effect.
------------~-_..,---_._----_._,,-_ ..- -----------1. Kille ffer, I).H. ~ tt,Absorption of Carbon Dioxide Tf t Ind.Eng. Chem.~ 29,1293 (1937)
2. American Cyanamid and Ohemical CompRny
3
Since the introduction of the two fi.lm theory of
Whitm~n and LewisI, great strides have been m2de in
expressing Quantitatively the rate of absorption of,::)
a gas by a Ii C1 uill. !fS.11.3::S and McAdams c, absorbed NH3
in water with a small laboratory wetted-wall tower.
Kowalke, Hougen and Watson3 and Chilton, Duffey and4Vernon used packed towers up to one foot in diameter
t~ absorb NH3 in water. ~hey determined the varia
tion of the absorption coefficient with height of
packing, NH3 ooncentration. liquid and gas rate, and5temperature. Haslam. Hershey t and Kean and Hixson
and Scott6 absorbed both NH3 and S02 in water using
1. Lewis t W.K.. and Wh1tman t W• G., rtprinoiples of GasAbsorption tr
, Ind.Eng. Cham., 16,1215-20 (1924)
2. Hanks,W. V. ~ and MoAdams t W.H., ffStudies 'in Absorption"., Ind. Eng. Chem., 21, 1034-9 (1929)
3. Kowalke ,O.L. t Hougen,O.A., and w~tson,K.M., tfAbsorption of Ammonia in Towers n , Chern. Met. Eng., 32,443-6(1925 )
4 • Chilton ~~ .H. t Duffey ,H.R., Vernon ,H.C., ftT'he Absorpof Gases in Packed Towers", Ind. Eng. Cham., 29, 298-301 (1937) .
5. Haslam 9 R.T. t HersheY,R.L., and Kean,R.H. t ffEff~ct ofGas Velocity and 2emperature on Rate of Absorption If, Ind.Eng. Chem., 16,1224-30 (1924)
6. Hixson.A.W., and Scott ,e.E ~ 9 "Absorption of Gase s inSpray ~owerSnt Ind. Eng. Chem., 27,307-14 (1935)

4
small glass towers. The latter also reported runs
using straw 011 to absorb benzene vapors 8& did
Simmons and Long1 •
The absorption of carbon dioxide has been much
more extensively investigated. Hirst and Pinke12t
among others, used the organic amines whioh form the
basis of the Girbotol Prooess3 •
Due to its great industrial importance. the most
work has been done on the use or alkaline oarbonate or
hydroxide solutions to absorb carbon d10·xide. NotS?ble
operotion is' H1tohcOCk,4 5 6among those employing batch ~
who used the carbonates and hydroxides of potassium,
sodium and lithium. He investigated the variation of
the rate of absorption with concentration. Continuous
1. Sltnmons.C.W., and LongfJ~D.t tt~ower Absorption 00effioients ft
• Ind. Eng. Chem., 22,718-21 (1930)
2~ Hirst,L.L•• and Pinkel,I.I., tfAbsorption of CarbonDioxide by Amines n , Ind. Eng. Chern., 28,1313-15 (1936)
3. Wood,W. R. 9 and storrs,B .'D., trGirbot.ol PurificationProoess", Am. Fet. Inst. Proc., 19M (Ill) 34, MY. (1938)
4 • Hitchcock tL·~B., URate of Absorption of CO2 ff, Ind.Eng. Ch~m.t 26, 1158-67 {1934}
5. HitchoocktL.B•• and Cadot,H.M., nR~te of Absorptionof CO2 '', Ind. Eng. Chem. t 27 t 728-32 (1935)
6. H1tehoocktL.B.~ 'tMechanism or Gas Liquid Reaction",Ind. Eng. Chem•• G9, 302-8 (~937)
5
counter-current absorption in packed towers was
carried out by Oomstock and Dodge l and Williamson
and Mathews2 who scrubbed the gas with cQrbonate sol
utions. ~hey determined the effect of conoentration,
temperature 9 and liq,uid and gas flow rat.as.
Because of its lesser ,industrial importance, the
investigat~on of water as an absorbent has not been
as extensive. Sherwood. Draemel. and Ruckman3 report
the desorption of CO2 from water in 2 packed tower
18 inches in di~eter and 51 inches high. Payne
and DOdge4 and Cantelo, Simmons, Giles, and Brillfi
employed small laboratory scale towers packed with
rings to absorb C02 in water. The former gave an
exoellent review of the literature. The latter
1. Comstook,C.S. _ and J)odge ,B.F., f'Rate of CO2Absorption by Carbonate Solutions in a P~aked
Tower", Ind. Eng. Chem., 29, 520-9 (1937)
2. Williamson, R. V." and Mathews, J .H. t ffRate ofAbsorption and Ea,uilibrium of C02 in -AlkalineSolutions", Ind. Eng. Chern., 16, llfi7-61 (1924)
3. Sherwood,T.K., Draemel,F.C., and RuokmantN.E.~
"Deso~pt1on of C02 from W'ater in a Packed Tower",Ind. Eng. Chem., 29, 282-5 (1937)
4. Payne,J.W., and ~odge,B.F., ttRate of Absorptionof CO2 in Water and Alkaline Median, Ind. Eng.Chem•• 24, 630-7 (1932)
5. Cantelo, at'al, u~ower Absorption Coefficients n ,Ind. Eng. Chem., 19, 989-97 (1927)

6
reports exceptionally high efficiencies. Davis1
reported upon the rate or absorption using batch
apparatus.
Bubble plate towers used in commercial reoti
fication have over-all plate effioiencies of 65%
to 95%; however the efficiencies of this type of
equipment when used for absorption are reported to
be much below these values. Atkins and Franklin2
report 18% for petroleum equipment. Whitman and
Dav1s3 absorbed carbon dioxide- in a 15 plate tower
with one bubble oap per plate using sodium carbonate
solution as an absorbant. The usual graphical methods
indioate tha~ their tower perfol~ed the work of one
theoreticul plate or an effioiency of less than 7%.
sherwood4 reports the work of Reynolds and Sandersfi
who absorbed NH3 in water in a single plate tower.
1'. Devis ~H.S., tr!ni ti21 Absorption rtstes of CO2 byW9ter ~nd ])ilute Sodium C9r~onate Solutions Jt , Ind.Eng. Chern., 25, 1023-25 (1933)
2 • Atkins ,G.T.. and FrAnklin t W•B., Re fille 1'1 15, 11>. 30 (19i36)
3~ Whitman,W.G., Ene. })a"Vis ,G.H.B., ffl~ Gor'1pnrj.son ofGE:S _,Ab801'1".p~ti-on'---Elld. 11e o-ti.fi o~3·tiolJ.Tf, Ir1.11. ~~:1~;~. CLle:.tl.,18, ;::.e)<~:·-6 (1926)
4. Sherwood,T.K., "Absorption E:ind Extractiol1. rt, ~Tev{
YO.r.--t'·; "ft~C~"\'1&.:-'''F;r-H.l·ll 1 q~::;rt 11 '.Lql...... , .1.'._" t;r..L. ,- ;J. .,_ , _ 4.' '- (, ,..:'. .- _
5. Re~!1~olc~8,B_~;~. ~- [~rLD. ~)t·~rlcLe.llS ,FaW., Th.csis. Ct-~Ell)Z'i(lt~;:3,
1~~:d3s., n[.I.T., 19Z~1

7
They obtained 2 Murphree effic1ency of' 65-85%, aver
aging 75%. McCabe and Swansonl used lime solution
to absorb SO~ in a bubble plate tower and obtained'-J
an effioiency of only 55%, even though the liQui'd
2height on each plate Was two feet. Goosmann in a
long dissertation on carbon dioxide, compared the
efficiencies of bubble cap and packed towers as
percentage of incoming CO2 absorbed, using Na2C03.
Tables indicate qualitatively a greater efficiency
for bubble towers, however. the towers were oper
ating under different conditions, and dimensions
and descriptions of them were omitted. In view orthe foregoing data the work described in this paper
WaS unde rt a.ken.
1. ~~cCabe t W.L.. and SWanson 9 W•H. J tt'rhe Paulson AcidAbsorbern~ 92. No. 26, p. 48-50 \1931)
2. Goosmann,.T.C., ffC02
·in Its New Field of Usefulness",Ice. and Refrig., 79, 399 (1930)
8
ABSORPTION THEORY
The transfer ot gas molecules from the gas phase
into the liquid phase is a diffusional process ana
the rate is proportional to a driving force and a
resistance. ~he analogy to the flow of electricity
and fluid flow has often been pointed out. The re
sistanoe to gas absorption is the result of two,
more or less stagnant, or perhaps better. laminar
films - one on either side of the interface - the
liquid film and the gas film1 • It is re~sonable to
assume that at the actual interface, equilibrium is
reached; that is, the partial pressure of the solute
gas at the interface is eQ,ual to the vapor pressure
exerted by that component from the liauid at the
'interface. If y designates the concentration of
the solute gas in the main body of the gas stream and
Yi , at the interface, then Y - Yi is the driVing
force across the gas film. In a similar manner if
x and Xi are the concentrations of the solute gas in
the liQuid phase in the main body of the lia.uid at the
interface respectively, then x. - x is the driVingJ.
force across the liquid film. Setting up an equation
1. Lewis,W.K., and Wh~tman,W.G.t rrprin9iple$ of GasAbsorption tr , Ind. Eng. Cham. t 16, 1215-20 (1~24)
9
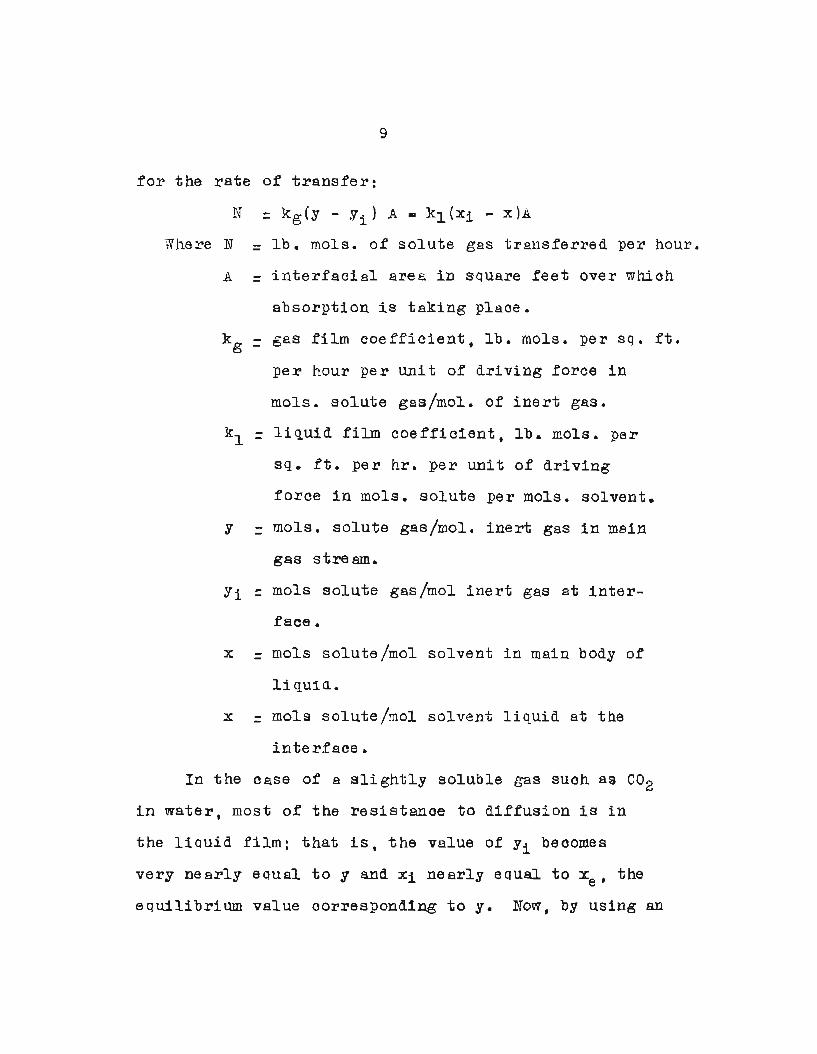
for the rate of transfer:
N = kg{Y - Yi) A • kl(Xi - X)A
Where N = lb. mola. of solute gas transferred per hour.
A = interfacial area in SqUare feet over which
absorption is taking place.
kg - gas fi~ coefficient, lb. mols. per sq. ft.
per hour per unit of driving force in
mols. solute gas/mol. of inert gas.
k1 = liquid film coefficient, lb. mols. per
sq. ft. per hr. per unit of driving
force in mals. solute per mols. solvent.
y - mols. solute gas/mol. inert gas in main
gas stream.
Yi =mols solute gas/mol inert gas at inter-
faoe.
x =mols sOlute/mol solvent in main body or
Ii g.Ula..
x = mols sOlute/mol solvent liquid at the
interface.
In the Case of a slightly soluble gas such as CO2
in water. most of the resistanoe to diffusion is in
the liquid film; that is, the value of Y1 becomes
very nearly equal to y and xi nearlY,equal to xe ' the
equilibrium value oorresponding to y. Now, by using an

10
over-all coefficient KL (since Henry's Law applies).
the equation becomes:
(2 )
Now if we consider oontinuous counter-current
absorption1 , 2 in a tower suoh as that sketohed in
figure -!-' and if:
L - lb. mols of solvententering per hour
G = Ib mols inert gas/hour
v = volume of tower incubic feet.
a - interfaoial area insquare· feet/cubic feeto·f tower.
L
Figure 1.
G:/0
X,
A material b alanoe may be set up over any sa ction of
the tower·.
Gdy = Ldx = II
and since A = 8 V, by sub. in equation (2)
N • KLa{xe - x) d V
Therefore :
(3 )
(4 )
(5 )
1_. Fiss,E.C., "The Design. Construction. and Operation'of a Carb'on ])1oxide Absorption Tower". Thesis. Atlanta f
Ga •• Georgia .School of Technology. 1938.
2. Sherwood,T.K., wAbsorption and Extraction tt • NewYork, McGraw..Hill p 9ti

11
He arr8n~~ing:
= v S.-L:-L,
lJo
ydY =
(6)
KL~.3. is eVi:lltlated 38 Oile :fi,gtlre, -I:ihe so oslled over-all
volunletl-;ic coef:E'icierlt i!l T110ls ;';jbsor·bed 'per hour per
and the equilibrium line. plotted as y against x. The
e q.uation of the operating line is obtained. from equation
(3). using,the terminal oonditions of the tower.
(7 )
~he usual graphical method envolving the theoretical
Plate1 will also be employed to analyze the results.
1. SherwoodtT.K.~ "Absorpti,on and Extraction", NewYork, McGraw-Hi11, 1937 p. 82

12
CONSTRUCTION OF THE Ul~IT
The tower proper, which had previously been used
tor distillation, contained twelve plates; the bottom
six were placed five inches apart and the top siX,
four inches. The inside diameter was 7 7/8 inches.
Each plate contained one bubble cap, 4i inches in
diameter. Figure ~ shows a sketch of the unit and
figure ! is a. dimensioned drawing of a plate. The
construction was of copper With a tin lining.
The auxillary equipment whioh had to be bUilt
was affected by the system chosen and by the method
of operation, continuous (reoycling) or intermittent.
It waS at first considered desirable to use the
ethanol amines t d.ue to recent develQpments employing
them to absorb aoid gases. However corrosion problems
as reported by Gregory and Scharmannlt especially in
the case of copper and tln. prevented their use.
Since the bubble plate tower is especially adapted
for cases where the liq.Q.id film is controlling. it
was decided to use a slightly soluble gas. For prao
tical ~ur~oses the choioe was almost limited to CO2 -
1. GregorY,L.B. t and Soharmann.W.G•• nCarbon DioxideScrubbing by Amine Solutions tt , Ind. Eng. Chem., 29,514-19 (1937)
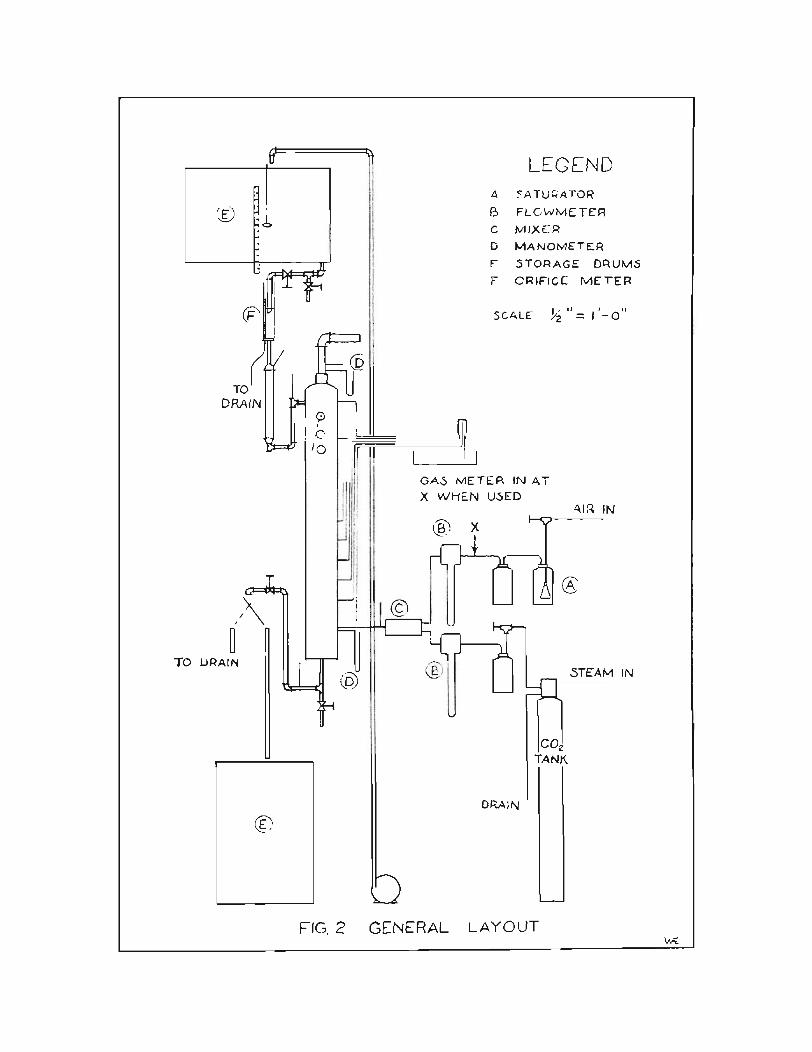
©
LEGENDA :ATURATORB FLCJWMETER
C MIXE~
D MANOMETER
E" ,STORAGE DRUMS
F ORIFiCE METE~
SCALE }-z U =: ,'_ II
GAS METER IN ATX WHEN USED
,L\"~ IN
STEAM IN
CO;:.TANK
DRA1N
FIG.2 GENERAL LAYOUT

FIG. 3 TYPICAL PLATE AND BUBBLE CAP
15
The question arose whether to generate the C02
by burning pentane from the school gas lines or
whether to use the liquified form in commeroial tanks.
Assuming 100% complete combustion, CO2 oould be ob
tained by burning pentane at a cost of 1.12 cents per
pound.. T'he liquid form could be obtained. for 13.5 cents
per pound. In view of the additional eq.uipment which
would be required, suah as a blower to obtain the
neoessary pressure, the difficulty of operating a
burner, the non-uniform pressure of'the gas lines, and
its unavailability on other than sohool days, gas in
commercial tanks was chosen. Later calculations have
shown that approximately 0.0003 pound mols of CO2 are
used per minute during the a.verage run. suming 45
m1nu~es for the average operating time, 'Q 03 x 45
x 44 = 0.594 pounds of C02 per run o~ a cost of only
8.02 cents per run.
~o eliminate a reboiler and oooler it was decided
to run intermittently. Tro further simplify operation
anQ analysis, distilled water was used as an absorbant
in most of the runs. 55 gallon drum was mounted
above the tower to supply water during the run. A
float device indicate the level in t e dr~. n
orifioe aisensrging vertically downward Was incorpor
ated in a si Ie constant rate devioe on the ~iqu~d
16
line to the tower. The rate for such an orifice varies
only slightly with the head. Figure 4 is a sketch
of the metering system. The overflow tube maintained
essentlally a oonstant head. The vent below the ori
fice was necessary to maintain atmospheric pressure on
the down-stream side. An adTantage of this device is
that various sized orifices can be made up and inter
changed readily. The goose-neck acted as a liquid
seal to prevent gas from esoaping.
Air rrom the line was regulated by needle valve,
l)B.ssed through a sa.turater as shown in figure ~ t
then through another bottle to remove entrainment. and
then through a flow meter. Carbon dioxide was e~panded
first through the tank valve and then through a specially
construoted needle valve made from the base of a Fisher
burner. During the ~irst rUns, difficulty was encounte~ed
in maintaining a oonstant flow due to the CO2 tank
valve freezing. ~o prevent this diffioulty a few feet
ef copper tubing were bent into a five inoh ooil with
seven turns around the valve and the wh~le ooi1 Was
enoased in sheet metal. By passing- steam through the
coil most of the trouble With the valve waS eliminated.
A large bottle in the carbon dioxide line befQre
the flow meter helped smooth out minor irregularities.
A Sargent Wet ~est- Meter was calibrated and a factor

-~
I "22
SCALEI I, ,I I
/ II I
J II /
/ /
I II )/
l = I
VENT
FIG. 4 LIQUID ORIFICE METER

18
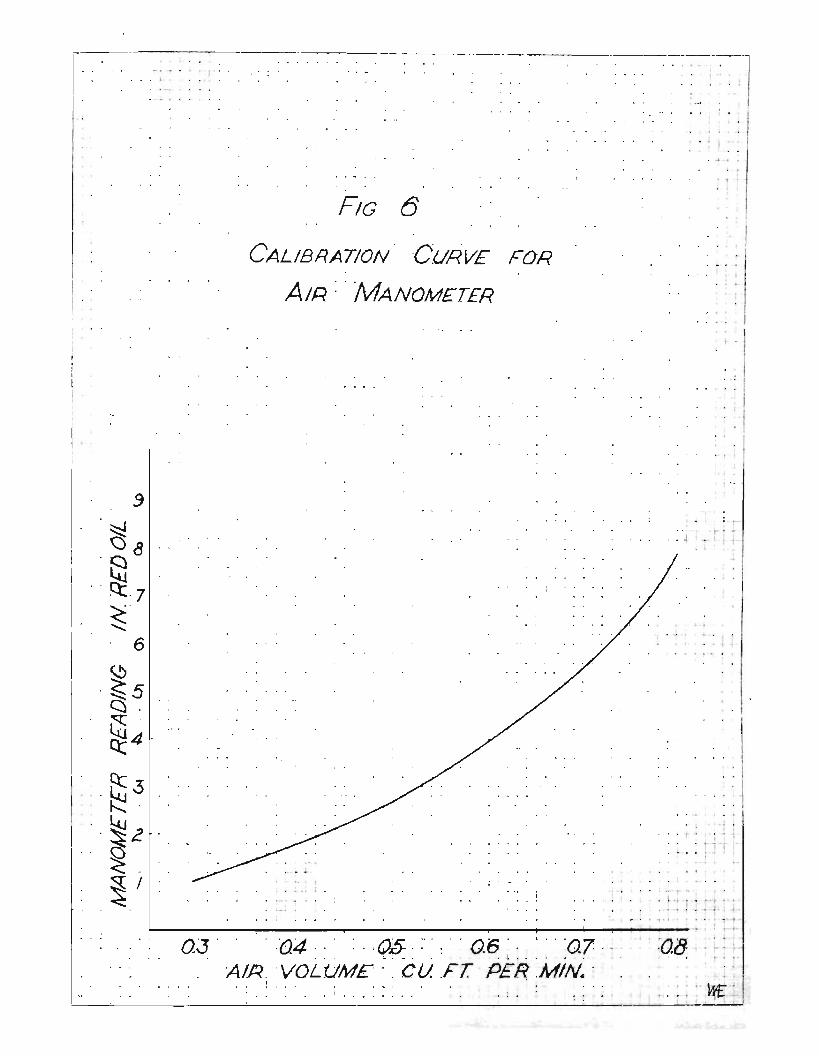
of 1.027 obtained. This was in turn used to obt in the
calibration ourves in figures 5 and 6 for the g2S flow
meters. After metering, a small metal oylinder 4 x ~
inches packed with Berl saddles was used as a mixing
ohamber. From this the gases were lead directly to
the base of the tower.
Af·tar the tower had been set up t air was blown
into the gas inlet with all the plates filled with
water. The pressure in the bottom section was meas-
ured with a mercury manometer t.o be _O.7 u Hg. From
this 9 the hei.ght of the liquid leg necessary to
maintain this pressure and to prevent gas from
esoaping with the exit liquor was c~loU1at,ed to be
9.5 inches.
Before aotually putting in pipe lines it was
advisable to determine the flooding rate of the tower
in order to know the maximum quantity which they would
be required to carry. This rate waS first calculated
assuming each downcomer to act as an orifice. Since
the distance between plates in the upper section was
four inches and the downcomer extended 1 9/16 inohes
above the plate t the maximum he ad on the Tto.r1fice n
would be 2 7/16 inches or 0.12 feet. Usin~ the fo~mulB:
=v
V
=A C V2 g H2(.875) JC 0.61
J:44-x~-4-
30.0071 ft. (sec.

----;--~-:---,-.-,---~;-.--:.......\ ---;-~
r ... . " ~ ~ L: !". \.. ~ • r - ~ 4
--;-r---r~_ ..._---- '~-"---"- ~_.- ._.-.--,--. -,._~--_._.__...__._._-_.-_._-----_.._._'._'_-""'_---'-_"""""""'__.. • ~ ; .. II' .. ..,., -, -~.
i !
; .. ,: '-""1
. :
: .~ ....,~ I
~ I
II j
.FIG .6·
CALIBRATION' CURVE FOR-.- .
. . AII=l' MANOMETER'J ' " \
,. i i
T .. ~
~ . T : ':'
...- ~., ~ . ~. - [ -
I .. ~
I
! r'-. '!
t· .. : . '1': ...... ~. r
OJ"Q4if'.p: . ;:: _~- p.f5,:. :b~AIJ:<;VOLUM£; 'Cu. :FT' P£RMIN~
~~1J
'~U'
.-'A'~;. r~~ .."----'-'~
21
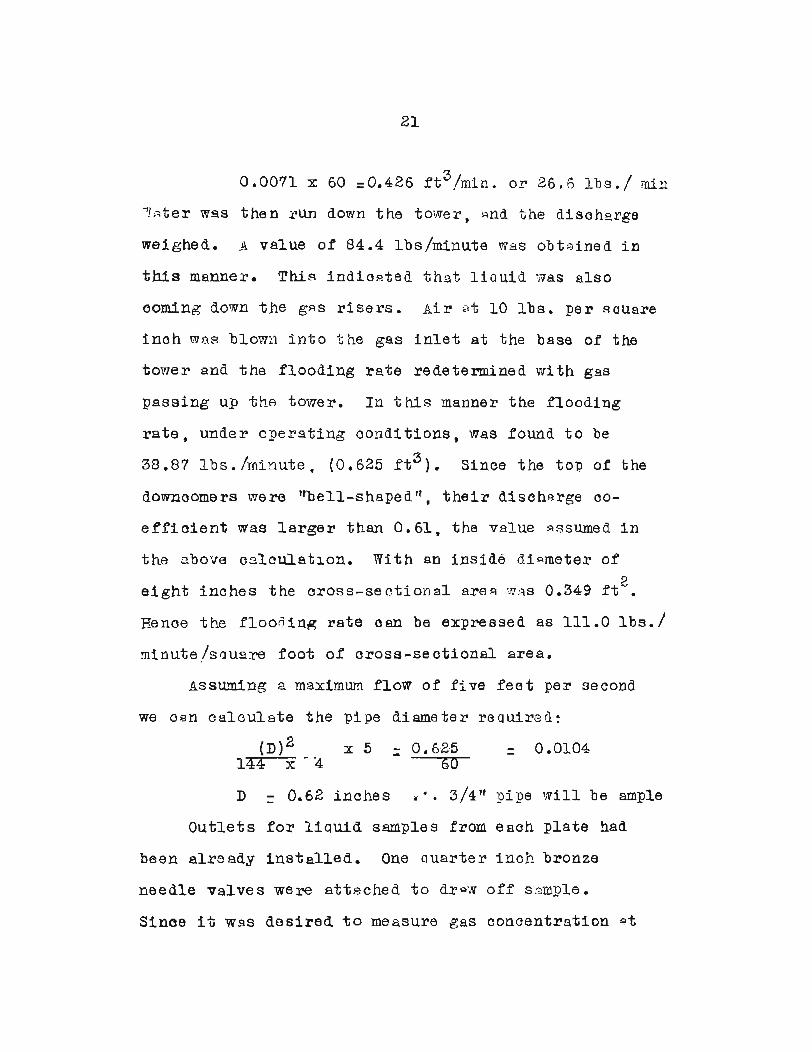
0.0071:x: 60 =0.426 tt3 jmin. or 26.6 Ibs./ mhl
?T~ter was then run down the tower 9 Bnd the discharge
weighed. A value of 84.4 Ibs/minute was obtBined in
this manner. This indicated that liauid was also
eoming down the ghS risers. Air at 10 lbs. per Rouare
inch was blown into the gas inlet at the base of the
tower and the flooding rate redetermined with gaS
passing up the tower. In this manner the flooding
rate 9 under operating condit~ons, was found to be
38.87 lbs./mil1ute. (O.625 tt3 ). Since the top of the
downoomers were ffbell-shaped n, their dischBrge 00
effioient was larger than 0.61, the value 3ssumed in
the above C31culat~on. With an inside di8meter of
eight inches the cross-sectional area WaS 0.349 ft 2•
Hence the flooa.in~ rate can be expressed as 111.0 Ibs./
mi.nute tIs aua:re foot of cross-se ctional area.
Assuming a maximum flow of five feet per second
we can calculate the pipe diameter required:
{D)2 x 5 - O. 6··2~5 = 0.0104144 x-'""-4 - 60
D - 0.62 inches . 3/4 " I>ipe \vill be ample- T .outlets for liquid samples from each plate had
been already installed. One Quarter inch bronze
needle valves were attached to d:rpw off s2mple.,
Since it waS desired to measure gas concentration !3t

22
any point~ gas s~pling tUbes were installed in the
vapor space above each plate. These tubes consisted
of i inch pipes, extending three fourths of the way
across the inside d.,ian1eter o.f the tovrer, BJld. -,~vere
drilled with a series of holes along the bottom.
They were screwed into B ~!_n to ~n bronz,e bushing
which was in turn screwed Bnd soldered to the copper
shell. A iff bronze needle valve was ~ttaohed to
the bushing. This is sketched in figure 3. Gas, -
samples could be dra\Vrl dire c-tl~r into 8 t~a,S burette
or conducted through small glass tUbing and oollected
over uv~ter.
An electrically driven (1/3 R.P.) oentrifugBl
pump w~s employed to pump the water from carboys or
to the lower storage drum to the feed drum sbove the
tower. The~no~eters were placed so that the inlet
~nd outlet gas teml)eratures and i,nIet and outlet
liauid temperi::tllres could be measured.
23
OPERA!rION
Since the technic was changed continuously dU~ing
the experiment.~~l runs, a detailed desoription of the
finnl method of operation and duties of the various
operators will be given at the end of this section.
st~rted nearly simulteneously. Gas flow was mAin
ta1ned at 8 constant value by manual oontrol, using
the flow meters as guides. -Sucoessive samples of the
outlet gas indicated that the tower attai~ed eQuili
brium after operating continuously for fifteen to
twenty minutes. Gas samples were collected in wide
mouth bottles of 130 m~. capacity, inverted in a
water bath. Liquid samples were drawn into small 30 mI.
bottles and stoppered immediately. Temperature.
pressure, and flow meter readings were taken oon
tinuously throughout the run_ After the first few runs,
a Sargent Wet Test meter WaS placed in the gas line.
The li n u1d samples were analyzed by adding 25 ml~
to 10 ml. of standard barium hydroxide. The excess
hydrQxide was back titrated With hydrochloric aoid
using phenolphthalein. ~he gas samples were displaced
into a gas burette and the car~-on diox;ide absorb~d in

24
a Hempel pipette using potassium hydroxide. The con
fining liquid for displacing the gas. as well as that
used in the oollecting bath, Was an acidified solution
of sodium sulfate as suggested by Kobe and Williamsl •
This was later changed to distilled water for the
sample collecting and mercury was used as a con-
fining liquid.
RUNS ONE TO FIVE.--~~ .------'.
The gas and lio-uid rates were adjusted to equal
approximately the mean of the ranges em.ployed by
previous investigators. The liquid orifice delivered
4.604 pounds of water per minute. With the CO~ !lowf,.,J
meter at 1.0 inch o~ fTred oil u (sp. gr. = 0.827 and2
the air meter at 1.5 inches, 0.00129 pound mols of
total gas entered per minute, (0.774 mols per hour)~
with a CO~ content of about 22 per cent by volume.:-.J
These runs showed that the liquid analyses were
much better thaD the gas analysis. A plot of liauid
ooncentration against plate number gave a reasonably
l~ Kobe,K.A. t and Williams,J.S., TfConfining Liauidsfor Gas Analysis" t Ind. Eng. Chem., 7, 37-8 (1935)
2. Throughout this paper rtmols'f will mean pound molsunless otherwise stated.
25
smooth curve. On the other hand, the gas analysis
varied erratically and showed no trend with plate
number. The gas analysis in run number five was nearly
constant, 21.3 per cent with a maximum deviation of 0.7
per cent from this average.
Calculations based on the liquid analysis for this
run showed that a total of 0.001294 mols of CO2 were
absorbed per hour. If the inlet gas is taken to be 21.2
per oent CO2 as analyzed, 8 material balance requires
that the outlet gas be 19.7 per oent CO2- In an
attempt to get a better oor~~lation of gas concen
trati.on with plate number t it was de cidedto increase
the amount of aarbon dioxide absorbed. This coUld be
most er~ectively accomplished by inoreasing the liquid
rate as the ooefficient of abso:rption is inoreased
with increased liquid rate. Also the greater amount
of sorubbing medium will increase the amount of
a.bsorption.
RUNS S!X TO ELEVEN----"-.---AS i,ndieated. by the previous runs. a larger ori
ti;ce deli.vering 11.83 pounds of water pel.! minute was
placed in the inlet liauid line. The strength of the
standard barium hydrox~ue and hydrochloric acid solu
tions used in analyzlng the liquid samples was
26
reduced from 0.1 normal. which was found to be too
high, to 0.05 normal. Also to eliminate the diffi
cUlty with the sodium sulfate confining liquid, the
gas samples were drawn directly from the tower into a
gas burette and analyzed immediately.
CalculRtions based on the liquid analysis of run
six shows that 0.00260 IDols of carbon dioxide per hour
were absorbed. However, the gas analysi"s and rate for
the same run show a loss of 0.00588 mola per hour, or
an error of over 100%.
The remainder of the runs in this set were devoted
to discovering the error in the set~UPt and obtaining a
material balance that would oheck Within the limits of
engineering accuraoy.
First, the inlet orifice was reoalibrated and the
original value checked. Likewise~ the Sargent Wet Test
meter, whioh had been plaoed in the exit gas li~e to
more aocurat,ely measure the rate, was rechecked.
Solution strengths were also redetermined.
It was thought that possibly carbon dioxide was
escaping from the liquid samples while they were being
drawn, sin?~ the liquid analysi~ showed less absorption
than that indicated 9Y the gas ana11s~s. To avoid this
possible loss, small diameter glass tubes about eight

27
inches long were drawn out to a fine tip and attached
to the valves for liquid sampling. Long glass tubes,
.s~milar .to Nessler t~be~, with a volume of about fifty
mI. were previous~y calibrated with a thirty-five ml.
mark and filled with ten ml. of standard barium hydro
xide and stoppered before the run. In taking a sample.
the line was flushed and the s2mple tUbe raised until
the tip of the glass tube extended just below the surface
of the barium hydroxide. By filling to the mark, a 25 ml.
s~ple was taken and contact with the air was minimized.
However. no differenoe could be deteoted between this
method and the one employed before; but due to the con
venience of this methqd, it was adopted in all the future
runs.
~he humidity of the inooming air was determined
with wet and dry bulb thermomet.ers to eliminate the 1)OS-
sib11ity of an inorease in gas volume by picking up
water vapor. The inlet air Was found to be almost 100%
saturated. Since it was desired to get only a material
balanoe during these partioular runs, tap water was used.. .
in runs seven and eight. The presence of magnesium in
the water. however, gave a tffading t.t end-point which WaS
undesirable.
Having cheoked the liquid and gas ~ate t there re-

28
mained to check the liquid an~.g2s analyt~oal methods.
~he I>o~sibility of_ .hydrochlorio acid reacting with the
pre?i~itated barium carbona~e during the titration
~rose •. and ~ince the gas meth~d of analysis was well
established, this was investigated.
A group of 25 ml. samples were taken from the
same s.oll:ltion of CO2 1~ water. Ten mI. of standard
barium hydroxide were added to each~ The samples
were then divided into three groups. The samples of
series I \vere tltrated dire ctly to a phenolphthalein
end point in the presence of the precipitate with
hydrochlorio aaid. The samples of series II were
centrifuged and a 25 ml. aliquot of the olear solu
tion was titr~ted. ~he samples of series III were
filtered through qualitative paper and 25 rol. of the
olear filtrate was titrated. T'he results t expressed
as mI. of acid required for b~ck-titrationt all, cal
culated to a like basis are g1van in the following
t~ble. 2he figure is the average of all the runs in
that series.
TABLE I
I W'ith Precipitate •••••••••••••• 3.11 ml.
II Centr~fug~~.~~~~~~~~~~~~~~~~.~~2.67 ml.
III Filtered •••••••••••••••••••••• 2.45 ml.
29
These values indicate the necessity of removing the
barium carbonate precipitate before adding a.aid. This
~rocedure WaS adopted in run eleven and oontin~ed in
all following runs.
In spite of this p~caution in the analytical
method, the gas analysis of run eleven indicated an
absorption 63 per oent higher than that caloulated. -
from the liq~~d ~a~ysis. The gas ana~ysis was
checked by cont~nuously bleeding a sample through. . ~ . ..
standard barium hydroxide and measuring the volume of
inert gss. Furthermore. the inlet composition could be- -
calculated from t he .flow met·er re adings. In most cases
these values oheoked within a small fraction of a per
cent of CO2 (0.1 ~_in some instances).
Assuming the gas analysis to be correot for run
eleven, the ooncentration of carbon dioxide in the
exit liquid WaS calculated to be 0.0001216 mols CO2
pel~ m'ol H2~ instead of .0000740, the measured vRlue.
From e Q.uilibri um d.ata t the partial pressure of carbon
dioxide i th~' ..-gas above this theoretical soltttion
pressure of CO2 .in c01?tact 1tvith the exit liCfuid was
only 0.207, indicating an impossibility. and showing
that the values of ga.s oonoentration wel~e in error.
30
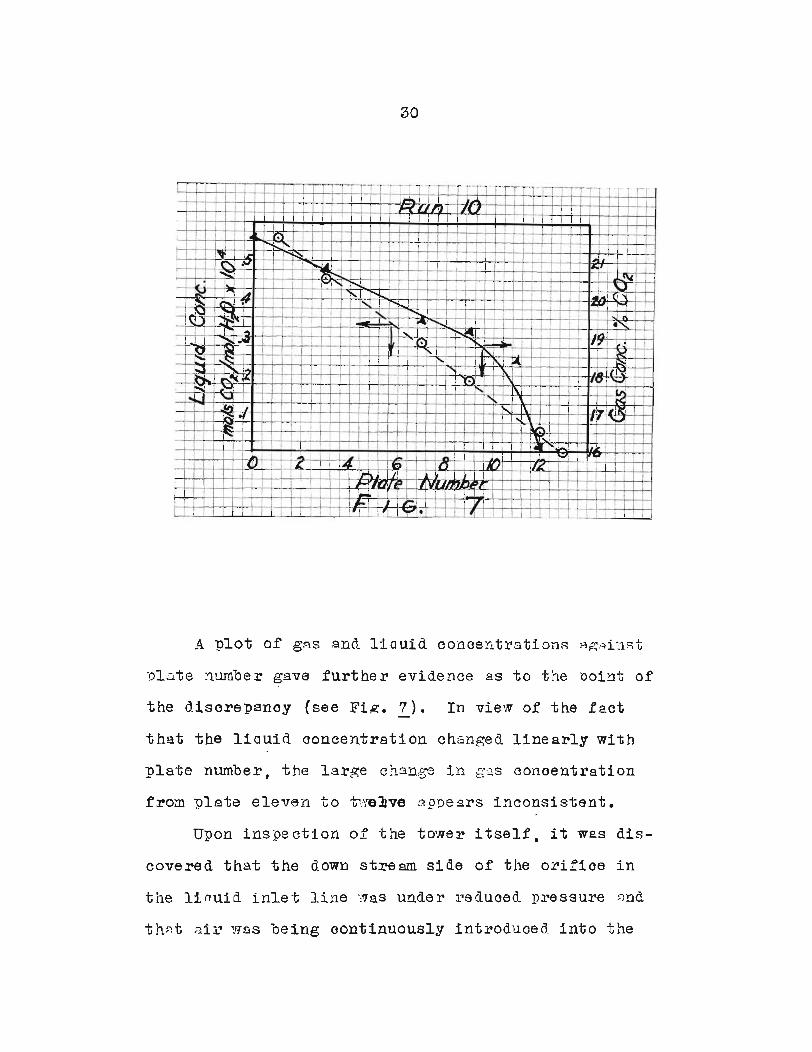
A plot of gas and liauid concentrations against
plate nmnber gave further evidence as to the point of
the disorepancy (see Fig • .?.). In vievv of the fact,
that the liauid. ooncentration changea~ linearly with
plate number, the large change in g.~2S conoentration
from plate eleven to twelve sppears inconsistent.
Upon ins~pection of -the tower itself, it was dis
covered that the down stre~ side of the orifice in
the linuid inlet line waS under reduoed pressure and
th8t air was being oontinuously introduced into the
31
system through the vent. ThiA condition w~s due to
the fact that the enlarged seotion below the orifice
was not of sufficient diameter nor long enough to
l)el~1nit -the bu.bbles to separate from the liOlli(l. Hence,
they were carried. ovel~ and deliv81'1e ll C~il~ectl~\J on to
~~ete 12 wher~ these bubbles of air diluted the gas
on this plate. ~his aocounted for the app~rently low
vAlue of CO2 oonoentration in the exit gas and the
sha~p break in the c~ve of Fig. 1.~Q correct this, the diameter of the enlarged
section below the orifice was increased from lin to 2"
standard pipe made oonsiderable longer as shown in
Fig.~. On the next run, the pressure in this section
was measured With a small m~nometer and found to be
equal to atmospheric.
RUNS TVlE:t\T1~ TO SIXTEEN
~he mat-erial b81B.nce o-f run number t\jvelve c.hecked
to 2bo'Llt 10 I>er cel'lt, poorer than any o£ the subS6,nuent
There remained the necessity of devising 8 method
of colleoting gas s~~les continuously throughout the
run which would eliminate the necessity of analyzing
the gas dur1,ng the ~1un~ eliminB-te the difficulty en
oountered ,:vhen the g~s s~l,mp]..es ·vvere collected over

32
S odi urn sulf~,te 801utioll, ;::u1d ,::,180 to enable a large
number of samples to be collected.
This WaS accomplished by supporting the gas sample
bottles ebove the bath and fitting each with 9 two
hole stopper with glass tubes and pinch oocks as
shown in figure 8. The bottles were first filled with
distilled water, RS was the bAth. The lines were
flushed out, then the bottles were attached as shown.
When filled. the gas in the bottle was in contact
125m/. nl3off/e U
Glass lube
Support
"'---~ OQS line'From tow~r
FIG 8 .SAMPLE BOTTLE
with only a small 8reB of the liauid in the bath.

33
The discharge liouicl fl"'OIn l'"1lill thirteen was caught
in a drum. Air was blown th~ough it for five hours.
The CO2 content ha.d been reduced about 85% and its ab
sorbing power was nearly 95% as muoh AS freshly dis
tilled water. This method of regenergtion W3S used
for the next three runs.
DIR.E'C'T!ONS FOR OPERATION
The lia,Ui,d. storage drum should be filled long
enough before-hand to allow the liauid to come to a
oonstant temperature. Before the run, sufficient
liauid sample tubes should be filled With ten mI. of
appraximately 0.05 nOJ?m2.1 b2ri tun h;ld.:roxi de • 1~18 0 ,
the g8,S sample bottles shottld be fille d 1J!i th clis
tilled water and placed in the collecting raok, but
not Btt~ched to the gns lines. After the CO2 tank
valve is vvarm, the 11tJn can begin.
Liau1cl ana. g2.S are st~.r·te(1 211d adjusted to
steady conditions~ the liquid rate being controlled
by the ori,fice and. the gas rate by the valves and
flow meters. Readings of temperatures and pressures
sre tFlken pe:riodic2:11y, JGhJ:'Otl~~:hou·t the run. After
tilVenty minute s of continuous operation, t he gas
lines are fltlshed by momentarily opening eaoh vBlve.
After this, the gas sample bottles are connected and

34
the rate in eaoh adjusted to about one bubble per
seoond. In this manner they Can be t2ken contin
uousl~v thl'tOlJ.ghout the run. T'he iin.Uid sRmples !~re
collected by filling each tube to the 35 mI. msrk.
The liquid samples should be t8](en preferr1.bl.V by
starting at· the bottom and working up the tower.
One man is required to operate the valves
regulating the gas flow. Another watches the inlet
o'r1fiae meter, compensating from time to time for
the d.rop of liquid he ad in t he drum. He :}lso times
the gas meter revolutions, reads meter pressure, inlet
liquid and outlet gas temperatures periodically. A
third man reads outlet liquid and inlet gas temper-" .
atures anci colleets liQui·.d samples. A fourth is
responsible for pressure readings, colleoting gBS
saInlJles Rnd assists where needed.. ,
35
RESULTS
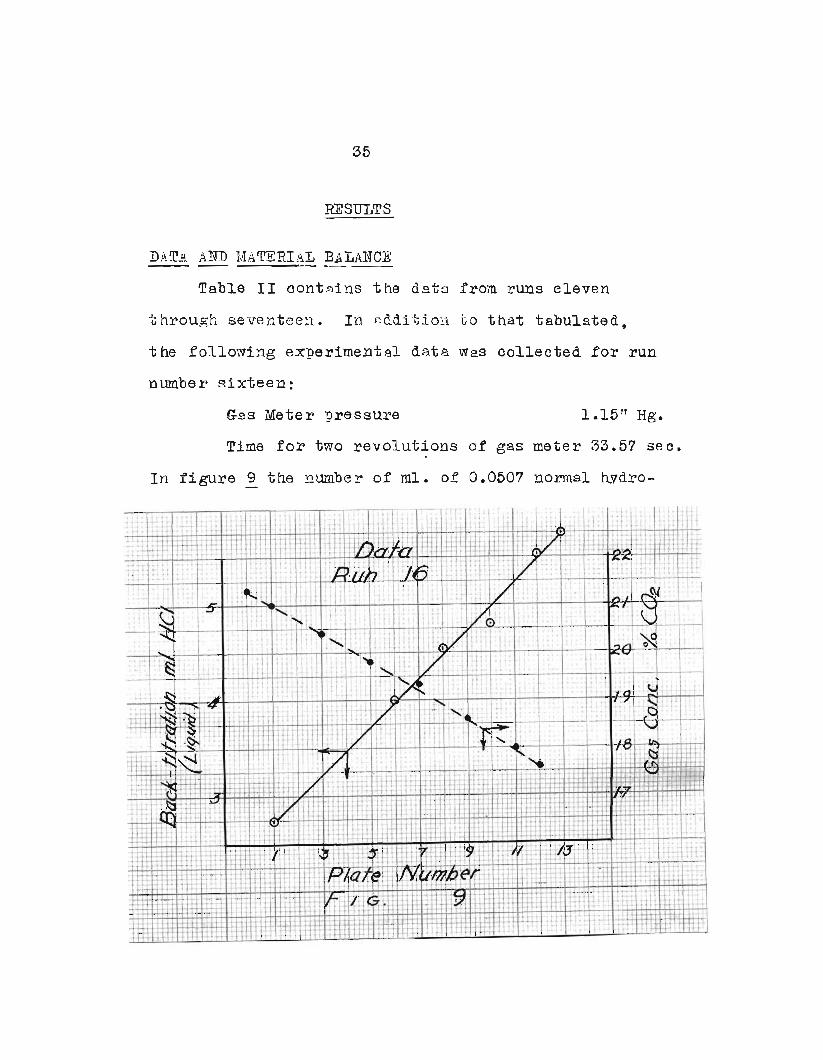
'Df~T_~ A:NJ) rJ!ATERI_~L BALAlfCE- -----Table II contAins the d2ts from runs eleven
through seventeen. In fidditiol1 to that tabulated,
the following experimental data WaS collected for run
l1umber sixteen:
Gas Meter pressure 1.15" Hg.
Time for two revolutions of gas meter 33.57 sec.
ITl figure ~ the l1umber of mI. of 0.0507 normal hydro-


37
ohloric acid reauired to titrate the exoess hydroxide
is plotted against the plate number from which the
sample· was drawn. Also the carbon dioxide concen-
tration of the gas sample W2S plotted against plate
number.
CALCULATION OF ABSORPTION FROM LIQUID DATA.........-..-. .........- -
Si11ce the to!> liq.uid sample required 5.4:8 rill.
of ~cid 2nd the bottom 2.49 ml.--
(5.48 - 2.49) 35 x 0.0507 x 1000 x 1 :0.0000764 mols-20 1000 ~ ~ x 55.55
CO2 absorbed per mol H20 ~nd:
0.0000764 x 11.83 • 0.0000502 mo1s CO2 absorbed per18
minute 88 calculated from the liauid analysis.
CALCULl'tTION OF ~·lBSO.RPTI·OI~ FROT·.:! GeS J).,~TA
Two revolutions of the gas meter indioate 0.2 cttoio
feet, then, times the cAlibration feetor, 1.0~7, we get:
0.2 x 1.027 x 60 = 0.367 cubic feet wet air at meter3"3:07
conditions in per minute. At the liquid temperature the
vapor pressure of water is 31.5 ~n. ~herefore:
0.367 x (744 +- (1.-·15 x 25.4)' - 31.5) x 273 = 0.000899:;~ _._-- 760 mr.r
mols dry air (inert gas) in pel~ nli:rlute. The gas concen
tration chRnges from 21.3% to 17.6%.
0.000899 x 0.213 - 0.000243 mols CO2 inQ.787
0.000899 x O.l76 = 0.000192 mols CO2 outO.8~ 0.000051 mals C02 absorbed per min
38
as calculated from the gas analysis. This checkR the
figure of O~0000502 from the liauid analysis within
Ip %which is entirely satisfactory.
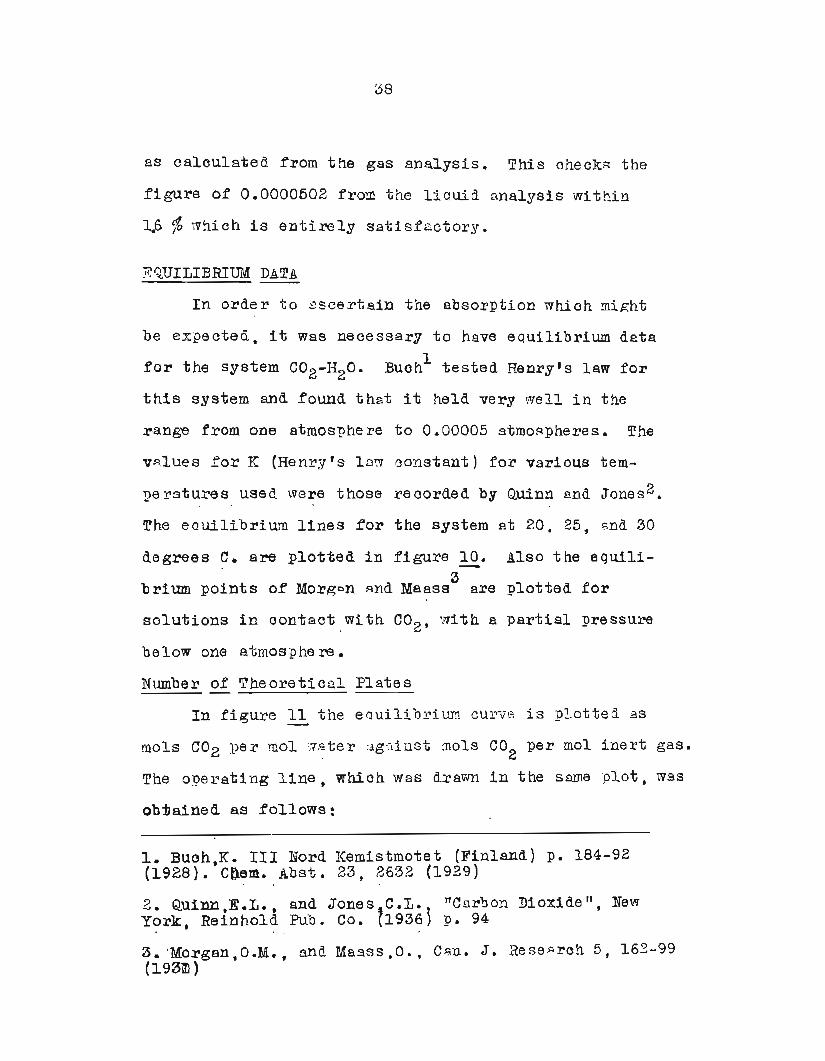
EQUILIBRIUM DA·TA----_......._-In order to 2scertain the absorption which might
be expected, it was neoessa~y to have equilibrium data
for the system CO2-H20. Buohl tested Henry's law for
this system and found that it held very vvell in the
rang~ frQ·m one atmosphere to 0.00005 atmospheres. ~he
VAlues for K (Henry's law constant) for various tem
peratures used were those recorded by Quinn and Jones2 •
The eauilibri~ lines for the system at 20. 25, 8nd 30
degrees C. are plotted in figure 1£. Also the equili3
brium points of Morg~n ~nd Maass are plotted for
solutions in oontact with 00 9 , with a partial pressure'-'
below one atn1osp.he re.
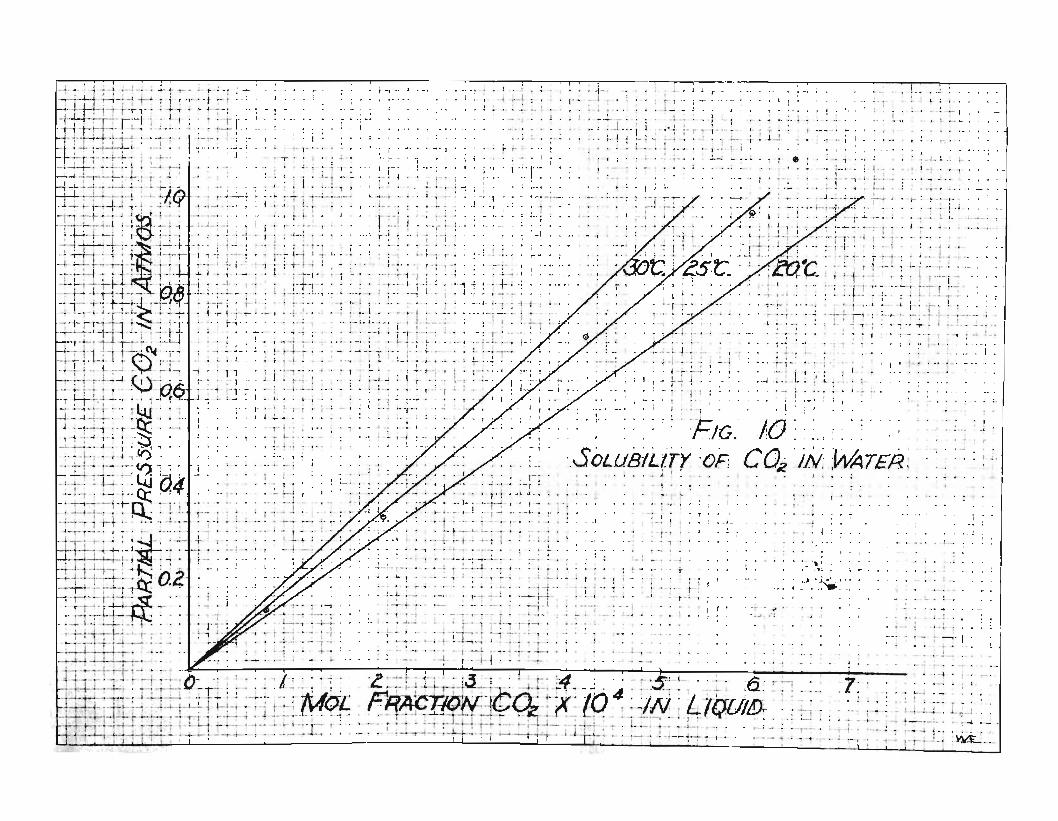
Number of Theoretioal Plates----------In figure l~ the eQuilibl'1iurn CU1T \te is plotted. as
mols COn per mol water against mols CO per mol inert gas.~ .., 2
Th~ operating line, which was dravvn in the S2me ~plot, was
obtained as follows:
1.· Buch,K.··· -III Nord Kemistmotet (Finland) p. 184-92(1928).· Ct).e,m.Abst. 23, 2632 (1929)
-" . .
2. Quinn E.L. and JoneStC.L·.) TtCnrbon nioxide ff, Ne\1Vt ,
York, Reinhold Pub. Co. 1936 p. 94.
3,. 'Morgan,O.M•• rind Maass ,0., CHn. J. ReseRrch 5, 162-99(l93ID )
·····1-.
L.,
.+
;"1
i;-
•..-.--
t~

41
Liquid in at 0.0000108 mols CO~ per mol water." -;,...J
Gas out at 17.6% CO2 = 0.2136 mols CO2 per mol inert.
Thus 0.0000108, 0.2136 are the coordinates of
point ttB ff (figure 11) representing the top of the
tower. Likewise. O.0000872~ 0.271 are the coor-
dinates of point "An, the bottom of the tower. The
usual step-wise procedure (indicated by the dotted
lines) for determining the number of theoretical
plates required ,fo~ the ~bsorption, shows about one
theoretical plate needed. Thus, by dividing by
twelve actual plates, a plate efficiency of about 8.3
per oent is obtained. This checks the results of1
Whitman and Davis who were a.bsorbing carbon dioxide
in ~ bubble plate tow~r with sodium carbonate solution.
CALcU"tAT'rON OF KL~.
The following caloulations for run sixteen are
typical of the method. The driving foroe can be ob
tained from the plot in Figure ll. For the bottom
of the tower it is the horizontal distance between
point "Au. and the eqUilibrium curve. or:
(1.12 - 0.871) x 10-4 = 0.249 x 10⁻⁴ IDols C02 per
mol water.
1. Whitman,W.G. 9 and DaVistG.H.B.~ "A Comparison ofG~s Ab-so:1'ption ·and Rect1fioa.tion u
t Ind. Eng. Chern.,18 t 26'4-6 ,. (1926)

42
Likewise, the driving force at the top is:
(0.925 - 0.106) x 10-4 =0.819 x 10⁻⁴ mols CO2
per
mol water.
Logarithmic mean driving force =
(O~819 - 0.249) x 10-42.302 log 0.819
\.J~'~
- 0.479 x 10⁻⁴ mols CO2 per mol water.
Tower volume = 1.57 cubic feet. (superfioial)
Mols CO? absorbed per hour =30.12 x 10⁻⁴f,...j , •
i'herefore I KL9 = ·30.18 x 10⁻⁴ /10-4 = 40.1 mols CO21.57 x 0.479
8bso~bed per hour ~~r oubic foot per unit
driving force (in mols CO'2>c,IYer mol water)
The values of KLs were ca.loulated for run eleven
to sixteen inclusive. For comparison, the values of
KL3 were .oalculated from.the data of those investi
gators using. the CO2 - water system. Sherwood, nraemel.1
and Ruckman t who were using a paaked tower of 18 inoh
diameter. re'Port that KLs varies as the 0.88 'pov'Ver orthe water rate expressed in pounds per hour per square
foot. ~he othe~ investigators used glass towers with
sm~ll cross seotional areaS. Although this relation
1. Sherwood,T.K., Draemel,F.C., snd RuclanBn,N.E.~
"Desorption o.f·C02from W.ater in a Packed Tower", Ind.Eng. Cnem., 29, 282-5 (1937)

43
of KL8 to liquid rate given by Sherwood 1s not exact
in the case of small d.iameter towers, it is probably
the best method for comparing results. Hence all
values were oorrected to the liquid rate used in the
pr~sent work. (2034 Ibs. per hr. per sq. ft.) These
values are tabulated in Table III.
TABLE III
Tower Absorption Coefficients
Run Equipment Tower Temp. KLaDiam. in. deg. C'.
11 Bubbl~ plate 8.0 31.7 34.8
12 Bubble plate 2 30.7 40.2
13 Bubble plate 2 28.9 34.9
14 Bubble plate 2 28.6 37.7
15 Bubble plate 2 27.6 39.4
16 Bubble plate 2 30.1 40.1
Sherwood et 81 In carbon ring 18.0 23.9 59.0,
Simmons andOsburn Raschig rings 3.58 10.4 26.2
Payne and Dodge glass rings 2.84 25.0 20.8
Cante.l0 at 21 Rascltigr1ngs 3.58 7.0 8.7
17* Bubble pJ.ate 8.0 27.0 21.2
*Run 27 waS made us ing addition agent flLUPomin tf •

44
~he value's o-f KL2 determined in this work are in
fair agreement among themselves and are of the same
order at magnitude as those of other investigators.
The differences are largely due to variations in
operating conditions. Temperature affects the co
efficient. KLa is also a function of liquid rate and
even though the values have been corrected to a sim
ilar water rate, data from small towers, under eight
inohes in d1~eter9 have been found not to be appli
cable to larger equipment.
For comparisoD, the best vaiue is probably that of
Sherwood which indioates that the bubble plate tower is
less efficient than a packed tower. This is some what
out of line, in as much as bubble plate towers are es
pecially adapted to the case of liquid film oontrolling.
However, where this type of equipment does eXist, it
can be operated with efficiencies at least oomparable
with other types. The higher initial cost and larger
pressure drop acoount for their limited use.

4~
~m EFFECT OF SURFACE TENSION ON THE R~TE OF ABSORPTION- -.... -----------If we consider a gas moleoule moving from the gas
phase into the liquid phase, it seems possible that
the physical properties of the liquid at the interface
could affect the rate of transfer. Visoosity has been
eorrelated With rate of absorption for the case of CO2in hydroxide and carbonate by Hitchcock and Cadot1 •
2Riou and co-workers ohanged the oisoosity of the ab-
sorbing liquids by adding inert substanoes suoh as
glycol, glycerine, and aloohol. They ooncluded that
T1soosity Was not a controlling factor in the absorption
rate. However the change of surfaoe tension resulting
from these addition agents and the possible effeot
upon absorption Was not mentioned.
C10ser investigation of the data of Riou shows
that in the cases mentioned above where the rate was
inC~2sed by addition agents the surfaoe tension Was
reduoed. For example, in the case of ethanol, the
surfaoe tension was deoreased about 30% and the rate
of absorption increased 30% although the viscosity
WaS increased over the ssne range of concentration.
1. Hitchcook,~.B.t ana Cadot,H.M., nRate of Absorptionof CO2 It. Ind. Eng. Cham., 27, 728-32 (1935)
2. Riou,Paul and Cartier,Paul. "Influence of V1scoai~y
on Rate or Absorption of CO2 by Means of Neutral SOd1umCarbonate Solutions tt , Compt. rend., 186,1727-9 (1937)

46
1Killeffer used suoh agents as formaldehyde and
methyl alcohol in carbonate solutions to absorb CO2
and reports increases of 115% and 20% respeotively.2 .
Williamson and Mathews absorbed CO2
in K2C03solution. They report "than an lfal ooho110 solution"
3inoreased the rate 40%. Uhlig developed equations for
the work involved when a gas moleoule Was absorbed by
consiQeration of free energy changes, diameter of
molecules, and surfaoe tension. He showed clearly
the relation of surface tension of the liQuid and gas
solubility.
It appeared plaUsible that a high surfaoe tension
would have a retarding effect on the gas moleoules.
Since most or the above. mentioned agents give only a
rela-tively small decrease in surface tension and with
the introduotion of newer, powerful surfaoe active
agents suoh as Aerosol O.T. it waS deoided to make a
preliminary investigation of this effect.
It was found that a 0.1% solution or Aerosol O.T.
in water foamed so much as to make it unusable in a
tower. Attempts to find a suocessful defoaming agent
~. Killeffer,D.H., rtAbsorption of C02" t Ind. Eng.Chem., &9, 1293 (1937) .
2. Williamson,R.V., and Methews,J.H•• "Ra.te of Absorption and Equilibrium of CO2 in Alkaline Solutions tf
,
Ind. Eng. Chem., 16,1157-61 (1924)
3. UhligtH~H., "The S·olubility of Gases and Surfaoe~ensionnt J. Phys. Chem., 41, 1215 (1937)
47
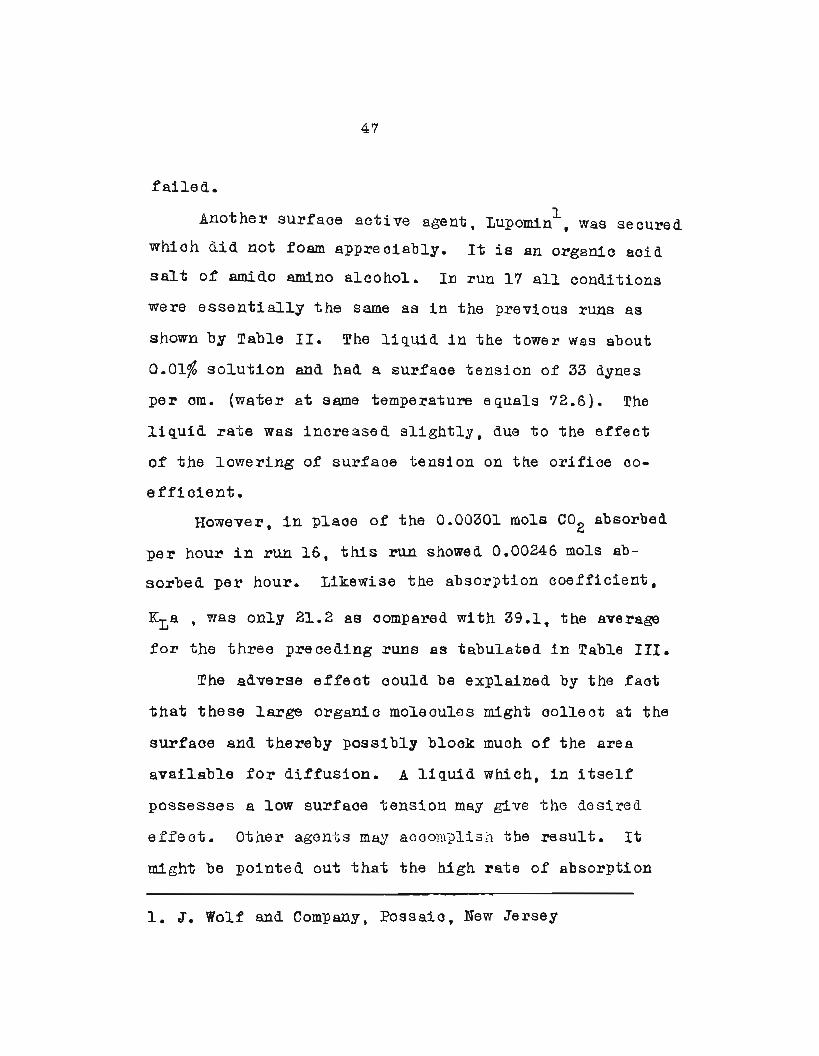
-failed.
Another surface active agent, LUPOmin1 , was secured
whioh did not foam appreoiably. It is an organic acid
salt of amido amino aleohol. In run 17 all conditions
were essentially the same as in the previous runs as
shown by Table II. The liquid in the tower WaS about
0.01% solution and had a surfaoe tension of 33 dynes
per om. (water at same temperature equals 72.6). The
liquid rate was increased slightly, due to the effect
of the loweri,ng of surface tension on the orifice 00-
effioient.
However, in place or the 0.00301 mols CO2 absorbed
per hour in run 16, this run showed 0.00246 mols ab
sorbed per hour. Likewise the absorption coefficient,
KLs , was only 21.2 as oompared with 39.1, the avera@B
for the three preceding runs 2S tabula.ted in ~able III.
The adverse effect could be explained by the faot
that these large organic mo1eoules might oollect at the
surface and thereby poss'ibly block muoh of the area
available for diffusion. A liquid Which, in itself
possesses a low surface tension may give the desired
effeot. Other agen-l;s may acoonrnlis:l the result. It
might b~ pointed out that the high rate of absorption
1. J. Wolf and Company, Possaio, New Jersey
48
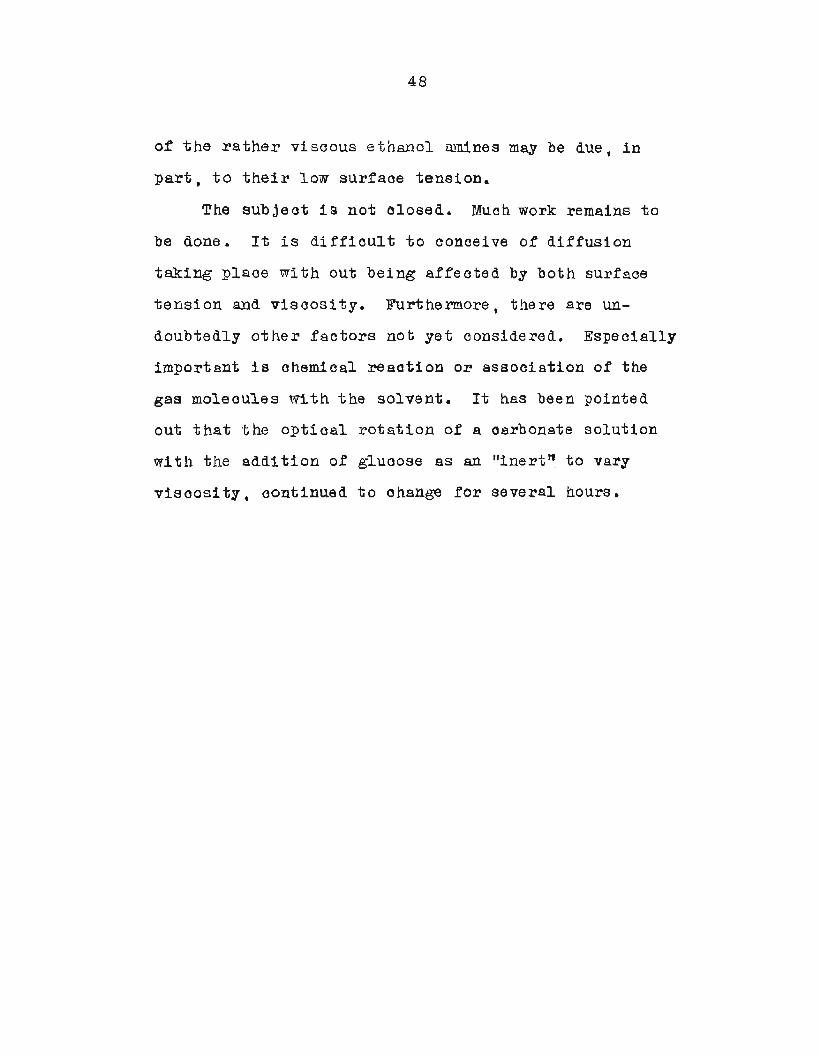
of the rather viscous etharlol ulnines may be due, in
part, to their low surfaoe tension.
The subjeot is not alosed. Much work remains to
be done. It is difficult to conceive of diffusion
taking place With out being affected by both surface
tension and Viscosity. Furthermore, there are un
doubtedly other factors not yet considered. Especially
important is chemioal reaction or association of the
gas moleoules With the solvent. It has been pointed
out that ·h.he optical rotation of a carbonate solution
with the addi tion of gluoose as an tfinert:~ to vary
visoos1t~t continued to change for several hours.
49
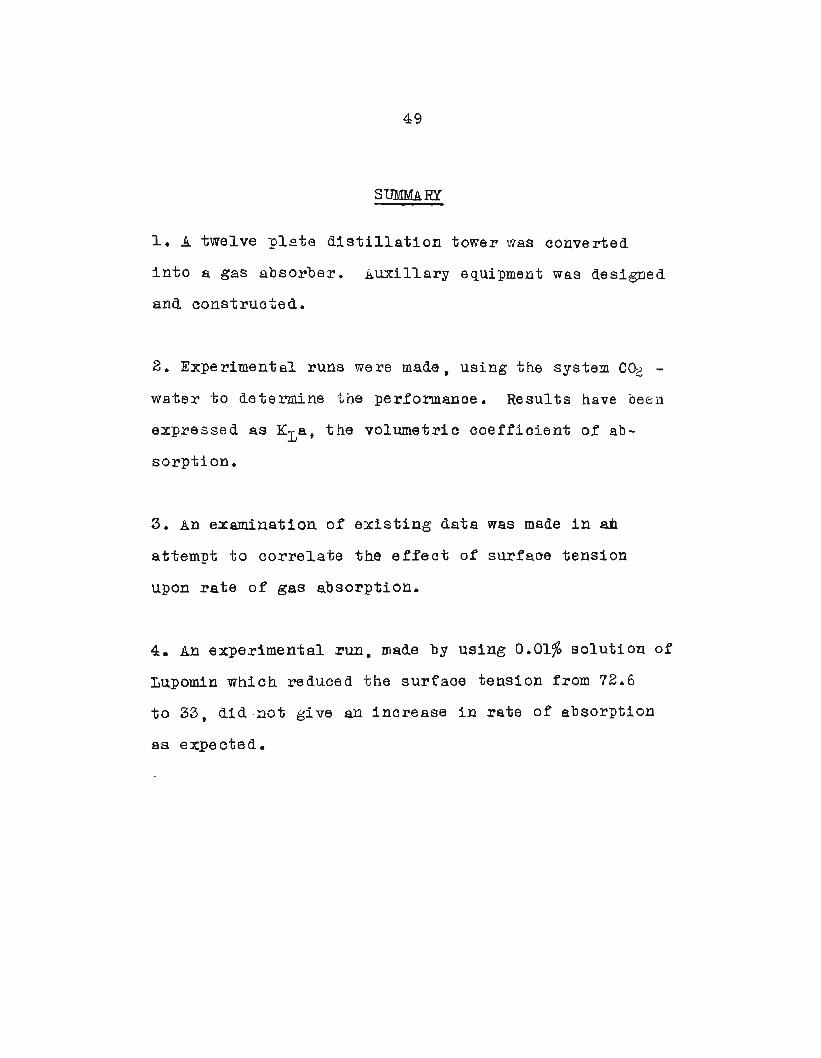
SUMMARY
1. A twelve plate distillation tower was converted
into a gas absorber. Auxillary e~uipment Was designed
and construoted.
2. Experimental runs were mac1e,. using the system C02 ~
water to determine the performanoe. Results have be n
expressed as KLs, the volumetric ooefficient of ab
sorption.
3. An examination of existing data was made in an
attempt to correlate the effect of surfaoe tension
upon rate of gas absorption.
4. An experimental run, made by using 0.01% solution of
Lupomin whioh reduced the surfaoe tension from 72.6
to 33, did-not give an increase in rate of absorption
as expected.
50
BIBLIOGRAPHY
1. Atkins, G. T ., and Franklin,W•B., tt,a Simplifie d I\~e thod
for Absorber Des1gn U, Refiner and Natural Gas-
Mfr., 15, No.1, P.30-2 (1936).
2. Buch,K., III Nord Kemistmotet (Finland), p.184-92
(1928) Chem.Abst. 23, 2632 (1929).
3. Cantelo,R.C., SimmonstC.W~, Giles,E.M., and Brill,F.A.,
"Tower Absorption Coefficients Tt , Ind. Eng. Chern.,
19, 989-92 (1927).
4. Chilton,T.H., DUffeY,H.R., and Vernon,H.C., "'T-he
Absorption of Gases in Packed Towers Tf, Ind. Eng.
Chern., 29, 298-30l (1937).
5. Comstook,C.S., and Dodge ,B.F. t URate of CO2 Absorp
tion by Carbonate Solutions in a Paoked ~owern,
Ind. Eng. Chem., 29, 520-9 (1937).
6. Davis ,H.S. , "Initial Absorption Rates of CO2 by
Water and Dilute Sodium Carbonate Soltuions lt,
Ind. Eng. Chem., 25, l023~25 (1933).
7. Fiss ,E. C. t ftThe Design ,Construotion, and Operation
of a Carbon ])1o:x:1de Absorption Tower tf, Thesis,
Atlanta, Georgia, Georgia School of Technology,
1938.
8. Goosmann J.O. "CO~ in Its New Field of Usefulness,nt , '-J
loe and Refrig., 79, 399 (1930).
51
9. Gregory ,L.B., a.nd Seharmann,W .G., "Carbon Dioxide
Sorubbing by Amine Solutions Tf, Ind. Eng. Chem.,
29. 514~19 (1937).
10. Hanks t W. V. t and ].[oAdams,W.H., tfStudie s in Absorp
tion Tt, Ind. En.g. Chern., 21 t 1034-9 (1929).
11. Haslam,R.T., HersheY,R.L., and Kean,R.H., "Effeot
of Gas Velocity and Temperature on Rate of
Absorption n , Ind. Eng. Chem., 16, 1224-30 (1924).
12. Hirst ,L.L. and Pinkel t I. I., rt,Absorption of C02 by
.!mines", Ind. Eng.Chem_, 28,1313-15 (1936).
13. Hitohcock,L.B., URate of absorption of C02 tf, Ind.
Eng. Chern., 26, 1158-67 (1934).
14. Hi tchcock,L.B., and. Cadot ,H.M., "Rate of Absorp
tion of COa", Ind. Eng. Chem., 27,728-32 (1935).
15. Hi tchoock,L.B., !3Mechanism of Gas Liquid Re-
aotion Tl , Ind. Eng. Chem., 29, 302-8 (1937).
16. Hix8on,A.W., and S<3o·tt,C.E., ffAbsorption of Gases
in Spray Towe rs ff, Incl. Eng. Chern., 27, 307 -1:4
(1935) •
17. Killeffer ~D.H. , flAbsorption of Carbon Dioxide If ,
Ind. Eng. Chem., 29,1293 (1937).
18. Kobe ,K.A., and. Williams t J .3 •• "Confining Liquids
tor Gas Analysis If, Ind. Eng. Chem., Anal. Ed.,
7,37-8 (1935).
02
19. Kowalke ,O.L., Hougen,O.A. t and Watson K.M. ttAb-. , ,
".
sorption of Ammonia in Towers t tf Chem. Met. Eng.,
32, 443-6 (1925).
20. Lewis,W.K., and Whitman,W.G •• ttPr1nciples of Gas
Absorption rr ~ Ind. Eng. Chern., 16 t 1215-20 (1924) •.,
21. McCabe,W.L., andSwanson,W.H., ftThe Paulson Aoid
Absorber tr, Paper ~rade J. t 92, No.26, 48-50 (1931).
22. Morgan,O.M_. and Maass,O., "An Investigation of the
Equilibria Existing in Gas-Water Systems Forming
Ele"otrolytes tr, Can. J. Research, 5, 162-99 (1931).
23. Payne, J •W., and Dodge,B.F., URate of Absorp"Gion or
CO2 in W"ater and ,in Alkaline Media tf, Ind. Eng.
Chem., 24, 630-7 (1932).
24. QU1n~,E.L., and Jones,C.L., '~Carbon Dioxid.e,tf New
York, Beinhold Pub. 00., p. 64 (1936).
25. Reynolds,B.M., and Sanders,F.W., Thesis. Cambridge,
Mas s ., M. I . T., t1931).
26. Riou,PaUl and Cartier,Paul, fflnfluence of Viscosity
on Rate of Absorption of CO2 by Means of Neutral
Sodium Carbonate Solutions", Compt. rend., 186,
1727-9 '(1928).
27. Sherwood,T .K., "Absorption and Extraction" t New York,
MCGraW-Hill, 1937, 1>. 191.
28. Shervvood,T.K., Draemel,F.C., and Ruckman,N.E.,
tTDesorption of C02 from Water in 8 Paoked Tower tf,
Ind. Eng. Cham., 29, 282-5 (1937).

53
29. Simmons,C.W., and Long,J.D., ffTower Absorption Co
efficients", Ind. Eng. Chem., 22, 718-21 (1930).
30. Uhlig,H.R., lIThe Solubility of Gases and. Surface
Tension", J. Phys. Chem., 41, 1215 (1937).
31. Wh1tman,W.G., and Davis,G.H.B., "A Comparison of
Gas Absorption and Reotification", Ind. Eng.
Chem., 18, 264-6 (1926).
32. Willlamson,R.V., and Mathews, J .H., "Rate of Ab
sorption and Equilibrium of C02 in Alkaline
Solut1ons tt , Ind. Eng. Chem., 16, 1157-61 (1924).
33. Wood,W.R., and storrs ,B.D •• "Girbotol Purification
Process Tf , Proc. Am. Pet. Inst., Sect. III, 19M,
34-6 (1938).
Related Documents


![a Carbon Dioxide Absorption Process Using [hmim][Tf2N]](https://static.cupdf.com/doc/110x72/62a0635d4dc673155024f898/a-carbon-dioxide-absorption-process-using-hmimtf2n.jpg)