Journal of Sustainable Development of Energy, Water and Environment Systems http://www.sdewes.org/jsdewes Year 2018, Volume 6, Issue 3, pp 481-493 481 ISSN 1848-9257 Journal of Sustainable Development of Energy, Water and Environment Systems http://www.sdewes.org/jsdewes Modelling Studies on Reactive Absorption of Carbon Dioxide in Monoethanolamine Solution from Flue Gas in Coal Based Thermal Power Plants Tanmay Singhal 1 , Sampatrao D. Manjare *2 1 Department of Chemical Engineering, BITS Pilani K K Birla Goa Campus, NH 17B, Bypass Road, Zuarinagar, Sancoale, Goa 403726, India e-mail: [email protected] 2 Department of Chemical Engineering, BITS Pilani K K Birla Goa Campus, NH 17B, Bypass Road, Zuarinagar, Sancoale, Goa 403726, India e-mail: [email protected] Cite as: Singhal, T., Manjare, S. D., Modelling Studies on Reactive Absorption of Carbon Dioxide in Monoethanolamine Solution from Flue Gas in Coal Based Thermal Power Plants, J. sustain. dev. energy water environ. syst., 6(3), pp 481-493, 2018, DOI: https://doi.org/10.13044/j.sdewes.d6.0227 ABSTRACT In this paper the detailed theoretical investigation on absorption of carbon dioxide, from flue gas in coal based thermal power plants has been presented. For absorption studies, monoethanolamine solution is considered as a solvent. The mathematical model for the absorption column has been developed by considering thin film model approach. Unified method is used for an overall estimation of carbon dioxide absorption. The carbon dioxide concentration profile at a given stage, using the thin film layer model, has been predicted at 298 K and 318 K. From the results it is noted that carbon dioxide concentration decreases from interface concentration at equilibrium to a minimum of 0 kmol/m 3 up to a distance of ±2 micrometers. Overall estimation of carbon dioxide absorption has been carried out using the unified model approach. The total amount of carbon dioxide absorbed in absorption column is estimated to be 95.60% of the inlet carbon dioxide with 30 trays, L/G ratio of 8.5 and carbon dioxide flow rate of 95.74 kmol/m 3 . The results revealed that reactive absorption is very effective in absorbing carbon dioxide into monoethanolamine solvent. KEYWORDS Carbon dioxide absorption, Mass transfer, Henry’s law, Film theory, Monoethanolamine. INTRODUCTION India is amongst the top four Carbon dioxide (CO2) producing countries with China, US, and countries under European Union, it produced about 2,341,000 kt of CO2 in 2014 [1]. In India, 38% of total CO2 emission is due to electricity production [2]. 71% of the total electricity supplied in India is generated using thermal power plant of which 62% is fulfilled using coal based thermal power plants [3]. This number is huge because India requires a large amount of electricity which is produced by power plants present across the country. * Corresponding author

Welcome message from author
This document is posted to help you gain knowledge. Please leave a comment to let me know what you think about it! Share it to your friends and learn new things together.
Transcript
Journal of Sustainable Development of Energy, Water
and Environment Systems
http://www.sdewes.org/jsdewes
Year 2018, Volume 6, Issue 3, pp 481-493
481
ISSN 1848-9257
Journal of Sustainable Development
of Energy, Water and Environment
Systems
http://www.sdewes.org/jsdewes
Modelling Studies on Reactive Absorption of Carbon Dioxide in
Monoethanolamine Solution from Flue Gas in Coal Based Thermal
Power Plants
Tanmay Singhal1, Sampatrao D. Manjare*2 1Department of Chemical Engineering, BITS Pilani K K Birla Goa Campus, NH 17B, Bypass Road,
Zuarinagar, Sancoale, Goa 403726, India
e-mail: [email protected] 2Department of Chemical Engineering, BITS Pilani K K Birla Goa Campus, NH 17B, Bypass Road,
Zuarinagar, Sancoale, Goa 403726, India
e-mail: [email protected]
Cite as: Singhal, T., Manjare, S. D., Modelling Studies on Reactive Absorption of Carbon Dioxide in
Monoethanolamine Solution from Flue Gas in Coal Based Thermal Power Plants, J. sustain. dev. energy water environ.
syst., 6(3), pp 481-493, 2018, DOI: https://doi.org/10.13044/j.sdewes.d6.0227
ABSTRACT
In this paper the detailed theoretical investigation on absorption of carbon dioxide, from
flue gas in coal based thermal power plants has been presented. For absorption studies,
monoethanolamine solution is considered as a solvent. The mathematical model for the
absorption column has been developed by considering thin film model approach. Unified
method is used for an overall estimation of carbon dioxide absorption. The carbon
dioxide concentration profile at a given stage, using the thin film layer model, has been
predicted at 298 K and 318 K. From the results it is noted that carbon dioxide
concentration decreases from interface concentration at equilibrium to a minimum of
0 kmol/m3 up to a distance of ±2 micrometers. Overall estimation of carbon dioxide
absorption has been carried out using the unified model approach. The total amount of
carbon dioxide absorbed in absorption column is estimated to be 95.60% of the inlet
carbon dioxide with 30 trays, L/G ratio of 8.5 and carbon dioxide flow rate of
95.74 kmol/m3. The results revealed that reactive absorption is very effective in
absorbing carbon dioxide into monoethanolamine solvent.
KEYWORDS
Carbon dioxide absorption, Mass transfer, Henry’s law, Film theory, Monoethanolamine.
INTRODUCTION
India is amongst the top four Carbon dioxide (CO2) producing countries with China,
US, and countries under European Union, it produced about 2,341,000 kt of CO2 in
2014 [1]. In India, 38% of total CO2 emission is due to electricity production [2]. 71% of
the total electricity supplied in India is generated using thermal power plant of which
62% is fulfilled using coal based thermal power plants [3]. This number is huge because
India requires a large amount of electricity which is produced by power plants present
across the country.
* Corresponding author
Journal of Sustainable Development of Energy, Water
and Environment Systems
Year 2018
Volume 6, Issue 3, pp 481-493
482
The CO2 emission from thermal power plants in India was estimated to be 4.98 × 10⁸
metric tons in the year 2009-2010 [4]. India has about 116 coal based thermal power
plants with near about 429 units.
The total power capacity from all these plants comes around 167,707.88 MW per
year [5]. The impact of this huge CO2 emission is rising of global temperature, i.e. global
warming, which is posing great threat not only to the environment but to human life as
well [6].
Therefore, there is a need to study post combustion treatment technologies for CO2
removal. Among the existing technologies for CO2 removal, absorption is one of the most
suitable technology [7]. In this paper the authors have carried out detailed theoretical
investigation on reactive absorption of CO2 using Monoethanolamine (MEA) solution as
the solvent. The method involved in this process is reactive absorption, i.e. the absorption
of CO2 from the gaseous stream into MEA accompanied by the reaction where CO2 and
MEA combine to form ester (R1HCOO−) and primary amine (R1NH3+) which enhances
the mass transfer between the two. In order to understand the state of art in CO2
absorption, the literature survey has been carried out in presented in following section.
Literature studies
Several studies have been carried out over the years on absorption and reactive
absorption of CO2 using various solvents such as Methyldiethanolamine (MDEA), MEA,
ammonia, Diethanolamine (DEA), blend of MDEA and ethanolamine. Zhang and
Chau-Chyun [8] used electrolyte Nonrandom Two-Liquid (NRTL) activity coefficient
model to develop a rigorous and thermodynamically consistent representation for the
MDEA-water-CO2 system. The model has been validated for predictions of
Vapor-Liquid Equilibrium (VLE), heat capacity, and CO2 heat of absorption of the
MDEA-water-CO2 system temperature range of 313 K to 393 K. Liu et al. [9] studied
absorption of CO2 absorption in ammonia. They concluded that ammonia could be better
solvent for CO2 absorption. However, they have mentioned further experimental
investigations are necessary. Lawal et al. [10] presented a study on chemical absorption
of CO2 in MEA solution based dynamic modeling of the absorber and regenerated
columns linked together. They concluded that the model predicts the absorber and
regenerator temperature profiles and CO2 profiles very well. Molina and Bouallou [11]
investigated kinetics of CO2 absorption into mixed solutions of MDEA and DEA.
Their study primarily focused on to optimize the blend composition to capture CO2.
In most of these studies, a single stage CO2 absorption using thin film mass and heat
transfer laws have been considered. These studied predicted the distance, from gas-liquid
interface to the point at which CO2 get absorbed in the solvent, using either equilibrium
stage or rate based model.
A study done using gPROMS showed rate based model gives better prediction than
the equilibrium model for CO2 absorption using MEA. It also states that effect of
L/G ratio is more sensitive than effect of flow rate change [12] which was verified in this
study as well. Another study rate based model was validated using 0.1 MW pilot plant in
South Korea which showed good agreement with data except when the L/G ratios taken
were low [13]. Study of CO2 absorption using aq. MEA using a packed tower has been
done which were in agreement with industry scale pilot plant data [14].
Dynamic modeling of CO2 absorption from coal-fired power plants into an aqueous
monoethanolamine solution has been carried out using Aspen Tech software [15].
The authors have studied the transient simulation of absorption column and the results are
validated with experimental data. A detailed a state-of-the-art review on post-combustion
CO2 capture with chemical absorption is presented by Wang et al. [16]. The authors have
concluded that more efforts in future should be directed to reduce energy combustion in
Journal of Sustainable Development of Energy, Water
and Environment Systems
Year 2018
Volume 6, Issue 3, pp 481-493
483
post combustion CO2 capture with chemical absorption. Dynamic behavior of coal-fired
power plants with post combustion CO2 capture is studied by Wellner et al. [17].
The authors used a model-based control strategy based on existing directives for power
plants with post combustion CO2 capture. Aboudheir et al. [18], investigated the kinetics
of the reaction between CO2 and high CO2-loaded, concentrated aqueous solutions of
MEA for the temperature range from 293 to 333 K. They proposed a new
termolecular-kinetics model, for CO2-MEA solution, which proved to be better than
previously published kinetic models. Zhang and Chen [19] have performed simulation
studies with both the rigorous rate-based model and the traditional equilibrium stage
model for CO2 absorption with MEA. The model results were validated with the pilot
plant data from recently published literature. They concluded that the rate-based model
yields better predictions compared to equilibrium stage model. Plaza et al. [20],
presented results of CO2 absorption in MEA with a new model that uses a rigorous
thermodynamic model from the published literatures.
From above mentioned literature survey it is noted that researchers across the globe
are striving to find the unique model for prediction of the performance of absorption
column for the CO2 absorption. Authors have used rate based and equilibrium NRTL
models and simulated them using various software like gPROMS and ASPEN plus.
Most of papers don’t provide the data for overall estimations of concentration profile of
CO2 (performance of the column) and its variation with L/G ratio and number of stages.
In view of above, this study tried to provide the theoretical investigation of the
absorption tower to predict the performance of the single stage as well as the absorption
column for CO2 absorption. Further, it provides the stage concentration profiles of CO2 at
various temperatures, inlet flow rates and liquid to gas ratios. The liquid phase
CO2 concentration on a particular stage is estimated using interfacial mass transfer
concepts and by applying Henry’s law at the gas-liquid interface. Further the prediction
of overall estimate of the CO2 absorption has been done using unified method.
The overall objective of this study is to predict and understand the dynamics of
absorption column for the removal of CO2. The outcome of the study can be used for
improvements in the operations of the commercial absorption columns for CO2
absorption as well as for the designing of new column for the same.
MODEL DEVELOPMENT
CO2 containing outlet stream of desulphurization unit is the input to the absorption
column. This stream consists of CO2 mixed with compounds like Sulphur dioxide
(SO2) and Nitrogen oxides (NOx). SO2 also has a high tendency to react with aqueous
MEA solution and interfere in the CO2 absorption and therefore a desulphurization unit
has to be installed before the absorption column to bring the concentration of SO2 down
enough so that it wouldn’t have much effect on CO2 absorption. A maximum of 10 ppmv
of SO2 concentration and less than 20 ppmv for NOx concentration [18] is acceptable for
the absorption column to work efficiently.
A column with multiple trays is considered in which the treated flue gas is moved
counter currently with MEA solution. The CO2 present in the flue gas reacts with the
solvent in a pseudo first order kinetics where carbamate formation takes place [19].
This reaction enhances the mass transfer from gas phase to the liquid phase, thus the
absorbed CO2 is separated from the flue gas as it moves upwards in the absorption
column. To find the amount of CO2 which gets absorbed horizontally (on a stage)
undergoing mass transfer forming a thin film between gas and liquid phase is considered
under the following assumptions:
• The gas phase offers no resistance to mass transfer, the resistance offered is by the
liquid film only;
Journal of Sustainable Development of Energy, Water
and Environment Systems
Year 2018
Volume 6, Issue 3, pp 481-493
484
• No vaporization of solvent, since the vapor pressure of MEA is very less at the
temperature rage considered for this work;
• Henry’s law is applicable at the interface of the gas and liquid phase;
• Temperature is assumed to be constant throughout the complete process; • Gas liquid equilibrium is assumed at each stage.
N-stage equilibrium model is developed using material balance equation, equilibrium
relations and summation equations as follows:
Material balance:
Vi+1 + Li−1 − Vi − Li + Fi = 0 (1)
Equilibrium relation:
Yi = Ki × Xi (2)
Summation equation:
ΣYi = 1 and ΣXi = 1 (3)
Reaction involved
The reaction of CO2 with MEA involves the following reactions [19] into ester and
amine:
R1NH2 + CO2 <--> H+ + R1HCOO−
R1NH2 + H+ <--> R1NH+3
Overall reaction:
CO2 + 2R1NH2 <--> R1HCOO− + R1NH3+
Parameters used
Parameters involved in this model are diffusivity of CO2 and Nitrogen dioxide (N2O)
in MEA and water, Henry’s constant at gas-liquid interface, density of aqueous MEA,
rate and equilibrium constant of the reactions. The relations for above said parameters are
provided below.
Diffusivity equation. The diffusivity coefficient of CO2 in MEA was estimated using
the N2O analogy developed by Ko [20]:
����.��� = ���.��� × (����/ ���)water (4)
The equations of the diffusivity used were given by Versteeg and Vanswaaij [21]:
���.��� = � �[−2,371/r] (5)
����.��� = ���[−2,119/r] (6)
���.��� = � + �������� + �������� × �[����� !"#$%/'] (7)
The values of constants in diffusivityrelations are taken from Ko et al. [20], and are
given in Table 1.
Journal of Sustainable Development of Energy, Water
and Environment Systems
Year 2018
Volume 6, Issue 3, pp 481-493
485
Table 1. Values of constants in diffusivity relations
b0 = 5.07 × 10⁻⁶ b1 = 8.65 × 10⁻⁷ b2 = 2.78 × 10⁻⁷ b3 = −2,371 b4 = −93.4 b5 = 2.35 × 10⁻⁶ b6 = −2,119
Density relations. The density of aq. MEA solution was taken as 1,013 kg/m3 using
the relations from Weiland et al. [22].
Solubility relation (Henry’s law). The Henry’s law constant is estimated using N2O
analogy by Clarke [23]:
)���.��� = )��.��� × ()��� / )��)water
)*�+.,�� = �(./�
.01
�.�2�1�.�1)
(8)
These constants are function of temperature Penttila et al. [24], and are provided in
Table 2.
Table 2. Values of constants for Henry’s constant relations
Henry’s constants a0 a1 a2 a3
)��,,�� 158.24 −9,048.59 −20.86 −0.00252
)���,,�� 145.36 −8,172.35 −19.30 0
)��,��� −9,172.5 39.59 - -
Rate of reaction. There have been many discussions regarding the order of rate of
reaction with respect to both CO2 and MEA. In most of literature studies, the order of
reaction with respect to CO2 is assumed to be 1 but the order of reaction with respect to
MEA was found to be in the range 1 to 2. However, in most of the studies reaction rate
constant has been taken as 1st order with respect to MEA. Thus, the overall order was
found to be 2 [25]. But in this study the authors have considered pure MEA with no
vaporization in gas phase due to very less vapor pressure of MEA (40 pascal at 20 °C),
hence in this study a pseudo first order reaction is considered. The rate constant was
found using following relation given by Aboudheir et al. [26]:
k = 4.61 × 10⁹ e (−4,412/r) (9)
Equilibrium constant was calculated with the help of following relation [27, 28]:
In K = A + B / T + C × In T + D × T (10)
The values of these constants are given in Table 3.
Table 3. Values of constants for equilibrium constant
A B C D
231.46 −12,092.1 −36.78 0
Operational details. A pure MEA solution is supplied from top of the absorption
column counter currently to the gaseous stream with CO2 as a major component.
Mathematical model has been developed for this system. Simulation studies are carried
out at two temperatures 298 K and 313 K, with CO2 compositions of 0.6 and 0.8 to find
Journal of Sustainable Development of Energy, Water
and Environment Systems
Year 2018
Volume 6, Issue 3, pp 481-493
486
CO2 concentration profile across the gas-liquid interface at a given stage. Simulation
studies are further carried out to estimate overall absorption of CO2 in absorption column,
at different inlet flow rates of CO2: 65.74, 75.74, 85.74 and 95.74 kmol/m3, at different
L/G ratios: 2, 6.5, 8.5 and at different number of stages 15, 25 and 30.
Development of model using unified method
In this method, N numbers of stages are considered for absorption of CO2 using MEA
as the solvent. Flue gas and MEA are flowing counter currently in the tower where the
flue gas is fed from the bottom most tray (Vn), where as pure MEA is added from the top
tray. At each tray, fractional amount of CO2 gets absorbed into MEA and flue gas which
is now CO2 lean moves to the next upper plate. The process continues up to the Nth stage,
post which the lean flue gas moves into the stack for removal. The schematic of ith stage is
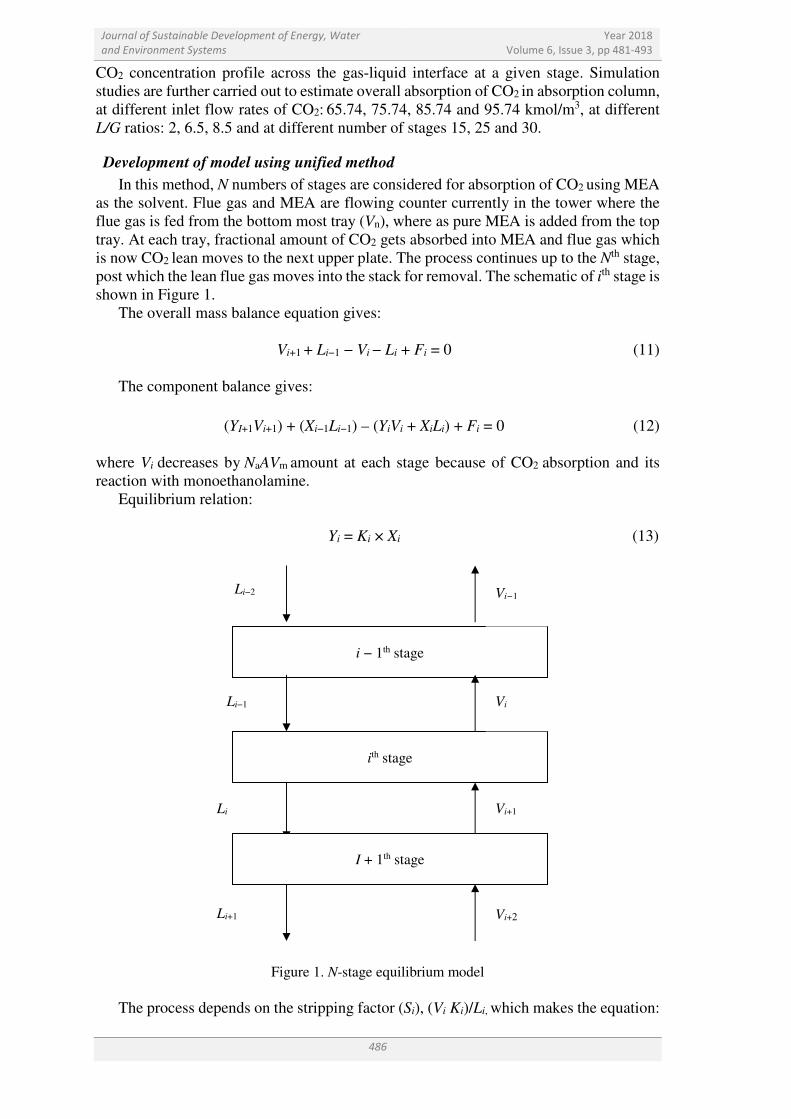
shown in Figure 1.
The overall mass balance equation gives:
Vi+1 + Li−1 − Vi − Li + Fi = 0 (11)
The component balance gives:
(YI+1Vi+1) + (Xi−1Li−1) – (YiVi + XiLi) + Fi = 0 (12)
where Vi decreases by NaAVm amount at each stage because of CO2 absorption and its
reaction with monoethanolamine.
Equilibrium relation:
Yi = Ki × Xi (13)
Figure 1. N-stage equilibrium model
The process depends on the stripping factor (Si), (Vi Ki)/Li, which makes the equation:
Vi+2
i − 1th stage
ith stage
I + 1th stage
Li−2
Li−1 Vi
Vi+1
Vi−1
Li
Li+1
Journal of Sustainable Development of Energy, Water
and Environment Systems
Year 2018
Volume 6, Issue 3, pp 481-493
487
Yi+1,jVi+1,j + yi,jVi,j [(Li,j / Gi,jKi,j) −1] + yi−1, jVi−1,j [(Li,j / Gi,jKi,j)] + Fi = 0 (14)
or:
Yi+1,jVi+1,j + yi,jVi,j [(1 / Si,jKi,j) −1] + yi−1,jVi−1,j [(1 / Si,jKi,j)] + Fi = 0 (15)
where Si,j is the stripping factor, i.e:
Si,j = (Gi,j × Ki,j) / Li,j (16)
Solution procedure. The model equations are solved using the equilibrium matrix
method (Thomas algorithm) to estimate overall absorption CO2 in the tower. It is
simplification of Gaussian elimination method which is used to solve system of
equations, using forward and backward substitutions. For this purpose the MATLAB
software has been used. The K value in the equilibrium relation is calculated using
the Henry’s constant at the interface of the two medium.
RESULTS AND DISCUSSION
The simulation studies for the absorption column were carried outto find the mole
fraction of CO2 absorbed at each stage. The overall absorption of CO2 in absorption
column is also estimated.
Parameters values
The parameters values used, at two temperatures 298 K and 318 K, in simulation
studies are mentioned in Table 4. The parameters viz., rate constant, Henry’s constant,
diffusion coefficient of CO2 and MEA are used for this study.
Table 4. Effect of variation of temperature on different parameters
Parameters T = 298 K T = 318 K
Rate constant [s−1] 1.713211 × 10³ 4.34716 × 10³
Henry’s constant [kPa m3/kmol] 2.162313 × 10⁸ 2.927188 × 10⁸
Diffusion coefficient of CO2 [m2/s] 1.293194 × 10⁻⁹ 2.2309 × 10⁻⁹
Diffusion coefficient of MEA [m2/s] 7.280607 × 10⁻¹⁰ 1.15787 × 10⁻⁹
Variation of rate constant with temperature. As the temperature increases the rate
constant also increases which in turn enhances the reaction rate of CO2 with MEA
solution and thus increases absorption.
Variation of Henry’s constant with temperature. The value of Henry’s constant
increases at the interface of gas and liquid with increase in temperature.
Variation of diffusion coefficient with temperature. Diffusion coefficients also
increase with temperature and hence increase the diffusion of the acidic gas into the
liquid solution.
Stage-wise variation in concentration profile
The effect of change in the inlet gas temperature and inlet CO2 composition, on the
concentration profile of CO2 from the gas-liquid interphase to bulk MEA at a given stage
is presented in Figure 2 and Figure 3, respectively. These studies were carried out at
constant inlet CO2 flow rate of 75.74 kmol/m3 and L/G ratio of 8.5.
Journal of Sustainable Development of Energy, Water
and Environment Systems
Year 2018
Volume 6, Issue 3, pp 481-493
488
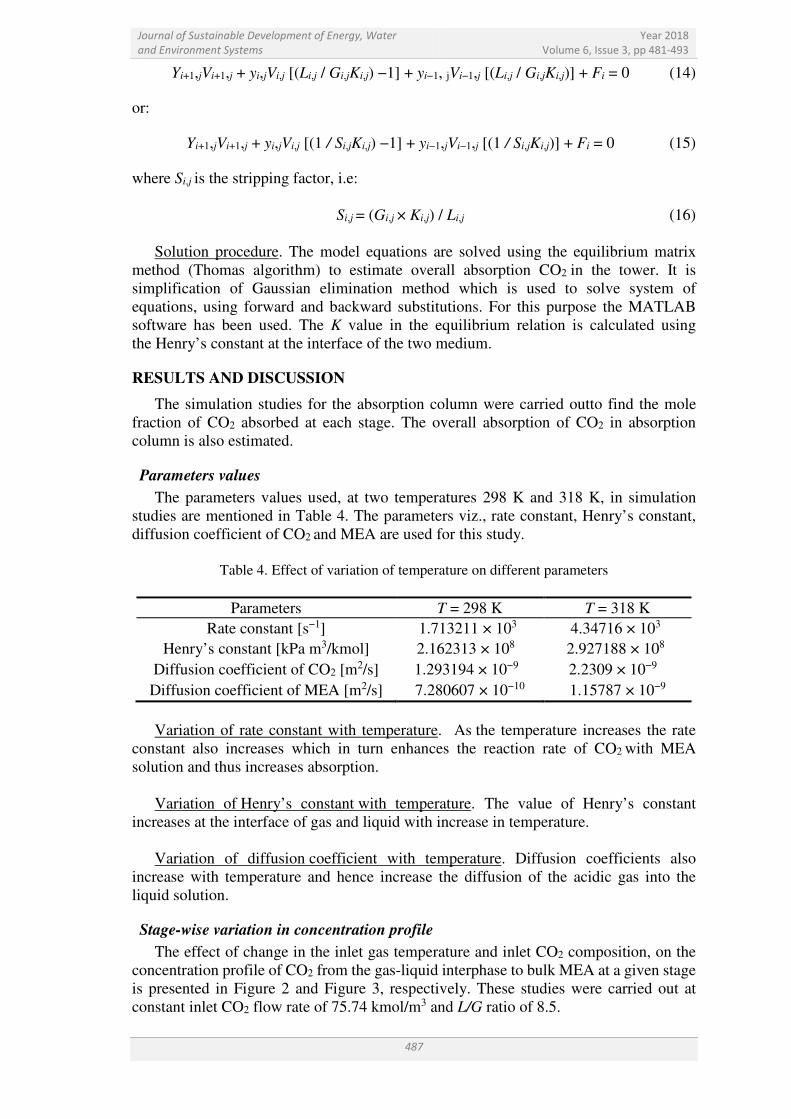
Figure 2. Effect of change in temperature on CO2 concentration profile
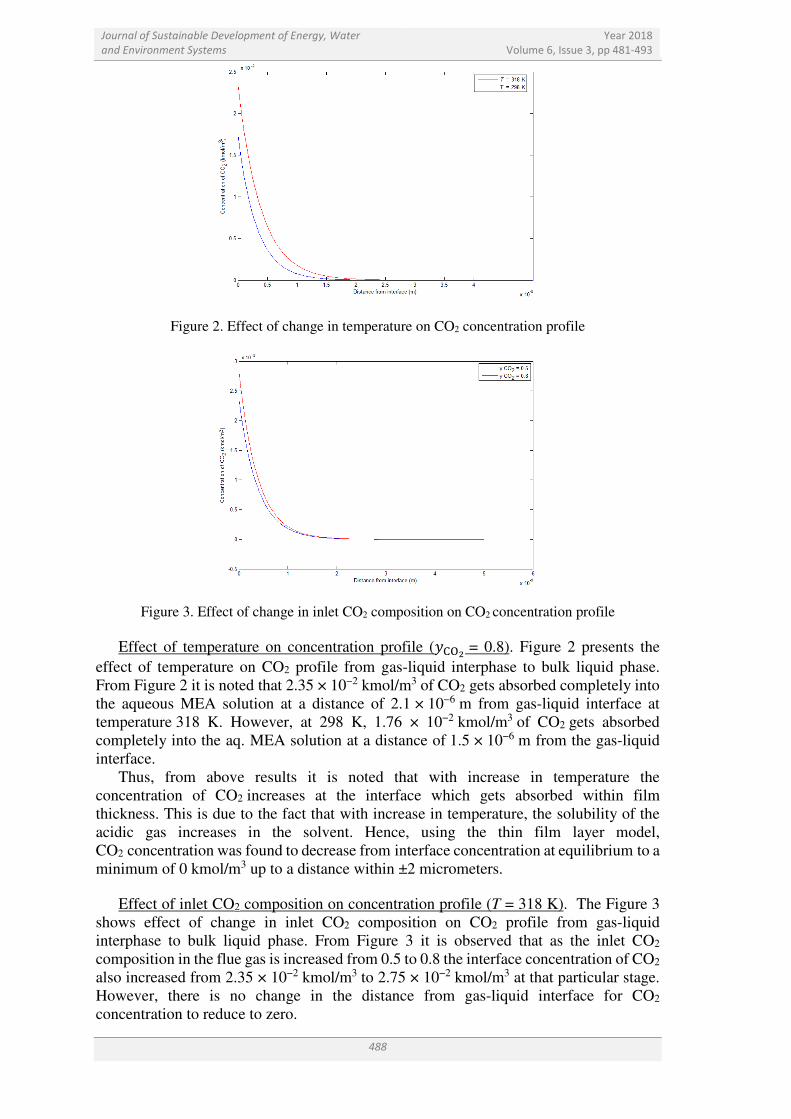
Figure 3. Effect of change in inlet CO2 composition on CO2 concentration profile
Effect of temperature on concentration profile (4��� = 0.8). Figure 2 presents the
effect of temperature on CO2 profile from gas-liquid interphase to bulk liquid phase.
From Figure 2 it is noted that 2.35 × 10⁻² kmol/m3 of CO2 gets absorbed completely into
the aqueous MEA solution at a distance of 2.1 × 10⁻⁶ m from gas-liquid interface at
temperature 318 K. However, at 298 K, 1.76 × 10⁻² kmol/m3 of CO2 gets absorbed
completely into the aq. MEA solution at a distance of 1.5 × 10⁻⁶ m from the gas-liquid
interface.
Thus, from above results it is noted that with increase in temperature the
concentration of CO2 increases at the interface which gets absorbed within film
thickness. This is due to the fact that with increase in temperature, the solubility of the
acidic gas increases in the solvent. Hence, using the thin film layer model,
CO2 concentration was found to decrease from interface concentration at equilibrium to a
minimum of 0 kmol/m3 up to a distance within ±2 micrometers.
Effect of inlet CO2 composition on concentration profile (T = 318 K). The Figure 3
shows effect of change in inlet CO2 composition on CO2 profile from gas-liquid
interphase to bulk liquid phase. From Figure 3 it is observed that as the inlet CO2
composition in the flue gas is increased from 0.5 to 0.8 the interface concentration of CO2
also increased from 2.35 × 10⁻² kmol/m3 to 2.75 × 10⁻² kmol/m3 at that particular stage.
However, there is no change in the distance from gas-liquid interface for CO2
concentration to reduce to zero.
Journal of Sustainable Development of Energy, Water
and Environment Systems
Year 2018
Volume 6, Issue 3, pp 481-493
489
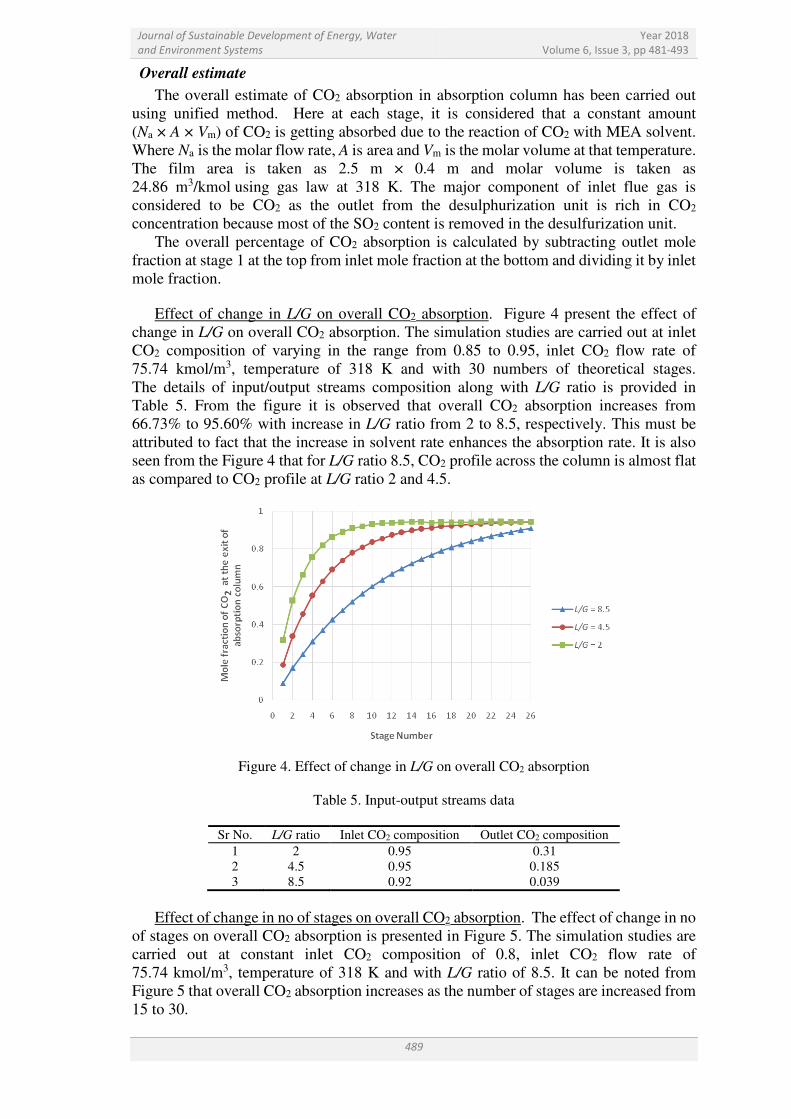
Overall estimate
The overall estimate of CO2 absorption in absorption column has been carried out
using unified method. Here at each stage, it is considered that a constant amount
(Na × A × Vm) of CO2 is getting absorbed due to the reaction of CO2 with MEA solvent.
Where Na is the molar flow rate, A is area and Vm is the molar volume at that temperature.
The film area is taken as 2.5 m × 0.4 m and molar volume is taken as
24.86 m3/kmol using gas law at 318 K. The major component of inlet flue gas is
considered to be CO2 as the outlet from the desulphurization unit is rich in CO2
concentration because most of the SO2 content is removed in the desulfurization unit.
The overall percentage of CO2 absorption is calculated by subtracting outlet mole
fraction at stage 1 at the top from inlet mole fraction at the bottom and dividing it by inlet
mole fraction.
Effect of change in L/G on overall CO2 absorption. Figure 4 present the effect of
change in L/G on overall CO2 absorption. The simulation studies are carried out at inlet
CO2 composition of varying in the range from 0.85 to 0.95, inlet CO2 flow rate of
75.74 kmol/m3, temperature of 318 K and with 30 numbers of theoretical stages.
The details of input/output streams composition along with L/G ratio is provided in
Table 5. From the figure it is observed that overall CO2 absorption increases from
66.73% to 95.60% with increase in L/G ratio from 2 to 8.5, respectively. This must be
attributed to fact that the increase in solvent rate enhances the absorption rate. It is also
seen from the Figure 4 that for L/G ratio 8.5, CO2 profile across the column is almost flat
as compared to CO2 profile at L/G ratio 2 and 4.5.
Figure 4. Effect of change in L/G on overall CO2 absorption
Table 5. Input-output streams data
Sr No. L/G ratio Inlet CO2 composition Outlet CO2 composition
1 2 0.95 0.31
2 4.5 0.95 0.185
3 8.5 0.92 0.039
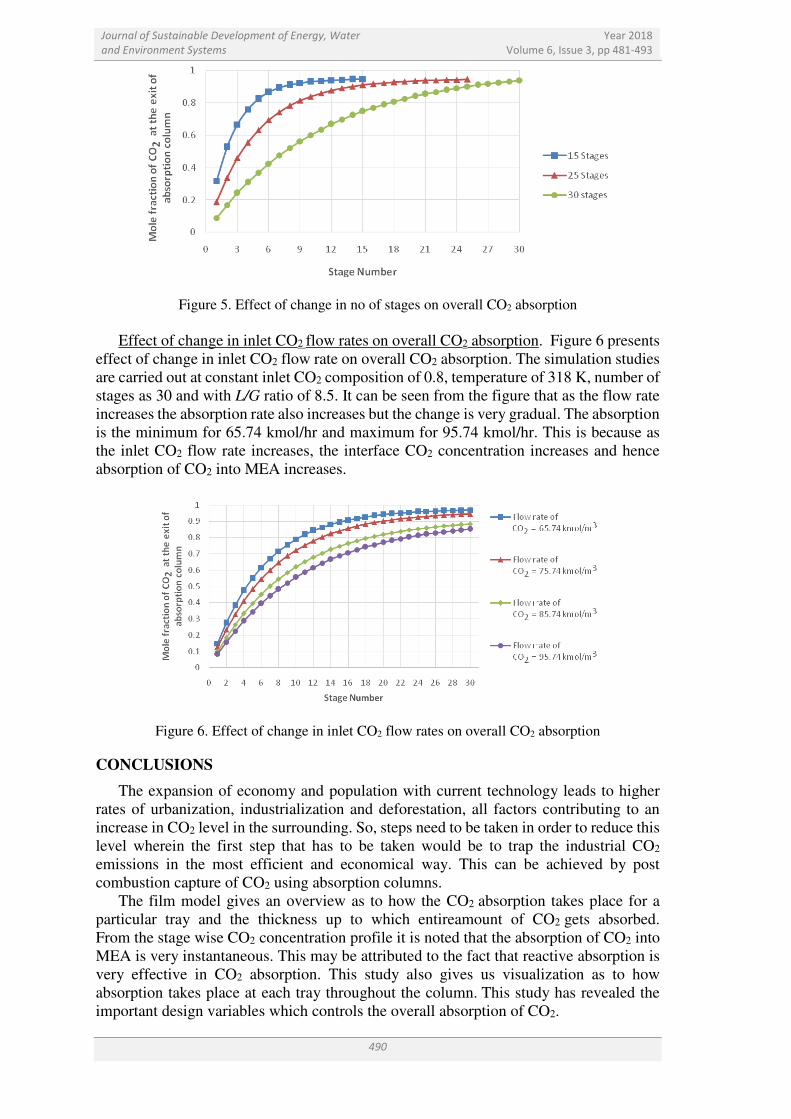
Effect of change in no of stages on overall CO2 absorption. The effect of change in no
of stages on overall CO2 absorption is presented in Figure 5. The simulation studies are
carried out at constant inlet CO2 composition of 0.8, inlet CO2 flow rate of
75.74 kmol/m3, temperature of 318 K and with L/G ratio of 8.5. It can be noted from
Figure 5 that overall CO2 absorption increases as the number of stages are increased from
15 to 30.
Journal of Sustainable Development of Energy, Water
and Environment Systems
Year 2018
Volume 6, Issue 3, pp 481-493
490
Figure 5. Effect of change in no of stages on overall CO2 absorption
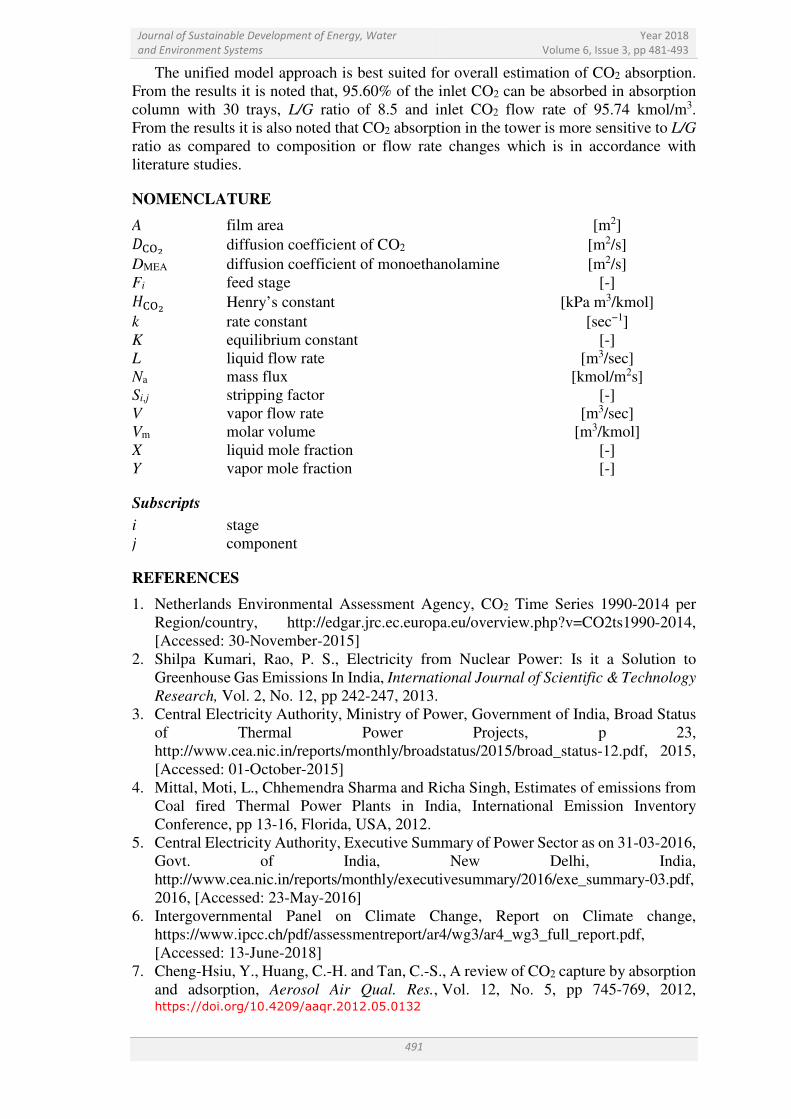
Effect of change in inlet CO2 flow rates on overall CO2 absorption. Figure 6 presents
effect of change in inlet CO2 flow rate on overall CO2 absorption. The simulation studies
are carried out at constant inlet CO2 composition of 0.8, temperature of 318 K, number of
stages as 30 and with L/G ratio of 8.5. It can be seen from the figure that as the flow rate
increases the absorption rate also increases but the change is very gradual. The absorption
is the minimum for 65.74 kmol/hr and maximum for 95.74 kmol/hr. This is because as
the inlet CO2 flow rate increases, the interface CO2 concentration increases and hence
absorption of CO2 into MEA increases.
Figure 6. Effect of change in inlet CO2 flow rates on overall CO2 absorption
CONCLUSIONS
The expansion of economy and population with current technology leads to higher
rates of urbanization, industrialization and deforestation, all factors contributing to an
increase in CO2 level in the surrounding. So, steps need to be taken in order to reduce this
level wherein the first step that has to be taken would be to trap the industrial CO2
emissions in the most efficient and economical way. This can be achieved by post
combustion capture of CO2 using absorption columns.
The film model gives an overview as to how the CO2 absorption takes place for a
particular tray and the thickness up to which entireamount of CO2 gets absorbed.
From the stage wise CO2 concentration profile it is noted that the absorption of CO2 into
MEA is very instantaneous. This may be attributed to the fact that reactive absorption is
very effective in CO2 absorption. This study also gives us visualization as to how
absorption takes place at each tray throughout the column. This study has revealed the
important design variables which controls the overall absorption of CO2.
Journal of Sustainable Development of Energy, Water
and Environment Systems
Year 2018
Volume 6, Issue 3, pp 481-493
491
The unified model approach is best suited for overall estimation of CO2 absorption.
From the results it is noted that, 95.60% of the inlet CO2 can be absorbed in absorption
column with 30 trays, L/G ratio of 8.5 and inlet CO2 flow rate of 95.74 kmol/m3.
From the results it is also noted that CO2 absorption in the tower is more sensitive to L/G
ratio as compared to composition or flow rate changes which is in accordance with
literature studies.
NOMENCLATURE
A film area [m2]
���� diffusion coefficient of CO2 [m2/s]
DMEA diffusion coefficient of monoethanolamine [m2/s]
Fi feed stage [-]
)��� Henry’s constant [kPa m3/kmol]
k rate constant [sec−1]
K equilibrium constant [-]
L liquid flow rate [m3/sec]
Na mass flux [kmol/m2s]
Si,j stripping factor [-]
V vapor flow rate [m3/sec]
Vm molar volume [m3/kmol]
X liquid mole fraction [-]
Y vapor mole fraction [-]
Subscripts
i stage
j component
REFERENCES
1. Netherlands Environmental Assessment Agency, CO2 Time Series 1990-2014 per
Region/country, http://edgar.jrc.ec.europa.eu/overview.php?v=CO2ts1990-2014,
[Accessed: 30-November-2015]
2. Shilpa Kumari, Rao, P. S., Electricity from Nuclear Power: Is it a Solution to
Greenhouse Gas Emissions In India, International Journal of Scientific & Technology
Research, Vol. 2, No. 12, pp 242-247, 2013.
3. Central Electricity Authority, Ministry of Power, Government of India, Broad Status
of Thermal Power Projects, p 23,
http://www.cea.nic.in/reports/monthly/broadstatus/2015/broad_status-12.pdf, 2015,
[Accessed: 01-October-2015]
4. Mittal, Moti, L., Chhemendra Sharma and Richa Singh, Estimates of emissions from
Coal fired Thermal Power Plants in India, International Emission Inventory
Conference, pp 13-16, Florida, USA, 2012.
5. Central Electricity Authority, Executive Summary of Power Sector as on 31-03-2016,
Govt. of India, New Delhi, India,
http://www.cea.nic.in/reports/monthly/executivesummary/2016/exe_summary-03.pdf,
2016, [Accessed: 23-May-2016]
6. Intergovernmental Panel on Climate Change, Report on Climate change,
https://www.ipcc.ch/pdf/assessmentreport/ar4/wg3/ar4_wg3_full_report.pdf,
[Accessed: 13-June-2018]
7. Cheng-Hsiu, Y., Huang, C.-H. and Tan, C.-S., A review of CO2 capture by absorption
and adsorption, Aerosol Air Qual. Res., Vol. 12, No. 5, pp 745-769, 2012, https://doi.org/10.4209/aaqr.2012.05.0132
Journal of Sustainable Development of Energy, Water
and Environment Systems
Year 2018
Volume 6, Issue 3, pp 481-493
492
8. Ying, Z. and Chen, C.-C., Thermodynamic modeling for CO2 absorption in aqueous
MDEA Solution with Electrolyte NRTL Model, Industrial&Engineering Chemistry
Research, Vol. 50, No. 1, pp 163-175, 2010, https://doi.org/10.1021/ie1006855
9. Liu, J., Wang, S., Zhao, B., Tong, H., Chen, C., Absorption of Carbon Dioxide in
Aqueous Ammonia, Energy Procedia, Vol. 1, No. 1, pp 933-940, 2009, https://doi.org/10.1016/j.egypro.2009.01.124
10. Lawal, A., Wang, M., Stephenson, P., Koumpouras, G., Yeung, H., Dynamic
modelling and analysis of post combustion CO2 chemical absorption Process for
Coal-fired Power Plants, Fuel, Vol. 89, No. 10, pp 2791-2801, 2010, https://doi.org/10.1016/j.fuel.2010.05.030
11. Toro-Molina, C. and Bouallou, C., Kinetics Study and simulation of CO2 absorption
into mixed aqueous Solutions of Methyldiethanolamine and Diethanolamine,
Chemical Engineering Transactions, Vol. 35, pp 319-324, 2013.
12. Lawal, A., Wang, M., Stephenson, P. and Yeung, H., Dynamic modelling of CO2
absorption for post combustion capture in Coal-fired Power Plants, Fuel, Vol. 88,
No. 12, pp 2455-2462, 2009, https://doi.org/10.1016/j.fuel.2008.11.009
13. Lim, Y., Kim, J., Jung, J., Chi Seob Lee, and Han, C., Modeling and simulation of
CO2 capture Process for Coal-based Power Plant using Amine Solvent in South
Korea, Energy Procedia, Vol. 37, pp 1855-1862, 2013, https://doi.org/10.1016/j.egypro.2013.06.065
14. Khan, F. M., Krishnamoorthi, V. and Mahmud, T., Modelling reactive absorption of
CO2 in packed Columns for post-combustion Carbon capture Applications,
Chemical Engineering Research and Design, Vol. 89, No. 9, pp 1600-1608, 2011, https://doi.org/10.1016/j.cherd.2010.09.020
15. Posch, S. and Haider, M., Dynamic modeling of CO2 absorption from Coal-fired
Power Plants into an aqueous Monoethanolamine Solution, Chemical Engineering
Research and Design, Vol. 91, No. 6, pp 977-987, 2013, https://doi.org/10.1016/j.cherd.2012.09.016
16. Wang, M., Lawal, A., Stephenson, P., Sidders, J. and Ramshaw, C., Post-combustion
CO2 capture with Chemical absorption: A State-of-the-art review,
Chemical Engineering Research and Design, Vol. 89, No. 9, pp 1609-1624, 2011, https://doi.org/10.1016/j.cherd.2010.11.005
17. Wellner, K., Marx-Schubach, T. and Schmitz, G., Dynamic behavior of Coal-fired
Power Plants with post combustion CO2 capture, Ind. Eng. Chem. Res., Vol. 55,
No. 46, pp 12038-12045, 2016, https://doi.org/10.1021/acs.iecr.6b02752
18. Aboudheir, A., Tontiwachwuthikul, P., Chakma, A. and Idem, R., Kinetics of the
reactive absorption of Carbon Dioxide in high CO2-loaded, concentrated aqueous
Monoethanolamine Solutions, Chemical Engineering Science, Vol. 58, No. 23-24,
pp 5195-5210, 2013, https://doi.org/10.1016/j.ces.2003.08.014
19. Zhang, Y. and Chen, C.-C., Modeling CO2 absorption and desorption by aqueous
Monoethanolamine Solution with Aspen rate-based Model, Energy Procedia,
Vol. 37, pp 1584-1596, 2013, https://doi.org/10.1016/j.egypro.2013.06.034
20. Plaza, J. M., Van Wagener, D. and Rochelle, G. T., Modeling CO2 capture with
aqueous Monoethanolamine, Energy Procedia, Vol. 1, pp 1171-1178, 2009, https://doi.org/10.1016/j.egypro.2009.01.154
21. Kothandaraman, A., Carbon Dioxide capture by chemical absorption: A Solvent
comparison Study, M.Sc. Thesis, Massachusetts Institute of Technology,
Massachusetts, USA, 2010.
22. Liu, X., Rate based modelling of CO2 removal using Alkanolamines, M.Sc. Thesis,
Norwegian University of Science and Technology, Trondheim, Norway, 2014.
23. Ko, J.-J., Tsai, T.-C., Lin, C.-Y., Wang, H.-M. and Li, M.-H., Diffusivity of Nitrous
Oxide in aqueous Alkanolamine Solutions, Journal of Chemical and Engineering
Data, Vol. 46, No. 1, pp 160-165, 2001, https://doi.org/10.1021/je000138x
Journal of Sustainable Development of Energy, Water
and Environment Systems
Year 2018
Volume 6, Issue 3, pp 481-493
493
24. Versteeg, G. F. and Vanswaaij, W. P. M., Solubility and diffusivity of Acid Gases
(CO2, N2O) in aqueous Alkanolamine Solutions, Journal of Chemical
and Engineering Data, Vol. 33, No. 1, pp 29-34, 1988, https://doi.org/10.1021/je00051a011
25. Weiland, R. H., Dingman, J. C., Benjamin Cronin, D. and Browning, G. J., Density
and Viscosity of some partially carbonated aqueous Alkanolamine Solutions and their
blends, Journal of Chemical and Engineering Data, Vol. 43, No. 3, pp 378-382,
1998, https://doi.org/10.1021/je9702044
26. Clarke, J. K. A., Kinetics of absorption of Carbon Dioxide in Monoethanolamine
Solutions at short contact times, Industrial&Engineering Chemistry Fundamentals,
Vol. 3, No. 3, pp 239-245, 1964, https://doi.org/10.1021/i160011a012
27. Penttilä, A., Dell’Era, C., Uusi-Kyyny, P. and Alopaeus, V., The Henry’s Law
constant of N2O and CO2 in aqueous Binary and Ternary Amine Solutions (MEA,
DEA, DIPA, MDEA, and AMP), Fluid Phase Equilibria, Vol. 311, pp 59-66, 2011,
https://doi.org/10.1016/j.fluid.2011.08.019
28. Mahajani, V. V. and Joshi, J. B., Kinetics of Reactions between Carbon Dioxide and
Alkanolamines, Gas Separation & Purification, Vol. 2, No. 2, pp 50-64, 1988, https://doi.org/10.1016/0950-4214(88)80013-6
29. Aboudheir, A., Kinetics of the reactive absorption of Carbon Dioxide in high
CO2-loaded, concentrated aqueous Monoethanolamine Solutions,
Chemical Engineering Science, Vol. 58, No. 23-24, pp 5195-5210, 2003, https://doi.org/10.1016/j.ces.2003.08.014
30. Kothandaraman, A., Carbon Dioxide capture by chemical absorption: A Solvent
comparison Study, M.Sc. Thesis, Massachusetts Institute of Technology,
Massachusetts, USA, 2010.
31. Yunda, L., Zhang, L. and Watanasiri, S., Representing Vapor- liquid Equilibrium for
an aqueous MEA-CO2 System using the Electrolyte Nonrandom-two-liquid Model,
Industrial&Engineering Chemistry Research, Vol. 38, No. 5, pp 2080-2090, 1999, https://doi.org/10.1021/ie980600v
Paper submitted: 25.09.2017
Paper revised: 13.06.2018
Paper accepted: 16.06.2018
Related Documents