ANNUAL SURVEY OF INDUSTRIES 2007-08 Vol. II REPORT ON ABSENTEEISM, LABOUR TURNOVER, EMPLOYMENT & LABOUR COST GOVERNMENT OF INDIA MINISTRY OF LABOUR & EMPLOYMENT LABOUR BUREAU CHANDIGARH/SHIMLA

Welcome message from author
This document is posted to help you gain knowledge. Please leave a comment to let me know what you think about it! Share it to your friends and learn new things together.
Transcript
ANNUAL SURVEY OF INDUSTRIES 2007-08 Vol. II
REPORT
ON
ABSENTEEISM, LABOUR TURNOVER, EMPLOYMENT & LABOUR COST
GOVERNMENT OF INDIA
MINISTRY OF LABOUR & EMPLOYMENT LABOUR BUREAU
CHANDIGARH/SHIMLA
i
PREFACE
The Annual Survey of Industries (ASI) is conducted annually under the Collection of Statistics Act, 1953 and the Rules framed thereunder in 1959. ASI Part-II Schedule, which contained labour statistics on Absenteeism, Labour Turnover, Earnings, Employment and Labour Cost, was canvassed with effect from the ASI 1961 Round. With effect from ASI 1999-2000, however, Block-4 and Block-5 of ASI Part-II Schedule containing data on Employment and Labour Cost and with effect from ASI 2002-03, Block-3 of ASI Part-II Schedule were also discontinued. Moreover, Block-E of the ASI Part-I Schedule was further modified by inserting a column on mandays paid for.
The present Report presents statistics on Absenteeism, Labour Turnover, Employment, Labour Cost and Earnings for the year 2007-08 and is based on Block-E of Part-I and Block-2 of Part-II of the ASI Schedule. Processed raw data based on ASI Block-E of Part-I received from the Central Statistical Organisation (CSO), Industrial Statistics Wing (IS Wing), Kolkata and the data in schedule form under ASI Block-2 of Part-II received from Field Operations Division (FOD) of National Sample Survey Organisation (NSSO), were processed by the Labour Bureau and are being presented States-wise and Sectors-wise at 3-digit and 4-digit level of the NIC-2004. Statistics on Total Cost of Production and percentage share of Labour Cost on workers to Total Cost of Production are also being included in this Report. The Report partly meets the statutory obligation pertaining to Article 11 of Part-II of the ILO Convention No. 160 on Labour Statistics, which was ratified by India on 01.04.1992. I hope that the data presented in this Report would prove to be immensely valuable to all users including the policy makers.
I take this opportunity to thank the officers of the CSO (IS Wing), Kolkata, not only for providing raw data in time but also for their cooperation in processing of these data by the Labour Bureau. The Officers and staff of the FOD also deserve Labour Bureau’s appreciation for timely canvassing of the ASI Schedules. I acknowledge the efforts of the Officers and staff of the ASI Section, MTU and Printing Unit of Labour Bureau, whose names are given in Annexure-IV, for their sincere efforts in processing voluminous data and bringing out this Report within a short time frame.
The views expressed in this Report are not necessarily those of the Government of India, Ministry of Labour & Employment.
Suggestions for further improvement in the ASI report are welcome.
B. N. Nanda Director General
Chandigarh 4th February 2011
ii
CONTENTS
Chapter Subject Page Main Findings 1 - 3 Chapter-I Introduction 4 - 12
1.1 Historical Background 4 - 5 1.2 Objectives of ASI 5 1.3 Scope and Coverage 5 – 6 1.4 Unit of Enumeration 6 1.5 ASI Frame 6 1.6 Classification of Factories 6 – 7 1.7 Sampling Design and Sample
Allocation 7 -8
1.8 Estimation Procedure 8 1.9 Schedule used for Enquiry 8 1.10 Reference Period 9 1.11 Period of Survey 9 1.12 Concepts and Definitions 9 – 11 1.13 Classification of Industries 11 1.14 Processing and Tabulation of Data 11 - 12 1.15 Presentation of Data 12 Chapter-II Absenteeism 13 - 21
2.1 Absenteeism in States 13 2.2 Absenteeism in Industries 13 - 14 2.3 Absenteeism in States by Sectors 14 2.4 Absenteeism in Industries by Sectors 14 - 15 Tables: 2.1.1 to 2.2.2 16 - 21 Chapter-III Labour Turnover 22 - 30
3.1 Labour Turnover in States 22 - 23 3.2 Labour Turnover in Industries 23 3.3 Labour Turnover in States by Sectors 23 - 24 3.4 Labour Turnover in Industries by
Sectors 24
Tables: 3.1.1 to 3.2.2 25 - 30 Chapter-IV Employment 31 - 53
4.1 Total Work Force 31 4.2 Employment in States 31 - 32 4.3 Employment in Industries 32 - 33 4.4 Employment of Contract Workers by
States 33
4.5 Employment of Contract Workers by Industries
33
4.6 Mandays Worked by Sectors, Industries and States
33 - 34
4.7 Mandays Worked by Contract Workers 34 4.8 Mandays Paid For 34 4.9 Factories Employing Contract Workers 34 - 35 Tables: 4.1.1 to 4.6.2 36 - 53 Chapter-V Labour Cost 54 - 81
iii
5.1 Average Labour Cost 54 5.2 Average Labour Cost by States 54 5.3 Average Labour Cost by Industries 54 - 55 5.4 Percentage of Components of Labour
Cost 55
5.5 Percentage of Labour Cost to Total Cost of Production
55 - 56
5.6 Wages/Salaries 57 - 58 5.7 Average Daily Earnings 58 - 59 5.8 Percentage of Factories paying/
incurring Expenses on Bonus, Provident Funds and Welfare Funds
59 - 60
Tables: 5.1.1 to 5.7.2 61 - 81 Chapter-VI Special Tables 82 - 137 6.1 Absenteeism and Labour Turnover at
4-digit of NIC 82
Table 6.1 83 - 137 Chapter-VII Trend Tables 138 - 251
7.1 Average Daily Employment 138 7.2 Wage/Salary Rates 138 7.3 Trend in Average Labour Cost 138 - 139 7.4 Percentage of Labour Cost to Total
Cost of Production 139
7.5 Percentage of Absenteeism and Labour Turnover
139 - 140
7.6 7.7
Number of Reporting Factories Growth Rates in Employment across sectors
140 140
Tables: 7.1 to 7.6 141 - 251
ANNEXURE-I Facsimile of Block-A, Block-B, Block-E, Block-F, Block-H and Block-I of Part-I and Block-1 and Block-2 of Part-II of ASI Schedule
252 - 256
ANNEXURE-II National Industrial Classification-
2004 257 - 262
ANNEXURE-III List of Reports/Publications brought
out by the Labour Bureau on Annual Survey of Industries(ASI)
263 - 268
ANNEXURE-IV List of Officers/Officials
associated with the Report 269
1
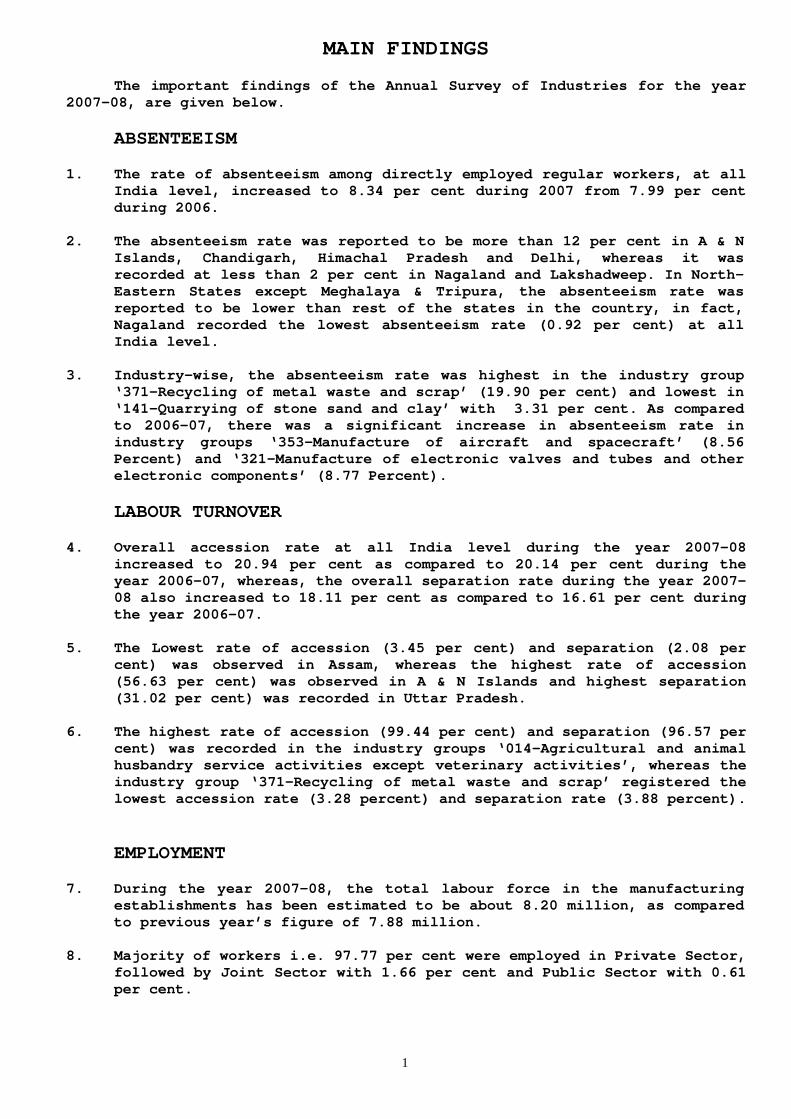
MAIN FINDINGS
The important findings of the Annual Survey of Industries for the year 2007-08, are given below. ABSENTEEISM 1. The rate of absenteeism among directly employed regular workers, at all
India level, increased to 8.34 per cent during 2007 from 7.99 per cent during 2006.
2. The absenteeism rate was reported to be more than 12 per cent in A & N
Islands, Chandigarh, Himachal Pradesh and Delhi, whereas it was recorded at less than 2 per cent in Nagaland and Lakshadweep. In North-Eastern States except Meghalaya & Tripura, the absenteeism rate was reported to be lower than rest of the states in the country, in fact, Nagaland recorded the lowest absenteeism rate (0.92 per cent) at all India level.
3. Industry-wise, the absenteeism rate was highest in the industry group
‘371-Recycling of metal waste and scrap’ (19.90 per cent) and lowest in ‘141-Quarrying of stone sand and clay’ with 3.31 per cent. As compared to 2006-07, there was a significant increase in absenteeism rate in industry groups ‘353-Manufacture of aircraft and spacecraft’ (8.56 Percent) and ‘321-Manufacture of electronic valves and tubes and other electronic components’ (8.77 Percent).
LABOUR TURNOVER 4. Overall accession rate at all India level during the year 2007-08
increased to 20.94 per cent as compared to 20.14 per cent during the year 2006-07, whereas, the overall separation rate during the year 2007-08 also increased to 18.11 per cent as compared to 16.61 per cent during the year 2006-07.
5. The Lowest rate of accession (3.45 per cent) and separation (2.08 per
cent) was observed in Assam, whereas the highest rate of accession (56.63 per cent) was observed in A & N Islands and highest separation (31.02 per cent) was recorded in Uttar Pradesh.
6. The highest rate of accession (99.44 per cent) and separation (96.57 per
cent) was recorded in the industry groups ‘014-Agricultural and animal husbandry service activities except veterinary activities’, whereas the industry group ‘371-Recycling of metal waste and scrap’ registered the lowest accession rate (3.28 percent) and separation rate (3.88 percent). EMPLOYMENT
7. During the year 2007-08, the total labour force in the manufacturing
establishments has been estimated to be about 8.20 million, as compared to previous year’s figure of 7.88 million.
8. Majority of workers i.e. 97.77 per cent were employed in Private Sector,
followed by Joint Sector with 1.66 per cent and Public Sector with 0.61 per cent.
2
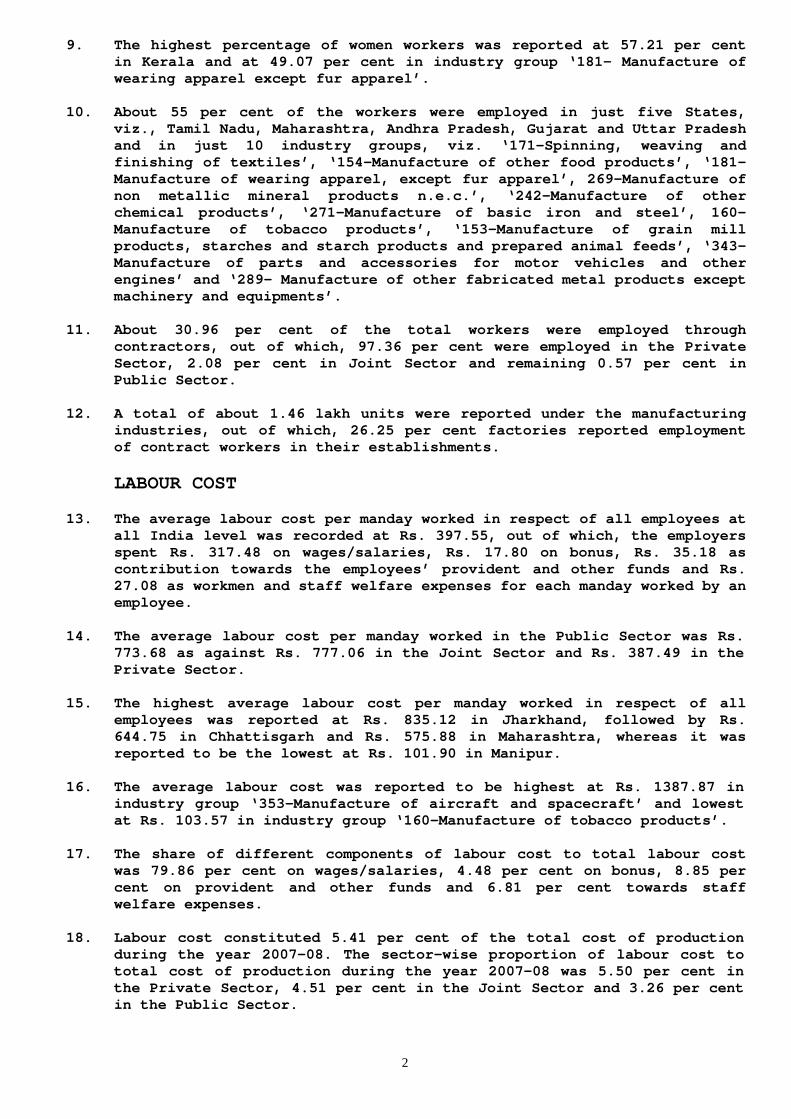
9. The highest percentage of women workers was reported at 57.21 per cent in Kerala and at 49.07 per cent in industry group ‘181- Manufacture of wearing apparel except fur apparel’.
10. About 55 per cent of the workers were employed in just five States,
viz., Tamil Nadu, Maharashtra, Andhra Pradesh, Gujarat and Uttar Pradesh and in just 10 industry groups, viz. ‘171–Spinning, weaving and finishing of textiles’, ‘154–Manufacture of other food products’, ‘181-Manufacture of wearing apparel, except fur apparel’, 269-Manufacture of non metallic mineral products n.e.c.’, ‘242-Manufacture of other chemical products’, ‘271-Manufacture of basic iron and steel’, 160-Manufacture of tobacco products’, ‘153-Manufacture of grain mill products, starches and starch products and prepared animal feeds’, ‘343-Manufacture of parts and accessories for motor vehicles and other engines’ and ‘289- Manufacture of other fabricated metal products except machinery and equipments’.
11. About 30.96 per cent of the total workers were employed through
contractors, out of which, 97.36 per cent were employed in the Private Sector, 2.08 per cent in Joint Sector and remaining 0.57 per cent in Public Sector.
12. A total of about 1.46 lakh units were reported under the manufacturing
industries, out of which, 26.25 per cent factories reported employment of contract workers in their establishments.
LABOUR COST
13. The average labour cost per manday worked in respect of all employees at
all India level was recorded at Rs. 397.55, out of which, the employers spent Rs. 317.48 on wages/salaries, Rs. 17.80 on bonus, Rs. 35.18 as contribution towards the employees’ provident and other funds and Rs. 27.08 as workmen and staff welfare expenses for each manday worked by an employee.
14. The average labour cost per manday worked in the Public Sector was Rs.
773.68 as against Rs. 777.06 in the Joint Sector and Rs. 387.49 in the Private Sector.
15. The highest average labour cost per manday worked in respect of all
employees was reported at Rs. 835.12 in Jharkhand, followed by Rs. 644.75 in Chhattisgarh and Rs. 575.88 in Maharashtra, whereas it was reported to be the lowest at Rs. 101.90 in Manipur.
16. The average labour cost was reported to be highest at Rs. 1387.87 in
industry group ‘353-Manufacture of aircraft and spacecraft’ and lowest at Rs. 103.57 in industry group ‘160-Manufacture of tobacco products’.
17. The share of different components of labour cost to total labour cost
was 79.86 per cent on wages/salaries, 4.48 per cent on bonus, 8.85 per cent on provident and other funds and 6.81 per cent towards staff welfare expenses.
18. Labour cost constituted 5.41 per cent of the total cost of production
during the year 2007-08. The sector-wise proportion of labour cost to total cost of production during the year 2007-08 was 5.50 per cent in the Private Sector, 4.51 per cent in the Joint Sector and 3.26 per cent in the Public Sector.
3
19. The highest average daily earning by all workers was reported in Jharkhand at Rs. 454.46, followed by Goa at Rs. 254.06 and Orissa at Rs. 246.25.
20. It has been observed that the average daily earnings by all employees
was less in all the North-Eastern States/Union Territories except Meghalaya (Rs.209.49) and Assam (Rs. 125.69).
21. The average daily earnings in respect of women workers was reported to
be higher than that of their male counterparts in Meghalaya (Rs 242.12), Chandigarh (Rs. 241.54) and Jharkhand (Rs 524.61). Also six industry groups viz. 271, 272, 281, 292, 331 and 341 depicts the average daily earnings of women workers more than that of their male counterparts.
-0-0-0-
4
CHAPTER-I
INTRODUCTION
The Annual Survey of Industries (ASI) is the principal source of industrial statistics in India. It provides statistical information to assess and evaluate, objectively and realistically, the changes in growth, composition and structure of organized manufacturing sector comprising activities related to manufacturing process, repair services, gas and water supply and cold storage. Industrial sector occupies an important position in the Indian economy and has a pivotal role to play in rapid and balanced economic development. Viewed in this context, the collection and dissemination of ASI data on a regular basis is of vital importance. The survey is conducted annually under the statutory provisions of the Collection of Statistics Act, 1953 and the Rules framed thereunder in 1959, except in the State of Jammu & Kashmir, where it is conducted under the State Collection of Statistics Act, 1961 and the Rules framed thereunder in 1964. 1.1 Historical Background
Understanding the importance of collection and compilation of data relating to industrial sector of the country, the Government of India, after 1930, launched a voluntary scheme for collection of detailed data from important industries in India. During the Second World War, in order to cater to the specific requirements of war management, each government department created its own statistical section. In 1942, the Industrial Statistics Act was enacted on the recommendations of the Royal Commission on Labour. The Directorate of Industrial Statistics (DIS) under the Ministry of Commerce was setup in the year 1945 to enforce the Industrial Statistics Act, 1942. The Directorate of Industrial Statistics launched the first Census of Manufacturing Industries (CMI) in the year 1946 with the objective of studying the structure of the Indian industry and estimating its contribution to the national economy. Due to practical difficulties, the CMI could cover only 29 of the 63 industry groups specified in the Industrial Statistics Act and extended only to 11 States of the Indian Union. It was conducted annually up to 1958. By 1958, the geographical coverage of the CMI extended to 13 States and 2 Union Territories.
Following the recommendation of the National Income Committee (1949),
the Directorate of Industrial Statistics conducted the first Sample Survey of Manufacturing Industries (SSMI) in 1949 for collecting data from factories falling under 34 industry groups left out by the CMI and defined under the Factories Act, 1934. The technical work including the survey design, sample selection, and preparation of schedules was undertaken by the Directorate of Industrial Statistics while the tabulation and analysis of data, report writing, etc. was carried out by the Indian Statistical Institute, Calcutta. The SSMI was conducted annually up to 1958 by the then Directorate of National Sample Survey now known as National Sample Survey Organisation (NSSO).
After independence, in the year 1951, the Central Statistical Organisaton (CSO) was setup under the Cabinet Secretariat by the Government of India as an apex statistical body for coordinating the large variety of data collection by various agencies as was necessitated for adoption of planned economy by the government. In the year 1956, the Industrial Statistics Act, 1942 was repealed by the Collection of Statistics Act, 1953 and Rules framed thereunder in 1959 regarding the Statistical Authority and procedure for collection of data. Subsequently, the DIS was transferred to
5
the Cabinet Secretariat in 1959 and was attached to the CSO as Industrial Statistics Wing.
The Collection of Statistics (Central) Rules, 1959 framed under the Collection of Statistics Act, 1953 provided for a comprehensive Annual Survey of Industries (ASI) in India. The survey replaced both the CMI and SSMI. The ASI was launched in 1960 with 1959 as the reference year and is continuing since then annually except for 1972. The labour part of the ASI Schedule (Part-II), which contained statistics on Absenteeism, Labour Turnover, Earnings, Employment and Labour Costs, was launched with effect from the ASI-1961. During that year, the Schedule was canvassed in respect of both the Census and the Sample Sectors. However, due to non-availability of detailed statistics in respect of the units in the Sample Sector, it was decided to canvass Part-II Schedule only for the Census Sector in subsequent years. The ASI in Sample Sector was, however, reintroduced with effect from ASI 1976-77.
Under the Collection of Statistics Act, 1953, the field survey for the ASI is conducted by the Field Operations Division (FOD) of the NSSO through its network of zonal, regional and sub-regional offices located all over the country. The Deputy Director General, FOD, is the Statistical Authority appointed under the Act for successful execution of the survey programme. The Central Statistical Organisation (CSO) is responsible for the processing and dissemination of data collected through Part-I of the ASI Schedule. Labour Bureau, likewise, is responsible for processing and dissemination of data on employment, mandays worked, social security benefits, labour cost and cost of production, collected through Block-E of Part-I and absenteeism, labour turnover and earnings collected through Part-II of the ASI schedule. The Standing Committee on Industrial Statistics provides guidance in this regard and suggests improvements from time to time in the sampling design, sample size, and techniques of data collection, processing and tabulation of data. The Committee has been constituted by the Ministry of Statistics & Programme Implementation and is represented by the CSO, NSSO, Labour Bureau, Ministry of Industry, State Governments, Reserve Bank of India, FICCI, CII, ASSOCHAM, research institutions, eminent scholars and other central Ministries. 1.2 Objectives of the ASI
The main objectives of the Annual Survey of Industries (Labour Part) are:
a. To build a systematic database on Absenteeism; Labour Turnover;
Earnings; Employment, and Labour Cost in Manufacturing Industries, and
b. To analyse various components of Labour Costs such as Wage/Salary;
Bonus; Provident Funds; Welfare Expenses, etc. in Manufacturing Industries.
1.3 Scope and Coverage
The scope of the ASI extends to the entire country except the States of
Arunachal Pradesh, Mizoram, Sikkim and the Union Territory (UT) of Lakshadweep. The coverage of ASI is extended to:
a. All factories registered under sections 2m(i) and 2m(ii) of the
Factories Act, 1948 which refer to the establishments using power and employing 10 or more workers and those not using power and employing 20 or more workers on any day of the preceding 12 months, and
6
b. Bidi and cigar manufacturing establishments registered under the Bidi and Cigar Workers (Condition of Employment) Act, 1966.
With effect from ASI 1998-99, all electricity undertakings engaged in
the generation, transmission and distribution of electricity, and registered with the Central Electricity Authority other than captive units are being kept outside the purview of the survey. Similarly, with effect from ASI 1999-2000, the departmental units such as Railway workshops, Road Transport Corporation workshops, Government mints, sanitary, water supply, gas, storage, etc. are also being kept outside its purview. Also, the defence factories, technical training institutions, jail factories, units engaged in storage and distribution of oil, restaurants, cafes and computer services are excluded from the scope of the survey. However, certain activities like cold storage, water supply, gas production & distribution, motion picture production, laundry services, repair of motor vehicles and of other consumer durables are covered under the survey. 1.4 Unit of Enumeration
The primary unit of ASI is a ‘factory’ in the case of manufacturing industries; a ‘workshop’ in the case of repair services; an ‘undertaking’ or a ‘licensee’ in the case of electricity, gas and water supply undertakings; and an ‘establishment’ in the case of bidi and cigar industries. The owner of two or more establishments located in the same State and pertaining to the same industry group and belonging to same scheme (census or sample) is, however, permitted to furnish a single consolidated return. Such consolidated returns are a common feature in the case of bidi and cigar establishments, electricity and certain public sector undertakings. 1.5 ASI Frame
The ASI frame is based on the lists of registered factories/units maintained by the Chief Inspector of Factories (CIF) in each State/Union Territory and those maintained by the licensing authorities in respect of the bidi and cigar establishments and electricity undertakings. The Regional Offices of FOD maintain close liaison with CIF and update the frame every year by adding the names of the newly registered units/establishments. The frame is revised once in three years by removing the names of the de-registered units from the ASI frame and adding those of newly registered units to the frame. 1.6 Classification of Factories
The ASI adopted from the beginning a very simple design. All the Units with 50 or more workers operating with power, and units having 100 or more workers operating without power were covered under the Census Sector. Also 12 States/UTs, namely, Himachal Pradesh, Jammu & Kashmir, Manipur, Meghalaya, Nagaland, Tripura, Pondicherry, A & N Islands, Chandigarh, Goa, Daman & Diu and Dadra & Nagar Haveli, which were industrially backward, were covered under Census Sector to take complete stock of their manufacturing activities. Even the Sample Sector which comprised of units employing less than 50/100 workers (operating with or without power) in the major States were covered fully over a span of two years. This procedure continued till 1986-87 by which time the total number of factories in the country grew enormously. Accordingly, the definition of the Census Sector was changed from ASI 1987-88 to units having 100 or more workers irrespective of their operation with or without power. All the units in the frame of 12 less industrially developed States/UTs were surveyed on complete enumeration basis. The rest of the universe was covered on sampling basis through an efficient sampling design
7
adopting State x 3-digit industry group as stratum so as to cover all the units in a span of three years. The design continued till ASI 1996-97.
Before launching of ASI 1997-98 due to constraints of resources in
covering a large number of units in the survey and generating the results of the survey in time bound manner, a review of the earlier design was made and a revised design was adopted in ASI 1997-98. The Census Sector was defined to include units having 200 or more workers and also some significant units were identified from the database of ASI 1993-94 to ASI 1995-96. These significant units although employed less than 200 workers, contributed significantly to the Value of Output in these ASI years. The complete coverage of all units in 12 less industrially developed States/UTs was continued. Also all Public Sector Undertakings (PSU) were included in the Census Sector. The rest of the universe was covered in the Sample Sector by the usual formula of determination of sample size at a given value of precision of the estimates with at least 99 per cent chance. The sampling design adopted State x 4-digit industry group as stratum.
With effect from ASI 2000-01, the coverage of the Census Sector was
modified to include units employing 100 or more workers and only 5 industrially backward States/Union Territories. For ASI 2007-08, the Census Sector consists of the following categories:-
a. All factories in five less industrially developed States/Union
Territories; viz., Manipur, Meghalaya, Nagaland, Tripura and Andaman & Nicobar Islands.
b. All factories employing 100 or more workers for rest of the States/Union Territories.
c. All factories declared as submitting 'Joint Returns' as identified by FOD, NSSO.
The units not covered under the Census Sector are covered under the
Sample Sector. 1.7 Sampling Design and Sample Allocation
The sampling design recommended by the Technical Committee headed by Prof. Arijit Chowdhury, ISI, Kolkata for ASI 1997-98 has been followed for ASI 2007-08 also, with stratum as state x NIC-2004 (4-digit level).
The sample size n for any industry at all India level is determined
first by assuming the Central Limit Theorem applicable to the large population. For any suitable characteristics X, say GVA, for 100p% variation in the estimates, the probability
_ _ _ P[ |x - X| ≤ p.X ] = 0.99 is ensured. Accordingly, it follows that n = (2.58/p)².(C.V.)² Assuming p=0.10 and calculating C.V. from ASI 2004-05, the sample size
n for each industry at NIC-2004 4-digit level is determined. The total sample size ni for ith state/Union Territory is then allotted in proportion to the number of units in the state.
N’i ni = n.----, where N’
8
N’ = Total number of units in the sample sector at all India
Level
N’i = Total number of units in the sample sector in the ith state/UT
1.8 Estimation Procedure
Let Nj = Number of units considered for selection from the jth
stratum
nj = Number of sample units selected from the jth stratum N’j = Number of units reported to exist in the frame in jth
stratum
n’j = Number of sample units reported in the jth stratum
T = Aggregate of a characteristics in a State/Union Territory
Tj = Aggregate of a characteristics in jth stratum
Mj = N’j/n’j, the multiplier for the jth stratum
Then, for any characteristics, its estimate T is given by T = ∑ Mj.Tj In case N’j and n’j are not known, Mj can be estimated, by using the
formula Mj = Nj/nj with the assumption that Nj/N’j = nj/n’j. 1.9 Schedule used for Enquiry
Data for the ASI are collected through a comprehensive schedule. In the initial rounds, the schedule sought particulars relating to manufacturing activity only. Over the years, alterations were made to meet the specific data requirements of various organizations. By 1973-74, the schedule consisted of five parts, viz., Part-I on manufacturing, Part-II on absenteeism, labour turnover, employment and labour cost, Part-III on stocks & consumption of components and accessories in small scale sector, Part-IV on construction expenditure and Part-V on indirect taxes, sales, subsidies and capacity of power equipments installed in the establishments. It was felt that the ASI schedule had become too unwieldy and complicated. So a modified schedule with only three parts on manufacturing, labour and construction was adopted with effect from ASI 1974-75.
The ASI schedule was further modified in 1987-88 and 1997-98. With
effect from ASI 1998-99, only Part-I and Part-II of the ASI Schedule are being canvassed and Part-III schedule relating to construction has been discontinued.
From ASI 1999-2000 onwards, Block-IV and Block-V of Part-II of the
schedule, which contained statistics on employment, mandays worked, labour cost on wages/salaries, bonus, provident funds and welfare expenses and total cost of production, have been merged with Block-E of Part-I of the ASI schedule. With effect from ASI 2002-03, Block-3 of Part-II of the ASI schedule was discontinued and Block-E of Part-I was modified by including a column on mandays paid for all categories of employees. A facsimile of Block-A, Block-B, Block-E, Block-F, Block-H and Block-I of Part-I and Block-1 and Block-2 of Part-II of the ASI schedule is enclosed at Annexure-I.
9
1.10 Reference Period
Reference period for 2007-08 round of Annual Survey of Industries was the accounting year of the factory, ending on any day during the fiscal year 2007-08. In ASI 2007-08, data collected from the respective units, thus, relates to their accounting year ending on any day between April 1, 2007 and March 31, 2008. 1.11 Period of Survey
The total survey period for ASI 2007-08 has been from September, 2008 to April, 2009. 1.12 Concepts and Definitions
The concepts and definitions followed in the survey and used in the present Report are given below:
a. Workers are defined to include all persons employed directly or through any agency, whether for wages or not, in any manufacturing process or in cleaning any part of machinery or premises used for manufacturing process or in any other kind of work, incidental to, or connected with the manufacturing process or the subject of manufacturing process. Labour engaged in repair and maintenance or production of fixed assets for factory’s own use or labour employed for generating electricity, etc. is also included.
b. Contract Workers are defined as all persons who were not employed
directly by an employer but through the contractor. These workers may be employed with or without the knowledge of the principal employer.
c. Supervisory & Managerial Staff include persons in supervisory and
managerial positions employed by the factory, whether covered by the definition of the term ‘workers’ under the Factory Act, 1948 or not.
d. Other Employees are the remaining employees employed by the
factory not included in the category of ‘workers’ and ‘supervisory & managerial staff’.
e. Employees include all workers and persons receiving wage/salary
and holding supervisory or managerial positions engaged in administrative office, store keeping and welfare sections, sales department as also those engaged in purchase of raw materials, etc or purchase of fixed assets for the factory and watch and ward staff.
f. Mandays worked is obtained by summing up the number of mandays
worked by persons working in each shift over all the shifts worked on all the days.
g. Mandays paid for is arrived at by summing up the number of
employees paid each shift during the reference period. This also includes all mandays on weekly off-days and scheduled holidays, if paid for, and other absences with pay, as also mandays lost through lay-off/strike for which compensation is payable.
h. Wages/salaries are defined to include all remuneration in monetary
terms and also payable more or less regularly in each pay period
10
to workers as compensation for the work done during the accounting year. It includes:
i) Wages and salaries including paid for leave period and
holidays; ii) Payment for dearness, overtime, compensatory, house
rent and other allowances; iii) Production bonus, good attendance bonus, incentive
bonus, etc. which are paid more or less regularly for each pay period; and
iv) Lay-off payments and compensation for unemployment
except where such payments are made from trust or other social funds set up especially for this purpose.
The amount of wages/salaries payable during the accounting
year are expressed in terms of gross value i.e. before deductions for fines, damages, taxes, provident fund, employees’ state insurance contribution, etc. For workers employed through contractors, payment made to these workers and not the payment made to the contractors are recorded. Benefits in kind (perquisites) of individual nature are only included. It excludes employer’s imputed value of group benefits in kind and travelling and other expenditures incurred for business purposes and reimbursed by the employer.
i. Bonus includes profit sharing bonus, festival bonus, year-end and
other bonuses and ex-gratia payments paid at less frequently intervals (i.e. other than bonuses paid more or less regularly for each pay period).
j. Provident and other funds include employers’ contribution to old
age benefits like provident fund, pension, gratuity etc. and contributions to other social security benefits such as the Employees’ State Insurance (ESI), compensation for work injuries and occupational diseases, provident fund linked insurance, retrenchment and lay-off benefits.
k. Workmen and Staff welfare expenses include expenditure incurred by
employer on maternity benefits; crèches and other benefits such as supply of food, beverages, tobacco, clothing and group lodging at concessional rates; educational, cultural and recreational facilities and services; and grants to trade unions and co-operative stores meant for the employees. All group benefits were also included.
l. Public Sector covers the establishments, which are
i) Wholly owned by the Central Government; ii) Wholly owned by the State and/or Local Government; and iii) Wholly owned by the Central Government and the State and/or
Local Government jointly.
m. Joint Sector covers the following type of ownership:
i) Central Government and private enterprise jointly; ii) State Government/Local Government and private enterprise
jointly; and
11
iii) Central, State/Local Government and private enterprise jointly.
n. Private Sector covered establishments wholly owned by any private
person or persons. o. Absenteeism is defined as the failure of a worker to report for
work when he is scheduled to work. A worker is considered scheduled to work when the employer has work available for him and the worker is aware of it. Authorised absence is also treated as absence while presence even for a part of the shift is treated as presence for whole shift. Absence on account of strikes, lockout, layoff, weekly rests or suspension is not taken into account. Thus, it relates to only voluntary absence due to personal reasons of the individual concerned. Absenteeism rates given in the report represent percentage of mandays lost due to absence to the corresponding total mandays scheduled to work. The mandays scheduled to work is arrived at by adding the mandays actually worked and the mandays lost on account of absence of the workers due to some reason or the other.
p. Labour Turnover measures the extent of change in the working force
due to accession and separation during the reference period. The term ‘accession’ is defined as the total number of workers added to the employment during the period, whether new or re-employed or transferred from other establishments or units under the same management. Inter-departmental transfers within the same establishment are, however, ignored. The term ‘separation’ implies severance of employment at the instance of workers or employer. It includes termination of service due to death or retirement, retrenchment as a result of rationalization or modernization or other reasons. The annual accession or separation rate is calculated as percentage of total accession or separation during the year to the average of number of workers in employment during the year.
q. The Average Number of Workers in employment during a year has been
derived by dividing the total number of workers in employment on the first and the last day of all the twelve months, by twice the total number of months actually worked during the reference period.
1.13 Classification of Industries
The new series of industrial classification (NIC-2004) was introduced with effect from the ASI 2004-05. All the industrial units in the ASI frame were accordingly classified in their appropriate industry groups on the basis of the value of the principle product manufactured by them. The unit, thus, got classified in one and only one industry group even though it might be manufacturing products belonging to different industries. The different aggregates are presented at 3-digit and 4-digit level corresponding to this classification. An extract from this classification showing industry groups along with their descriptions and codes used in this publication is reproduced at Annexure-II. 1.14 Processing and Tabulation of Data
A CD containing the data, corresponding to the employment, mandays, labour cost and total cost of production under Block-A, Block-B and Block-E of Part-I of the ASI schedule, was received from the CSO, IS Wing, Kolkata,
12
as per the directive of the Standing Committee on Industrial Statistics. The Machine Tabulation Unit (MTU) of Labour Bureau processed the data on absenteeism and labour turnover based on Block-2 of Part-II of the ASI Schedule. ASI Section of Labour Bureau further validated and cleaned the Block-2 data submitted by the MTU. Final processing and tabulation of the data under Block-E and Block-2 were undertaken by the ASI Section and Tables were generated for drafting the report. 1.15 Presentation of Data
The ASI results presented in this report relate to factory sector i.e. industrial units covered under the Census and sample Sectors of the ASI. The total of any characteristics was obtained by adding the figures of the Census Sector and estimates of the Sample Sector. The report contains data on Absenteeism; Labour Turnover; Employment; Mandays Worked and Paid for; Labour Cost; and total Cost of Production by States, Sectors and Industries at 3-digit and 4-digit level of NIC-2004.
The data relating to Mandays Worked, Mandays Paid for, Labour Cost and Cost of Production are rounded off to thousands separately at different aggregate levels of all India, States, Industries and Sectors. Therefore, these figures at higher level aggregates may not tally with the lower level aggregates due to rounding off errors, if any.
As per the tabulation policy, it has been decided to publish the detailed information corresponding to industry codes 014 to 372 at 3-digit level and 0140 to 3720 at 4-digit level following NIC-2004. For industry codes equal to and greater than 400 at 3-digit level and 4000 at 4-digit level, the units have been clubbed and shown under a common industry code 400 and 4000, respectively, in different tables.
The rounded off figures of mandays, labour cost and cost of production to thousands, have been shown by ‘0’, wherever these figures were found to be negligible (less than 500). The figures found to be nil or not applicable have been indicated by a dash (-).
Data for the cases, where the number of factories is less than 3, have not been published in the Tables presented at 4-digit level of NIC-2004.
-0-0-0-
13
CHAPTER – II
ABSENTEEISM
Information regarding absenteeism amongst workers in an industry or an industrial establishment on account of reasons other than strikes, lockouts, lay-off, weekly rest or suspension, provides a sound database for gauging the employee’s morale, commitment and level of job satisfaction which have a direct bearing on productivity. The effects of high levels of absenteeism are wide ranging and affect everyone in the organisation. It cannot be regarded purely as a management problem. Employers, workers and their representatives have an obligation towards the organisation in ensuring that absence of workers do not jeopardise their prosperity or job satisfaction and committed level of output.
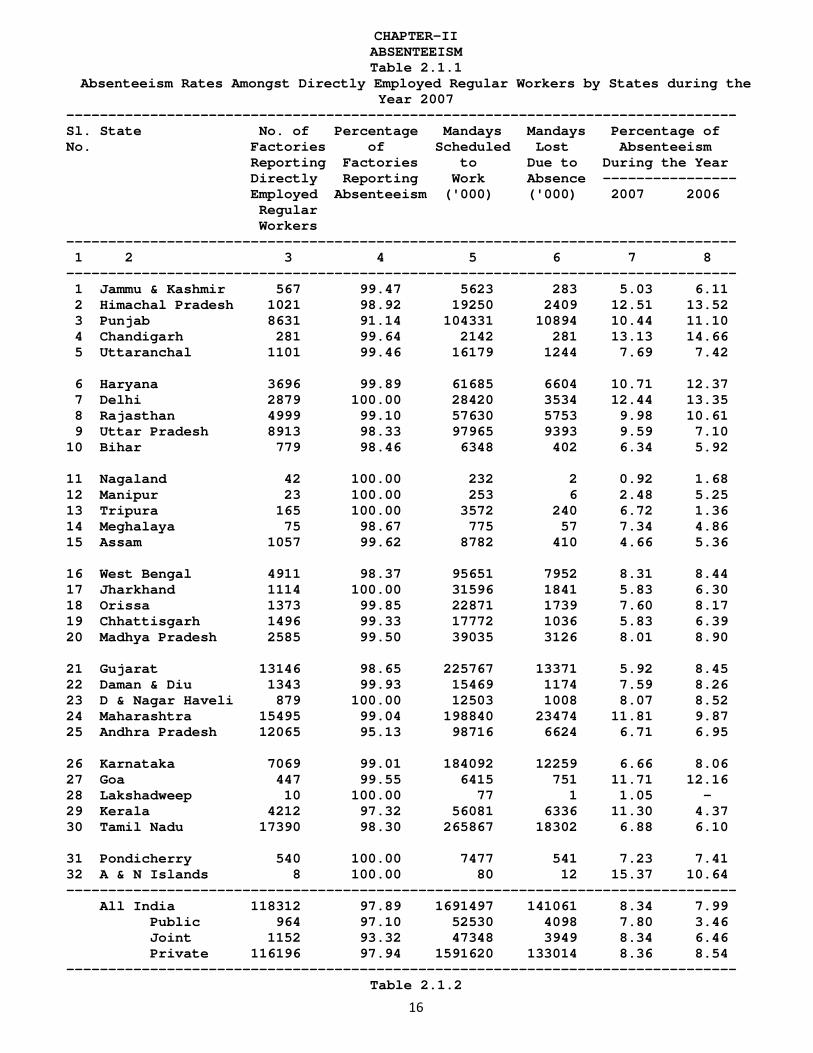
Absenteeism is also one of the indicators to evaluate and monitor various employees’ welfare programmes and labour policies. With this aim in view, statistics on absenteeism amongst the directly employed regular workers are being collected on a regular basis as a part of the Annual Survey of Industries. Absenteeism rate amongst these workers in an industry or a State are worked out as percentages of mandays lost on account of absence to the mandays scheduled to work in the respective industry or State. Statistics on the number of factories reporting absenteeism, percentage of such factories, mandays scheduled to work, mandays lost due to absence and percentage of absenteeism by States, Industries and Sectors during the year 2007, are presented in Tables 2.1.1, 2.1.2, 2.2.1 and 2.2.2, respectively. 2.1 Absenteeism in States State-wise absenteeism rate amongst the directly employed regular workers during the year 2007 is given in Table 2.1.1. It is observed that the rate of absenteeism at all India level increased to 8.34 per cent during 2007 from 7.99 per cent during 2006. Out of 32 States/Union Territories, the rate of absenteeism was higher in 11 States than the absenteeism rate at all-India level during 2007. The highest absenteeism rate was observed in Andaman & Nicobar Islands (15.37 per cent) and followed by Chandigarh (13.13 percent), Himachal Pradesh (12.51 per cent), Delhi (12.44 per cent), Maharashtra (11.81 per cent), Goa (11.71 per cent) and Kerala (11.30 per cent). The lowest absenteeism rate was recorded at 0.92 per cent in Nagaland followed by Lakshdweep (1.05 per cent),Manipur(2.48 per cent) and Assam (4.66 per cent)..
An increase in absenteeism rate during 2007 as compared to that in 2006 was recorded in 9 States/Union Territories. As compared to 2006, there has been a sharp decline in the absenteeism rate in the State of Manipur, whereas there has been a significant increase in the States of Tripura,Kerala and A&N islands.
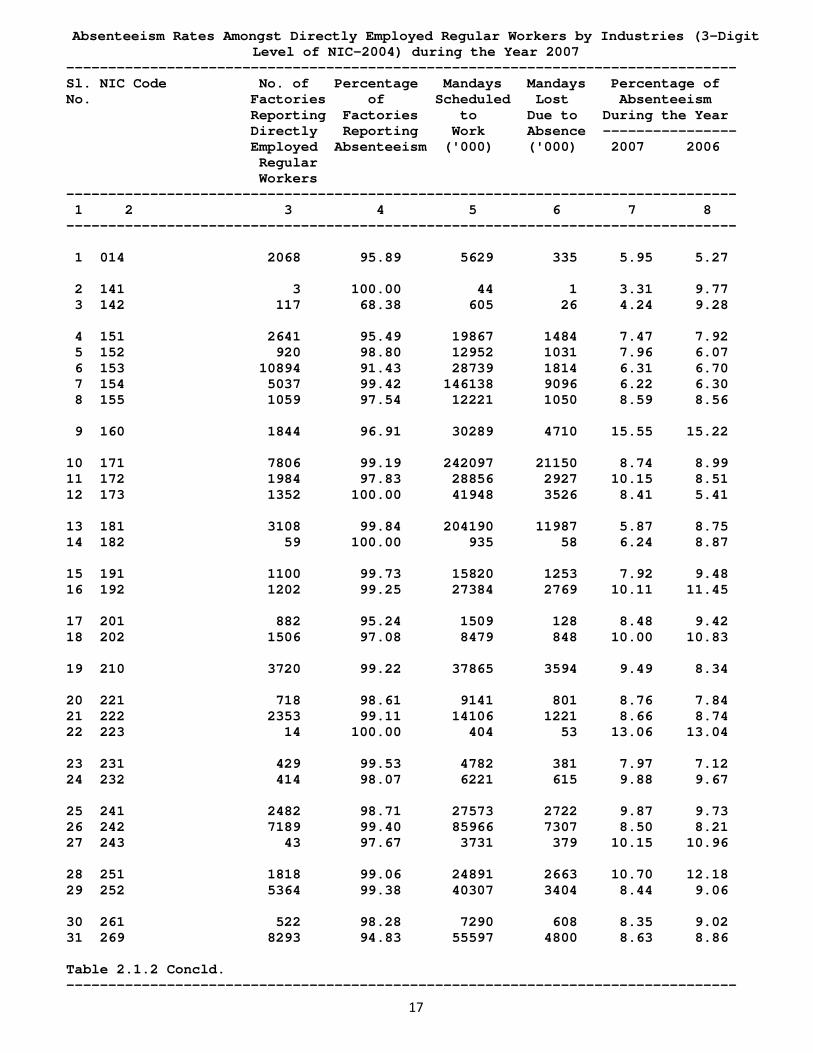
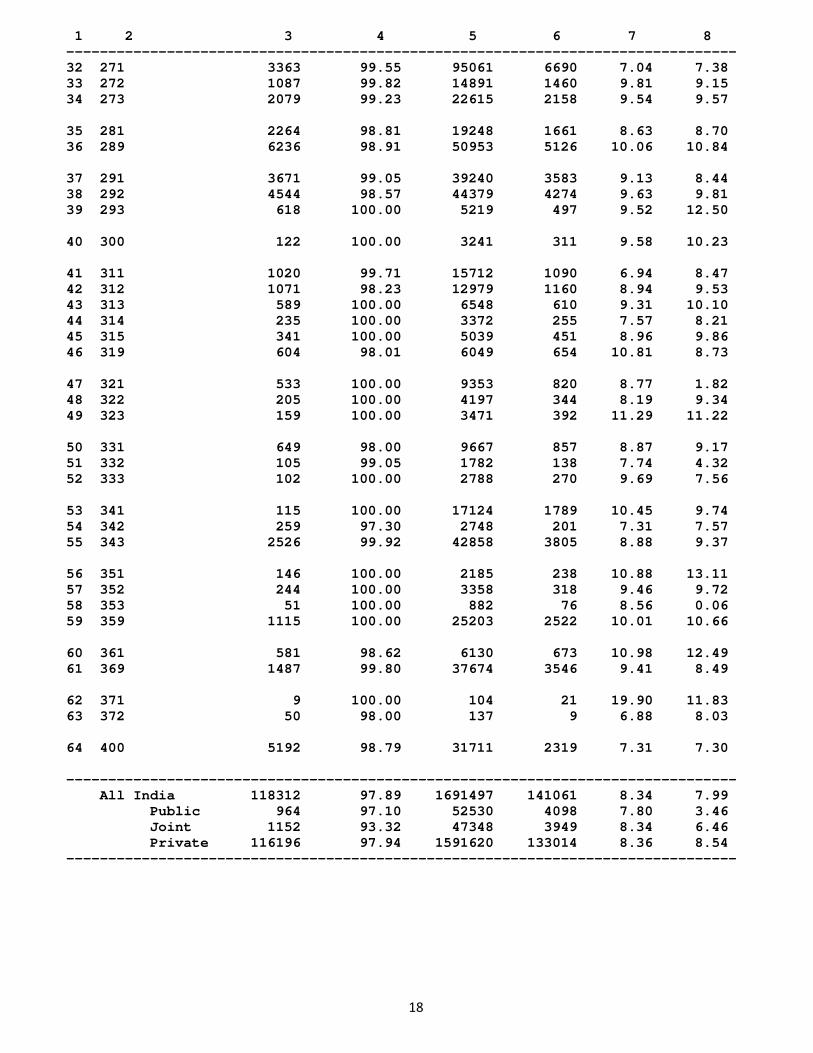
2.2 Absenteeism in Industries Industry-wise absenteeism rate amongst the directly employed regular workers during 2007 is depicted in Table 2.1.2. It reveals that during 2007, the highest rate of absenteeism was reported at 19.90 per cent in the industry group ‘371-Recycling of metal waste and scrap followed by industry
14
groups ‘160-Manufacture of tobacco products’(15.55 per cent), ‘223-Reproduction of recorded media’ (13.06 per cent), ’323-Manufature of domestic appliances’ (11.29 per cent), ‘361- Manufacture of Furniture’ (10.98 per cent).
The lowest rate of absenteeism was reported at 3.31 per cent in industry group ‘141-Quarrying of stone, sand and clay’, The industry groups 142-Minning and quarrying n.e.c (4.24 percent)and 181-Manufacturing of wearing apparel, dressing and dyeing of fur(5.87cent) also reported low rates of absenteeism.
Out of 64 industry groups, absenteeism rate was higher than that at the
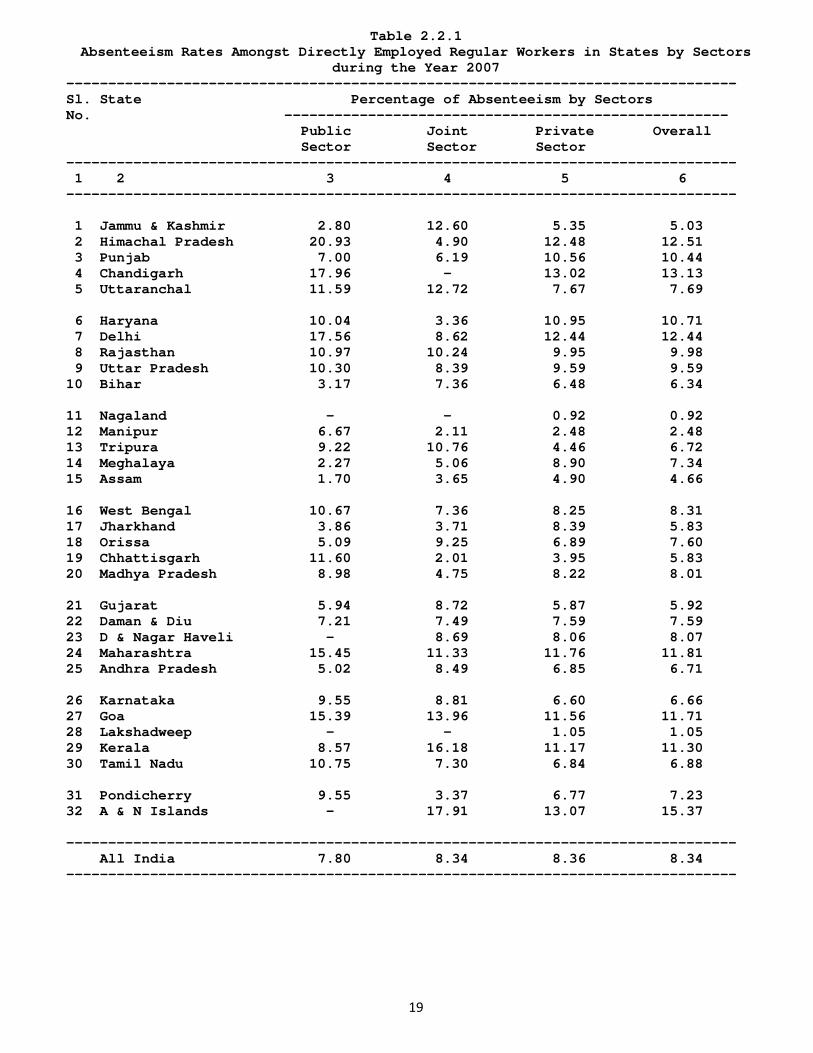
all-India level in 46 industry groups, whereas an increase in the rate of absenteeism during 2007 was witnessed in 25 industry groups over that of 2006. As compared to 2006, there was a significant increase in absenteeism rate in industry groups ‘353-Manufacture of aircraft and spacecraft’ and ‘321-Manufacture of electronic valves and tubes & other electronic components. 2.3 Absenteeism in States by Sectors Table 2.2.1 shows the State-wise and Sector-wise absenteeism rates during 2007. Among the three sectors viz. Public, Joint and Private Sectors, the highest rate of absenteeism at all India level was reported at 8.36 per cent in Private Sector, followed by Joint Sector (8.34 per cent) and Public Sector (7.80 per cent).
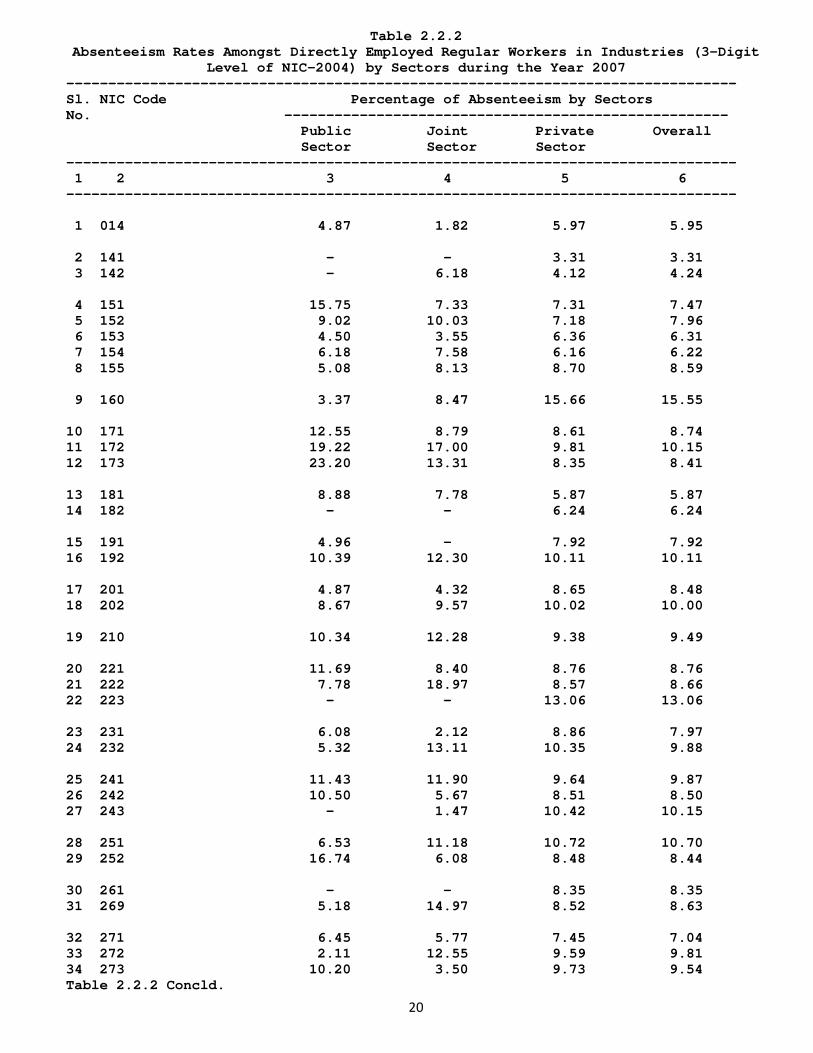
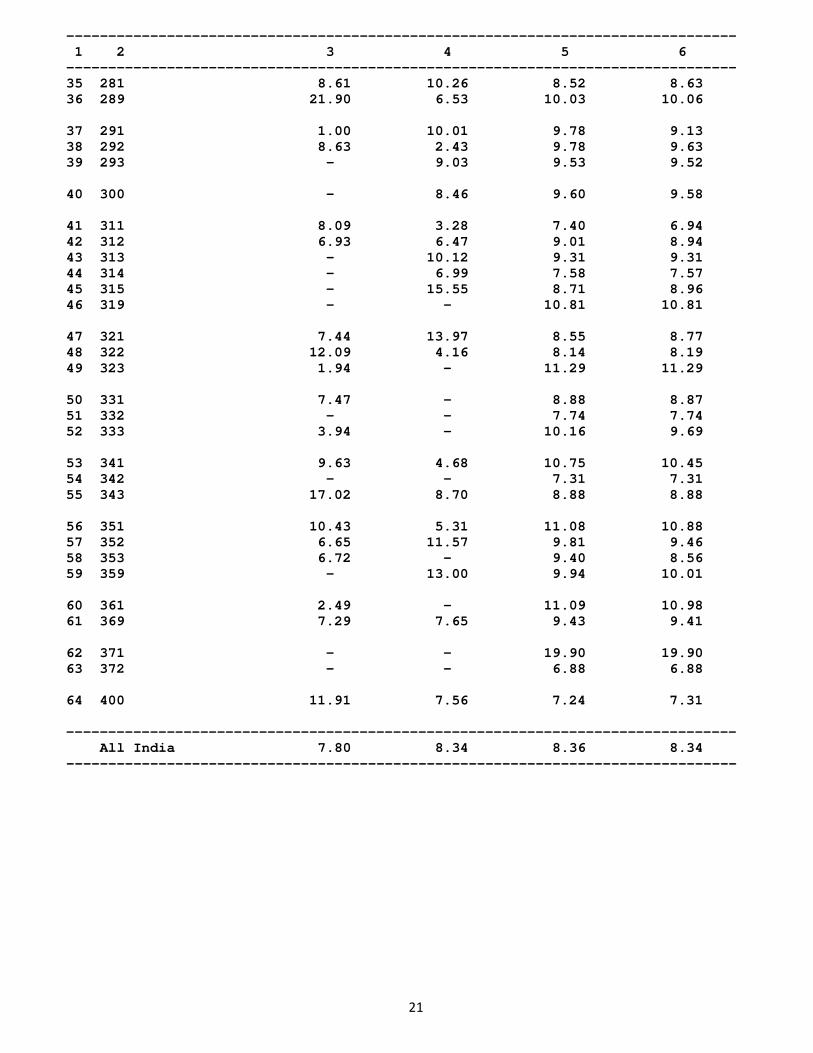
The absenteeism rates in North-Eastern States were on the lower side in all the sectors except in case of Tripura, where it was 10.76 in the joint sector and 9.22 percent in the Public Sector. The rate of absenteeism in Public Sector was highest at 20.93 per cent in Himachal Pradesh, followed by Chandigarh(17.96 per cent) and Delhi (17.56 per cent). The absenteeism rate was recorded lowest in the Public Sector at 1.70 per cent in Assam followed by Meghalaya (2.27 per cent), Jammu & Kashmir (2.80 per cent), Bihar (3.17 per cent) and Jharkhand(3.86 per cent). In the Joint Sector, the absenteeism rate was highest at 17.91 per cent in A&N islands, followed by Kerala (16.18 per cent) and Goa (13.96 per cent), whereas the lowest rate of absenteeism was recorded at 2.01 per cent in Chhatisgarh, followed by Manipur with 2.11 per cent. In Private Sector, 4 States/Union Territories, viz. A & N islands, Chandigarh, Himachal Pradesh, and Delhi recorded absenteeism rates of more than 12 per cent. The absenteeism rate was less than 7 per cent in North-Eastern States (except Meghalaya), Jammu & Kashmir, Chhattisgarh, Tamil Nadu, Bihar, Orissa, Gujarat, A.P, Karnataka, Lakshadweep and Pondicherry. 2.4 Absenteeism in Industries by Sectors Industry-wise and Sector-wise absenteeism rate for the year 2007 is given in Table 2.2.2. In the Public Sector, the rate of absenteeism was recorded more than 15 per cent in Six industry group viz. ‘173-Manufacture of Knitted and crocheted fabrics and articles (23.20 per cent),‘289-Manufacture of other fabricated metal products, metal working service activities’(21.90 per cent), ‘172-Manufacture of other textiles’(19.22 per cent), ‘343-Manufacture of parts and accessories for motor vehicles and their engines’ (17.02 per cent) and ‘252-Manufacture of Plastic products,(16.74 per cent)and ‘151- Production, processing and preservation of meat, fish, fruit, vegetables, oils and fats’ (15.75 percent). The rate of absenteeism was recorded less than 5 per cent in 10 industry groups, viz. ‘291’-Manufacture
15
of General purpose machinery{1.00 per cent}, ‘323-Manufacture of television and radio receivers, sound or video recording or reproducing apparatus, and associated goods’{1.94 per cent}, ‘272-Manufacture of Basic precious and non-ferrous metals’{2.11 per cent}, ‘361-Manufacture of Furniture’{2.49 per cent}, ‘160-Manufacture of Tobacco products {3.37 per cent},’333’-Manufacture of watches and clocks (3.94 per cent), ‘153-Manufacture of grain mill products, starches and starch products, and prepared animal feeds (4.50 per cent),’014-Agriculture and animal husbandry service activities, except veterinary activities’ (4.87 percent)’ ‘201-Saw milling and planning of wood’,(4.87 per cent), ‘191-Tanning and dressing of leather, manufacturer of luggage handbags, saddler &harness(4.06 per cent). In the Joint Sector, the highest rate of absenteeism at 18.97 per cent was reported in industry group ‘222-Printing & service activities related to printing, whereas the lowest rate of 1.47 per cent was reported in the industry group ‘243-Manufacture of Man made fibers. In the Private Sector, the highest rate of absenteeism at 19.90 per cent was recorded in industry group ‘371-Recycling of metal waste and scrap, whereas the lowest rate of 3.31 per cent was reported in industry group.‘141’-Quariying of stone, sand and clay.
-0-0-0-
16
CHAPTER-II ABSENTEEISM Table 2.1.1
Absenteeism Rates Amongst Directly Employed Regular Workers by States during the Year 2007
-------------------------------------------------------------------------------- Sl. State No. of Percentage Mandays Mandays Percentage of No. Factories of Scheduled Lost Absenteeism Reporting Factories to Due to During the Year Directly Reporting Work Absence ---------------- Employed Absenteeism ('000) ('000) 2007 2006 Regular Workers -------------------------------------------------------------------------------- 1 2 3 4 5 6 7 8 -------------------------------------------------------------------------------- 1 Jammu & Kashmir 567 99.47 5623 283 5.03 6.11 2 Himachal Pradesh 1021 98.92 19250 2409 12.51 13.52 3 Punjab 8631 91.14 104331 10894 10.44 11.10 4 Chandigarh 281 99.64 2142 281 13.13 14.66 5 Uttaranchal 1101 99.46 16179 1244 7.69 7.42 6 Haryana 3696 99.89 61685 6604 10.71 12.37 7 Delhi 2879 100.00 28420 3534 12.44 13.35 8 Rajasthan 4999 99.10 57630 5753 9.98 10.61 9 Uttar Pradesh 8913 98.33 97965 9393 9.59 7.10 10 Bihar 779 98.46 6348 402 6.34 5.92 11 Nagaland 42 100.00 232 2 0.92 1.68 12 Manipur 23 100.00 253 6 2.48 5.25 13 Tripura 165 100.00 3572 240 6.72 1.36 14 Meghalaya 75 98.67 775 57 7.34 4.86 15 Assam 1057 99.62 8782 410 4.66 5.36 16 West Bengal 4911 98.37 95651 7952 8.31 8.44 17 Jharkhand 1114 100.00 31596 1841 5.83 6.30 18 Orissa 1373 99.85 22871 1739 7.60 8.17 19 Chhattisgarh 1496 99.33 17772 1036 5.83 6.39 20 Madhya Pradesh 2585 99.50 39035 3126 8.01 8.90 21 Gujarat 13146 98.65 225767 13371 5.92 8.45 22 Daman & Diu 1343 99.93 15469 1174 7.59 8.26 23 D & Nagar Haveli 879 100.00 12503 1008 8.07 8.52 24 Maharashtra 15495 99.04 198840 23474 11.81 9.87 25 Andhra Pradesh 12065 95.13 98716 6624 6.71 6.95 26 Karnataka 7069 99.01 184092 12259 6.66 8.06 27 Goa 447 99.55 6415 751 11.71 12.16 28 Lakshadweep 10 100.00 77 1 1.05 - 29 Kerala 4212 97.32 56081 6336 11.30 4.37 30 Tamil Nadu 17390 98.30 265867 18302 6.88 6.10 31 Pondicherry 540 100.00 7477 541 7.23 7.41 32 A & N Islands 8 100.00 80 12 15.37 10.64 -------------------------------------------------------------------------------- All India 118312 97.89 1691497 141061 8.34 7.99 Public 964 97.10 52530 4098 7.80 3.46 Joint 1152 93.32 47348 3949 8.34 6.46 Private 116196 97.94 1591620 133014 8.36 8.54 --------------------------------------------------------------------------------
Table 2.1.2
17
Absenteeism Rates Amongst Directly Employed Regular Workers by Industries (3-Digit Level of NIC-2004) during the Year 2007
-------------------------------------------------------------------------------- Sl. NIC Code No. of Percentage Mandays Mandays Percentage of No. Factories of Scheduled Lost Absenteeism Reporting Factories to Due to During the Year Directly Reporting Work Absence ---------------- Employed Absenteeism ('000) ('000) 2007 2006 Regular Workers -------------------------------------------------------------------------------- 1 2 3 4 5 6 7 8 -------------------------------------------------------------------------------- 1 014 2068 95.89 5629 335 5.95 5.27 2 141 3 100.00 44 1 3.31 9.77 3 142 117 68.38 605 26 4.24 9.28 4 151 2641 95.49 19867 1484 7.47 7.92 5 152 920 98.80 12952 1031 7.96 6.07 6 153 10894 91.43 28739 1814 6.31 6.70 7 154 5037 99.42 146138 9096 6.22 6.30 8 155 1059 97.54 12221 1050 8.59 8.56 9 160 1844 96.91 30289 4710 15.55 15.22 10 171 7806 99.19 242097 21150 8.74 8.99 11 172 1984 97.83 28856 2927 10.15 8.51 12 173 1352 100.00 41948 3526 8.41 5.41 13 181 3108 99.84 204190 11987 5.87 8.75 14 182 59 100.00 935 58 6.24 8.87 15 191 1100 99.73 15820 1253 7.92 9.48 16 192 1202 99.25 27384 2769 10.11 11.45 17 201 882 95.24 1509 128 8.48 9.42 18 202 1506 97.08 8479 848 10.00 10.83 19 210 3720 99.22 37865 3594 9.49 8.34 20 221 718 98.61 9141 801 8.76 7.84 21 222 2353 99.11 14106 1221 8.66 8.74 22 223 14 100.00 404 53 13.06 13.04 23 231 429 99.53 4782 381 7.97 7.12 24 232 414 98.07 6221 615 9.88 9.67 25 241 2482 98.71 27573 2722 9.87 9.73 26 242 7189 99.40 85966 7307 8.50 8.21 27 243 43 97.67 3731 379 10.15 10.96 28 251 1818 99.06 24891 2663 10.70 12.18 29 252 5364 99.38 40307 3404 8.44 9.06 30 261 522 98.28 7290 608 8.35 9.02 31 269 8293 94.83 55597 4800 8.63 8.86 Table 2.1.2 Concld. --------------------------------------------------------------------------------
18
1 2 3 4 5 6 7 8 -------------------------------------------------------------------------------- 32 271 3363 99.55 95061 6690 7.04 7.38 33 272 1087 99.82 14891 1460 9.81 9.15 34 273 2079 99.23 22615 2158 9.54 9.57 35 281 2264 98.81 19248 1661 8.63 8.70 36 289 6236 98.91 50953 5126 10.06 10.84 37 291 3671 99.05 39240 3583 9.13 8.44 38 292 4544 98.57 44379 4274 9.63 9.81 39 293 618 100.00 5219 497 9.52 12.50 40 300 122 100.00 3241 311 9.58 10.23 41 311 1020 99.71 15712 1090 6.94 8.47 42 312 1071 98.23 12979 1160 8.94 9.53 43 313 589 100.00 6548 610 9.31 10.10 44 314 235 100.00 3372 255 7.57 8.21 45 315 341 100.00 5039 451 8.96 9.86 46 319 604 98.01 6049 654 10.81 8.73 47 321 533 100.00 9353 820 8.77 1.82 48 322 205 100.00 4197 344 8.19 9.34 49 323 159 100.00 3471 392 11.29 11.22 50 331 649 98.00 9667 857 8.87 9.17 51 332 105 99.05 1782 138 7.74 4.32 52 333 102 100.00 2788 270 9.69 7.56 53 341 115 100.00 17124 1789 10.45 9.74 54 342 259 97.30 2748 201 7.31 7.57 55 343 2526 99.92 42858 3805 8.88 9.37 56 351 146 100.00 2185 238 10.88 13.11 57 352 244 100.00 3358 318 9.46 9.72 58 353 51 100.00 882 76 8.56 0.06 59 359 1115 100.00 25203 2522 10.01 10.66 60 361 581 98.62 6130 673 10.98 12.49 61 369 1487 99.80 37674 3546 9.41 8.49 62 371 9 100.00 104 21 19.90 11.83 63 372 50 98.00 137 9 6.88 8.03 64 400 5192 98.79 31711 2319 7.31 7.30 -------------------------------------------------------------------------------- All India 118312 97.89 1691497 141061 8.34 7.99 Public 964 97.10 52530 4098 7.80 3.46 Joint 1152 93.32 47348 3949 8.34 6.46 Private 116196 97.94 1591620 133014 8.36 8.54 --------------------------------------------------------------------------------
19
Table 2.2.1 Absenteeism Rates Amongst Directly Employed Regular Workers in States by Sectors
during the Year 2007 -------------------------------------------------------------------------------- Sl. State Percentage of Absenteeism by Sectors No. ----------------------------------------------------- Public Joint Private Overall Sector Sector Sector -------------------------------------------------------------------------------- 1 2 3 4 5 6 -------------------------------------------------------------------------------- 1 Jammu & Kashmir 2.80 12.60 5.35 5.03 2 Himachal Pradesh 20.93 4.90 12.48 12.51 3 Punjab 7.00 6.19 10.56 10.44 4 Chandigarh 17.96 - 13.02 13.13 5 Uttaranchal 11.59 12.72 7.67 7.69 6 Haryana 10.04 3.36 10.95 10.71 7 Delhi 17.56 8.62 12.44 12.44 8 Rajasthan 10.97 10.24 9.95 9.98 9 Uttar Pradesh 10.30 8.39 9.59 9.59 10 Bihar 3.17 7.36 6.48 6.34 11 Nagaland - - 0.92 0.92 12 Manipur 6.67 2.11 2.48 2.48 13 Tripura 9.22 10.76 4.46 6.72 14 Meghalaya 2.27 5.06 8.90 7.34 15 Assam 1.70 3.65 4.90 4.66 16 West Bengal 10.67 7.36 8.25 8.31 17 Jharkhand 3.86 3.71 8.39 5.83 18 Orissa 5.09 9.25 6.89 7.60 19 Chhattisgarh 11.60 2.01 3.95 5.83 20 Madhya Pradesh 8.98 4.75 8.22 8.01 21 Gujarat 5.94 8.72 5.87 5.92 22 Daman & Diu 7.21 7.49 7.59 7.59 23 D & Nagar Haveli - 8.69 8.06 8.07 24 Maharashtra 15.45 11.33 11.76 11.81 25 Andhra Pradesh 5.02 8.49 6.85 6.71 26 Karnataka 9.55 8.81 6.60 6.66 27 Goa 15.39 13.96 11.56 11.71 28 Lakshadweep - - 1.05 1.05 29 Kerala 8.57 16.18 11.17 11.30 30 Tamil Nadu 10.75 7.30 6.84 6.88 31 Pondicherry 9.55 3.37 6.77 7.23 32 A & N Islands - 17.91 13.07 15.37 -------------------------------------------------------------------------------- All India 7.80 8.34 8.36 8.34 --------------------------------------------------------------------------------
20
Table 2.2.2 Absenteeism Rates Amongst Directly Employed Regular Workers in Industries (3-Digit
Level of NIC-2004) by Sectors during the Year 2007 -------------------------------------------------------------------------------- Sl. NIC Code Percentage of Absenteeism by Sectors No. ----------------------------------------------------- Public Joint Private Overall Sector Sector Sector -------------------------------------------------------------------------------- 1 2 3 4 5 6 -------------------------------------------------------------------------------- 1 014 4.87 1.82 5.97 5.95 2 141 - - 3.31 3.31 3 142 - 6.18 4.12 4.24 4 151 15.75 7.33 7.31 7.47 5 152 9.02 10.03 7.18 7.96 6 153 4.50 3.55 6.36 6.31 7 154 6.18 7.58 6.16 6.22 8 155 5.08 8.13 8.70 8.59 9 160 3.37 8.47 15.66 15.55 10 171 12.55 8.79 8.61 8.74 11 172 19.22 17.00 9.81 10.15 12 173 23.20 13.31 8.35 8.41 13 181 8.88 7.78 5.87 5.87 14 182 - - 6.24 6.24 15 191 4.96 - 7.92 7.92 16 192 10.39 12.30 10.11 10.11 17 201 4.87 4.32 8.65 8.48 18 202 8.67 9.57 10.02 10.00 19 210 10.34 12.28 9.38 9.49 20 221 11.69 8.40 8.76 8.76 21 222 7.78 18.97 8.57 8.66 22 223 - - 13.06 13.06 23 231 6.08 2.12 8.86 7.97 24 232 5.32 13.11 10.35 9.88 25 241 11.43 11.90 9.64 9.87 26 242 10.50 5.67 8.51 8.50 27 243 - 1.47 10.42 10.15 28 251 6.53 11.18 10.72 10.70 29 252 16.74 6.08 8.48 8.44 30 261 - - 8.35 8.35 31 269 5.18 14.97 8.52 8.63 32 271 6.45 5.77 7.45 7.04 33 272 2.11 12.55 9.59 9.81 34 273 10.20 3.50 9.73 9.54 Table 2.2.2 Concld.
21
-------------------------------------------------------------------------------- 1 2 3 4 5 6 -------------------------------------------------------------------------------- 35 281 8.61 10.26 8.52 8.63 36 289 21.90 6.53 10.03 10.06 37 291 1.00 10.01 9.78 9.13 38 292 8.63 2.43 9.78 9.63 39 293 - 9.03 9.53 9.52 40 300 - 8.46 9.60 9.58 41 311 8.09 3.28 7.40 6.94 42 312 6.93 6.47 9.01 8.94 43 313 - 10.12 9.31 9.31 44 314 - 6.99 7.58 7.57 45 315 - 15.55 8.71 8.96 46 319 - - 10.81 10.81 47 321 7.44 13.97 8.55 8.77 48 322 12.09 4.16 8.14 8.19 49 323 1.94 - 11.29 11.29 50 331 7.47 - 8.88 8.87 51 332 - - 7.74 7.74 52 333 3.94 - 10.16 9.69 53 341 9.63 4.68 10.75 10.45 54 342 - - 7.31 7.31 55 343 17.02 8.70 8.88 8.88 56 351 10.43 5.31 11.08 10.88 57 352 6.65 11.57 9.81 9.46 58 353 6.72 - 9.40 8.56 59 359 - 13.00 9.94 10.01 60 361 2.49 - 11.09 10.98 61 369 7.29 7.65 9.43 9.41 62 371 - - 19.90 19.90 63 372 - - 6.88 6.88 64 400 11.91 7.56 7.24 7.31 -------------------------------------------------------------------------------- All India 7.80 8.34 8.36 8.34 --------------------------------------------------------------------------------
22
CHAPTER-III
LABOUR TURNOVER
Labour turnover is an important parameter indicating overall health of
an industry or an establishment in terms of wages, industrial relations, working conditions and other welfare facilities provided by the employers to the workers. Labour Turnover measures the extent of change in the work force due to accession or separation during a particular period of time. Higher rate of Labour Turnover indicates lack of stability in the labour force, which is not conducive to higher productivity.
High Labour Turnover may adversely affect a business. Not only it is expensive, but it also lowers productivity and morale and tends to get worse if not manoeuvred properly. Simultaneously looking at it from a different angle, Labour Turnover, to a certain extent, helps to infuse new ideas, skills and enthusiasm to the labour force. A natural level of Labour Turnover can provide a way for a business to reduce its workforce gradually without having to resort to redundancies.
Generally, following factors could be the causes of a high level of Labour Turnover;
a) Dissatisfaction on account of insufficient wages leading to
employees moving to competitors, b) Low level of motivation from employers’ side and poor morale within
the workforce in a specific industry, c) Faulty Recruitment and misplacement of employees resulting in their
mobility in search of suitable employment, and d) A buoyant local labour market offering better and more attractive
opportunities to employees.
Comparative statistics relating to the rate of accession and separation in respect of directly employed regular workers during the year 2007 vis-à-vis 2006, their average employment and the percentage of factories reporting labour turnover by States, Industries and Sectors have been presented in Tables 3.1.1. 3.1.2, 3.2.1 and 3.2.2. 3.1 Labour Turnover by States
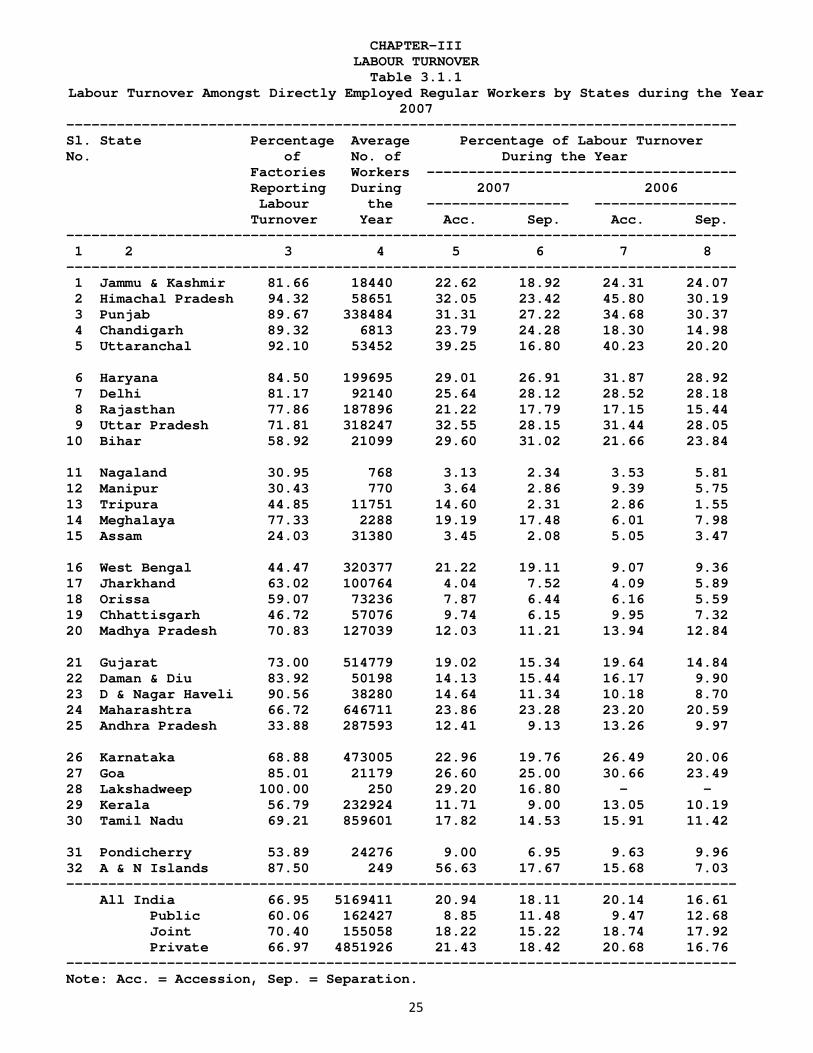
State-wise Labour Turnover among directly employed regular workers is presented in Table 3.1.1. It may be seen from the Table that at all India level, the rate of accession, during the year 2007, was 20.94 per cent as compared to 20.14 per cent during the year 2006. The overall separation rate during the year 2007 was 18.11 per cent as compared to 16.61 per cent during the year 2006. Thus, there was about 2.83 per cent increase in overall employment during the year 2007 as compared to 3.53 per cent increase during the year 2006. At all India level, 66.95 per cent factories reported Labour Turnover in their units during the year 2007.
The lowest rate of accession during the year 2007 was recorded in Nagaland at 3.13 per cent followed by Assam (3.45 per cent), Manipur (3.64 per cent) and Jharkhand (4.04 per cent). The highest rate of accession during the year 2007 was observed in A & N Islands at 56.63 per cent followed by Uttranchal (39.25 per cent), Uttar Pradesh (32.55 per cent), Himachal Pradesh (32.05 per cent), Punjab (31.31 per cent) and Bihar (29.60 per cent).
23
The lowest rate of separation during the year was recorded in Assam at 2.08 per cent, followed by Tripura (2.31 per cent), Nagaland (2.34 per cent), Manipur (2.86 per cent), Chhattisgarh (6.15 per cent) and Orissa (6.44 per cent). The highest rate of separation during the year was reported in Bihar at 31.02 per cent, followed by Uttar Pradesh (28.15 per cent), Delhi (28.12 per cent), Punjab (27.22 per cent) and Haryana (26.91 per cent).
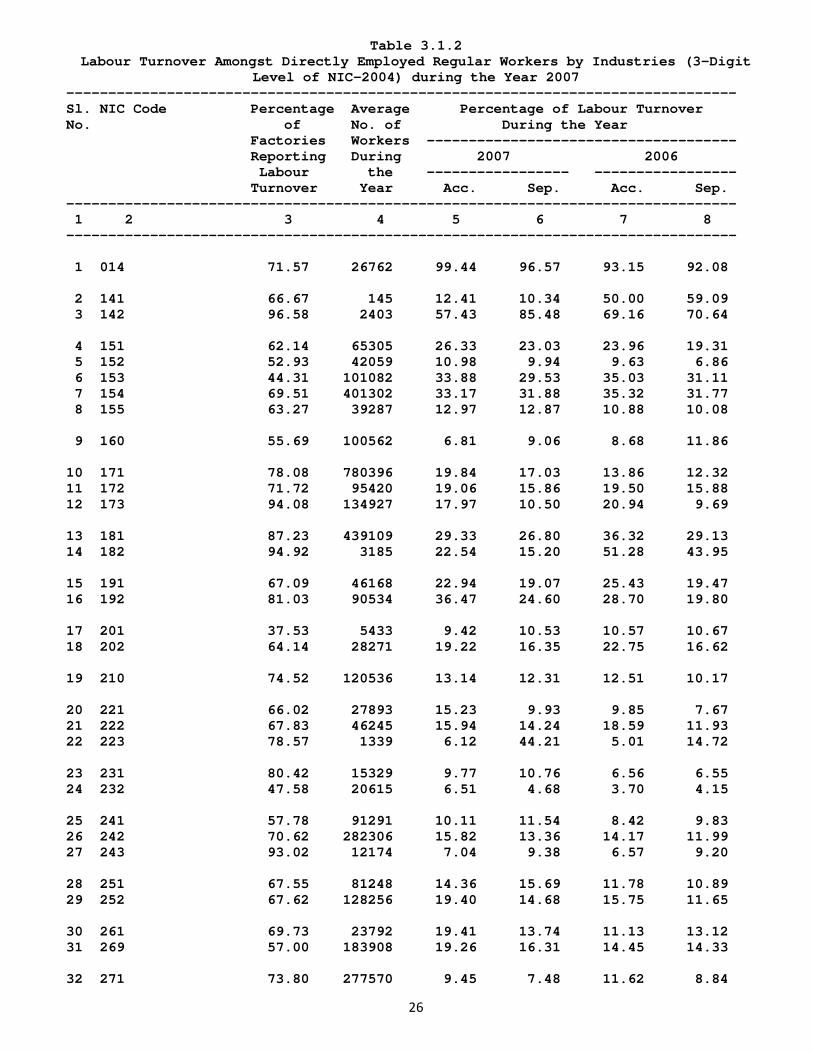
The total Labour Turnover was highest in Andaman & Nicobar Islands (74.30 per cent) and the lowest in Nagaland (5.47 per cent). During the year, 27 States recorded higher accession rates in comparison to separation rates. Similarly, 5 States recorded higher separation rates in comparison to accession rates at the State level. Strong correlation has been recorded between the accession and separation rates. 3.2 Labour Turnover by Industries Industry-wise Labour Turnover among directly employed regular workers during the year 2007 is given in Table 3.1.2. The highest rate of accession was recorded in the industry group ‘014-Agricultural and animal husbandry service activities, except veterinary activities’ (99.44 per cent) followed by industry groups, ‘142-Mining and quarrying, n.e.c.’ (57.43 per cent), ‘341-Manufacture of Motor Vehicles’ (47.96 per cent), ‘351-Building and repair of Ships & Boats’ (39.06 per cent), ‘192-Manufacture of Footwear’ (36.47 per cent) and ‘153-Manufacture of grain mill products, starches and starch products and prepared animal feeds (33.88 per cent). The lowest rate of accession at 3.28 per cent was recorded in the industry group ‘371-Recycling of metal waste and scrap followed by ‘223-reproduction of recorded media’ (6.12 per cent), ‘232-Manufacture of refined petroleum products’(6.51 per cent) ‘160-Manufacture of tobacco products (6.81 per cent), ‘243-Manufactureo of man-made fabrics’ (7.04 per cent) and ‘352-Manufacture of railway and tramway locomotives and rolling stock (8.19 per cent).
On the other hand, the highest rate of separation at 96.57 per cent was recorded in the industry group ‘014-Agricultural and animal husbandry service activities except veterinary activities’. It was followed by industry group ‘142-Mining and quarrying, n.e.c.’ (85.48 per cent). The lowest rate of separation, however, was recorded at 3.88 per cent in industry group, ‘371-Recycling of metal waste and scrap’ followed by ‘232-Manufacture of refined petroleum products’ (4.68 per cent), ‘271-Manufacture of basic iron & steel (7.48 per cent) and ‘314-Manufacture of accumulators, primary cells and primary batteries (8.26 per cent).
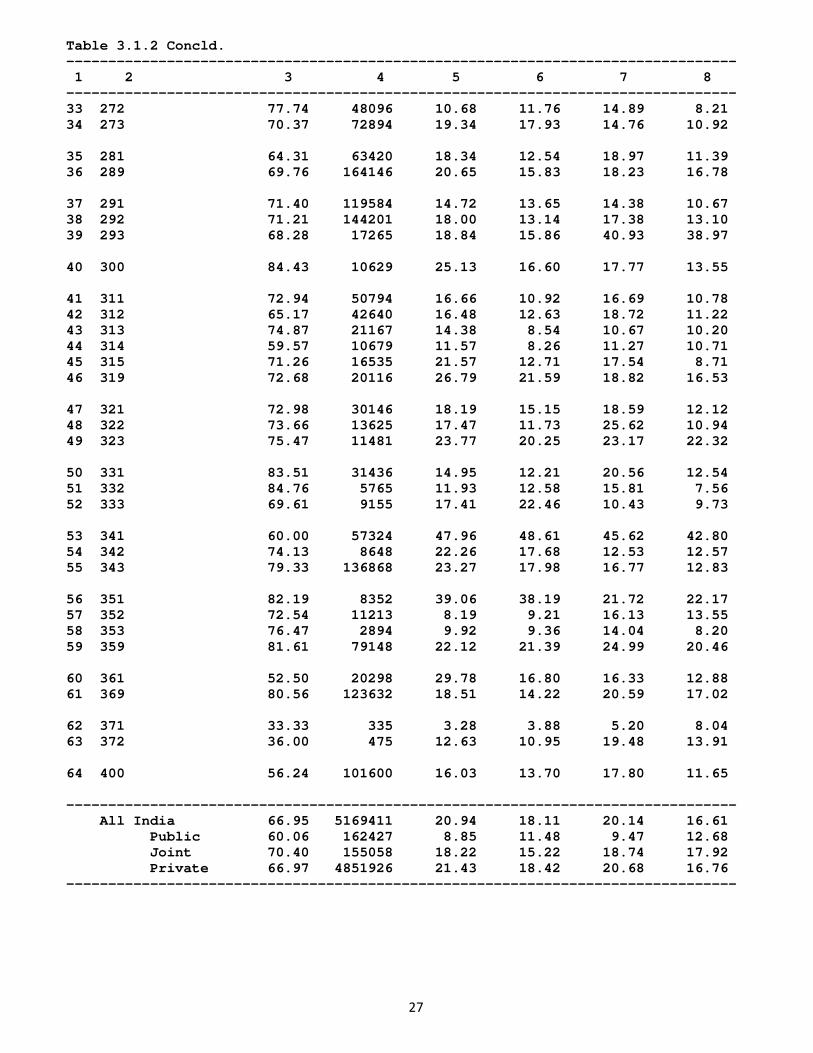
The total labour turnover was highest in industry group ‘014-Agricultural and animal husbandry service activities except veterinary activities’ at 196.01 percent and lowest in industry group ‘371-Recycling of Metal waste and scrap’ (7.16 per cent). During the year 2007, 49 industry groups recorded higher accession rates and 15 industry groups recording higher separation rates at the industry level. 3.3 Labour Turnover in States by Sectors
Table 3.2.1 depicts State-wise and Sector-wise Labour Turnover among directly employed regular workers. It has been observed that at all India level, accession rate was the highest in Private Sector at 21.43 per cent followed by Joint Sector at 18.22 per cent and Public Sector at 8.85 per cent. Separation rate was highest at 18.42 per cent in Private Sector, followed by Joint Sector at 15.22 per cent and Public Sector at 11.48 per cent.
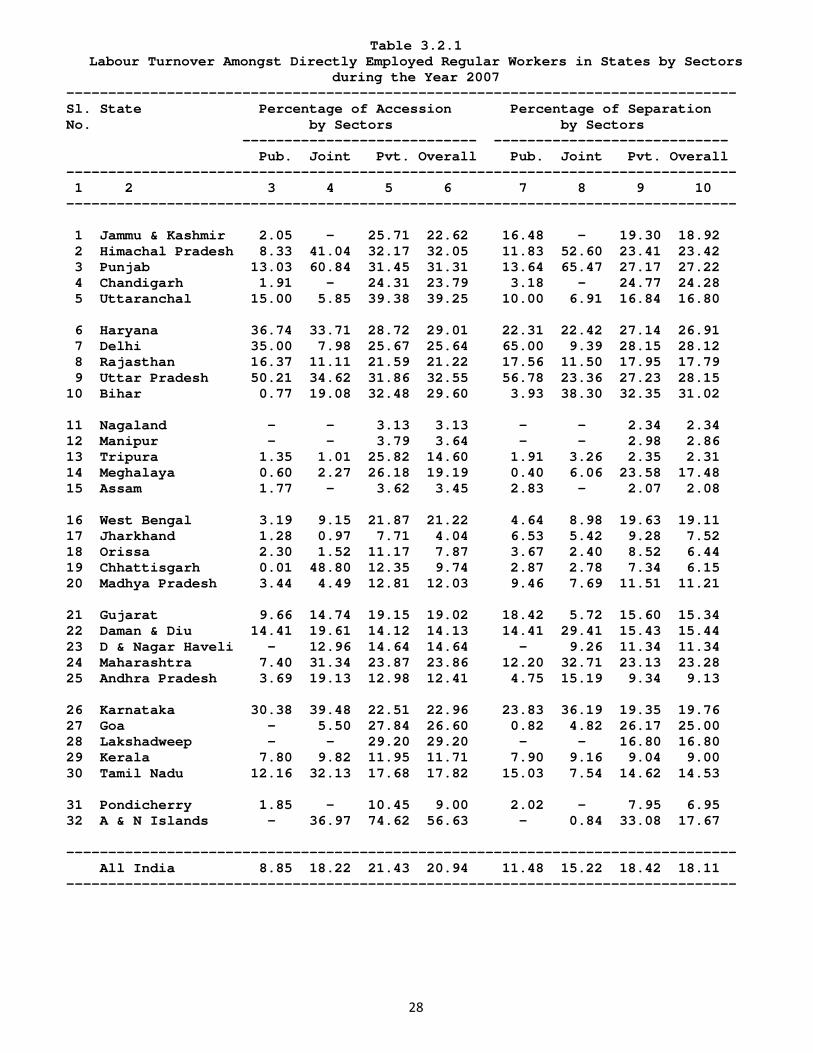
24
The highest rate of accession in Public Sector was recorded in Uttar Pradesh at 50.21 per cent followed by Haryana (36.74 per cent) and lowest in Chhattisgarh at 0.01 per cent. In Joint Sector, the highest rate of accession was reported in Punjab at 60.84 per cent and the lowest in Jharkhand at 0.97 per cent. In Private Sector, Andaman & Nicobar Islands reported the highest rate of accession at 74.62 per cent whereas Nagaland reported the lowest rate of accession at 3.13 per cent.
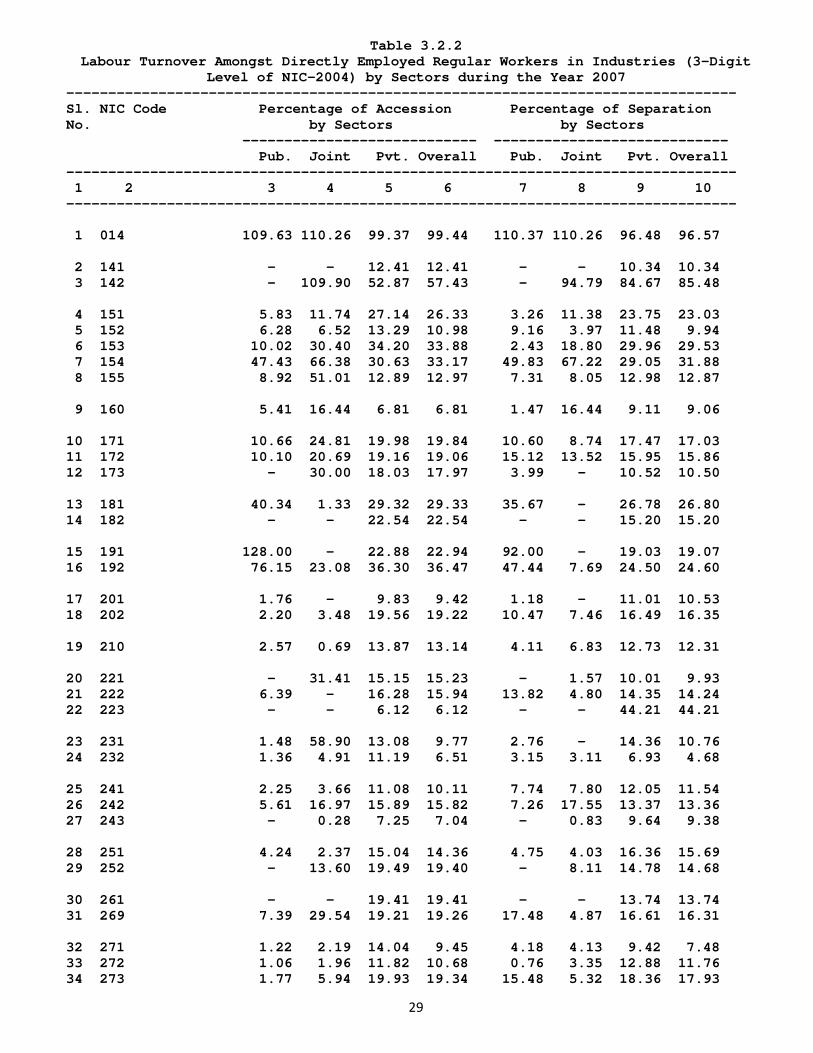
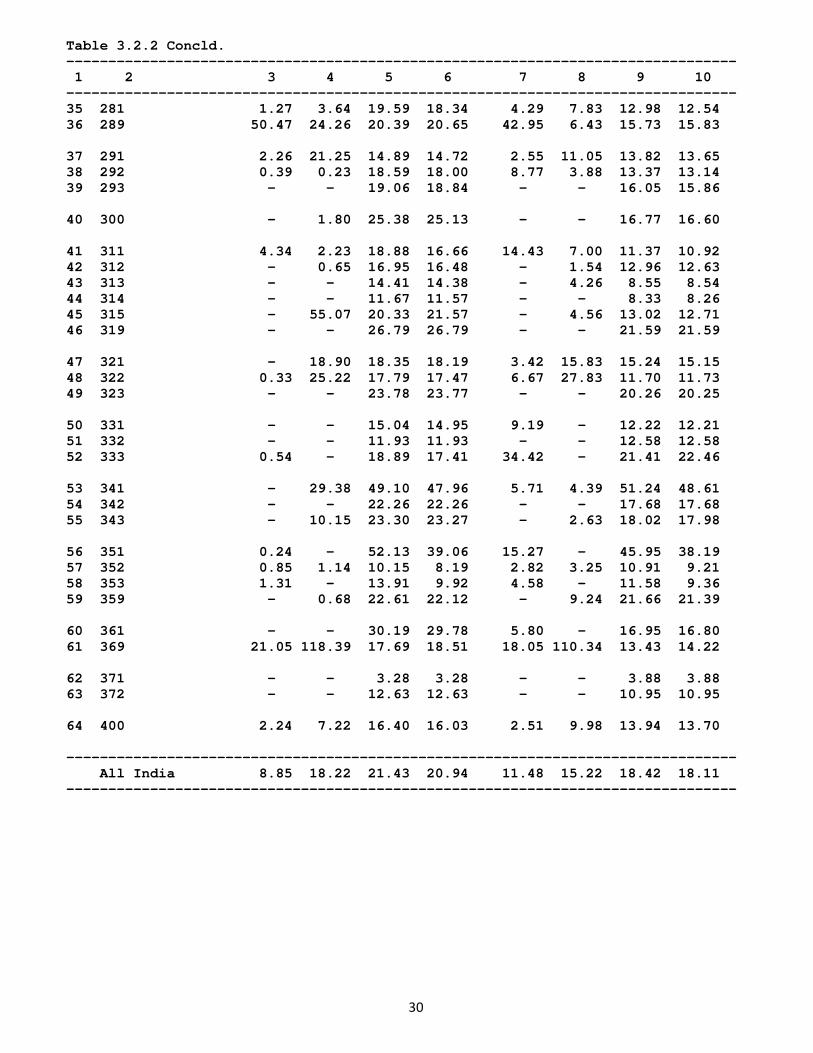
The highest rate of separation in Public Sector was observed in Delhi at 65.00 per cent and was lowest in Meghalaya at 0.40 per cent. In Joint Sector, the highest rate of separation was reported in Punjab at 65.47 per cent and the lowest in Andaman & Nicobar Islands at 0.84 per cent, whereas in Private Sector, the highest rate of separation was reported in Andaman & Nicobar Islands at 33.08 per cent and the lowest in Assam at 2.07 per cent. 3.4 Labour Turnover in Industries by Sectors Industry-wise and Sector-wise Labour Turnover amongst directly employed regular workers is given in Table 3.2.2. It may be seen from the Table that in Public Sector, the highest rate of accession was recorded at 128.00 per cent in the industry group ‘191-Tanning and dressing of leather, manufacture of luggage handbags, saddler & harness’ and the highest rate of separation at 110.37 per cent was observed in ‘014-Agricultural and animal husbandry service activities, except veterinary activities’. The highest rates of both accession and separation in the Joint Sector were reported in the industry group, ‘369-Manufacture of Jewellery and related articles’ at 118.39 per cent and 110.34 per cent respectively. In Private Sector, the highest rate of accession and separation was reported in the industry group ‘014- Agricultural and animal husbandry service activities, except veterinary activities’’ at 99.37 and 96.48 per cent respectively.
Sector-wise lowest rate of accession was recorded at 0.24 per cent in the industry group ‘351-Building and repair of Ships & Boats’ in Public Sector, 0.23 per cent in industry group ‘292-Manufacture of Special Purpose Machinery’ in Joint Sector and 3.28 per cent in industry group ‘371-Recycling of metal waste and scrap’ in Private Sector. In Public Sector, the industry group ‘272-Manufacture of basic precious and non-ferrous metals’ recorded the lowest separation rate of 0.76 per cent. In Joint Sector, the separation rate was lowest at 0.83 per cent in the industry ‘243-Manufacture of man made fibers’, whereas in Private Sector, it was lowest at 3.88 per cent in industry group ‘371-Recycling of metal waste and scrap’.
-0-0-0-
25
CHAPTER-III LABOUR TURNOVER Table 3.1.1
Labour Turnover Amongst Directly Employed Regular Workers by States during the Year 2007
-------------------------------------------------------------------------------- Sl. State Percentage Average Percentage of Labour Turnover No. of No. of During the Year Factories Workers ------------------------------------- Reporting During 2007 2006 Labour the ----------------- ----------------- Turnover Year Acc. Sep. Acc. Sep. -------------------------------------------------------------------------------- 1 2 3 4 5 6 7 8 -------------------------------------------------------------------------------- 1 Jammu & Kashmir 81.66 18440 22.62 18.92 24.31 24.07 2 Himachal Pradesh 94.32 58651 32.05 23.42 45.80 30.19 3 Punjab 89.67 338484 31.31 27.22 34.68 30.37 4 Chandigarh 89.32 6813 23.79 24.28 18.30 14.98 5 Uttaranchal 92.10 53452 39.25 16.80 40.23 20.20 6 Haryana 84.50 199695 29.01 26.91 31.87 28.92 7 Delhi 81.17 92140 25.64 28.12 28.52 28.18 8 Rajasthan 77.86 187896 21.22 17.79 17.15 15.44 9 Uttar Pradesh 71.81 318247 32.55 28.15 31.44 28.05 10 Bihar 58.92 21099 29.60 31.02 21.66 23.84 11 Nagaland 30.95 768 3.13 2.34 3.53 5.81 12 Manipur 30.43 770 3.64 2.86 9.39 5.75 13 Tripura 44.85 11751 14.60 2.31 2.86 1.55 14 Meghalaya 77.33 2288 19.19 17.48 6.01 7.98 15 Assam 24.03 31380 3.45 2.08 5.05 3.47 16 West Bengal 44.47 320377 21.22 19.11 9.07 9.36 17 Jharkhand 63.02 100764 4.04 7.52 4.09 5.89 18 Orissa 59.07 73236 7.87 6.44 6.16 5.59 19 Chhattisgarh 46.72 57076 9.74 6.15 9.95 7.32 20 Madhya Pradesh 70.83 127039 12.03 11.21 13.94 12.84 21 Gujarat 73.00 514779 19.02 15.34 19.64 14.84 22 Daman & Diu 83.92 50198 14.13 15.44 16.17 9.90 23 D & Nagar Haveli 90.56 38280 14.64 11.34 10.18 8.70 24 Maharashtra 66.72 646711 23.86 23.28 23.20 20.59 25 Andhra Pradesh 33.88 287593 12.41 9.13 13.26 9.97 26 Karnataka 68.88 473005 22.96 19.76 26.49 20.06 27 Goa 85.01 21179 26.60 25.00 30.66 23.49 28 Lakshadweep 100.00 250 29.20 16.80 - - 29 Kerala 56.79 232924 11.71 9.00 13.05 10.19 30 Tamil Nadu 69.21 859601 17.82 14.53 15.91 11.42 31 Pondicherry 53.89 24276 9.00 6.95 9.63 9.96 32 A & N Islands 87.50 249 56.63 17.67 15.68 7.03 -------------------------------------------------------------------------------- All India 66.95 5169411 20.94 18.11 20.14 16.61 Public 60.06 162427 8.85 11.48 9.47 12.68 Joint 70.40 155058 18.22 15.22 18.74 17.92 Private 66.97 4851926 21.43 18.42 20.68 16.76 -------------------------------------------------------------------------------- Note: Acc. = Accession, Sep. = Separation.
26
Table 3.1.2 Labour Turnover Amongst Directly Employed Regular Workers by Industries (3-Digit
Level of NIC-2004) during the Year 2007 -------------------------------------------------------------------------------- Sl. NIC Code Percentage Average Percentage of Labour Turnover No. of No. of During the Year Factories Workers ------------------------------------- Reporting During 2007 2006 Labour the ----------------- ----------------- Turnover Year Acc. Sep. Acc. Sep. -------------------------------------------------------------------------------- 1 2 3 4 5 6 7 8 -------------------------------------------------------------------------------- 1 014 71.57 26762 99.44 96.57 93.15 92.08 2 141 66.67 145 12.41 10.34 50.00 59.09 3 142 96.58 2403 57.43 85.48 69.16 70.64 4 151 62.14 65305 26.33 23.03 23.96 19.31 5 152 52.93 42059 10.98 9.94 9.63 6.86 6 153 44.31 101082 33.88 29.53 35.03 31.11 7 154 69.51 401302 33.17 31.88 35.32 31.77 8 155 63.27 39287 12.97 12.87 10.88 10.08 9 160 55.69 100562 6.81 9.06 8.68 11.86 10 171 78.08 780396 19.84 17.03 13.86 12.32 11 172 71.72 95420 19.06 15.86 19.50 15.88 12 173 94.08 134927 17.97 10.50 20.94 9.69 13 181 87.23 439109 29.33 26.80 36.32 29.13 14 182 94.92 3185 22.54 15.20 51.28 43.95 15 191 67.09 46168 22.94 19.07 25.43 19.47 16 192 81.03 90534 36.47 24.60 28.70 19.80 17 201 37.53 5433 9.42 10.53 10.57 10.67 18 202 64.14 28271 19.22 16.35 22.75 16.62 19 210 74.52 120536 13.14 12.31 12.51 10.17 20 221 66.02 27893 15.23 9.93 9.85 7.67 21 222 67.83 46245 15.94 14.24 18.59 11.93 22 223 78.57 1339 6.12 44.21 5.01 14.72 23 231 80.42 15329 9.77 10.76 6.56 6.55 24 232 47.58 20615 6.51 4.68 3.70 4.15 25 241 57.78 91291 10.11 11.54 8.42 9.83 26 242 70.62 282306 15.82 13.36 14.17 11.99 27 243 93.02 12174 7.04 9.38 6.57 9.20 28 251 67.55 81248 14.36 15.69 11.78 10.89 29 252 67.62 128256 19.40 14.68 15.75 11.65 30 261 69.73 23792 19.41 13.74 11.13 13.12 31 269 57.00 183908 19.26 16.31 14.45 14.33 32 271 73.80 277570 9.45 7.48 11.62 8.84
27
Table 3.1.2 Concld. -------------------------------------------------------------------------------- 1 2 3 4 5 6 7 8 -------------------------------------------------------------------------------- 33 272 77.74 48096 10.68 11.76 14.89 8.21 34 273 70.37 72894 19.34 17.93 14.76 10.92 35 281 64.31 63420 18.34 12.54 18.97 11.39 36 289 69.76 164146 20.65 15.83 18.23 16.78 37 291 71.40 119584 14.72 13.65 14.38 10.67 38 292 71.21 144201 18.00 13.14 17.38 13.10 39 293 68.28 17265 18.84 15.86 40.93 38.97 40 300 84.43 10629 25.13 16.60 17.77 13.55 41 311 72.94 50794 16.66 10.92 16.69 10.78 42 312 65.17 42640 16.48 12.63 18.72 11.22 43 313 74.87 21167 14.38 8.54 10.67 10.20 44 314 59.57 10679 11.57 8.26 11.27 10.71 45 315 71.26 16535 21.57 12.71 17.54 8.71 46 319 72.68 20116 26.79 21.59 18.82 16.53 47 321 72.98 30146 18.19 15.15 18.59 12.12 48 322 73.66 13625 17.47 11.73 25.62 10.94 49 323 75.47 11481 23.77 20.25 23.17 22.32 50 331 83.51 31436 14.95 12.21 20.56 12.54 51 332 84.76 5765 11.93 12.58 15.81 7.56 52 333 69.61 9155 17.41 22.46 10.43 9.73 53 341 60.00 57324 47.96 48.61 45.62 42.80 54 342 74.13 8648 22.26 17.68 12.53 12.57 55 343 79.33 136868 23.27 17.98 16.77 12.83 56 351 82.19 8352 39.06 38.19 21.72 22.17 57 352 72.54 11213 8.19 9.21 16.13 13.55 58 353 76.47 2894 9.92 9.36 14.04 8.20 59 359 81.61 79148 22.12 21.39 24.99 20.46 60 361 52.50 20298 29.78 16.80 16.33 12.88 61 369 80.56 123632 18.51 14.22 20.59 17.02 62 371 33.33 335 3.28 3.88 5.20 8.04 63 372 36.00 475 12.63 10.95 19.48 13.91 64 400 56.24 101600 16.03 13.70 17.80 11.65 -------------------------------------------------------------------------------- All India 66.95 5169411 20.94 18.11 20.14 16.61 Public 60.06 162427 8.85 11.48 9.47 12.68 Joint 70.40 155058 18.22 15.22 18.74 17.92 Private 66.97 4851926 21.43 18.42 20.68 16.76 --------------------------------------------------------------------------------
28
Table 3.2.1 Labour Turnover Amongst Directly Employed Regular Workers in States by Sectors
during the Year 2007 -------------------------------------------------------------------------------- Sl. State Percentage of Accession Percentage of Separation No. by Sectors by Sectors ---------------------------- ---------------------------- Pub. Joint Pvt. Overall Pub. Joint Pvt. Overall -------------------------------------------------------------------------------- 1 2 3 4 5 6 7 8 9 10 -------------------------------------------------------------------------------- 1 Jammu & Kashmir 2.05 - 25.71 22.62 16.48 - 19.30 18.92 2 Himachal Pradesh 8.33 41.04 32.17 32.05 11.83 52.60 23.41 23.42 3 Punjab 13.03 60.84 31.45 31.31 13.64 65.47 27.17 27.22 4 Chandigarh 1.91 - 24.31 23.79 3.18 - 24.77 24.28 5 Uttaranchal 15.00 5.85 39.38 39.25 10.00 6.91 16.84 16.80 6 Haryana 36.74 33.71 28.72 29.01 22.31 22.42 27.14 26.91 7 Delhi 35.00 7.98 25.67 25.64 65.00 9.39 28.15 28.12 8 Rajasthan 16.37 11.11 21.59 21.22 17.56 11.50 17.95 17.79 9 Uttar Pradesh 50.21 34.62 31.86 32.55 56.78 23.36 27.23 28.15 10 Bihar 0.77 19.08 32.48 29.60 3.93 38.30 32.35 31.02 11 Nagaland - - 3.13 3.13 - - 2.34 2.34 12 Manipur - - 3.79 3.64 - - 2.98 2.86 13 Tripura 1.35 1.01 25.82 14.60 1.91 3.26 2.35 2.31 14 Meghalaya 0.60 2.27 26.18 19.19 0.40 6.06 23.58 17.48 15 Assam 1.77 - 3.62 3.45 2.83 - 2.07 2.08 16 West Bengal 3.19 9.15 21.87 21.22 4.64 8.98 19.63 19.11 17 Jharkhand 1.28 0.97 7.71 4.04 6.53 5.42 9.28 7.52 18 Orissa 2.30 1.52 11.17 7.87 3.67 2.40 8.52 6.44 19 Chhattisgarh 0.01 48.80 12.35 9.74 2.87 2.78 7.34 6.15 20 Madhya Pradesh 3.44 4.49 12.81 12.03 9.46 7.69 11.51 11.21 21 Gujarat 9.66 14.74 19.15 19.02 18.42 5.72 15.60 15.34 22 Daman & Diu 14.41 19.61 14.12 14.13 14.41 29.41 15.43 15.44 23 D & Nagar Haveli - 12.96 14.64 14.64 - 9.26 11.34 11.34 24 Maharashtra 7.40 31.34 23.87 23.86 12.20 32.71 23.13 23.28 25 Andhra Pradesh 3.69 19.13 12.98 12.41 4.75 15.19 9.34 9.13 26 Karnataka 30.38 39.48 22.51 22.96 23.83 36.19 19.35 19.76 27 Goa - 5.50 27.84 26.60 0.82 4.82 26.17 25.00 28 Lakshadweep - - 29.20 29.20 - - 16.80 16.80 29 Kerala 7.80 9.82 11.95 11.71 7.90 9.16 9.04 9.00 30 Tamil Nadu 12.16 32.13 17.68 17.82 15.03 7.54 14.62 14.53 31 Pondicherry 1.85 - 10.45 9.00 2.02 - 7.95 6.95 32 A & N Islands - 36.97 74.62 56.63 - 0.84 33.08 17.67 -------------------------------------------------------------------------------- All India 8.85 18.22 21.43 20.94 11.48 15.22 18.42 18.11 --------------------------------------------------------------------------------
29
Table 3.2.2 Labour Turnover Amongst Directly Employed Regular Workers in Industries (3-Digit
Level of NIC-2004) by Sectors during the Year 2007 -------------------------------------------------------------------------------- Sl. NIC Code Percentage of Accession Percentage of Separation No. by Sectors by Sectors ---------------------------- ---------------------------- Pub. Joint Pvt. Overall Pub. Joint Pvt. Overall -------------------------------------------------------------------------------- 1 2 3 4 5 6 7 8 9 10 -------------------------------------------------------------------------------- 1 014 109.63 110.26 99.37 99.44 110.37 110.26 96.48 96.57 2 141 - - 12.41 12.41 - - 10.34 10.34 3 142 - 109.90 52.87 57.43 - 94.79 84.67 85.48 4 151 5.83 11.74 27.14 26.33 3.26 11.38 23.75 23.03 5 152 6.28 6.52 13.29 10.98 9.16 3.97 11.48 9.94 6 153 10.02 30.40 34.20 33.88 2.43 18.80 29.96 29.53 7 154 47.43 66.38 30.63 33.17 49.83 67.22 29.05 31.88 8 155 8.92 51.01 12.89 12.97 7.31 8.05 12.98 12.87 9 160 5.41 16.44 6.81 6.81 1.47 16.44 9.11 9.06 10 171 10.66 24.81 19.98 19.84 10.60 8.74 17.47 17.03 11 172 10.10 20.69 19.16 19.06 15.12 13.52 15.95 15.86 12 173 - 30.00 18.03 17.97 3.99 - 10.52 10.50 13 181 40.34 1.33 29.32 29.33 35.67 - 26.78 26.80 14 182 - - 22.54 22.54 - - 15.20 15.20 15 191 128.00 - 22.88 22.94 92.00 - 19.03 19.07 16 192 76.15 23.08 36.30 36.47 47.44 7.69 24.50 24.60 17 201 1.76 - 9.83 9.42 1.18 - 11.01 10.53 18 202 2.20 3.48 19.56 19.22 10.47 7.46 16.49 16.35 19 210 2.57 0.69 13.87 13.14 4.11 6.83 12.73 12.31 20 221 - 31.41 15.15 15.23 - 1.57 10.01 9.93 21 222 6.39 - 16.28 15.94 13.82 4.80 14.35 14.24 22 223 - - 6.12 6.12 - - 44.21 44.21 23 231 1.48 58.90 13.08 9.77 2.76 - 14.36 10.76 24 232 1.36 4.91 11.19 6.51 3.15 3.11 6.93 4.68 25 241 2.25 3.66 11.08 10.11 7.74 7.80 12.05 11.54 26 242 5.61 16.97 15.89 15.82 7.26 17.55 13.37 13.36 27 243 - 0.28 7.25 7.04 - 0.83 9.64 9.38 28 251 4.24 2.37 15.04 14.36 4.75 4.03 16.36 15.69 29 252 - 13.60 19.49 19.40 - 8.11 14.78 14.68 30 261 - - 19.41 19.41 - - 13.74 13.74 31 269 7.39 29.54 19.21 19.26 17.48 4.87 16.61 16.31 32 271 1.22 2.19 14.04 9.45 4.18 4.13 9.42 7.48 33 272 1.06 1.96 11.82 10.68 0.76 3.35 12.88 11.76 34 273 1.77 5.94 19.93 19.34 15.48 5.32 18.36 17.93
30
Table 3.2.2 Concld. -------------------------------------------------------------------------------- 1 2 3 4 5 6 7 8 9 10 -------------------------------------------------------------------------------- 35 281 1.27 3.64 19.59 18.34 4.29 7.83 12.98 12.54 36 289 50.47 24.26 20.39 20.65 42.95 6.43 15.73 15.83 37 291 2.26 21.25 14.89 14.72 2.55 11.05 13.82 13.65 38 292 0.39 0.23 18.59 18.00 8.77 3.88 13.37 13.14 39 293 - - 19.06 18.84 - - 16.05 15.86 40 300 - 1.80 25.38 25.13 - - 16.77 16.60 41 311 4.34 2.23 18.88 16.66 14.43 7.00 11.37 10.92 42 312 - 0.65 16.95 16.48 - 1.54 12.96 12.63 43 313 - - 14.41 14.38 - 4.26 8.55 8.54 44 314 - - 11.67 11.57 - - 8.33 8.26 45 315 - 55.07 20.33 21.57 - 4.56 13.02 12.71 46 319 - - 26.79 26.79 - - 21.59 21.59 47 321 - 18.90 18.35 18.19 3.42 15.83 15.24 15.15 48 322 0.33 25.22 17.79 17.47 6.67 27.83 11.70 11.73 49 323 - - 23.78 23.77 - - 20.26 20.25 50 331 - - 15.04 14.95 9.19 - 12.22 12.21 51 332 - - 11.93 11.93 - - 12.58 12.58 52 333 0.54 - 18.89 17.41 34.42 - 21.41 22.46 53 341 - 29.38 49.10 47.96 5.71 4.39 51.24 48.61 54 342 - - 22.26 22.26 - - 17.68 17.68 55 343 - 10.15 23.30 23.27 - 2.63 18.02 17.98 56 351 0.24 - 52.13 39.06 15.27 - 45.95 38.19 57 352 0.85 1.14 10.15 8.19 2.82 3.25 10.91 9.21 58 353 1.31 - 13.91 9.92 4.58 - 11.58 9.36 59 359 - 0.68 22.61 22.12 - 9.24 21.66 21.39 60 361 - - 30.19 29.78 5.80 - 16.95 16.80 61 369 21.05 118.39 17.69 18.51 18.05 110.34 13.43 14.22 62 371 - - 3.28 3.28 - - 3.88 3.88 63 372 - - 12.63 12.63 - - 10.95 10.95 64 400 2.24 7.22 16.40 16.03 2.51 9.98 13.94 13.70 -------------------------------------------------------------------------------- All India 8.85 18.22 21.43 20.94 11.48 15.22 18.42 18.11 --------------------------------------------------------------------------------
31
CHAPTER-IV
EMPLOYMENT
Data on the salient features of labour force deployed in the organised manufacturing industries during the year 2007-08 has been presented in this chapter. These include presentation of employment by industries, States, category of workers, sex and age, establishment size, employment through contractors and mandays worked in the Public sector, Joint sector and Private sector.
4.1 Total Work Force The State-wise and industry-wise break-up of employment during the year 2007-08 has been presented in the Tables 4.1.1 and 4.1.2, respectively. Total employment includes workers employed directly by the employers in addition to those engaged through contractors. The average daily employment of the workers has been worked out as the ratio of mandays worked to the number of working days at the unit level. During the year 2007-08, the total labour force in the manufacturing establishments has been estimated to be about 8.19 million, of which the proportion of directly employed female workers was 13.66 per cent, while that of the children stood negligible. 4.2 Employment by States It may be seen from the Table 4.1.1 that five States, viz. Tamil Nadu, Maharashtra, Andhra Pradesh, Gujarat and Uttar Pradesh taken together accounted for about 54.69 per cent of the total employment during the year 2007-08. Tamil Nadu recorded the highest employment share of 15.66 per cent followed by Maharashtra (11.63 per cent), Andhra Pradesh (10.52 per cent), Gujarat (9.73 per cent) and Uttar Pradesh (7.20 per cent) respectively. On the other hand, proportion of workers in three States/Union Territories, viz. Andaman & Nicobar Islands, Manipur and Nagaland and Meghalaya taken together was merely 0.12 per cent.
In terms of sectors, majority of workers i.e. 97.77 per cent were employed in Private Sector followed by Joint Sector with 1.61 per cent and Public Sector with 0.61 per cent respectively. At the State level, Private Sector was the major source of employment of workers in all the States. The contribution of the Private Sector in employment of workers was highest at 100.00 per cent in Chandigarh, Manipur, Tripura and Daman & Diu followed by Puducherry (99.76 per cent), Delhi (99.71 per cent), Nagaland (99.60 per cent) and Maharashtra (99.45 per cent) respectively, whereas it was lowest at 81.31 per cent in Meghalaya. The contribution of Private Sector to the total employment was more than 90 per cent in 30 States/Union Territories. The contribution of the Public Sector in employment of workers was highest at 10.98 per cent in Meghalaya state followed by Assam (3.88 per cent) whereas it was Nil in seven states viz. Chandigarh, Haryana, Delhi, Nagaland, Manipur, Tripura, Daman Diu and A & N Islands. The share of the Joint Sector in total employment of workers was recorded highest at 8.72 per cent in Goa followed by Meghalaya (7.72 per cent)and Orissa 6.92 percent, whereas it was less than 1 per cent in 13 states including 6 states viz. Chandigarh, Manipur, Tripura, Daman & Diu, Dadra & Nagar Haveli and Pondicherry showing nil.
32
The maximum proportion of directly employed women workers was reported at 57.21 per cent in Kerala followed by Tamil Nadu (36.28 per cent), Karnataka (35.30 per cent) and Manipur (29.89 per cent). Interestingly, Kerala is the only State, where the share of the women workforce is significantly higher than that of their male counterparts. Out of 32 States/Union Territories, only four States/Union Territories reported percentage of women workers more than that at the All India level (13.66 per cent).
4.3 Employment by Industries
On perusal of Table 4.1.2, it is observed that out of 64 industry groups, 10 industry groups taken together accounted for more than 56.73 per cent of the employment in the Manufacturing industries. The maximum contribution to the total employment was 11.62 per cent in the industry group ‘171–Spinning, weaving and finishing of textiles’ followed by industry groups ‘154–Manufacture of other food products’ (7.26 per cent), ‘181-Manufacture of wearing apparel, except fur apparel’ (6.40 per cent), ‘269-Manufacture of non- metallic mineral products’ (6.25 per cent), ‘242–Manufacture of other chemical products’ (5.58 per cent), ‘271-Manufacture of basic iron and steel’ (5.31 per cent), ‘160-Manufacture of tobacco products, (4.82 per cent) ‘153-Manufacture of grain mill products, starches and starchproducts,and prepared animal feeds’ (3.30 percent), ‘343-Manufacture of parts and accessories for motor vehicles and their engines’ (3.16 percent)and ‘289-Manufacture of other fabricated metal products & metal working service activities’. Four industry groups, viz. ‘141-Quariying of stone, sand and clay’, ‘223-Reproduction of recorded media’, ‘371-Recycling of metal waste and scrap’ and ‘372-Recycling of non-metal waste and scrap’ together contributed a meagre 0.05 per cent employment in the manufacturing establishments.
The maximum proportion of directly employed women workers was reported
at 49.07 per cent in industry group ‘181-Manufacture of wearing apparel, except fur apparel’. A significant contribution in employment of women workers was also seen in industry groups ‘333-Manufacture of watches and clocks’ (41.48 per cent). ‘154–Manufacture of other food products’ (35.61 per cent) and ‘141-Quariying of stone, Manufacture of other food products’ (35.23 per cent).
Out of a total of 64 industry groups, Private Sector made a significant contribution by providing more than 90 per cent employment opportunities to workers in 59 industry groups. Of these, it was cent per cent in 10 industry groups, viz. ‘141-Quariying of stone, sand and clay’, 182-Dressing and dyeing of fur; manufacture of articles of fur’, ‘191- Tanning and dressing of leather, manufacturing of luggage, handbags, saddlery and harness’, ‘223-Reproduction of recorded media’, ‘243- Manufacture of man-made fibres’, ‘261-Manufacture of glass and glass products, ‘314-Manufacture of accumulators, primary cells and primary batteries’, ‘332-Manufacture of optical instruments and photographic equipment’,‘ 342-Manufacture of bodies(coach work) for motor vehicles; manufacture of trailers and semi-trailers’, and ‘372-Recycling of non-metal waste and scrap’. Contribution of Private Sector in providing employment was more than 99 per cent in 31 industry groups. The lowest contribution of the Private Sector in providing employment of workers was reported at 61.48 per cent in industry group ‘371-Recycling of metal waste and scrap’.
33
The contribution of Public Sector in employment generation was highest at 25.58 per cent in industry group ‘353-Manufacture of aircraft and spacecraft’, ‘333-Manufacture of watches and clocks’ (7.36 percent),232’-Manufacture of refined petroleum products,(6.57.percent), ‘352-Manufacture of railway and tramway locomotives and rolling stock’ (6.31 percent) cent), whereas it was nil in 23 industry groups.
The contribution of Joint Sector in employment generation among industries was highest at 38.52 per cent in industry group ‘371-recycling of metal waste and scrap’, followed by 20.40 per cent in the industry group ‘142-Minning and quarrying n.e.c and 19.17 percent in the industry group’341’-Manufacture of motor vehicle, whereas it was nil in 15 industry groups. 4.4 Employment of Contract Workers by States
Sector-wise employment of contract workers in different States is given in Table 4.2.1. It is observed that at all India level, about 30.96 per cent of the total workers were employed through contractors. The practice of employing workers through contractors was more prevalent in the Private Sector, where 30.83 per cent of the workers were employed through contractors. The percentage of contract workers was 39.85 per cent and 28.68 per cent in Joint and Public Sectors, respectively.
Among States, out of the total work force in the respective State/Union Territories, Tripura employed highest percentage of contract workers at 83.22 percent, followed by Nagaland (62.63 percent), Bihar (60.47 per cent) and Andhra Pradesh (52.16 percent). The lowest percentage of contract workers was employed in Delhi (5.78 percent) followed by Kerala (13.01 per cent), Tamil Nadu (15.19 per cent) and Karnataka (16.54 per cent).
It is further observed that out of total contract workers, 97.36 per cent were employed in the Private Sector alone. Joint Sector and Public Sector employed 2.08 per cent and 0.57 per cent of the contract workers, respectively. More than 97.36 per cent of the contract workers were employed in Private Sector in all the States/Union Territories. 4.5 Employment of Contract Workers by Industries
Industry-wise employment of contract workers is depicted in Table 4.2.2. The proportion of contract workers to total workers in respective industry groups was maximum at 72.71 per cent in the industry group ‘372-Recycling of non-metal waste and scrap’ followed by industry groups ‘,‘160-Manufacture of tobacco products’(71.95 Percent),’232’-Manufacture of refined petroleum products (64.75Percent),. The minimum proportion of contract workers was reported at 9.09 per cent in industry group ‘332-Manufacture of optical instruments and photographic equipments.
4.6 Mandays Worked by Sectors, Industries and States State-wise and industry-wise data on total number of mandays worked during the year 2007-08 by sectors and category of workers are presented in Tables 4.3.1 and 4.3.2 respectively. The mandays worked have been obtained by summing up the attendance of all workers working in each shift on all working days for both manufacturing and non-manufacturing working days.
All the workers together were reported to have worked a total of 2477.47 million mandays during the year 2007-08. At All India level, mandays worked in the Private Sector accounted for 97.60 per cent of the total
34
mandays worked by workers. In Joint Sector this proportion was 1.74 per cent whereas it was 0.66 per cent in Public Sector.
Among States, Tamil Nadu accounted for the highest share (15.43 per cent) of total mandays worked by workers in manufacturing industries followed by Maharashtra (12.10 per cent), Andhra Pradesh (10.51 per cent) and Gujarat (9.94 per cent).Chandigarh, Nagaland, Manipur, Meghalaya and Andaman & Nicobar Islands together reported about 0.21 per cent mandays worked to total mandays worked by workers in the manufacturing industries. Among Industries, the industry group ‘171-Spinning, weaving and finishing of textiles’ accounted for the highest share of 21.33 per cent mandays worked to the total mandays worked in the manufacturing industries. Other major contributing industry groups in mandays worked were ‘154-Manufacture of other food products’ (6.67 per cent) and ‘181-Manufacture of wearing apparel, except fur apparel’ (6.43 per cent). Six industry groups, viz. ‘141-Quariying of stone, sand and clay’ ‘182-Dressing and dyeing of fur; manufacture of articles of fur’, ‘223-Reproduction of recorded media’, ‘353-Manufacture of aircraft and spacecraft’, ‘371-Recycling of metal waste and scrap’ and ‘372-Recycling of non-metal waste and scrap’ accounted for about 0.14 per cent of the total mandays worked in the Manufacturing industries. 4.7 Mandays Worked by Contract Workers
Table 4.4.1 and 4.4.2 give details of mandays worked by contract workers by States and industries respectively. The contract workers worked a total of 758.29 million mandays out of 2477.47 mandays worked by all workers. 4.8 Mandays Paid For
Details of mandays paid for by State and industries are furnished in Table 4.5.1 and 4.5.2, respectively. The employers paid for about 2730.90 million mandays as against 2477.47 mandays actually worked by workers in the manufacturing industries. 4.9 Factories employing contract workers
Details of number of reporting factories, factories employing contract and child workers, etc., by States and industries are furnished in Tables 4.6.1 and 4.6.2 respectively. A total of about 1.46 lakh units were reported under the manufacturing industries. Out of these, 26.25 per cent factories were reported to have employed contract workers. The percentage of factories employing contract workers was reported at 33.89 per cent in Public Sector, 49.64 per cent in Joint Sector and 26.12 per cent in Private Sector. Only 6 factories of Assam reported to have employed child workers in their establishments. This accounts for negligible percentage.
At the State level, 62.94 per cent factories in Tripura, 55.77 per cent
in Nagaland, 50.98 per cent factories in Bihar and 40.69 per cent factories in Goa reported to have employed contract workers. Under Joint Sector, 80.95 factories in orrissa,80.77 in Chhattisgarh, 73.68 percent in Rajasthan and 73.33 percent in West Bengal reported to have employed the contract workers. Under Public Sector, cent per cent factories in Punjab, Chhattisgarh, Gujarat, and Dadra Nagar Haveli, 80.00 per cent factories in Uttaranchal and 75.00 per cent in Maharashtra reported to have employed the contract workers. Under Private Sector, 62.94 per cent factories in Tripura, 56.31 per cent factories in Nagaland and 51.31 per cent factories in Bihar reported to have employed the contract workers.
35
At the industry level, under Public Sector, cent per cent factories in Eight industry groups, viz.‘142- Mining and quarrying n.e.c.’192’-Manufacture of footwear,’251’-Manufacture of rubber products,’289- Manufacture of other fabricated metal products & metal working service activities’, ‘272- Manufacture of basic precious and non precious metals,’323’-Manufacturer of television and radio receivers, sound or video recording apparatus, and associated goods’‘331-Manufacture of medical appliances and instruments and appliances for measuring, checking, testing, navigating and other purposes except industrial process control equipment, and ‘351’-Building and repair of ships & Boats’ reported to have employed the contract workers. Under Joint Sector, the employment of contract workers was reported in cent per cent factories in Ten industry groups, viz. ‘142-Mining and Quarrying n.e.c.’, ‘155’- Manufacture of Beverages, ‘160-Manufacture of tobacco products,‘181- Manufacture of wearing apparel ,except fur apparel, ‘231-Manufacture of coke oven products,273’-Casting of metals,’293’-manufacture of domestic appliances n.e.c.,’341’-Manufacture of motor vehicles,’353’-Manufacture of aircraft and spacecraft,’369’-Manufacturing n.e.c. Under Private Sector, 69.09 per cent factories in industry group‘142-Mining and Quarrying n.e.c.’ followed by 43.19 per cent factories in‘‘014-Agricultural and animal husbandry service activities except veterinary activities and 42.94 percent in industry group ‘300’-Manufacture of office ,accounting and computing machinery.
-0-0-0-
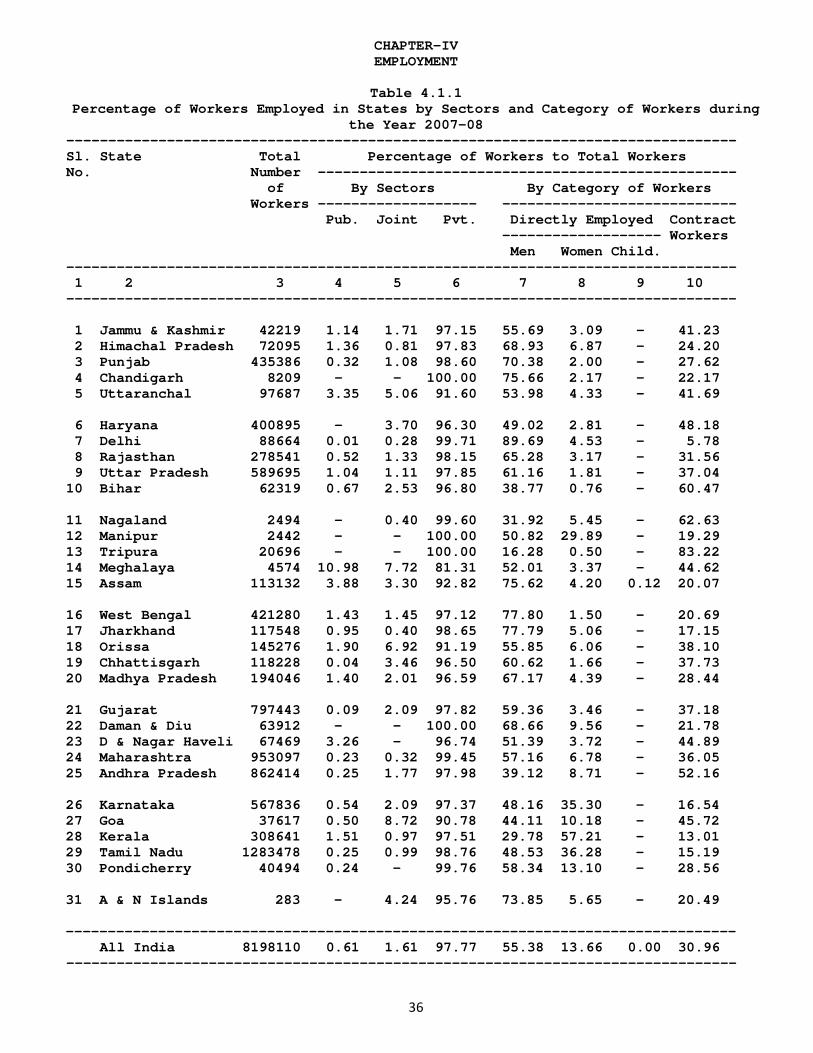
36
CHAPTER-IV EMPLOYMENT
Table 4.1.1
Percentage of Workers Employed in States by Sectors and Category of Workers during the Year 2007-08
-------------------------------------------------------------------------------- Sl. State Total Percentage of Workers to Total Workers No. Number -------------------------------------------------- of By Sectors By Category of Workers Workers ------------------- ---------------------------- Pub. Joint Pvt. Directly Employed Contract ------------------- Workers Men Women Child. -------------------------------------------------------------------------------- 1 2 3 4 5 6 7 8 9 10 -------------------------------------------------------------------------------- 1 Jammu & Kashmir 42219 1.14 1.71 97.15 55.69 3.09 - 41.23 2 Himachal Pradesh 72095 1.36 0.81 97.83 68.93 6.87 - 24.20 3 Punjab 435386 0.32 1.08 98.60 70.38 2.00 - 27.62 4 Chandigarh 8209 - - 100.00 75.66 2.17 - 22.17 5 Uttaranchal 97687 3.35 5.06 91.60 53.98 4.33 - 41.69 6 Haryana 400895 - 3.70 96.30 49.02 2.81 - 48.18 7 Delhi 88664 0.01 0.28 99.71 89.69 4.53 - 5.78 8 Rajasthan 278541 0.52 1.33 98.15 65.28 3.17 - 31.56 9 Uttar Pradesh 589695 1.04 1.11 97.85 61.16 1.81 - 37.04 10 Bihar 62319 0.67 2.53 96.80 38.77 0.76 - 60.47 11 Nagaland 2494 - 0.40 99.60 31.92 5.45 - 62.63 12 Manipur 2442 - - 100.00 50.82 29.89 - 19.29 13 Tripura 20696 - - 100.00 16.28 0.50 - 83.22 14 Meghalaya 4574 10.98 7.72 81.31 52.01 3.37 - 44.62 15 Assam 113132 3.88 3.30 92.82 75.62 4.20 0.12 20.07 16 West Bengal 421280 1.43 1.45 97.12 77.80 1.50 - 20.69 17 Jharkhand 117548 0.95 0.40 98.65 77.79 5.06 - 17.15 18 Orissa 145276 1.90 6.92 91.19 55.85 6.06 - 38.10 19 Chhattisgarh 118228 0.04 3.46 96.50 60.62 1.66 - 37.73 20 Madhya Pradesh 194046 1.40 2.01 96.59 67.17 4.39 - 28.44 21 Gujarat 797443 0.09 2.09 97.82 59.36 3.46 - 37.18 22 Daman & Diu 63912 - - 100.00 68.66 9.56 - 21.78 23 D & Nagar Haveli 67469 3.26 - 96.74 51.39 3.72 - 44.89 24 Maharashtra 953097 0.23 0.32 99.45 57.16 6.78 - 36.05 25 Andhra Pradesh 862414 0.25 1.77 97.98 39.12 8.71 - 52.16 26 Karnataka 567836 0.54 2.09 97.37 48.16 35.30 - 16.54 27 Goa 37617 0.50 8.72 90.78 44.11 10.18 - 45.72 28 Kerala 308641 1.51 0.97 97.51 29.78 57.21 - 13.01 29 Tamil Nadu 1283478 0.25 0.99 98.76 48.53 36.28 - 15.19 30 Pondicherry 40494 0.24 - 99.76 58.34 13.10 - 28.56 31 A & N Islands 283 - 4.24 95.76 73.85 5.65 - 20.49 -------------------------------------------------------------------------------- All India 8198110 0.61 1.61 97.77 55.38 13.66 0.00 30.96 --------------------------------------------------------------------------------
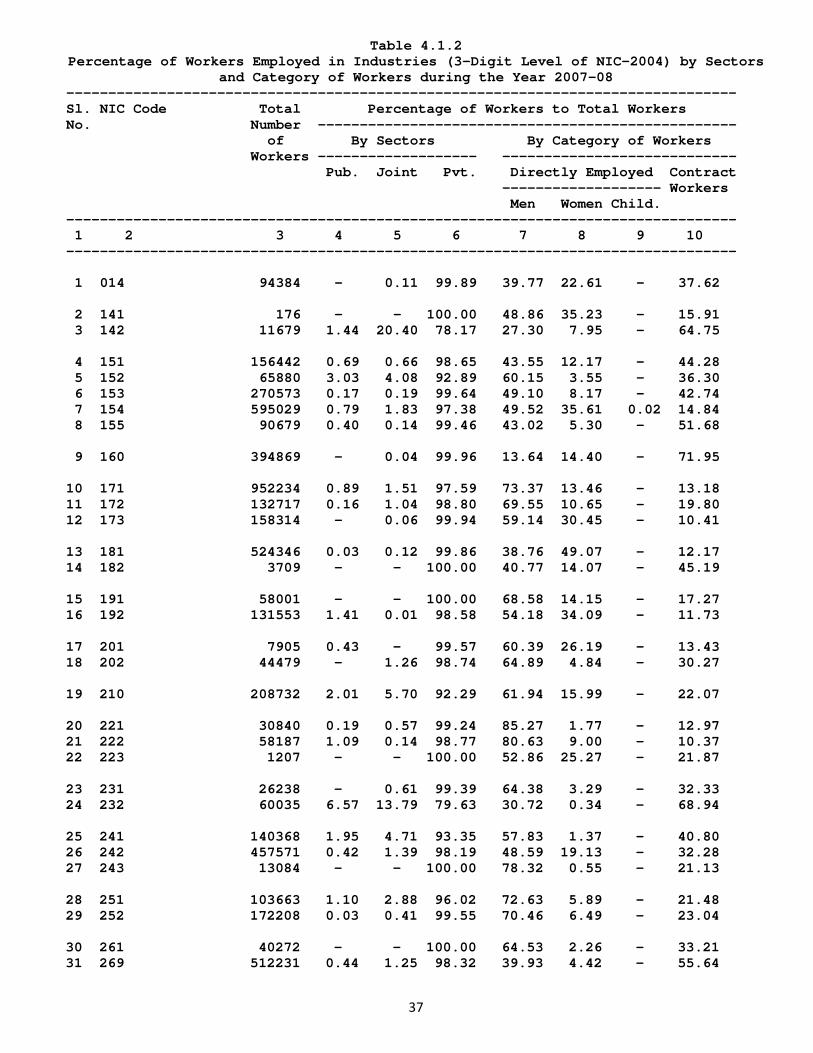
37
Table 4.1.2 Percentage of Workers Employed in Industries (3-Digit Level of NIC-2004) by Sectors
and Category of Workers during the Year 2007-08 -------------------------------------------------------------------------------- Sl. NIC Code Total Percentage of Workers to Total Workers No. Number -------------------------------------------------- of By Sectors By Category of Workers Workers ------------------- ---------------------------- Pub. Joint Pvt. Directly Employed Contract ------------------- Workers Men Women Child. -------------------------------------------------------------------------------- 1 2 3 4 5 6 7 8 9 10 -------------------------------------------------------------------------------- 1 014 94384 - 0.11 99.89 39.77 22.61 - 37.62 2 141 176 - - 100.00 48.86 35.23 - 15.91 3 142 11679 1.44 20.40 78.17 27.30 7.95 - 64.75 4 151 156442 0.69 0.66 98.65 43.55 12.17 - 44.28 5 152 65880 3.03 4.08 92.89 60.15 3.55 - 36.30 6 153 270573 0.17 0.19 99.64 49.10 8.17 - 42.74 7 154 595029 0.79 1.83 97.38 49.52 35.61 0.02 14.84 8 155 90679 0.40 0.14 99.46 43.02 5.30 - 51.68 9 160 394869 - 0.04 99.96 13.64 14.40 - 71.95 10 171 952234 0.89 1.51 97.59 73.37 13.46 - 13.18 11 172 132717 0.16 1.04 98.80 69.55 10.65 - 19.80 12 173 158314 - 0.06 99.94 59.14 30.45 - 10.41 13 181 524346 0.03 0.12 99.86 38.76 49.07 - 12.17 14 182 3709 - - 100.00 40.77 14.07 - 45.19 15 191 58001 - - 100.00 68.58 14.15 - 17.27 16 192 131553 1.41 0.01 98.58 54.18 34.09 - 11.73 17 201 7905 0.43 - 99.57 60.39 26.19 - 13.43 18 202 44479 - 1.26 98.74 64.89 4.84 - 30.27 19 210 208732 2.01 5.70 92.29 61.94 15.99 - 22.07 20 221 30840 0.19 0.57 99.24 85.27 1.77 - 12.97 21 222 58187 1.09 0.14 98.77 80.63 9.00 - 10.37 22 223 1207 - - 100.00 52.86 25.27 - 21.87 23 231 26238 - 0.61 99.39 64.38 3.29 - 32.33 24 232 60035 6.57 13.79 79.63 30.72 0.34 - 68.94 25 241 140368 1.95 4.71 93.35 57.83 1.37 - 40.80 26 242 457571 0.42 1.39 98.19 48.59 19.13 - 32.28 27 243 13084 - - 100.00 78.32 0.55 - 21.13 28 251 103663 1.10 2.88 96.02 72.63 5.89 - 21.48 29 252 172208 0.03 0.41 99.55 70.46 6.49 - 23.04 30 261 40272 - - 100.00 64.53 2.26 - 33.21 31 269 512231 0.44 1.25 98.32 39.93 4.42 - 55.64
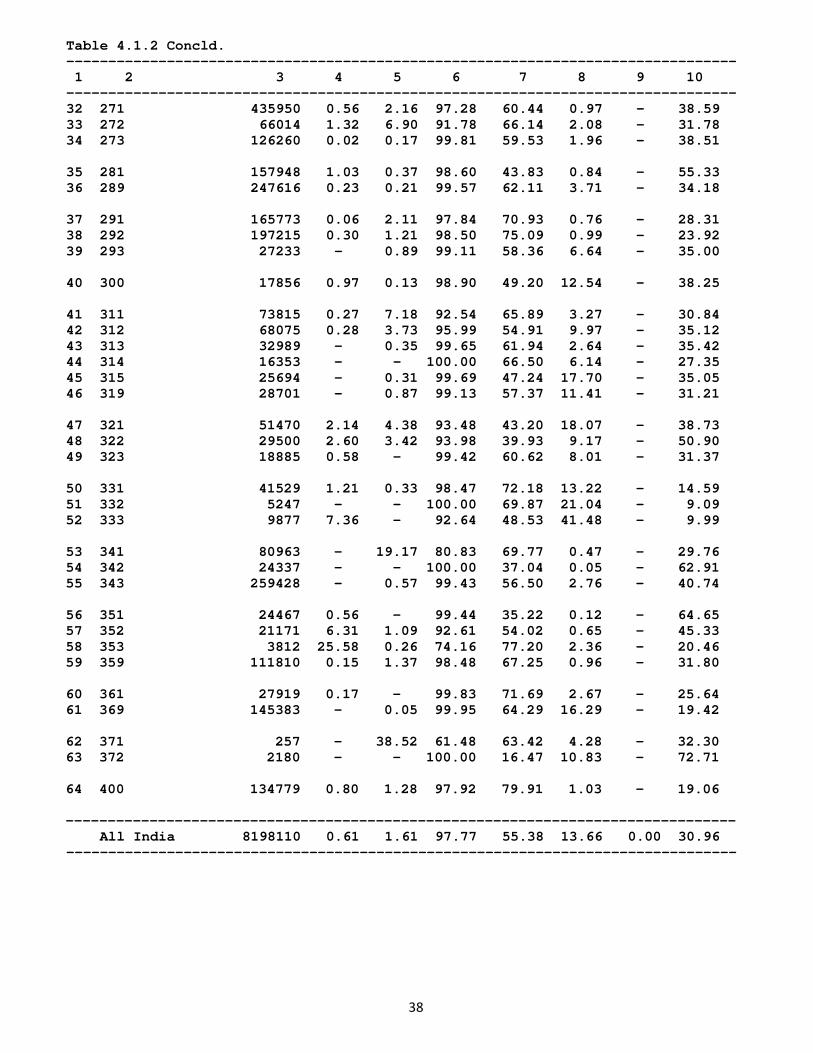
38
Table 4.1.2 Concld. -------------------------------------------------------------------------------- 1 2 3 4 5 6 7 8 9 10 -------------------------------------------------------------------------------- 32 271 435950 0.56 2.16 97.28 60.44 0.97 - 38.59 33 272 66014 1.32 6.90 91.78 66.14 2.08 - 31.78 34 273 126260 0.02 0.17 99.81 59.53 1.96 - 38.51 35 281 157948 1.03 0.37 98.60 43.83 0.84 - 55.33 36 289 247616 0.23 0.21 99.57 62.11 3.71 - 34.18 37 291 165773 0.06 2.11 97.84 70.93 0.76 - 28.31 38 292 197215 0.30 1.21 98.50 75.09 0.99 - 23.92 39 293 27233 - 0.89 99.11 58.36 6.64 - 35.00 40 300 17856 0.97 0.13 98.90 49.20 12.54 - 38.25 41 311 73815 0.27 7.18 92.54 65.89 3.27 - 30.84 42 312 68075 0.28 3.73 95.99 54.91 9.97 - 35.12 43 313 32989 - 0.35 99.65 61.94 2.64 - 35.42 44 314 16353 - - 100.00 66.50 6.14 - 27.35 45 315 25694 - 0.31 99.69 47.24 17.70 - 35.05 46 319 28701 - 0.87 99.13 57.37 11.41 - 31.21 47 321 51470 2.14 4.38 93.48 43.20 18.07 - 38.73 48 322 29500 2.60 3.42 93.98 39.93 9.17 - 50.90 49 323 18885 0.58 - 99.42 60.62 8.01 - 31.37 50 331 41529 1.21 0.33 98.47 72.18 13.22 - 14.59 51 332 5247 - - 100.00 69.87 21.04 - 9.09 52 333 9877 7.36 - 92.64 48.53 41.48 - 9.99 53 341 80963 - 19.17 80.83 69.77 0.47 - 29.76 54 342 24337 - - 100.00 37.04 0.05 - 62.91 55 343 259428 - 0.57 99.43 56.50 2.76 - 40.74 56 351 24467 0.56 - 99.44 35.22 0.12 - 64.65 57 352 21171 6.31 1.09 92.61 54.02 0.65 - 45.33 58 353 3812 25.58 0.26 74.16 77.20 2.36 - 20.46 59 359 111810 0.15 1.37 98.48 67.25 0.96 - 31.80 60 361 27919 0.17 - 99.83 71.69 2.67 - 25.64 61 369 145383 - 0.05 99.95 64.29 16.29 - 19.42 62 371 257 - 38.52 61.48 63.42 4.28 - 32.30 63 372 2180 - - 100.00 16.47 10.83 - 72.71 64 400 134779 0.80 1.28 97.92 79.91 1.03 - 19.06 -------------------------------------------------------------------------------- All India 8198110 0.61 1.61 97.77 55.38 13.66 0.00 30.96 --------------------------------------------------------------------------------
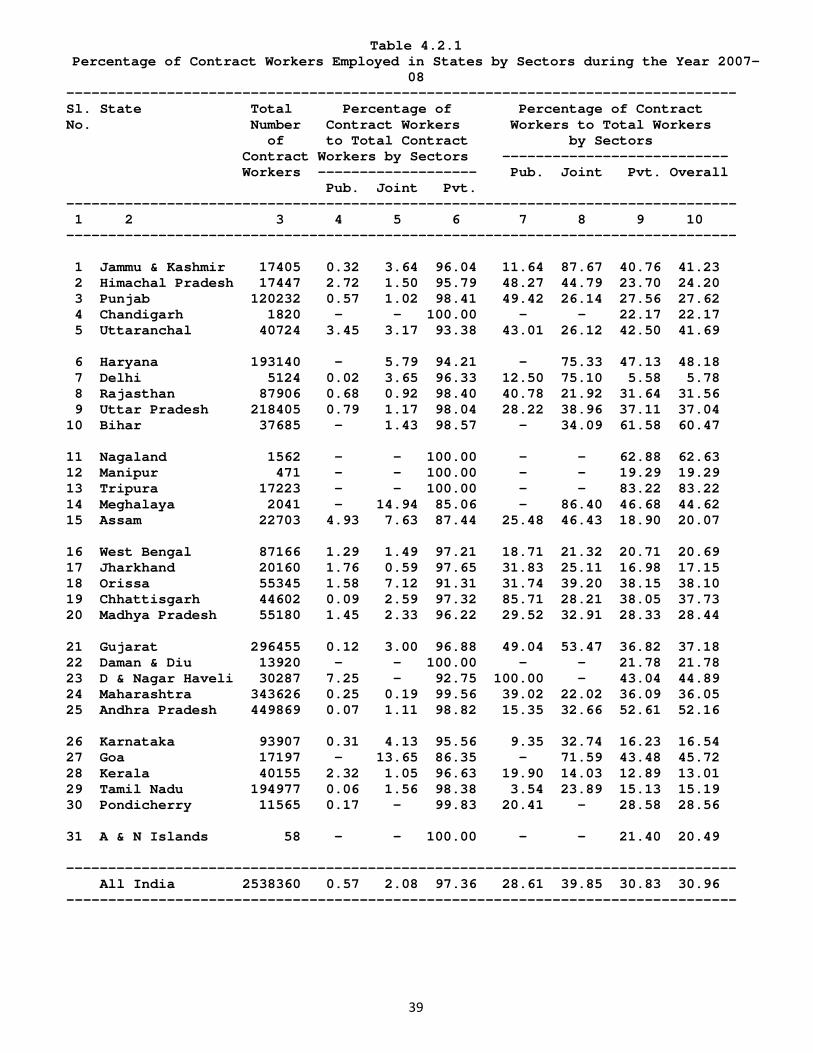
39
Table 4.2.1 Percentage of Contract Workers Employed in States by Sectors during the Year 2007-
08 -------------------------------------------------------------------------------- Sl. State Total Percentage of Percentage of Contract No. Number Contract Workers Workers to Total Workers of to Total Contract by Sectors Contract Workers by Sectors --------------------------- Workers ------------------- Pub. Joint Pvt. Overall Pub. Joint Pvt. -------------------------------------------------------------------------------- 1 2 3 4 5 6 7 8 9 10 -------------------------------------------------------------------------------- 1 Jammu & Kashmir 17405 0.32 3.64 96.04 11.64 87.67 40.76 41.23 2 Himachal Pradesh 17447 2.72 1.50 95.79 48.27 44.79 23.70 24.20 3 Punjab 120232 0.57 1.02 98.41 49.42 26.14 27.56 27.62 4 Chandigarh 1820 - - 100.00 - - 22.17 22.17 5 Uttaranchal 40724 3.45 3.17 93.38 43.01 26.12 42.50 41.69 6 Haryana 193140 - 5.79 94.21 - 75.33 47.13 48.18 7 Delhi 5124 0.02 3.65 96.33 12.50 75.10 5.58 5.78 8 Rajasthan 87906 0.68 0.92 98.40 40.78 21.92 31.64 31.56 9 Uttar Pradesh 218405 0.79 1.17 98.04 28.22 38.96 37.11 37.04 10 Bihar 37685 - 1.43 98.57 - 34.09 61.58 60.47 11 Nagaland 1562 - - 100.00 - - 62.88 62.63 12 Manipur 471 - - 100.00 - - 19.29 19.29 13 Tripura 17223 - - 100.00 - - 83.22 83.22 14 Meghalaya 2041 - 14.94 85.06 - 86.40 46.68 44.62 15 Assam 22703 4.93 7.63 87.44 25.48 46.43 18.90 20.07 16 West Bengal 87166 1.29 1.49 97.21 18.71 21.32 20.71 20.69 17 Jharkhand 20160 1.76 0.59 97.65 31.83 25.11 16.98 17.15 18 Orissa 55345 1.58 7.12 91.31 31.74 39.20 38.15 38.10 19 Chhattisgarh 44602 0.09 2.59 97.32 85.71 28.21 38.05 37.73 20 Madhya Pradesh 55180 1.45 2.33 96.22 29.52 32.91 28.33 28.44 21 Gujarat 296455 0.12 3.00 96.88 49.04 53.47 36.82 37.18 22 Daman & Diu 13920 - - 100.00 - - 21.78 21.78 23 D & Nagar Haveli 30287 7.25 - 92.75 100.00 - 43.04 44.89 24 Maharashtra 343626 0.25 0.19 99.56 39.02 22.02 36.09 36.05 25 Andhra Pradesh 449869 0.07 1.11 98.82 15.35 32.66 52.61 52.16 26 Karnataka 93907 0.31 4.13 95.56 9.35 32.74 16.23 16.54 27 Goa 17197 - 13.65 86.35 - 71.59 43.48 45.72 28 Kerala 40155 2.32 1.05 96.63 19.90 14.03 12.89 13.01 29 Tamil Nadu 194977 0.06 1.56 98.38 3.54 23.89 15.13 15.19 30 Pondicherry 11565 0.17 - 99.83 20.41 - 28.58 28.56 31 A & N Islands 58 - - 100.00 - - 21.40 20.49 -------------------------------------------------------------------------------- All India 2538360 0.57 2.08 97.36 28.61 39.85 30.83 30.96 --------------------------------------------------------------------------------
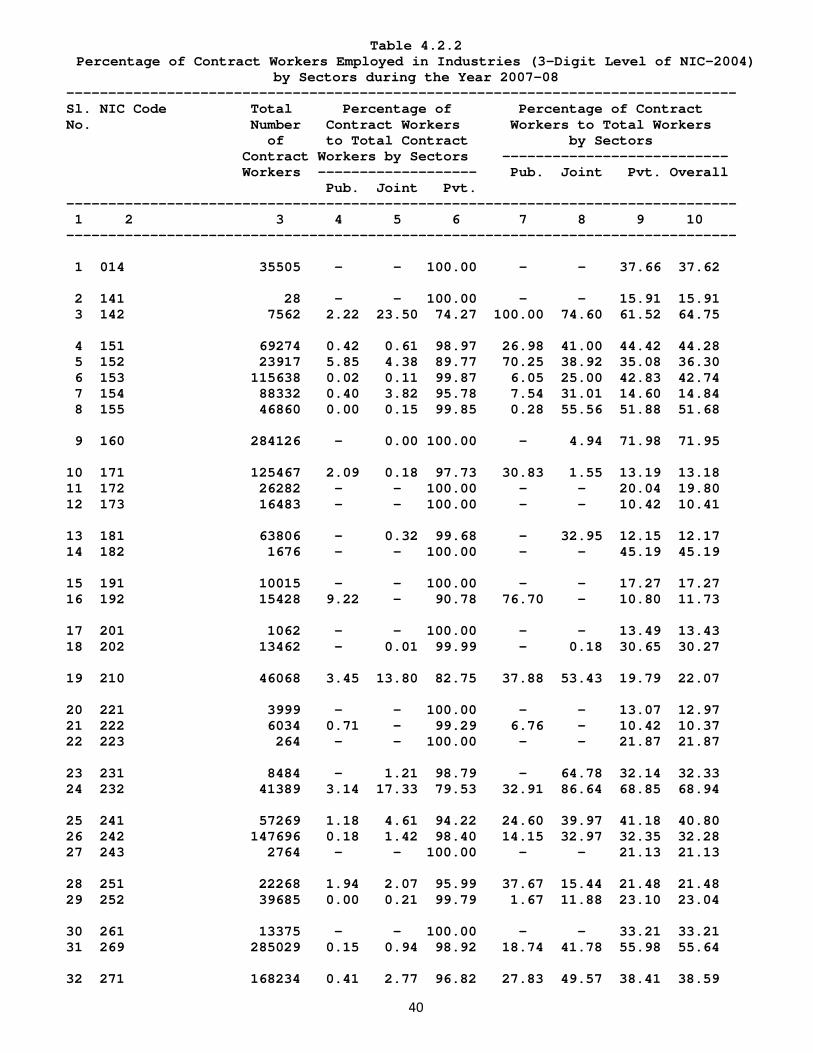
40
Table 4.2.2 Percentage of Contract Workers Employed in Industries (3-Digit Level of NIC-2004)
by Sectors during the Year 2007-08 -------------------------------------------------------------------------------- Sl. NIC Code Total Percentage of Percentage of Contract No. Number Contract Workers Workers to Total Workers of to Total Contract by Sectors Contract Workers by Sectors --------------------------- Workers ------------------- Pub. Joint Pvt. Overall Pub. Joint Pvt. -------------------------------------------------------------------------------- 1 2 3 4 5 6 7 8 9 10 -------------------------------------------------------------------------------- 1 014 35505 - - 100.00 - - 37.66 37.62 2 141 28 - - 100.00 - - 15.91 15.91 3 142 7562 2.22 23.50 74.27 100.00 74.60 61.52 64.75 4 151 69274 0.42 0.61 98.97 26.98 41.00 44.42 44.28 5 152 23917 5.85 4.38 89.77 70.25 38.92 35.08 36.30 6 153 115638 0.02 0.11 99.87 6.05 25.00 42.83 42.74 7 154 88332 0.40 3.82 95.78 7.54 31.01 14.60 14.84 8 155 46860 0.00 0.15 99.85 0.28 55.56 51.88 51.68 9 160 284126 - 0.00 100.00 - 4.94 71.98 71.95 10 171 125467 2.09 0.18 97.73 30.83 1.55 13.19 13.18 11 172 26282 - - 100.00 - - 20.04 19.80 12 173 16483 - - 100.00 - - 10.42 10.41 13 181 63806 - 0.32 99.68 - 32.95 12.15 12.17 14 182 1676 - - 100.00 - - 45.19 45.19 15 191 10015 - - 100.00 - - 17.27 17.27 16 192 15428 9.22 - 90.78 76.70 - 10.80 11.73 17 201 1062 - - 100.00 - - 13.49 13.43 18 202 13462 - 0.01 99.99 - 0.18 30.65 30.27 19 210 46068 3.45 13.80 82.75 37.88 53.43 19.79 22.07 20 221 3999 - - 100.00 - - 13.07 12.97 21 222 6034 0.71 - 99.29 6.76 - 10.42 10.37 22 223 264 - - 100.00 - - 21.87 21.87 23 231 8484 - 1.21 98.79 - 64.78 32.14 32.33 24 232 41389 3.14 17.33 79.53 32.91 86.64 68.85 68.94 25 241 57269 1.18 4.61 94.22 24.60 39.97 41.18 40.80 26 242 147696 0.18 1.42 98.40 14.15 32.97 32.35 32.28 27 243 2764 - - 100.00 - - 21.13 21.13 28 251 22268 1.94 2.07 95.99 37.67 15.44 21.48 21.48 29 252 39685 0.00 0.21 99.79 1.67 11.88 23.10 23.04 30 261 13375 - - 100.00 - - 33.21 33.21 31 269 285029 0.15 0.94 98.92 18.74 41.78 55.98 55.64 32 271 168234 0.41 2.77 96.82 27.83 49.57 38.41 38.59
41
Table 4.2.2 Concld. -------------------------------------------------------------------------------- 1 2 3 4 5 6 7 8 9 10 -------------------------------------------------------------------------------- 33 272 20980 1.12 3.02 95.86 27.06 13.89 33.19 31.78 34 273 48627 - 0.34 99.66 - 76.61 38.46 38.51 35 281 87396 0.57 0.32 99.11 30.79 47.96 55.62 55.33 36 289 84628 0.03 - 99.97 4.11 - 34.32 34.18 37 291 46931 - 0.91 99.09 - 12.21 28.67 28.31 38 292 47177 0.24 1.53 98.23 19.52 30.33 23.86 23.92 39 293 9531 - 1.59 98.41 - 62.81 34.75 35.00 40 300 6830 - - 100.00 - - 38.67 38.25 41 311 22763 0.07 9.50 90.43 8.42 40.77 30.13 30.84 42 312 23906 - 3.76 96.24 - 35.42 35.21 35.12 43 313 11685 - 0.64 99.36 - 64.10 35.32 35.42 44 314 4473 - - 100.00 - - 27.35 27.35 45 315 9006 - - 100.00 - - 35.16 35.05 46 319 8958 - - 100.00 - - 31.49 31.21 47 321 19934 - 0.31 99.69 - 2.75 41.30 38.73 48 322 15016 0.71 0.39 98.91 13.82 5.75 53.57 50.90 49 323 5924 1.86 - 98.14 100.00 - 30.97 31.37 50 331 6060 4.52 - 95.48 54.69 - 14.15 14.59 51 332 477 - - 100.00 - - 9.09 9.09 52 333 987 5.67 - 94.33 7.70 - 10.17 9.99 53 341 24092 - 52.03 47.97 - 80.78 17.66 29.76 54 342 15310 - - 100.00 - - 62.91 62.91 55 343 105687 - 0.38 99.62 - 27.19 40.82 40.74 56 351 15819 0.05 - 99.95 5.80 - 64.99 64.65 57 352 9597 6.22 - 93.78 44.72 - 45.90 45.33 58 353 780 - 1.28 98.72 - 100.00 27.24 20.46 59 359 35555 - - 100.00 - - 32.29 31.80 60 361 7158 0.43 - 99.57 65.96 - 25.57 25.64 61 369 28237 - 0.20 99.80 - 77.78 19.39 19.42 62 371 83 - - 100.00 - - 52.53 32.30 63 372 1585 - - 100.00 - - 72.71 72.71 64 400 25689 2.28 2.37 95.35 54.37 35.18 18.56 19.06 -------------------------------------------------------------------------------- All India 2538360 0.57 2.08 97.36 28.61 39.85 30.83 30.96 --------------------------------------------------------------------------------
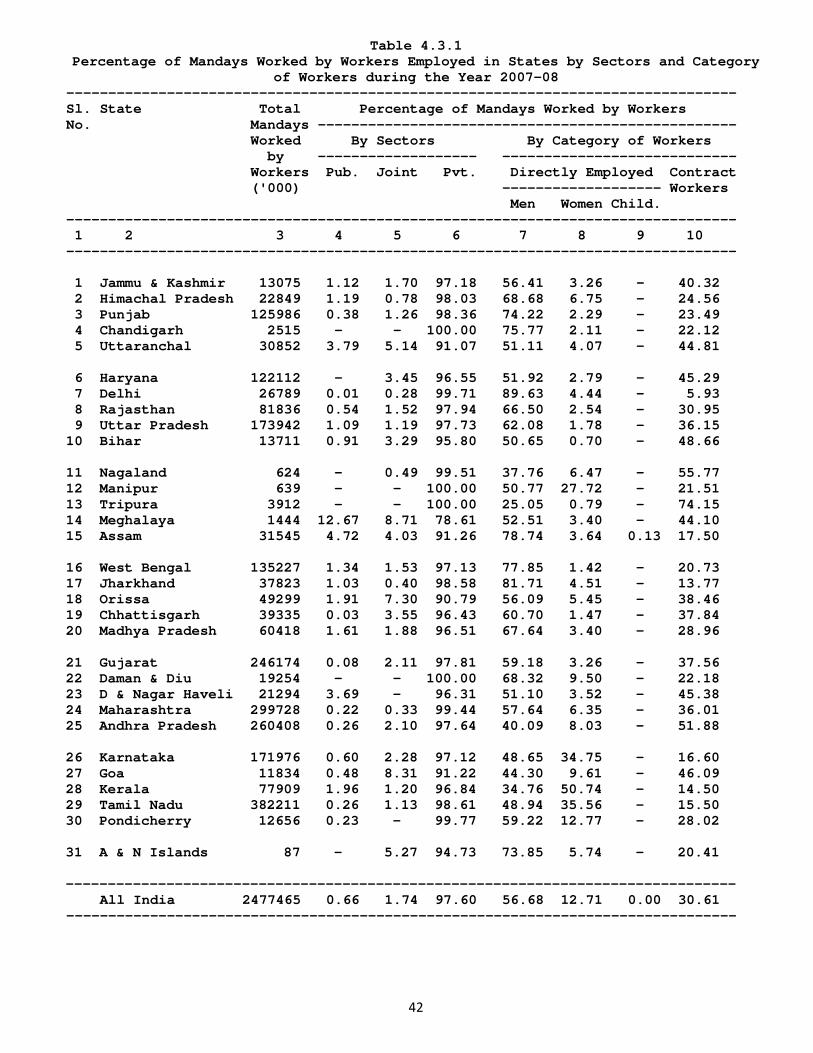
42
Table 4.3.1 Percentage of Mandays Worked by Workers Employed in States by Sectors and Category
of Workers during the Year 2007-08 -------------------------------------------------------------------------------- Sl. State Total Percentage of Mandays Worked by Workers No. Mandays -------------------------------------------------- Worked By Sectors By Category of Workers by ------------------- ---------------------------- Workers Pub. Joint Pvt. Directly Employed Contract ('000) ------------------- Workers Men Women Child. -------------------------------------------------------------------------------- 1 2 3 4 5 6 7 8 9 10 -------------------------------------------------------------------------------- 1 Jammu & Kashmir 13075 1.12 1.70 97.18 56.41 3.26 - 40.32 2 Himachal Pradesh 22849 1.19 0.78 98.03 68.68 6.75 - 24.56 3 Punjab 125986 0.38 1.26 98.36 74.22 2.29 - 23.49 4 Chandigarh 2515 - - 100.00 75.77 2.11 - 22.12 5 Uttaranchal 30852 3.79 5.14 91.07 51.11 4.07 - 44.81 6 Haryana 122112 - 3.45 96.55 51.92 2.79 - 45.29 7 Delhi 26789 0.01 0.28 99.71 89.63 4.44 - 5.93 8 Rajasthan 81836 0.54 1.52 97.94 66.50 2.54 - 30.95 9 Uttar Pradesh 173942 1.09 1.19 97.73 62.08 1.78 - 36.15 10 Bihar 13711 0.91 3.29 95.80 50.65 0.70 - 48.66 11 Nagaland 624 - 0.49 99.51 37.76 6.47 - 55.77 12 Manipur 639 - - 100.00 50.77 27.72 - 21.51 13 Tripura 3912 - - 100.00 25.05 0.79 - 74.15 14 Meghalaya 1444 12.67 8.71 78.61 52.51 3.40 - 44.10 15 Assam 31545 4.72 4.03 91.26 78.74 3.64 0.13 17.50 16 West Bengal 135227 1.34 1.53 97.13 77.85 1.42 - 20.73 17 Jharkhand 37823 1.03 0.40 98.58 81.71 4.51 - 13.77 18 Orissa 49299 1.91 7.30 90.79 56.09 5.45 - 38.46 19 Chhattisgarh 39335 0.03 3.55 96.43 60.70 1.47 - 37.84 20 Madhya Pradesh 60418 1.61 1.88 96.51 67.64 3.40 - 28.96 21 Gujarat 246174 0.08 2.11 97.81 59.18 3.26 - 37.56 22 Daman & Diu 19254 - - 100.00 68.32 9.50 - 22.18 23 D & Nagar Haveli 21294 3.69 - 96.31 51.10 3.52 - 45.38 24 Maharashtra 299728 0.22 0.33 99.44 57.64 6.35 - 36.01 25 Andhra Pradesh 260408 0.26 2.10 97.64 40.09 8.03 - 51.88 26 Karnataka 171976 0.60 2.28 97.12 48.65 34.75 - 16.60 27 Goa 11834 0.48 8.31 91.22 44.30 9.61 - 46.09 28 Kerala 77909 1.96 1.20 96.84 34.76 50.74 - 14.50 29 Tamil Nadu 382211 0.26 1.13 98.61 48.94 35.56 - 15.50 30 Pondicherry 12656 0.23 - 99.77 59.22 12.77 - 28.02 31 A & N Islands 87 - 5.27 94.73 73.85 5.74 - 20.41 -------------------------------------------------------------------------------- All India 2477465 0.66 1.74 97.60 56.68 12.71 0.00 30.61 --------------------------------------------------------------------------------
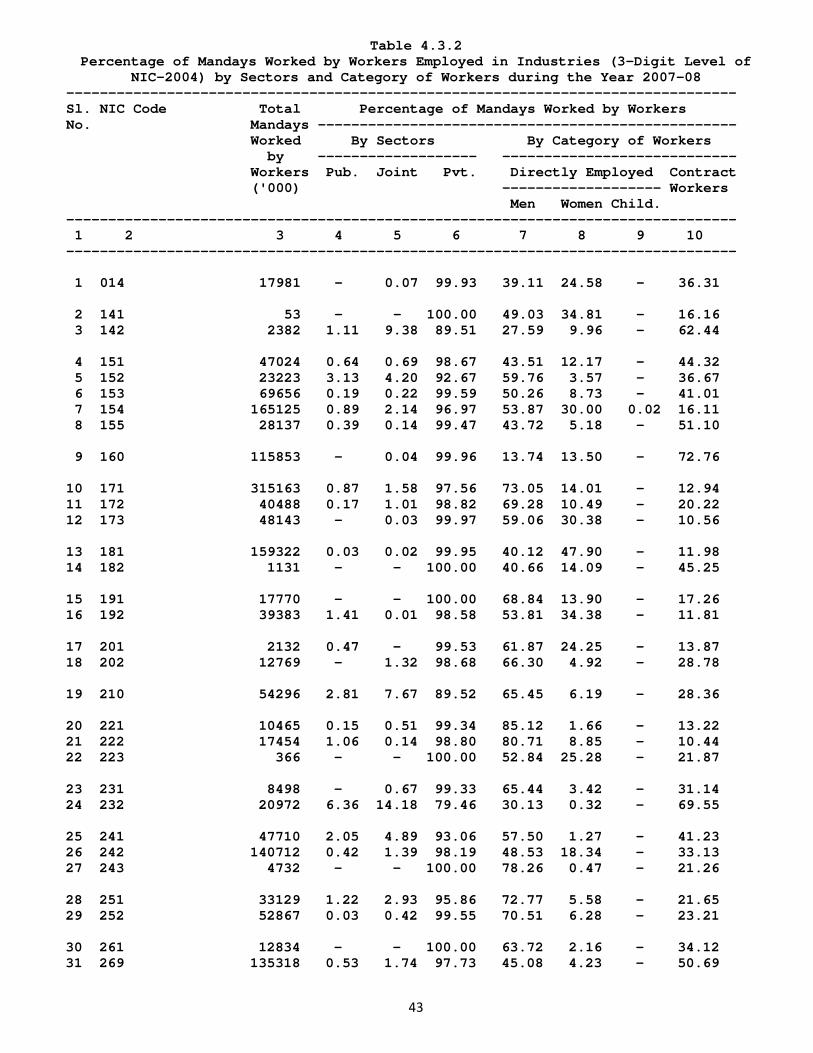
43
Table 4.3.2 Percentage of Mandays Worked by Workers Employed in Industries (3-Digit Level of
NIC-2004) by Sectors and Category of Workers during the Year 2007-08 -------------------------------------------------------------------------------- Sl. NIC Code Total Percentage of Mandays Worked by Workers No. Mandays -------------------------------------------------- Worked By Sectors By Category of Workers by ------------------- ---------------------------- Workers Pub. Joint Pvt. Directly Employed Contract ('000) ------------------- Workers Men Women Child. -------------------------------------------------------------------------------- 1 2 3 4 5 6 7 8 9 10 -------------------------------------------------------------------------------- 1 014 17981 - 0.07 99.93 39.11 24.58 - 36.31 2 141 53 - - 100.00 49.03 34.81 - 16.16 3 142 2382 1.11 9.38 89.51 27.59 9.96 - 62.44 4 151 47024 0.64 0.69 98.67 43.51 12.17 - 44.32 5 152 23223 3.13 4.20 92.67 59.76 3.57 - 36.67 6 153 69656 0.19 0.22 99.59 50.26 8.73 - 41.01 7 154 165125 0.89 2.14 96.97 53.87 30.00 0.02 16.11 8 155 28137 0.39 0.14 99.47 43.72 5.18 - 51.10 9 160 115853 - 0.04 99.96 13.74 13.50 - 72.76 10 171 315163 0.87 1.58 97.56 73.05 14.01 - 12.94 11 172 40488 0.17 1.01 98.82 69.28 10.49 - 20.22 12 173 48143 - 0.03 99.97 59.06 30.38 - 10.56 13 181 159322 0.03 0.02 99.95 40.12 47.90 - 11.98 14 182 1131 - - 100.00 40.66 14.09 - 45.25 15 191 17770 - - 100.00 68.84 13.90 - 17.26 16 192 39383 1.41 0.01 98.58 53.81 34.38 - 11.81 17 201 2132 0.47 - 99.53 61.87 24.25 - 13.87 18 202 12769 - 1.32 98.68 66.30 4.92 - 28.78 19 210 54296 2.81 7.67 89.52 65.45 6.19 - 28.36 20 221 10465 0.15 0.51 99.34 85.12 1.66 - 13.22 21 222 17454 1.06 0.14 98.80 80.71 8.85 - 10.44 22 223 366 - - 100.00 52.84 25.28 - 21.87 23 231 8498 - 0.67 99.33 65.44 3.42 - 31.14 24 232 20972 6.36 14.18 79.46 30.13 0.32 - 69.55 25 241 47710 2.05 4.89 93.06 57.50 1.27 - 41.23 26 242 140712 0.42 1.39 98.19 48.53 18.34 - 33.13 27 243 4732 - - 100.00 78.26 0.47 - 21.26 28 251 33129 1.22 2.93 95.86 72.77 5.58 - 21.65 29 252 52867 0.03 0.42 99.55 70.51 6.28 - 23.21 30 261 12834 - - 100.00 63.72 2.16 - 34.12 31 269 135318 0.53 1.74 97.73 45.08 4.23 - 50.69

44
Table 4.3.2 Concld. -------------------------------------------------------------------------------- 1 2 3 4 5 6 7 8 9 10 -------------------------------------------------------------------------------- 32 271 147705 0.61 2.21 97.18 60.90 1.03 - 38.08 33 272 21692 1.45 7.45 91.09 66.63 2.03 - 31.34 34 273 39134 0.02 0.17 99.81 59.63 1.89 - 38.48 35 281 49130 1.01 0.36 98.63 42.28 0.80 - 56.92 36 289 74804 0.23 0.21 99.56 61.91 3.66 - 34.43 37 291 50136 0.05 2.13 97.82 70.91 0.73 - 28.35 38 292 60419 0.29 1.46 98.25 74.75 0.95 - 24.30 39 293 8181 - 0.88 99.12 58.19 6.65 - 35.16 40 300 5476 0.94 0.12 98.93 51.13 11.70 - 37.17 41 311 22645 0.27 8.40 91.33 65.94 3.01 - 31.06 42 312 20686 0.28 3.69 96.03 55.01 9.82 - 35.17 43 313 10159 - 0.35 99.65 61.44 2.53 - 36.02 44 314 5084 - - 100.00 66.96 6.01 - 27.03 45 315 8018 - 0.20 99.80 47.34 17.21 - 35.45 46 319 8550 - 1.02 98.98 56.70 11.55 - 31.75 47 321 14645 2.26 4.65 93.09 45.82 18.70 - 35.48 48 322 9103 2.52 3.31 94.17 40.22 8.88 - 50.90 49 323 5777 0.50 - 99.50 61.50 7.85 - 30.65 50 331 12203 1.23 0.33 98.44 72.17 12.82 - 15.01 51 332 1608 - - 100.00 69.85 20.91 - 9.24 52 333 3012 7.33 - 92.67 48.33 41.85 - 9.81 53 341 25186 - 17.44 82.56 71.19 0.52 - 28.30 54 342 7356 - - 100.00 37.10 0.05 - 62.85 55 343 78912 - 0.61 99.39 56.23 2.72 - 41.04 56 351 6822 0.60 - 99.40 30.55 0.13 - 69.32 57 352 6339 6.25 1.08 92.68 53.72 0.64 - 45.63 58 353 1120 25.95 0.33 73.72 78.16 2.22 - 19.61 59 359 34151 0.14 1.37 98.49 68.22 0.94 - 30.83 60 361 8745 0.16 - 99.84 72.38 2.50 - 25.12 61 369 43326 - 0.05 99.95 64.01 16.38 - 19.62 62 371 72 - 50.33 49.67 77.71 4.41 - 17.88 63 372 649 - - 100.00 16.27 9.87 - 73.86 64 400 41530 0.87 1.40 97.73 79.74 1.01 - 19.25 -------------------------------------------------------------------------------- All India 2477465 0.66 1.74 97.60 56.68 12.71 0.00 30.61 --------------------------------------------------------------------------------
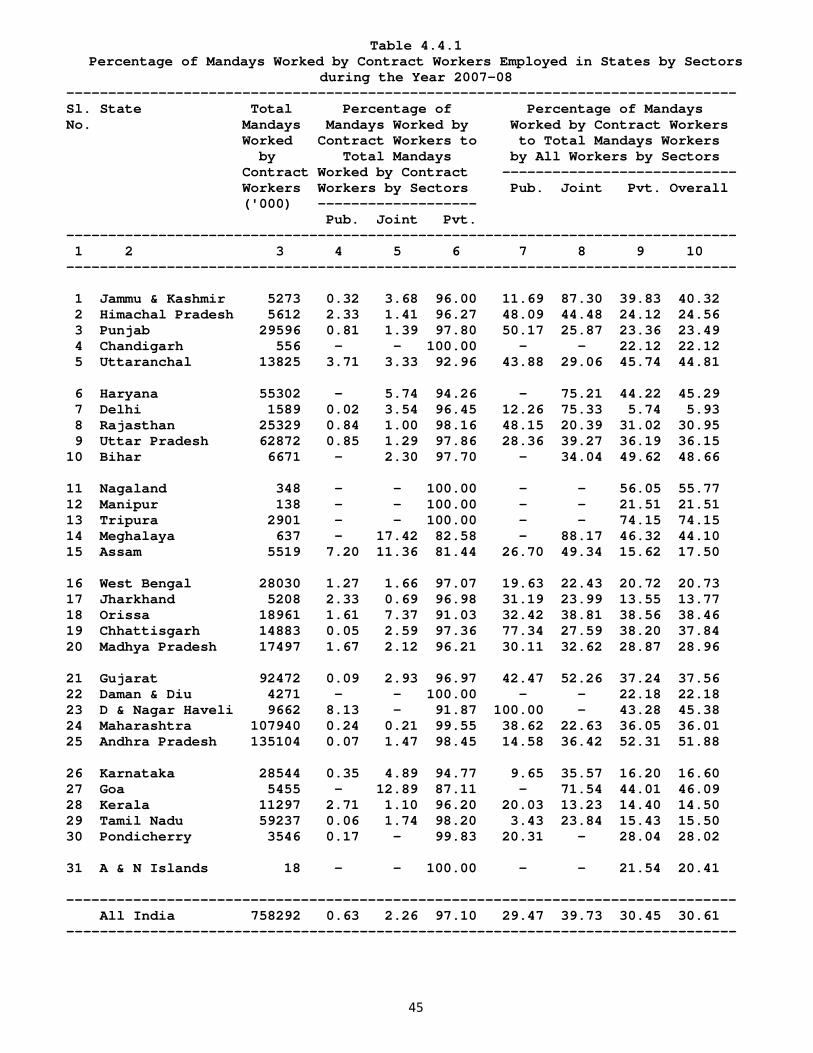
45
Table 4.4.1 Percentage of Mandays Worked by Contract Workers Employed in States by Sectors
during the Year 2007-08 -------------------------------------------------------------------------------- Sl. State Total Percentage of Percentage of Mandays No. Mandays Mandays Worked by Worked by Contract Workers Worked Contract Workers to to Total Mandays Workers by Total Mandays by All Workers by Sectors Contract Worked by Contract ---------------------------- Workers Workers by Sectors Pub. Joint Pvt. Overall ('000) ------------------- Pub. Joint Pvt. -------------------------------------------------------------------------------- 1 2 3 4 5 6 7 8 9 10 -------------------------------------------------------------------------------- 1 Jammu & Kashmir 5273 0.32 3.68 96.00 11.69 87.30 39.83 40.32 2 Himachal Pradesh 5612 2.33 1.41 96.27 48.09 44.48 24.12 24.56 3 Punjab 29596 0.81 1.39 97.80 50.17 25.87 23.36 23.49 4 Chandigarh 556 - - 100.00 - - 22.12 22.12 5 Uttaranchal 13825 3.71 3.33 92.96 43.88 29.06 45.74 44.81 6 Haryana 55302 - 5.74 94.26 - 75.21 44.22 45.29 7 Delhi 1589 0.02 3.54 96.45 12.26 75.33 5.74 5.93 8 Rajasthan 25329 0.84 1.00 98.16 48.15 20.39 31.02 30.95 9 Uttar Pradesh 62872 0.85 1.29 97.86 28.36 39.27 36.19 36.15 10 Bihar 6671 - 2.30 97.70 - 34.04 49.62 48.66 11 Nagaland 348 - - 100.00 - - 56.05 55.77 12 Manipur 138 - - 100.00 - - 21.51 21.51 13 Tripura 2901 - - 100.00 - - 74.15 74.15 14 Meghalaya 637 - 17.42 82.58 - 88.17 46.32 44.10 15 Assam 5519 7.20 11.36 81.44 26.70 49.34 15.62 17.50 16 West Bengal 28030 1.27 1.66 97.07 19.63 22.43 20.72 20.73 17 Jharkhand 5208 2.33 0.69 96.98 31.19 23.99 13.55 13.77 18 Orissa 18961 1.61 7.37 91.03 32.42 38.81 38.56 38.46 19 Chhattisgarh 14883 0.05 2.59 97.36 77.34 27.59 38.20 37.84 20 Madhya Pradesh 17497 1.67 2.12 96.21 30.11 32.62 28.87 28.96 21 Gujarat 92472 0.09 2.93 96.97 42.47 52.26 37.24 37.56 22 Daman & Diu 4271 - - 100.00 - - 22.18 22.18 23 D & Nagar Haveli 9662 8.13 - 91.87 100.00 - 43.28 45.38 24 Maharashtra 107940 0.24 0.21 99.55 38.62 22.63 36.05 36.01 25 Andhra Pradesh 135104 0.07 1.47 98.45 14.58 36.42 52.31 51.88 26 Karnataka 28544 0.35 4.89 94.77 9.65 35.57 16.20 16.60 27 Goa 5455 - 12.89 87.11 - 71.54 44.01 46.09 28 Kerala 11297 2.71 1.10 96.20 20.03 13.23 14.40 14.50 29 Tamil Nadu 59237 0.06 1.74 98.20 3.43 23.84 15.43 15.50 30 Pondicherry 3546 0.17 - 99.83 20.31 - 28.04 28.02 31 A & N Islands 18 - - 100.00 - - 21.54 20.41 -------------------------------------------------------------------------------- All India 758292 0.63 2.26 97.10 29.47 39.73 30.45 30.61 --------------------------------------------------------------------------------
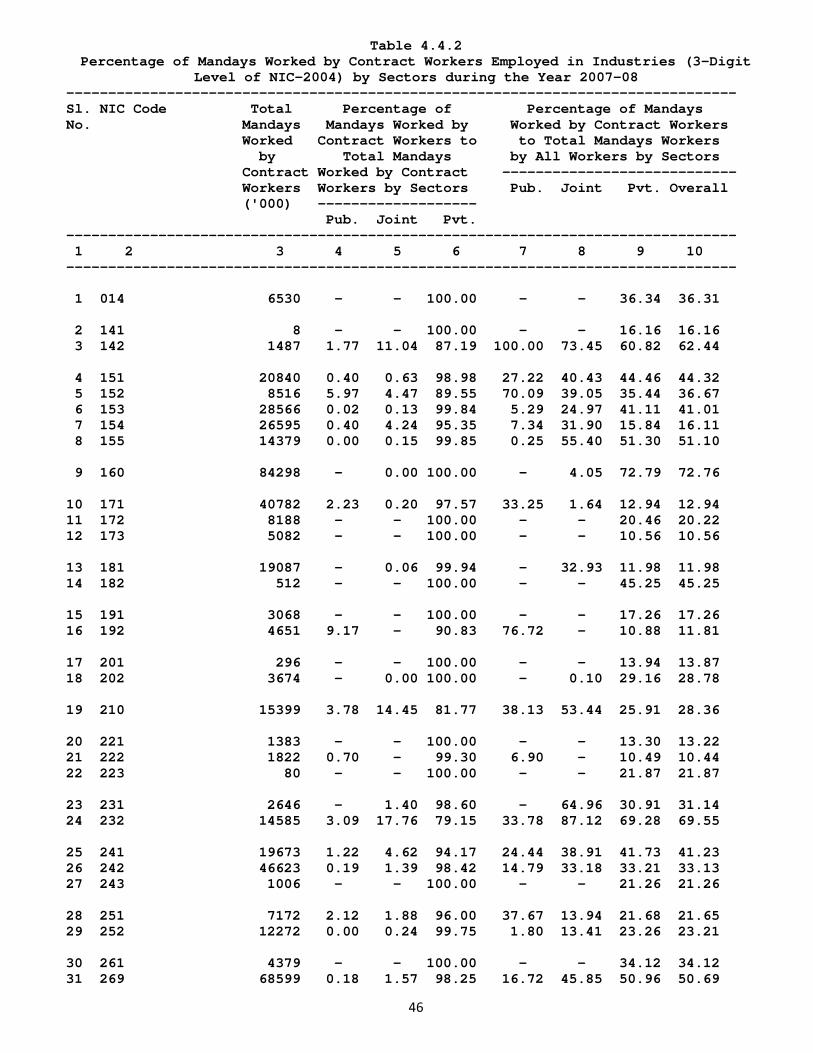
46
Table 4.4.2 Percentage of Mandays Worked by Contract Workers Employed in Industries (3-Digit
Level of NIC-2004) by Sectors during the Year 2007-08 -------------------------------------------------------------------------------- Sl. NIC Code Total Percentage of Percentage of Mandays No. Mandays Mandays Worked by Worked by Contract Workers Worked Contract Workers to to Total Mandays Workers by Total Mandays by All Workers by Sectors Contract Worked by Contract ---------------------------- Workers Workers by Sectors Pub. Joint Pvt. Overall ('000) ------------------- Pub. Joint Pvt. -------------------------------------------------------------------------------- 1 2 3 4 5 6 7 8 9 10 -------------------------------------------------------------------------------- 1 014 6530 - - 100.00 - - 36.34 36.31 2 141 8 - - 100.00 - - 16.16 16.16 3 142 1487 1.77 11.04 87.19 100.00 73.45 60.82 62.44 4 151 20840 0.40 0.63 98.98 27.22 40.43 44.46 44.32 5 152 8516 5.97 4.47 89.55 70.09 39.05 35.44 36.67 6 153 28566 0.02 0.13 99.84 5.29 24.97 41.11 41.01 7 154 26595 0.40 4.24 95.35 7.34 31.90 15.84 16.11 8 155 14379 0.00 0.15 99.85 0.25 55.40 51.30 51.10 9 160 84298 - 0.00 100.00 - 4.05 72.79 72.76 10 171 40782 2.23 0.20 97.57 33.25 1.64 12.94 12.94 11 172 8188 - - 100.00 - - 20.46 20.22 12 173 5082 - - 100.00 - - 10.56 10.56 13 181 19087 - 0.06 99.94 - 32.93 11.98 11.98 14 182 512 - - 100.00 - - 45.25 45.25 15 191 3068 - - 100.00 - - 17.26 17.26 16 192 4651 9.17 - 90.83 76.72 - 10.88 11.81 17 201 296 - - 100.00 - - 13.94 13.87 18 202 3674 - 0.00 100.00 - 0.10 29.16 28.78 19 210 15399 3.78 14.45 81.77 38.13 53.44 25.91 28.36 20 221 1383 - - 100.00 - - 13.30 13.22 21 222 1822 0.70 - 99.30 6.90 - 10.49 10.44 22 223 80 - - 100.00 - - 21.87 21.87 23 231 2646 - 1.40 98.60 - 64.96 30.91 31.14 24 232 14585 3.09 17.76 79.15 33.78 87.12 69.28 69.55 25 241 19673 1.22 4.62 94.17 24.44 38.91 41.73 41.23 26 242 46623 0.19 1.39 98.42 14.79 33.18 33.21 33.13 27 243 1006 - - 100.00 - - 21.26 21.26 28 251 7172 2.12 1.88 96.00 37.67 13.94 21.68 21.65 29 252 12272 0.00 0.24 99.75 1.80 13.41 23.26 23.21 30 261 4379 - - 100.00 - - 34.12 34.12 31 269 68599 0.18 1.57 98.25 16.72 45.85 50.96 50.69
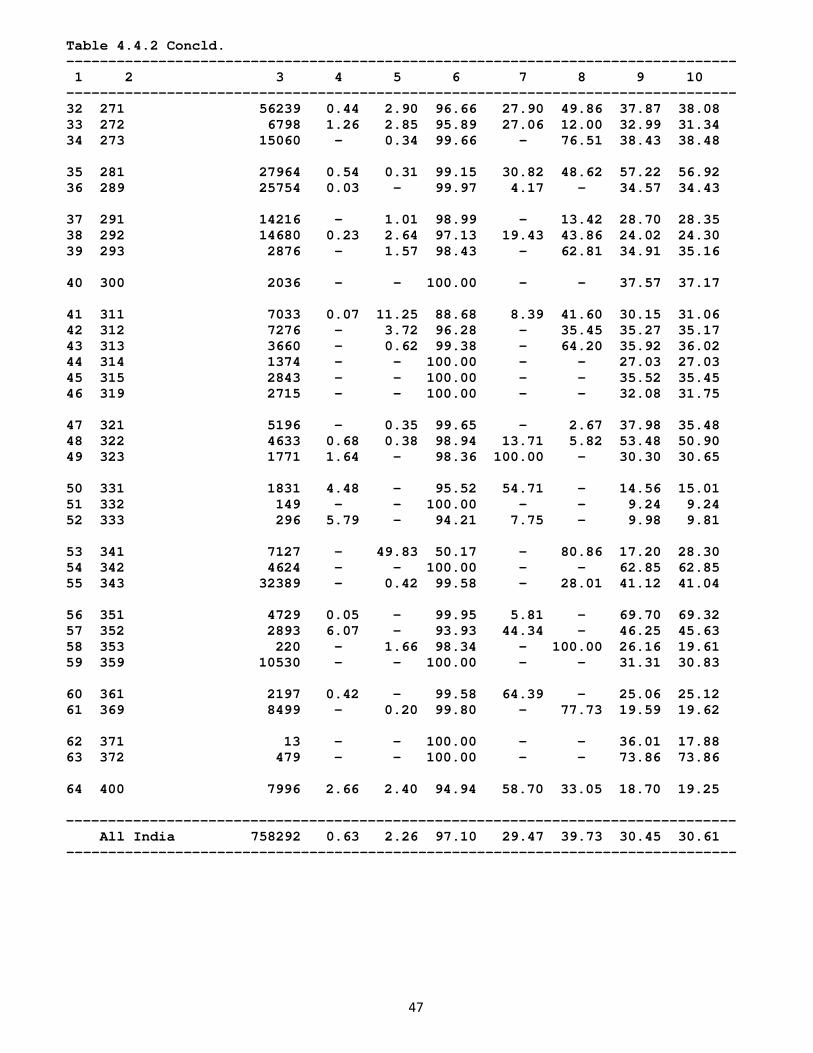
47
Table 4.4.2 Concld. -------------------------------------------------------------------------------- 1 2 3 4 5 6 7 8 9 10 -------------------------------------------------------------------------------- 32 271 56239 0.44 2.90 96.66 27.90 49.86 37.87 38.08 33 272 6798 1.26 2.85 95.89 27.06 12.00 32.99 31.34 34 273 15060 - 0.34 99.66 - 76.51 38.43 38.48 35 281 27964 0.54 0.31 99.15 30.82 48.62 57.22 56.92 36 289 25754 0.03 - 99.97 4.17 - 34.57 34.43 37 291 14216 - 1.01 98.99 - 13.42 28.70 28.35 38 292 14680 0.23 2.64 97.13 19.43 43.86 24.02 24.30 39 293 2876 - 1.57 98.43 - 62.81 34.91 35.16 40 300 2036 - - 100.00 - - 37.57 37.17 41 311 7033 0.07 11.25 88.68 8.39 41.60 30.15 31.06 42 312 7276 - 3.72 96.28 - 35.45 35.27 35.17 43 313 3660 - 0.62 99.38 - 64.20 35.92 36.02 44 314 1374 - - 100.00 - - 27.03 27.03 45 315 2843 - - 100.00 - - 35.52 35.45 46 319 2715 - - 100.00 - - 32.08 31.75 47 321 5196 - 0.35 99.65 - 2.67 37.98 35.48 48 322 4633 0.68 0.38 98.94 13.71 5.82 53.48 50.90 49 323 1771 1.64 - 98.36 100.00 - 30.30 30.65 50 331 1831 4.48 - 95.52 54.71 - 14.56 15.01 51 332 149 - - 100.00 - - 9.24 9.24 52 333 296 5.79 - 94.21 7.75 - 9.98 9.81 53 341 7127 - 49.83 50.17 - 80.86 17.20 28.30 54 342 4624 - - 100.00 - - 62.85 62.85 55 343 32389 - 0.42 99.58 - 28.01 41.12 41.04 56 351 4729 0.05 - 99.95 5.81 - 69.70 69.32 57 352 2893 6.07 - 93.93 44.34 - 46.25 45.63 58 353 220 - 1.66 98.34 - 100.00 26.16 19.61 59 359 10530 - - 100.00 - - 31.31 30.83 60 361 2197 0.42 - 99.58 64.39 - 25.06 25.12 61 369 8499 - 0.20 99.80 - 77.73 19.59 19.62 62 371 13 - - 100.00 - - 36.01 17.88 63 372 479 - - 100.00 - - 73.86 73.86 64 400 7996 2.66 2.40 94.94 58.70 33.05 18.70 19.25 -------------------------------------------------------------------------------- All India 758292 0.63 2.26 97.10 29.47 39.73 30.45 30.61 --------------------------------------------------------------------------------
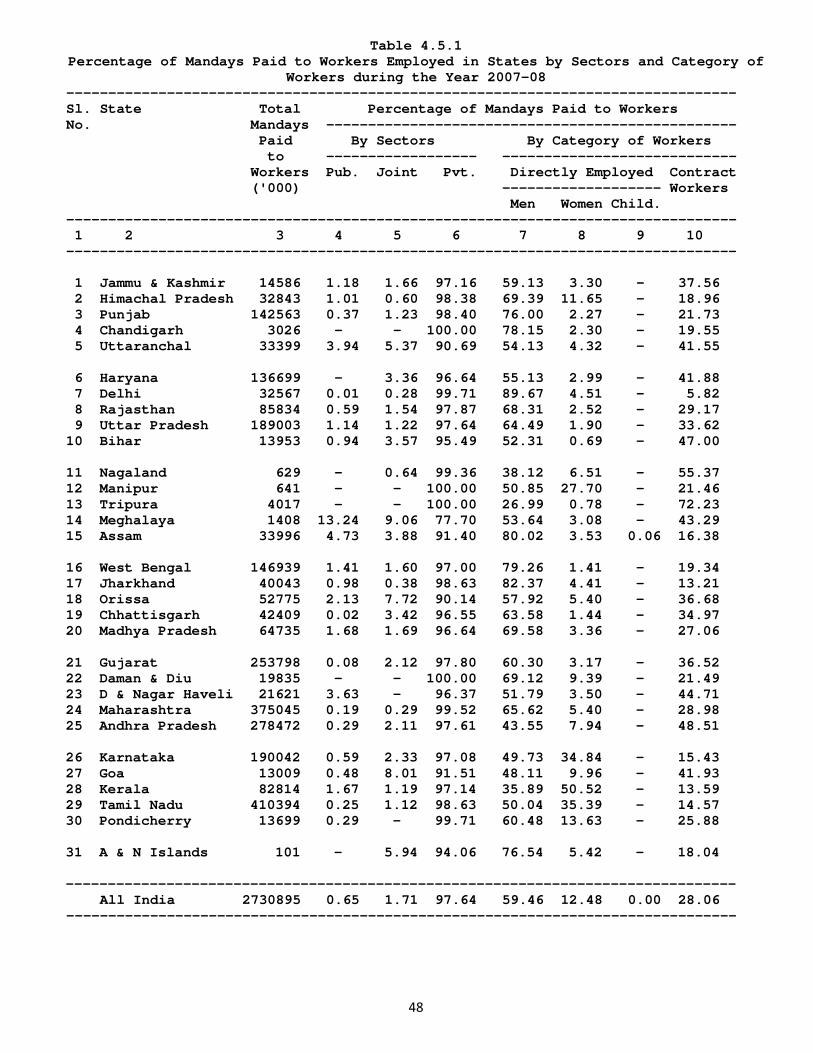
48
Table 4.5.1 Percentage of Mandays Paid to Workers Employed in States by Sectors and Category of
Workers during the Year 2007-08 -------------------------------------------------------------------------------- Sl. State Total Percentage of Mandays Paid to Workers No. Mandays ------------------------------------------------- Paid By Sectors By Category of Workers to ------------------ ---------------------------- Workers Pub. Joint Pvt. Directly Employed Contract ('000) ------------------- Workers Men Women Child. -------------------------------------------------------------------------------- 1 2 3 4 5 6 7 8 9 10 -------------------------------------------------------------------------------- 1 Jammu & Kashmir 14586 1.18 1.66 97.16 59.13 3.30 - 37.56 2 Himachal Pradesh 32843 1.01 0.60 98.38 69.39 11.65 - 18.96 3 Punjab 142563 0.37 1.23 98.40 76.00 2.27 - 21.73 4 Chandigarh 3026 - - 100.00 78.15 2.30 - 19.55 5 Uttaranchal 33399 3.94 5.37 90.69 54.13 4.32 - 41.55 6 Haryana 136699 - 3.36 96.64 55.13 2.99 - 41.88 7 Delhi 32567 0.01 0.28 99.71 89.67 4.51 - 5.82 8 Rajasthan 85834 0.59 1.54 97.87 68.31 2.52 - 29.17 9 Uttar Pradesh 189003 1.14 1.22 97.64 64.49 1.90 - 33.62 10 Bihar 13953 0.94 3.57 95.49 52.31 0.69 - 47.00 11 Nagaland 629 - 0.64 99.36 38.12 6.51 - 55.37 12 Manipur 641 - - 100.00 50.85 27.70 - 21.46 13 Tripura 4017 - - 100.00 26.99 0.78 - 72.23 14 Meghalaya 1408 13.24 9.06 77.70 53.64 3.08 - 43.29 15 Assam 33996 4.73 3.88 91.40 80.02 3.53 0.06 16.38 16 West Bengal 146939 1.41 1.60 97.00 79.26 1.41 - 19.34 17 Jharkhand 40043 0.98 0.38 98.63 82.37 4.41 - 13.21 18 Orissa 52775 2.13 7.72 90.14 57.92 5.40 - 36.68 19 Chhattisgarh 42409 0.02 3.42 96.55 63.58 1.44 - 34.97 20 Madhya Pradesh 64735 1.68 1.69 96.64 69.58 3.36 - 27.06 21 Gujarat 253798 0.08 2.12 97.80 60.30 3.17 - 36.52 22 Daman & Diu 19835 - - 100.00 69.12 9.39 - 21.49 23 D & Nagar Haveli 21621 3.63 - 96.37 51.79 3.50 - 44.71 24 Maharashtra 375045 0.19 0.29 99.52 65.62 5.40 - 28.98 25 Andhra Pradesh 278472 0.29 2.11 97.61 43.55 7.94 - 48.51 26 Karnataka 190042 0.59 2.33 97.08 49.73 34.84 - 15.43 27 Goa 13009 0.48 8.01 91.51 48.11 9.96 - 41.93 28 Kerala 82814 1.67 1.19 97.14 35.89 50.52 - 13.59 29 Tamil Nadu 410394 0.25 1.12 98.63 50.04 35.39 - 14.57 30 Pondicherry 13699 0.29 - 99.71 60.48 13.63 - 25.88 31 A & N Islands 101 - 5.94 94.06 76.54 5.42 - 18.04 -------------------------------------------------------------------------------- All India 2730895 0.65 1.71 97.64 59.46 12.48 0.00 28.06 --------------------------------------------------------------------------------
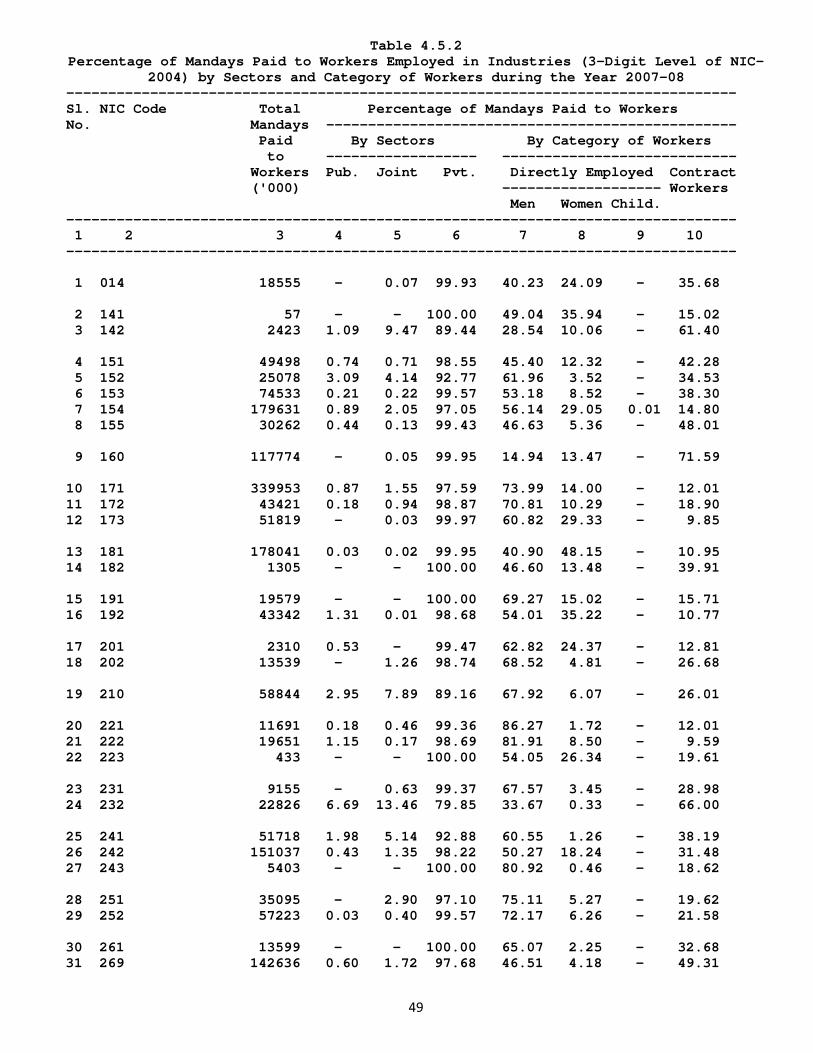
49
Table 4.5.2 Percentage of Mandays Paid to Workers Employed in Industries (3-Digit Level of NIC-
2004) by Sectors and Category of Workers during the Year 2007-08 -------------------------------------------------------------------------------- Sl. NIC Code Total Percentage of Mandays Paid to Workers No. Mandays ------------------------------------------------- Paid By Sectors By Category of Workers to ------------------ ---------------------------- Workers Pub. Joint Pvt. Directly Employed Contract ('000) ------------------- Workers Men Women Child. -------------------------------------------------------------------------------- 1 2 3 4 5 6 7 8 9 10 -------------------------------------------------------------------------------- 1 014 18555 - 0.07 99.93 40.23 24.09 - 35.68 2 141 57 - - 100.00 49.04 35.94 - 15.02 3 142 2423 1.09 9.47 89.44 28.54 10.06 - 61.40 4 151 49498 0.74 0.71 98.55 45.40 12.32 - 42.28 5 152 25078 3.09 4.14 92.77 61.96 3.52 - 34.53 6 153 74533 0.21 0.22 99.57 53.18 8.52 - 38.30 7 154 179631 0.89 2.05 97.05 56.14 29.05 0.01 14.80 8 155 30262 0.44 0.13 99.43 46.63 5.36 - 48.01 9 160 117774 - 0.05 99.95 14.94 13.47 - 71.59 10 171 339953 0.87 1.55 97.59 73.99 14.00 - 12.01 11 172 43421 0.18 0.94 98.87 70.81 10.29 - 18.90 12 173 51819 - 0.03 99.97 60.82 29.33 - 9.85 13 181 178041 0.03 0.02 99.95 40.90 48.15 - 10.95 14 182 1305 - - 100.00 46.60 13.48 - 39.91 15 191 19579 - - 100.00 69.27 15.02 - 15.71 16 192 43342 1.31 0.01 98.68 54.01 35.22 - 10.77 17 201 2310 0.53 - 99.47 62.82 24.37 - 12.81 18 202 13539 - 1.26 98.74 68.52 4.81 - 26.68 19 210 58844 2.95 7.89 89.16 67.92 6.07 - 26.01 20 221 11691 0.18 0.46 99.36 86.27 1.72 - 12.01 21 222 19651 1.15 0.17 98.69 81.91 8.50 - 9.59 22 223 433 - - 100.00 54.05 26.34 - 19.61 23 231 9155 - 0.63 99.37 67.57 3.45 - 28.98 24 232 22826 6.69 13.46 79.85 33.67 0.33 - 66.00 25 241 51718 1.98 5.14 92.88 60.55 1.26 - 38.19 26 242 151037 0.43 1.35 98.22 50.27 18.24 - 31.48 27 243 5403 - - 100.00 80.92 0.46 - 18.62 28 251 35095 - 2.90 97.10 75.11 5.27 - 19.62 29 252 57223 0.03 0.40 99.57 72.17 6.26 - 21.58 30 261 13599 - - 100.00 65.07 2.25 - 32.68 31 269 142636 0.60 1.72 97.68 46.51 4.18 - 49.31
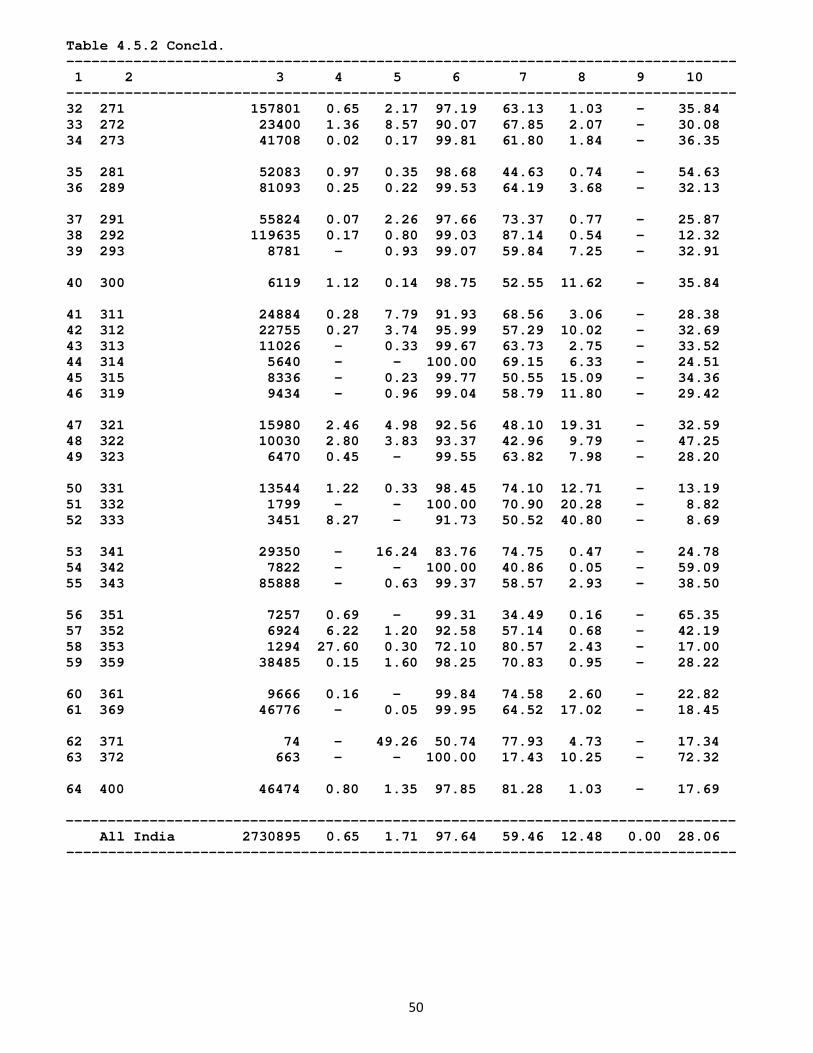
50
Table 4.5.2 Concld. -------------------------------------------------------------------------------- 1 2 3 4 5 6 7 8 9 10 -------------------------------------------------------------------------------- 32 271 157801 0.65 2.17 97.19 63.13 1.03 - 35.84 33 272 23400 1.36 8.57 90.07 67.85 2.07 - 30.08 34 273 41708 0.02 0.17 99.81 61.80 1.84 - 36.35 35 281 52083 0.97 0.35 98.68 44.63 0.74 - 54.63 36 289 81093 0.25 0.22 99.53 64.19 3.68 - 32.13 37 291 55824 0.07 2.26 97.66 73.37 0.77 - 25.87 38 292 119635 0.17 0.80 99.03 87.14 0.54 - 12.32 39 293 8781 - 0.93 99.07 59.84 7.25 - 32.91 40 300 6119 1.12 0.14 98.75 52.55 11.62 - 35.84 41 311 24884 0.28 7.79 91.93 68.56 3.06 - 28.38 42 312 22755 0.27 3.74 95.99 57.29 10.02 - 32.69 43 313 11026 - 0.33 99.67 63.73 2.75 - 33.52 44 314 5640 - - 100.00 69.15 6.33 - 24.51 45 315 8336 - 0.23 99.77 50.55 15.09 - 34.36 46 319 9434 - 0.96 99.04 58.79 11.80 - 29.42 47 321 15980 2.46 4.98 92.56 48.10 19.31 - 32.59 48 322 10030 2.80 3.83 93.37 42.96 9.79 - 47.25 49 323 6470 0.45 - 99.55 63.82 7.98 - 28.20 50 331 13544 1.22 0.33 98.45 74.10 12.71 - 13.19 51 332 1799 - - 100.00 70.90 20.28 - 8.82 52 333 3451 8.27 - 91.73 50.52 40.80 - 8.69 53 341 29350 - 16.24 83.76 74.75 0.47 - 24.78 54 342 7822 - - 100.00 40.86 0.05 - 59.09 55 343 85888 - 0.63 99.37 58.57 2.93 - 38.50 56 351 7257 0.69 - 99.31 34.49 0.16 - 65.35 57 352 6924 6.22 1.20 92.58 57.14 0.68 - 42.19 58 353 1294 27.60 0.30 72.10 80.57 2.43 - 17.00 59 359 38485 0.15 1.60 98.25 70.83 0.95 - 28.22 60 361 9666 0.16 - 99.84 74.58 2.60 - 22.82 61 369 46776 - 0.05 99.95 64.52 17.02 - 18.45 62 371 74 - 49.26 50.74 77.93 4.73 - 17.34 63 372 663 - - 100.00 17.43 10.25 - 72.32 64 400 46474 0.80 1.35 97.85 81.28 1.03 - 17.69 -------------------------------------------------------------------------------- All India 2730895 0.65 1.71 97.64 59.46 12.48 0.00 28.06 --------------------------------------------------------------------------------
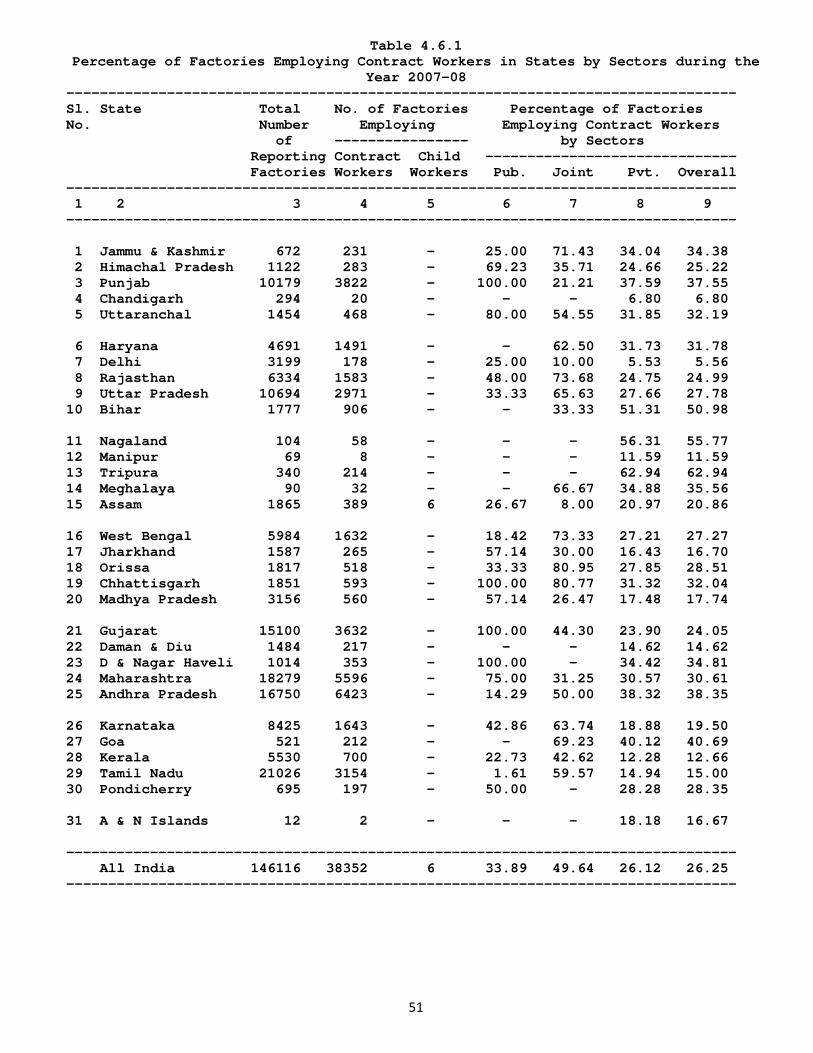
51
Table 4.6.1 Percentage of Factories Employing Contract Workers in States by Sectors during the
Year 2007-08 -------------------------------------------------------------------------------- Sl. State Total No. of Factories Percentage of Factories No. Number Employing Employing Contract Workers of ---------------- by Sectors Reporting Contract Child ------------------------------ Factories Workers Workers Pub. Joint Pvt. Overall -------------------------------------------------------------------------------- 1 2 3 4 5 6 7 8 9 -------------------------------------------------------------------------------- 1 Jammu & Kashmir 672 231 - 25.00 71.43 34.04 34.38 2 Himachal Pradesh 1122 283 - 69.23 35.71 24.66 25.22 3 Punjab 10179 3822 - 100.00 21.21 37.59 37.55 4 Chandigarh 294 20 - - - 6.80 6.80 5 Uttaranchal 1454 468 - 80.00 54.55 31.85 32.19 6 Haryana 4691 1491 - - 62.50 31.73 31.78 7 Delhi 3199 178 - 25.00 10.00 5.53 5.56 8 Rajasthan 6334 1583 - 48.00 73.68 24.75 24.99 9 Uttar Pradesh 10694 2971 - 33.33 65.63 27.66 27.78 10 Bihar 1777 906 - - 33.33 51.31 50.98 11 Nagaland 104 58 - - - 56.31 55.77 12 Manipur 69 8 - - - 11.59 11.59 13 Tripura 340 214 - - - 62.94 62.94 14 Meghalaya 90 32 - - 66.67 34.88 35.56 15 Assam 1865 389 6 26.67 8.00 20.97 20.86 16 West Bengal 5984 1632 - 18.42 73.33 27.21 27.27 17 Jharkhand 1587 265 - 57.14 30.00 16.43 16.70 18 Orissa 1817 518 - 33.33 80.95 27.85 28.51 19 Chhattisgarh 1851 593 - 100.00 80.77 31.32 32.04 20 Madhya Pradesh 3156 560 - 57.14 26.47 17.48 17.74 21 Gujarat 15100 3632 - 100.00 44.30 23.90 24.05 22 Daman & Diu 1484 217 - - - 14.62 14.62 23 D & Nagar Haveli 1014 353 - 100.00 - 34.42 34.81 24 Maharashtra 18279 5596 - 75.00 31.25 30.57 30.61 25 Andhra Pradesh 16750 6423 - 14.29 50.00 38.32 38.35 26 Karnataka 8425 1643 - 42.86 63.74 18.88 19.50 27 Goa 521 212 - - 69.23 40.12 40.69 28 Kerala 5530 700 - 22.73 42.62 12.28 12.66 29 Tamil Nadu 21026 3154 - 1.61 59.57 14.94 15.00 30 Pondicherry 695 197 - 50.00 - 28.28 28.35 31 A & N Islands 12 2 - - - 18.18 16.67 -------------------------------------------------------------------------------- All India 146116 38352 6 33.89 49.64 26.12 26.25 --------------------------------------------------------------------------------
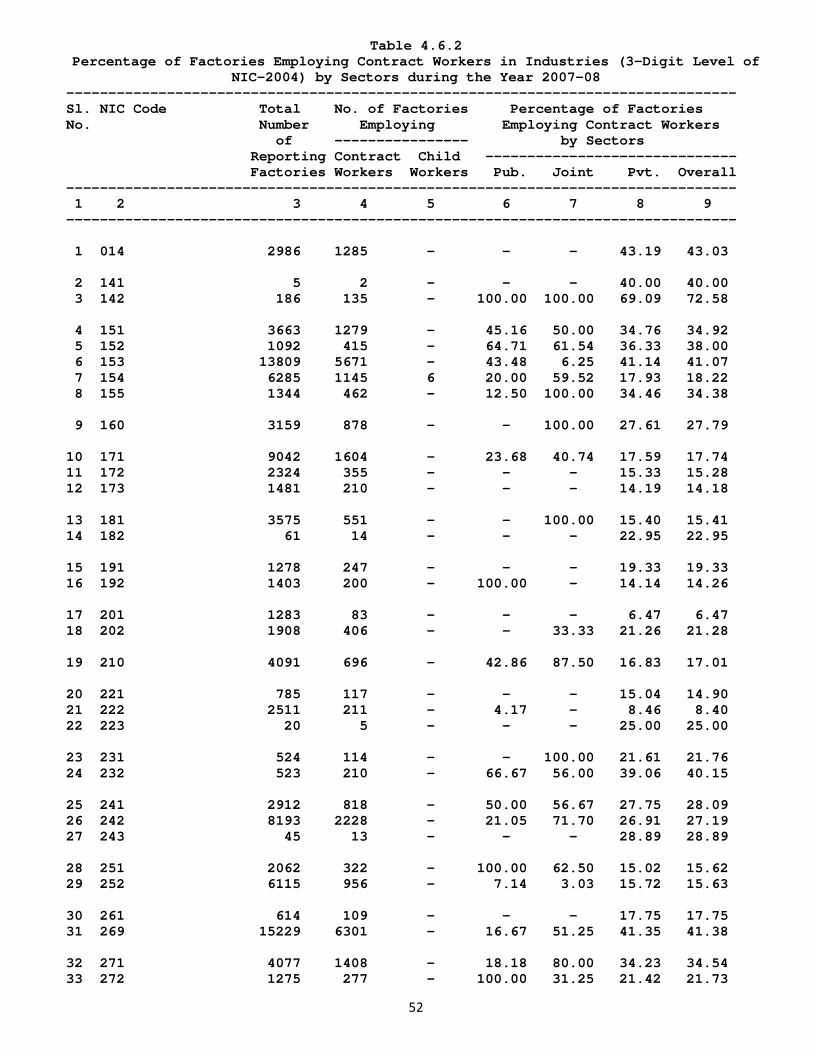
52
Table 4.6.2 Percentage of Factories Employing Contract Workers in Industries (3-Digit Level of
NIC-2004) by Sectors during the Year 2007-08 -------------------------------------------------------------------------------- Sl. NIC Code Total No. of Factories Percentage of Factories No. Number Employing Employing Contract Workers of ---------------- by Sectors Reporting Contract Child ------------------------------ Factories Workers Workers Pub. Joint Pvt. Overall -------------------------------------------------------------------------------- 1 2 3 4 5 6 7 8 9 -------------------------------------------------------------------------------- 1 014 2986 1285 - - - 43.19 43.03 2 141 5 2 - - - 40.00 40.00 3 142 186 135 - 100.00 100.00 69.09 72.58 4 151 3663 1279 - 45.16 50.00 34.76 34.92 5 152 1092 415 - 64.71 61.54 36.33 38.00 6 153 13809 5671 - 43.48 6.25 41.14 41.07 7 154 6285 1145 6 20.00 59.52 17.93 18.22 8 155 1344 462 - 12.50 100.00 34.46 34.38 9 160 3159 878 - - 100.00 27.61 27.79 10 171 9042 1604 - 23.68 40.74 17.59 17.74 11 172 2324 355 - - - 15.33 15.28 12 173 1481 210 - - - 14.19 14.18 13 181 3575 551 - - 100.00 15.40 15.41 14 182 61 14 - - - 22.95 22.95 15 191 1278 247 - - - 19.33 19.33 16 192 1403 200 - 100.00 - 14.14 14.26 17 201 1283 83 - - - 6.47 6.47 18 202 1908 406 - - 33.33 21.26 21.28 19 210 4091 696 - 42.86 87.50 16.83 17.01 20 221 785 117 - - - 15.04 14.90 21 222 2511 211 - 4.17 - 8.46 8.40 22 223 20 5 - - - 25.00 25.00 23 231 524 114 - - 100.00 21.61 21.76 24 232 523 210 - 66.67 56.00 39.06 40.15 25 241 2912 818 - 50.00 56.67 27.75 28.09 26 242 8193 2228 - 21.05 71.70 26.91 27.19 27 243 45 13 - - - 28.89 28.89 28 251 2062 322 - 100.00 62.50 15.02 15.62 29 252 6115 956 - 7.14 3.03 15.72 15.63 30 261 614 109 - - - 17.75 17.75 31 269 15229 6301 - 16.67 51.25 41.35 41.38 32 271 4077 1408 - 18.18 80.00 34.23 34.54 33 272 1275 277 - 100.00 31.25 21.42 21.73
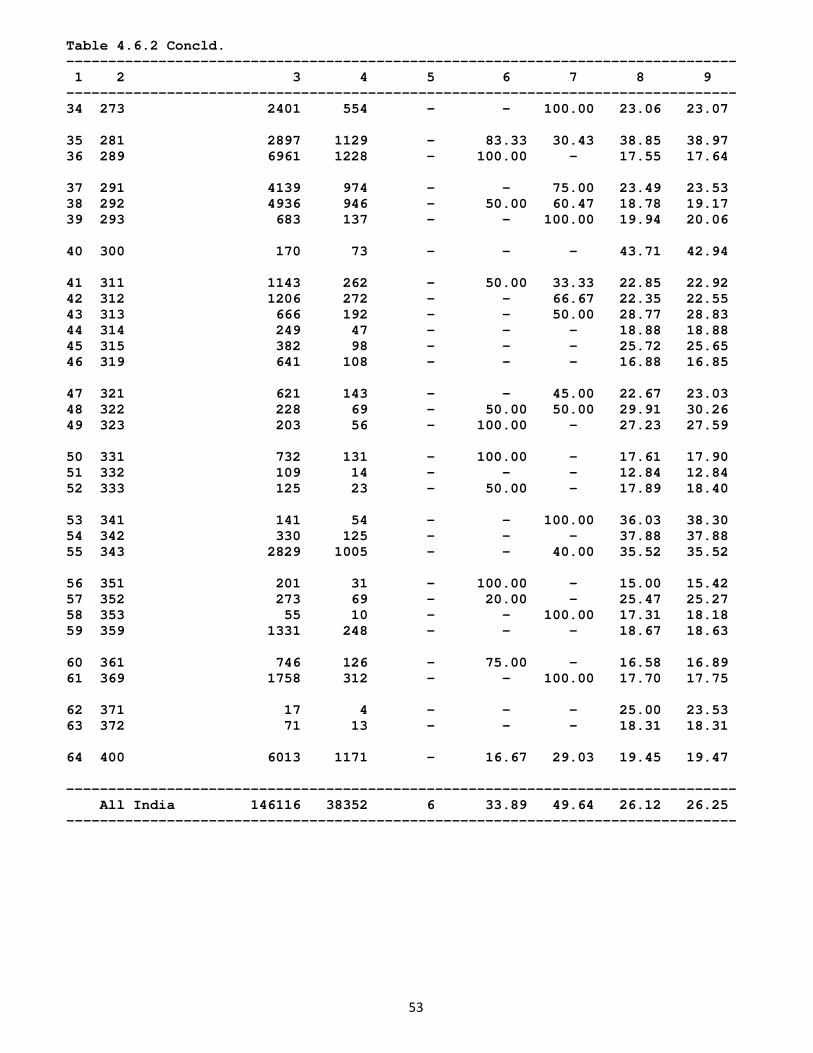
53
Table 4.6.2 Concld. -------------------------------------------------------------------------------- 1 2 3 4 5 6 7 8 9 -------------------------------------------------------------------------------- 34 273 2401 554 - - 100.00 23.06 23.07 35 281 2897 1129 - 83.33 30.43 38.85 38.97 36 289 6961 1228 - 100.00 - 17.55 17.64 37 291 4139 974 - - 75.00 23.49 23.53 38 292 4936 946 - 50.00 60.47 18.78 19.17 39 293 683 137 - - 100.00 19.94 20.06 40 300 170 73 - - - 43.71 42.94 41 311 1143 262 - 50.00 33.33 22.85 22.92 42 312 1206 272 - - 66.67 22.35 22.55 43 313 666 192 - - 50.00 28.77 28.83 44 314 249 47 - - - 18.88 18.88 45 315 382 98 - - - 25.72 25.65 46 319 641 108 - - - 16.88 16.85 47 321 621 143 - - 45.00 22.67 23.03 48 322 228 69 - 50.00 50.00 29.91 30.26 49 323 203 56 - 100.00 - 27.23 27.59 50 331 732 131 - 100.00 - 17.61 17.90 51 332 109 14 - - - 12.84 12.84 52 333 125 23 - 50.00 - 17.89 18.40 53 341 141 54 - - 100.00 36.03 38.30 54 342 330 125 - - - 37.88 37.88 55 343 2829 1005 - - 40.00 35.52 35.52 56 351 201 31 - 100.00 - 15.00 15.42 57 352 273 69 - 20.00 - 25.47 25.27 58 353 55 10 - - 100.00 17.31 18.18 59 359 1331 248 - - - 18.67 18.63 60 361 746 126 - 75.00 - 16.58 16.89 61 369 1758 312 - - 100.00 17.70 17.75 62 371 17 4 - - - 25.00 23.53 63 372 71 13 - - - 18.31 18.31 64 400 6013 1171 - 16.67 29.03 19.45 19.47 -------------------------------------------------------------------------------- All India 146116 38352 6 33.89 49.64 26.12 26.25 --------------------------------------------------------------------------------
54
CHAPTER-V
LABOUR COST
Labour cost is one of the most significant parameter for assessing the economic viability of any industrial activity by an entrepreneur before venturing into the industrial field. It provides vital information with regard to the extent of expenditure incurred by entrepreneurs on labour welfare and social security aspects, in addition to wages/salaries paid to them which adequately equips the fresher in choosing the suitable field and proper area as also in planning the industrial project and its proper manoeuvreance. Further, it helps in (a) reliable costing, (b) wage fixation on a realistic basis, (c) logical collective bargaining, (d) evolving, implementation and evaluation of welfare measures, (e) study of trends over a period of time, (f) location of industry and the like. Labour Cost data is also important for policy formulation at the national and regional levels. With this end in view, data on various aspects of labour cost is collected every year which, inter-alia, include the expenses incurred by the industrial establishments on account of wages/salaries to their employees, bonus (profit sharing bonus, festival bonus, etc.), contributions to provident and other funds and workmen and staff welfare expenses in respect of all employees employed directly or through contractors. The aggregate of these components add up to the labour cost, when used in conjunction with the number of mandays worked, this gives the average labour cost per manday worked.
5.1 Average Labour Cost State-wise and Industry-wise data on average Labour Cost per manday worked for all employees during the year 2007-08 are given in Tables 5.1.1 and 5.1.2, respectively. The Tables reveal that at All India level, the average labour cost per manday worked in respect of all employees was recorded at Rs. 397.55. Component wise, the employers, on an average for each manday worked by an average employee, spent Rs. 317.48 on wages/salaries, Rs. 17.80 on bonus, Rs. 35.18 as a contribution towards the employees’ provident and other funds and Rs. 27.08 towards workmen and staff welfare expenses. The average labour cost per manday worked in manufacturing industries belonging to the Public Sector was Rs. 773.68 as compared to Rs. 777.06 in the Joint Sector and Rs. 387.49 in the Private Sector.
5.2 Average Labour Cost by States
Table 5.1.1 reveals that the highest average labour cost per manday worked in respect of all employees was reported at Rs. 835.12 in Jharkhand, followed by Rs. 644.75 in Chhattisgarh and Rs. 575.88 in Maharashtra. The lowest average labour cost per manday worked in respect of all employees was reported at Rs. 101.90 in Manipur, followed by Rs. 109.91 in Nagaland and Rs. 128.87 in Tripura.
5.3 Average Labour Cost by Industries Industry-wise data presented in Table 5.1.2 reflects exceptionally very high labour cost per manday worked at Rs. 1387.87 in the industry group ‘353-Manufacture of aircraft and spacecraft’, followed by industry groups ‘341-Manufacture of motor vehicle’ (Rs. 1123.52) and ‘232-Manufacture of refined petroleum products’ (Rs.975.05). The lowest average labour cost per manday worked was reported at Rs. 103.57 in the industry group ‘160-Manufacture of tobacco products’ ‘014- Agricultural and animal husbandry service activities
55
except veterinary activities’ (Rs. 135.56) and ‘141-Quarying of sand clay and sand (Rs. 137.47).
5.4 Percentage of Components of Labour Cost
State-wise and Industry-wise break up of proportion of various
components of labour cost on employees, viz., (i) wages/salaries; (ii) bonus; (iii) contribution to provident and other funds, and (iv) workmen and staff welfare expenses, to total labour cost on employees has been depicted in Tables 5.2.1 and 5.2.2, respectively.
At the All India level, the total Labour Cost on Employees stood at Rs.
12502431 lakh. The share of different components of labour cost to Total Labour Cost worked out to be 79.86 per cent on wages/salaries, 4.48 per cent on bonus, 8.85 per cent on provident and other funds and 6.81 per cent towards staff welfare expenses. Across the States, the share of wages/salaries in the labour cost was highest at 94.85 per cent in Manipur followed by A & N Islands with 85.82 per cent. The share of wages/salaries in the labour cost was the lowest at 74.34 per cent in Jharkhand followed by West Bengal (74.66 per cent).
The contribution of bonus to total labour cost was 6 per cent or more
in Nagaland, Kerala and Tamil Nadu and Daman Diu less than 2 per cent in Manipur and Orissa. The proportion of provident and other funds in total labour cost was highest (14.98 per cent) in West Bengal whereas the lowest (0.57 per cent) was reported in Manipur. The highest proportion of staff welfare expenses in total labour cost was reported (11.76 per cent) in Chhattisgarh and the lowest (2.52 per cent) in A & N Islands.
In all the industry groups, the proportion of wages/salaries to total
labour cost was reported to be between 70 to 90 per cent. Three industry groups, viz., ‘014-Agricultural and animal husbandry service activities, except veterinary activities’, ‘201-Saw milling and planning of wood’ and ‘372-Recycling of non-metal waste and scrap articles and used non metallic items’ reported more than 90 per cent of the share of wages/salaries to the total labour cost.
The contribution of bonus in the total labour cost was highest at 8.13
per cent in the industry group ‘223’- Reproduction of recorded media and the lowest share of 0.62 percent was recorded in industry group,’ 371’- Recycling of non-metal waste and scrap’. The percentage contribution of provident and other funds to total labour cost was highest at 15.38 per cent in industry group ‘223–Reproduction of recorded media and the lowest at 2.02 per cent in industry group ‘372-Recycling of non-metal waste and scrap. The share of staff welfare expenses in total labour cost was highest at 12.34 per cent in industry group ‘251-Manufacture of rubber products and lowest at 1.07 percent in industry group,’014’Agricultural and animal husbandry service activities ,except veterinary activities.
5.5 Percentage of Labour Cost to Total Cost of Production
Labour cost is one of the important components of the total cost of production in any industrial establishment. The percentage of labour cost on employees to the total cost of production indicates the contribution made by labour in the economy of the country. In rapidly changing scenario of the world economy in terms of liberalisation, privatisation, globalisation and modernisation, the percentage share of labour cost to total cost of production is bound to change unambiguously over a period of time. The time
56
series data on the percentage of labour cost to total cost of production may be of immense use in overall economic planning, adoption of labour policies and programmes. With this end in view, State-wise and Industry-wise data on percentage share of labour cost to total cost of production in different sectors have been collected and presented in Tables 5.3.1 and 5.3.2, respectively.
Table 5.3.1 reveals that at all India level, labour cost constituted
5.41 per cent of the total cost of production during the year 2007-08. The proportion of labour cost to total cost of production was 3.26 per cent in the Public Sector, 4.51 per cent in the Joint Sector and 5.50 per cent in the Private Sector.
Among States, the highest proportion of labour cost on employees to
total cost of production was reported in Manipur at 13.25 per cent followed by Tripura at 9.47 per cent, Jharkhand at 9.43 per cent, Chandigarh at 8.87 per cent and Orissa at 8.77 per cent. On the other hand, the lowest percentage of labour cost to total cost of production was reported 2.03 in Bihar State.
In the Public Sector, the percentage of labour cost to total cost of
production was more than 10 per cent in 15 States/Union Territories, whereas it was less than 5 per cent in only 4 States/UTs. In the Joint Sector, the percentage of labour cost was recorded to be more than 10 per cent in 14 States/Union Territories, whereas it was less than 5 per cent in 7 States/Union Territories. In the Private Sector, the percentage of labour cost was recorded between 5 to 10 per cent in 16 States/Union Territories, whereas it was less than 5 per cent in 14 States/Union Territories and more than 10 per cent in only one State i.e. Manipur.
Industry-wise and Sector-wise percentage of labour cost to total cost
of production is presented in Table 5.3.2. The proportion of labour cost to total cost of production was recorded to be highest at 31.90 per cent in industry group ‘353-Mining and quarrying n.e.c.’ followed by ‘333-Manufacture of watches and clothes’ with 25.57 per cent. The lowest proportion of 0.71 per cent was reported in industry group ‘232-Manufacture of refined petroleum products’ followed by the industry groups, ‘151-Production, processing & preservation of meat, fish, fruit, vegetables, oils and fats’ (1.56 per cent) and ‘014-Agriculture and animal husbandry service activities, except veterinary activities’ (1.76 per cent). The percentage of labour cost to total cost of production was reported to be more than 20 per cent in only three industry groups, between 10 to 20 per cent in 11 industry groups, between 5 to 10 per cent in 36 industry groups and less than 5 per cent in 14 industry groups.
In the Public Sector, the percentage of labour cost to total cost of
production was more than 20 per cent in 17 industry groups, whereas it was less than 5 per cent in 4 industry groups. In the Joint Sector, the percentage of labour cost was recorded to be more than 10 per cent in 30 industry groups whereas it was less than 5 per cent in 12 industry groups. In the Private Sector, the percentage of labour cost was recorded less than 5 per cent in 14 industry groups, between 5 to 10 per cent in 36 industry groups, between 10 to 20 per cent in 16 industry groups and more than 20 per cent in only three industry groups. It has been observed that the percentage of labour cost to total cost of production was on the higher side in the Public and the Joint Sectors, whereas it was on the lower side in the Private Sector establishments in majority of the industry groups.
57
5.6 Wages/Salaries
State-wise and Industry-wise data on wages/salaries component of labour cost per manday worked is presented in Tables 5.4.1 and 5.4.2, respectively. The Tables reveal that at all India level, labour cost on account of the wages/salaries per manday worked were Rs. 205.98 for all workers and Rs. 317.48 for all employees taken together, Rs. 255.19 for men, Rs. 122.06 for women, Rs. 30.12 for child workers and Rs. 149.71 for contract workers, The wages/salaries per manday worked for all employees was the highest at Rs. 594.50 in the Joint Sector followed by Rs. 589.92 in the Public Sector and Rs. 310.16 in the Private Sector.
The States/Union Territories, wherein wages/salaries paid to its
employees more than Rs. 300, were H1machal Pradesh, Jharkhand, Chhattisgarh, Maharashtra, Goa, Chandigarh, Uttaranchal, Haryana, Orissa, Delhi, Madhya Pradesh, Gujarat, Daman & Diu, Karnataka, and Pondicherry. The highest wages/salaries per manday paid to all workers were reported in Jharkhand at Rs. 481.13, followed by Maharashtra (Rs. 282.29) and Goa (Rs. 279.29. Among male workers, the highest wages/salaries per manday worked were reported at Rs. 534.89 in Jharkhand and the lowest at Rs. 93.67 in Manipur. Among women workers, the highest and lowest wages/salaries per manday worked was reported at Rs. 542.74 in Jharkhand and Rs. 67.27 in Tripura, respectively. For contract workers, wages/salaries per manday worked was found to be the highest at Rs. 275.48 in Andaman & Nicobar and the lowest at Rs. 70.84 in Nagaland.
It has been observed that the wages/salaries per manday worked were
generally recorded to be the lowest in the North-Eastern States/Union Territories except Meghalaya and Assam for all categories of employees. Under the category of directly employed workers, the wages/salaries per mandays worked of women workers was reported to be more than that of their male counterparts in Chandigarh, Meghalaya and Jharkhand.
Among Industries, the main components of labour cost viz. wages/
salaries paid per manday worked to all workers was reported to be the highest at Rs. 871.17 in industry group ‘353–Manufacture of aircraft and spacecraft’ followed by industry groups ‘232-Manufacture of refined petroleum products’ (Rs. 509.70) and ‘341-Manufacture of motor vehicles’ (Rs. 503.82), whereas it was lowest at Rs. 72.02 in industry group ‘160-Manufacture of tobacco products’, followed by industry groups ‘141-Quarrying of stone and sand and clay’ (Rs.101.39) and ‘014-Agricultural animal husbandry service activities, except veterinary activities’ (Rs. 106.81).
The highest wages/salaries paid per manday worked to women workers was
reported at Rs. 844.86 in industry group ‘341–Manufacture of motor vehicles’ followed by industry groups, ‘232-Manufacture of refined petroleum products’ (Rs.830.02) and ‘353-Mining and quarrying n.e.c.’ (Rs. 785.49), whereas it was lowest at Rs. 69.85 in industry group ‘160-Manufacture of tobacco products’371-Recycling of metal waste and scrap’ followed by industry group (Rs. 78.39) ‘154- Manufacture of other food products, (84.80),‘014- Agricultural and animal husbandry service activities, except veterinary activities’ (Rs. 88.83), ‘153- Manufacture of grain mill products, starches and starch products, and prepared animal feeds’ (Rs. 89.55) and ‘142-Mining and quarrying, n.e.c.’,(91.55).
The average wages/salaries paid per mandays worked to women workers was
higher than that of their male counterparts in 6 industries groups, viz., ‘231-Manufacture of coke oven products’, ‘271-Manufacture of basic iron and steel’, ‘272-Manufacture of basic precious and non-ferrous metals’ and ‘341-
58
Manufacture of motor vehicle’, ‘323-Manufacture of television and radio receivers, sound or video recording or reproducing apparatus, and associated goods’, ‘331-Manufacture of medical appliances and instruments and appliances for measuring, checking, testing, navigating and other purposes except optical instruments’.
5.7 Average Daily Earnings
The average daily earnings have been defined as the wages/salaries per manday paid for. State-wise and industry-wise statistics on average daily earnings of workers during the year 2007-08 are presented in Tables 5.5.1 and 5.5.2, respectively. The Tables show that at all India level, the average daily earnings were recorded to be Rs. 220.68 for men, Rs. 112.77 for women, Rs. 56.49 for children, Rs. 148.17 for contract workers, Rs. 186.86 for all workers and Rs. 277.55 for all employees. At all India level, the average daily earnings by workers were reported at Rs. 398.67 in the Public Sector, Rs. 377.76 in the Joint Sector and Rs. 182.11 in the Private Sector.
The highest amount of average daily earnings for male workers was
reported at Rs. 501.19 in Jharkhand and the lowest at Rs. 93.28 in Manipur. The average daily earnings for women workers were the highest at Rs. 524.61 in Jharkhand, whereas it was reported to be lowest at Rs. 59.67 in Himachal Pradesh. Among all the State/Union Territories, the average daily earnings of contract workers were reported to be the highest at Rs. 267.12 in Andaman & Nicobar Islands, followed by Meghalaya (Rs. 215.25) and the lowest at Rs. 70.83 in Nagaland followed by Tripura (Rs. 76.00), Manipur (Rs. 92.66)and in Andhra Pradesh (Rs. 98.55). It has further been observed that the average daily earnings were recorded more or less the lowest in the North-Eastern States/Union Territories except Meghalaya and Assam.
Directly employed women workers were reported to be earning more than
their male counterparts in Union Territory of Chandigarh, Meghalaya and Jharkhand.
At the industry level, the highest average daily earnings for all workers was reported at Rs. 753.81 in industry group ‘353-Manufacture of aircraft and spacecraft’ followed by industry groups ‘232-Manufacture of refined petroleum products’ (Rs. 468.31) and ‘371-Recycling of metal waste and scrap’ (Rs.437.44) and lowest at Rs. 94.24 in industry group ‘141-Quarrying of stone, sand and clay’. For contract workers, the highest average daily earnings was reported at Rs. 284.72 in industry group ‘351-Building and repair of ships & boats’ and lowest at Rs. 55.73 in industry group ‘160-Manufacture of tobacco products’. For women worker, the highest average daily earnings was reported at Rs. 801.07 in industry group ‘341–Manufacture of motor vehicles’ and the lowest in industry group ‘160-Manufacture of tobacco products’ (Rs. 68.85).
The average daily earnings of women workers was higher than that of
their male counterparts in 7 industries groups, viz., ‘231-Manufacture of coke oven products’, ‘271-Manufacture of basic iron and steel’, ‘272-Manufacture of basic precious and non-ferrous metals casting of metals’, ‘281-Manufacture of structural metal products, tanks, reservoirs and steam generators’, ‘292-Manufacture of special purpose machinery’, ‘331-Manufacture of medical appliances and instruments and appliances for measuring, checking, testing, navigating and other purposes except optical instruments’, and industry group ‘341-Manufacture of motor vehicles’.
59
Average daily earnings of employees by State and industry have been presented in Tables 5.6.1 and 5.6.2, respectively. At all India level, the average daily earnings was Rs. 798.29 for supervisory & managerial staff, Rs. 339.51 for other staff as compared to Rs. 201.95 for directly employed workers, Rs. 148.17 for contract workers, Rs. 186.86 for all workers and Rs. 277.55 for all employees.
For supervisory and managerial staff, the average daily earnings was
highest in the Public Sector at Rs. 1257.77, followed by the Joint Sector (Rs. 1167.52) and the Private Sector (Rs. 783.66). At the State level, the highest average daily earnings for supervisory and managerial staff was reported at Rs. 1689.48 in Chhattisgarh and the lowest at Rs. 199.43 in Manipur.
For other staff, the highest average earnings was reported at Rs.
525.31 in the Joint Sector, followed by the Public Sector (Rs. 503.72) and the Private Sector (Rs. 335.21). At State level, the highest and lowest average daily earnings for other staff were reported at Rs. 620.28 in Jharkhand and Rs. 106.62 in Nagaland, respectively.
For the directly employed workers, the highest and lowest average daily
earnings were reported at Rs. 502.38 in Jharkhand and Rs. 87.61 in Manipur, respectively.
For all categories of employees, the highest average daily earnings
were reported in the Public Sector (Rs.536.32), followed by the Joint Sector (Rs.535.03) and the private Sector (Rs.270.92).
At the industry level, the highest average daily earnings was reported
in the industry group ‘232-Manufacture of refined petroleum products’ at Rs. 943.60 for Directly employed workers, Rs.2533.20 for supervisory and managerial staff in industry group ‘323-Manufacture of television and radio receivers, sound or video recording or reproducing apparatus and associated goods’, Rs.753.81 for all workers, Rs. 1338.75 for other staff and Rs. 1000.56 for all employees, respectively in the industry group ‘353-Manufacture of aircraft and spacecraft’. The lowest average daily earnings for directly employed workers, Rs. 95.29 in industry group ‘141-Quarrying of stone, sand and clay’, supervisory and managerial staff Rs. 165.23 in industry group ‘141-Quarrying of stone and sand and clay’ and for other staff Rs. 122.37 in industry group ‘014-Agricultural and animal husbandry service activities except veterinary activities’ respectively. For contract workers, all workers and all employees, the lowest average daily earnings were reported as Rs. 55.73, Rs. 70.83 and Rs. 82.72 in the industry group ‘160-Manufacture of Tobacco Products’ and Rs.113.26, 103.51 and 119.79 in the industry group ‘014- Agricultural and animal husbandry service activities, except veterinary activities’.
5.8 Percentage of Factories paying/incurring Expenses on
Bonus, Provident Funds and Welfare Funds
State-wise and industries-wise data on percentage of factories paying/incurring expenses on bonus, provident funds and welfare funds are given in Tables 5.7.1 and 5.7.2, respectively. The Tables reveal that at the all India level, the percentage of factories incurring expenditure on bonus, provident funds and welfare funds was recorded at 65.23 per cent, 70.88 per cent and 69.29 per cent, respectively. The percentage of factories paying bonus was recorded at 74.72 per cent in the Public Sector, 70.30 per cent in the Joint Sector and 65.18 per cent in the Private Sector. The percentage of
60
factories contributing towards the provident and other funds was recorded at 88.06 per cent in the Public Sector, 85.65 per cent in the Joint Sector and 70.76 per cent in the Private Sector. The percentage of factories incurring expenditure on welfare of their workers was recorded at 85.83 per cent in the Public Sector, 77.47 per cent in the Joint Sector and 69.21 per cent the Private Sector.
At the State level, the percentage of factories paying bonus to its
workers was recorded the lowest at 11.59 per cent in Manipur, followed by 12.50 per cent in Nagaland. The percentage of factories contributing to the provident and other funds was recorded the lowest at 4.37 per cent in Manipur, followed by 10.58 per cent in Nagaland. The percentage of factories incurring expenditure on welfare of its workers was the lowest at 39.17 per cent in Chhattisgarh, followed by 45.75 per cent in Andhra Pradesh and 53.77 per cent in Orissa.
Table 5.7.2 shows that the percentage of factories incurring expenses
on bonus was the lowest at 29.41 per cent in industry group ‘371-Recycling of metal waste and scrap’, on provident and other funds at 20.00 per cent in industry group ‘141-Quarrying of stone and sand and clay, except veterinary activities’ and on welfare funds at 35.63 per cent in industry group ‘014- Agricultural and animal husbandry service activities, except veterinary activities’.
-0-0-0-
61
CHAPTER-V LABOUR COST
Table 5.1.1
Average Labour Costs per Manday Worked on Employees in States during the Year 2007-08
-------------------------------------------------------------------------------- Sl. State Average Labour Costs (Rs.) per Manday Worked on No. --------------------------------------------------- Wages/ Bonus Provident Welfare Overall Salaries Funds Expenses -------------------------------------------------------------------------------- 1 2 3 4 5 6 7 -------------------------------------------------------------------------------- 1 Jammu & Kashmir 198.93 7.23 16.25 9.51 231.92 2 Himachal Pradesh 319.65 13.16 28.78 21.32 382.91 3 Punjab 226.67 12.40 22.44 11.78 273.29 4 Chandigarh 385.13 18.32 32.97 17.41 453.83 5 Uttaranchal 321.77 14.04 27.95 31.86 395.61 6 Haryana 342.15 14.59 30.85 22.92 410.51 7 Delhi 335.16 20.75 39.97 17.07 412.96 8 Rajasthan 258.54 11.50 24.60 14.77 309.41 9 Uttar Pradesh 294.16 14.68 30.67 19.89 359.40 10 Bihar 206.43 7.73 27.61 18.72 260.49 11 Nagaland 93.31 7.04 5.20 4.35 109.91 12 Manipur 96.66 0.51 0.58 4.16 101.90 13 Tripura 109.41 6.84 5.08 7.53 128.87 14 Meghalaya 266.53 8.80 16.41 18.86 310.60 15 Assam 189.76 10.41 18.13 26.78 245.08 16 West Bengal 292.88 15.68 58.75 24.95 392.26 17 Jharkhand 620.86 30.51 121.70 62.06 835.12 18 Orissa 388.95 8.32 41.34 42.78 481.40 19 Chhattisgarh 501.30 13.52 54.08 75.85 644.75 20 Madhya Pradesh 309.28 16.23 37.37 26.47 389.35 21 Gujarat 325.91 17.52 29.46 22.33 395.22 22 Daman & Diu 313.79 25.85 18.33 37.90 395.87 23 D & Nagar Haveli 252.22 14.13 22.32 18.21 306.88 24 Maharashtra 458.21 26.74 50.01 40.92 575.88 25 Andhra Pradesh 237.94 12.77 24.10 20.17 294.98 26 Karnataka 362.54 20.00 43.52 29.08 455.14 27 Goa 391.99 20.42 43.63 34.44 490.47 28 Kerala 228.94 20.08 30.31 19.86 299.18 29 Tamil Nadu 245.30 20.39 24.26 26.64 316.59 30 Pondicherry 360.55 22.43 33.95 34.73 451.66 31 A & N Islands 287.25 11.75 27.26 8.45 334.71 -------------------------------------------------------------------------------- All India 317.48 17.80 35.18 27.08 397.55 Public Sector 589.92 23.04 83.30 77.41 773.68 Joint Sector 594.50 31.91 79.20 71.45 777.06 Private Sector 310.16 17.49 33.98 25.86 387.49 --------------------------------------------------------------------------------
62
Table 5.1.2 Average Labour Costs per Manday Worked on Employees in Industries (3-Digit Level of
NIC-2004) during the Year 2007-08 -------------------------------------------------------------------------------- Sl. NIC Code Average Labour Costs (Rs.) per Manday Worked on No. --------------------------------------------------- Wages/ Bonus Provident Welfare Overall Salaries Funds Expenses -------------------------------------------------------------------------------- 1 2 3 4 5 6 7 -------------------------------------------------------------------------------- 1 014 128.30 2.54 3.27 1.45 135.56 2 141 114.82 5.01 15.97 1.66 137.47 3 142 133.52 4.69 4.40 6.59 149.20 4 151 205.79 11.85 15.12 10.50 243.26 5 152 319.50 13.46 43.35 13.18 389.49 6 153 157.94 7.37 9.77 5.18 180.26 7 154 210.26 16.93 24.26 10.69 262.14 8 155 315.10 15.61 25.60 21.40 377.71 9 160 84.82 6.03 9.62 3.10 103.57 10 171 202.53 12.88 23.92 10.52 249.85 11 172 234.26 14.05 20.37 10.65 279.33 12 173 180.72 14.56 13.02 7.54 215.83 13 181 203.46 12.21 21.13 8.52 245.33 14 182 209.92 8.16 12.16 10.40 240.63 15 191 189.86 16.27 19.86 14.33 240.32 16 192 177.04 12.83 18.74 10.35 218.96 17 201 127.12 6.71 4.53 2.67 141.03 18 202 188.54 10.02 15.87 7.87 222.29 19 210 258.06 15.63 28.42 19.24 321.35 20 221 609.92 19.86 73.30 37.83 740.91 21 222 264.15 15.76 27.92 16.33 324.16 22 223 359.73 41.40 78.33 29.71 509.17 23 231 345.40 17.59 55.55 29.89 448.43 24 232 720.57 50.49 98.25 105.75 975.05 25 241 567.60 27.47 72.28 68.74 736.08 26 242 382.10 22.69 39.50 31.55 475.84 27 243 598.27 39.93 121.48 86.98 846.66 28 251 320.66 19.93 32.01 52.47 425.07 29 252 251.40 15.99 21.74 17.41 306.53 30 261 292.53 19.99 31.70 22.65 366.87 31 269 248.98 13.71 23.51 20.28 306.49 32 271 518.10 14.91 88.21 64.18 685.39 33 272 567.79 31.12 72.98 73.06 744.95 34 273 270.10 16.00 24.64 21.14 331.89
63
Table 5.1.2 Concld. -------------------------------------------------------------------------------- 1 2 3 4 5 6 7 -------------------------------------------------------------------------------- 35 281 371.06 16.92 28.11 15.07 431.16 36 289 282.55 17.10 24.70 19.06 343.41 37 291 511.36 26.94 50.95 48.09 637.34 38 292 475.38 29.54 55.80 51.40 612.12 39 293 305.21 17.35 29.68 27.56 379.79 40 300 579.86 27.70 49.05 31.27 687.88 41 311 589.80 47.37 67.06 80.85 785.08 42 312 432.36 28.49 44.75 38.01 543.62 43 313 407.86 25.33 51.91 32.01 517.12 44 314 405.06 20.36 44.83 45.51 515.75 45 315 271.17 16.46 27.41 18.44 333.48 46 319 332.44 20.13 35.25 30.84 418.67 47 321 453.72 24.68 57.27 32.76 568.43 48 322 547.20 20.16 84.64 40.43 692.43 49 323 690.44 38.93 62.02 50.80 842.19 50 331 637.74 37.52 54.05 51.68 781.00 51 332 375.67 21.15 35.42 29.20 461.44 52 333 492.63 18.42 51.85 25.53 588.43 53 341 824.41 62.61 98.20 138.30 1123.52 54 342 268.19 9.77 16.48 12.02 306.46 55 343 393.76 22.35 37.76 45.64 499.50 56 351 471.20 16.72 30.77 21.08 539.77 57 352 337.08 20.34 37.62 31.61 426.64 58 353 1185.07 36.40 96.14 70.25 1387.87 59 359 441.73 19.97 46.78 39.69 548.17 60 361 369.14 15.03 37.57 24.03 445.77 61 369 304.02 14.40 22.55 14.97 355.95 62 371 467.36 3.41 38.93 37.94 547.65 63 372 189.83 3.74 4.13 7.46 205.16 64 400 298.82 16.65 21.77 19.33 356.56 -------------------------------------------------------------------------------- All India 317.48 17.80 35.18 27.08 397.55 Public Sector 589.92 23.04 83.30 77.41 773.68 Joint Sector 594.50 31.91 79.20 71.45 777.06 Private Sector 310.16 17.49 33.98 25.86 387.49 --------------------------------------------------------------------------------
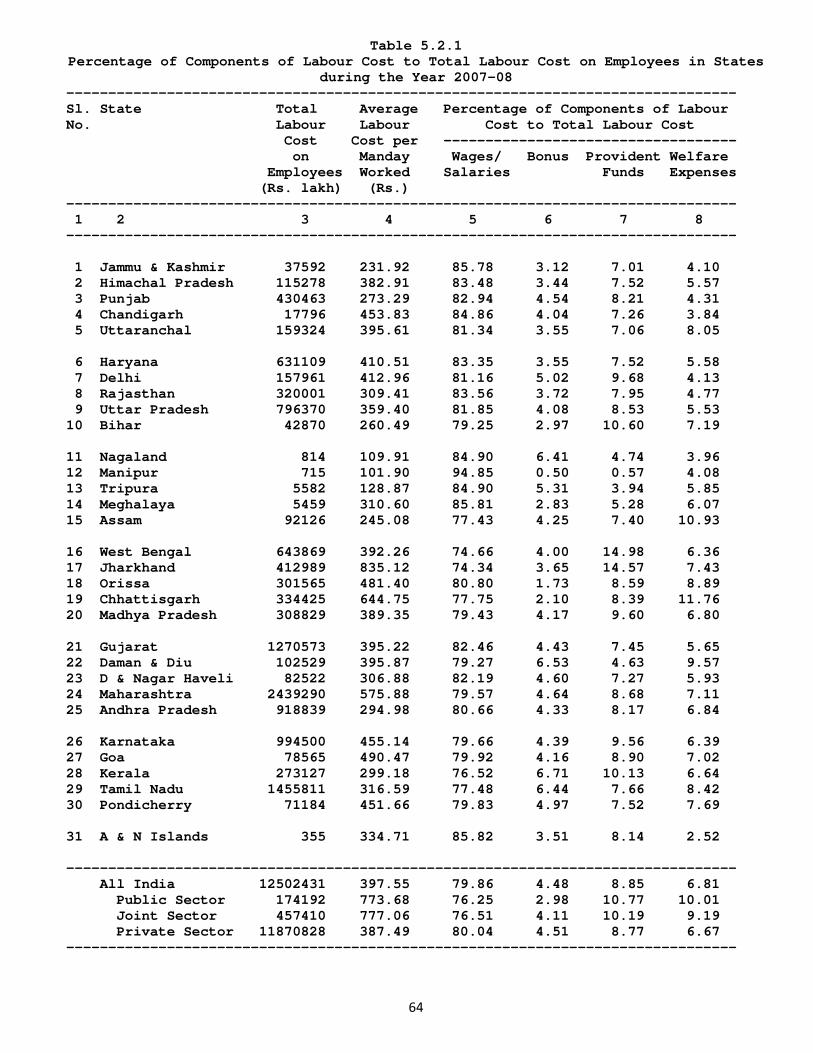
64
Table 5.2.1 Percentage of Components of Labour Cost to Total Labour Cost on Employees in States
during the Year 2007-08 -------------------------------------------------------------------------------- Sl. State Total Average Percentage of Components of Labour No. Labour Labour Cost to Total Labour Cost Cost Cost per ----------------------------------- on Manday Wages/ Bonus Provident Welfare Employees Worked Salaries Funds Expenses (Rs. lakh) (Rs.) -------------------------------------------------------------------------------- 1 2 3 4 5 6 7 8 -------------------------------------------------------------------------------- 1 Jammu & Kashmir 37592 231.92 85.78 3.12 7.01 4.10 2 Himachal Pradesh 115278 382.91 83.48 3.44 7.52 5.57 3 Punjab 430463 273.29 82.94 4.54 8.21 4.31 4 Chandigarh 17796 453.83 84.86 4.04 7.26 3.84 5 Uttaranchal 159324 395.61 81.34 3.55 7.06 8.05 6 Haryana 631109 410.51 83.35 3.55 7.52 5.58 7 Delhi 157961 412.96 81.16 5.02 9.68 4.13 8 Rajasthan 320001 309.41 83.56 3.72 7.95 4.77 9 Uttar Pradesh 796370 359.40 81.85 4.08 8.53 5.53 10 Bihar 42870 260.49 79.25 2.97 10.60 7.19 11 Nagaland 814 109.91 84.90 6.41 4.74 3.96 12 Manipur 715 101.90 94.85 0.50 0.57 4.08 13 Tripura 5582 128.87 84.90 5.31 3.94 5.85 14 Meghalaya 5459 310.60 85.81 2.83 5.28 6.07 15 Assam 92126 245.08 77.43 4.25 7.40 10.93 16 West Bengal 643869 392.26 74.66 4.00 14.98 6.36 17 Jharkhand 412989 835.12 74.34 3.65 14.57 7.43 18 Orissa 301565 481.40 80.80 1.73 8.59 8.89 19 Chhattisgarh 334425 644.75 77.75 2.10 8.39 11.76 20 Madhya Pradesh 308829 389.35 79.43 4.17 9.60 6.80 21 Gujarat 1270573 395.22 82.46 4.43 7.45 5.65 22 Daman & Diu 102529 395.87 79.27 6.53 4.63 9.57 23 D & Nagar Haveli 82522 306.88 82.19 4.60 7.27 5.93 24 Maharashtra 2439290 575.88 79.57 4.64 8.68 7.11 25 Andhra Pradesh 918839 294.98 80.66 4.33 8.17 6.84 26 Karnataka 994500 455.14 79.66 4.39 9.56 6.39 27 Goa 78565 490.47 79.92 4.16 8.90 7.02 28 Kerala 273127 299.18 76.52 6.71 10.13 6.64 29 Tamil Nadu 1455811 316.59 77.48 6.44 7.66 8.42 30 Pondicherry 71184 451.66 79.83 4.97 7.52 7.69 31 A & N Islands 355 334.71 85.82 3.51 8.14 2.52 -------------------------------------------------------------------------------- All India 12502431 397.55 79.86 4.48 8.85 6.81 Public Sector 174192 773.68 76.25 2.98 10.77 10.01 Joint Sector 457410 777.06 76.51 4.11 10.19 9.19 Private Sector 11870828 387.49 80.04 4.51 8.77 6.67 --------------------------------------------------------------------------------
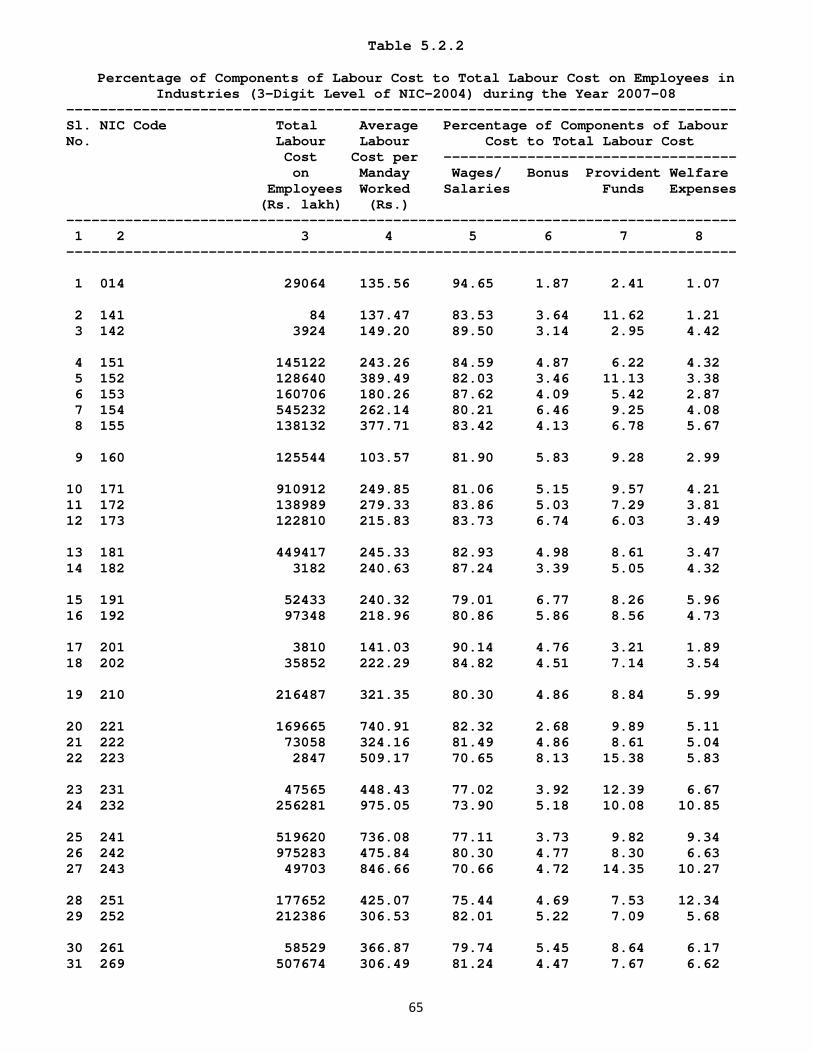
65
Table 5.2.2
Percentage of Components of Labour Cost to Total Labour Cost on Employees in Industries (3-Digit Level of NIC-2004) during the Year 2007-08
-------------------------------------------------------------------------------- Sl. NIC Code Total Average Percentage of Components of Labour No. Labour Labour Cost to Total Labour Cost Cost Cost per ----------------------------------- on Manday Wages/ Bonus Provident Welfare Employees Worked Salaries Funds Expenses (Rs. lakh) (Rs.) -------------------------------------------------------------------------------- 1 2 3 4 5 6 7 8 -------------------------------------------------------------------------------- 1 014 29064 135.56 94.65 1.87 2.41 1.07 2 141 84 137.47 83.53 3.64 11.62 1.21 3 142 3924 149.20 89.50 3.14 2.95 4.42 4 151 145122 243.26 84.59 4.87 6.22 4.32 5 152 128640 389.49 82.03 3.46 11.13 3.38 6 153 160706 180.26 87.62 4.09 5.42 2.87 7 154 545232 262.14 80.21 6.46 9.25 4.08 8 155 138132 377.71 83.42 4.13 6.78 5.67 9 160 125544 103.57 81.90 5.83 9.28 2.99 10 171 910912 249.85 81.06 5.15 9.57 4.21 11 172 138989 279.33 83.86 5.03 7.29 3.81 12 173 122810 215.83 83.73 6.74 6.03 3.49 13 181 449417 245.33 82.93 4.98 8.61 3.47 14 182 3182 240.63 87.24 3.39 5.05 4.32 15 191 52433 240.32 79.01 6.77 8.26 5.96 16 192 97348 218.96 80.86 5.86 8.56 4.73 17 201 3810 141.03 90.14 4.76 3.21 1.89 18 202 35852 222.29 84.82 4.51 7.14 3.54 19 210 216487 321.35 80.30 4.86 8.84 5.99 20 221 169665 740.91 82.32 2.68 9.89 5.11 21 222 73058 324.16 81.49 4.86 8.61 5.04 22 223 2847 509.17 70.65 8.13 15.38 5.83 23 231 47565 448.43 77.02 3.92 12.39 6.67 24 232 256281 975.05 73.90 5.18 10.08 10.85 25 241 519620 736.08 77.11 3.73 9.82 9.34 26 242 975283 475.84 80.30 4.77 8.30 6.63 27 243 49703 846.66 70.66 4.72 14.35 10.27 28 251 177652 425.07 75.44 4.69 7.53 12.34 29 252 212386 306.53 82.01 5.22 7.09 5.68 30 261 58529 366.87 79.74 5.45 8.64 6.17 31 269 507674 306.49 81.24 4.47 7.67 6.62
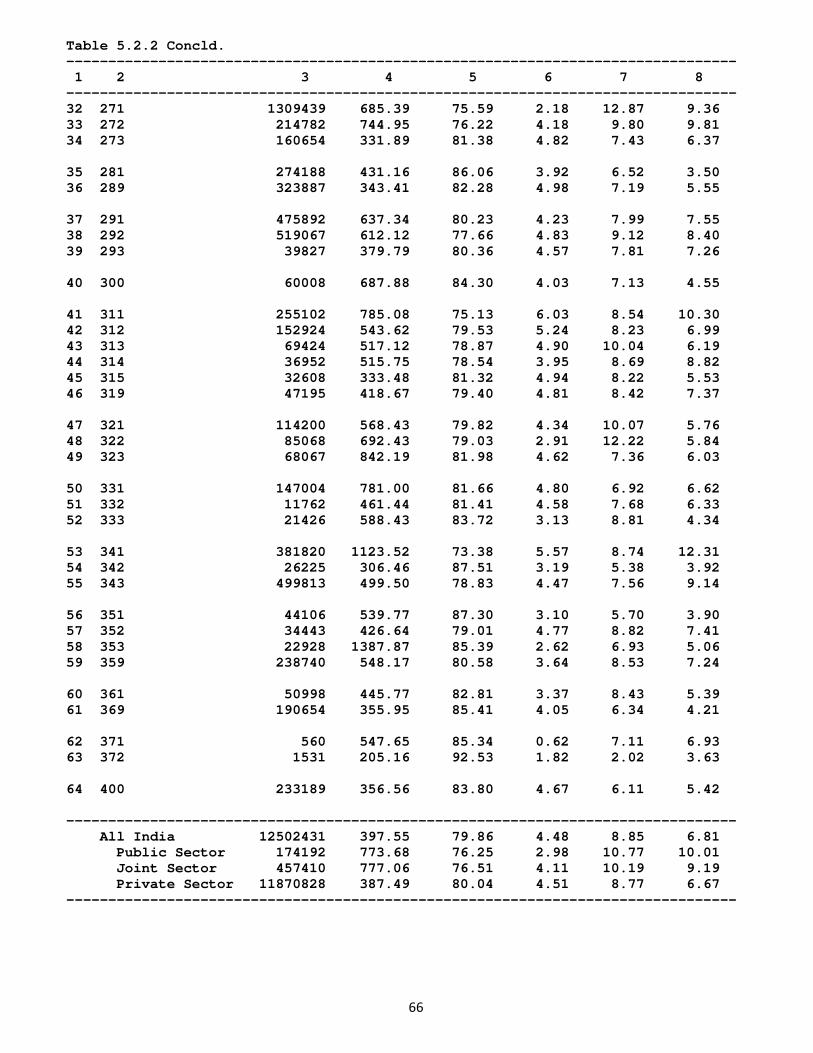
66
Table 5.2.2 Concld. -------------------------------------------------------------------------------- 1 2 3 4 5 6 7 8 -------------------------------------------------------------------------------- 32 271 1309439 685.39 75.59 2.18 12.87 9.36 33 272 214782 744.95 76.22 4.18 9.80 9.81 34 273 160654 331.89 81.38 4.82 7.43 6.37 35 281 274188 431.16 86.06 3.92 6.52 3.50 36 289 323887 343.41 82.28 4.98 7.19 5.55 37 291 475892 637.34 80.23 4.23 7.99 7.55 38 292 519067 612.12 77.66 4.83 9.12 8.40 39 293 39827 379.79 80.36 4.57 7.81 7.26 40 300 60008 687.88 84.30 4.03 7.13 4.55 41 311 255102 785.08 75.13 6.03 8.54 10.30 42 312 152924 543.62 79.53 5.24 8.23 6.99 43 313 69424 517.12 78.87 4.90 10.04 6.19 44 314 36952 515.75 78.54 3.95 8.69 8.82 45 315 32608 333.48 81.32 4.94 8.22 5.53 46 319 47195 418.67 79.40 4.81 8.42 7.37 47 321 114200 568.43 79.82 4.34 10.07 5.76 48 322 85068 692.43 79.03 2.91 12.22 5.84 49 323 68067 842.19 81.98 4.62 7.36 6.03 50 331 147004 781.00 81.66 4.80 6.92 6.62 51 332 11762 461.44 81.41 4.58 7.68 6.33 52 333 21426 588.43 83.72 3.13 8.81 4.34 53 341 381820 1123.52 73.38 5.57 8.74 12.31 54 342 26225 306.46 87.51 3.19 5.38 3.92 55 343 499813 499.50 78.83 4.47 7.56 9.14 56 351 44106 539.77 87.30 3.10 5.70 3.90 57 352 34443 426.64 79.01 4.77 8.82 7.41 58 353 22928 1387.87 85.39 2.62 6.93 5.06 59 359 238740 548.17 80.58 3.64 8.53 7.24 60 361 50998 445.77 82.81 3.37 8.43 5.39 61 369 190654 355.95 85.41 4.05 6.34 4.21 62 371 560 547.65 85.34 0.62 7.11 6.93 63 372 1531 205.16 92.53 1.82 2.02 3.63 64 400 233189 356.56 83.80 4.67 6.11 5.42 -------------------------------------------------------------------------------- All India 12502431 397.55 79.86 4.48 8.85 6.81 Public Sector 174192 773.68 76.25 2.98 10.77 10.01 Joint Sector 457410 777.06 76.51 4.11 10.19 9.19 Private Sector 11870828 387.49 80.04 4.51 8.77 6.67 --------------------------------------------------------------------------------
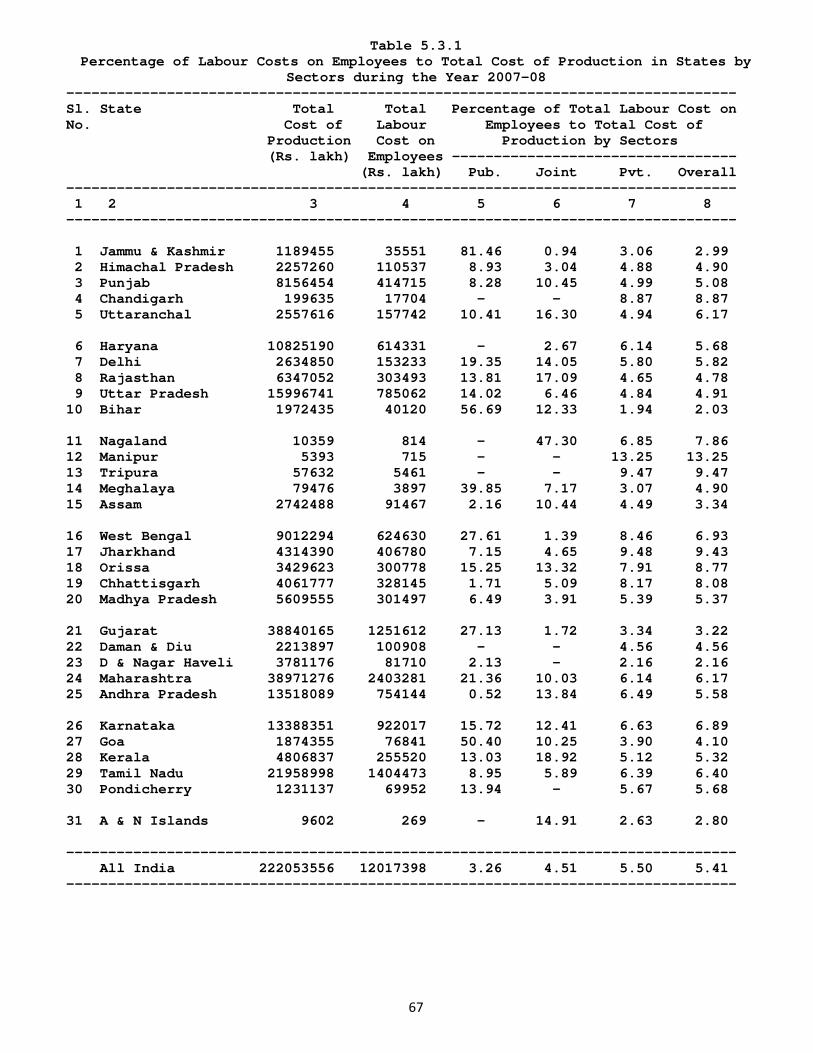
67
Table 5.3.1 Percentage of Labour Costs on Employees to Total Cost of Production in States by
Sectors during the Year 2007-08 -------------------------------------------------------------------------------- Sl. State Total Total Percentage of Total Labour Cost on No. Cost of Labour Employees to Total Cost of Production Cost on Production by Sectors (Rs. lakh) Employees ---------------------------------- (Rs. lakh) Pub. Joint Pvt. Overall -------------------------------------------------------------------------------- 1 2 3 4 5 6 7 8 -------------------------------------------------------------------------------- 1 Jammu & Kashmir 1189455 35551 81.46 0.94 3.06 2.99 2 Himachal Pradesh 2257260 110537 8.93 3.04 4.88 4.90 3 Punjab 8156454 414715 8.28 10.45 4.99 5.08 4 Chandigarh 199635 17704 - - 8.87 8.87 5 Uttaranchal 2557616 157742 10.41 16.30 4.94 6.17 6 Haryana 10825190 614331 - 2.67 6.14 5.68 7 Delhi 2634850 153233 19.35 14.05 5.80 5.82 8 Rajasthan 6347052 303493 13.81 17.09 4.65 4.78 9 Uttar Pradesh 15996741 785062 14.02 6.46 4.84 4.91 10 Bihar 1972435 40120 56.69 12.33 1.94 2.03 11 Nagaland 10359 814 - 47.30 6.85 7.86 12 Manipur 5393 715 - - 13.25 13.25 13 Tripura 57632 5461 - - 9.47 9.47 14 Meghalaya 79476 3897 39.85 7.17 3.07 4.90 15 Assam 2742488 91467 2.16 10.44 4.49 3.34 16 West Bengal 9012294 624630 27.61 1.39 8.46 6.93 17 Jharkhand 4314390 406780 7.15 4.65 9.48 9.43 18 Orissa 3429623 300778 15.25 13.32 7.91 8.77 19 Chhattisgarh 4061777 328145 1.71 5.09 8.17 8.08 20 Madhya Pradesh 5609555 301497 6.49 3.91 5.39 5.37 21 Gujarat 38840165 1251612 27.13 1.72 3.34 3.22 22 Daman & Diu 2213897 100908 - - 4.56 4.56 23 D & Nagar Haveli 3781176 81710 2.13 - 2.16 2.16 24 Maharashtra 38971276 2403281 21.36 10.03 6.14 6.17 25 Andhra Pradesh 13518089 754144 0.52 13.84 6.49 5.58 26 Karnataka 13388351 922017 15.72 12.41 6.63 6.89 27 Goa 1874355 76841 50.40 10.25 3.90 4.10 28 Kerala 4806837 255520 13.03 18.92 5.12 5.32 29 Tamil Nadu 21958998 1404473 8.95 5.89 6.39 6.40 30 Pondicherry 1231137 69952 13.94 - 5.67 5.68 31 A & N Islands 9602 269 - 14.91 2.63 2.80 -------------------------------------------------------------------------------- All India 222053556 12017398 3.26 4.51 5.50 5.41 --------------------------------------------------------------------------------
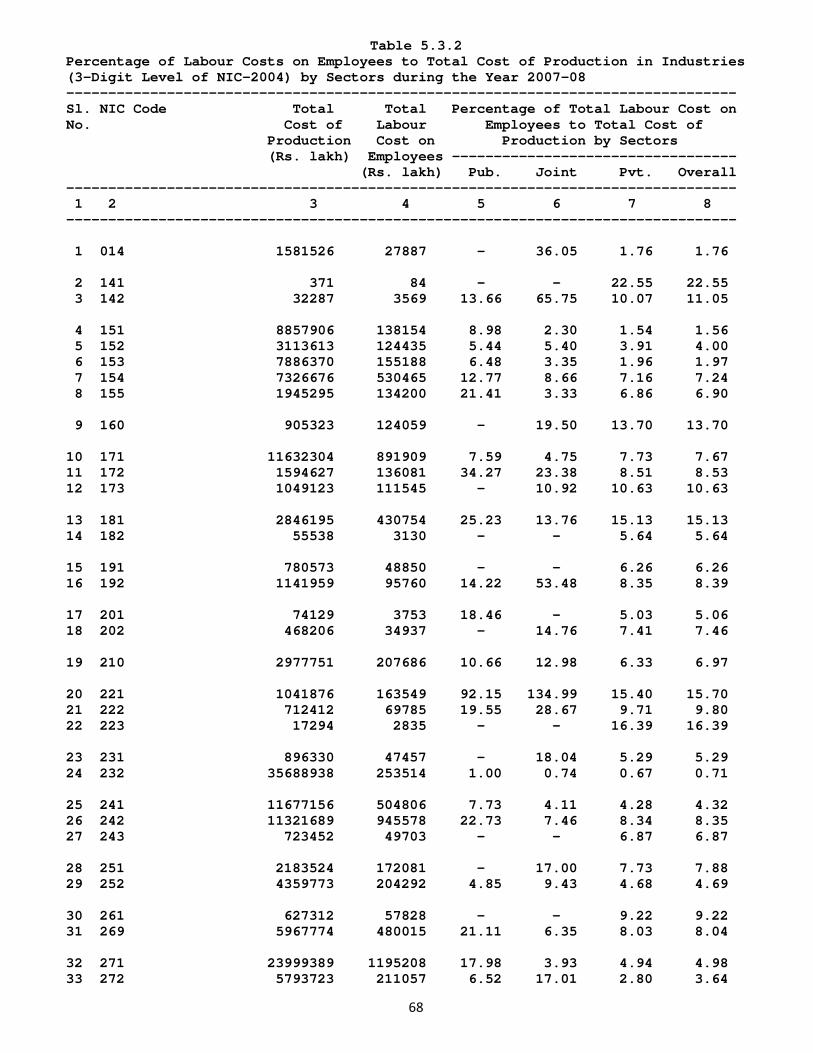
68
Table 5.3.2 Percentage of Labour Costs on Employees to Total Cost of Production in Industries (3-Digit Level of NIC-2004) by Sectors during the Year 2007-08 -------------------------------------------------------------------------------- Sl. NIC Code Total Total Percentage of Total Labour Cost on No. Cost of Labour Employees to Total Cost of Production Cost on Production by Sectors (Rs. lakh) Employees ---------------------------------- (Rs. lakh) Pub. Joint Pvt. Overall -------------------------------------------------------------------------------- 1 2 3 4 5 6 7 8 -------------------------------------------------------------------------------- 1 014 1581526 27887 - 36.05 1.76 1.76 2 141 371 84 - - 22.55 22.55 3 142 32287 3569 13.66 65.75 10.07 11.05 4 151 8857906 138154 8.98 2.30 1.54 1.56 5 152 3113613 124435 5.44 5.40 3.91 4.00 6 153 7886370 155188 6.48 3.35 1.96 1.97 7 154 7326676 530465 12.77 8.66 7.16 7.24 8 155 1945295 134200 21.41 3.33 6.86 6.90 9 160 905323 124059 - 19.50 13.70 13.70 10 171 11632304 891909 7.59 4.75 7.73 7.67 11 172 1594627 136081 34.27 23.38 8.51 8.53 12 173 1049123 111545 - 10.92 10.63 10.63 13 181 2846195 430754 25.23 13.76 15.13 15.13 14 182 55538 3130 - - 5.64 5.64 15 191 780573 48850 - - 6.26 6.26 16 192 1141959 95760 14.22 53.48 8.35 8.39 17 201 74129 3753 18.46 - 5.03 5.06 18 202 468206 34937 - 14.76 7.41 7.46 19 210 2977751 207686 10.66 12.98 6.33 6.97 20 221 1041876 163549 92.15 134.99 15.40 15.70 21 222 712412 69785 19.55 28.67 9.71 9.80 22 223 17294 2835 - - 16.39 16.39 23 231 896330 47457 - 18.04 5.29 5.29 24 232 35688938 253514 1.00 0.74 0.67 0.71 25 241 11677156 504806 7.73 4.11 4.28 4.32 26 242 11321689 945578 22.73 7.46 8.34 8.35 27 243 723452 49703 - - 6.87 6.87 28 251 2183524 172081 - 17.00 7.73 7.88 29 252 4359773 204292 4.85 9.43 4.68 4.69 30 261 627312 57828 - - 9.22 9.22 31 269 5967774 480015 21.11 6.35 8.03 8.04 32 271 23999389 1195208 17.98 3.93 4.94 4.98 33 272 5793723 211057 6.52 17.01 2.80 3.64
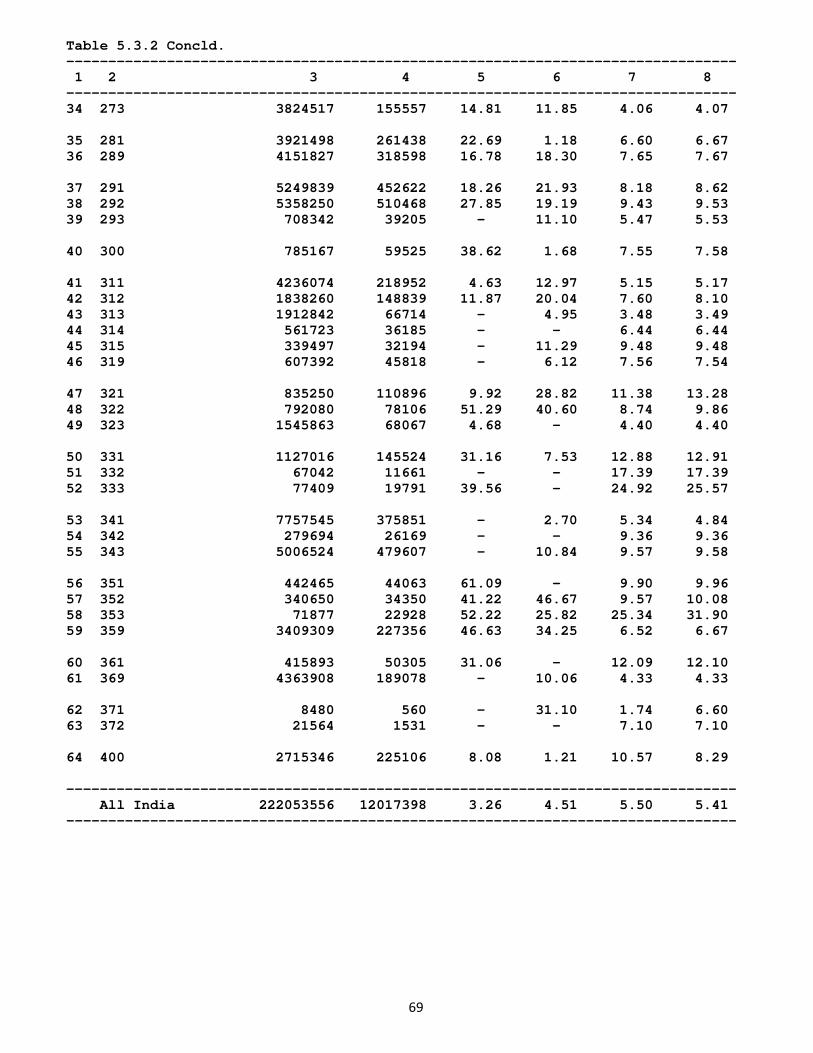
69
Table 5.3.2 Concld. -------------------------------------------------------------------------------- 1 2 3 4 5 6 7 8 -------------------------------------------------------------------------------- 34 273 3824517 155557 14.81 11.85 4.06 4.07 35 281 3921498 261438 22.69 1.18 6.60 6.67 36 289 4151827 318598 16.78 18.30 7.65 7.67 37 291 5249839 452622 18.26 21.93 8.18 8.62 38 292 5358250 510468 27.85 19.19 9.43 9.53 39 293 708342 39205 - 11.10 5.47 5.53 40 300 785167 59525 38.62 1.68 7.55 7.58 41 311 4236074 218952 4.63 12.97 5.15 5.17 42 312 1838260 148839 11.87 20.04 7.60 8.10 43 313 1912842 66714 - 4.95 3.48 3.49 44 314 561723 36185 - - 6.44 6.44 45 315 339497 32194 - 11.29 9.48 9.48 46 319 607392 45818 - 6.12 7.56 7.54 47 321 835250 110896 9.92 28.82 11.38 13.28 48 322 792080 78106 51.29 40.60 8.74 9.86 49 323 1545863 68067 4.68 - 4.40 4.40 50 331 1127016 145524 31.16 7.53 12.88 12.91 51 332 67042 11661 - - 17.39 17.39 52 333 77409 19791 39.56 - 24.92 25.57 53 341 7757545 375851 - 2.70 5.34 4.84 54 342 279694 26169 - - 9.36 9.36 55 343 5006524 479607 - 10.84 9.57 9.58 56 351 442465 44063 61.09 - 9.90 9.96 57 352 340650 34350 41.22 46.67 9.57 10.08 58 353 71877 22928 52.22 25.82 25.34 31.90 59 359 3409309 227356 46.63 34.25 6.52 6.67 60 361 415893 50305 31.06 - 12.09 12.10 61 369 4363908 189078 - 10.06 4.33 4.33 62 371 8480 560 - 31.10 1.74 6.60 63 372 21564 1531 - - 7.10 7.10 64 400 2715346 225106 8.08 1.21 10.57 8.29 -------------------------------------------------------------------------------- All India 222053556 12017398 3.26 4.51 5.50 5.41 --------------------------------------------------------------------------------
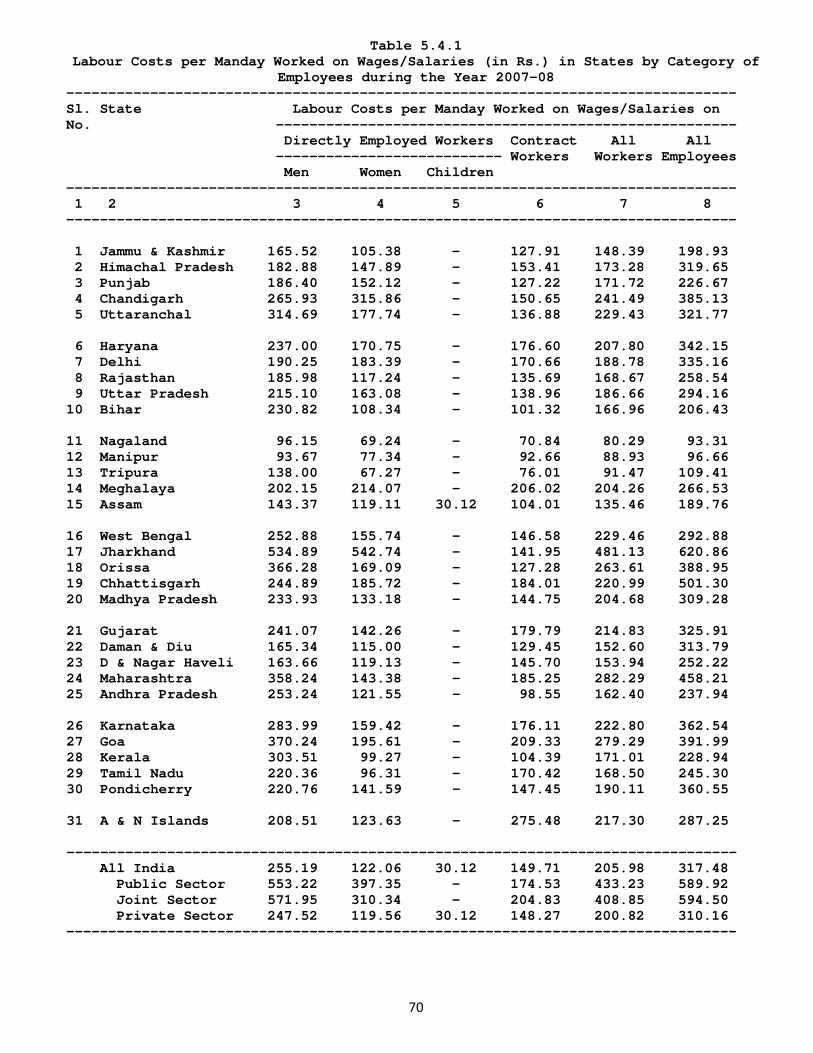
70
Table 5.4.1 Labour Costs per Manday Worked on Wages/Salaries (in Rs.) in States by Category of
Employees during the Year 2007-08 -------------------------------------------------------------------------------- Sl. State Labour Costs per Manday Worked on Wages/Salaries on No. ------------------------------------------------------- Directly Employed Workers Contract All All --------------------------- Workers Workers Employees Men Women Children -------------------------------------------------------------------------------- 1 2 3 4 5 6 7 8 -------------------------------------------------------------------------------- 1 Jammu & Kashmir 165.52 105.38 - 127.91 148.39 198.93 2 Himachal Pradesh 182.88 147.89 - 153.41 173.28 319.65 3 Punjab 186.40 152.12 - 127.22 171.72 226.67 4 Chandigarh 265.93 315.86 - 150.65 241.49 385.13 5 Uttaranchal 314.69 177.74 - 136.88 229.43 321.77 6 Haryana 237.00 170.75 - 176.60 207.80 342.15 7 Delhi 190.25 183.39 - 170.66 188.78 335.16 8 Rajasthan 185.98 117.24 - 135.69 168.67 258.54 9 Uttar Pradesh 215.10 163.08 - 138.96 186.66 294.16 10 Bihar 230.82 108.34 - 101.32 166.96 206.43 11 Nagaland 96.15 69.24 - 70.84 80.29 93.31 12 Manipur 93.67 77.34 - 92.66 88.93 96.66 13 Tripura 138.00 67.27 - 76.01 91.47 109.41 14 Meghalaya 202.15 214.07 - 206.02 204.26 266.53 15 Assam 143.37 119.11 30.12 104.01 135.46 189.76 16 West Bengal 252.88 155.74 - 146.58 229.46 292.88 17 Jharkhand 534.89 542.74 - 141.95 481.13 620.86 18 Orissa 366.28 169.09 - 127.28 263.61 388.95 19 Chhattisgarh 244.89 185.72 - 184.01 220.99 501.30 20 Madhya Pradesh 233.93 133.18 - 144.75 204.68 309.28 21 Gujarat 241.07 142.26 - 179.79 214.83 325.91 22 Daman & Diu 165.34 115.00 - 129.45 152.60 313.79 23 D & Nagar Haveli 163.66 119.13 - 145.70 153.94 252.22 24 Maharashtra 358.24 143.38 - 185.25 282.29 458.21 25 Andhra Pradesh 253.24 121.55 - 98.55 162.40 237.94 26 Karnataka 283.99 159.42 - 176.11 222.80 362.54 27 Goa 370.24 195.61 - 209.33 279.29 391.99 28 Kerala 303.51 99.27 - 104.39 171.01 228.94 29 Tamil Nadu 220.36 96.31 - 170.42 168.50 245.30 30 Pondicherry 220.76 141.59 - 147.45 190.11 360.55 31 A & N Islands 208.51 123.63 - 275.48 217.30 287.25 -------------------------------------------------------------------------------- All India 255.19 122.06 30.12 149.71 205.98 317.48 Public Sector 553.22 397.35 - 174.53 433.23 589.92 Joint Sector 571.95 310.34 - 204.83 408.85 594.50 Private Sector 247.52 119.56 30.12 148.27 200.82 310.16 --------------------------------------------------------------------------------
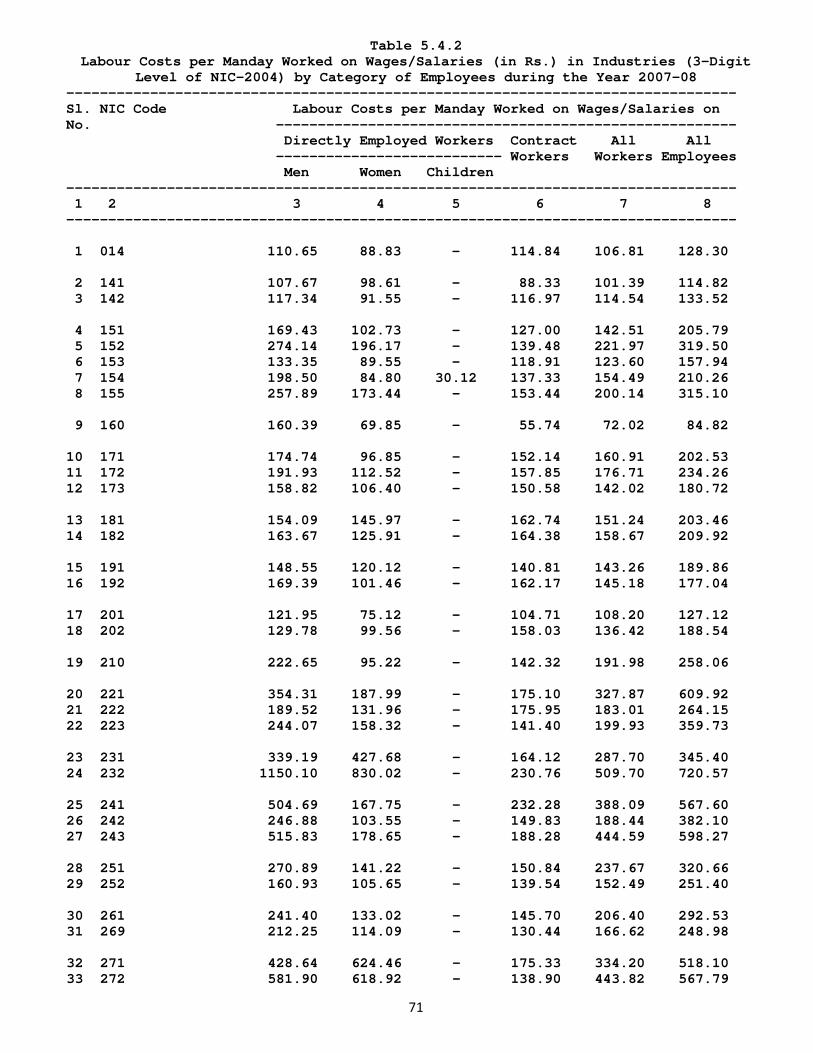
71
Table 5.4.2 Labour Costs per Manday Worked on Wages/Salaries (in Rs.) in Industries (3-Digit
Level of NIC-2004) by Category of Employees during the Year 2007-08 -------------------------------------------------------------------------------- Sl. NIC Code Labour Costs per Manday Worked on Wages/Salaries on No. ------------------------------------------------------- Directly Employed Workers Contract All All --------------------------- Workers Workers Employees Men Women Children -------------------------------------------------------------------------------- 1 2 3 4 5 6 7 8 -------------------------------------------------------------------------------- 1 014 110.65 88.83 - 114.84 106.81 128.30 2 141 107.67 98.61 - 88.33 101.39 114.82 3 142 117.34 91.55 - 116.97 114.54 133.52 4 151 169.43 102.73 - 127.00 142.51 205.79 5 152 274.14 196.17 - 139.48 221.97 319.50 6 153 133.35 89.55 - 118.91 123.60 157.94 7 154 198.50 84.80 30.12 137.33 154.49 210.26 8 155 257.89 173.44 - 153.44 200.14 315.10 9 160 160.39 69.85 - 55.74 72.02 84.82 10 171 174.74 96.85 - 152.14 160.91 202.53 11 172 191.93 112.52 - 157.85 176.71 234.26 12 173 158.82 106.40 - 150.58 142.02 180.72 13 181 154.09 145.97 - 162.74 151.24 203.46 14 182 163.67 125.91 - 164.38 158.67 209.92 15 191 148.55 120.12 - 140.81 143.26 189.86 16 192 169.39 101.46 - 162.17 145.18 177.04 17 201 121.95 75.12 - 104.71 108.20 127.12 18 202 129.78 99.56 - 158.03 136.42 188.54 19 210 222.65 95.22 - 142.32 191.98 258.06 20 221 354.31 187.99 - 175.10 327.87 609.92 21 222 189.52 131.96 - 175.95 183.01 264.15 22 223 244.07 158.32 - 141.40 199.93 359.73 23 231 339.19 427.68 - 164.12 287.70 345.40 24 232 1150.10 830.02 - 230.76 509.70 720.57 25 241 504.69 167.75 - 232.28 388.09 567.60 26 242 246.88 103.55 - 149.83 188.44 382.10 27 243 515.83 178.65 - 188.28 444.59 598.27 28 251 270.89 141.22 - 150.84 237.67 320.66 29 252 160.93 105.65 - 139.54 152.49 251.40 30 261 241.40 133.02 - 145.70 206.40 292.53 31 269 212.25 114.09 - 130.44 166.62 248.98 32 271 428.64 624.46 - 175.33 334.20 518.10 33 272 581.90 618.92 - 138.90 443.82 567.79
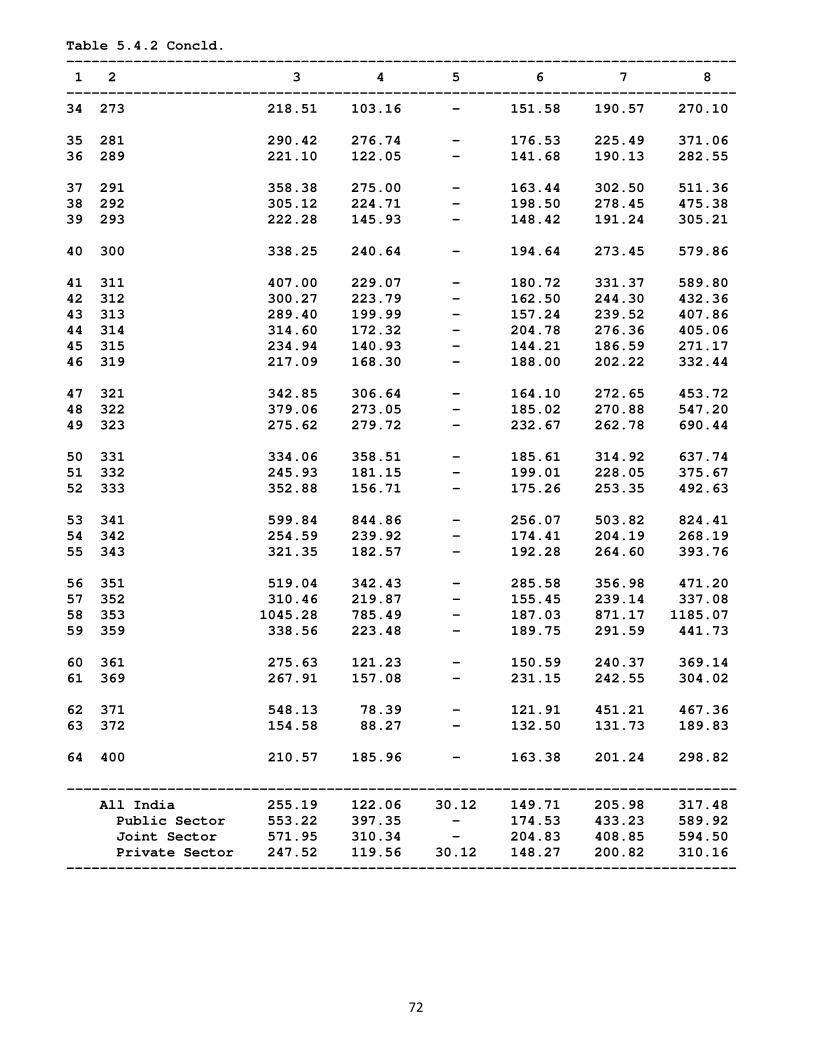
72
Table 5.4.2 Concld. -------------------------------------------------------------------------------- 1 2 3 4 5 6 7 8 -------------------------------------------------------------------------------- 34 273 218.51 103.16 - 151.58 190.57 270.10 35 281 290.42 276.74 - 176.53 225.49 371.06 36 289 221.10 122.05 - 141.68 190.13 282.55 37 291 358.38 275.00 - 163.44 302.50 511.36 38 292 305.12 224.71 - 198.50 278.45 475.38 39 293 222.28 145.93 - 148.42 191.24 305.21 40 300 338.25 240.64 - 194.64 273.45 579.86 41 311 407.00 229.07 - 180.72 331.37 589.80 42 312 300.27 223.79 - 162.50 244.30 432.36 43 313 289.40 199.99 - 157.24 239.52 407.86 44 314 314.60 172.32 - 204.78 276.36 405.06 45 315 234.94 140.93 - 144.21 186.59 271.17 46 319 217.09 168.30 - 188.00 202.22 332.44 47 321 342.85 306.64 - 164.10 272.65 453.72 48 322 379.06 273.05 - 185.02 270.88 547.20 49 323 275.62 279.72 - 232.67 262.78 690.44 50 331 334.06 358.51 - 185.61 314.92 637.74 51 332 245.93 181.15 - 199.01 228.05 375.67 52 333 352.88 156.71 - 175.26 253.35 492.63 53 341 599.84 844.86 - 256.07 503.82 824.41 54 342 254.59 239.92 - 174.41 204.19 268.19 55 343 321.35 182.57 - 192.28 264.60 393.76 56 351 519.04 342.43 - 285.58 356.98 471.20 57 352 310.46 219.87 - 155.45 239.14 337.08 58 353 1045.28 785.49 - 187.03 871.17 1185.07 59 359 338.56 223.48 - 189.75 291.59 441.73 60 361 275.63 121.23 - 150.59 240.37 369.14 61 369 267.91 157.08 - 231.15 242.55 304.02 62 371 548.13 78.39 - 121.91 451.21 467.36 63 372 154.58 88.27 - 132.50 131.73 189.83 64 400 210.57 185.96 - 163.38 201.24 298.82 -------------------------------------------------------------------------------- All India 255.19 122.06 30.12 149.71 205.98 317.48 Public Sector 553.22 397.35 - 174.53 433.23 589.92 Joint Sector 571.95 310.34 - 204.83 408.85 594.50 Private Sector 247.52 119.56 30.12 148.27 200.82 310.16 --------------------------------------------------------------------------------
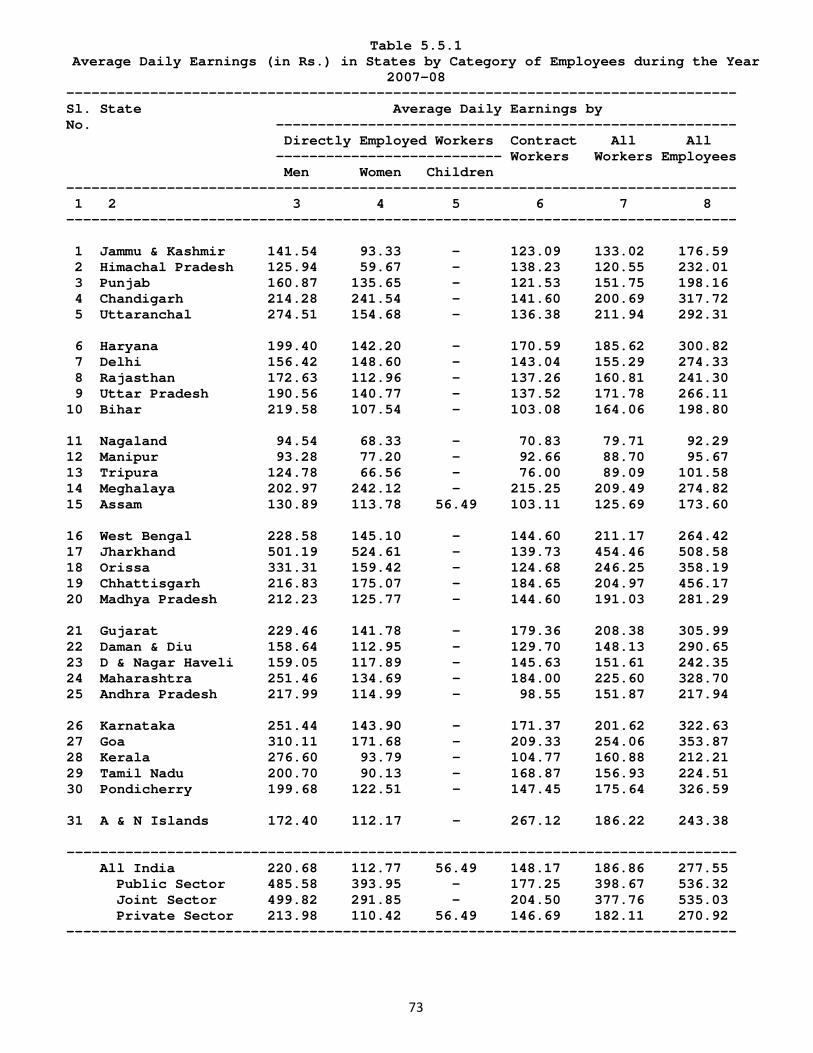
73
Table 5.5.1 Average Daily Earnings (in Rs.) in States by Category of Employees during the Year
2007-08 -------------------------------------------------------------------------------- Sl. State Average Daily Earnings by No. ------------------------------------------------------- Directly Employed Workers Contract All All --------------------------- Workers Workers Employees Men Women Children -------------------------------------------------------------------------------- 1 2 3 4 5 6 7 8 -------------------------------------------------------------------------------- 1 Jammu & Kashmir 141.54 93.33 - 123.09 133.02 176.59 2 Himachal Pradesh 125.94 59.67 - 138.23 120.55 232.01 3 Punjab 160.87 135.65 - 121.53 151.75 198.16 4 Chandigarh 214.28 241.54 - 141.60 200.69 317.72 5 Uttaranchal 274.51 154.68 - 136.38 211.94 292.31 6 Haryana 199.40 142.20 - 170.59 185.62 300.82 7 Delhi 156.42 148.60 - 143.04 155.29 274.33 8 Rajasthan 172.63 112.96 - 137.26 160.81 241.30 9 Uttar Pradesh 190.56 140.77 - 137.52 171.78 266.11 10 Bihar 219.58 107.54 - 103.08 164.06 198.80 11 Nagaland 94.54 68.33 - 70.83 79.71 92.29 12 Manipur 93.28 77.20 - 92.66 88.70 95.67 13 Tripura 124.78 66.56 - 76.00 89.09 101.58 14 Meghalaya 202.97 242.12 - 215.25 209.49 274.82 15 Assam 130.89 113.78 56.49 103.11 125.69 173.60 16 West Bengal 228.58 145.10 - 144.60 211.17 264.42 17 Jharkhand 501.19 524.61 - 139.73 454.46 508.58 18 Orissa 331.31 159.42 - 124.68 246.25 358.19 19 Chhattisgarh 216.83 175.07 - 184.65 204.97 456.17 20 Madhya Pradesh 212.23 125.77 - 144.60 191.03 281.29 21 Gujarat 229.46 141.78 - 179.36 208.38 305.99 22 Daman & Diu 158.64 112.95 - 129.70 148.13 290.65 23 D & Nagar Haveli 159.05 117.89 - 145.63 151.61 242.35 24 Maharashtra 251.46 134.69 - 184.00 225.60 328.70 25 Andhra Pradesh 217.99 114.99 - 98.55 151.87 217.94 26 Karnataka 251.44 143.90 - 171.37 201.62 322.63 27 Goa 310.11 171.68 - 209.33 254.06 353.87 28 Kerala 276.60 93.79 - 104.77 160.88 212.21 29 Tamil Nadu 200.70 90.13 - 168.87 156.93 224.51 30 Pondicherry 199.68 122.51 - 147.45 175.64 326.59 31 A & N Islands 172.40 112.17 - 267.12 186.22 243.38 -------------------------------------------------------------------------------- All India 220.68 112.77 56.49 148.17 186.86 277.55 Public Sector 485.58 393.95 - 177.25 398.67 536.32 Joint Sector 499.82 291.85 - 204.50 377.76 535.03 Private Sector 213.98 110.42 56.49 146.69 182.11 270.92 --------------------------------------------------------------------------------
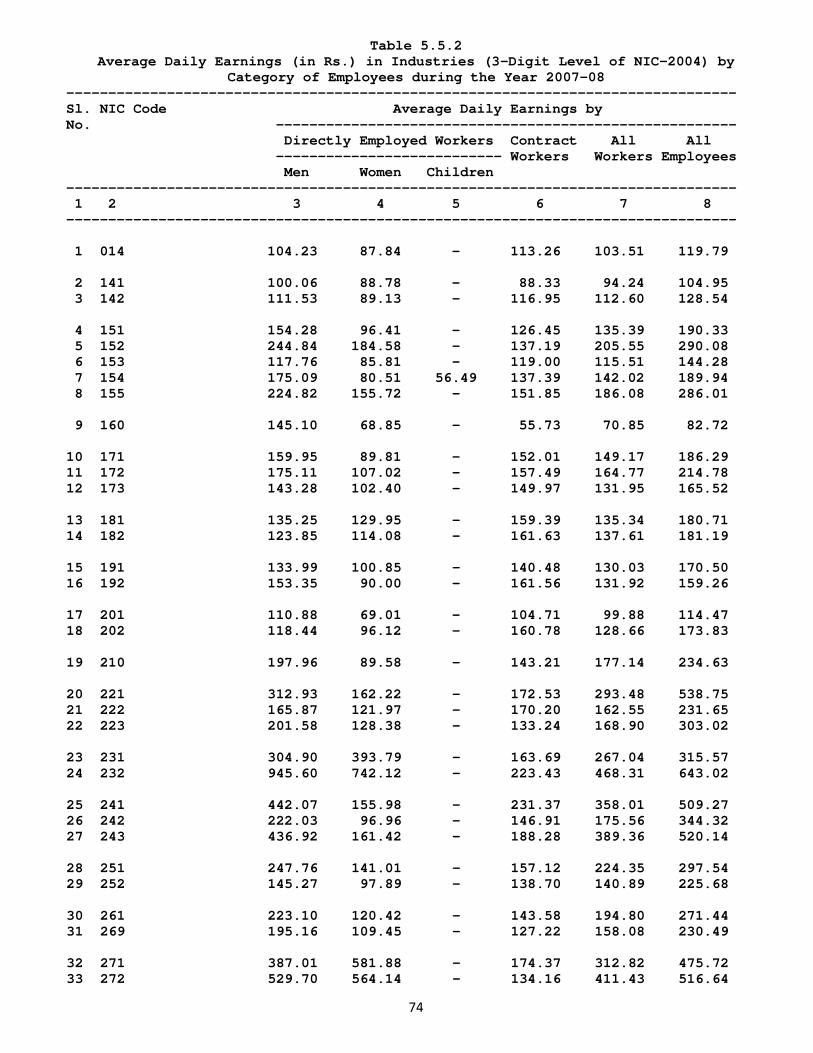
74
Table 5.5.2 Average Daily Earnings (in Rs.) in Industries (3-Digit Level of NIC-2004) by
Category of Employees during the Year 2007-08 -------------------------------------------------------------------------------- Sl. NIC Code Average Daily Earnings by No. ------------------------------------------------------- Directly Employed Workers Contract All All --------------------------- Workers Workers Employees Men Women Children -------------------------------------------------------------------------------- 1 2 3 4 5 6 7 8 -------------------------------------------------------------------------------- 1 014 104.23 87.84 - 113.26 103.51 119.79 2 141 100.06 88.78 - 88.33 94.24 104.95 3 142 111.53 89.13 - 116.95 112.60 128.54 4 151 154.28 96.41 - 126.45 135.39 190.33 5 152 244.84 184.58 - 137.19 205.55 290.08 6 153 117.76 85.81 - 119.00 115.51 144.28 7 154 175.09 80.51 56.49 137.39 142.02 189.94 8 155 224.82 155.72 - 151.85 186.08 286.01 9 160 145.10 68.85 - 55.73 70.85 82.72 10 171 159.95 89.81 - 152.01 149.17 186.29 11 172 175.11 107.02 - 157.49 164.77 214.78 12 173 143.28 102.40 - 149.97 131.95 165.52 13 181 135.25 129.95 - 159.39 135.34 180.71 14 182 123.85 114.08 - 161.63 137.61 181.19 15 191 133.99 100.85 - 140.48 130.03 170.50 16 192 153.35 90.00 - 161.56 131.92 159.26 17 201 110.88 69.01 - 104.71 99.88 114.47 18 202 118.44 96.12 - 160.78 128.66 173.83 19 210 197.96 89.58 - 143.21 177.14 234.63 20 221 312.93 162.22 - 172.53 293.48 538.75 21 222 165.87 121.97 - 170.20 162.55 231.65 22 223 201.58 128.38 - 133.24 168.90 303.02 23 231 304.90 393.79 - 163.69 267.04 315.57 24 232 945.60 742.12 - 223.43 468.31 643.02 25 241 442.07 155.98 - 231.37 358.01 509.27 26 242 222.03 96.96 - 146.91 175.56 344.32 27 243 436.92 161.42 - 188.28 389.36 520.14 28 251 247.76 141.01 - 157.12 224.35 297.54 29 252 145.27 97.89 - 138.70 140.89 225.68 30 261 223.10 120.42 - 143.58 194.80 271.44 31 269 195.16 109.45 - 127.22 158.08 230.49 32 271 387.01 581.88 - 174.37 312.82 475.72 33 272 529.70 564.14 - 134.16 411.43 516.64
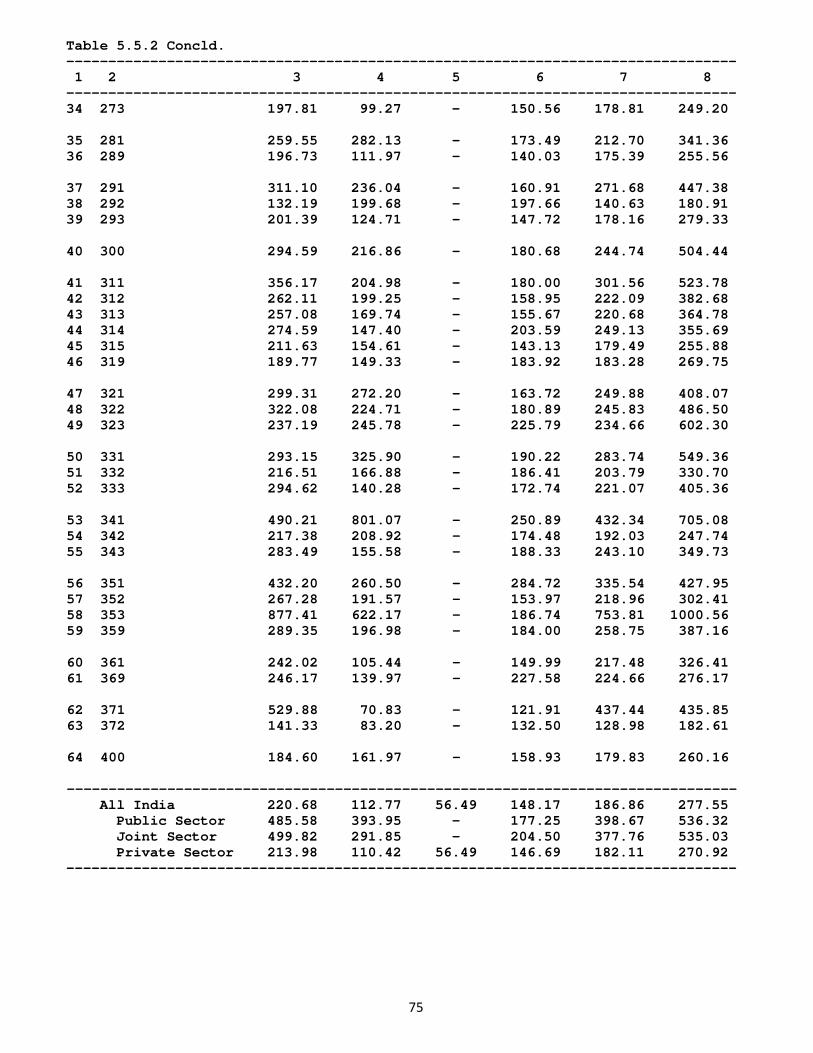
75
Table 5.5.2 Concld. -------------------------------------------------------------------------------- 1 2 3 4 5 6 7 8 -------------------------------------------------------------------------------- 34 273 197.81 99.27 - 150.56 178.81 249.20 35 281 259.55 282.13 - 173.49 212.70 341.36 36 289 196.73 111.97 - 140.03 175.39 255.56 37 291 311.10 236.04 - 160.91 271.68 447.38 38 292 132.19 199.68 - 197.66 140.63 180.91 39 293 201.39 124.71 - 147.72 178.16 279.33 40 300 294.59 216.86 - 180.68 244.74 504.44 41 311 356.17 204.98 - 180.00 301.56 523.78 42 312 262.11 199.25 - 158.95 222.09 382.68 43 313 257.08 169.74 - 155.67 220.68 364.78 44 314 274.59 147.40 - 203.59 249.13 355.69 45 315 211.63 154.61 - 143.13 179.49 255.88 46 319 189.77 149.33 - 183.92 183.28 269.75 47 321 299.31 272.20 - 163.72 249.88 408.07 48 322 322.08 224.71 - 180.89 245.83 486.50 49 323 237.19 245.78 - 225.79 234.66 602.30 50 331 293.15 325.90 - 190.22 283.74 549.36 51 332 216.51 166.88 - 186.41 203.79 330.70 52 333 294.62 140.28 - 172.74 221.07 405.36 53 341 490.21 801.07 - 250.89 432.34 705.08 54 342 217.38 208.92 - 174.48 192.03 247.74 55 343 283.49 155.58 - 188.33 243.10 349.73 56 351 432.20 260.50 - 284.72 335.54 427.95 57 352 267.28 191.57 - 153.97 218.96 302.41 58 353 877.41 622.17 - 186.74 753.81 1000.56 59 359 289.35 196.98 - 184.00 258.75 387.16 60 361 242.02 105.44 - 149.99 217.48 326.41 61 369 246.17 139.97 - 227.58 224.66 276.17 62 371 529.88 70.83 - 121.91 437.44 435.85 63 372 141.33 83.20 - 132.50 128.98 182.61 64 400 184.60 161.97 - 158.93 179.83 260.16 -------------------------------------------------------------------------------- All India 220.68 112.77 56.49 148.17 186.86 277.55 Public Sector 485.58 393.95 - 177.25 398.67 536.32 Joint Sector 499.82 291.85 - 204.50 377.76 535.03 Private Sector 213.98 110.42 56.49 146.69 182.11 270.92 --------------------------------------------------------------------------------
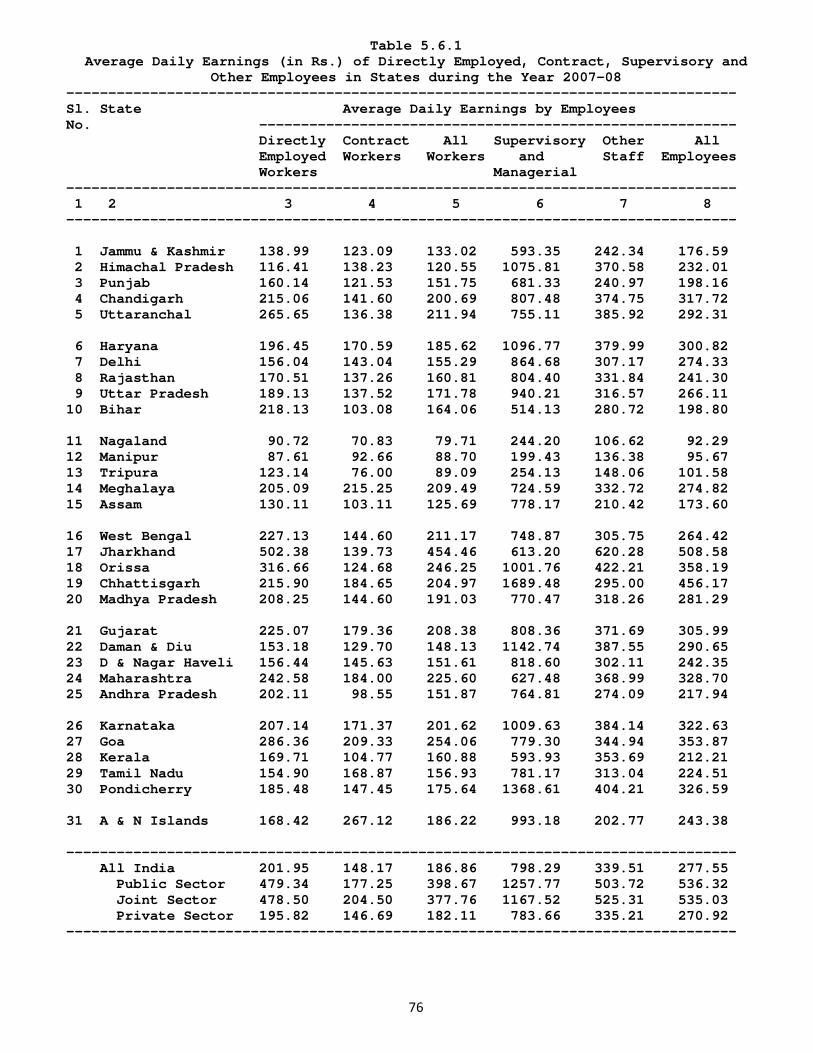
76
Table 5.6.1 Average Daily Earnings (in Rs.) of Directly Employed, Contract, Supervisory and
Other Employees in States during the Year 2007-08 -------------------------------------------------------------------------------- Sl. State Average Daily Earnings by Employees No. --------------------------------------------------------- Directly Contract All Supervisory Other All Employed Workers Workers and Staff Employees Workers Managerial -------------------------------------------------------------------------------- 1 2 3 4 5 6 7 8 -------------------------------------------------------------------------------- 1 Jammu & Kashmir 138.99 123.09 133.02 593.35 242.34 176.59 2 Himachal Pradesh 116.41 138.23 120.55 1075.81 370.58 232.01 3 Punjab 160.14 121.53 151.75 681.33 240.97 198.16 4 Chandigarh 215.06 141.60 200.69 807.48 374.75 317.72 5 Uttaranchal 265.65 136.38 211.94 755.11 385.92 292.31 6 Haryana 196.45 170.59 185.62 1096.77 379.99 300.82 7 Delhi 156.04 143.04 155.29 864.68 307.17 274.33 8 Rajasthan 170.51 137.26 160.81 804.40 331.84 241.30 9 Uttar Pradesh 189.13 137.52 171.78 940.21 316.57 266.11 10 Bihar 218.13 103.08 164.06 514.13 280.72 198.80 11 Nagaland 90.72 70.83 79.71 244.20 106.62 92.29 12 Manipur 87.61 92.66 88.70 199.43 136.38 95.67 13 Tripura 123.14 76.00 89.09 254.13 148.06 101.58 14 Meghalaya 205.09 215.25 209.49 724.59 332.72 274.82 15 Assam 130.11 103.11 125.69 778.17 210.42 173.60 16 West Bengal 227.13 144.60 211.17 748.87 305.75 264.42 17 Jharkhand 502.38 139.73 454.46 613.20 620.28 508.58 18 Orissa 316.66 124.68 246.25 1001.76 422.21 358.19 19 Chhattisgarh 215.90 184.65 204.97 1689.48 295.00 456.17 20 Madhya Pradesh 208.25 144.60 191.03 770.47 318.26 281.29 21 Gujarat 225.07 179.36 208.38 808.36 371.69 305.99 22 Daman & Diu 153.18 129.70 148.13 1142.74 387.55 290.65 23 D & Nagar Haveli 156.44 145.63 151.61 818.60 302.11 242.35 24 Maharashtra 242.58 184.00 225.60 627.48 368.99 328.70 25 Andhra Pradesh 202.11 98.55 151.87 764.81 274.09 217.94 26 Karnataka 207.14 171.37 201.62 1009.63 384.14 322.63 27 Goa 286.36 209.33 254.06 779.30 344.94 353.87 28 Kerala 169.71 104.77 160.88 593.93 353.69 212.21 29 Tamil Nadu 154.90 168.87 156.93 781.17 313.04 224.51 30 Pondicherry 185.48 147.45 175.64 1368.61 404.21 326.59 31 A & N Islands 168.42 267.12 186.22 993.18 202.77 243.38 -------------------------------------------------------------------------------- All India 201.95 148.17 186.86 798.29 339.51 277.55 Public Sector 479.34 177.25 398.67 1257.77 503.72 536.32 Joint Sector 478.50 204.50 377.76 1167.52 525.31 535.03 Private Sector 195.82 146.69 182.11 783.66 335.21 270.92 --------------------------------------------------------------------------------
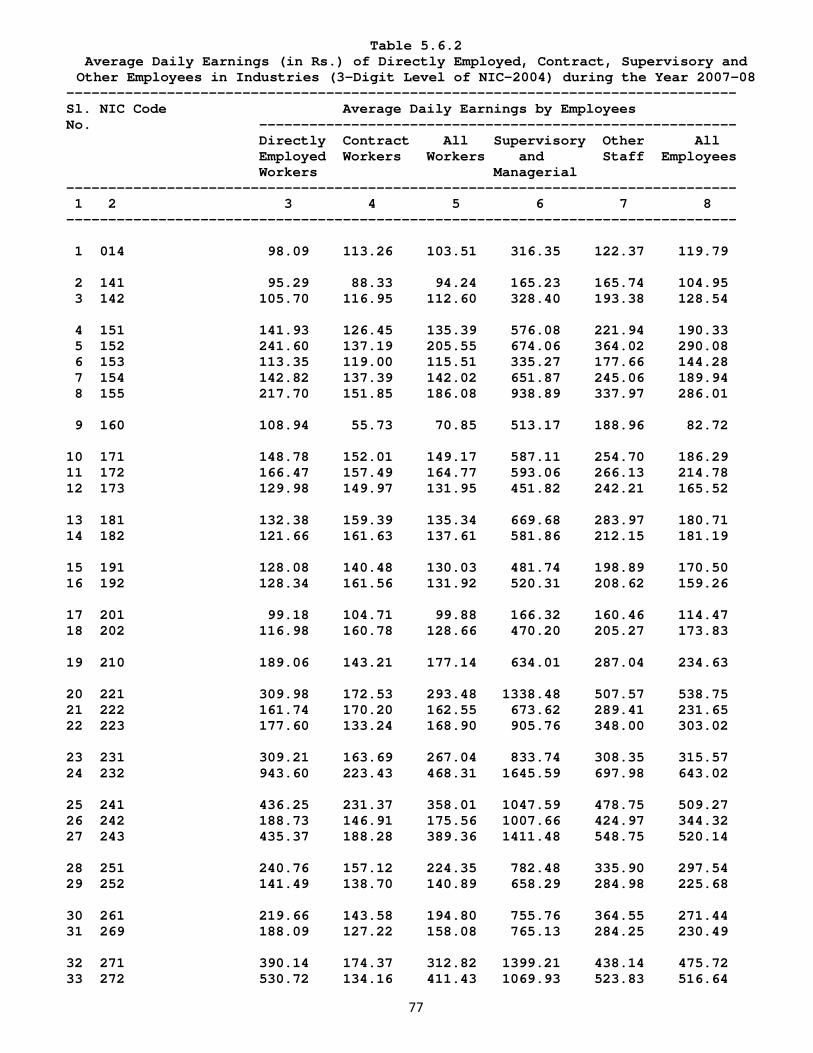
77
Table 5.6.2 Average Daily Earnings (in Rs.) of Directly Employed, Contract, Supervisory and
Other Employees in Industries (3-Digit Level of NIC-2004) during the Year 2007-08 -------------------------------------------------------------------------------- Sl. NIC Code Average Daily Earnings by Employees No. --------------------------------------------------------- Directly Contract All Supervisory Other All Employed Workers Workers and Staff Employees Workers Managerial -------------------------------------------------------------------------------- 1 2 3 4 5 6 7 8 -------------------------------------------------------------------------------- 1 014 98.09 113.26 103.51 316.35 122.37 119.79 2 141 95.29 88.33 94.24 165.23 165.74 104.95 3 142 105.70 116.95 112.60 328.40 193.38 128.54 4 151 141.93 126.45 135.39 576.08 221.94 190.33 5 152 241.60 137.19 205.55 674.06 364.02 290.08 6 153 113.35 119.00 115.51 335.27 177.66 144.28 7 154 142.82 137.39 142.02 651.87 245.06 189.94 8 155 217.70 151.85 186.08 938.89 337.97 286.01 9 160 108.94 55.73 70.85 513.17 188.96 82.72 10 171 148.78 152.01 149.17 587.11 254.70 186.29 11 172 166.47 157.49 164.77 593.06 266.13 214.78 12 173 129.98 149.97 131.95 451.82 242.21 165.52 13 181 132.38 159.39 135.34 669.68 283.97 180.71 14 182 121.66 161.63 137.61 581.86 212.15 181.19 15 191 128.08 140.48 130.03 481.74 198.89 170.50 16 192 128.34 161.56 131.92 520.31 208.62 159.26 17 201 99.18 104.71 99.88 166.32 160.46 114.47 18 202 116.98 160.78 128.66 470.20 205.27 173.83 19 210 189.06 143.21 177.14 634.01 287.04 234.63 20 221 309.98 172.53 293.48 1338.48 507.57 538.75 21 222 161.74 170.20 162.55 673.62 289.41 231.65 22 223 177.60 133.24 168.90 905.76 348.00 303.02 23 231 309.21 163.69 267.04 833.74 308.35 315.57 24 232 943.60 223.43 468.31 1645.59 697.98 643.02 25 241 436.25 231.37 358.01 1047.59 478.75 509.27 26 242 188.73 146.91 175.56 1007.66 424.97 344.32 27 243 435.37 188.28 389.36 1411.48 548.75 520.14 28 251 240.76 157.12 224.35 782.48 335.90 297.54 29 252 141.49 138.70 140.89 658.29 284.98 225.68 30 261 219.66 143.58 194.80 755.76 364.55 271.44 31 269 188.09 127.22 158.08 765.13 284.25 230.49 32 271 390.14 174.37 312.82 1399.21 438.14 475.72 33 272 530.72 134.16 411.43 1069.93 523.83 516.64
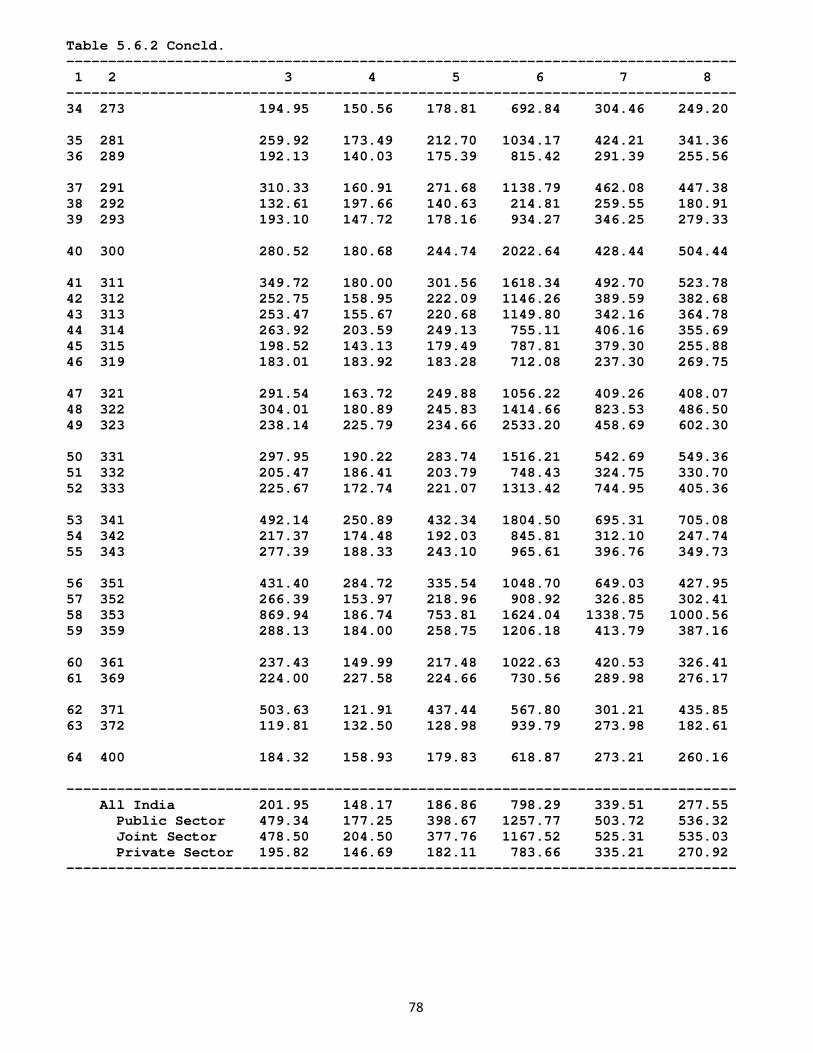
78
Table 5.6.2 Concld. -------------------------------------------------------------------------------- 1 2 3 4 5 6 7 8 -------------------------------------------------------------------------------- 34 273 194.95 150.56 178.81 692.84 304.46 249.20 35 281 259.92 173.49 212.70 1034.17 424.21 341.36 36 289 192.13 140.03 175.39 815.42 291.39 255.56 37 291 310.33 160.91 271.68 1138.79 462.08 447.38 38 292 132.61 197.66 140.63 214.81 259.55 180.91 39 293 193.10 147.72 178.16 934.27 346.25 279.33 40 300 280.52 180.68 244.74 2022.64 428.44 504.44 41 311 349.72 180.00 301.56 1618.34 492.70 523.78 42 312 252.75 158.95 222.09 1146.26 389.59 382.68 43 313 253.47 155.67 220.68 1149.80 342.16 364.78 44 314 263.92 203.59 249.13 755.11 406.16 355.69 45 315 198.52 143.13 179.49 787.81 379.30 255.88 46 319 183.01 183.92 183.28 712.08 237.30 269.75 47 321 291.54 163.72 249.88 1056.22 409.26 408.07 48 322 304.01 180.89 245.83 1414.66 823.53 486.50 49 323 238.14 225.79 234.66 2533.20 458.69 602.30 50 331 297.95 190.22 283.74 1516.21 542.69 549.36 51 332 205.47 186.41 203.79 748.43 324.75 330.70 52 333 225.67 172.74 221.07 1313.42 744.95 405.36 53 341 492.14 250.89 432.34 1804.50 695.31 705.08 54 342 217.37 174.48 192.03 845.81 312.10 247.74 55 343 277.39 188.33 243.10 965.61 396.76 349.73 56 351 431.40 284.72 335.54 1048.70 649.03 427.95 57 352 266.39 153.97 218.96 908.92 326.85 302.41 58 353 869.94 186.74 753.81 1624.04 1338.75 1000.56 59 359 288.13 184.00 258.75 1206.18 413.79 387.16 60 361 237.43 149.99 217.48 1022.63 420.53 326.41 61 369 224.00 227.58 224.66 730.56 289.98 276.17 62 371 503.63 121.91 437.44 567.80 301.21 435.85 63 372 119.81 132.50 128.98 939.79 273.98 182.61 64 400 184.32 158.93 179.83 618.87 273.21 260.16 -------------------------------------------------------------------------------- All India 201.95 148.17 186.86 798.29 339.51 277.55 Public Sector 479.34 177.25 398.67 1257.77 503.72 536.32 Joint Sector 478.50 204.50 377.76 1167.52 525.31 535.03 Private Sector 195.82 146.69 182.11 783.66 335.21 270.92 --------------------------------------------------------------------------------
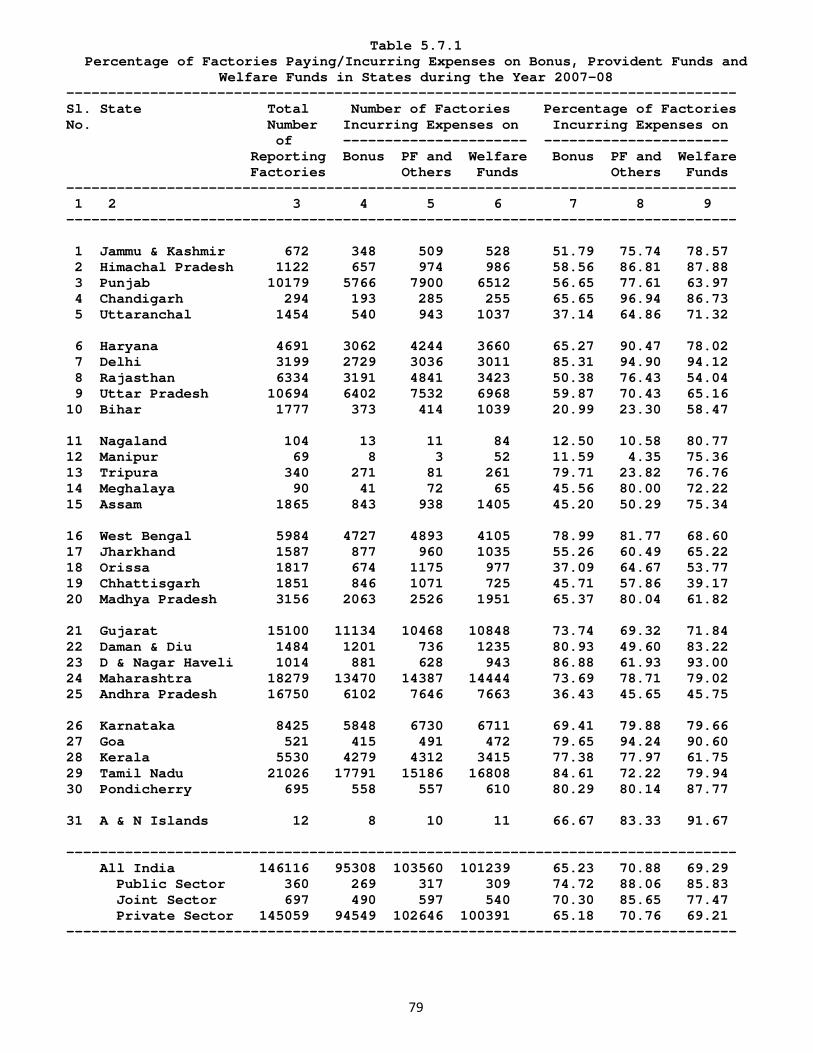
79
Table 5.7.1 Percentage of Factories Paying/Incurring Expenses on Bonus, Provident Funds and
Welfare Funds in States during the Year 2007-08 -------------------------------------------------------------------------------- Sl. State Total Number of Factories Percentage of Factories No. Number Incurring Expenses on Incurring Expenses on of ---------------------- ---------------------- Reporting Bonus PF and Welfare Bonus PF and Welfare Factories Others Funds Others Funds -------------------------------------------------------------------------------- 1 2 3 4 5 6 7 8 9 -------------------------------------------------------------------------------- 1 Jammu & Kashmir 672 348 509 528 51.79 75.74 78.57 2 Himachal Pradesh 1122 657 974 986 58.56 86.81 87.88 3 Punjab 10179 5766 7900 6512 56.65 77.61 63.97 4 Chandigarh 294 193 285 255 65.65 96.94 86.73 5 Uttaranchal 1454 540 943 1037 37.14 64.86 71.32 6 Haryana 4691 3062 4244 3660 65.27 90.47 78.02 7 Delhi 3199 2729 3036 3011 85.31 94.90 94.12 8 Rajasthan 6334 3191 4841 3423 50.38 76.43 54.04 9 Uttar Pradesh 10694 6402 7532 6968 59.87 70.43 65.16 10 Bihar 1777 373 414 1039 20.99 23.30 58.47 11 Nagaland 104 13 11 84 12.50 10.58 80.77 12 Manipur 69 8 3 52 11.59 4.35 75.36 13 Tripura 340 271 81 261 79.71 23.82 76.76 14 Meghalaya 90 41 72 65 45.56 80.00 72.22 15 Assam 1865 843 938 1405 45.20 50.29 75.34 16 West Bengal 5984 4727 4893 4105 78.99 81.77 68.60 17 Jharkhand 1587 877 960 1035 55.26 60.49 65.22 18 Orissa 1817 674 1175 977 37.09 64.67 53.77 19 Chhattisgarh 1851 846 1071 725 45.71 57.86 39.17 20 Madhya Pradesh 3156 2063 2526 1951 65.37 80.04 61.82 21 Gujarat 15100 11134 10468 10848 73.74 69.32 71.84 22 Daman & Diu 1484 1201 736 1235 80.93 49.60 83.22 23 D & Nagar Haveli 1014 881 628 943 86.88 61.93 93.00 24 Maharashtra 18279 13470 14387 14444 73.69 78.71 79.02 25 Andhra Pradesh 16750 6102 7646 7663 36.43 45.65 45.75 26 Karnataka 8425 5848 6730 6711 69.41 79.88 79.66 27 Goa 521 415 491 472 79.65 94.24 90.60 28 Kerala 5530 4279 4312 3415 77.38 77.97 61.75 29 Tamil Nadu 21026 17791 15186 16808 84.61 72.22 79.94 30 Pondicherry 695 558 557 610 80.29 80.14 87.77 31 A & N Islands 12 8 10 11 66.67 83.33 91.67 -------------------------------------------------------------------------------- All India 146116 95308 103560 101239 65.23 70.88 69.29 Public Sector 360 269 317 309 74.72 88.06 85.83 Joint Sector 697 490 597 540 70.30 85.65 77.47 Private Sector 145059 94549 102646 100391 65.18 70.76 69.21 --------------------------------------------------------------------------------
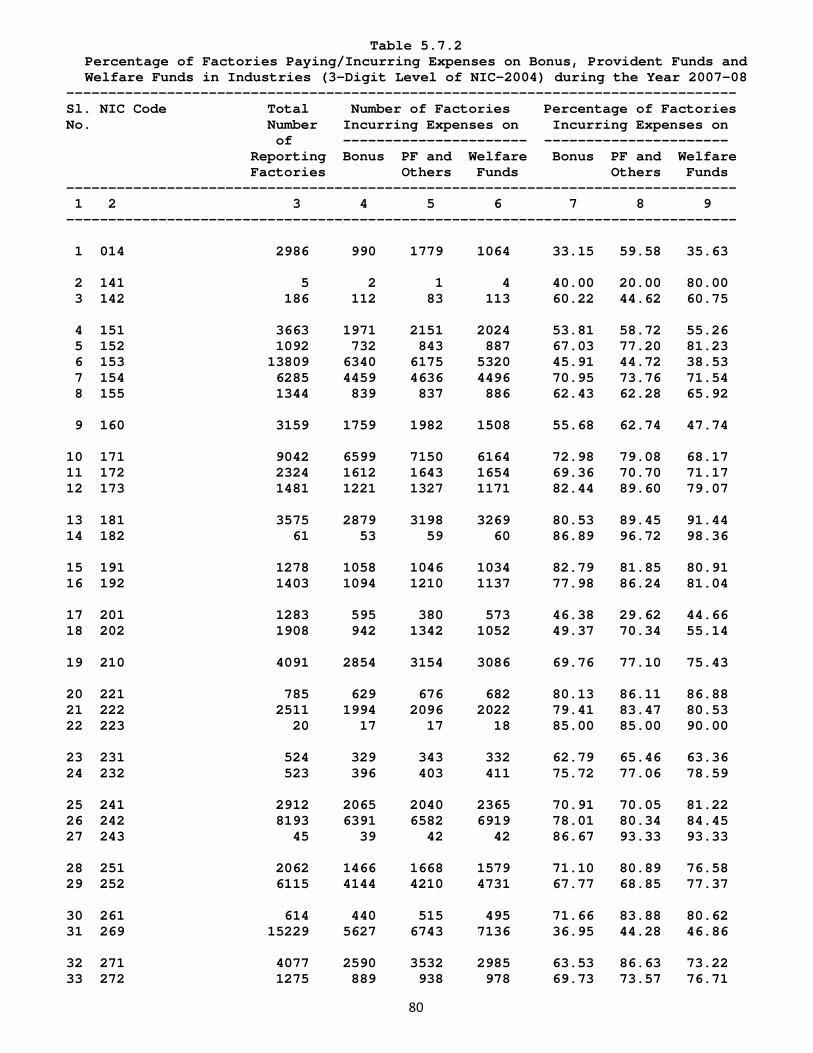
80
Table 5.7.2 Percentage of Factories Paying/Incurring Expenses on Bonus, Provident Funds and Welfare Funds in Industries (3-Digit Level of NIC-2004) during the Year 2007-08
-------------------------------------------------------------------------------- Sl. NIC Code Total Number of Factories Percentage of Factories No. Number Incurring Expenses on Incurring Expenses on of ---------------------- ---------------------- Reporting Bonus PF and Welfare Bonus PF and Welfare Factories Others Funds Others Funds -------------------------------------------------------------------------------- 1 2 3 4 5 6 7 8 9 -------------------------------------------------------------------------------- 1 014 2986 990 1779 1064 33.15 59.58 35.63 2 141 5 2 1 4 40.00 20.00 80.00 3 142 186 112 83 113 60.22 44.62 60.75 4 151 3663 1971 2151 2024 53.81 58.72 55.26 5 152 1092 732 843 887 67.03 77.20 81.23 6 153 13809 6340 6175 5320 45.91 44.72 38.53 7 154 6285 4459 4636 4496 70.95 73.76 71.54 8 155 1344 839 837 886 62.43 62.28 65.92 9 160 3159 1759 1982 1508 55.68 62.74 47.74 10 171 9042 6599 7150 6164 72.98 79.08 68.17 11 172 2324 1612 1643 1654 69.36 70.70 71.17 12 173 1481 1221 1327 1171 82.44 89.60 79.07 13 181 3575 2879 3198 3269 80.53 89.45 91.44 14 182 61 53 59 60 86.89 96.72 98.36 15 191 1278 1058 1046 1034 82.79 81.85 80.91 16 192 1403 1094 1210 1137 77.98 86.24 81.04 17 201 1283 595 380 573 46.38 29.62 44.66 18 202 1908 942 1342 1052 49.37 70.34 55.14 19 210 4091 2854 3154 3086 69.76 77.10 75.43 20 221 785 629 676 682 80.13 86.11 86.88 21 222 2511 1994 2096 2022 79.41 83.47 80.53 22 223 20 17 17 18 85.00 85.00 90.00 23 231 524 329 343 332 62.79 65.46 63.36 24 232 523 396 403 411 75.72 77.06 78.59 25 241 2912 2065 2040 2365 70.91 70.05 81.22 26 242 8193 6391 6582 6919 78.01 80.34 84.45 27 243 45 39 42 42 86.67 93.33 93.33 28 251 2062 1466 1668 1579 71.10 80.89 76.58 29 252 6115 4144 4210 4731 67.77 68.85 77.37 30 261 614 440 515 495 71.66 83.88 80.62 31 269 15229 5627 6743 7136 36.95 44.28 46.86 32 271 4077 2590 3532 2985 63.53 86.63 73.22 33 272 1275 889 938 978 69.73 73.57 76.71
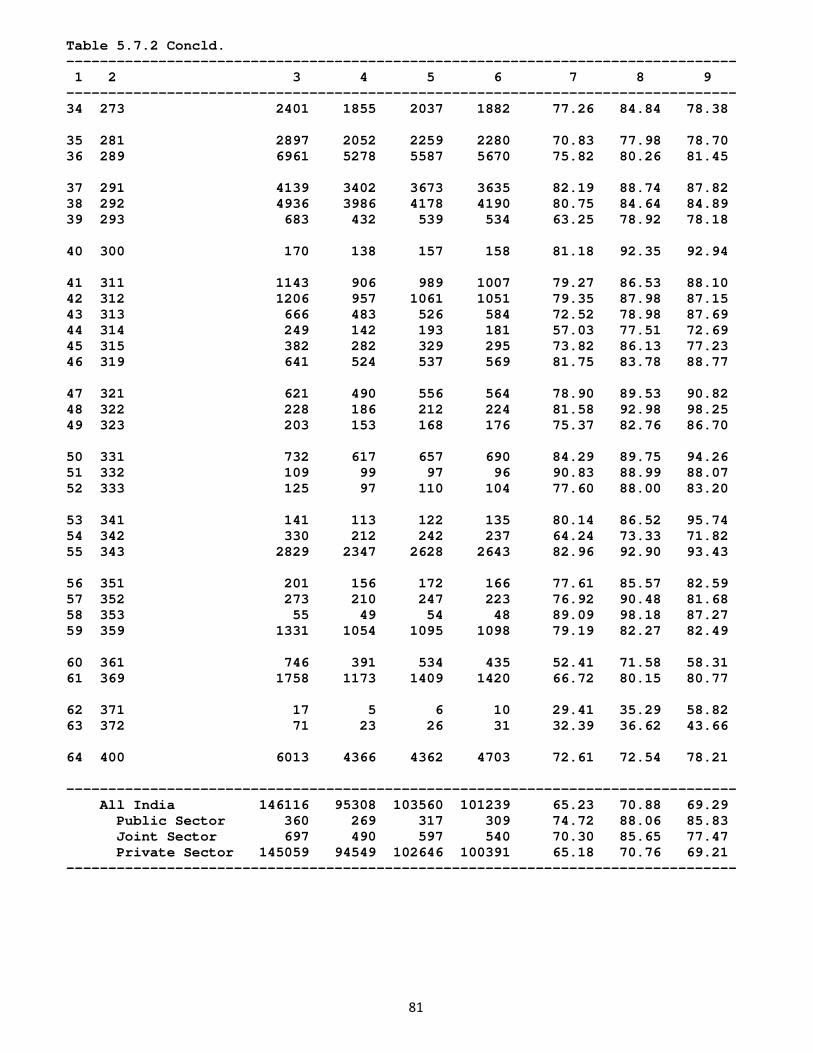
81
Table 5.7.2 Concld. -------------------------------------------------------------------------------- 1 2 3 4 5 6 7 8 9 -------------------------------------------------------------------------------- 34 273 2401 1855 2037 1882 77.26 84.84 78.38 35 281 2897 2052 2259 2280 70.83 77.98 78.70 36 289 6961 5278 5587 5670 75.82 80.26 81.45 37 291 4139 3402 3673 3635 82.19 88.74 87.82 38 292 4936 3986 4178 4190 80.75 84.64 84.89 39 293 683 432 539 534 63.25 78.92 78.18 40 300 170 138 157 158 81.18 92.35 92.94 41 311 1143 906 989 1007 79.27 86.53 88.10 42 312 1206 957 1061 1051 79.35 87.98 87.15 43 313 666 483 526 584 72.52 78.98 87.69 44 314 249 142 193 181 57.03 77.51 72.69 45 315 382 282 329 295 73.82 86.13 77.23 46 319 641 524 537 569 81.75 83.78 88.77 47 321 621 490 556 564 78.90 89.53 90.82 48 322 228 186 212 224 81.58 92.98 98.25 49 323 203 153 168 176 75.37 82.76 86.70 50 331 732 617 657 690 84.29 89.75 94.26 51 332 109 99 97 96 90.83 88.99 88.07 52 333 125 97 110 104 77.60 88.00 83.20 53 341 141 113 122 135 80.14 86.52 95.74 54 342 330 212 242 237 64.24 73.33 71.82 55 343 2829 2347 2628 2643 82.96 92.90 93.43 56 351 201 156 172 166 77.61 85.57 82.59 57 352 273 210 247 223 76.92 90.48 81.68 58 353 55 49 54 48 89.09 98.18 87.27 59 359 1331 1054 1095 1098 79.19 82.27 82.49 60 361 746 391 534 435 52.41 71.58 58.31 61 369 1758 1173 1409 1420 66.72 80.15 80.77 62 371 17 5 6 10 29.41 35.29 58.82 63 372 71 23 26 31 32.39 36.62 43.66 64 400 6013 4366 4362 4703 72.61 72.54 78.21 -------------------------------------------------------------------------------- All India 146116 95308 103560 101239 65.23 70.88 69.29 Public Sector 360 269 317 309 74.72 88.06 85.83 Joint Sector 697 490 597 540 70.30 85.65 77.47 Private Sector 145059 94549 102646 100391 65.18 70.76 69.21 --------------------------------------------------------------------------------
82
CHAPTER-VI
SPECIAL TABLE
6.1 Absenteeism and Labour Turnover at 4-Digit of NIC Detailed statistics on employment and labour cost at 4-digit of NIC-2004 by States and Sectors have already been published in Table 3.6 of “Annual Survey of Industries 2007-08, Volume-I - Statistics on Employment and Labour Cost”. Similar Table on absenteeism and labour turnover at 4-digit of NIC-2004 by States and Sectors has been presented in Table 6.1 for detailed analysis and application by the researchers and the policy planners. The Table presents detailed statistics on number of factories reporting directly employed workers, percentage of factories reporting absenteeism and labour turnover and percentage of absenteeism, accession and separation.
-0-0-0-
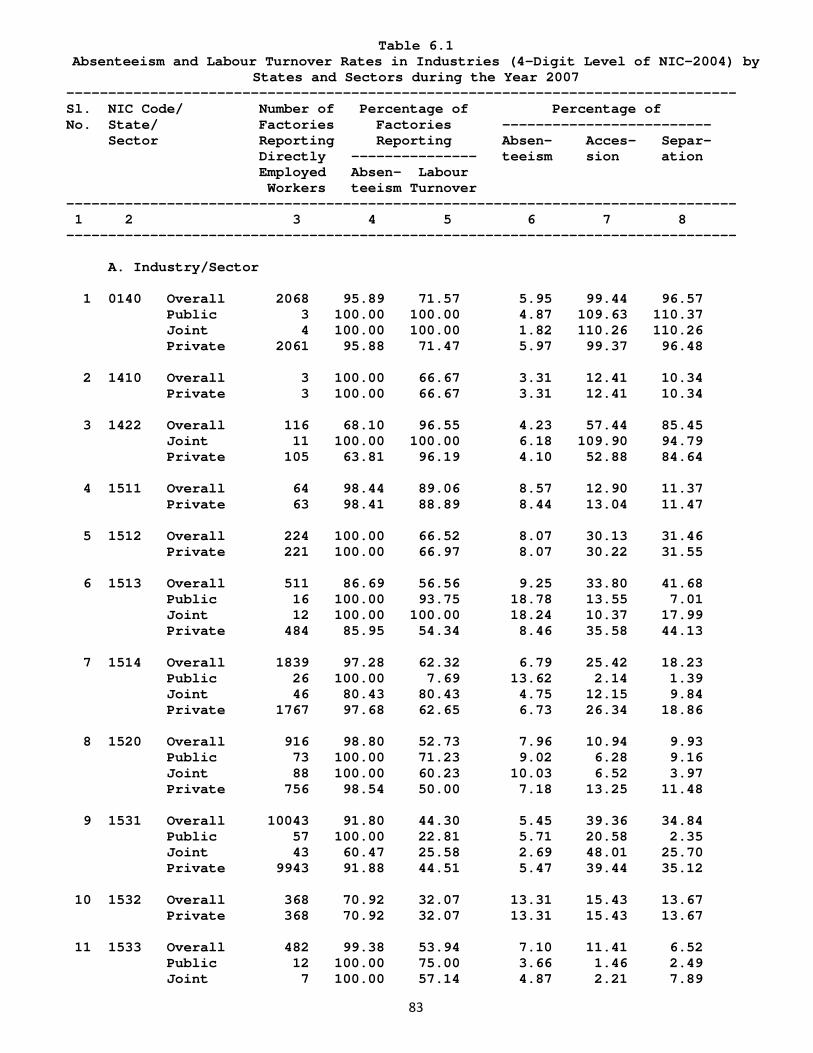
83
Table 6.1 Absenteeism and Labour Turnover Rates in Industries (4-Digit Level of NIC-2004) by
States and Sectors during the Year 2007 -------------------------------------------------------------------------------- Sl. NIC Code/ Number of Percentage of Percentage of No. State/ Factories Factories ------------------------- Sector Reporting Reporting Absen- Acces- Separ- Directly --------------- teeism sion ation Employed Absen- Labour Workers teeism Turnover -------------------------------------------------------------------------------- 1 2 3 4 5 6 7 8 -------------------------------------------------------------------------------- A. Industry/Sector 1 0140 Overall 2068 95.89 71.57 5.95 99.44 96.57 Public 3 100.00 100.00 4.87 109.63 110.37 Joint 4 100.00 100.00 1.82 110.26 110.26 Private 2061 95.88 71.47 5.97 99.37 96.48 2 1410 Overall 3 100.00 66.67 3.31 12.41 10.34 Private 3 100.00 66.67 3.31 12.41 10.34 3 1422 Overall 116 68.10 96.55 4.23 57.44 85.45 Joint 11 100.00 100.00 6.18 109.90 94.79 Private 105 63.81 96.19 4.10 52.88 84.64 4 1511 Overall 64 98.44 89.06 8.57 12.90 11.37 Private 63 98.41 88.89 8.44 13.04 11.47 5 1512 Overall 224 100.00 66.52 8.07 30.13 31.46 Private 221 100.00 66.97 8.07 30.22 31.55 6 1513 Overall 511 86.69 56.56 9.25 33.80 41.68 Public 16 100.00 93.75 18.78 13.55 7.01 Joint 12 100.00 100.00 18.24 10.37 17.99 Private 484 85.95 54.34 8.46 35.58 44.13 7 1514 Overall 1839 97.28 62.32 6.79 25.42 18.23 Public 26 100.00 7.69 13.62 2.14 1.39 Joint 46 80.43 80.43 4.75 12.15 9.84 Private 1767 97.68 62.65 6.73 26.34 18.86 8 1520 Overall 916 98.80 52.73 7.96 10.94 9.93 Public 73 100.00 71.23 9.02 6.28 9.16 Joint 88 100.00 60.23 10.03 6.52 3.97 Private 756 98.54 50.00 7.18 13.25 11.48 9 1531 Overall 10043 91.80 44.30 5.45 39.36 34.84 Public 57 100.00 22.81 5.71 20.58 2.35 Joint 43 60.47 25.58 2.69 48.01 25.70 Private 9943 91.88 44.51 5.47 39.44 35.12 10 1532 Overall 368 70.92 32.07 13.31 15.43 13.67 Private 368 70.92 32.07 13.31 15.43 13.67 11 1533 Overall 482 99.38 53.94 7.10 11.41 6.52 Public 12 100.00 75.00 3.66 1.46 2.49 Joint 7 100.00 57.14 4.87 2.21 7.89
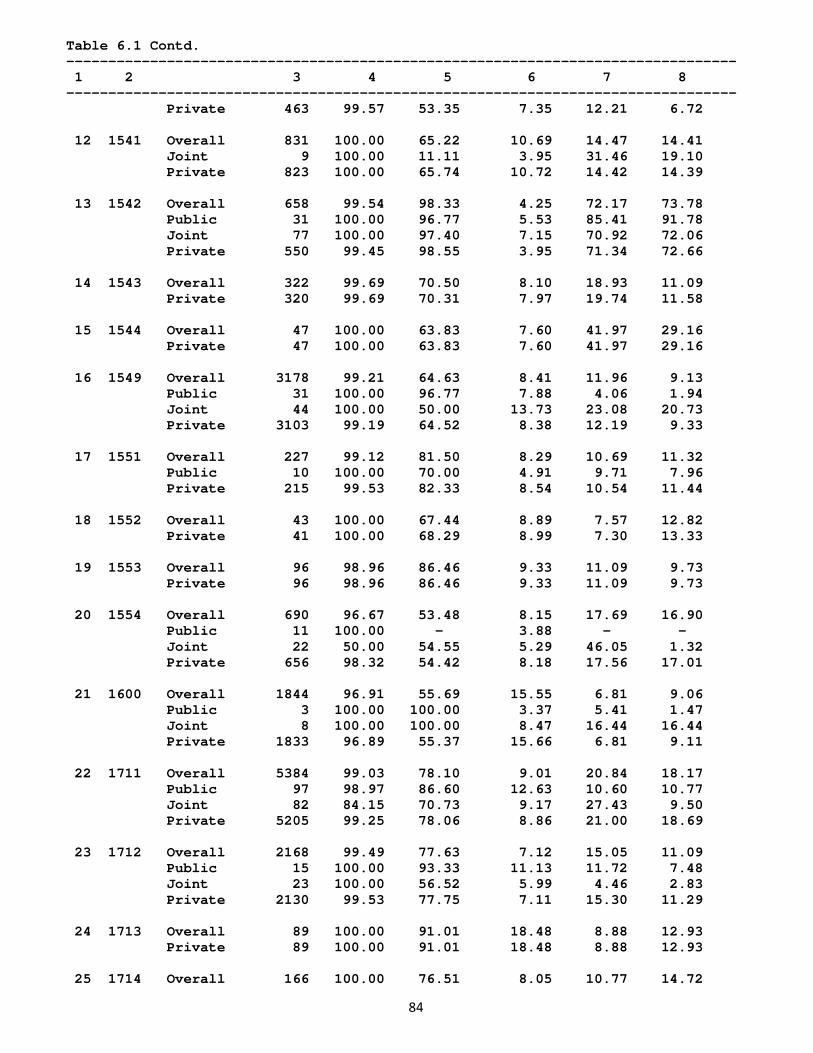
84
Table 6.1 Contd. -------------------------------------------------------------------------------- 1 2 3 4 5 6 7 8 -------------------------------------------------------------------------------- Private 463 99.57 53.35 7.35 12.21 6.72 12 1541 Overall 831 100.00 65.22 10.69 14.47 14.41 Joint 9 100.00 11.11 3.95 31.46 19.10 Private 823 100.00 65.74 10.72 14.42 14.39 13 1542 Overall 658 99.54 98.33 4.25 72.17 73.78 Public 31 100.00 96.77 5.53 85.41 91.78 Joint 77 100.00 97.40 7.15 70.92 72.06 Private 550 99.45 98.55 3.95 71.34 72.66 14 1543 Overall 322 99.69 70.50 8.10 18.93 11.09 Private 320 99.69 70.31 7.97 19.74 11.58 15 1544 Overall 47 100.00 63.83 7.60 41.97 29.16 Private 47 100.00 63.83 7.60 41.97 29.16 16 1549 Overall 3178 99.21 64.63 8.41 11.96 9.13 Public 31 100.00 96.77 7.88 4.06 1.94 Joint 44 100.00 50.00 13.73 23.08 20.73 Private 3103 99.19 64.52 8.38 12.19 9.33 17 1551 Overall 227 99.12 81.50 8.29 10.69 11.32 Public 10 100.00 70.00 4.91 9.71 7.96 Private 215 99.53 82.33 8.54 10.54 11.44 18 1552 Overall 43 100.00 67.44 8.89 7.57 12.82 Private 41 100.00 68.29 8.99 7.30 13.33 19 1553 Overall 96 98.96 86.46 9.33 11.09 9.73 Private 96 98.96 86.46 9.33 11.09 9.73 20 1554 Overall 690 96.67 53.48 8.15 17.69 16.90 Public 11 100.00 - 3.88 - - Joint 22 50.00 54.55 5.29 46.05 1.32 Private 656 98.32 54.42 8.18 17.56 17.01 21 1600 Overall 1844 96.91 55.69 15.55 6.81 9.06 Public 3 100.00 100.00 3.37 5.41 1.47 Joint 8 100.00 100.00 8.47 16.44 16.44 Private 1833 96.89 55.37 15.66 6.81 9.11 22 1711 Overall 5384 99.03 78.10 9.01 20.84 18.17 Public 97 98.97 86.60 12.63 10.60 10.77 Joint 82 84.15 70.73 9.17 27.43 9.50 Private 5205 99.25 78.06 8.86 21.00 18.69 23 1712 Overall 2168 99.49 77.63 7.12 15.05 11.09 Public 15 100.00 93.33 11.13 11.72 7.48 Joint 23 100.00 56.52 5.99 4.46 2.83 Private 2130 99.53 77.75 7.11 15.30 11.29 24 1713 Overall 89 100.00 91.01 18.48 8.88 12.93 Private 89 100.00 91.01 18.48 8.88 12.93 25 1714 Overall 166 100.00 76.51 8.05 10.77 14.72
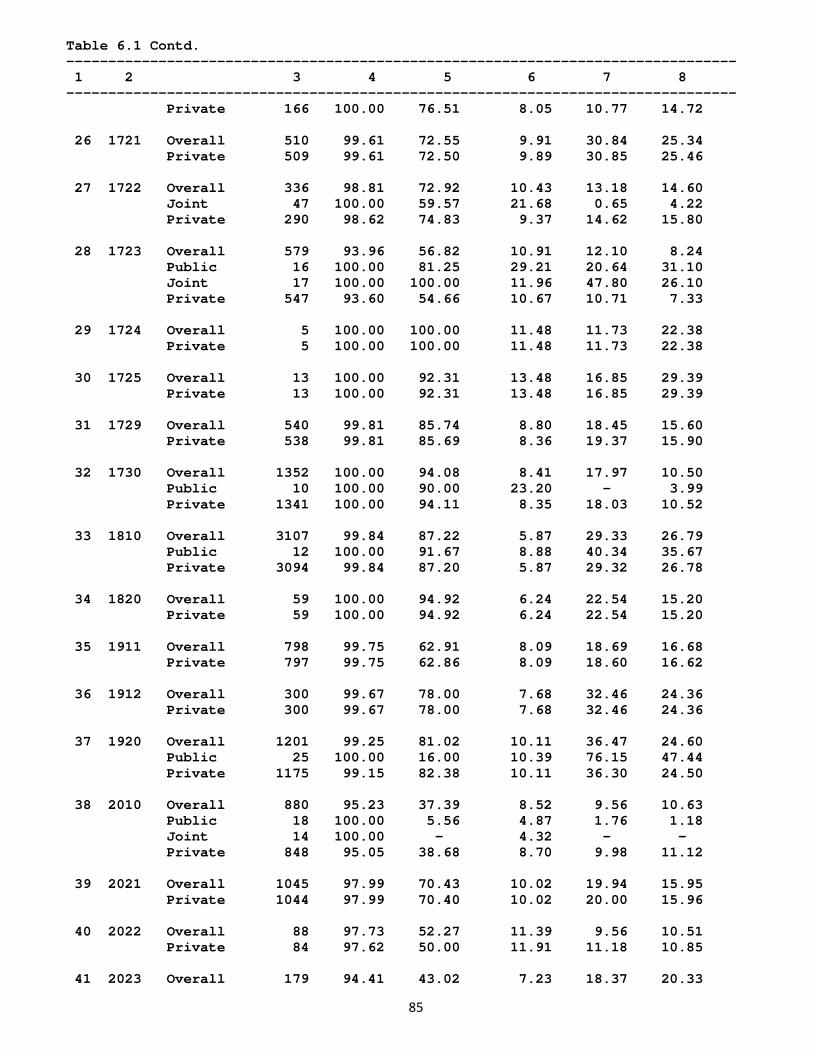
85
Table 6.1 Contd. -------------------------------------------------------------------------------- 1 2 3 4 5 6 7 8 -------------------------------------------------------------------------------- Private 166 100.00 76.51 8.05 10.77 14.72 26 1721 Overall 510 99.61 72.55 9.91 30.84 25.34 Private 509 99.61 72.50 9.89 30.85 25.46 27 1722 Overall 336 98.81 72.92 10.43 13.18 14.60 Joint 47 100.00 59.57 21.68 0.65 4.22 Private 290 98.62 74.83 9.37 14.62 15.80 28 1723 Overall 579 93.96 56.82 10.91 12.10 8.24 Public 16 100.00 81.25 29.21 20.64 31.10 Joint 17 100.00 100.00 11.96 47.80 26.10 Private 547 93.60 54.66 10.67 10.71 7.33 29 1724 Overall 5 100.00 100.00 11.48 11.73 22.38 Private 5 100.00 100.00 11.48 11.73 22.38 30 1725 Overall 13 100.00 92.31 13.48 16.85 29.39 Private 13 100.00 92.31 13.48 16.85 29.39 31 1729 Overall 540 99.81 85.74 8.80 18.45 15.60 Private 538 99.81 85.69 8.36 19.37 15.90 32 1730 Overall 1352 100.00 94.08 8.41 17.97 10.50 Public 10 100.00 90.00 23.20 - 3.99 Private 1341 100.00 94.11 8.35 18.03 10.52 33 1810 Overall 3107 99.84 87.22 5.87 29.33 26.79 Public 12 100.00 91.67 8.88 40.34 35.67 Private 3094 99.84 87.20 5.87 29.32 26.78 34 1820 Overall 59 100.00 94.92 6.24 22.54 15.20 Private 59 100.00 94.92 6.24 22.54 15.20 35 1911 Overall 798 99.75 62.91 8.09 18.69 16.68 Private 797 99.75 62.86 8.09 18.60 16.62 36 1912 Overall 300 99.67 78.00 7.68 32.46 24.36 Private 300 99.67 78.00 7.68 32.46 24.36 37 1920 Overall 1201 99.25 81.02 10.11 36.47 24.60 Public 25 100.00 16.00 10.39 76.15 47.44 Private 1175 99.15 82.38 10.11 36.30 24.50 38 2010 Overall 880 95.23 37.39 8.52 9.56 10.63 Public 18 100.00 5.56 4.87 1.76 1.18 Joint 14 100.00 - 4.32 - - Private 848 95.05 38.68 8.70 9.98 11.12 39 2021 Overall 1045 97.99 70.43 10.02 19.94 15.95 Private 1044 97.99 70.40 10.02 20.00 15.96 40 2022 Overall 88 97.73 52.27 11.39 9.56 10.51 Private 84 97.62 50.00 11.91 11.18 10.85 41 2023 Overall 179 94.41 43.02 7.23 18.37 20.33
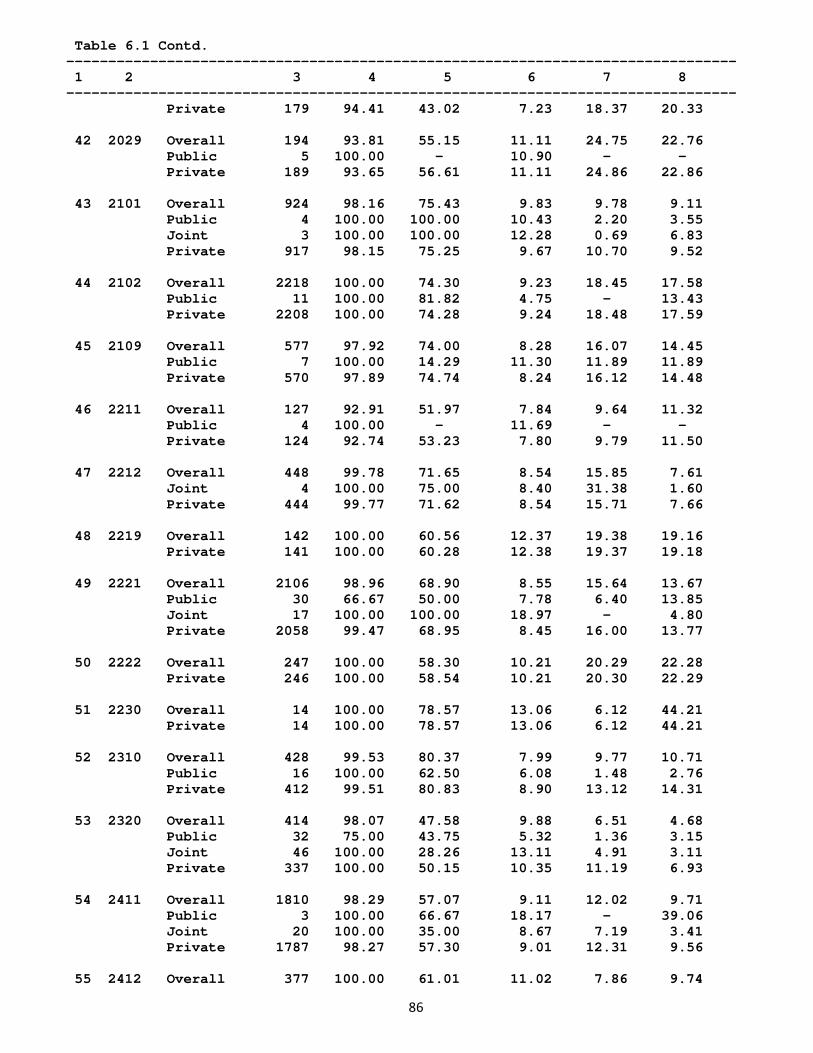
86
Table 6.1 Contd. -------------------------------------------------------------------------------- 1 2 3 4 5 6 7 8 -------------------------------------------------------------------------------- Private 179 94.41 43.02 7.23 18.37 20.33 42 2029 Overall 194 93.81 55.15 11.11 24.75 22.76 Public 5 100.00 - 10.90 - - Private 189 93.65 56.61 11.11 24.86 22.86 43 2101 Overall 924 98.16 75.43 9.83 9.78 9.11 Public 4 100.00 100.00 10.43 2.20 3.55 Joint 3 100.00 100.00 12.28 0.69 6.83 Private 917 98.15 75.25 9.67 10.70 9.52 44 2102 Overall 2218 100.00 74.30 9.23 18.45 17.58 Public 11 100.00 81.82 4.75 - 13.43 Private 2208 100.00 74.28 9.24 18.48 17.59 45 2109 Overall 577 97.92 74.00 8.28 16.07 14.45 Public 7 100.00 14.29 11.30 11.89 11.89 Private 570 97.89 74.74 8.24 16.12 14.48 46 2211 Overall 127 92.91 51.97 7.84 9.64 11.32 Public 4 100.00 - 11.69 - - Private 124 92.74 53.23 7.80 9.79 11.50 47 2212 Overall 448 99.78 71.65 8.54 15.85 7.61 Joint 4 100.00 75.00 8.40 31.38 1.60 Private 444 99.77 71.62 8.54 15.71 7.66 48 2219 Overall 142 100.00 60.56 12.37 19.38 19.16 Private 141 100.00 60.28 12.38 19.37 19.18 49 2221 Overall 2106 98.96 68.90 8.55 15.64 13.67 Public 30 66.67 50.00 7.78 6.40 13.85 Joint 17 100.00 100.00 18.97 - 4.80 Private 2058 99.47 68.95 8.45 16.00 13.77 50 2222 Overall 247 100.00 58.30 10.21 20.29 22.28 Private 246 100.00 58.54 10.21 20.30 22.29 51 2230 Overall 14 100.00 78.57 13.06 6.12 44.21 Private 14 100.00 78.57 13.06 6.12 44.21 52 2310 Overall 428 99.53 80.37 7.99 9.77 10.71 Public 16 100.00 62.50 6.08 1.48 2.76 Private 412 99.51 80.83 8.90 13.12 14.31 53 2320 Overall 414 98.07 47.58 9.88 6.51 4.68 Public 32 75.00 43.75 5.32 1.36 3.15 Joint 46 100.00 28.26 13.11 4.91 3.11 Private 337 100.00 50.15 10.35 11.19 6.93 54 2411 Overall 1810 98.29 57.07 9.11 12.02 9.71 Public 3 100.00 66.67 18.17 - 39.06 Joint 20 100.00 35.00 8.67 7.19 3.41 Private 1787 98.27 57.30 9.01 12.31 9.56 55 2412 Overall 377 100.00 61.01 11.02 7.86 9.74
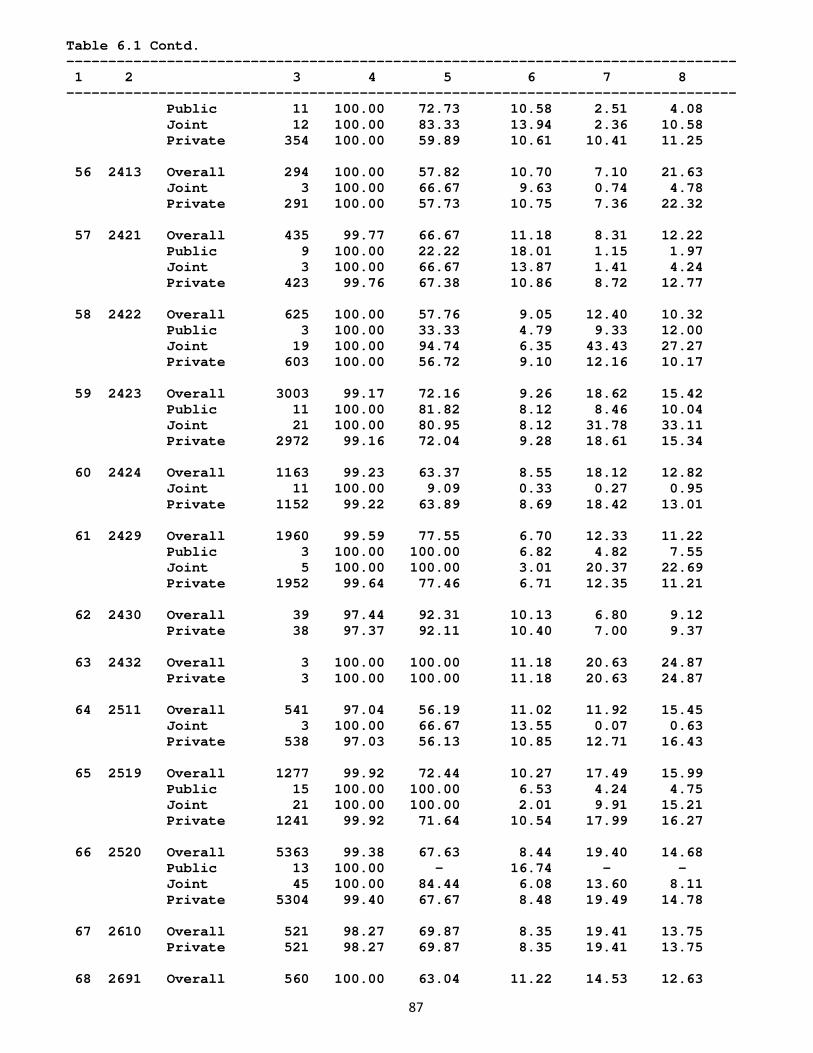
87
Table 6.1 Contd. -------------------------------------------------------------------------------- 1 2 3 4 5 6 7 8 -------------------------------------------------------------------------------- Public 11 100.00 72.73 10.58 2.51 4.08 Joint 12 100.00 83.33 13.94 2.36 10.58 Private 354 100.00 59.89 10.61 10.41 11.25 56 2413 Overall 294 100.00 57.82 10.70 7.10 21.63 Joint 3 100.00 66.67 9.63 0.74 4.78 Private 291 100.00 57.73 10.75 7.36 22.32 57 2421 Overall 435 99.77 66.67 11.18 8.31 12.22 Public 9 100.00 22.22 18.01 1.15 1.97 Joint 3 100.00 66.67 13.87 1.41 4.24 Private 423 99.76 67.38 10.86 8.72 12.77 58 2422 Overall 625 100.00 57.76 9.05 12.40 10.32 Public 3 100.00 33.33 4.79 9.33 12.00 Joint 19 100.00 94.74 6.35 43.43 27.27 Private 603 100.00 56.72 9.10 12.16 10.17 59 2423 Overall 3003 99.17 72.16 9.26 18.62 15.42 Public 11 100.00 81.82 8.12 8.46 10.04 Joint 21 100.00 80.95 8.12 31.78 33.11 Private 2972 99.16 72.04 9.28 18.61 15.34 60 2424 Overall 1163 99.23 63.37 8.55 18.12 12.82 Joint 11 100.00 9.09 0.33 0.27 0.95 Private 1152 99.22 63.89 8.69 18.42 13.01 61 2429 Overall 1960 99.59 77.55 6.70 12.33 11.22 Public 3 100.00 100.00 6.82 4.82 7.55 Joint 5 100.00 100.00 3.01 20.37 22.69 Private 1952 99.64 77.46 6.71 12.35 11.21 62 2430 Overall 39 97.44 92.31 10.13 6.80 9.12 Private 38 97.37 92.11 10.40 7.00 9.37 63 2432 Overall 3 100.00 100.00 11.18 20.63 24.87 Private 3 100.00 100.00 11.18 20.63 24.87 64 2511 Overall 541 97.04 56.19 11.02 11.92 15.45 Joint 3 100.00 66.67 13.55 0.07 0.63 Private 538 97.03 56.13 10.85 12.71 16.43 65 2519 Overall 1277 99.92 72.44 10.27 17.49 15.99 Public 15 100.00 100.00 6.53 4.24 4.75 Joint 21 100.00 100.00 2.01 9.91 15.21 Private 1241 99.92 71.64 10.54 17.99 16.27 66 2520 Overall 5363 99.38 67.63 8.44 19.40 14.68 Public 13 100.00 - 16.74 - - Joint 45 100.00 84.44 6.08 13.60 8.11 Private 5304 99.40 67.67 8.48 19.49 14.78 67 2610 Overall 521 98.27 69.87 8.35 19.41 13.75 Private 521 98.27 69.87 8.35 19.41 13.75 68 2691 Overall 560 100.00 63.04 11.22 14.53 12.63
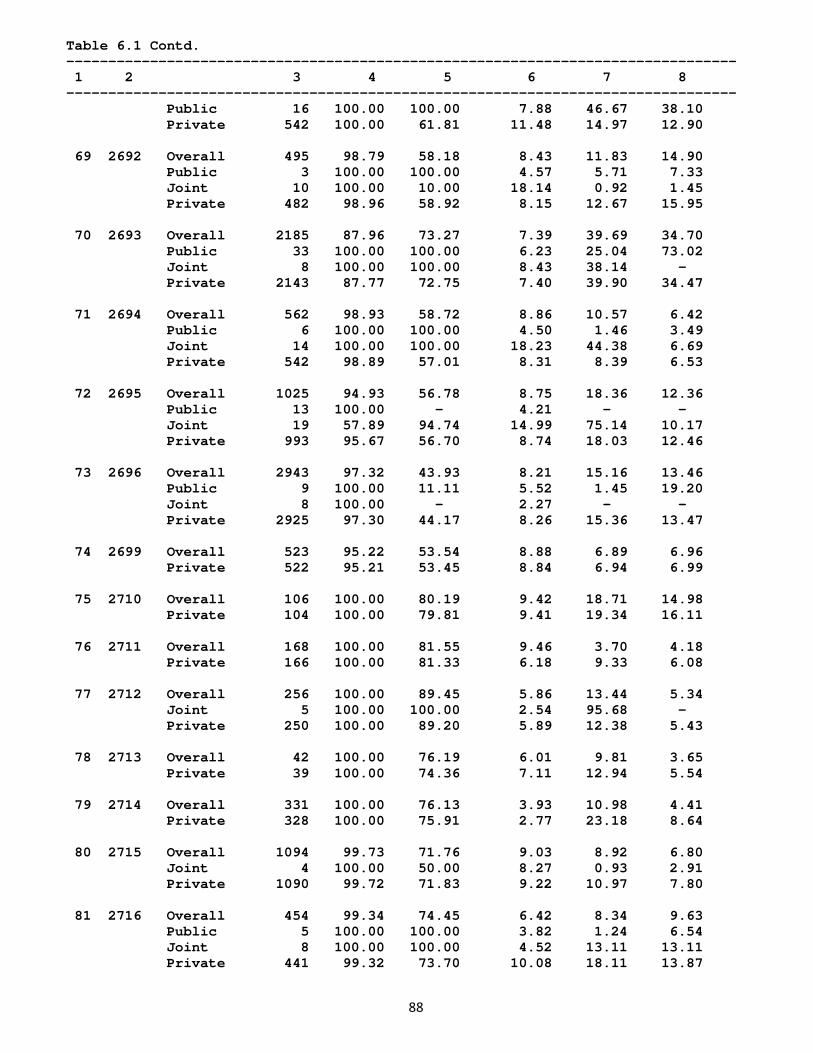
88
Table 6.1 Contd. -------------------------------------------------------------------------------- 1 2 3 4 5 6 7 8 -------------------------------------------------------------------------------- Public 16 100.00 100.00 7.88 46.67 38.10 Private 542 100.00 61.81 11.48 14.97 12.90 69 2692 Overall 495 98.79 58.18 8.43 11.83 14.90 Public 3 100.00 100.00 4.57 5.71 7.33 Joint 10 100.00 10.00 18.14 0.92 1.45 Private 482 98.96 58.92 8.15 12.67 15.95 70 2693 Overall 2185 87.96 73.27 7.39 39.69 34.70 Public 33 100.00 100.00 6.23 25.04 73.02 Joint 8 100.00 100.00 8.43 38.14 - Private 2143 87.77 72.75 7.40 39.90 34.47 71 2694 Overall 562 98.93 58.72 8.86 10.57 6.42 Public 6 100.00 100.00 4.50 1.46 3.49 Joint 14 100.00 100.00 18.23 44.38 6.69 Private 542 98.89 57.01 8.31 8.39 6.53 72 2695 Overall 1025 94.93 56.78 8.75 18.36 12.36 Public 13 100.00 - 4.21 - - Joint 19 57.89 94.74 14.99 75.14 10.17 Private 993 95.67 56.70 8.74 18.03 12.46 73 2696 Overall 2943 97.32 43.93 8.21 15.16 13.46 Public 9 100.00 11.11 5.52 1.45 19.20 Joint 8 100.00 - 2.27 - - Private 2925 97.30 44.17 8.26 15.36 13.47 74 2699 Overall 523 95.22 53.54 8.88 6.89 6.96 Private 522 95.21 53.45 8.84 6.94 6.99 75 2710 Overall 106 100.00 80.19 9.42 18.71 14.98 Private 104 100.00 79.81 9.41 19.34 16.11 76 2711 Overall 168 100.00 81.55 9.46 3.70 4.18 Private 166 100.00 81.33 6.18 9.33 6.08 77 2712 Overall 256 100.00 89.45 5.86 13.44 5.34 Joint 5 100.00 100.00 2.54 95.68 - Private 250 100.00 89.20 5.89 12.38 5.43 78 2713 Overall 42 100.00 76.19 6.01 9.81 3.65 Private 39 100.00 74.36 7.11 12.94 5.54 79 2714 Overall 331 100.00 76.13 3.93 10.98 4.41 Private 328 100.00 75.91 2.77 23.18 8.64 80 2715 Overall 1094 99.73 71.76 9.03 8.92 6.80 Joint 4 100.00 50.00 8.27 0.93 2.91 Private 1090 99.72 71.83 9.22 10.97 7.80 81 2716 Overall 454 99.34 74.45 6.42 8.34 9.63 Public 5 100.00 100.00 3.82 1.24 6.54 Joint 8 100.00 100.00 4.52 13.11 13.11 Private 441 99.32 73.70 10.08 18.11 13.87
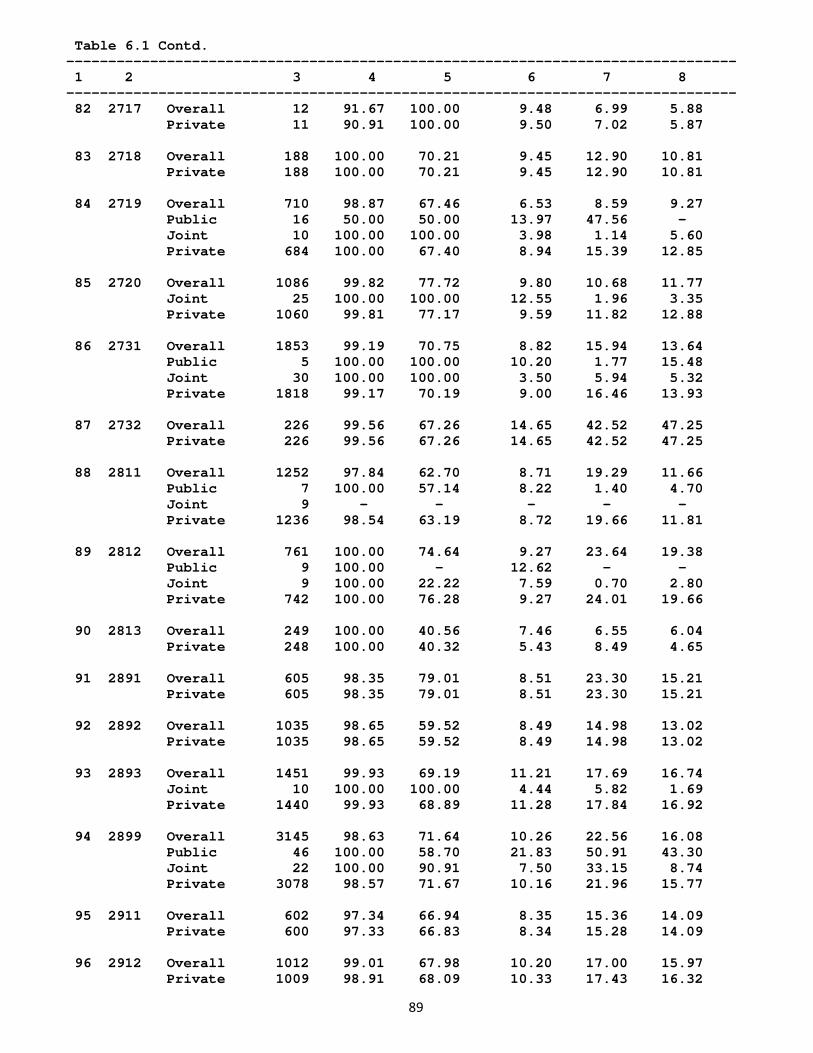
89
Table 6.1 Contd. -------------------------------------------------------------------------------- 1 2 3 4 5 6 7 8 -------------------------------------------------------------------------------- 82 2717 Overall 12 91.67 100.00 9.48 6.99 5.88 Private 11 90.91 100.00 9.50 7.02 5.87 83 2718 Overall 188 100.00 70.21 9.45 12.90 10.81 Private 188 100.00 70.21 9.45 12.90 10.81 84 2719 Overall 710 98.87 67.46 6.53 8.59 9.27 Public 16 50.00 50.00 13.97 47.56 - Joint 10 100.00 100.00 3.98 1.14 5.60 Private 684 100.00 67.40 8.94 15.39 12.85 85 2720 Overall 1086 99.82 77.72 9.80 10.68 11.77 Joint 25 100.00 100.00 12.55 1.96 3.35 Private 1060 99.81 77.17 9.59 11.82 12.88 86 2731 Overall 1853 99.19 70.75 8.82 15.94 13.64 Public 5 100.00 100.00 10.20 1.77 15.48 Joint 30 100.00 100.00 3.50 5.94 5.32 Private 1818 99.17 70.19 9.00 16.46 13.93 87 2732 Overall 226 99.56 67.26 14.65 42.52 47.25 Private 226 99.56 67.26 14.65 42.52 47.25 88 2811 Overall 1252 97.84 62.70 8.71 19.29 11.66 Public 7 100.00 57.14 8.22 1.40 4.70 Joint 9 - - - - - Private 1236 98.54 63.19 8.72 19.66 11.81 89 2812 Overall 761 100.00 74.64 9.27 23.64 19.38 Public 9 100.00 - 12.62 - - Joint 9 100.00 22.22 7.59 0.70 2.80 Private 742 100.00 76.28 9.27 24.01 19.66 90 2813 Overall 249 100.00 40.56 7.46 6.55 6.04 Private 248 100.00 40.32 5.43 8.49 4.65 91 2891 Overall 605 98.35 79.01 8.51 23.30 15.21 Private 605 98.35 79.01 8.51 23.30 15.21 92 2892 Overall 1035 98.65 59.52 8.49 14.98 13.02 Private 1035 98.65 59.52 8.49 14.98 13.02 93 2893 Overall 1451 99.93 69.19 11.21 17.69 16.74 Joint 10 100.00 100.00 4.44 5.82 1.69 Private 1440 99.93 68.89 11.28 17.84 16.92 94 2899 Overall 3145 98.63 71.64 10.26 22.56 16.08 Public 46 100.00 58.70 21.83 50.91 43.30 Joint 22 100.00 90.91 7.50 33.15 8.74 Private 3078 98.57 71.67 10.16 21.96 15.77 95 2911 Overall 602 97.34 66.94 8.35 15.36 14.09 Private 600 97.33 66.83 8.34 15.28 14.09 96 2912 Overall 1012 99.01 67.98 10.20 17.00 15.97 Private 1009 98.91 68.09 10.33 17.43 16.32
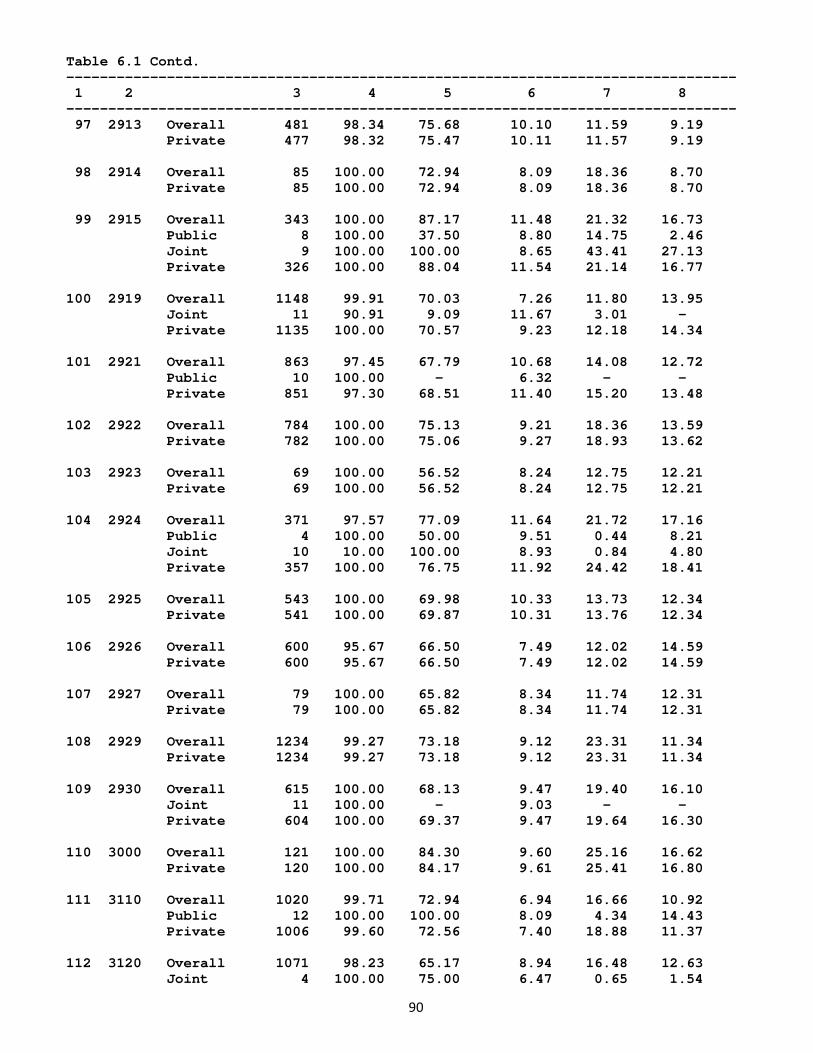
90
Table 6.1 Contd. -------------------------------------------------------------------------------- 1 2 3 4 5 6 7 8 -------------------------------------------------------------------------------- 97 2913 Overall 481 98.34 75.68 10.10 11.59 9.19 Private 477 98.32 75.47 10.11 11.57 9.19 98 2914 Overall 85 100.00 72.94 8.09 18.36 8.70 Private 85 100.00 72.94 8.09 18.36 8.70 99 2915 Overall 343 100.00 87.17 11.48 21.32 16.73 Public 8 100.00 37.50 8.80 14.75 2.46 Joint 9 100.00 100.00 8.65 43.41 27.13 Private 326 100.00 88.04 11.54 21.14 16.77 100 2919 Overall 1148 99.91 70.03 7.26 11.80 13.95 Joint 11 90.91 9.09 11.67 3.01 - Private 1135 100.00 70.57 9.23 12.18 14.34 101 2921 Overall 863 97.45 67.79 10.68 14.08 12.72 Public 10 100.00 - 6.32 - - Private 851 97.30 68.51 11.40 15.20 13.48 102 2922 Overall 784 100.00 75.13 9.21 18.36 13.59 Private 782 100.00 75.06 9.27 18.93 13.62 103 2923 Overall 69 100.00 56.52 8.24 12.75 12.21 Private 69 100.00 56.52 8.24 12.75 12.21 104 2924 Overall 371 97.57 77.09 11.64 21.72 17.16 Public 4 100.00 50.00 9.51 0.44 8.21 Joint 10 10.00 100.00 8.93 0.84 4.80 Private 357 100.00 76.75 11.92 24.42 18.41 105 2925 Overall 543 100.00 69.98 10.33 13.73 12.34 Private 541 100.00 69.87 10.31 13.76 12.34 106 2926 Overall 600 95.67 66.50 7.49 12.02 14.59 Private 600 95.67 66.50 7.49 12.02 14.59 107 2927 Overall 79 100.00 65.82 8.34 11.74 12.31 Private 79 100.00 65.82 8.34 11.74 12.31 108 2929 Overall 1234 99.27 73.18 9.12 23.31 11.34 Private 1234 99.27 73.18 9.12 23.31 11.34 109 2930 Overall 615 100.00 68.13 9.47 19.40 16.10 Joint 11 100.00 - 9.03 - - Private 604 100.00 69.37 9.47 19.64 16.30 110 3000 Overall 121 100.00 84.30 9.60 25.16 16.62 Private 120 100.00 84.17 9.61 25.41 16.80 111 3110 Overall 1020 99.71 72.94 6.94 16.66 10.92 Public 12 100.00 100.00 8.09 4.34 14.43 Private 1006 99.60 72.56 7.40 18.88 11.37 112 3120 Overall 1071 98.23 65.17 8.94 16.48 12.63 Joint 4 100.00 75.00 6.47 0.65 1.54
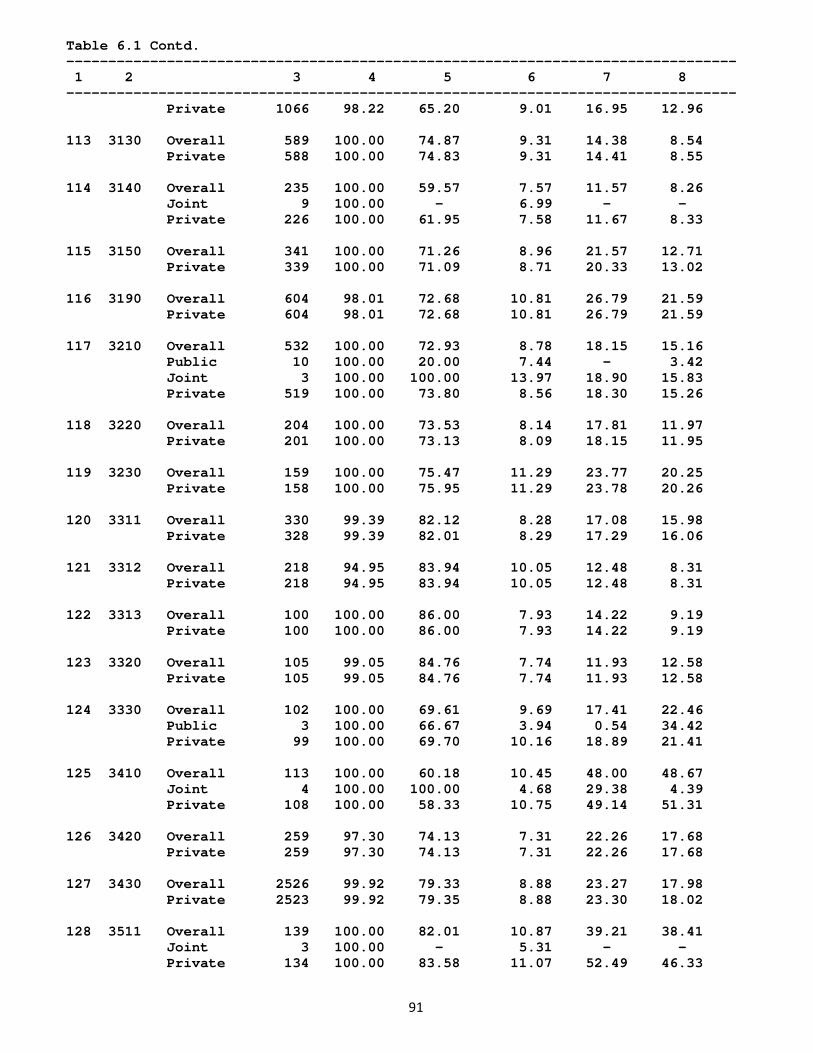
91
Table 6.1 Contd. -------------------------------------------------------------------------------- 1 2 3 4 5 6 7 8 -------------------------------------------------------------------------------- Private 1066 98.22 65.20 9.01 16.95 12.96 113 3130 Overall 589 100.00 74.87 9.31 14.38 8.54 Private 588 100.00 74.83 9.31 14.41 8.55 114 3140 Overall 235 100.00 59.57 7.57 11.57 8.26 Joint 9 100.00 - 6.99 - - Private 226 100.00 61.95 7.58 11.67 8.33 115 3150 Overall 341 100.00 71.26 8.96 21.57 12.71 Private 339 100.00 71.09 8.71 20.33 13.02 116 3190 Overall 604 98.01 72.68 10.81 26.79 21.59 Private 604 98.01 72.68 10.81 26.79 21.59 117 3210 Overall 532 100.00 72.93 8.78 18.15 15.16 Public 10 100.00 20.00 7.44 - 3.42 Joint 3 100.00 100.00 13.97 18.90 15.83 Private 519 100.00 73.80 8.56 18.30 15.26 118 3220 Overall 204 100.00 73.53 8.14 17.81 11.97 Private 201 100.00 73.13 8.09 18.15 11.95 119 3230 Overall 159 100.00 75.47 11.29 23.77 20.25 Private 158 100.00 75.95 11.29 23.78 20.26 120 3311 Overall 330 99.39 82.12 8.28 17.08 15.98 Private 328 99.39 82.01 8.29 17.29 16.06 121 3312 Overall 218 94.95 83.94 10.05 12.48 8.31 Private 218 94.95 83.94 10.05 12.48 8.31 122 3313 Overall 100 100.00 86.00 7.93 14.22 9.19 Private 100 100.00 86.00 7.93 14.22 9.19 123 3320 Overall 105 99.05 84.76 7.74 11.93 12.58 Private 105 99.05 84.76 7.74 11.93 12.58 124 3330 Overall 102 100.00 69.61 9.69 17.41 22.46 Public 3 100.00 66.67 3.94 0.54 34.42 Private 99 100.00 69.70 10.16 18.89 21.41 125 3410 Overall 113 100.00 60.18 10.45 48.00 48.67 Joint 4 100.00 100.00 4.68 29.38 4.39 Private 108 100.00 58.33 10.75 49.14 51.31 126 3420 Overall 259 97.30 74.13 7.31 22.26 17.68 Private 259 97.30 74.13 7.31 22.26 17.68 127 3430 Overall 2526 99.92 79.33 8.88 23.27 17.98 Private 2523 99.92 79.35 8.88 23.30 18.02 128 3511 Overall 139 100.00 82.01 10.87 39.21 38.41 Joint 3 100.00 - 5.31 - - Private 134 100.00 83.58 11.07 52.49 46.33
92
Table 6.1 Contd. -------------------------------------------------------------------------------- 1 2 3 4 5 6 7 8 -------------------------------------------------------------------------------- 129 3512 Overall 7 100.00 85.71 11.69 21.92 13.70 Private 7 100.00 85.71 11.69 21.92 13.70 130 3520 Overall 243 100.00 72.43 9.40 8.17 9.34 Public 21 100.00 52.38 6.65 0.85 2.82 Private 220 100.00 74.09 9.74 10.17 11.11 131 3530 Overall 51 100.00 76.47 8.56 9.92 9.36 Private 49 100.00 75.51 9.40 13.91 11.58 132 3591 Overall 504 100.00 79.96 9.52 23.53 22.02 Private 502 100.00 79.88 9.42 24.26 22.46 133 3592 Overall 528 100.00 86.17 10.87 19.54 20.62 Private 528 100.00 86.17 10.87 19.54 20.62 134 3599 Overall 83 100.00 61.45 13.38 13.33 15.06 Private 82 100.00 60.98 13.31 13.34 14.39 135 3610 Overall 580 98.62 52.59 10.97 29.84 16.83 Public 4 100.00 75.00 2.49 - 5.80 Private 576 98.61 52.43 11.09 30.25 16.98 136 3691 Overall 603 100.00 88.56 9.48 17.97 13.76 Private 602 100.00 88.54 9.49 17.96 13.76 137 3692 Overall 10 100.00 70.00 10.02 29.67 26.72 Private 10 100.00 70.00 10.02 29.67 26.72 138 3693 Overall 144 99.31 70.83 10.24 21.18 13.09 Private 144 99.31 70.83 10.24 21.18 13.09 139 3694 Overall 170 100.00 85.88 11.00 17.54 17.40 Private 170 100.00 85.88 11.00 17.54 17.40 140 3699 Overall 560 99.64 73.04 8.59 19.74 14.99 Private 559 99.64 72.99 8.63 15.60 11.00 141 3710 Overall 8 100.00 37.50 23.19 5.64 6.67 Private 8 100.00 37.50 23.19 5.64 6.67 142 3720 Overall 50 98.00 36.00 6.88 12.63 10.95 Private 50 98.00 36.00 6.88 12.63 10.95 143 4000 Overall 5192 98.79 56.24 7.31 16.03 13.70 Public 40 100.00 22.50 11.91 2.24 2.51 Joint 69 100.00 89.86 7.56 7.22 9.98 Private 5083 98.76 56.05 7.24 16.40 13.94 B. State/Sector 1 Jammu & Kashmir 567 99.47 81.66 5.03 22.62 18.92 Public 19 100.00 68.42 2.80 2.05 16.48 Private 545 99.45 82.57 5.35 25.71 19.30
93
Table 6.1 Contd. -------------------------------------------------------------------------------- 1 2 3 4 5 6 7 8 -------------------------------------------------------------------------------- 2 Himachal Pradesh 1021 98.92 94.32 12.51 32.05 23.42 Public 9 100.00 88.89 20.93 8.33 11.83 Joint 5 100.00 100.00 4.90 41.04 52.60 Private 1007 99.01 94.44 12.48 32.17 23.41 3 Punjab 8631 91.14 89.67 10.44 31.31 27.22 Public 56 100.00 82.14 7.00 13.03 13.64 Joint 61 67.21 83.61 6.19 60.84 65.47 Private 8513 91.25 89.77 10.56 31.45 27.17 4 Chandigarh 281 99.64 89.32 13.13 23.79 24.28 Private 280 99.64 89.29 13.02 24.31 24.77 5 Uttaranchal 1101 99.46 92.10 7.69 39.25 16.80 Private 1097 99.45 92.16 7.67 39.38 16.84 6 Haryana 3696 99.89 84.50 10.71 29.01 26.91 Public 32 100.00 100.00 10.04 36.74 22.31 Joint 12 100.00 100.00 3.36 33.71 22.42 Private 3652 99.89 84.31 10.95 28.72 27.14 7 Delhi 2879 100.00 81.17 12.44 25.64 28.12 Joint 12 100.00 33.33 8.62 7.98 9.39 Private 2865 100.00 81.40 12.44 25.67 28.15 8 Rajasthan 4999 99.10 77.86 9.98 21.22 17.79 Public 52 100.00 73.08 10.97 16.37 17.56 Joint 25 100.00 84.00 10.24 11.11 11.50 Private 4922 99.09 77.87 9.95 21.59 17.95 9 Uttar Pradesh 8913 98.33 71.81 9.59 32.55 28.15 Public 91 100.00 59.34 10.30 50.21 56.78 Joint 43 100.00 79.07 8.39 34.62 23.36 Private 8779 98.30 71.90 9.59 31.86 27.23 10 Bihar 779 98.46 58.92 6.34 29.60 31.02 Public 11 100.00 36.36 3.17 0.77 3.93 Joint 26 100.00 34.62 7.36 19.08 38.30 Private 742 98.52 60.11 6.48 32.48 32.35 11 Nagaland 42 100.00 30.95 0.92 3.13 2.34 Private 42 100.00 30.95 0.92 3.13 2.34 12 Manipur 23 100.00 30.43 2.48 3.64 2.86 Private 21 100.00 33.33 2.48 3.79 2.98 13 Tripura 165 100.00 44.85 6.72 14.60 2.31 Public 8 100.00 87.50 9.22 1.35 1.91 Joint 3 100.00 66.67 10.76 1.01 3.26 Private 154 100.00 42.21 4.46 25.82 2.35 14 Meghalaya 75 98.67 77.33 7.34 19.19 17.48 Private 72 98.61 76.39 8.90 26.18 23.58 15 Assam 1057 99.62 24.03 4.66 3.45 2.08 Public 20 100.00 60.00 1.70 1.77 2.83
94
Table 6.1 Contd. -------------------------------------------------------------------------------- 1 2 3 4 5 6 7 8 -------------------------------------------------------------------------------- Joint 21 100.00 - 3.65 - - Private 1015 99.61 23.84 4.90 3.62 2.07 16 West Bengal 4911 98.37 44.47 8.31 21.22 19.11 Public 57 100.00 71.93 10.67 3.19 4.64 Joint 13 100.00 92.31 7.36 9.15 8.98 Private 4841 98.35 44.02 8.25 21.87 19.63 17 Jharkhand 1114 100.00 63.02 5.83 4.04 7.52 Public 20 100.00 80.00 3.86 1.28 6.53 Joint 14 100.00 42.86 3.71 0.97 5.42 Private 1080 100.00 62.87 8.39 7.71 9.28 18 Orissa 1373 99.85 59.07 7.60 7.87 6.44 Public 12 100.00 75.00 5.09 2.30 3.67 Joint 18 100.00 83.33 9.25 1.52 2.40 Private 1343 99.85 58.60 6.89 11.17 8.52 19 Chhattisgarh 1496 99.33 46.72 5.83 9.74 6.15 Public 30 100.00 10.00 11.60 0.01 2.87 Joint 21 100.00 61.90 2.01 48.80 2.78 Private 1445 99.31 47.34 3.95 12.35 7.34 20 Madhya Pradesh 2585 99.50 70.83 8.01 12.03 11.21 Public 44 100.00 40.91 8.98 3.44 9.46 Joint 43 100.00 58.14 4.75 4.49 7.69 Private 2498 99.48 71.58 8.22 12.81 11.51 21 Gujarat 13146 98.65 73.00 5.92 19.02 15.34 Public 13 92.31 92.31 5.94 9.66 18.42 Joint 198 95.45 82.83 8.72 14.74 5.72 Private 12935 98.70 72.83 5.87 19.15 15.60 22 Daman & Diu 1343 99.93 83.92 7.59 14.13 15.44 Public 5 100.00 100.00 7.21 14.41 14.41 Joint 5 100.00 100.00 7.49 19.61 29.41 Private 1334 99.93 83.81 7.59 14.12 15.43 23 D & Nagar Haveli 879 100.00 90.56 8.07 14.64 11.34 Private 878 100.00 90.55 8.06 14.64 11.34 24 Maharashtra 15495 99.04 66.72 11.81 23.86 23.28 Public 101 100.00 55.45 15.45 7.40 12.20 Joint 159 100.00 64.78 11.33 31.34 32.71 Private 15236 99.02 66.81 11.76 23.87 23.13 25 Andhra Pradesh 12065 95.13 33.88 6.71 12.41 9.13 Public 80 80.00 48.75 5.02 3.69 4.75 Joint 112 77.68 59.82 8.49 19.13 15.19 Private 11873 95.40 33.54 6.85 12.98 9.34 26 Karnataka 7069 99.01 68.88 6.66 22.96 19.76 Public 22 100.00 68.18 9.55 30.38 23.83 Joint 50 100.00 86.00 8.81 39.48 36.19 Private 6996 99.01 68.77 6.60 22.51 19.35
95
Table 6.1 Contd. -------------------------------------------------------------------------------- 1 2 3 4 5 6 7 8 -------------------------------------------------------------------------------- 27 Goa 447 99.55 85.01 11.71 26.60 25.00 Public 3 100.00 66.67 15.39 - 0.82 Joint 11 90.91 63.64 13.96 5.50 4.82 Private 433 99.77 85.68 11.56 27.84 26.17 28 Lakshadweep 10 100.00 100.00 1.05 29.20 16.80 Private 10 100.00 100.00 1.05 29.20 16.80 29 Kerala 4212 97.32 56.79 11.30 11.71 9.00 Public 80 100.00 60.00 8.57 7.80 7.90 Joint 203 89.16 66.50 16.18 9.82 9.16 Private 3929 97.68 56.22 11.17 11.95 9.04 30 Tamil Nadu 17390 98.30 69.21 6.88 17.82 14.53 Public 175 93.71 50.29 10.75 12.16 15.03 Joint 85 100.00 84.71 7.30 32.13 7.54 Private 17130 98.34 69.33 6.84 17.68 14.62 31 Pondicherry 540 100.00 53.89 7.23 9.00 6.95 Public 16 100.00 62.50 9.55 1.85 2.02 Private 523 100.00 53.73 6.77 10.45 7.95 32 A & N Islands 8 100.00 87.50 15.37 56.63 17.67 Private 6 100.00 83.33 13.07 74.62 33.08 All India 118312 97.89 66.95 8.34 20.94 18.11 Public 964 97.10 60.06 7.80 8.85 11.48 Joint 1152 93.32 70.40 8.34 18.22 15.22 Private 116196 97.94 66.97 8.36 21.43 18.42 C. State/Industry 1 Jammu & Kashmir 567 99.47 81.66 5.03 22.62 18.92 1513 6 100.00 50.00 8.32 5.71 2.86 1514 15 100.00 73.33 3.01 26.96 22.68 1520 6 100.00 66.67 5.80 18.84 13.77 1531 31 100.00 48.39 5.77 22.07 19.95 1541 8 100.00 75.00 3.95 11.11 9.68 1543 5 80.00 20.00 11.83 5.88 14.71 1549 12 100.00 91.67 3.12 15.84 24.00 1551 5 100.00 80.00 8.25 28.40 12.35 1554 7 100.00 85.71 7.14 14.98 11.59 1711 10 100.00 80.00 4.21 2.64 9.64 1810 4 100.00 100.00 3.86 86.82 77.91 2021 6 100.00 100.00 7.08 21.94 16.77 2022 3 100.00 33.33 4.86 5.63 21.83 2029 4 100.00 75.00 2.60 12.61 4.20 2101 5 100.00 100.00 4.25 12.40 17.83 2102 9 100.00 100.00 3.63 17.59 10.76 2219 4 100.00 25.00 4.71 5.63 14.08 2221 3 66.67 33.33 2.80 9.09 9.09 2320 6 100.00 50.00 8.03 9.63 21.48 2411 37 100.00 81.08 5.86 25.67 16.32 2413 4 100.00 100.00 7.48 8.14 12.79 2421 9 100.00 100.00 8.50 15.23 16.56 2422 9 100.00 77.78 8.48 38.51 21.62
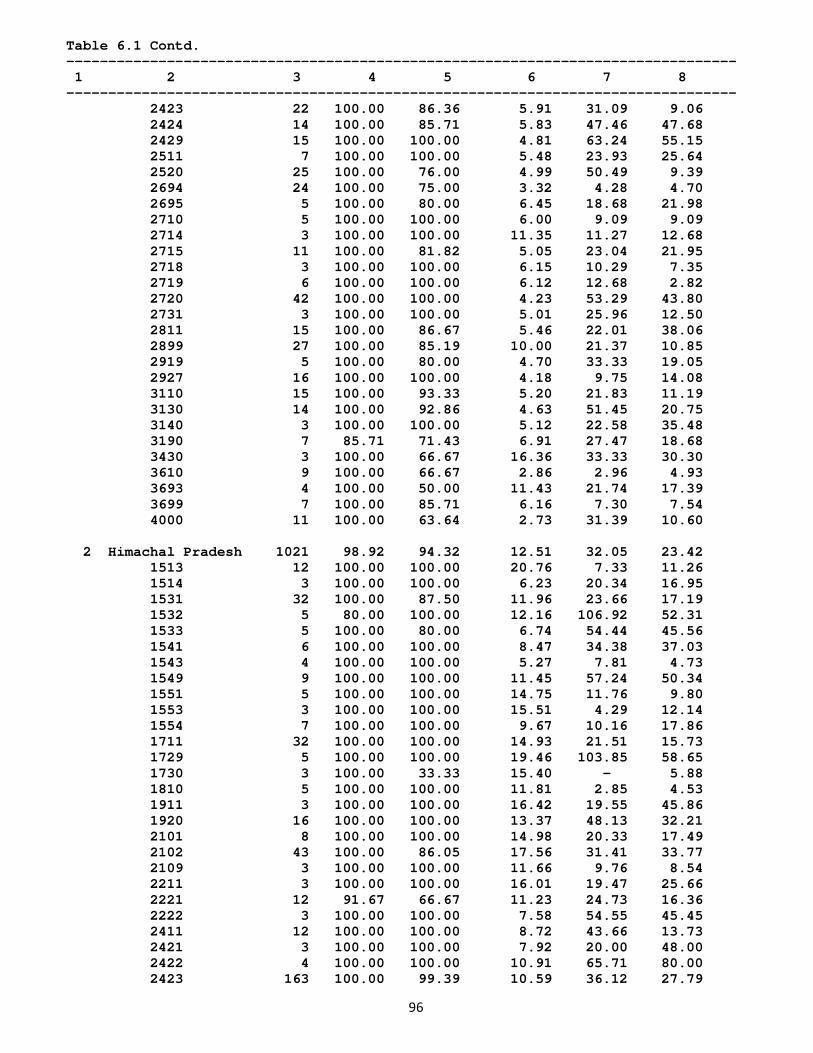
96
Table 6.1 Contd. -------------------------------------------------------------------------------- 1 2 3 4 5 6 7 8 -------------------------------------------------------------------------------- 2423 22 100.00 86.36 5.91 31.09 9.06 2424 14 100.00 85.71 5.83 47.46 47.68 2429 15 100.00 100.00 4.81 63.24 55.15 2511 7 100.00 100.00 5.48 23.93 25.64 2520 25 100.00 76.00 4.99 50.49 9.39 2694 24 100.00 75.00 3.32 4.28 4.70 2695 5 100.00 80.00 6.45 18.68 21.98 2710 5 100.00 100.00 6.00 9.09 9.09 2714 3 100.00 100.00 11.35 11.27 12.68 2715 11 100.00 81.82 5.05 23.04 21.95 2718 3 100.00 100.00 6.15 10.29 7.35 2719 6 100.00 100.00 6.12 12.68 2.82 2720 42 100.00 100.00 4.23 53.29 43.80 2731 3 100.00 100.00 5.01 25.96 12.50 2811 15 100.00 86.67 5.46 22.01 38.06 2899 27 100.00 85.19 10.00 21.37 10.85 2919 5 100.00 80.00 4.70 33.33 19.05 2927 16 100.00 100.00 4.18 9.75 14.08 3110 15 100.00 93.33 5.20 21.83 11.19 3130 14 100.00 92.86 4.63 51.45 20.75 3140 3 100.00 100.00 5.12 22.58 35.48 3190 7 85.71 71.43 6.91 27.47 18.68 3430 3 100.00 66.67 16.36 33.33 30.30 3610 9 100.00 66.67 2.86 2.96 4.93 3693 4 100.00 50.00 11.43 21.74 17.39 3699 7 100.00 85.71 6.16 7.30 7.54 4000 11 100.00 63.64 2.73 31.39 10.60 2 Himachal Pradesh 1021 98.92 94.32 12.51 32.05 23.42 1513 12 100.00 100.00 20.76 7.33 11.26 1514 3 100.00 100.00 6.23 20.34 16.95 1531 32 100.00 87.50 11.96 23.66 17.19 1532 5 80.00 100.00 12.16 106.92 52.31 1533 5 100.00 80.00 6.74 54.44 45.56 1541 6 100.00 100.00 8.47 34.38 37.03 1543 4 100.00 100.00 5.27 7.81 4.73 1549 9 100.00 100.00 11.45 57.24 50.34 1551 5 100.00 100.00 14.75 11.76 9.80 1553 3 100.00 100.00 15.51 4.29 12.14 1554 7 100.00 100.00 9.67 10.16 17.86 1711 32 100.00 100.00 14.93 21.51 15.73 1729 5 100.00 100.00 19.46 103.85 58.65 1730 3 100.00 33.33 15.40 - 5.88 1810 5 100.00 100.00 11.81 2.85 4.53 1911 3 100.00 100.00 16.42 19.55 45.86 1920 16 100.00 100.00 13.37 48.13 32.21 2101 8 100.00 100.00 14.98 20.33 17.49 2102 43 100.00 86.05 17.56 31.41 33.77 2109 3 100.00 100.00 11.66 9.76 8.54 2211 3 100.00 100.00 16.01 19.47 25.66 2221 12 91.67 66.67 11.23 24.73 16.36 2222 3 100.00 100.00 7.58 54.55 45.45 2411 12 100.00 100.00 8.72 43.66 13.73 2421 3 100.00 100.00 7.92 20.00 48.00 2422 4 100.00 100.00 10.91 65.71 80.00 2423 163 100.00 99.39 10.59 36.12 27.79
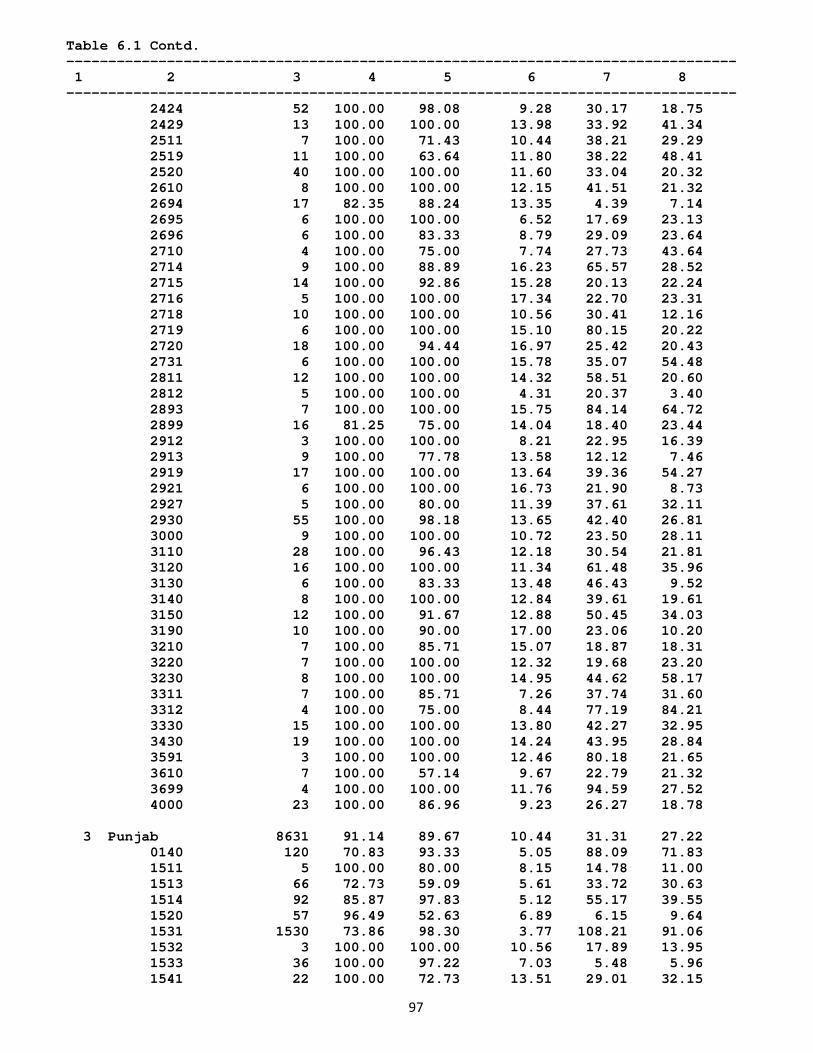
97
Table 6.1 Contd. -------------------------------------------------------------------------------- 1 2 3 4 5 6 7 8 -------------------------------------------------------------------------------- 2424 52 100.00 98.08 9.28 30.17 18.75 2429 13 100.00 100.00 13.98 33.92 41.34 2511 7 100.00 71.43 10.44 38.21 29.29 2519 11 100.00 63.64 11.80 38.22 48.41 2520 40 100.00 100.00 11.60 33.04 20.32 2610 8 100.00 100.00 12.15 41.51 21.32 2694 17 82.35 88.24 13.35 4.39 7.14 2695 6 100.00 100.00 6.52 17.69 23.13 2696 6 100.00 83.33 8.79 29.09 23.64 2710 4 100.00 75.00 7.74 27.73 43.64 2714 9 100.00 88.89 16.23 65.57 28.52 2715 14 100.00 92.86 15.28 20.13 22.24 2716 5 100.00 100.00 17.34 22.70 23.31 2718 10 100.00 100.00 10.56 30.41 12.16 2719 6 100.00 100.00 15.10 80.15 20.22 2720 18 100.00 94.44 16.97 25.42 20.43 2731 6 100.00 100.00 15.78 35.07 54.48 2811 12 100.00 100.00 14.32 58.51 20.60 2812 5 100.00 100.00 4.31 20.37 3.40 2893 7 100.00 100.00 15.75 84.14 64.72 2899 16 81.25 75.00 14.04 18.40 23.44 2912 3 100.00 100.00 8.21 22.95 16.39 2913 9 100.00 77.78 13.58 12.12 7.46 2919 17 100.00 100.00 13.64 39.36 54.27 2921 6 100.00 100.00 16.73 21.90 8.73 2927 5 100.00 80.00 11.39 37.61 32.11 2930 55 100.00 98.18 13.65 42.40 26.81 3000 9 100.00 100.00 10.72 23.50 28.11 3110 28 100.00 96.43 12.18 30.54 21.81 3120 16 100.00 100.00 11.34 61.48 35.96 3130 6 100.00 83.33 13.48 46.43 9.52 3140 8 100.00 100.00 12.84 39.61 19.61 3150 12 100.00 91.67 12.88 50.45 34.03 3190 10 100.00 90.00 17.00 23.06 10.20 3210 7 100.00 85.71 15.07 18.87 18.31 3220 7 100.00 100.00 12.32 19.68 23.20 3230 8 100.00 100.00 14.95 44.62 58.17 3311 7 100.00 85.71 7.26 37.74 31.60 3312 4 100.00 75.00 8.44 77.19 84.21 3330 15 100.00 100.00 13.80 42.27 32.95 3430 19 100.00 100.00 14.24 43.95 28.84 3591 3 100.00 100.00 12.46 80.18 21.65 3610 7 100.00 57.14 9.67 22.79 21.32 3699 4 100.00 100.00 11.76 94.59 27.52 4000 23 100.00 86.96 9.23 26.27 18.78 3 Punjab 8631 91.14 89.67 10.44 31.31 27.22 0140 120 70.83 93.33 5.05 88.09 71.83 1511 5 100.00 80.00 8.15 14.78 11.00 1513 66 72.73 59.09 5.61 33.72 30.63 1514 92 85.87 97.83 5.12 55.17 39.55 1520 57 96.49 52.63 6.89 6.15 9.64 1531 1530 73.86 98.30 3.77 108.21 91.06 1532 3 100.00 100.00 10.56 17.89 13.95 1533 36 100.00 97.22 7.03 5.48 5.96 1541 22 100.00 72.73 13.51 29.01 32.15
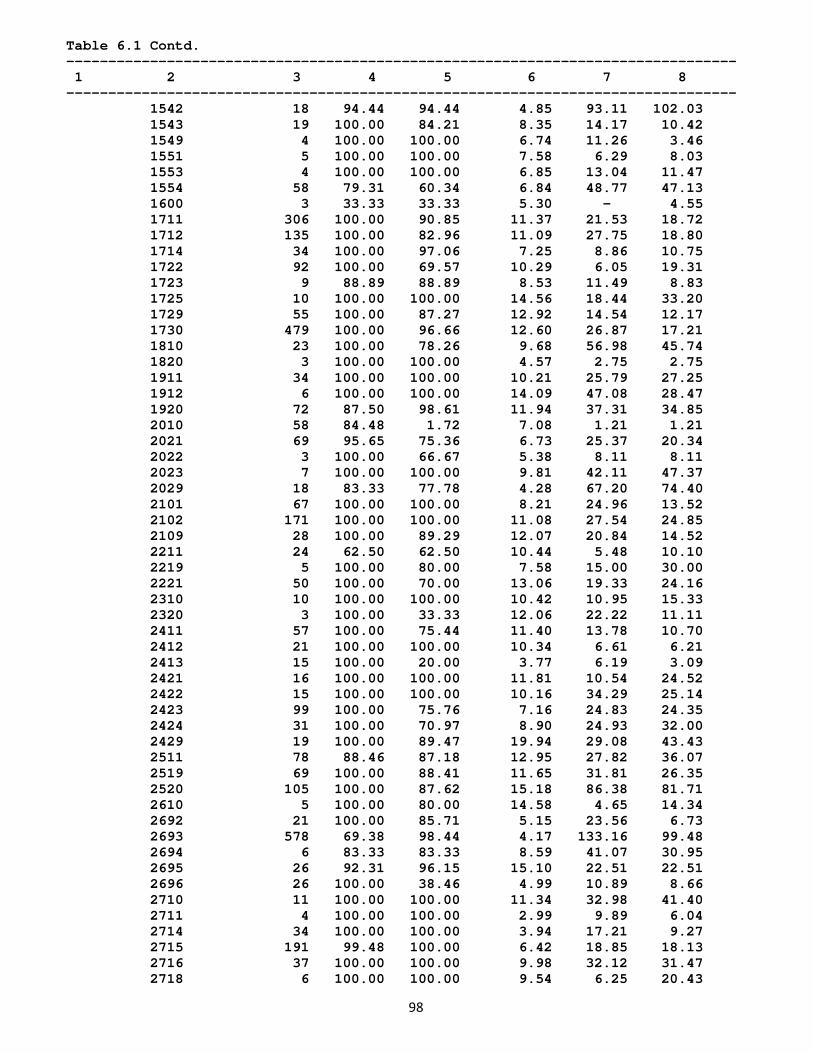
98
Table 6.1 Contd. -------------------------------------------------------------------------------- 1 2 3 4 5 6 7 8 -------------------------------------------------------------------------------- 1542 18 94.44 94.44 4.85 93.11 102.03 1543 19 100.00 84.21 8.35 14.17 10.42 1549 4 100.00 100.00 6.74 11.26 3.46 1551 5 100.00 100.00 7.58 6.29 8.03 1553 4 100.00 100.00 6.85 13.04 11.47 1554 58 79.31 60.34 6.84 48.77 47.13 1600 3 33.33 33.33 5.30 - 4.55 1711 306 100.00 90.85 11.37 21.53 18.72 1712 135 100.00 82.96 11.09 27.75 18.80 1714 34 100.00 97.06 7.25 8.86 10.75 1722 92 100.00 69.57 10.29 6.05 19.31 1723 9 88.89 88.89 8.53 11.49 8.83 1725 10 100.00 100.00 14.56 18.44 33.20 1729 55 100.00 87.27 12.92 14.54 12.17 1730 479 100.00 96.66 12.60 26.87 17.21 1810 23 100.00 78.26 9.68 56.98 45.74 1820 3 100.00 100.00 4.57 2.75 2.75 1911 34 100.00 100.00 10.21 25.79 27.25 1912 6 100.00 100.00 14.09 47.08 28.47 1920 72 87.50 98.61 11.94 37.31 34.85 2010 58 84.48 1.72 7.08 1.21 1.21 2021 69 95.65 75.36 6.73 25.37 20.34 2022 3 100.00 66.67 5.38 8.11 8.11 2023 7 100.00 100.00 9.81 42.11 47.37 2029 18 83.33 77.78 4.28 67.20 74.40 2101 67 100.00 100.00 8.21 24.96 13.52 2102 171 100.00 100.00 11.08 27.54 24.85 2109 28 100.00 89.29 12.07 20.84 14.52 2211 24 62.50 62.50 10.44 5.48 10.10 2219 5 100.00 80.00 7.58 15.00 30.00 2221 50 100.00 70.00 13.06 19.33 24.16 2310 10 100.00 100.00 10.42 10.95 15.33 2320 3 100.00 33.33 12.06 22.22 11.11 2411 57 100.00 75.44 11.40 13.78 10.70 2412 21 100.00 100.00 10.34 6.61 6.21 2413 15 100.00 20.00 3.77 6.19 3.09 2421 16 100.00 100.00 11.81 10.54 24.52 2422 15 100.00 100.00 10.16 34.29 25.14 2423 99 100.00 75.76 7.16 24.83 24.35 2424 31 100.00 70.97 8.90 24.93 32.00 2429 19 100.00 89.47 19.94 29.08 43.43 2511 78 88.46 87.18 12.95 27.82 36.07 2519 69 100.00 88.41 11.65 31.81 26.35 2520 105 100.00 87.62 15.18 86.38 81.71 2610 5 100.00 80.00 14.58 4.65 14.34 2692 21 100.00 85.71 5.15 23.56 6.73 2693 578 69.38 98.44 4.17 133.16 99.48 2694 6 83.33 83.33 8.59 41.07 30.95 2695 26 92.31 96.15 15.10 22.51 22.51 2696 26 100.00 38.46 4.99 10.89 8.66 2710 11 100.00 100.00 11.34 32.98 41.40 2711 4 100.00 100.00 2.99 9.89 6.04 2714 34 100.00 100.00 3.94 17.21 9.27 2715 191 99.48 100.00 6.42 18.85 18.13 2716 37 100.00 100.00 9.98 32.12 31.47 2718 6 100.00 100.00 9.54 6.25 20.43
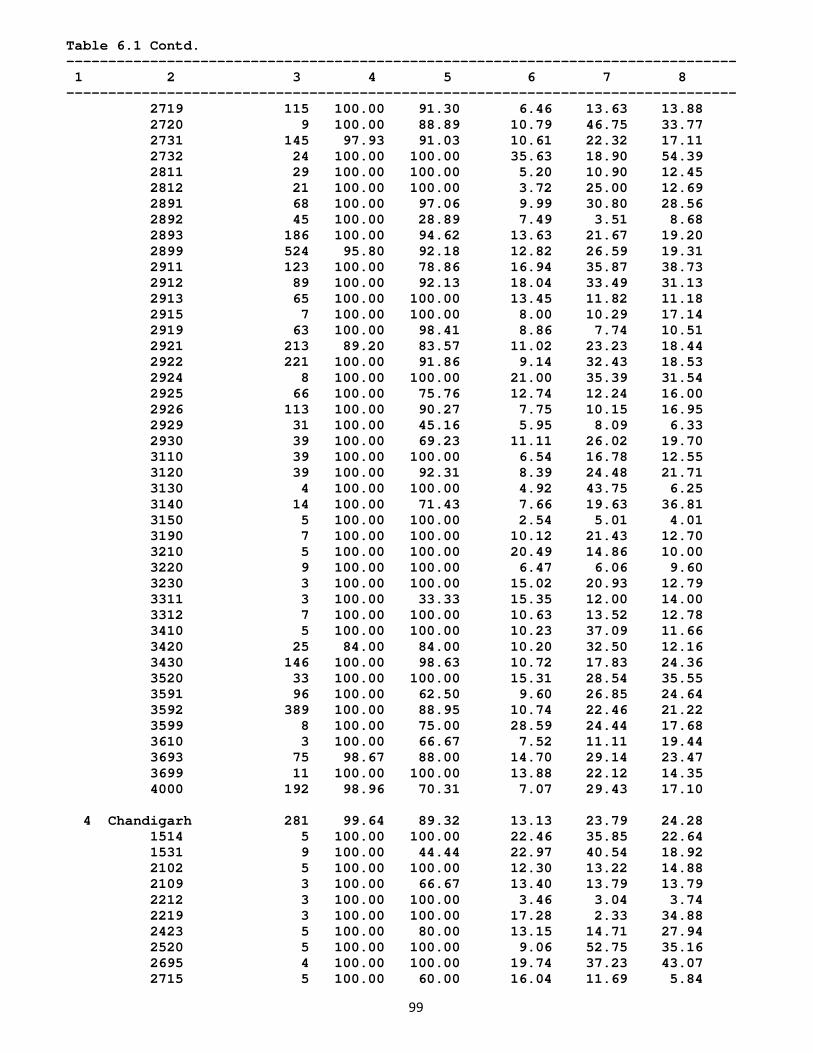
99
Table 6.1 Contd. -------------------------------------------------------------------------------- 1 2 3 4 5 6 7 8 -------------------------------------------------------------------------------- 2719 115 100.00 91.30 6.46 13.63 13.88 2720 9 100.00 88.89 10.79 46.75 33.77 2731 145 97.93 91.03 10.61 22.32 17.11 2732 24 100.00 100.00 35.63 18.90 54.39 2811 29 100.00 100.00 5.20 10.90 12.45 2812 21 100.00 100.00 3.72 25.00 12.69 2891 68 100.00 97.06 9.99 30.80 28.56 2892 45 100.00 28.89 7.49 3.51 8.68 2893 186 100.00 94.62 13.63 21.67 19.20 2899 524 95.80 92.18 12.82 26.59 19.31 2911 123 100.00 78.86 16.94 35.87 38.73 2912 89 100.00 92.13 18.04 33.49 31.13 2913 65 100.00 100.00 13.45 11.82 11.18 2915 7 100.00 100.00 8.00 10.29 17.14 2919 63 100.00 98.41 8.86 7.74 10.51 2921 213 89.20 83.57 11.02 23.23 18.44 2922 221 100.00 91.86 9.14 32.43 18.53 2924 8 100.00 100.00 21.00 35.39 31.54 2925 66 100.00 75.76 12.74 12.24 16.00 2926 113 100.00 90.27 7.75 10.15 16.95 2929 31 100.00 45.16 5.95 8.09 6.33 2930 39 100.00 69.23 11.11 26.02 19.70 3110 39 100.00 100.00 6.54 16.78 12.55 3120 39 100.00 92.31 8.39 24.48 21.71 3130 4 100.00 100.00 4.92 43.75 6.25 3140 14 100.00 71.43 7.66 19.63 36.81 3150 5 100.00 100.00 2.54 5.01 4.01 3190 7 100.00 100.00 10.12 21.43 12.70 3210 5 100.00 100.00 20.49 14.86 10.00 3220 9 100.00 100.00 6.47 6.06 9.60 3230 3 100.00 100.00 15.02 20.93 12.79 3311 3 100.00 33.33 15.35 12.00 14.00 3312 7 100.00 100.00 10.63 13.52 12.78 3410 5 100.00 100.00 10.23 37.09 11.66 3420 25 84.00 84.00 10.20 32.50 12.16 3430 146 100.00 98.63 10.72 17.83 24.36 3520 33 100.00 100.00 15.31 28.54 35.55 3591 96 100.00 62.50 9.60 26.85 24.64 3592 389 100.00 88.95 10.74 22.46 21.22 3599 8 100.00 75.00 28.59 24.44 17.68 3610 3 100.00 66.67 7.52 11.11 19.44 3693 75 98.67 88.00 14.70 29.14 23.47 3699 11 100.00 100.00 13.88 22.12 14.35 4000 192 98.96 70.31 7.07 29.43 17.10 4 Chandigarh 281 99.64 89.32 13.13 23.79 24.28 1514 5 100.00 100.00 22.46 35.85 22.64 1531 9 100.00 44.44 22.97 40.54 18.92 2102 5 100.00 100.00 12.30 13.22 14.88 2109 3 100.00 66.67 13.40 13.79 13.79 2212 3 100.00 100.00 3.46 3.04 3.74 2219 3 100.00 100.00 17.28 2.33 34.88 2423 5 100.00 80.00 13.15 14.71 27.94 2520 5 100.00 100.00 9.06 52.75 35.16 2695 4 100.00 100.00 19.74 37.23 43.07 2715 5 100.00 60.00 16.04 11.69 5.84
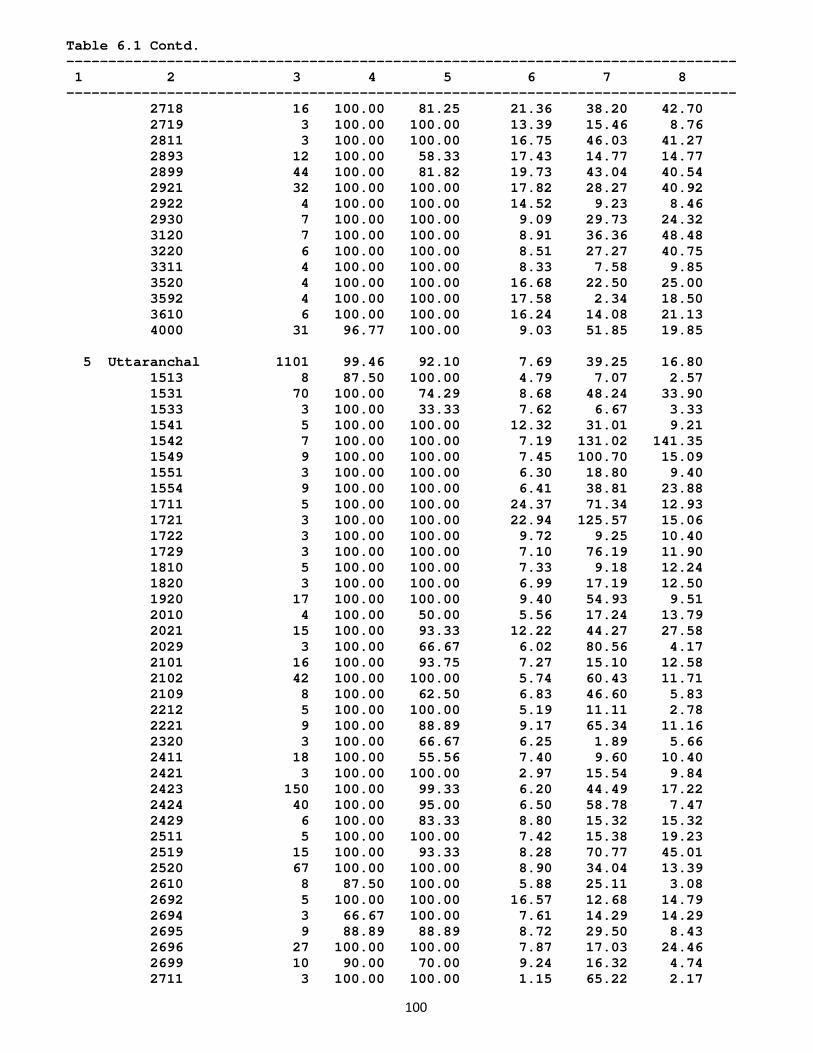
100
Table 6.1 Contd. -------------------------------------------------------------------------------- 1 2 3 4 5 6 7 8 -------------------------------------------------------------------------------- 2718 16 100.00 81.25 21.36 38.20 42.70 2719 3 100.00 100.00 13.39 15.46 8.76 2811 3 100.00 100.00 16.75 46.03 41.27 2893 12 100.00 58.33 17.43 14.77 14.77 2899 44 100.00 81.82 19.73 43.04 40.54 2921 32 100.00 100.00 17.82 28.27 40.92 2922 4 100.00 100.00 14.52 9.23 8.46 2930 7 100.00 100.00 9.09 29.73 24.32 3120 7 100.00 100.00 8.91 36.36 48.48 3220 6 100.00 100.00 8.51 27.27 40.75 3311 4 100.00 100.00 8.33 7.58 9.85 3520 4 100.00 100.00 16.68 22.50 25.00 3592 4 100.00 100.00 17.58 2.34 18.50 3610 6 100.00 100.00 16.24 14.08 21.13 4000 31 96.77 100.00 9.03 51.85 19.85 5 Uttaranchal 1101 99.46 92.10 7.69 39.25 16.80 1513 8 87.50 100.00 4.79 7.07 2.57 1531 70 100.00 74.29 8.68 48.24 33.90 1533 3 100.00 33.33 7.62 6.67 3.33 1541 5 100.00 100.00 12.32 31.01 9.21 1542 7 100.00 100.00 7.19 131.02 141.35 1549 9 100.00 100.00 7.45 100.70 15.09 1551 3 100.00 100.00 6.30 18.80 9.40 1554 9 100.00 100.00 6.41 38.81 23.88 1711 5 100.00 100.00 24.37 71.34 12.93 1721 3 100.00 100.00 22.94 125.57 15.06 1722 3 100.00 100.00 9.72 9.25 10.40 1729 3 100.00 100.00 7.10 76.19 11.90 1810 5 100.00 100.00 7.33 9.18 12.24 1820 3 100.00 100.00 6.99 17.19 12.50 1920 17 100.00 100.00 9.40 54.93 9.51 2010 4 100.00 50.00 5.56 17.24 13.79 2021 15 100.00 93.33 12.22 44.27 27.58 2029 3 100.00 66.67 6.02 80.56 4.17 2101 16 100.00 93.75 7.27 15.10 12.58 2102 42 100.00 100.00 5.74 60.43 11.71 2109 8 100.00 62.50 6.83 46.60 5.83 2212 5 100.00 100.00 5.19 11.11 2.78 2221 9 100.00 88.89 9.17 65.34 11.16 2320 3 100.00 66.67 6.25 1.89 5.66 2411 18 100.00 55.56 7.40 9.60 10.40 2421 3 100.00 100.00 2.97 15.54 9.84 2423 150 100.00 99.33 6.20 44.49 17.22 2424 40 100.00 95.00 6.50 58.78 7.47 2429 6 100.00 83.33 8.80 15.32 15.32 2511 5 100.00 100.00 7.42 15.38 19.23 2519 15 100.00 93.33 8.28 70.77 45.01 2520 67 100.00 100.00 8.90 34.04 13.39 2610 8 87.50 100.00 5.88 25.11 3.08 2692 5 100.00 100.00 16.57 12.68 14.79 2694 3 66.67 100.00 7.61 14.29 14.29 2695 9 88.89 88.89 8.72 29.50 8.43 2696 27 100.00 100.00 7.87 17.03 24.46 2699 10 90.00 70.00 9.24 16.32 4.74 2711 3 100.00 100.00 1.15 65.22 2.17
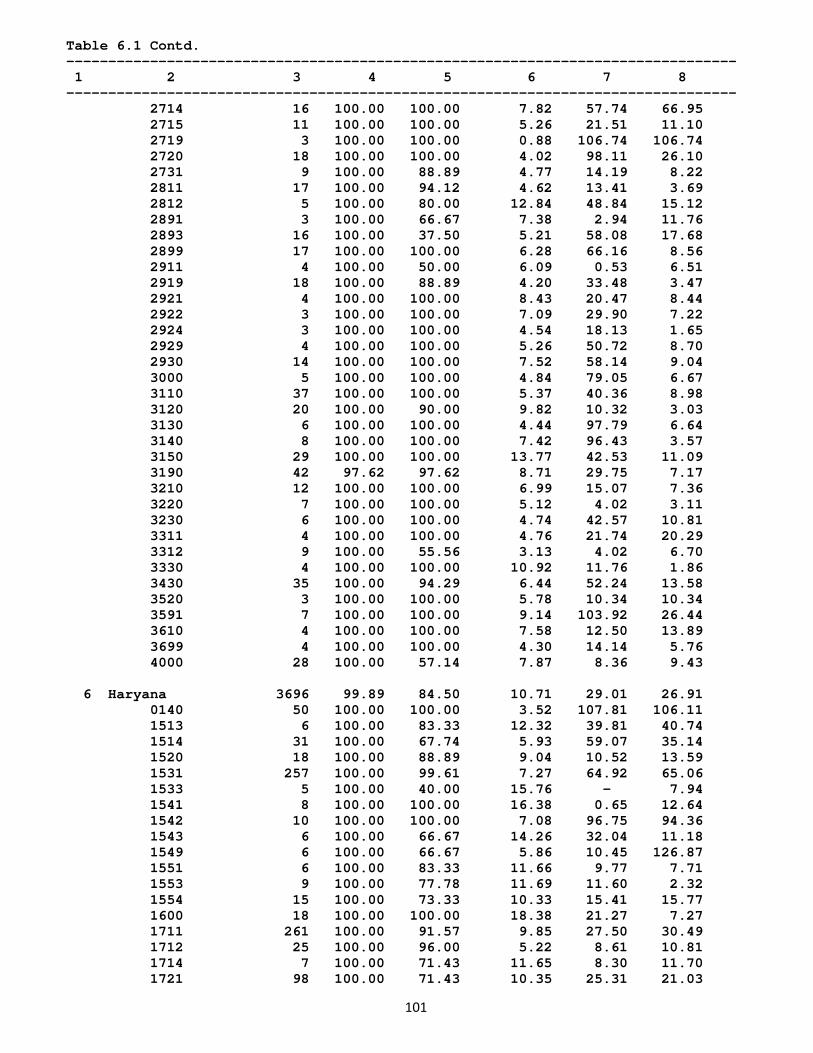
101
Table 6.1 Contd. -------------------------------------------------------------------------------- 1 2 3 4 5 6 7 8 -------------------------------------------------------------------------------- 2714 16 100.00 100.00 7.82 57.74 66.95 2715 11 100.00 100.00 5.26 21.51 11.10 2719 3 100.00 100.00 0.88 106.74 106.74 2720 18 100.00 100.00 4.02 98.11 26.10 2731 9 100.00 88.89 4.77 14.19 8.22 2811 17 100.00 94.12 4.62 13.41 3.69 2812 5 100.00 80.00 12.84 48.84 15.12 2891 3 100.00 66.67 7.38 2.94 11.76 2893 16 100.00 37.50 5.21 58.08 17.68 2899 17 100.00 100.00 6.28 66.16 8.56 2911 4 100.00 50.00 6.09 0.53 6.51 2919 18 100.00 88.89 4.20 33.48 3.47 2921 4 100.00 100.00 8.43 20.47 8.44 2922 3 100.00 100.00 7.09 29.90 7.22 2924 3 100.00 100.00 4.54 18.13 1.65 2929 4 100.00 100.00 5.26 50.72 8.70 2930 14 100.00 100.00 7.52 58.14 9.04 3000 5 100.00 100.00 4.84 79.05 6.67 3110 37 100.00 100.00 5.37 40.36 8.98 3120 20 100.00 90.00 9.82 10.32 3.03 3130 6 100.00 100.00 4.44 97.79 6.64 3140 8 100.00 100.00 7.42 96.43 3.57 3150 29 100.00 100.00 13.77 42.53 11.09 3190 42 97.62 97.62 8.71 29.75 7.17 3210 12 100.00 100.00 6.99 15.07 7.36 3220 7 100.00 100.00 5.12 4.02 3.11 3230 6 100.00 100.00 4.74 42.57 10.81 3311 4 100.00 100.00 4.76 21.74 20.29 3312 9 100.00 55.56 3.13 4.02 6.70 3330 4 100.00 100.00 10.92 11.76 1.86 3430 35 100.00 94.29 6.44 52.24 13.58 3520 3 100.00 100.00 5.78 10.34 10.34 3591 7 100.00 100.00 9.14 103.92 26.44 3610 4 100.00 100.00 7.58 12.50 13.89 3699 4 100.00 100.00 4.30 14.14 5.76 4000 28 100.00 57.14 7.87 8.36 9.43 6 Haryana 3696 99.89 84.50 10.71 29.01 26.91 0140 50 100.00 100.00 3.52 107.81 106.11 1513 6 100.00 83.33 12.32 39.81 40.74 1514 31 100.00 67.74 5.93 59.07 35.14 1520 18 100.00 88.89 9.04 10.52 13.59 1531 257 100.00 99.61 7.27 64.92 65.06 1533 5 100.00 40.00 15.76 - 7.94 1541 8 100.00 100.00 16.38 0.65 12.64 1542 10 100.00 100.00 7.08 96.75 94.36 1543 6 100.00 66.67 14.26 32.04 11.18 1549 6 100.00 66.67 5.86 10.45 126.87 1551 6 100.00 83.33 11.66 9.77 7.71 1553 9 100.00 77.78 11.69 11.60 2.32 1554 15 100.00 73.33 10.33 15.41 15.77 1600 18 100.00 100.00 18.38 21.27 7.27 1711 261 100.00 91.57 9.85 27.50 30.49 1712 25 100.00 96.00 5.22 8.61 10.81 1714 7 100.00 71.43 11.65 8.30 11.70 1721 98 100.00 71.43 10.35 25.31 21.03
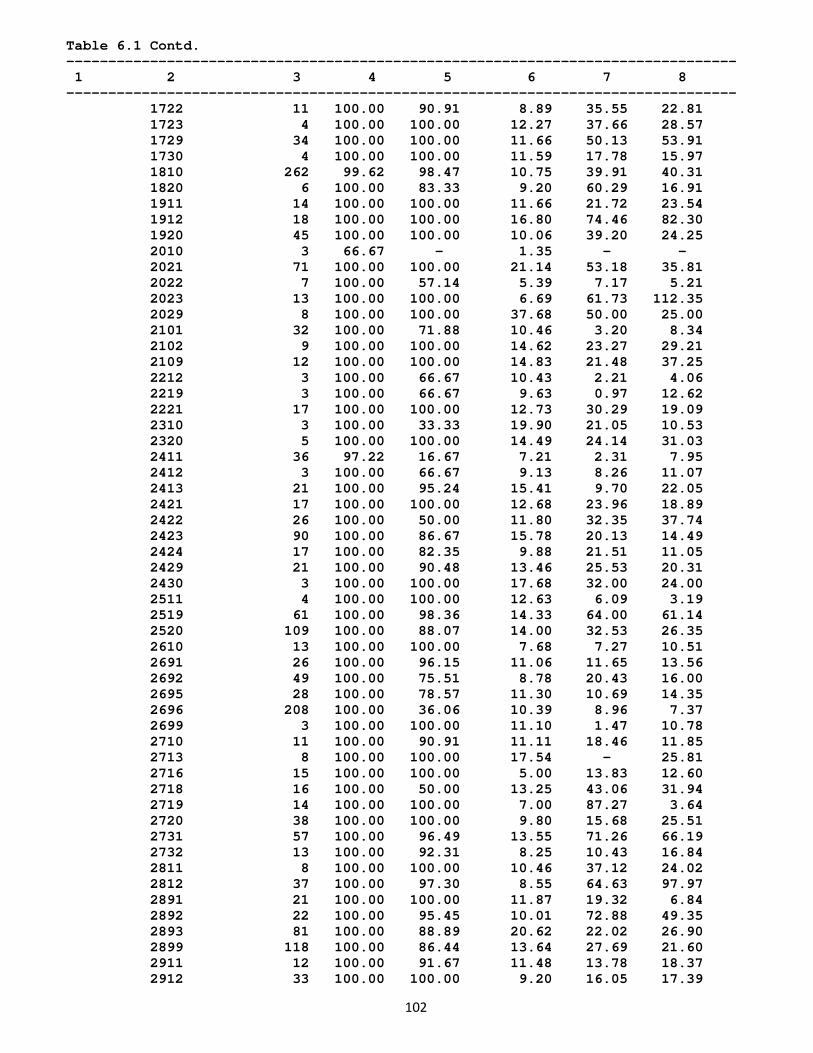
102
Table 6.1 Contd. -------------------------------------------------------------------------------- 1 2 3 4 5 6 7 8 -------------------------------------------------------------------------------- 1722 11 100.00 90.91 8.89 35.55 22.81 1723 4 100.00 100.00 12.27 37.66 28.57 1729 34 100.00 100.00 11.66 50.13 53.91 1730 4 100.00 100.00 11.59 17.78 15.97 1810 262 99.62 98.47 10.75 39.91 40.31 1820 6 100.00 83.33 9.20 60.29 16.91 1911 14 100.00 100.00 11.66 21.72 23.54 1912 18 100.00 100.00 16.80 74.46 82.30 1920 45 100.00 100.00 10.06 39.20 24.25 2010 3 66.67 - 1.35 - - 2021 71 100.00 100.00 21.14 53.18 35.81 2022 7 100.00 57.14 5.39 7.17 5.21 2023 13 100.00 100.00 6.69 61.73 112.35 2029 8 100.00 100.00 37.68 50.00 25.00 2101 32 100.00 71.88 10.46 3.20 8.34 2102 9 100.00 100.00 14.62 23.27 29.21 2109 12 100.00 100.00 14.83 21.48 37.25 2212 3 100.00 66.67 10.43 2.21 4.06 2219 3 100.00 66.67 9.63 0.97 12.62 2221 17 100.00 100.00 12.73 30.29 19.09 2310 3 100.00 33.33 19.90 21.05 10.53 2320 5 100.00 100.00 14.49 24.14 31.03 2411 36 97.22 16.67 7.21 2.31 7.95 2412 3 100.00 66.67 9.13 8.26 11.07 2413 21 100.00 95.24 15.41 9.70 22.05 2421 17 100.00 100.00 12.68 23.96 18.89 2422 26 100.00 50.00 11.80 32.35 37.74 2423 90 100.00 86.67 15.78 20.13 14.49 2424 17 100.00 82.35 9.88 21.51 11.05 2429 21 100.00 90.48 13.46 25.53 20.31 2430 3 100.00 100.00 17.68 32.00 24.00 2511 4 100.00 100.00 12.63 6.09 3.19 2519 61 100.00 98.36 14.33 64.00 61.14 2520 109 100.00 88.07 14.00 32.53 26.35 2610 13 100.00 100.00 7.68 7.27 10.51 2691 26 100.00 96.15 11.06 11.65 13.56 2692 49 100.00 75.51 8.78 20.43 16.00 2695 28 100.00 78.57 11.30 10.69 14.35 2696 208 100.00 36.06 10.39 8.96 7.37 2699 3 100.00 100.00 11.10 1.47 10.78 2710 11 100.00 90.91 11.11 18.46 11.85 2713 8 100.00 100.00 17.54 - 25.81 2716 15 100.00 100.00 5.00 13.83 12.60 2718 16 100.00 50.00 13.25 43.06 31.94 2719 14 100.00 100.00 7.00 87.27 3.64 2720 38 100.00 100.00 9.80 15.68 25.51 2731 57 100.00 96.49 13.55 71.26 66.19 2732 13 100.00 92.31 8.25 10.43 16.84 2811 8 100.00 100.00 10.46 37.12 24.02 2812 37 100.00 97.30 8.55 64.63 97.97 2891 21 100.00 100.00 11.87 19.32 6.84 2892 22 100.00 95.45 10.01 72.88 49.35 2893 81 100.00 88.89 20.62 22.02 26.90 2899 118 100.00 86.44 13.64 27.69 21.60 2911 12 100.00 91.67 11.48 13.78 18.37 2912 33 100.00 100.00 9.20 16.05 17.39
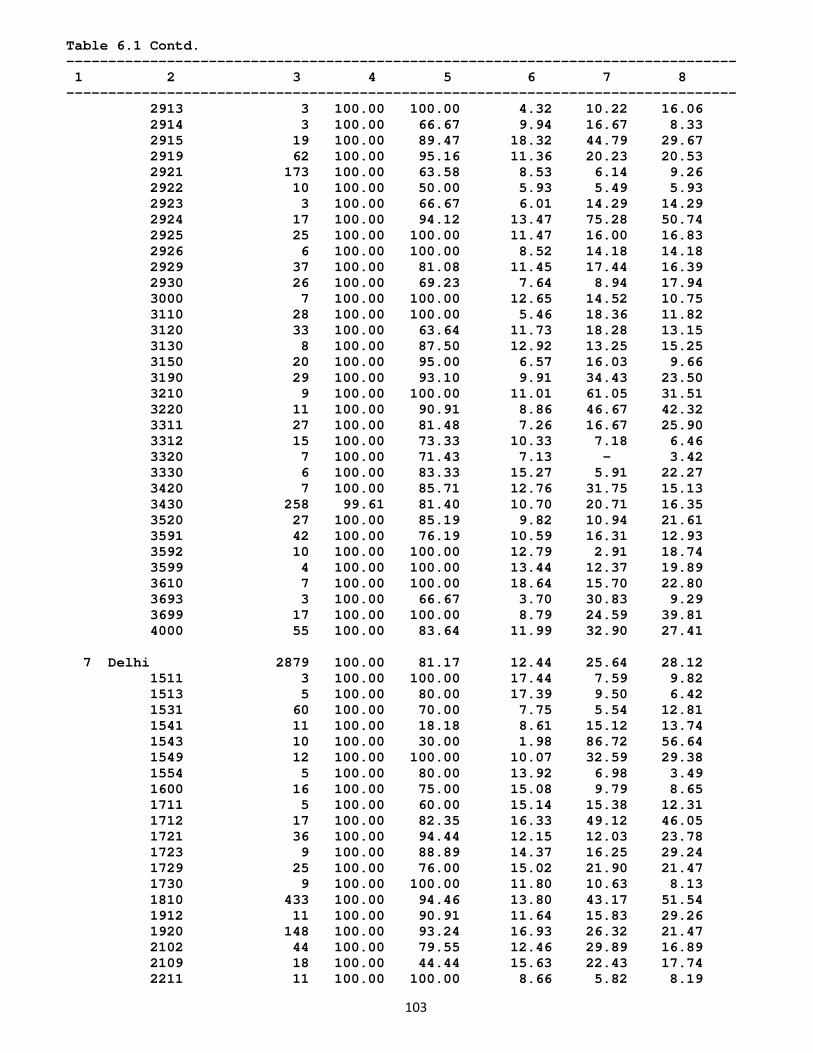
103
Table 6.1 Contd. -------------------------------------------------------------------------------- 1 2 3 4 5 6 7 8 -------------------------------------------------------------------------------- 2913 3 100.00 100.00 4.32 10.22 16.06 2914 3 100.00 66.67 9.94 16.67 8.33 2915 19 100.00 89.47 18.32 44.79 29.67 2919 62 100.00 95.16 11.36 20.23 20.53 2921 173 100.00 63.58 8.53 6.14 9.26 2922 10 100.00 50.00 5.93 5.49 5.93 2923 3 100.00 66.67 6.01 14.29 14.29 2924 17 100.00 94.12 13.47 75.28 50.74 2925 25 100.00 100.00 11.47 16.00 16.83 2926 6 100.00 100.00 8.52 14.18 14.18 2929 37 100.00 81.08 11.45 17.44 16.39 2930 26 100.00 69.23 7.64 8.94 17.94 3000 7 100.00 100.00 12.65 14.52 10.75 3110 28 100.00 100.00 5.46 18.36 11.82 3120 33 100.00 63.64 11.73 18.28 13.15 3130 8 100.00 87.50 12.92 13.25 15.25 3150 20 100.00 95.00 6.57 16.03 9.66 3190 29 100.00 93.10 9.91 34.43 23.50 3210 9 100.00 100.00 11.01 61.05 31.51 3220 11 100.00 90.91 8.86 46.67 42.32 3311 27 100.00 81.48 7.26 16.67 25.90 3312 15 100.00 73.33 10.33 7.18 6.46 3320 7 100.00 71.43 7.13 - 3.42 3330 6 100.00 83.33 15.27 5.91 22.27 3420 7 100.00 85.71 12.76 31.75 15.13 3430 258 99.61 81.40 10.70 20.71 16.35 3520 27 100.00 85.19 9.82 10.94 21.61 3591 42 100.00 76.19 10.59 16.31 12.93 3592 10 100.00 100.00 12.79 2.91 18.74 3599 4 100.00 100.00 13.44 12.37 19.89 3610 7 100.00 100.00 18.64 15.70 22.80 3693 3 100.00 66.67 3.70 30.83 9.29 3699 17 100.00 100.00 8.79 24.59 39.81 4000 55 100.00 83.64 11.99 32.90 27.41 7 Delhi 2879 100.00 81.17 12.44 25.64 28.12 1511 3 100.00 100.00 17.44 7.59 9.82 1513 5 100.00 80.00 17.39 9.50 6.42 1531 60 100.00 70.00 7.75 5.54 12.81 1541 11 100.00 18.18 8.61 15.12 13.74 1543 10 100.00 30.00 1.98 86.72 56.64 1549 12 100.00 100.00 10.07 32.59 29.38 1554 5 100.00 80.00 13.92 6.98 3.49 1600 16 100.00 75.00 15.08 9.79 8.65 1711 5 100.00 60.00 15.14 15.38 12.31 1712 17 100.00 82.35 16.33 49.12 46.05 1721 36 100.00 94.44 12.15 12.03 23.78 1723 9 100.00 88.89 14.37 16.25 29.24 1729 25 100.00 76.00 15.02 21.90 21.47 1730 9 100.00 100.00 11.80 10.63 8.13 1810 433 100.00 94.46 13.80 43.17 51.54 1912 11 100.00 90.91 11.64 15.83 29.26 1920 148 100.00 93.24 16.93 26.32 21.47 2102 44 100.00 79.55 12.46 29.89 16.89 2109 18 100.00 44.44 15.63 22.43 17.74 2211 11 100.00 100.00 8.66 5.82 8.19
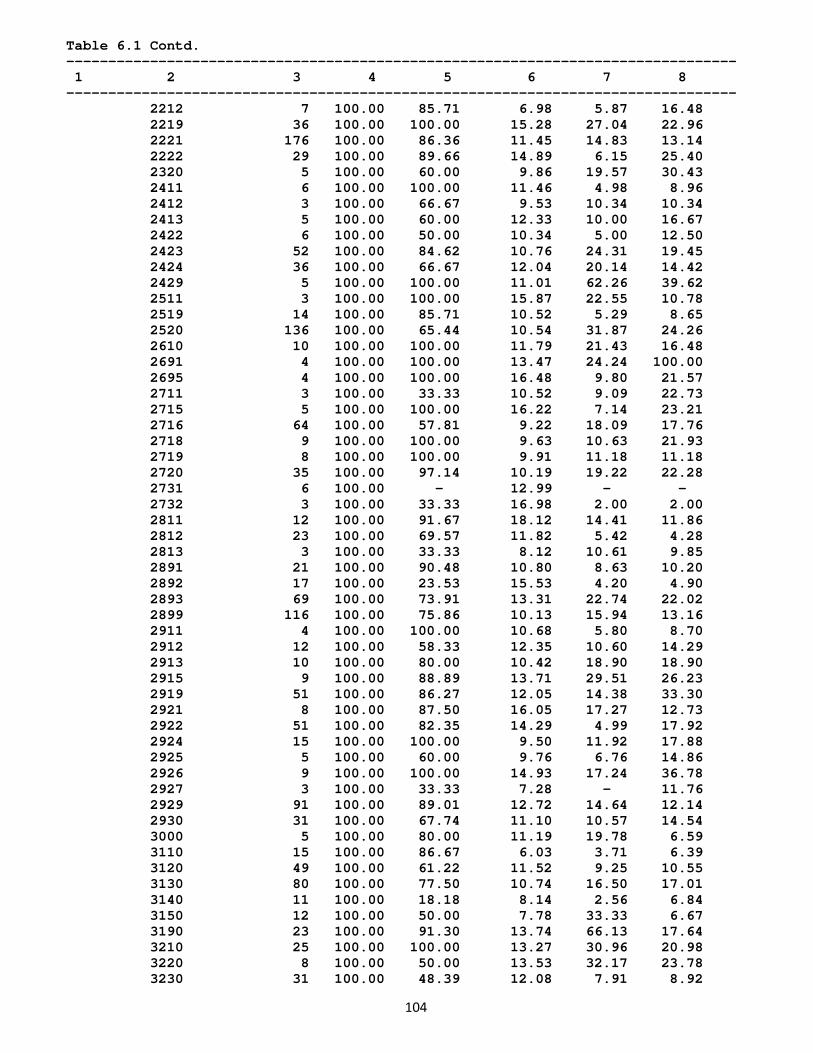
104
Table 6.1 Contd. -------------------------------------------------------------------------------- 1 2 3 4 5 6 7 8 -------------------------------------------------------------------------------- 2212 7 100.00 85.71 6.98 5.87 16.48 2219 36 100.00 100.00 15.28 27.04 22.96 2221 176 100.00 86.36 11.45 14.83 13.14 2222 29 100.00 89.66 14.89 6.15 25.40 2320 5 100.00 60.00 9.86 19.57 30.43 2411 6 100.00 100.00 11.46 4.98 8.96 2412 3 100.00 66.67 9.53 10.34 10.34 2413 5 100.00 60.00 12.33 10.00 16.67 2422 6 100.00 50.00 10.34 5.00 12.50 2423 52 100.00 84.62 10.76 24.31 19.45 2424 36 100.00 66.67 12.04 20.14 14.42 2429 5 100.00 100.00 11.01 62.26 39.62 2511 3 100.00 100.00 15.87 22.55 10.78 2519 14 100.00 85.71 10.52 5.29 8.65 2520 136 100.00 65.44 10.54 31.87 24.26 2610 10 100.00 100.00 11.79 21.43 16.48 2691 4 100.00 100.00 13.47 24.24 100.00 2695 4 100.00 100.00 16.48 9.80 21.57 2711 3 100.00 33.33 10.52 9.09 22.73 2715 5 100.00 100.00 16.22 7.14 23.21 2716 64 100.00 57.81 9.22 18.09 17.76 2718 9 100.00 100.00 9.63 10.63 21.93 2719 8 100.00 100.00 9.91 11.18 11.18 2720 35 100.00 97.14 10.19 19.22 22.28 2731 6 100.00 - 12.99 - - 2732 3 100.00 33.33 16.98 2.00 2.00 2811 12 100.00 91.67 18.12 14.41 11.86 2812 23 100.00 69.57 11.82 5.42 4.28 2813 3 100.00 33.33 8.12 10.61 9.85 2891 21 100.00 90.48 10.80 8.63 10.20 2892 17 100.00 23.53 15.53 4.20 4.90 2893 69 100.00 73.91 13.31 22.74 22.02 2899 116 100.00 75.86 10.13 15.94 13.16 2911 4 100.00 100.00 10.68 5.80 8.70 2912 12 100.00 58.33 12.35 10.60 14.29 2913 10 100.00 80.00 10.42 18.90 18.90 2915 9 100.00 88.89 13.71 29.51 26.23 2919 51 100.00 86.27 12.05 14.38 33.30 2921 8 100.00 87.50 16.05 17.27 12.73 2922 51 100.00 82.35 14.29 4.99 17.92 2924 15 100.00 100.00 9.50 11.92 17.88 2925 5 100.00 60.00 9.76 6.76 14.86 2926 9 100.00 100.00 14.93 17.24 36.78 2927 3 100.00 33.33 7.28 - 11.76 2929 91 100.00 89.01 12.72 14.64 12.14 2930 31 100.00 67.74 11.10 10.57 14.54 3000 5 100.00 80.00 11.19 19.78 6.59 3110 15 100.00 86.67 6.03 3.71 6.39 3120 49 100.00 61.22 11.52 9.25 10.55 3130 80 100.00 77.50 10.74 16.50 17.01 3140 11 100.00 18.18 8.14 2.56 6.84 3150 12 100.00 50.00 7.78 33.33 6.67 3190 23 100.00 91.30 13.74 66.13 17.64 3210 25 100.00 100.00 13.27 30.96 20.98 3220 8 100.00 50.00 13.53 32.17 23.78 3230 31 100.00 48.39 12.08 7.91 8.92
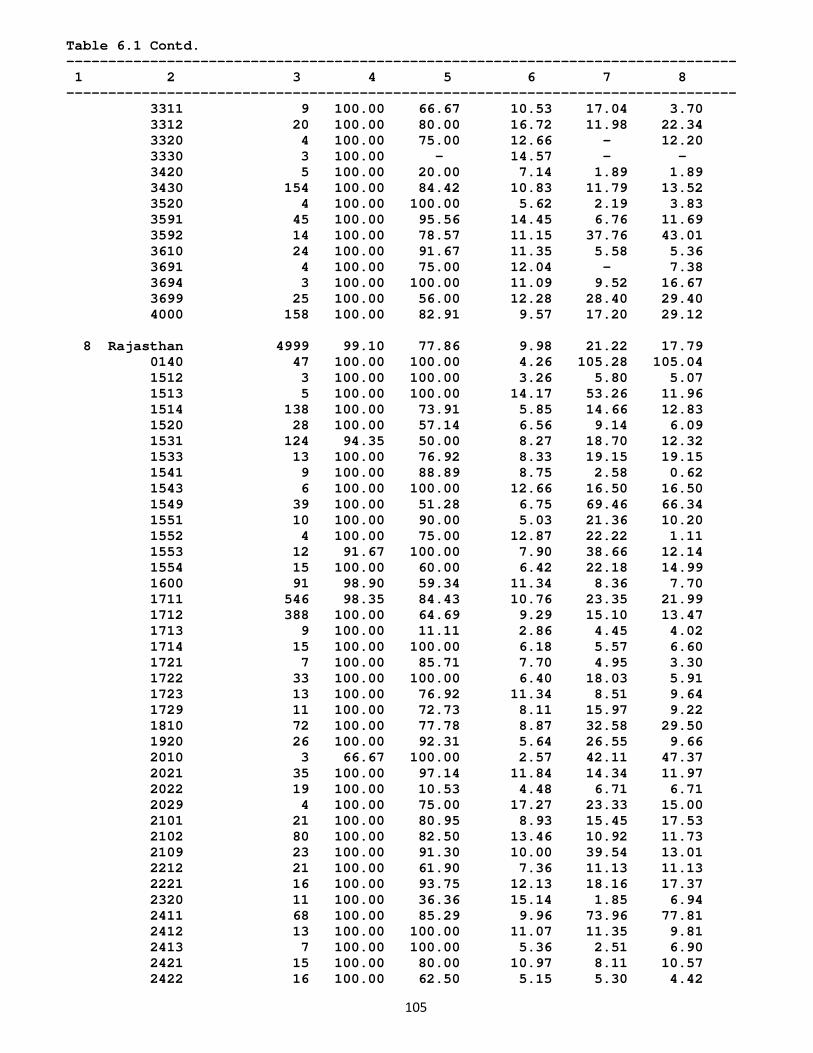
105
Table 6.1 Contd. -------------------------------------------------------------------------------- 1 2 3 4 5 6 7 8 -------------------------------------------------------------------------------- 3311 9 100.00 66.67 10.53 17.04 3.70 3312 20 100.00 80.00 16.72 11.98 22.34 3320 4 100.00 75.00 12.66 - 12.20 3330 3 100.00 - 14.57 - - 3420 5 100.00 20.00 7.14 1.89 1.89 3430 154 100.00 84.42 10.83 11.79 13.52 3520 4 100.00 100.00 5.62 2.19 3.83 3591 45 100.00 95.56 14.45 6.76 11.69 3592 14 100.00 78.57 11.15 37.76 43.01 3610 24 100.00 91.67 11.35 5.58 5.36 3691 4 100.00 75.00 12.04 - 7.38 3694 3 100.00 100.00 11.09 9.52 16.67 3699 25 100.00 56.00 12.28 28.40 29.40 4000 158 100.00 82.91 9.57 17.20 29.12 8 Rajasthan 4999 99.10 77.86 9.98 21.22 17.79 0140 47 100.00 100.00 4.26 105.28 105.04 1512 3 100.00 100.00 3.26 5.80 5.07 1513 5 100.00 100.00 14.17 53.26 11.96 1514 138 100.00 73.91 5.85 14.66 12.83 1520 28 100.00 57.14 6.56 9.14 6.09 1531 124 94.35 50.00 8.27 18.70 12.32 1533 13 100.00 76.92 8.33 19.15 19.15 1541 9 100.00 88.89 8.75 2.58 0.62 1543 6 100.00 100.00 12.66 16.50 16.50 1549 39 100.00 51.28 6.75 69.46 66.34 1551 10 100.00 90.00 5.03 21.36 10.20 1552 4 100.00 75.00 12.87 22.22 1.11 1553 12 91.67 100.00 7.90 38.66 12.14 1554 15 100.00 60.00 6.42 22.18 14.99 1600 91 98.90 59.34 11.34 8.36 7.70 1711 546 98.35 84.43 10.76 23.35 21.99 1712 388 100.00 64.69 9.29 15.10 13.47 1713 9 100.00 11.11 2.86 4.45 4.02 1714 15 100.00 100.00 6.18 5.57 6.60 1721 7 100.00 85.71 7.70 4.95 3.30 1722 33 100.00 100.00 6.40 18.03 5.91 1723 13 100.00 76.92 11.34 8.51 9.64 1729 11 100.00 72.73 8.11 15.97 9.22 1810 72 100.00 77.78 8.87 32.58 29.50 1920 26 100.00 92.31 5.64 26.55 9.66 2010 3 66.67 100.00 2.57 42.11 47.37 2021 35 100.00 97.14 11.84 14.34 11.97 2022 19 100.00 10.53 4.48 6.71 6.71 2029 4 100.00 75.00 17.27 23.33 15.00 2101 21 100.00 80.95 8.93 15.45 17.53 2102 80 100.00 82.50 13.46 10.92 11.73 2109 23 100.00 91.30 10.00 39.54 13.01 2212 21 100.00 61.90 7.36 11.13 11.13 2221 16 100.00 93.75 12.13 18.16 17.37 2320 11 100.00 36.36 15.14 1.85 6.94 2411 68 100.00 85.29 9.96 73.96 77.81 2412 13 100.00 100.00 11.07 11.35 9.81 2413 7 100.00 100.00 5.36 2.51 6.90 2421 15 100.00 80.00 10.97 8.11 10.57 2422 16 100.00 62.50 5.15 5.30 4.42
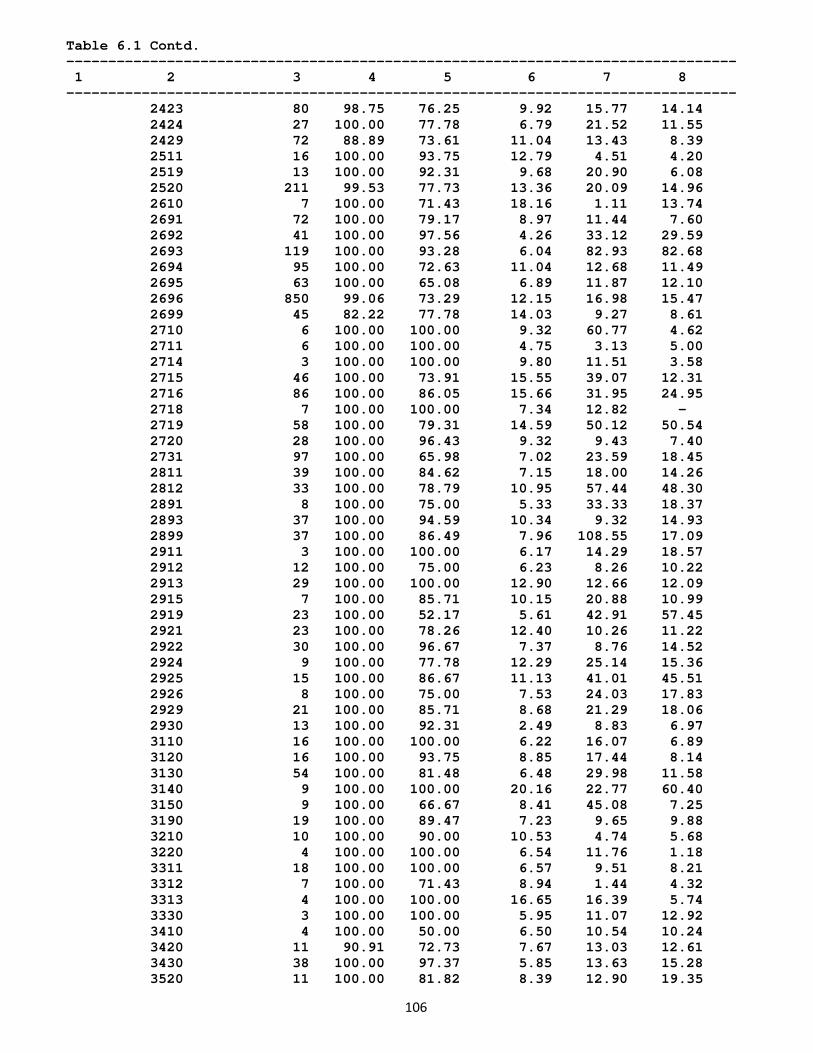
106
Table 6.1 Contd. -------------------------------------------------------------------------------- 1 2 3 4 5 6 7 8 -------------------------------------------------------------------------------- 2423 80 98.75 76.25 9.92 15.77 14.14 2424 27 100.00 77.78 6.79 21.52 11.55 2429 72 88.89 73.61 11.04 13.43 8.39 2511 16 100.00 93.75 12.79 4.51 4.20 2519 13 100.00 92.31 9.68 20.90 6.08 2520 211 99.53 77.73 13.36 20.09 14.96 2610 7 100.00 71.43 18.16 1.11 13.74 2691 72 100.00 79.17 8.97 11.44 7.60 2692 41 100.00 97.56 4.26 33.12 29.59 2693 119 100.00 93.28 6.04 82.93 82.68 2694 95 100.00 72.63 11.04 12.68 11.49 2695 63 100.00 65.08 6.89 11.87 12.10 2696 850 99.06 73.29 12.15 16.98 15.47 2699 45 82.22 77.78 14.03 9.27 8.61 2710 6 100.00 100.00 9.32 60.77 4.62 2711 6 100.00 100.00 4.75 3.13 5.00 2714 3 100.00 100.00 9.80 11.51 3.58 2715 46 100.00 73.91 15.55 39.07 12.31 2716 86 100.00 86.05 15.66 31.95 24.95 2718 7 100.00 100.00 7.34 12.82 - 2719 58 100.00 79.31 14.59 50.12 50.54 2720 28 100.00 96.43 9.32 9.43 7.40 2731 97 100.00 65.98 7.02 23.59 18.45 2811 39 100.00 84.62 7.15 18.00 14.26 2812 33 100.00 78.79 10.95 57.44 48.30 2891 8 100.00 75.00 5.33 33.33 18.37 2893 37 100.00 94.59 10.34 9.32 14.93 2899 37 100.00 86.49 7.96 108.55 17.09 2911 3 100.00 100.00 6.17 14.29 18.57 2912 12 100.00 75.00 6.23 8.26 10.22 2913 29 100.00 100.00 12.90 12.66 12.09 2915 7 100.00 85.71 10.15 20.88 10.99 2919 23 100.00 52.17 5.61 42.91 57.45 2921 23 100.00 78.26 12.40 10.26 11.22 2922 30 100.00 96.67 7.37 8.76 14.52 2924 9 100.00 77.78 12.29 25.14 15.36 2925 15 100.00 86.67 11.13 41.01 45.51 2926 8 100.00 75.00 7.53 24.03 17.83 2929 21 100.00 85.71 8.68 21.29 18.06 2930 13 100.00 92.31 2.49 8.83 6.97 3110 16 100.00 100.00 6.22 16.07 6.89 3120 16 100.00 93.75 8.85 17.44 8.14 3130 54 100.00 81.48 6.48 29.98 11.58 3140 9 100.00 100.00 20.16 22.77 60.40 3150 9 100.00 66.67 8.41 45.08 7.25 3190 19 100.00 89.47 7.23 9.65 9.88 3210 10 100.00 90.00 10.53 4.74 5.68 3220 4 100.00 100.00 6.54 11.76 1.18 3311 18 100.00 100.00 6.57 9.51 8.21 3312 7 100.00 71.43 8.94 1.44 4.32 3313 4 100.00 100.00 16.65 16.39 5.74 3330 3 100.00 100.00 5.95 11.07 12.92 3410 4 100.00 50.00 6.50 10.54 10.24 3420 11 90.91 72.73 7.67 13.03 12.61 3430 38 100.00 97.37 5.85 13.63 15.28 3520 11 100.00 81.82 8.39 12.90 19.35
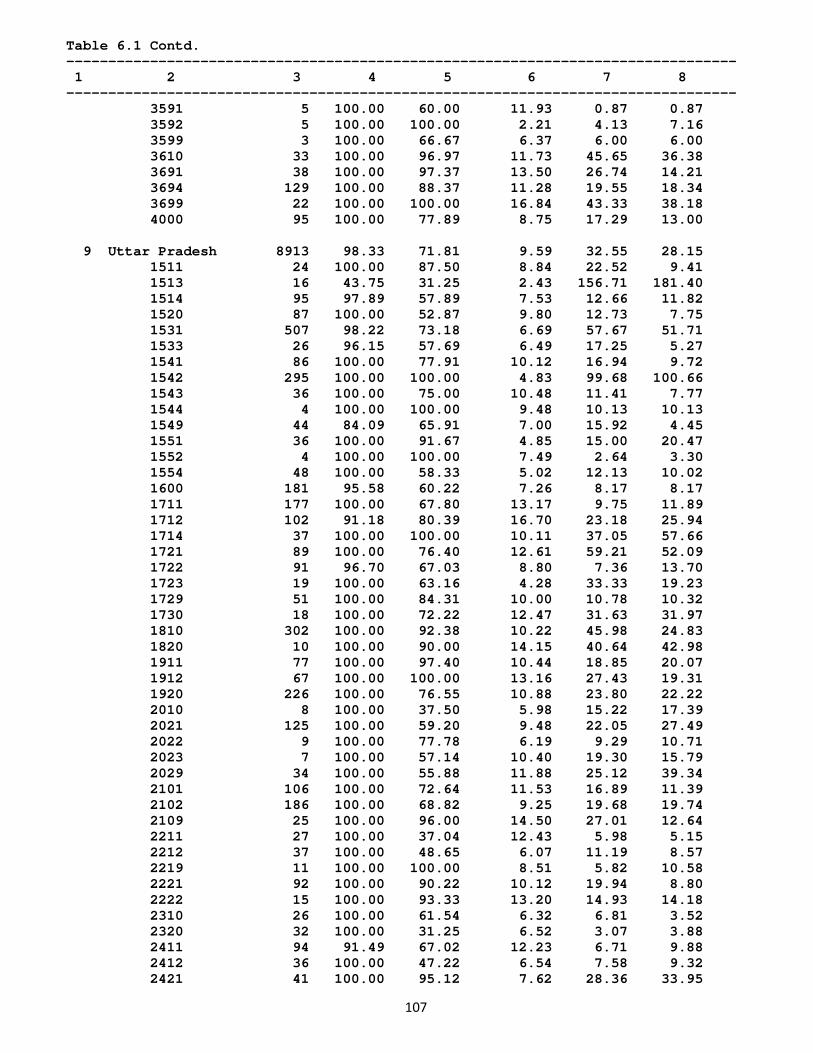
107
Table 6.1 Contd. -------------------------------------------------------------------------------- 1 2 3 4 5 6 7 8 -------------------------------------------------------------------------------- 3591 5 100.00 60.00 11.93 0.87 0.87 3592 5 100.00 100.00 2.21 4.13 7.16 3599 3 100.00 66.67 6.37 6.00 6.00 3610 33 100.00 96.97 11.73 45.65 36.38 3691 38 100.00 97.37 13.50 26.74 14.21 3694 129 100.00 88.37 11.28 19.55 18.34 3699 22 100.00 100.00 16.84 43.33 38.18 4000 95 100.00 77.89 8.75 17.29 13.00 9 Uttar Pradesh 8913 98.33 71.81 9.59 32.55 28.15 1511 24 100.00 87.50 8.84 22.52 9.41 1513 16 43.75 31.25 2.43 156.71 181.40 1514 95 97.89 57.89 7.53 12.66 11.82 1520 87 100.00 52.87 9.80 12.73 7.75 1531 507 98.22 73.18 6.69 57.67 51.71 1533 26 96.15 57.69 6.49 17.25 5.27 1541 86 100.00 77.91 10.12 16.94 9.72 1542 295 100.00 100.00 4.83 99.68 100.66 1543 36 100.00 75.00 10.48 11.41 7.77 1544 4 100.00 100.00 9.48 10.13 10.13 1549 44 84.09 65.91 7.00 15.92 4.45 1551 36 100.00 91.67 4.85 15.00 20.47 1552 4 100.00 100.00 7.49 2.64 3.30 1554 48 100.00 58.33 5.02 12.13 10.02 1600 181 95.58 60.22 7.26 8.17 8.17 1711 177 100.00 67.80 13.17 9.75 11.89 1712 102 91.18 80.39 16.70 23.18 25.94 1714 37 100.00 100.00 10.11 37.05 57.66 1721 89 100.00 76.40 12.61 59.21 52.09 1722 91 96.70 67.03 8.80 7.36 13.70 1723 19 100.00 63.16 4.28 33.33 19.23 1729 51 100.00 84.31 10.00 10.78 10.32 1730 18 100.00 72.22 12.47 31.63 31.97 1810 302 100.00 92.38 10.22 45.98 24.83 1820 10 100.00 90.00 14.15 40.64 42.98 1911 77 100.00 97.40 10.44 18.85 20.07 1912 67 100.00 100.00 13.16 27.43 19.31 1920 226 100.00 76.55 10.88 23.80 22.22 2010 8 100.00 37.50 5.98 15.22 17.39 2021 125 100.00 59.20 9.48 22.05 27.49 2022 9 100.00 77.78 6.19 9.29 10.71 2023 7 100.00 57.14 10.40 19.30 15.79 2029 34 100.00 55.88 11.88 25.12 39.34 2101 106 100.00 72.64 11.53 16.89 11.39 2102 186 100.00 68.82 9.25 19.68 19.74 2109 25 100.00 96.00 14.50 27.01 12.64 2211 27 100.00 37.04 12.43 5.98 5.15 2212 37 100.00 48.65 6.07 11.19 8.57 2219 11 100.00 100.00 8.51 5.82 10.58 2221 92 100.00 90.22 10.12 19.94 8.80 2222 15 100.00 93.33 13.20 14.93 14.18 2310 26 100.00 61.54 6.32 6.81 3.52 2320 32 100.00 31.25 6.52 3.07 3.88 2411 94 91.49 67.02 12.23 6.71 9.88 2412 36 100.00 47.22 6.54 7.58 9.32 2421 41 100.00 95.12 7.62 28.36 33.95
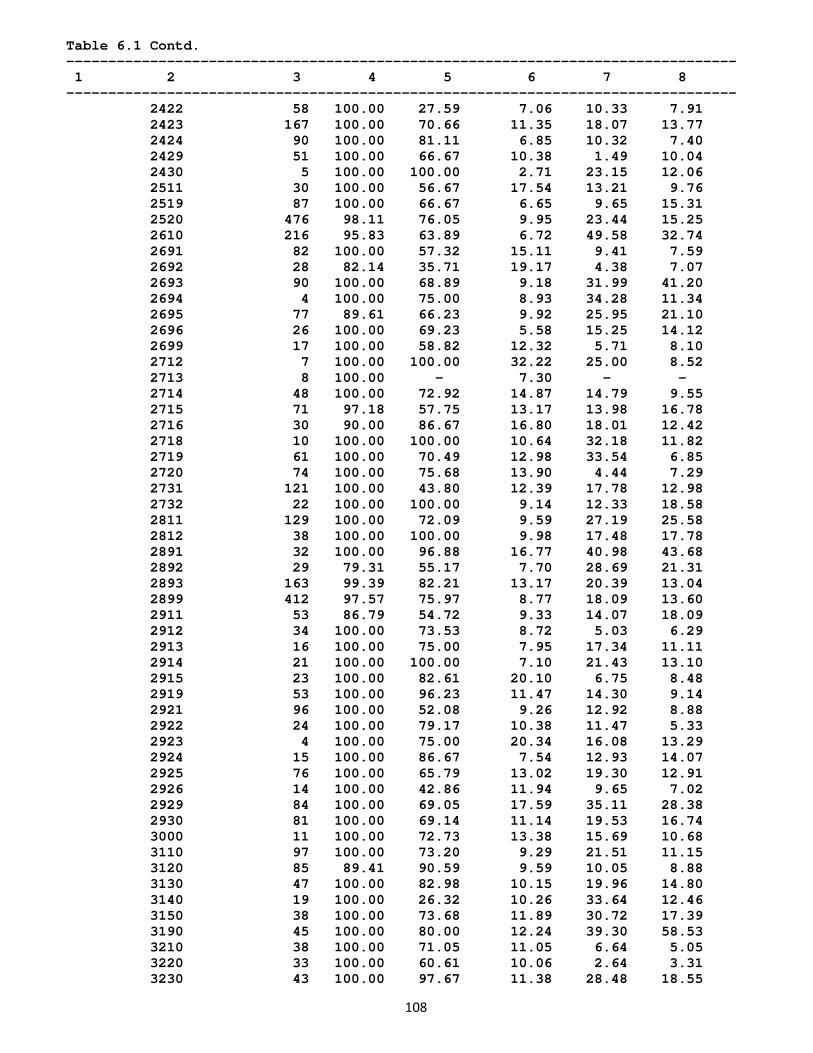
108
Table 6.1 Contd. -------------------------------------------------------------------------------- 1 2 3 4 5 6 7 8 -------------------------------------------------------------------------------- 2422 58 100.00 27.59 7.06 10.33 7.91 2423 167 100.00 70.66 11.35 18.07 13.77 2424 90 100.00 81.11 6.85 10.32 7.40 2429 51 100.00 66.67 10.38 1.49 10.04 2430 5 100.00 100.00 2.71 23.15 12.06 2511 30 100.00 56.67 17.54 13.21 9.76 2519 87 100.00 66.67 6.65 9.65 15.31 2520 476 98.11 76.05 9.95 23.44 15.25 2610 216 95.83 63.89 6.72 49.58 32.74 2691 82 100.00 57.32 15.11 9.41 7.59 2692 28 82.14 35.71 19.17 4.38 7.07 2693 90 100.00 68.89 9.18 31.99 41.20 2694 4 100.00 75.00 8.93 34.28 11.34 2695 77 89.61 66.23 9.92 25.95 21.10 2696 26 100.00 69.23 5.58 15.25 14.12 2699 17 100.00 58.82 12.32 5.71 8.10 2712 7 100.00 100.00 32.22 25.00 8.52 2713 8 100.00 - 7.30 - - 2714 48 100.00 72.92 14.87 14.79 9.55 2715 71 97.18 57.75 13.17 13.98 16.78 2716 30 90.00 86.67 16.80 18.01 12.42 2718 10 100.00 100.00 10.64 32.18 11.82 2719 61 100.00 70.49 12.98 33.54 6.85 2720 74 100.00 75.68 13.90 4.44 7.29 2731 121 100.00 43.80 12.39 17.78 12.98 2732 22 100.00 100.00 9.14 12.33 18.58 2811 129 100.00 72.09 9.59 27.19 25.58 2812 38 100.00 100.00 9.98 17.48 17.78 2891 32 100.00 96.88 16.77 40.98 43.68 2892 29 79.31 55.17 7.70 28.69 21.31 2893 163 99.39 82.21 13.17 20.39 13.04 2899 412 97.57 75.97 8.77 18.09 13.60 2911 53 86.79 54.72 9.33 14.07 18.09 2912 34 100.00 73.53 8.72 5.03 6.29 2913 16 100.00 75.00 7.95 17.34 11.11 2914 21 100.00 100.00 7.10 21.43 13.10 2915 23 100.00 82.61 20.10 6.75 8.48 2919 53 100.00 96.23 11.47 14.30 9.14 2921 96 100.00 52.08 9.26 12.92 8.88 2922 24 100.00 79.17 10.38 11.47 5.33 2923 4 100.00 75.00 20.34 16.08 13.29 2924 15 100.00 86.67 7.54 12.93 14.07 2925 76 100.00 65.79 13.02 19.30 12.91 2926 14 100.00 42.86 11.94 9.65 7.02 2929 84 100.00 69.05 17.59 35.11 28.38 2930 81 100.00 69.14 11.14 19.53 16.74 3000 11 100.00 72.73 13.38 15.69 10.68 3110 97 100.00 73.20 9.29 21.51 11.15 3120 85 89.41 90.59 9.59 10.05 8.88 3130 47 100.00 82.98 10.15 19.96 14.80 3140 19 100.00 26.32 10.26 33.64 12.46 3150 38 100.00 73.68 11.89 30.72 17.39 3190 45 100.00 80.00 12.24 39.30 58.53 3210 38 100.00 71.05 11.05 6.64 5.05 3220 33 100.00 60.61 10.06 2.64 3.31 3230 43 100.00 97.67 11.38 28.48 18.55
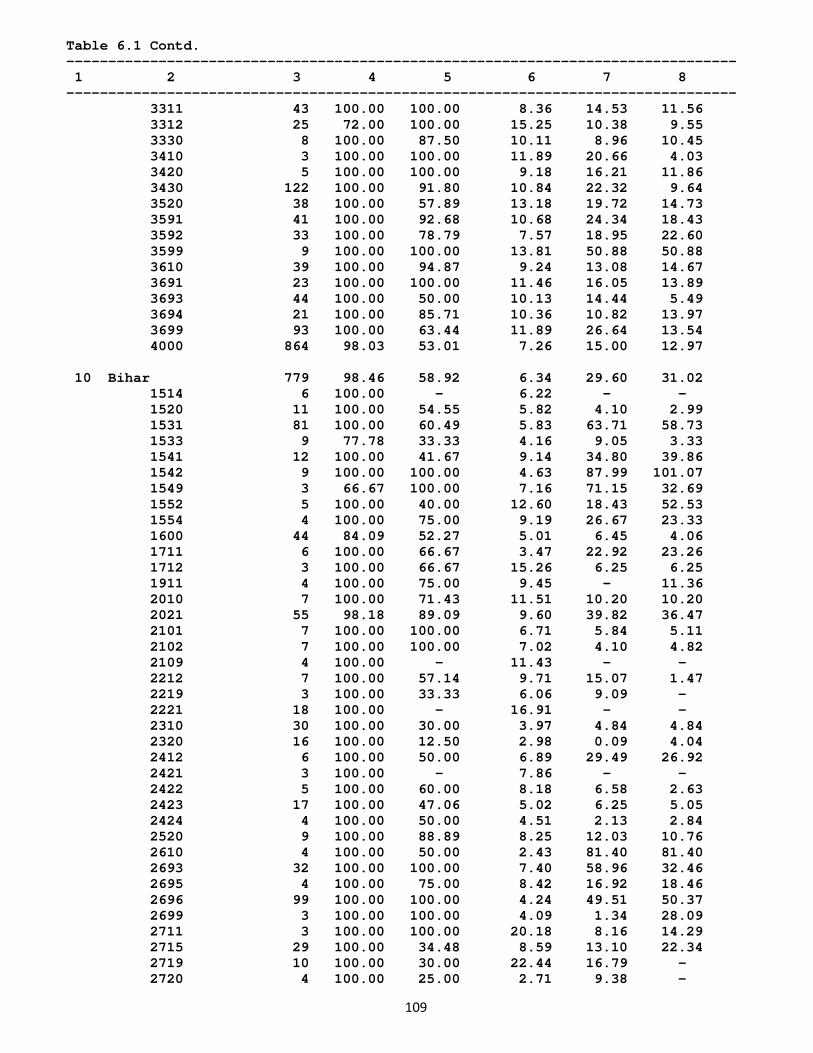
109
Table 6.1 Contd. -------------------------------------------------------------------------------- 1 2 3 4 5 6 7 8 -------------------------------------------------------------------------------- 3311 43 100.00 100.00 8.36 14.53 11.56 3312 25 72.00 100.00 15.25 10.38 9.55 3330 8 100.00 87.50 10.11 8.96 10.45 3410 3 100.00 100.00 11.89 20.66 4.03 3420 5 100.00 100.00 9.18 16.21 11.86 3430 122 100.00 91.80 10.84 22.32 9.64 3520 38 100.00 57.89 13.18 19.72 14.73 3591 41 100.00 92.68 10.68 24.34 18.43 3592 33 100.00 78.79 7.57 18.95 22.60 3599 9 100.00 100.00 13.81 50.88 50.88 3610 39 100.00 94.87 9.24 13.08 14.67 3691 23 100.00 100.00 11.46 16.05 13.89 3693 44 100.00 50.00 10.13 14.44 5.49 3694 21 100.00 85.71 10.36 10.82 13.97 3699 93 100.00 63.44 11.89 26.64 13.54 4000 864 98.03 53.01 7.26 15.00 12.97 10 Bihar 779 98.46 58.92 6.34 29.60 31.02 1514 6 100.00 - 6.22 - - 1520 11 100.00 54.55 5.82 4.10 2.99 1531 81 100.00 60.49 5.83 63.71 58.73 1533 9 77.78 33.33 4.16 9.05 3.33 1541 12 100.00 41.67 9.14 34.80 39.86 1542 9 100.00 100.00 4.63 87.99 101.07 1549 3 66.67 100.00 7.16 71.15 32.69 1552 5 100.00 40.00 12.60 18.43 52.53 1554 4 100.00 75.00 9.19 26.67 23.33 1600 44 84.09 52.27 5.01 6.45 4.06 1711 6 100.00 66.67 3.47 22.92 23.26 1712 3 100.00 66.67 15.26 6.25 6.25 1911 4 100.00 75.00 9.45 - 11.36 2010 7 100.00 71.43 11.51 10.20 10.20 2021 55 98.18 89.09 9.60 39.82 36.47 2101 7 100.00 100.00 6.71 5.84 5.11 2102 7 100.00 100.00 7.02 4.10 4.82 2109 4 100.00 - 11.43 - - 2212 7 100.00 57.14 9.71 15.07 1.47 2219 3 100.00 33.33 6.06 9.09 - 2221 18 100.00 - 16.91 - - 2310 30 100.00 30.00 3.97 4.84 4.84 2320 16 100.00 12.50 2.98 0.09 4.04 2412 6 100.00 50.00 6.89 29.49 26.92 2421 3 100.00 - 7.86 - - 2422 5 100.00 60.00 8.18 6.58 2.63 2423 17 100.00 47.06 5.02 6.25 5.05 2424 4 100.00 50.00 4.51 2.13 2.84 2520 9 100.00 88.89 8.25 12.03 10.76 2610 4 100.00 50.00 2.43 81.40 81.40 2693 32 100.00 100.00 7.40 58.96 32.46 2695 4 100.00 75.00 8.42 16.92 18.46 2696 99 100.00 100.00 4.24 49.51 50.37 2699 3 100.00 100.00 4.09 1.34 28.09 2711 3 100.00 100.00 20.18 8.16 14.29 2715 29 100.00 34.48 8.59 13.10 22.34 2719 10 100.00 30.00 22.44 16.79 - 2720 4 100.00 25.00 2.71 9.38 -
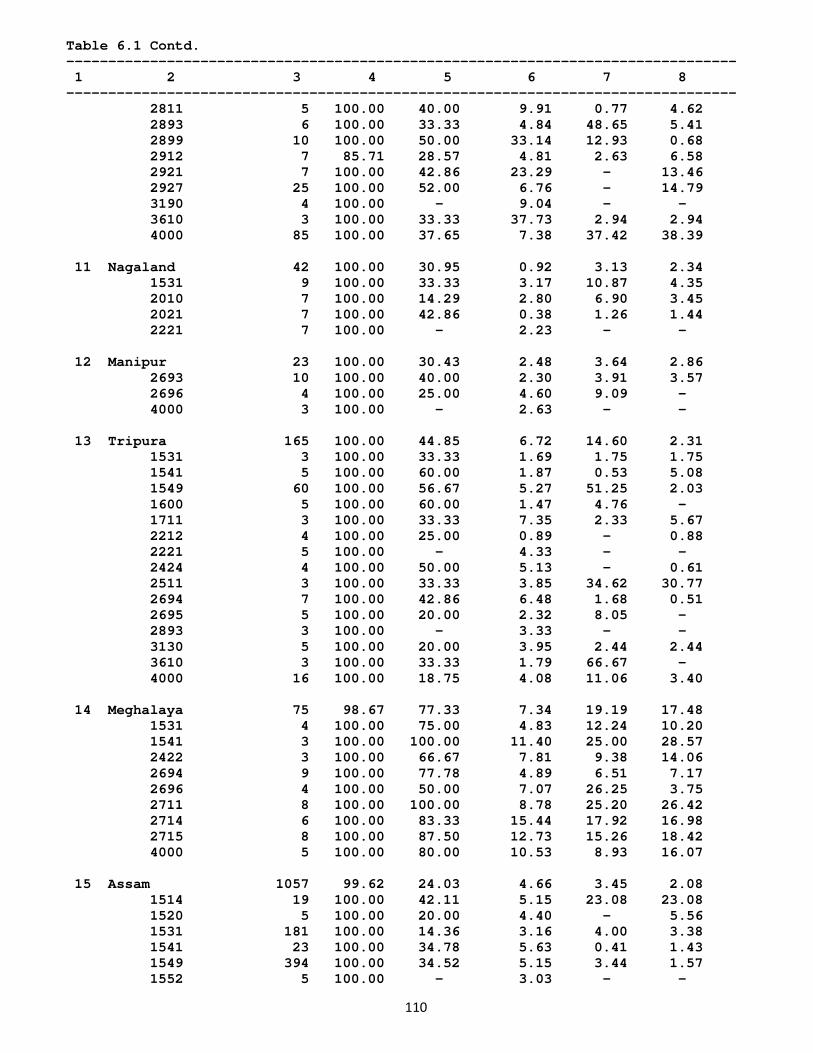
110
Table 6.1 Contd. -------------------------------------------------------------------------------- 1 2 3 4 5 6 7 8 -------------------------------------------------------------------------------- 2811 5 100.00 40.00 9.91 0.77 4.62 2893 6 100.00 33.33 4.84 48.65 5.41 2899 10 100.00 50.00 33.14 12.93 0.68 2912 7 85.71 28.57 4.81 2.63 6.58 2921 7 100.00 42.86 23.29 - 13.46 2927 25 100.00 52.00 6.76 - 14.79 3190 4 100.00 - 9.04 - - 3610 3 100.00 33.33 37.73 2.94 2.94 4000 85 100.00 37.65 7.38 37.42 38.39 11 Nagaland 42 100.00 30.95 0.92 3.13 2.34 1531 9 100.00 33.33 3.17 10.87 4.35 2010 7 100.00 14.29 2.80 6.90 3.45 2021 7 100.00 42.86 0.38 1.26 1.44 2221 7 100.00 - 2.23 - - 12 Manipur 23 100.00 30.43 2.48 3.64 2.86 2693 10 100.00 40.00 2.30 3.91 3.57 2696 4 100.00 25.00 4.60 9.09 - 4000 3 100.00 - 2.63 - - 13 Tripura 165 100.00 44.85 6.72 14.60 2.31 1531 3 100.00 33.33 1.69 1.75 1.75 1541 5 100.00 60.00 1.87 0.53 5.08 1549 60 100.00 56.67 5.27 51.25 2.03 1600 5 100.00 60.00 1.47 4.76 - 1711 3 100.00 33.33 7.35 2.33 5.67 2212 4 100.00 25.00 0.89 - 0.88 2221 5 100.00 - 4.33 - - 2424 4 100.00 50.00 5.13 - 0.61 2511 3 100.00 33.33 3.85 34.62 30.77 2694 7 100.00 42.86 6.48 1.68 0.51 2695 5 100.00 20.00 2.32 8.05 - 2893 3 100.00 - 3.33 - - 3130 5 100.00 20.00 3.95 2.44 2.44 3610 3 100.00 33.33 1.79 66.67 - 4000 16 100.00 18.75 4.08 11.06 3.40 14 Meghalaya 75 98.67 77.33 7.34 19.19 17.48 1531 4 100.00 75.00 4.83 12.24 10.20 1541 3 100.00 100.00 11.40 25.00 28.57 2422 3 100.00 66.67 7.81 9.38 14.06 2694 9 100.00 77.78 4.89 6.51 7.17 2696 4 100.00 50.00 7.07 26.25 3.75 2711 8 100.00 100.00 8.78 25.20 26.42 2714 6 100.00 83.33 15.44 17.92 16.98 2715 8 100.00 87.50 12.73 15.26 18.42 4000 5 100.00 80.00 10.53 8.93 16.07 15 Assam 1057 99.62 24.03 4.66 3.45 2.08 1514 19 100.00 42.11 5.15 23.08 23.08 1520 5 100.00 20.00 4.40 - 5.56 1531 181 100.00 14.36 3.16 4.00 3.38 1541 23 100.00 34.78 5.63 0.41 1.43 1549 394 100.00 34.52 5.15 3.44 1.57 1552 5 100.00 - 3.03 - -
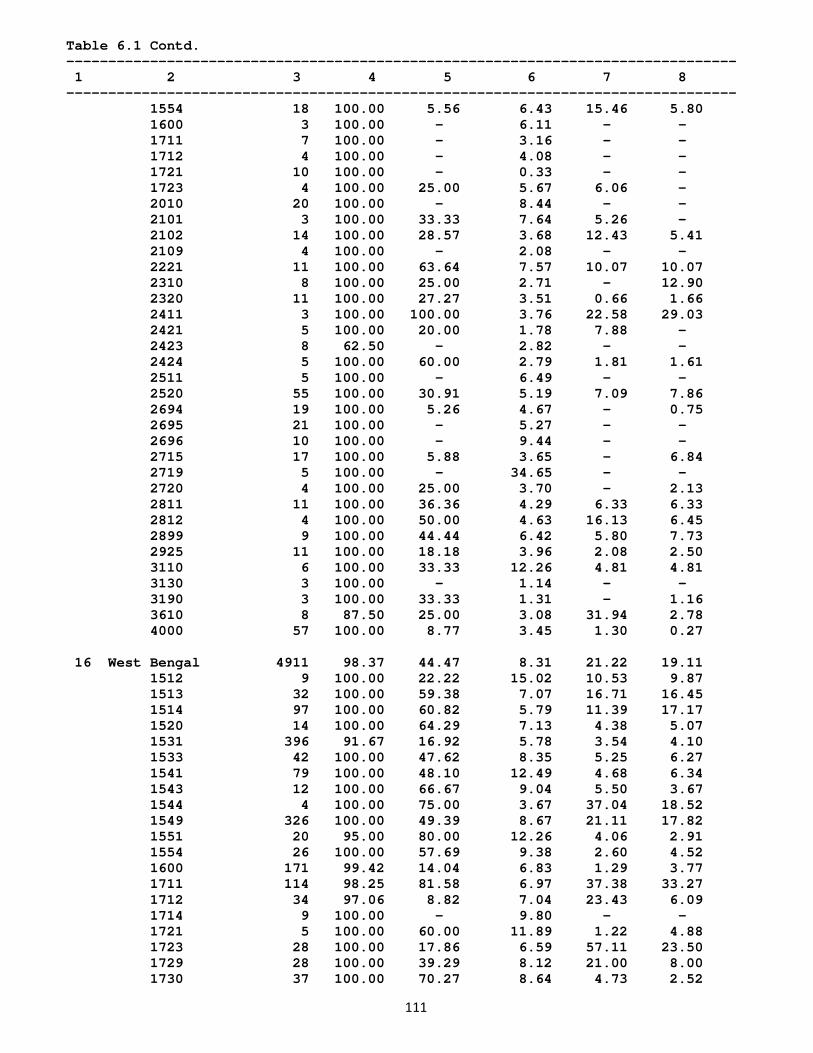
111
Table 6.1 Contd. -------------------------------------------------------------------------------- 1 2 3 4 5 6 7 8 -------------------------------------------------------------------------------- 1554 18 100.00 5.56 6.43 15.46 5.80 1600 3 100.00 - 6.11 - - 1711 7 100.00 - 3.16 - - 1712 4 100.00 - 4.08 - - 1721 10 100.00 - 0.33 - - 1723 4 100.00 25.00 5.67 6.06 - 2010 20 100.00 - 8.44 - - 2101 3 100.00 33.33 7.64 5.26 - 2102 14 100.00 28.57 3.68 12.43 5.41 2109 4 100.00 - 2.08 - - 2221 11 100.00 63.64 7.57 10.07 10.07 2310 8 100.00 25.00 2.71 - 12.90 2320 11 100.00 27.27 3.51 0.66 1.66 2411 3 100.00 100.00 3.76 22.58 29.03 2421 5 100.00 20.00 1.78 7.88 - 2423 8 62.50 - 2.82 - - 2424 5 100.00 60.00 2.79 1.81 1.61 2511 5 100.00 - 6.49 - - 2520 55 100.00 30.91 5.19 7.09 7.86 2694 19 100.00 5.26 4.67 - 0.75 2695 21 100.00 - 5.27 - - 2696 10 100.00 - 9.44 - - 2715 17 100.00 5.88 3.65 - 6.84 2719 5 100.00 - 34.65 - - 2720 4 100.00 25.00 3.70 - 2.13 2811 11 100.00 36.36 4.29 6.33 6.33 2812 4 100.00 50.00 4.63 16.13 6.45 2899 9 100.00 44.44 6.42 5.80 7.73 2925 11 100.00 18.18 3.96 2.08 2.50 3110 6 100.00 33.33 12.26 4.81 4.81 3130 3 100.00 - 1.14 - - 3190 3 100.00 33.33 1.31 - 1.16 3610 8 87.50 25.00 3.08 31.94 2.78 4000 57 100.00 8.77 3.45 1.30 0.27 16 West Bengal 4911 98.37 44.47 8.31 21.22 19.11 1512 9 100.00 22.22 15.02 10.53 9.87 1513 32 100.00 59.38 7.07 16.71 16.45 1514 97 100.00 60.82 5.79 11.39 17.17 1520 14 100.00 64.29 7.13 4.38 5.07 1531 396 91.67 16.92 5.78 3.54 4.10 1533 42 100.00 47.62 8.35 5.25 6.27 1541 79 100.00 48.10 12.49 4.68 6.34 1543 12 100.00 66.67 9.04 5.50 3.67 1544 4 100.00 75.00 3.67 37.04 18.52 1549 326 100.00 49.39 8.67 21.11 17.82 1551 20 95.00 80.00 12.26 4.06 2.91 1554 26 100.00 57.69 9.38 2.60 4.52 1600 171 99.42 14.04 6.83 1.29 3.77 1711 114 98.25 81.58 6.97 37.38 33.27 1712 34 97.06 8.82 7.04 23.43 6.09 1714 9 100.00 - 9.80 - - 1721 5 100.00 60.00 11.89 1.22 4.88 1723 28 100.00 17.86 6.59 57.11 23.50 1729 28 100.00 39.29 8.12 21.00 8.00 1730 37 100.00 70.27 8.64 4.73 2.52
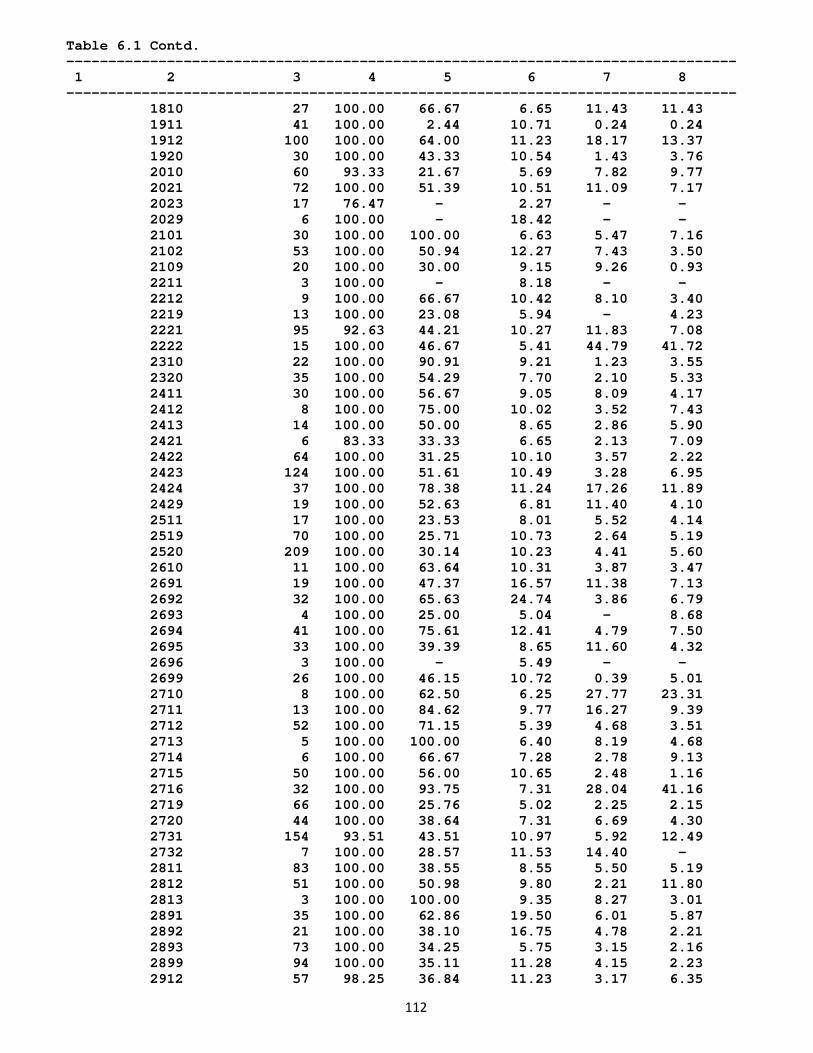
112
Table 6.1 Contd. -------------------------------------------------------------------------------- 1 2 3 4 5 6 7 8 -------------------------------------------------------------------------------- 1810 27 100.00 66.67 6.65 11.43 11.43 1911 41 100.00 2.44 10.71 0.24 0.24 1912 100 100.00 64.00 11.23 18.17 13.37 1920 30 100.00 43.33 10.54 1.43 3.76 2010 60 93.33 21.67 5.69 7.82 9.77 2021 72 100.00 51.39 10.51 11.09 7.17 2023 17 76.47 - 2.27 - - 2029 6 100.00 - 18.42 - - 2101 30 100.00 100.00 6.63 5.47 7.16 2102 53 100.00 50.94 12.27 7.43 3.50 2109 20 100.00 30.00 9.15 9.26 0.93 2211 3 100.00 - 8.18 - - 2212 9 100.00 66.67 10.42 8.10 3.40 2219 13 100.00 23.08 5.94 - 4.23 2221 95 92.63 44.21 10.27 11.83 7.08 2222 15 100.00 46.67 5.41 44.79 41.72 2310 22 100.00 90.91 9.21 1.23 3.55 2320 35 100.00 54.29 7.70 2.10 5.33 2411 30 100.00 56.67 9.05 8.09 4.17 2412 8 100.00 75.00 10.02 3.52 7.43 2413 14 100.00 50.00 8.65 2.86 5.90 2421 6 83.33 33.33 6.65 2.13 7.09 2422 64 100.00 31.25 10.10 3.57 2.22 2423 124 100.00 51.61 10.49 3.28 6.95 2424 37 100.00 78.38 11.24 17.26 11.89 2429 19 100.00 52.63 6.81 11.40 4.10 2511 17 100.00 23.53 8.01 5.52 4.14 2519 70 100.00 25.71 10.73 2.64 5.19 2520 209 100.00 30.14 10.23 4.41 5.60 2610 11 100.00 63.64 10.31 3.87 3.47 2691 19 100.00 47.37 16.57 11.38 7.13 2692 32 100.00 65.63 24.74 3.86 6.79 2693 4 100.00 25.00 5.04 - 8.68 2694 41 100.00 75.61 12.41 4.79 7.50 2695 33 100.00 39.39 8.65 11.60 4.32 2696 3 100.00 - 5.49 - - 2699 26 100.00 46.15 10.72 0.39 5.01 2710 8 100.00 62.50 6.25 27.77 23.31 2711 13 100.00 84.62 9.77 16.27 9.39 2712 52 100.00 71.15 5.39 4.68 3.51 2713 5 100.00 100.00 6.40 8.19 4.68 2714 6 100.00 66.67 7.28 2.78 9.13 2715 50 100.00 56.00 10.65 2.48 1.16 2716 32 100.00 93.75 7.31 28.04 41.16 2719 66 100.00 25.76 5.02 2.25 2.15 2720 44 100.00 38.64 7.31 6.69 4.30 2731 154 93.51 43.51 10.97 5.92 12.49 2732 7 100.00 28.57 11.53 14.40 - 2811 83 100.00 38.55 8.55 5.50 5.19 2812 51 100.00 50.98 9.80 2.21 11.80 2813 3 100.00 100.00 9.35 8.27 3.01 2891 35 100.00 62.86 19.50 6.01 5.87 2892 21 100.00 38.10 16.75 4.78 2.21 2893 73 100.00 34.25 5.75 3.15 2.16 2899 94 100.00 35.11 11.28 4.15 2.23 2912 57 98.25 36.84 11.23 3.17 6.35

113
Table 6.1 Contd. -------------------------------------------------------------------------------- 1 2 3 4 5 6 7 8 -------------------------------------------------------------------------------- 2913 42 100.00 52.38 9.66 3.38 4.65 2914 6 100.00 66.67 9.53 2.30 2.63 2915 29 100.00 82.76 9.95 6.06 4.62 2919 99 100.00 73.74 12.40 13.30 16.95 2921 14 100.00 14.29 6.79 7.65 4.12 2922 16 100.00 25.00 7.49 3.29 4.53 2924 15 100.00 26.67 5.51 1.58 3.70 2925 25 100.00 72.00 8.66 1.67 3.71 2926 5 100.00 20.00 9.30 2.47 0.41 2927 3 100.00 66.67 4.66 - 3.64 2929 39 100.00 74.36 5.59 15.52 11.79 2930 32 100.00 75.00 9.25 3.81 5.26 3000 5 100.00 40.00 10.65 62.69 15.90 3110 66 100.00 45.45 7.14 5.35 2.79 3120 48 100.00 27.08 8.06 1.64 2.91 3130 21 100.00 85.71 9.74 2.38 4.38 3140 16 100.00 62.50 7.88 0.13 3.49 3150 22 100.00 27.27 10.00 5.90 9.01 3190 52 100.00 7.69 7.58 1.57 2.02 3210 4 100.00 50.00 7.10 5.77 5.77 3220 3 100.00 66.67 9.17 9.90 - 3230 8 100.00 50.00 9.81 4.60 1.15 3311 11 100.00 72.73 8.89 10.19 6.80 3312 15 73.33 40.00 9.02 5.39 7.46 3313 5 100.00 80.00 12.58 1.92 3.83 3320 3 100.00 100.00 11.31 15.40 2.87 3410 4 100.00 100.00 17.49 - 6.54 3420 8 100.00 100.00 6.90 52.05 15.07 3430 10 100.00 100.00 15.31 9.87 1.97 3511 8 100.00 50.00 11.19 0.87 6.09 3520 74 100.00 62.16 8.62 3.11 4.31 3530 3 100.00 100.00 6.88 1.40 4.63 3610 22 100.00 13.64 7.13 4.25 3.28 3699 15 100.00 53.33 9.70 7.98 6.12 4000 390 97.44 38.72 8.62 3.27 5.35 17 Jharkhand 1114 100.00 63.02 5.83 4.04 7.52 1513 5 100.00 80.00 3.08 1.52 9.09 1514 5 100.00 60.00 5.59 14.29 19.64 1531 72 100.00 86.11 5.78 15.77 21.44 1541 4 100.00 25.00 1.82 1.52 - 1543 4 100.00 25.00 5.90 - 2.67 1552 3 100.00 66.67 4.56 1.89 5.66 1554 8 100.00 37.50 2.83 6.75 3.07 1600 18 100.00 77.78 7.84 3.51 3.18 2010 27 100.00 59.26 9.20 21.62 21.62 2021 5 100.00 40.00 8.22 1.79 7.14 2102 4 100.00 75.00 7.21 - 20.59 2212 7 100.00 42.86 3.75 4.95 2.48 2219 5 100.00 - 7.44 - - 2221 8 100.00 50.00 12.85 - 2.84 2310 223 100.00 100.00 7.83 8.88 13.01 2320 3 100.00 - 3.64 - - 2411 16 100.00 12.50 11.81 7.18 2.77 2412 4 100.00 25.00 15.51 2.22 - 2422 7 100.00 42.86 9.07 1.26 4.40
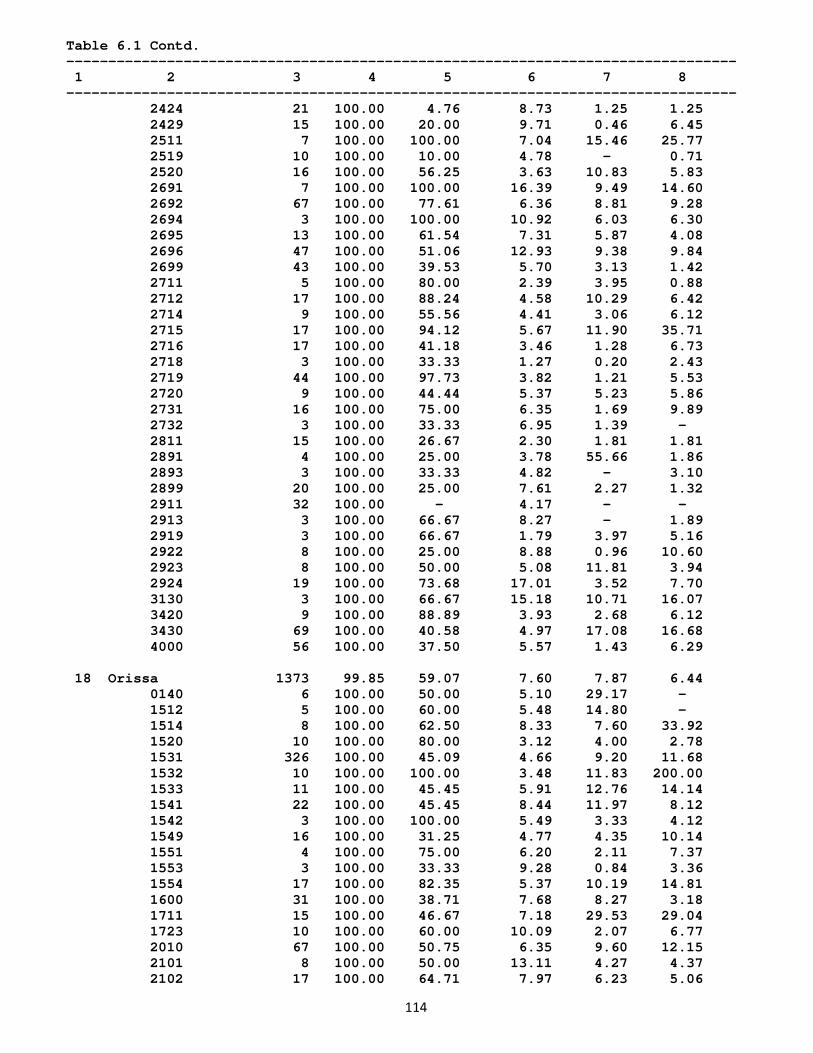
114
Table 6.1 Contd. -------------------------------------------------------------------------------- 1 2 3 4 5 6 7 8 -------------------------------------------------------------------------------- 2424 21 100.00 4.76 8.73 1.25 1.25 2429 15 100.00 20.00 9.71 0.46 6.45 2511 7 100.00 100.00 7.04 15.46 25.77 2519 10 100.00 10.00 4.78 - 0.71 2520 16 100.00 56.25 3.63 10.83 5.83 2691 7 100.00 100.00 16.39 9.49 14.60 2692 67 100.00 77.61 6.36 8.81 9.28 2694 3 100.00 100.00 10.92 6.03 6.30 2695 13 100.00 61.54 7.31 5.87 4.08 2696 47 100.00 51.06 12.93 9.38 9.84 2699 43 100.00 39.53 5.70 3.13 1.42 2711 5 100.00 80.00 2.39 3.95 0.88 2712 17 100.00 88.24 4.58 10.29 6.42 2714 9 100.00 55.56 4.41 3.06 6.12 2715 17 100.00 94.12 5.67 11.90 35.71 2716 17 100.00 41.18 3.46 1.28 6.73 2718 3 100.00 33.33 1.27 0.20 2.43 2719 44 100.00 97.73 3.82 1.21 5.53 2720 9 100.00 44.44 5.37 5.23 5.86 2731 16 100.00 75.00 6.35 1.69 9.89 2732 3 100.00 33.33 6.95 1.39 - 2811 15 100.00 26.67 2.30 1.81 1.81 2891 4 100.00 25.00 3.78 55.66 1.86 2893 3 100.00 33.33 4.82 - 3.10 2899 20 100.00 25.00 7.61 2.27 1.32 2911 32 100.00 - 4.17 - - 2913 3 100.00 66.67 8.27 - 1.89 2919 3 100.00 66.67 1.79 3.97 5.16 2922 8 100.00 25.00 8.88 0.96 10.60 2923 8 100.00 50.00 5.08 11.81 3.94 2924 19 100.00 73.68 17.01 3.52 7.70 3130 3 100.00 66.67 15.18 10.71 16.07 3420 9 100.00 88.89 3.93 2.68 6.12 3430 69 100.00 40.58 4.97 17.08 16.68 4000 56 100.00 37.50 5.57 1.43 6.29 18 Orissa 1373 99.85 59.07 7.60 7.87 6.44 0140 6 100.00 50.00 5.10 29.17 - 1512 5 100.00 60.00 5.48 14.80 - 1514 8 100.00 62.50 8.33 7.60 33.92 1520 10 100.00 80.00 3.12 4.00 2.78 1531 326 100.00 45.09 4.66 9.20 11.68 1532 10 100.00 100.00 3.48 11.83 200.00 1533 11 100.00 45.45 5.91 12.76 14.14 1541 22 100.00 45.45 8.44 11.97 8.12 1542 3 100.00 100.00 5.49 3.33 4.12 1549 16 100.00 31.25 4.77 4.35 10.14 1551 4 100.00 75.00 6.20 2.11 7.37 1553 3 100.00 33.33 9.28 0.84 3.36 1554 17 100.00 82.35 5.37 10.19 14.81 1600 31 100.00 38.71 7.68 8.27 3.18 1711 15 100.00 46.67 7.18 29.53 29.04 1723 10 100.00 60.00 10.09 2.07 6.77 2010 67 100.00 50.75 6.35 9.60 12.15 2101 8 100.00 50.00 13.11 4.27 4.37 2102 17 100.00 64.71 7.97 6.23 5.06
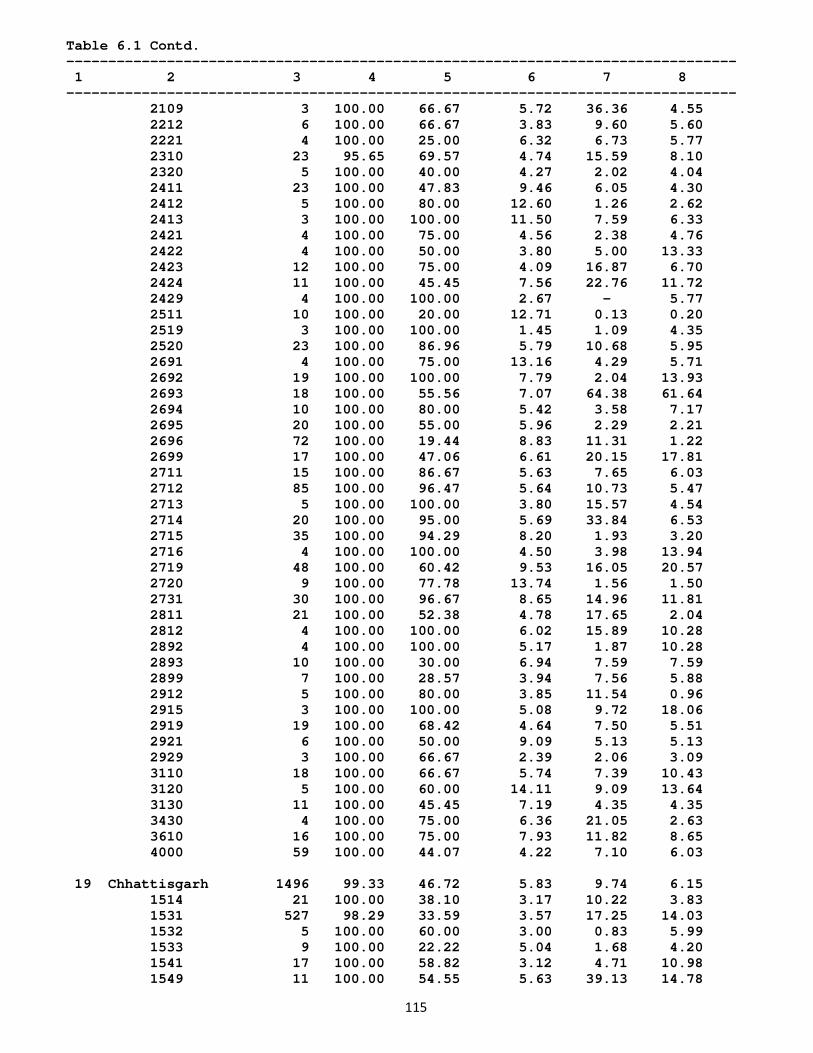
115
Table 6.1 Contd. -------------------------------------------------------------------------------- 1 2 3 4 5 6 7 8 -------------------------------------------------------------------------------- 2109 3 100.00 66.67 5.72 36.36 4.55 2212 6 100.00 66.67 3.83 9.60 5.60 2221 4 100.00 25.00 6.32 6.73 5.77 2310 23 95.65 69.57 4.74 15.59 8.10 2320 5 100.00 40.00 4.27 2.02 4.04 2411 23 100.00 47.83 9.46 6.05 4.30 2412 5 100.00 80.00 12.60 1.26 2.62 2413 3 100.00 100.00 11.50 7.59 6.33 2421 4 100.00 75.00 4.56 2.38 4.76 2422 4 100.00 50.00 3.80 5.00 13.33 2423 12 100.00 75.00 4.09 16.87 6.70 2424 11 100.00 45.45 7.56 22.76 11.72 2429 4 100.00 100.00 2.67 - 5.77 2511 10 100.00 20.00 12.71 0.13 0.20 2519 3 100.00 100.00 1.45 1.09 4.35 2520 23 100.00 86.96 5.79 10.68 5.95 2691 4 100.00 75.00 13.16 4.29 5.71 2692 19 100.00 100.00 7.79 2.04 13.93 2693 18 100.00 55.56 7.07 64.38 61.64 2694 10 100.00 80.00 5.42 3.58 7.17 2695 20 100.00 55.00 5.96 2.29 2.21 2696 72 100.00 19.44 8.83 11.31 1.22 2699 17 100.00 47.06 6.61 20.15 17.81 2711 15 100.00 86.67 5.63 7.65 6.03 2712 85 100.00 96.47 5.64 10.73 5.47 2713 5 100.00 100.00 3.80 15.57 4.54 2714 20 100.00 95.00 5.69 33.84 6.53 2715 35 100.00 94.29 8.20 1.93 3.20 2716 4 100.00 100.00 4.50 3.98 13.94 2719 48 100.00 60.42 9.53 16.05 20.57 2720 9 100.00 77.78 13.74 1.56 1.50 2731 30 100.00 96.67 8.65 14.96 11.81 2811 21 100.00 52.38 4.78 17.65 2.04 2812 4 100.00 100.00 6.02 15.89 10.28 2892 4 100.00 100.00 5.17 1.87 10.28 2893 10 100.00 30.00 6.94 7.59 7.59 2899 7 100.00 28.57 3.94 7.56 5.88 2912 5 100.00 80.00 3.85 11.54 0.96 2915 3 100.00 100.00 5.08 9.72 18.06 2919 19 100.00 68.42 4.64 7.50 5.51 2921 6 100.00 50.00 9.09 5.13 5.13 2929 3 100.00 66.67 2.39 2.06 3.09 3110 18 100.00 66.67 5.74 7.39 10.43 3120 5 100.00 60.00 14.11 9.09 13.64 3130 11 100.00 45.45 7.19 4.35 4.35 3430 4 100.00 75.00 6.36 21.05 2.63 3610 16 100.00 75.00 7.93 11.82 8.65 4000 59 100.00 44.07 4.22 7.10 6.03 19 Chhattisgarh 1496 99.33 46.72 5.83 9.74 6.15 1514 21 100.00 38.10 3.17 10.22 3.83 1531 527 98.29 33.59 3.57 17.25 14.03 1532 5 100.00 60.00 3.00 0.83 5.99 1533 9 100.00 22.22 5.04 1.68 4.20 1541 17 100.00 58.82 3.12 4.71 10.98 1549 11 100.00 54.55 5.63 39.13 14.78
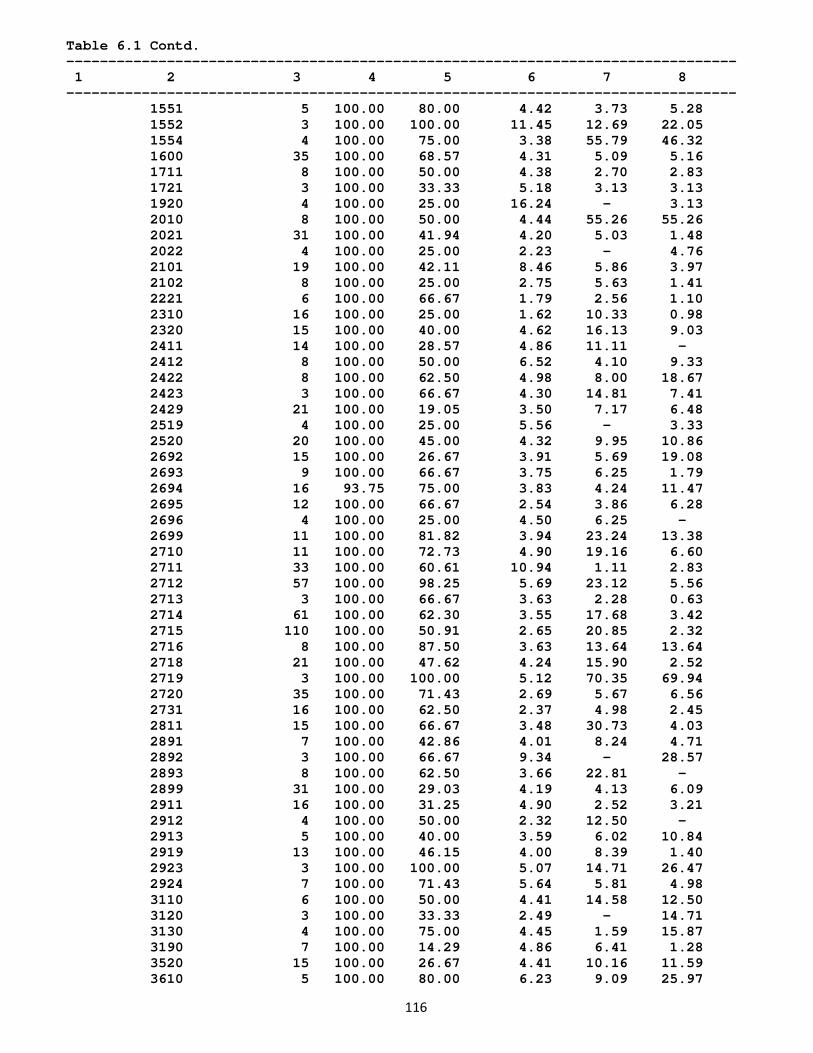
116
Table 6.1 Contd. -------------------------------------------------------------------------------- 1 2 3 4 5 6 7 8 -------------------------------------------------------------------------------- 1551 5 100.00 80.00 4.42 3.73 5.28 1552 3 100.00 100.00 11.45 12.69 22.05 1554 4 100.00 75.00 3.38 55.79 46.32 1600 35 100.00 68.57 4.31 5.09 5.16 1711 8 100.00 50.00 4.38 2.70 2.83 1721 3 100.00 33.33 5.18 3.13 3.13 1920 4 100.00 25.00 16.24 - 3.13 2010 8 100.00 50.00 4.44 55.26 55.26 2021 31 100.00 41.94 4.20 5.03 1.48 2022 4 100.00 25.00 2.23 - 4.76 2101 19 100.00 42.11 8.46 5.86 3.97 2102 8 100.00 25.00 2.75 5.63 1.41 2221 6 100.00 66.67 1.79 2.56 1.10 2310 16 100.00 25.00 1.62 10.33 0.98 2320 15 100.00 40.00 4.62 16.13 9.03 2411 14 100.00 28.57 4.86 11.11 - 2412 8 100.00 50.00 6.52 4.10 9.33 2422 8 100.00 62.50 4.98 8.00 18.67 2423 3 100.00 66.67 4.30 14.81 7.41 2429 21 100.00 19.05 3.50 7.17 6.48 2519 4 100.00 25.00 5.56 - 3.33 2520 20 100.00 45.00 4.32 9.95 10.86 2692 15 100.00 26.67 3.91 5.69 19.08 2693 9 100.00 66.67 3.75 6.25 1.79 2694 16 93.75 75.00 3.83 4.24 11.47 2695 12 100.00 66.67 2.54 3.86 6.28 2696 4 100.00 25.00 4.50 6.25 - 2699 11 100.00 81.82 3.94 23.24 13.38 2710 11 100.00 72.73 4.90 19.16 6.60 2711 33 100.00 60.61 10.94 1.11 2.83 2712 57 100.00 98.25 5.69 23.12 5.56 2713 3 100.00 66.67 3.63 2.28 0.63 2714 61 100.00 62.30 3.55 17.68 3.42 2715 110 100.00 50.91 2.65 20.85 2.32 2716 8 100.00 87.50 3.63 13.64 13.64 2718 21 100.00 47.62 4.24 15.90 2.52 2719 3 100.00 100.00 5.12 70.35 69.94 2720 35 100.00 71.43 2.69 5.67 6.56 2731 16 100.00 62.50 2.37 4.98 2.45 2811 15 100.00 66.67 3.48 30.73 4.03 2891 7 100.00 42.86 4.01 8.24 4.71 2892 3 100.00 66.67 9.34 - 28.57 2893 8 100.00 62.50 3.66 22.81 - 2899 31 100.00 29.03 4.19 4.13 6.09 2911 16 100.00 31.25 4.90 2.52 3.21 2912 4 100.00 50.00 2.32 12.50 - 2913 5 100.00 40.00 3.59 6.02 10.84 2919 13 100.00 46.15 4.00 8.39 1.40 2923 3 100.00 100.00 5.07 14.71 26.47 2924 7 100.00 71.43 5.64 5.81 4.98 3110 6 100.00 50.00 4.41 14.58 12.50 3120 3 100.00 33.33 2.49 - 14.71 3130 4 100.00 75.00 4.45 1.59 15.87 3190 7 100.00 14.29 4.86 6.41 1.28 3520 15 100.00 26.67 4.41 10.16 11.59 3610 5 100.00 80.00 6.23 9.09 25.97
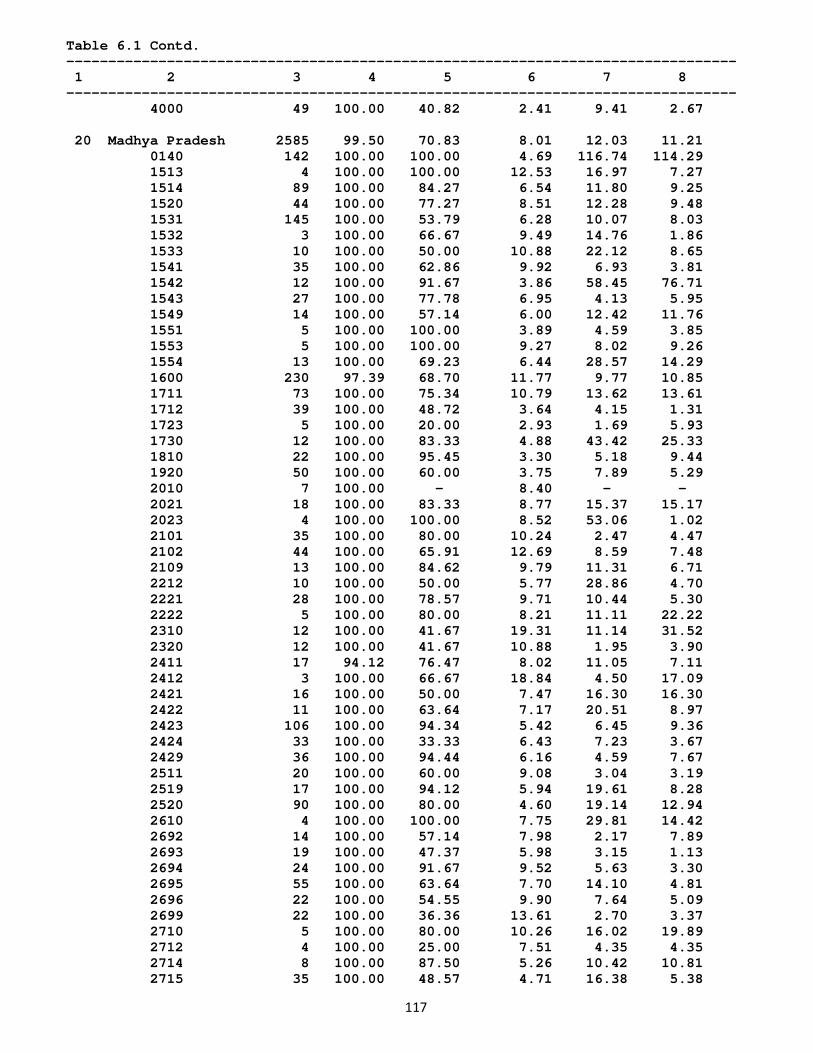
117
Table 6.1 Contd. -------------------------------------------------------------------------------- 1 2 3 4 5 6 7 8 -------------------------------------------------------------------------------- 4000 49 100.00 40.82 2.41 9.41 2.67 20 Madhya Pradesh 2585 99.50 70.83 8.01 12.03 11.21 0140 142 100.00 100.00 4.69 116.74 114.29 1513 4 100.00 100.00 12.53 16.97 7.27 1514 89 100.00 84.27 6.54 11.80 9.25 1520 44 100.00 77.27 8.51 12.28 9.48 1531 145 100.00 53.79 6.28 10.07 8.03 1532 3 100.00 66.67 9.49 14.76 1.86 1533 10 100.00 50.00 10.88 22.12 8.65 1541 35 100.00 62.86 9.92 6.93 3.81 1542 12 100.00 91.67 3.86 58.45 76.71 1543 27 100.00 77.78 6.95 4.13 5.95 1549 14 100.00 57.14 6.00 12.42 11.76 1551 5 100.00 100.00 3.89 4.59 3.85 1553 5 100.00 100.00 9.27 8.02 9.26 1554 13 100.00 69.23 6.44 28.57 14.29 1600 230 97.39 68.70 11.77 9.77 10.85 1711 73 100.00 75.34 10.79 13.62 13.61 1712 39 100.00 48.72 3.64 4.15 1.31 1723 5 100.00 20.00 2.93 1.69 5.93 1730 12 100.00 83.33 4.88 43.42 25.33 1810 22 100.00 95.45 3.30 5.18 9.44 1920 50 100.00 60.00 3.75 7.89 5.29 2010 7 100.00 - 8.40 - - 2021 18 100.00 83.33 8.77 15.37 15.17 2023 4 100.00 100.00 8.52 53.06 1.02 2101 35 100.00 80.00 10.24 2.47 4.47 2102 44 100.00 65.91 12.69 8.59 7.48 2109 13 100.00 84.62 9.79 11.31 6.71 2212 10 100.00 50.00 5.77 28.86 4.70 2221 28 100.00 78.57 9.71 10.44 5.30 2222 5 100.00 80.00 8.21 11.11 22.22 2310 12 100.00 41.67 19.31 11.14 31.52 2320 12 100.00 41.67 10.88 1.95 3.90 2411 17 94.12 76.47 8.02 11.05 7.11 2412 3 100.00 66.67 18.84 4.50 17.09 2421 16 100.00 50.00 7.47 16.30 16.30 2422 11 100.00 63.64 7.17 20.51 8.97 2423 106 100.00 94.34 5.42 6.45 9.36 2424 33 100.00 33.33 6.43 7.23 3.67 2429 36 100.00 94.44 6.16 4.59 7.67 2511 20 100.00 60.00 9.08 3.04 3.19 2519 17 100.00 94.12 5.94 19.61 8.28 2520 90 100.00 80.00 4.60 19.14 12.94 2610 4 100.00 100.00 7.75 29.81 14.42 2692 14 100.00 57.14 7.98 2.17 7.89 2693 19 100.00 47.37 5.98 3.15 1.13 2694 24 100.00 91.67 9.52 5.63 3.30 2695 55 100.00 63.64 7.70 14.10 4.81 2696 22 100.00 54.55 9.90 7.64 5.09 2699 22 100.00 36.36 13.61 2.70 3.37 2710 5 100.00 80.00 10.26 16.02 19.89 2712 4 100.00 25.00 7.51 4.35 4.35 2714 8 100.00 87.50 5.26 10.42 10.81 2715 35 100.00 48.57 4.71 16.38 5.38
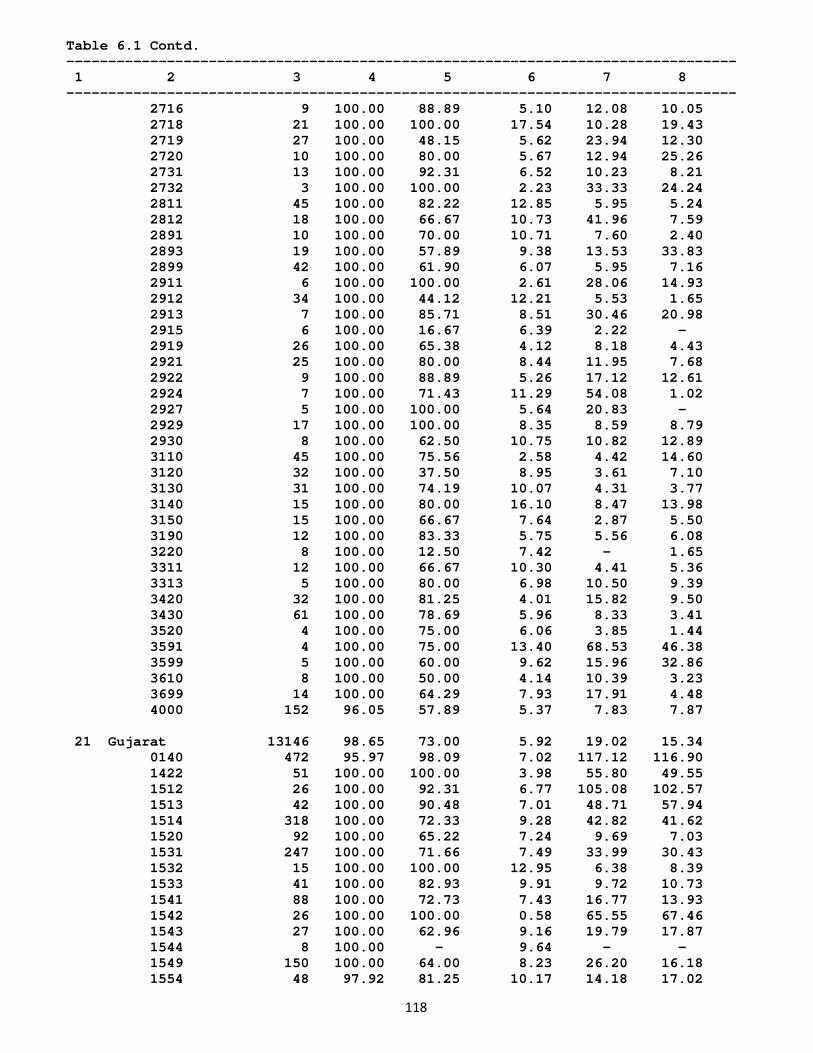
118
Table 6.1 Contd. -------------------------------------------------------------------------------- 1 2 3 4 5 6 7 8 -------------------------------------------------------------------------------- 2716 9 100.00 88.89 5.10 12.08 10.05 2718 21 100.00 100.00 17.54 10.28 19.43 2719 27 100.00 48.15 5.62 23.94 12.30 2720 10 100.00 80.00 5.67 12.94 25.26 2731 13 100.00 92.31 6.52 10.23 8.21 2732 3 100.00 100.00 2.23 33.33 24.24 2811 45 100.00 82.22 12.85 5.95 5.24 2812 18 100.00 66.67 10.73 41.96 7.59 2891 10 100.00 70.00 10.71 7.60 2.40 2893 19 100.00 57.89 9.38 13.53 33.83 2899 42 100.00 61.90 6.07 5.95 7.16 2911 6 100.00 100.00 2.61 28.06 14.93 2912 34 100.00 44.12 12.21 5.53 1.65 2913 7 100.00 85.71 8.51 30.46 20.98 2915 6 100.00 16.67 6.39 2.22 - 2919 26 100.00 65.38 4.12 8.18 4.43 2921 25 100.00 80.00 8.44 11.95 7.68 2922 9 100.00 88.89 5.26 17.12 12.61 2924 7 100.00 71.43 11.29 54.08 1.02 2927 5 100.00 100.00 5.64 20.83 - 2929 17 100.00 100.00 8.35 8.59 8.79 2930 8 100.00 62.50 10.75 10.82 12.89 3110 45 100.00 75.56 2.58 4.42 14.60 3120 32 100.00 37.50 8.95 3.61 7.10 3130 31 100.00 74.19 10.07 4.31 3.77 3140 15 100.00 80.00 16.10 8.47 13.98 3150 15 100.00 66.67 7.64 2.87 5.50 3190 12 100.00 83.33 5.75 5.56 6.08 3220 8 100.00 12.50 7.42 - 1.65 3311 12 100.00 66.67 10.30 4.41 5.36 3313 5 100.00 80.00 6.98 10.50 9.39 3420 32 100.00 81.25 4.01 15.82 9.50 3430 61 100.00 78.69 5.96 8.33 3.41 3520 4 100.00 75.00 6.06 3.85 1.44 3591 4 100.00 75.00 13.40 68.53 46.38 3599 5 100.00 60.00 9.62 15.96 32.86 3610 8 100.00 50.00 4.14 10.39 3.23 3699 14 100.00 64.29 7.93 17.91 4.48 4000 152 96.05 57.89 5.37 7.83 7.87 21 Gujarat 13146 98.65 73.00 5.92 19.02 15.34 0140 472 95.97 98.09 7.02 117.12 116.90 1422 51 100.00 100.00 3.98 55.80 49.55 1512 26 100.00 92.31 6.77 105.08 102.57 1513 42 100.00 90.48 7.01 48.71 57.94 1514 318 100.00 72.33 9.28 42.82 41.62 1520 92 100.00 65.22 7.24 9.69 7.03 1531 247 100.00 71.66 7.49 33.99 30.43 1532 15 100.00 100.00 12.95 6.38 8.39 1533 41 100.00 82.93 9.91 9.72 10.73 1541 88 100.00 72.73 7.43 16.77 13.93 1542 26 100.00 100.00 0.58 65.55 67.46 1543 27 100.00 62.96 9.16 19.79 17.87 1544 8 100.00 - 9.64 - - 1549 150 100.00 64.00 8.23 26.20 16.18 1554 48 97.92 81.25 10.17 14.18 17.02
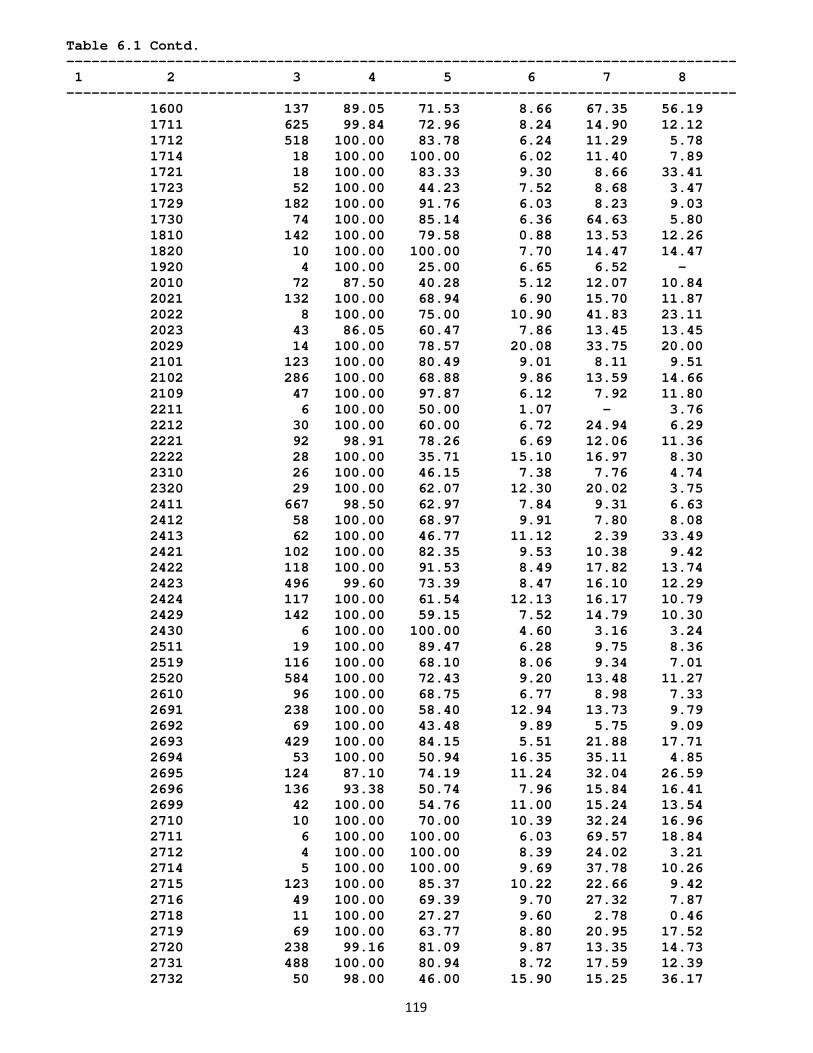
119
Table 6.1 Contd. -------------------------------------------------------------------------------- 1 2 3 4 5 6 7 8 -------------------------------------------------------------------------------- 1600 137 89.05 71.53 8.66 67.35 56.19 1711 625 99.84 72.96 8.24 14.90 12.12 1712 518 100.00 83.78 6.24 11.29 5.78 1714 18 100.00 100.00 6.02 11.40 7.89 1721 18 100.00 83.33 9.30 8.66 33.41 1723 52 100.00 44.23 7.52 8.68 3.47 1729 182 100.00 91.76 6.03 8.23 9.03 1730 74 100.00 85.14 6.36 64.63 5.80 1810 142 100.00 79.58 0.88 13.53 12.26 1820 10 100.00 100.00 7.70 14.47 14.47 1920 4 100.00 25.00 6.65 6.52 - 2010 72 87.50 40.28 5.12 12.07 10.84 2021 132 100.00 68.94 6.90 15.70 11.87 2022 8 100.00 75.00 10.90 41.83 23.11 2023 43 86.05 60.47 7.86 13.45 13.45 2029 14 100.00 78.57 20.08 33.75 20.00 2101 123 100.00 80.49 9.01 8.11 9.51 2102 286 100.00 68.88 9.86 13.59 14.66 2109 47 100.00 97.87 6.12 7.92 11.80 2211 6 100.00 50.00 1.07 - 3.76 2212 30 100.00 60.00 6.72 24.94 6.29 2221 92 98.91 78.26 6.69 12.06 11.36 2222 28 100.00 35.71 15.10 16.97 8.30 2310 26 100.00 46.15 7.38 7.76 4.74 2320 29 100.00 62.07 12.30 20.02 3.75 2411 667 98.50 62.97 7.84 9.31 6.63 2412 58 100.00 68.97 9.91 7.80 8.08 2413 62 100.00 46.77 11.12 2.39 33.49 2421 102 100.00 82.35 9.53 10.38 9.42 2422 118 100.00 91.53 8.49 17.82 13.74 2423 496 99.60 73.39 8.47 16.10 12.29 2424 117 100.00 61.54 12.13 16.17 10.79 2429 142 100.00 59.15 7.52 14.79 10.30 2430 6 100.00 100.00 4.60 3.16 3.24 2511 19 100.00 89.47 6.28 9.75 8.36 2519 116 100.00 68.10 8.06 9.34 7.01 2520 584 100.00 72.43 9.20 13.48 11.27 2610 96 100.00 68.75 6.77 8.98 7.33 2691 238 100.00 58.40 12.94 13.73 9.79 2692 69 100.00 43.48 9.89 5.75 9.09 2693 429 100.00 84.15 5.51 21.88 17.71 2694 53 100.00 50.94 16.35 35.11 4.85 2695 124 87.10 74.19 11.24 32.04 26.59 2696 136 93.38 50.74 7.96 15.84 16.41 2699 42 100.00 54.76 11.00 15.24 13.54 2710 10 100.00 70.00 10.39 32.24 16.96 2711 6 100.00 100.00 6.03 69.57 18.84 2712 4 100.00 100.00 8.39 24.02 3.21 2714 5 100.00 100.00 9.69 37.78 10.26 2715 123 100.00 85.37 10.22 22.66 9.42 2716 49 100.00 69.39 9.70 27.32 7.87 2718 11 100.00 27.27 9.60 2.78 0.46 2719 69 100.00 63.77 8.80 20.95 17.52 2720 238 99.16 81.09 9.87 13.35 14.73 2731 488 100.00 80.94 8.72 17.59 12.39 2732 50 98.00 46.00 15.90 15.25 36.17
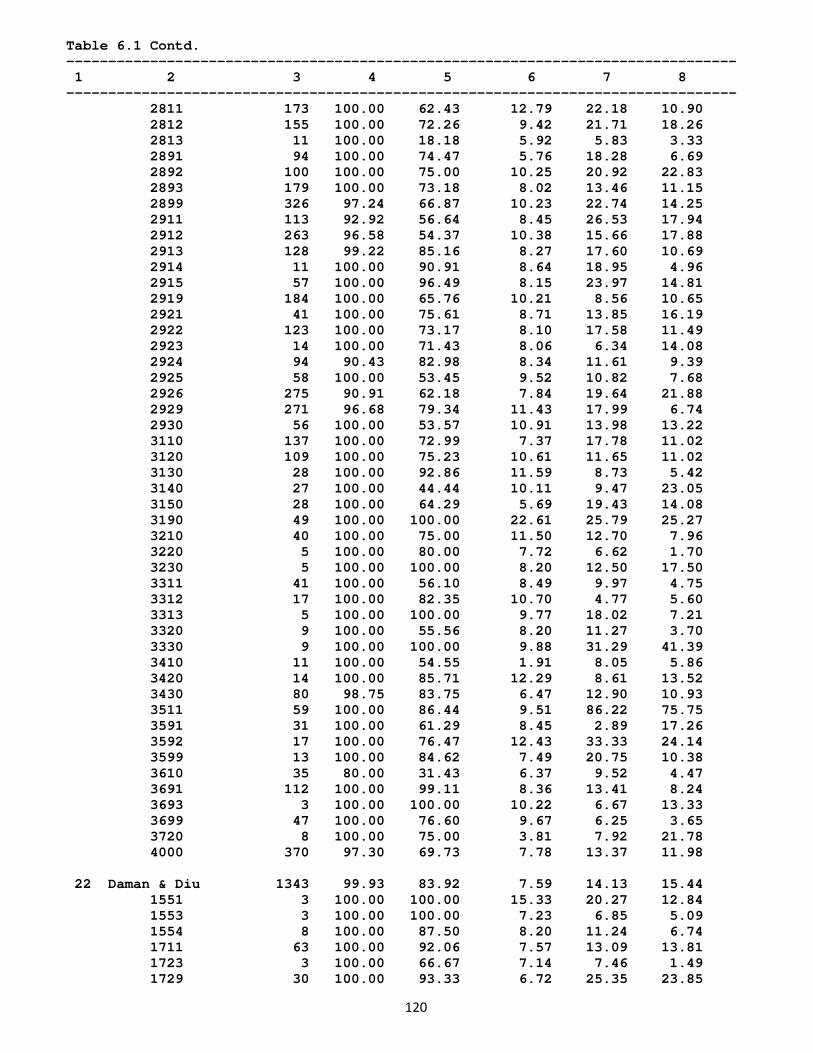
120
Table 6.1 Contd. -------------------------------------------------------------------------------- 1 2 3 4 5 6 7 8 -------------------------------------------------------------------------------- 2811 173 100.00 62.43 12.79 22.18 10.90 2812 155 100.00 72.26 9.42 21.71 18.26 2813 11 100.00 18.18 5.92 5.83 3.33 2891 94 100.00 74.47 5.76 18.28 6.69 2892 100 100.00 75.00 10.25 20.92 22.83 2893 179 100.00 73.18 8.02 13.46 11.15 2899 326 97.24 66.87 10.23 22.74 14.25 2911 113 92.92 56.64 8.45 26.53 17.94 2912 263 96.58 54.37 10.38 15.66 17.88 2913 128 99.22 85.16 8.27 17.60 10.69 2914 11 100.00 90.91 8.64 18.95 4.96 2915 57 100.00 96.49 8.15 23.97 14.81 2919 184 100.00 65.76 10.21 8.56 10.65 2921 41 100.00 75.61 8.71 13.85 16.19 2922 123 100.00 73.17 8.10 17.58 11.49 2923 14 100.00 71.43 8.06 6.34 14.08 2924 94 90.43 82.98 8.34 11.61 9.39 2925 58 100.00 53.45 9.52 10.82 7.68 2926 275 90.91 62.18 7.84 19.64 21.88 2929 271 96.68 79.34 11.43 17.99 6.74 2930 56 100.00 53.57 10.91 13.98 13.22 3110 137 100.00 72.99 7.37 17.78 11.02 3120 109 100.00 75.23 10.61 11.65 11.02 3130 28 100.00 92.86 11.59 8.73 5.42 3140 27 100.00 44.44 10.11 9.47 23.05 3150 28 100.00 64.29 5.69 19.43 14.08 3190 49 100.00 100.00 22.61 25.79 25.27 3210 40 100.00 75.00 11.50 12.70 7.96 3220 5 100.00 80.00 7.72 6.62 1.70 3230 5 100.00 100.00 8.20 12.50 17.50 3311 41 100.00 56.10 8.49 9.97 4.75 3312 17 100.00 82.35 10.70 4.77 5.60 3313 5 100.00 100.00 9.77 18.02 7.21 3320 9 100.00 55.56 8.20 11.27 3.70 3330 9 100.00 100.00 9.88 31.29 41.39 3410 11 100.00 54.55 1.91 8.05 5.86 3420 14 100.00 85.71 12.29 8.61 13.52 3430 80 98.75 83.75 6.47 12.90 10.93 3511 59 100.00 86.44 9.51 86.22 75.75 3591 31 100.00 61.29 8.45 2.89 17.26 3592 17 100.00 76.47 12.43 33.33 24.14 3599 13 100.00 84.62 7.49 20.75 10.38 3610 35 80.00 31.43 6.37 9.52 4.47 3691 112 100.00 99.11 8.36 13.41 8.24 3693 3 100.00 100.00 10.22 6.67 13.33 3699 47 100.00 76.60 9.67 6.25 3.65 3720 8 100.00 75.00 3.81 7.92 21.78 4000 370 97.30 69.73 7.78 13.37 11.98 22 Daman & Diu 1343 99.93 83.92 7.59 14.13 15.44 1551 3 100.00 100.00 15.33 20.27 12.84 1553 3 100.00 100.00 7.23 6.85 5.09 1554 8 100.00 87.50 8.20 11.24 6.74 1711 63 100.00 92.06 7.57 13.09 13.81 1723 3 100.00 66.67 7.14 7.46 1.49 1729 30 100.00 93.33 6.72 25.35 23.85
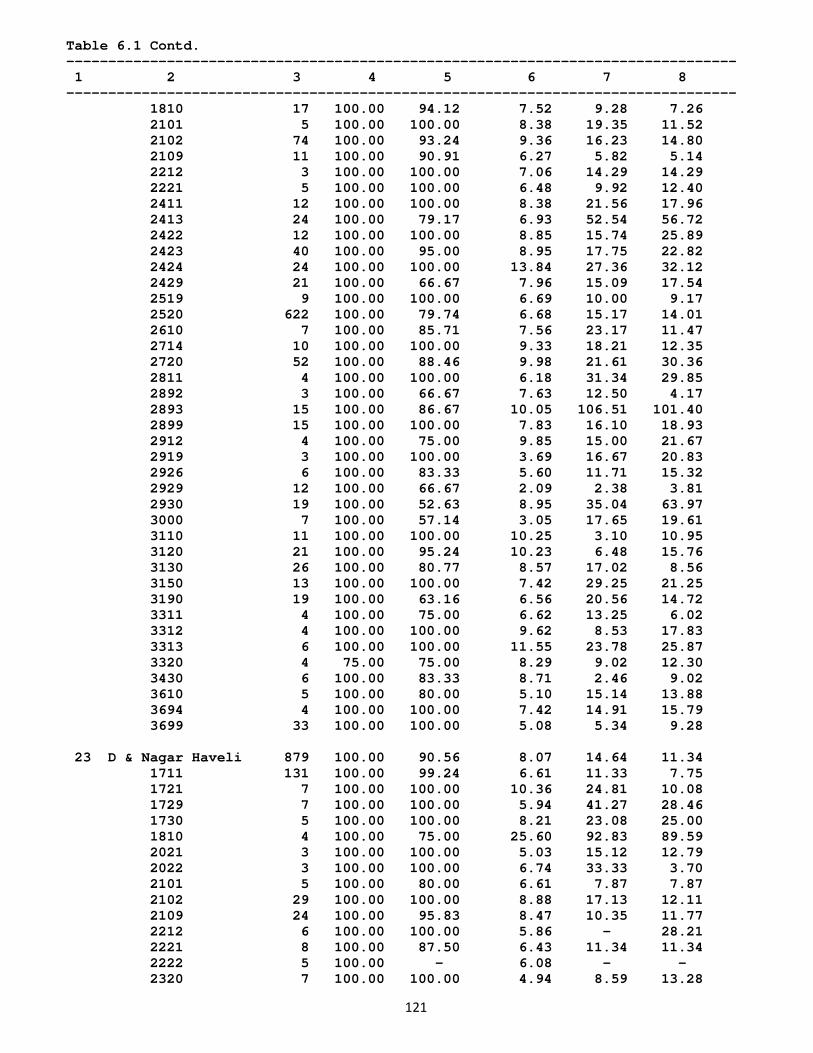
121
Table 6.1 Contd. -------------------------------------------------------------------------------- 1 2 3 4 5 6 7 8 -------------------------------------------------------------------------------- 1810 17 100.00 94.12 7.52 9.28 7.26 2101 5 100.00 100.00 8.38 19.35 11.52 2102 74 100.00 93.24 9.36 16.23 14.80 2109 11 100.00 90.91 6.27 5.82 5.14 2212 3 100.00 100.00 7.06 14.29 14.29 2221 5 100.00 100.00 6.48 9.92 12.40 2411 12 100.00 100.00 8.38 21.56 17.96 2413 24 100.00 79.17 6.93 52.54 56.72 2422 12 100.00 100.00 8.85 15.74 25.89 2423 40 100.00 95.00 8.95 17.75 22.82 2424 24 100.00 100.00 13.84 27.36 32.12 2429 21 100.00 66.67 7.96 15.09 17.54 2519 9 100.00 100.00 6.69 10.00 9.17 2520 622 100.00 79.74 6.68 15.17 14.01 2610 7 100.00 85.71 7.56 23.17 11.47 2714 10 100.00 100.00 9.33 18.21 12.35 2720 52 100.00 88.46 9.98 21.61 30.36 2811 4 100.00 100.00 6.18 31.34 29.85 2892 3 100.00 66.67 7.63 12.50 4.17 2893 15 100.00 86.67 10.05 106.51 101.40 2899 15 100.00 100.00 7.83 16.10 18.93 2912 4 100.00 75.00 9.85 15.00 21.67 2919 3 100.00 100.00 3.69 16.67 20.83 2926 6 100.00 83.33 5.60 11.71 15.32 2929 12 100.00 66.67 2.09 2.38 3.81 2930 19 100.00 52.63 8.95 35.04 63.97 3000 7 100.00 57.14 3.05 17.65 19.61 3110 11 100.00 100.00 10.25 3.10 10.95 3120 21 100.00 95.24 10.23 6.48 15.76 3130 26 100.00 80.77 8.57 17.02 8.56 3150 13 100.00 100.00 7.42 29.25 21.25 3190 19 100.00 63.16 6.56 20.56 14.72 3311 4 100.00 75.00 6.62 13.25 6.02 3312 4 100.00 100.00 9.62 8.53 17.83 3313 6 100.00 100.00 11.55 23.78 25.87 3320 4 75.00 75.00 8.29 9.02 12.30 3430 6 100.00 83.33 8.71 2.46 9.02 3610 5 100.00 80.00 5.10 15.14 13.88 3694 4 100.00 100.00 7.42 14.91 15.79 3699 33 100.00 100.00 5.08 5.34 9.28 23 D & Nagar Haveli 879 100.00 90.56 8.07 14.64 11.34 1711 131 100.00 99.24 6.61 11.33 7.75 1721 7 100.00 100.00 10.36 24.81 10.08 1729 7 100.00 100.00 5.94 41.27 28.46 1730 5 100.00 100.00 8.21 23.08 25.00 1810 4 100.00 75.00 25.60 92.83 89.59 2021 3 100.00 100.00 5.03 15.12 12.79 2022 3 100.00 100.00 6.74 33.33 3.70 2101 5 100.00 80.00 6.61 7.87 7.87 2102 29 100.00 100.00 8.88 17.13 12.11 2109 24 100.00 95.83 8.47 10.35 11.77 2212 6 100.00 100.00 5.86 - 28.21 2221 8 100.00 87.50 6.43 11.34 11.34 2222 5 100.00 - 6.08 - - 2320 7 100.00 100.00 4.94 8.59 13.28
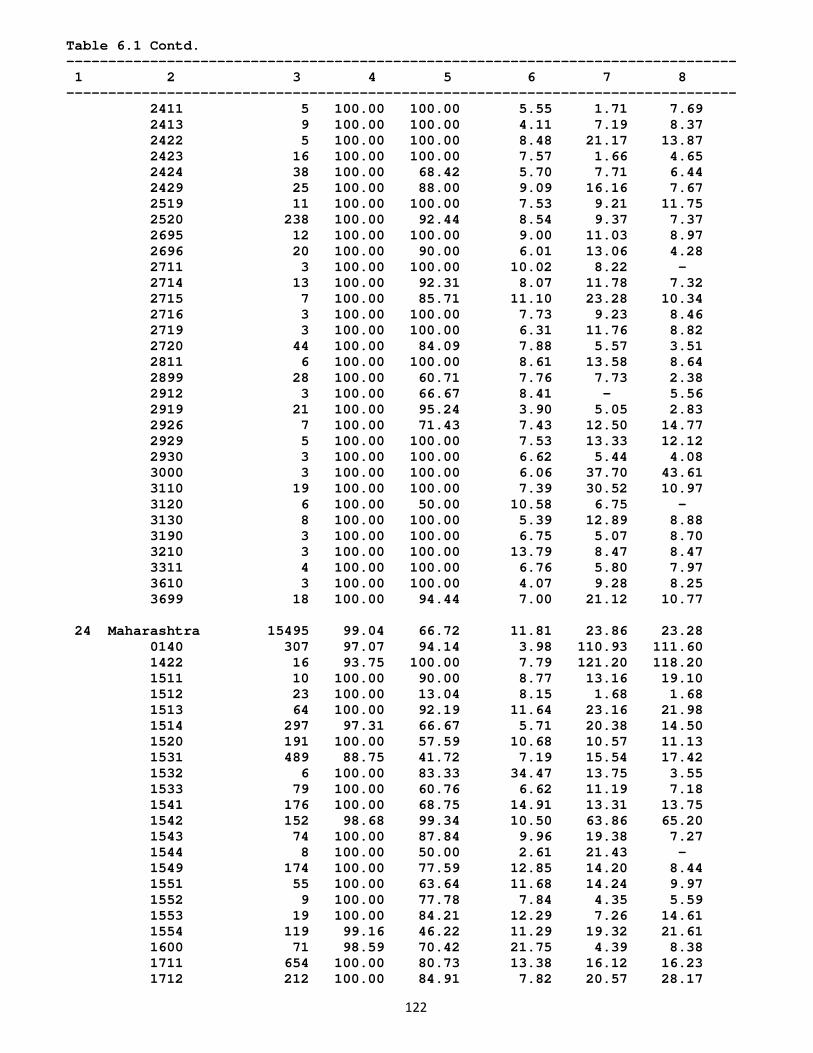
122
Table 6.1 Contd. -------------------------------------------------------------------------------- 1 2 3 4 5 6 7 8 -------------------------------------------------------------------------------- 2411 5 100.00 100.00 5.55 1.71 7.69 2413 9 100.00 100.00 4.11 7.19 8.37 2422 5 100.00 100.00 8.48 21.17 13.87 2423 16 100.00 100.00 7.57 1.66 4.65 2424 38 100.00 68.42 5.70 7.71 6.44 2429 25 100.00 88.00 9.09 16.16 7.67 2519 11 100.00 100.00 7.53 9.21 11.75 2520 238 100.00 92.44 8.54 9.37 7.37 2695 12 100.00 100.00 9.00 11.03 8.97 2696 20 100.00 90.00 6.01 13.06 4.28 2711 3 100.00 100.00 10.02 8.22 - 2714 13 100.00 92.31 8.07 11.78 7.32 2715 7 100.00 85.71 11.10 23.28 10.34 2716 3 100.00 100.00 7.73 9.23 8.46 2719 3 100.00 100.00 6.31 11.76 8.82 2720 44 100.00 84.09 7.88 5.57 3.51 2811 6 100.00 100.00 8.61 13.58 8.64 2899 28 100.00 60.71 7.76 7.73 2.38 2912 3 100.00 66.67 8.41 - 5.56 2919 21 100.00 95.24 3.90 5.05 2.83 2926 7 100.00 71.43 7.43 12.50 14.77 2929 5 100.00 100.00 7.53 13.33 12.12 2930 3 100.00 100.00 6.62 5.44 4.08 3000 3 100.00 100.00 6.06 37.70 43.61 3110 19 100.00 100.00 7.39 30.52 10.97 3120 6 100.00 50.00 10.58 6.75 - 3130 8 100.00 100.00 5.39 12.89 8.88 3190 3 100.00 100.00 6.75 5.07 8.70 3210 3 100.00 100.00 13.79 8.47 8.47 3311 4 100.00 100.00 6.76 5.80 7.97 3610 3 100.00 100.00 4.07 9.28 8.25 3699 18 100.00 94.44 7.00 21.12 10.77 24 Maharashtra 15495 99.04 66.72 11.81 23.86 23.28 0140 307 97.07 94.14 3.98 110.93 111.60 1422 16 93.75 100.00 7.79 121.20 118.20 1511 10 100.00 90.00 8.77 13.16 19.10 1512 23 100.00 13.04 8.15 1.68 1.68 1513 64 100.00 92.19 11.64 23.16 21.98 1514 297 97.31 66.67 5.71 20.38 14.50 1520 191 100.00 57.59 10.68 10.57 11.13 1531 489 88.75 41.72 7.19 15.54 17.42 1532 6 100.00 83.33 34.47 13.75 3.55 1533 79 100.00 60.76 6.62 11.19 7.18 1541 176 100.00 68.75 14.91 13.31 13.75 1542 152 98.68 99.34 10.50 63.86 65.20 1543 74 100.00 87.84 9.96 19.38 7.27 1544 8 100.00 50.00 2.61 21.43 - 1549 174 100.00 77.59 12.85 14.20 8.44 1551 55 100.00 63.64 11.68 14.24 9.97 1552 9 100.00 77.78 7.84 4.35 5.59 1553 19 100.00 84.21 12.29 7.26 14.61 1554 119 99.16 46.22 11.29 19.32 21.61 1600 71 98.59 70.42 21.75 4.39 8.38 1711 654 100.00 80.73 13.38 16.12 16.23 1712 212 100.00 84.91 7.82 20.57 28.17
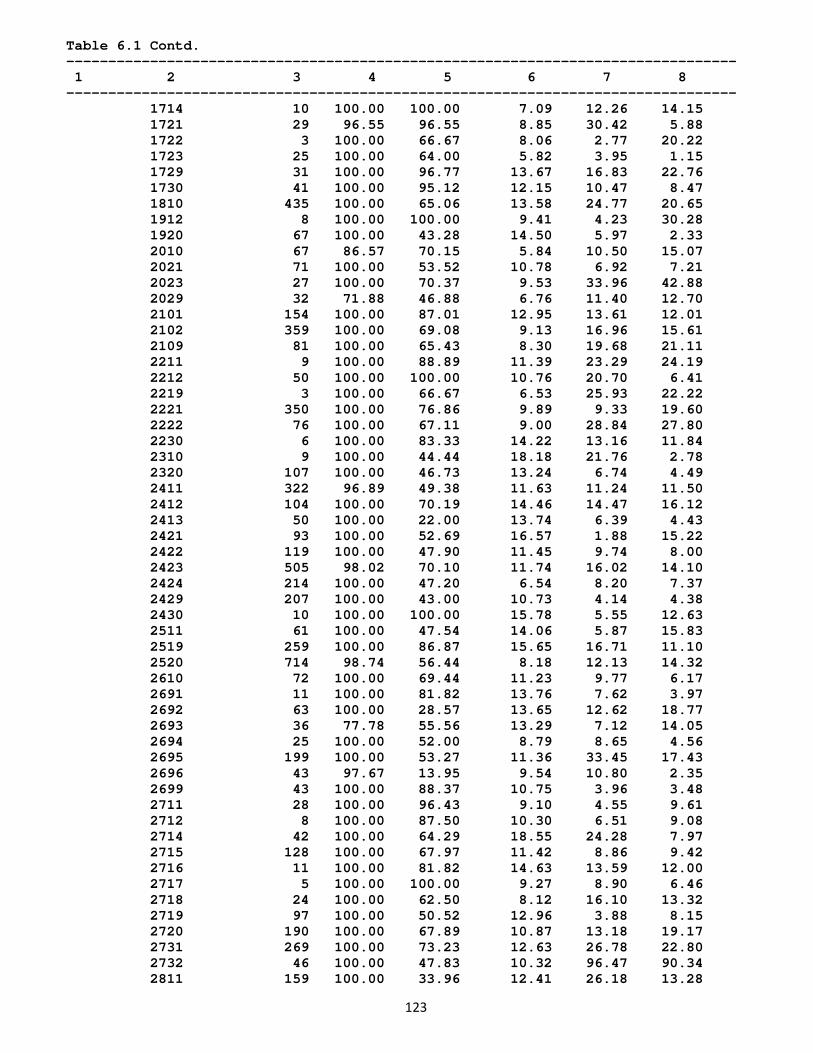
123
Table 6.1 Contd. -------------------------------------------------------------------------------- 1 2 3 4 5 6 7 8 -------------------------------------------------------------------------------- 1714 10 100.00 100.00 7.09 12.26 14.15 1721 29 96.55 96.55 8.85 30.42 5.88 1722 3 100.00 66.67 8.06 2.77 20.22 1723 25 100.00 64.00 5.82 3.95 1.15 1729 31 100.00 96.77 13.67 16.83 22.76 1730 41 100.00 95.12 12.15 10.47 8.47 1810 435 100.00 65.06 13.58 24.77 20.65 1912 8 100.00 100.00 9.41 4.23 30.28 1920 67 100.00 43.28 14.50 5.97 2.33 2010 67 86.57 70.15 5.84 10.50 15.07 2021 71 100.00 53.52 10.78 6.92 7.21 2023 27 100.00 70.37 9.53 33.96 42.88 2029 32 71.88 46.88 6.76 11.40 12.70 2101 154 100.00 87.01 12.95 13.61 12.01 2102 359 100.00 69.08 9.13 16.96 15.61 2109 81 100.00 65.43 8.30 19.68 21.11 2211 9 100.00 88.89 11.39 23.29 24.19 2212 50 100.00 100.00 10.76 20.70 6.41 2219 3 100.00 66.67 6.53 25.93 22.22 2221 350 100.00 76.86 9.89 9.33 19.60 2222 76 100.00 67.11 9.00 28.84 27.80 2230 6 100.00 83.33 14.22 13.16 11.84 2310 9 100.00 44.44 18.18 21.76 2.78 2320 107 100.00 46.73 13.24 6.74 4.49 2411 322 96.89 49.38 11.63 11.24 11.50 2412 104 100.00 70.19 14.46 14.47 16.12 2413 50 100.00 22.00 13.74 6.39 4.43 2421 93 100.00 52.69 16.57 1.88 15.22 2422 119 100.00 47.90 11.45 9.74 8.00 2423 505 98.02 70.10 11.74 16.02 14.10 2424 214 100.00 47.20 6.54 8.20 7.37 2429 207 100.00 43.00 10.73 4.14 4.38 2430 10 100.00 100.00 15.78 5.55 12.63 2511 61 100.00 47.54 14.06 5.87 15.83 2519 259 100.00 86.87 15.65 16.71 11.10 2520 714 98.74 56.44 8.18 12.13 14.32 2610 72 100.00 69.44 11.23 9.77 6.17 2691 11 100.00 81.82 13.76 7.62 3.97 2692 63 100.00 28.57 13.65 12.62 18.77 2693 36 77.78 55.56 13.29 7.12 14.05 2694 25 100.00 52.00 8.79 8.65 4.56 2695 199 100.00 53.27 11.36 33.45 17.43 2696 43 97.67 13.95 9.54 10.80 2.35 2699 43 100.00 88.37 10.75 3.96 3.48 2711 28 100.00 96.43 9.10 4.55 9.61 2712 8 100.00 87.50 10.30 6.51 9.08 2714 42 100.00 64.29 18.55 24.28 7.97 2715 128 100.00 67.97 11.42 8.86 9.42 2716 11 100.00 81.82 14.63 13.59 12.00 2717 5 100.00 100.00 9.27 8.90 6.46 2718 24 100.00 62.50 8.12 16.10 13.32 2719 97 100.00 50.52 12.96 3.88 8.15 2720 190 100.00 67.89 10.87 13.18 19.17 2731 269 100.00 73.23 12.63 26.78 22.80 2732 46 100.00 47.83 10.32 96.47 90.34 2811 159 100.00 33.96 12.41 26.18 13.28
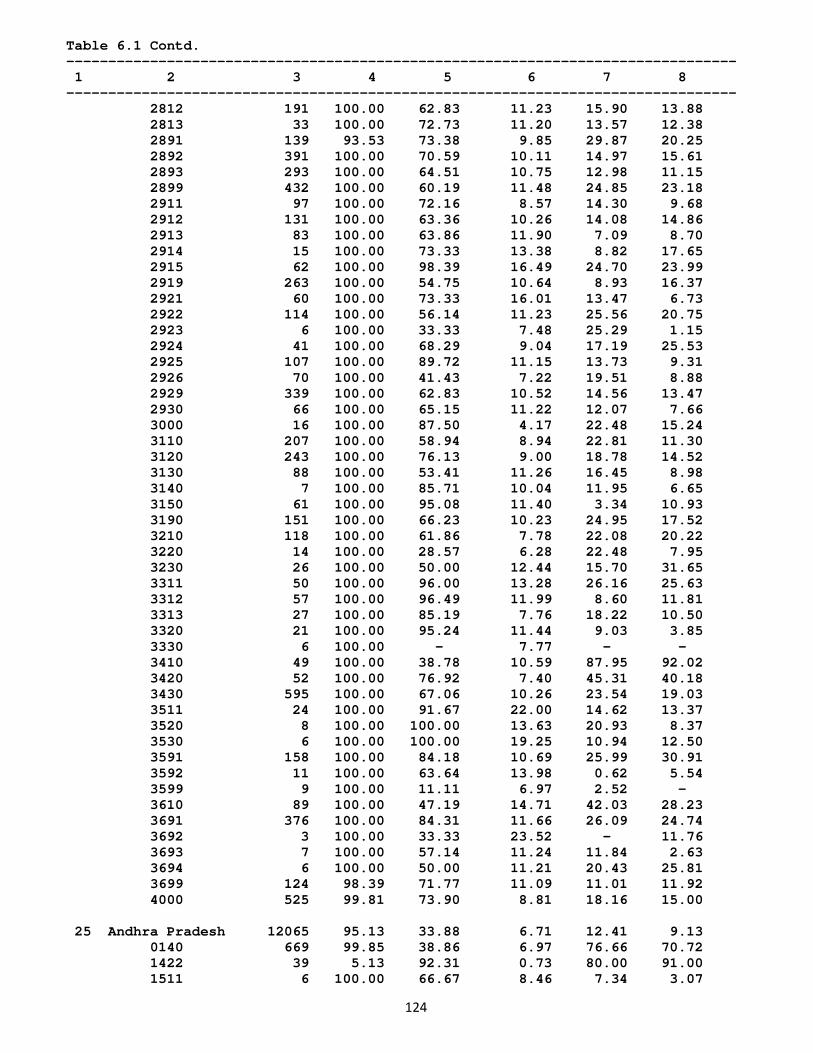
124
Table 6.1 Contd. -------------------------------------------------------------------------------- 1 2 3 4 5 6 7 8 -------------------------------------------------------------------------------- 2812 191 100.00 62.83 11.23 15.90 13.88 2813 33 100.00 72.73 11.20 13.57 12.38 2891 139 93.53 73.38 9.85 29.87 20.25 2892 391 100.00 70.59 10.11 14.97 15.61 2893 293 100.00 64.51 10.75 12.98 11.15 2899 432 100.00 60.19 11.48 24.85 23.18 2911 97 100.00 72.16 8.57 14.30 9.68 2912 131 100.00 63.36 10.26 14.08 14.86 2913 83 100.00 63.86 11.90 7.09 8.70 2914 15 100.00 73.33 13.38 8.82 17.65 2915 62 100.00 98.39 16.49 24.70 23.99 2919 263 100.00 54.75 10.64 8.93 16.37 2921 60 100.00 73.33 16.01 13.47 6.73 2922 114 100.00 56.14 11.23 25.56 20.75 2923 6 100.00 33.33 7.48 25.29 1.15 2924 41 100.00 68.29 9.04 17.19 25.53 2925 107 100.00 89.72 11.15 13.73 9.31 2926 70 100.00 41.43 7.22 19.51 8.88 2929 339 100.00 62.83 10.52 14.56 13.47 2930 66 100.00 65.15 11.22 12.07 7.66 3000 16 100.00 87.50 4.17 22.48 15.24 3110 207 100.00 58.94 8.94 22.81 11.30 3120 243 100.00 76.13 9.00 18.78 14.52 3130 88 100.00 53.41 11.26 16.45 8.98 3140 7 100.00 85.71 10.04 11.95 6.65 3150 61 100.00 95.08 11.40 3.34 10.93 3190 151 100.00 66.23 10.23 24.95 17.52 3210 118 100.00 61.86 7.78 22.08 20.22 3220 14 100.00 28.57 6.28 22.48 7.95 3230 26 100.00 50.00 12.44 15.70 31.65 3311 50 100.00 96.00 13.28 26.16 25.63 3312 57 100.00 96.49 11.99 8.60 11.81 3313 27 100.00 85.19 7.76 18.22 10.50 3320 21 100.00 95.24 11.44 9.03 3.85 3330 6 100.00 - 7.77 - - 3410 49 100.00 38.78 10.59 87.95 92.02 3420 52 100.00 76.92 7.40 45.31 40.18 3430 595 100.00 67.06 10.26 23.54 19.03 3511 24 100.00 91.67 22.00 14.62 13.37 3520 8 100.00 100.00 13.63 20.93 8.37 3530 6 100.00 100.00 19.25 10.94 12.50 3591 158 100.00 84.18 10.69 25.99 30.91 3592 11 100.00 63.64 13.98 0.62 5.54 3599 9 100.00 11.11 6.97 2.52 - 3610 89 100.00 47.19 14.71 42.03 28.23 3691 376 100.00 84.31 11.66 26.09 24.74 3692 3 100.00 33.33 23.52 - 11.76 3693 7 100.00 57.14 11.24 11.84 2.63 3694 6 100.00 50.00 11.21 20.43 25.81 3699 124 98.39 71.77 11.09 11.01 11.92 4000 525 99.81 73.90 8.81 18.16 15.00 25 Andhra Pradesh 12065 95.13 33.88 6.71 12.41 9.13 0140 669 99.85 38.86 6.97 76.66 70.72 1422 39 5.13 92.31 0.73 80.00 91.00 1511 6 100.00 66.67 8.46 7.34 3.07
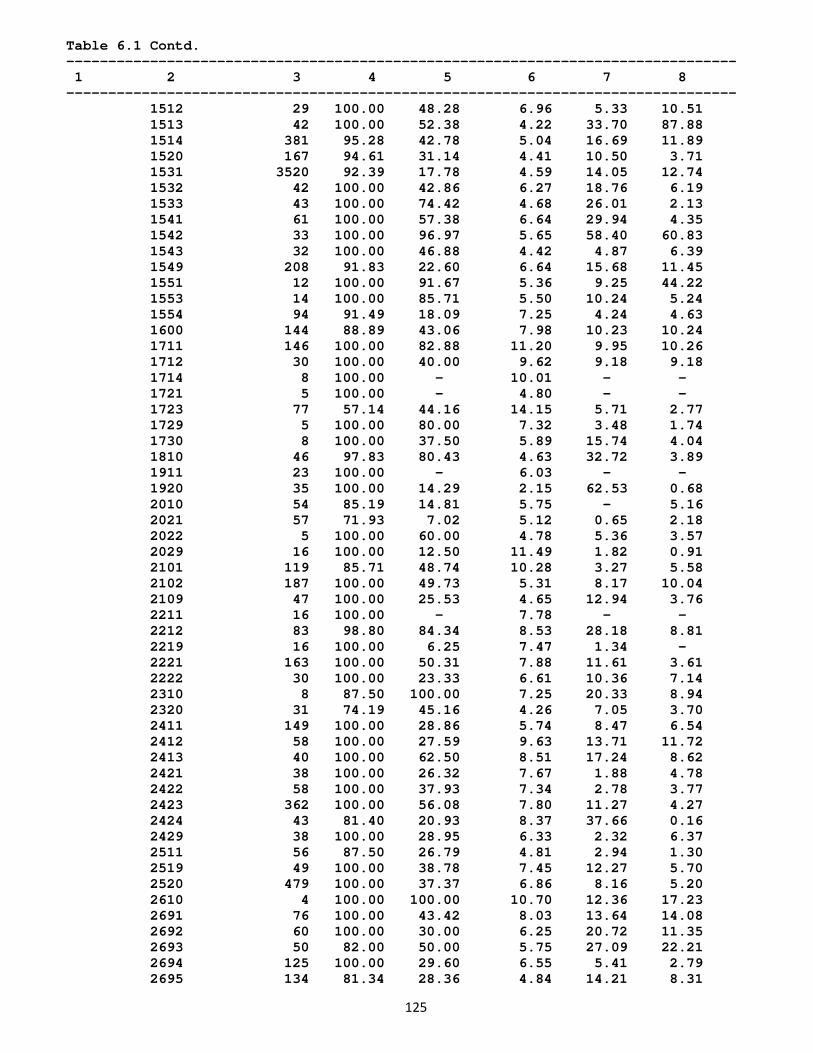
125
Table 6.1 Contd. -------------------------------------------------------------------------------- 1 2 3 4 5 6 7 8 -------------------------------------------------------------------------------- 1512 29 100.00 48.28 6.96 5.33 10.51 1513 42 100.00 52.38 4.22 33.70 87.88 1514 381 95.28 42.78 5.04 16.69 11.89 1520 167 94.61 31.14 4.41 10.50 3.71 1531 3520 92.39 17.78 4.59 14.05 12.74 1532 42 100.00 42.86 6.27 18.76 6.19 1533 43 100.00 74.42 4.68 26.01 2.13 1541 61 100.00 57.38 6.64 29.94 4.35 1542 33 100.00 96.97 5.65 58.40 60.83 1543 32 100.00 46.88 4.42 4.87 6.39 1549 208 91.83 22.60 6.64 15.68 11.45 1551 12 100.00 91.67 5.36 9.25 44.22 1553 14 100.00 85.71 5.50 10.24 5.24 1554 94 91.49 18.09 7.25 4.24 4.63 1600 144 88.89 43.06 7.98 10.23 10.24 1711 146 100.00 82.88 11.20 9.95 10.26 1712 30 100.00 40.00 9.62 9.18 9.18 1714 8 100.00 - 10.01 - - 1721 5 100.00 - 4.80 - - 1723 77 57.14 44.16 14.15 5.71 2.77 1729 5 100.00 80.00 7.32 3.48 1.74 1730 8 100.00 37.50 5.89 15.74 4.04 1810 46 97.83 80.43 4.63 32.72 3.89 1911 23 100.00 - 6.03 - - 1920 35 100.00 14.29 2.15 62.53 0.68 2010 54 85.19 14.81 5.75 - 5.16 2021 57 71.93 7.02 5.12 0.65 2.18 2022 5 100.00 60.00 4.78 5.36 3.57 2029 16 100.00 12.50 11.49 1.82 0.91 2101 119 85.71 48.74 10.28 3.27 5.58 2102 187 100.00 49.73 5.31 8.17 10.04 2109 47 100.00 25.53 4.65 12.94 3.76 2211 16 100.00 - 7.78 - - 2212 83 98.80 84.34 8.53 28.18 8.81 2219 16 100.00 6.25 7.47 1.34 - 2221 163 100.00 50.31 7.88 11.61 3.61 2222 30 100.00 23.33 6.61 10.36 7.14 2310 8 87.50 100.00 7.25 20.33 8.94 2320 31 74.19 45.16 4.26 7.05 3.70 2411 149 100.00 28.86 5.74 8.47 6.54 2412 58 100.00 27.59 9.63 13.71 11.72 2413 40 100.00 62.50 8.51 17.24 8.62 2421 38 100.00 26.32 7.67 1.88 4.78 2422 58 100.00 37.93 7.34 2.78 3.77 2423 362 100.00 56.08 7.80 11.27 4.27 2424 43 81.40 20.93 8.37 37.66 0.16 2429 38 100.00 28.95 6.33 2.32 6.37 2511 56 87.50 26.79 4.81 2.94 1.30 2519 49 100.00 38.78 7.45 12.27 5.70 2520 479 100.00 37.37 6.86 8.16 5.20 2610 4 100.00 100.00 10.70 12.36 17.23 2691 76 100.00 43.42 8.03 13.64 14.08 2692 60 100.00 30.00 6.25 20.72 11.35 2693 50 82.00 50.00 5.75 27.09 22.21 2694 125 100.00 29.60 6.55 5.41 2.79 2695 134 81.34 28.36 4.84 14.21 8.31
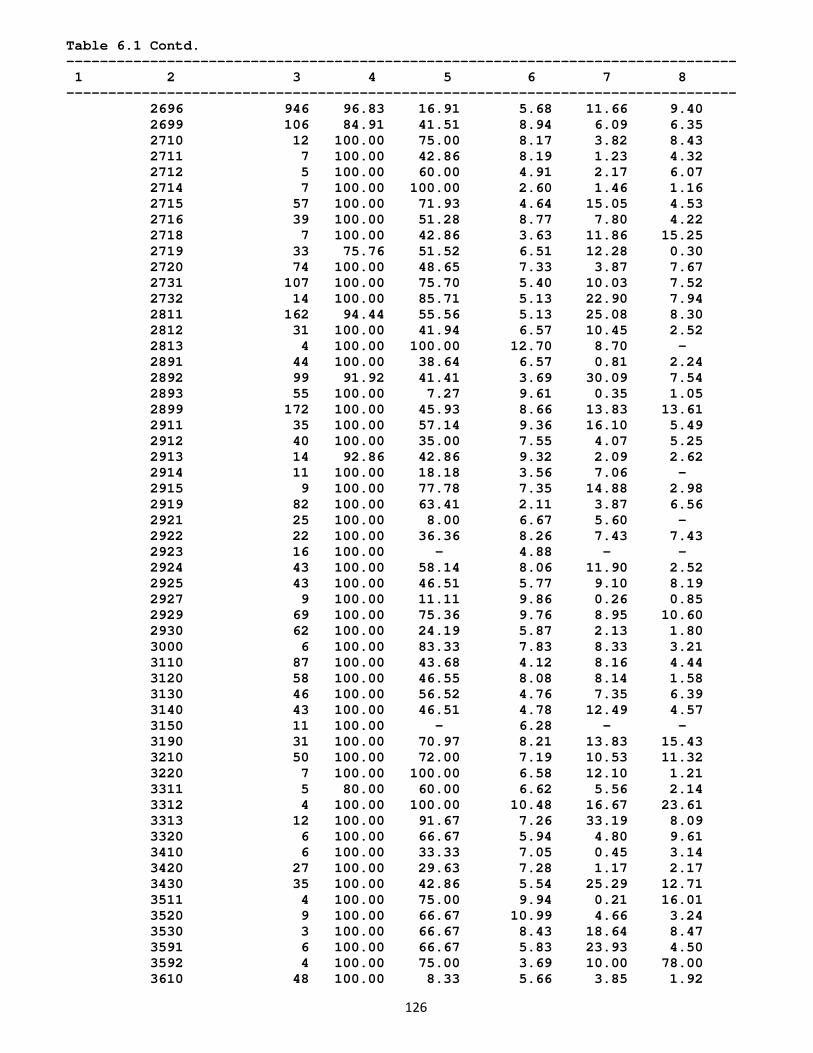
126
Table 6.1 Contd. -------------------------------------------------------------------------------- 1 2 3 4 5 6 7 8 -------------------------------------------------------------------------------- 2696 946 96.83 16.91 5.68 11.66 9.40 2699 106 84.91 41.51 8.94 6.09 6.35 2710 12 100.00 75.00 8.17 3.82 8.43 2711 7 100.00 42.86 8.19 1.23 4.32 2712 5 100.00 60.00 4.91 2.17 6.07 2714 7 100.00 100.00 2.60 1.46 1.16 2715 57 100.00 71.93 4.64 15.05 4.53 2716 39 100.00 51.28 8.77 7.80 4.22 2718 7 100.00 42.86 3.63 11.86 15.25 2719 33 75.76 51.52 6.51 12.28 0.30 2720 74 100.00 48.65 7.33 3.87 7.67 2731 107 100.00 75.70 5.40 10.03 7.52 2732 14 100.00 85.71 5.13 22.90 7.94 2811 162 94.44 55.56 5.13 25.08 8.30 2812 31 100.00 41.94 6.57 10.45 2.52 2813 4 100.00 100.00 12.70 8.70 - 2891 44 100.00 38.64 6.57 0.81 2.24 2892 99 91.92 41.41 3.69 30.09 7.54 2893 55 100.00 7.27 9.61 0.35 1.05 2899 172 100.00 45.93 8.66 13.83 13.61 2911 35 100.00 57.14 9.36 16.10 5.49 2912 40 100.00 35.00 7.55 4.07 5.25 2913 14 92.86 42.86 9.32 2.09 2.62 2914 11 100.00 18.18 3.56 7.06 - 2915 9 100.00 77.78 7.35 14.88 2.98 2919 82 100.00 63.41 2.11 3.87 6.56 2921 25 100.00 8.00 6.67 5.60 - 2922 22 100.00 36.36 8.26 7.43 7.43 2923 16 100.00 - 4.88 - - 2924 43 100.00 58.14 8.06 11.90 2.52 2925 43 100.00 46.51 5.77 9.10 8.19 2927 9 100.00 11.11 9.86 0.26 0.85 2929 69 100.00 75.36 9.76 8.95 10.60 2930 62 100.00 24.19 5.87 2.13 1.80 3000 6 100.00 83.33 7.83 8.33 3.21 3110 87 100.00 43.68 4.12 8.16 4.44 3120 58 100.00 46.55 8.08 8.14 1.58 3130 46 100.00 56.52 4.76 7.35 6.39 3140 43 100.00 46.51 4.78 12.49 4.57 3150 11 100.00 - 6.28 - - 3190 31 100.00 70.97 8.21 13.83 15.43 3210 50 100.00 72.00 7.19 10.53 11.32 3220 7 100.00 100.00 6.58 12.10 1.21 3311 5 80.00 60.00 6.62 5.56 2.14 3312 4 100.00 100.00 10.48 16.67 23.61 3313 12 100.00 91.67 7.26 33.19 8.09 3320 6 100.00 66.67 5.94 4.80 9.61 3410 6 100.00 33.33 7.05 0.45 3.14 3420 27 100.00 29.63 7.28 1.17 2.17 3430 35 100.00 42.86 5.54 25.29 12.71 3511 4 100.00 75.00 9.94 0.21 16.01 3520 9 100.00 66.67 10.99 4.66 3.24 3530 3 100.00 66.67 8.43 18.64 8.47 3591 6 100.00 66.67 5.83 23.93 4.50 3592 4 100.00 75.00 3.69 10.00 78.00 3610 48 100.00 8.33 5.66 3.85 1.92
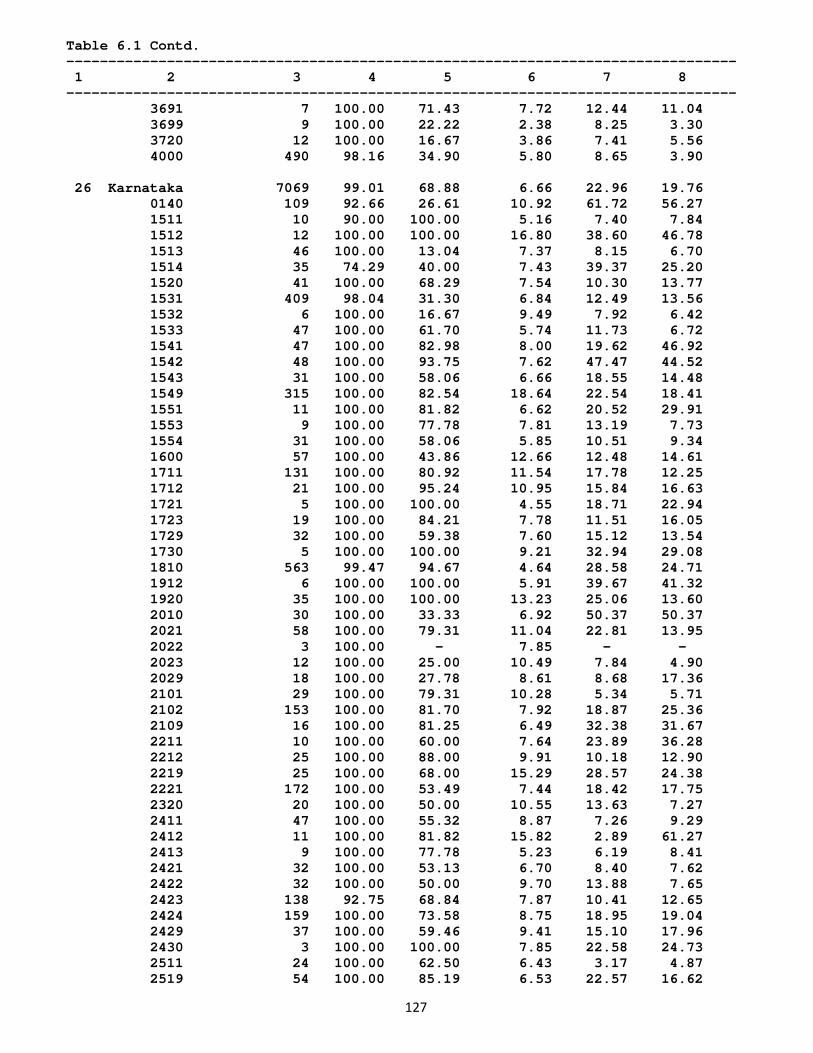
127
Table 6.1 Contd. -------------------------------------------------------------------------------- 1 2 3 4 5 6 7 8 -------------------------------------------------------------------------------- 3691 7 100.00 71.43 7.72 12.44 11.04 3699 9 100.00 22.22 2.38 8.25 3.30 3720 12 100.00 16.67 3.86 7.41 5.56 4000 490 98.16 34.90 5.80 8.65 3.90 26 Karnataka 7069 99.01 68.88 6.66 22.96 19.76 0140 109 92.66 26.61 10.92 61.72 56.27 1511 10 90.00 100.00 5.16 7.40 7.84 1512 12 100.00 100.00 16.80 38.60 46.78 1513 46 100.00 13.04 7.37 8.15 6.70 1514 35 74.29 40.00 7.43 39.37 25.20 1520 41 100.00 68.29 7.54 10.30 13.77 1531 409 98.04 31.30 6.84 12.49 13.56 1532 6 100.00 16.67 9.49 7.92 6.42 1533 47 100.00 61.70 5.74 11.73 6.72 1541 47 100.00 82.98 8.00 19.62 46.92 1542 48 100.00 93.75 7.62 47.47 44.52 1543 31 100.00 58.06 6.66 18.55 14.48 1549 315 100.00 82.54 18.64 22.54 18.41 1551 11 100.00 81.82 6.62 20.52 29.91 1553 9 100.00 77.78 7.81 13.19 7.73 1554 31 100.00 58.06 5.85 10.51 9.34 1600 57 100.00 43.86 12.66 12.48 14.61 1711 131 100.00 80.92 11.54 17.78 12.25 1712 21 100.00 95.24 10.95 15.84 16.63 1721 5 100.00 100.00 4.55 18.71 22.94 1723 19 100.00 84.21 7.78 11.51 16.05 1729 32 100.00 59.38 7.60 15.12 13.54 1730 5 100.00 100.00 9.21 32.94 29.08 1810 563 99.47 94.67 4.64 28.58 24.71 1912 6 100.00 100.00 5.91 39.67 41.32 1920 35 100.00 100.00 13.23 25.06 13.60 2010 30 100.00 33.33 6.92 50.37 50.37 2021 58 100.00 79.31 11.04 22.81 13.95 2022 3 100.00 - 7.85 - - 2023 12 100.00 25.00 10.49 7.84 4.90 2029 18 100.00 27.78 8.61 8.68 17.36 2101 29 100.00 79.31 10.28 5.34 5.71 2102 153 100.00 81.70 7.92 18.87 25.36 2109 16 100.00 81.25 6.49 32.38 31.67 2211 10 100.00 60.00 7.64 23.89 36.28 2212 25 100.00 88.00 9.91 10.18 12.90 2219 25 100.00 68.00 15.29 28.57 24.38 2221 172 100.00 53.49 7.44 18.42 17.75 2320 20 100.00 50.00 10.55 13.63 7.27 2411 47 100.00 55.32 8.87 7.26 9.29 2412 11 100.00 81.82 15.82 2.89 61.27 2413 9 100.00 77.78 5.23 6.19 8.41 2421 32 100.00 53.13 6.70 8.40 7.62 2422 32 100.00 50.00 9.70 13.88 7.65 2423 138 92.75 68.84 7.87 10.41 12.65 2424 159 100.00 73.58 8.75 18.95 19.04 2429 37 100.00 59.46 9.41 15.10 17.96 2430 3 100.00 100.00 7.85 22.58 24.73 2511 24 100.00 62.50 6.43 3.17 4.87 2519 54 100.00 85.19 6.53 22.57 16.62
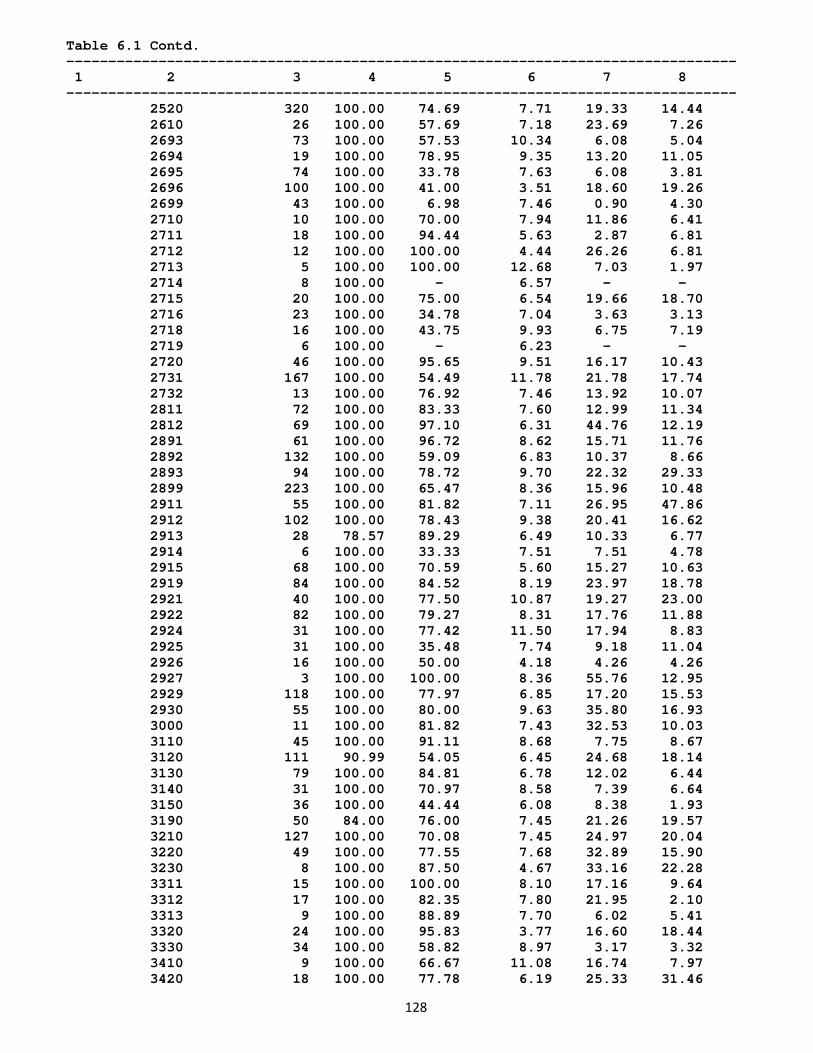
128
Table 6.1 Contd. -------------------------------------------------------------------------------- 1 2 3 4 5 6 7 8 -------------------------------------------------------------------------------- 2520 320 100.00 74.69 7.71 19.33 14.44 2610 26 100.00 57.69 7.18 23.69 7.26 2693 73 100.00 57.53 10.34 6.08 5.04 2694 19 100.00 78.95 9.35 13.20 11.05 2695 74 100.00 33.78 7.63 6.08 3.81 2696 100 100.00 41.00 3.51 18.60 19.26 2699 43 100.00 6.98 7.46 0.90 4.30 2710 10 100.00 70.00 7.94 11.86 6.41 2711 18 100.00 94.44 5.63 2.87 6.81 2712 12 100.00 100.00 4.44 26.26 6.81 2713 5 100.00 100.00 12.68 7.03 1.97 2714 8 100.00 - 6.57 - - 2715 20 100.00 75.00 6.54 19.66 18.70 2716 23 100.00 34.78 7.04 3.63 3.13 2718 16 100.00 43.75 9.93 6.75 7.19 2719 6 100.00 - 6.23 - - 2720 46 100.00 95.65 9.51 16.17 10.43 2731 167 100.00 54.49 11.78 21.78 17.74 2732 13 100.00 76.92 7.46 13.92 10.07 2811 72 100.00 83.33 7.60 12.99 11.34 2812 69 100.00 97.10 6.31 44.76 12.19 2891 61 100.00 96.72 8.62 15.71 11.76 2892 132 100.00 59.09 6.83 10.37 8.66 2893 94 100.00 78.72 9.70 22.32 29.33 2899 223 100.00 65.47 8.36 15.96 10.48 2911 55 100.00 81.82 7.11 26.95 47.86 2912 102 100.00 78.43 9.38 20.41 16.62 2913 28 78.57 89.29 6.49 10.33 6.77 2914 6 100.00 33.33 7.51 7.51 4.78 2915 68 100.00 70.59 5.60 15.27 10.63 2919 84 100.00 84.52 8.19 23.97 18.78 2921 40 100.00 77.50 10.87 19.27 23.00 2922 82 100.00 79.27 8.31 17.76 11.88 2924 31 100.00 77.42 11.50 17.94 8.83 2925 31 100.00 35.48 7.74 9.18 11.04 2926 16 100.00 50.00 4.18 4.26 4.26 2927 3 100.00 100.00 8.36 55.76 12.95 2929 118 100.00 77.97 6.85 17.20 15.53 2930 55 100.00 80.00 9.63 35.80 16.93 3000 11 100.00 81.82 7.43 32.53 10.03 3110 45 100.00 91.11 8.68 7.75 8.67 3120 111 90.99 54.05 6.45 24.68 18.14 3130 79 100.00 84.81 6.78 12.02 6.44 3140 31 100.00 70.97 8.58 7.39 6.64 3150 36 100.00 44.44 6.08 8.38 1.93 3190 50 84.00 76.00 7.45 21.26 19.57 3210 127 100.00 70.08 7.45 24.97 20.04 3220 49 100.00 77.55 7.68 32.89 15.90 3230 8 100.00 87.50 4.67 33.16 22.28 3311 15 100.00 100.00 8.10 17.16 9.64 3312 17 100.00 82.35 7.80 21.95 2.10 3313 9 100.00 88.89 7.70 6.02 5.41 3320 24 100.00 95.83 3.77 16.60 18.44 3330 34 100.00 58.82 8.97 3.17 3.32 3410 9 100.00 66.67 11.08 16.74 7.97 3420 18 100.00 77.78 6.19 25.33 31.46
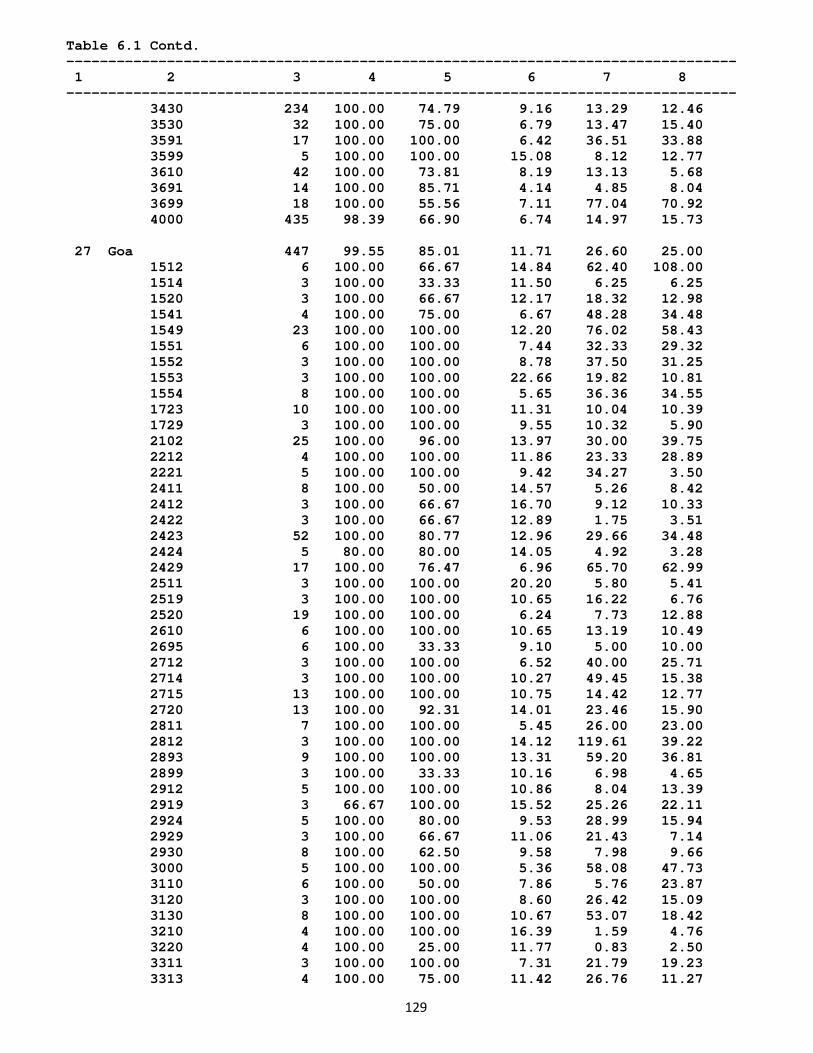
129
Table 6.1 Contd. -------------------------------------------------------------------------------- 1 2 3 4 5 6 7 8 -------------------------------------------------------------------------------- 3430 234 100.00 74.79 9.16 13.29 12.46 3530 32 100.00 75.00 6.79 13.47 15.40 3591 17 100.00 100.00 6.42 36.51 33.88 3599 5 100.00 100.00 15.08 8.12 12.77 3610 42 100.00 73.81 8.19 13.13 5.68 3691 14 100.00 85.71 4.14 4.85 8.04 3699 18 100.00 55.56 7.11 77.04 70.92 4000 435 98.39 66.90 6.74 14.97 15.73 27 Goa 447 99.55 85.01 11.71 26.60 25.00 1512 6 100.00 66.67 14.84 62.40 108.00 1514 3 100.00 33.33 11.50 6.25 6.25 1520 3 100.00 66.67 12.17 18.32 12.98 1541 4 100.00 75.00 6.67 48.28 34.48 1549 23 100.00 100.00 12.20 76.02 58.43 1551 6 100.00 100.00 7.44 32.33 29.32 1552 3 100.00 100.00 8.78 37.50 31.25 1553 3 100.00 100.00 22.66 19.82 10.81 1554 8 100.00 100.00 5.65 36.36 34.55 1723 10 100.00 100.00 11.31 10.04 10.39 1729 3 100.00 100.00 9.55 10.32 5.90 2102 25 100.00 96.00 13.97 30.00 39.75 2212 4 100.00 100.00 11.86 23.33 28.89 2221 5 100.00 100.00 9.42 34.27 3.50 2411 8 100.00 50.00 14.57 5.26 8.42 2412 3 100.00 66.67 16.70 9.12 10.33 2422 3 100.00 66.67 12.89 1.75 3.51 2423 52 100.00 80.77 12.96 29.66 34.48 2424 5 80.00 80.00 14.05 4.92 3.28 2429 17 100.00 76.47 6.96 65.70 62.99 2511 3 100.00 100.00 20.20 5.80 5.41 2519 3 100.00 100.00 10.65 16.22 6.76 2520 19 100.00 100.00 6.24 7.73 12.88 2610 6 100.00 100.00 10.65 13.19 10.49 2695 6 100.00 33.33 9.10 5.00 10.00 2712 3 100.00 100.00 6.52 40.00 25.71 2714 3 100.00 100.00 10.27 49.45 15.38 2715 13 100.00 100.00 10.75 14.42 12.77 2720 13 100.00 92.31 14.01 23.46 15.90 2811 7 100.00 100.00 5.45 26.00 23.00 2812 3 100.00 100.00 14.12 119.61 39.22 2893 9 100.00 100.00 13.31 59.20 36.81 2899 3 100.00 33.33 10.16 6.98 4.65 2912 5 100.00 100.00 10.86 8.04 13.39 2919 3 66.67 100.00 15.52 25.26 22.11 2924 5 100.00 80.00 9.53 28.99 15.94 2929 3 100.00 66.67 11.06 21.43 7.14 2930 8 100.00 62.50 9.58 7.98 9.66 3000 5 100.00 100.00 5.36 58.08 47.73 3110 6 100.00 50.00 7.86 5.76 23.87 3120 3 100.00 100.00 8.60 26.42 15.09 3130 8 100.00 100.00 10.67 53.07 18.42 3210 4 100.00 100.00 16.39 1.59 4.76 3220 4 100.00 25.00 11.77 0.83 2.50 3311 3 100.00 100.00 7.31 21.79 19.23 3313 4 100.00 75.00 11.42 26.76 11.27
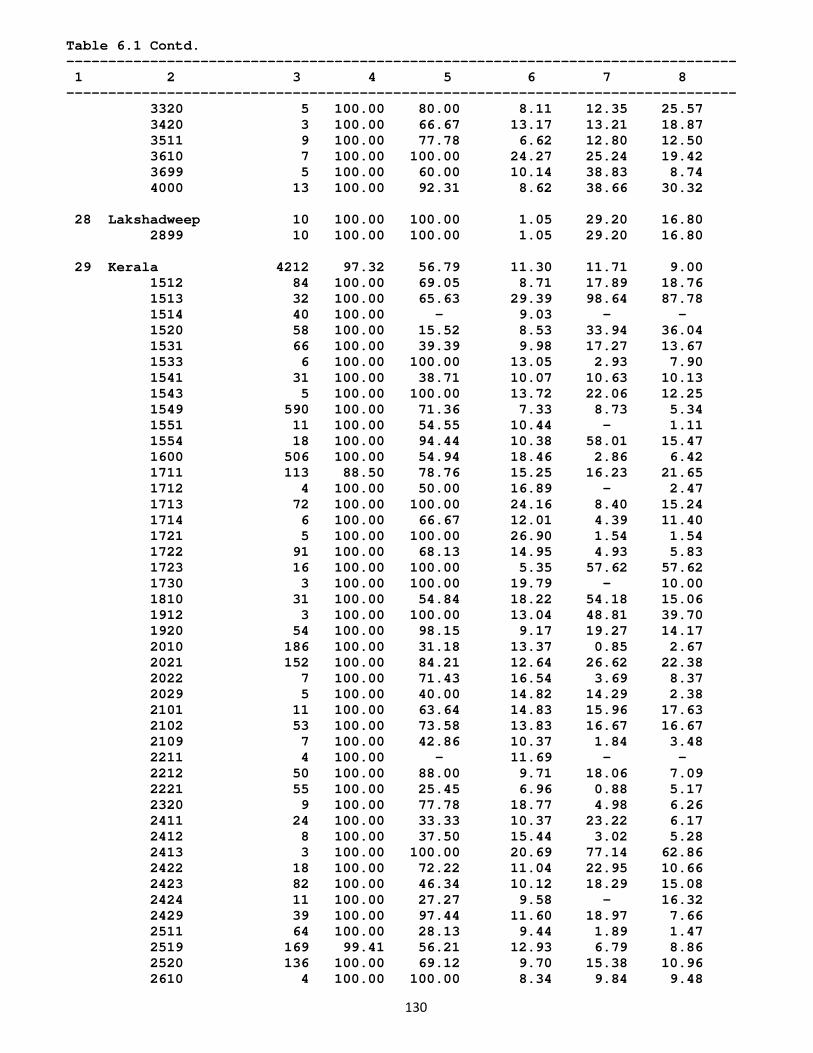
130
Table 6.1 Contd. -------------------------------------------------------------------------------- 1 2 3 4 5 6 7 8 -------------------------------------------------------------------------------- 3320 5 100.00 80.00 8.11 12.35 25.57 3420 3 100.00 66.67 13.17 13.21 18.87 3511 9 100.00 77.78 6.62 12.80 12.50 3610 7 100.00 100.00 24.27 25.24 19.42 3699 5 100.00 60.00 10.14 38.83 8.74 4000 13 100.00 92.31 8.62 38.66 30.32 28 Lakshadweep 10 100.00 100.00 1.05 29.20 16.80 2899 10 100.00 100.00 1.05 29.20 16.80 29 Kerala 4212 97.32 56.79 11.30 11.71 9.00 1512 84 100.00 69.05 8.71 17.89 18.76 1513 32 100.00 65.63 29.39 98.64 87.78 1514 40 100.00 - 9.03 - - 1520 58 100.00 15.52 8.53 33.94 36.04 1531 66 100.00 39.39 9.98 17.27 13.67 1533 6 100.00 100.00 13.05 2.93 7.90 1541 31 100.00 38.71 10.07 10.63 10.13 1543 5 100.00 100.00 13.72 22.06 12.25 1549 590 100.00 71.36 7.33 8.73 5.34 1551 11 100.00 54.55 10.44 - 1.11 1554 18 100.00 94.44 10.38 58.01 15.47 1600 506 100.00 54.94 18.46 2.86 6.42 1711 113 88.50 78.76 15.25 16.23 21.65 1712 4 100.00 50.00 16.89 - 2.47 1713 72 100.00 100.00 24.16 8.40 15.24 1714 6 100.00 66.67 12.01 4.39 11.40 1721 5 100.00 100.00 26.90 1.54 1.54 1722 91 100.00 68.13 14.95 4.93 5.83 1723 16 100.00 100.00 5.35 57.62 57.62 1730 3 100.00 100.00 19.79 - 10.00 1810 31 100.00 54.84 18.22 54.18 15.06 1912 3 100.00 100.00 13.04 48.81 39.70 1920 54 100.00 98.15 9.17 19.27 14.17 2010 186 100.00 31.18 13.37 0.85 2.67 2021 152 100.00 84.21 12.64 26.62 22.38 2022 7 100.00 71.43 16.54 3.69 8.37 2029 5 100.00 40.00 14.82 14.29 2.38 2101 11 100.00 63.64 14.83 15.96 17.63 2102 53 100.00 73.58 13.83 16.67 16.67 2109 7 100.00 42.86 10.37 1.84 3.48 2211 4 100.00 - 11.69 - - 2212 50 100.00 88.00 9.71 18.06 7.09 2221 55 100.00 25.45 6.96 0.88 5.17 2320 9 100.00 77.78 18.77 4.98 6.26 2411 24 100.00 33.33 10.37 23.22 6.17 2412 8 100.00 37.50 15.44 3.02 5.28 2413 3 100.00 100.00 20.69 77.14 62.86 2422 18 100.00 72.22 11.04 22.95 10.66 2423 82 100.00 46.34 10.12 18.29 15.08 2424 11 100.00 27.27 9.58 - 16.32 2429 39 100.00 97.44 11.60 18.97 7.66 2511 64 100.00 28.13 9.44 1.89 1.47 2519 169 99.41 56.21 12.93 6.79 8.86 2520 136 100.00 69.12 9.70 15.38 10.96 2610 4 100.00 100.00 8.34 9.84 9.48
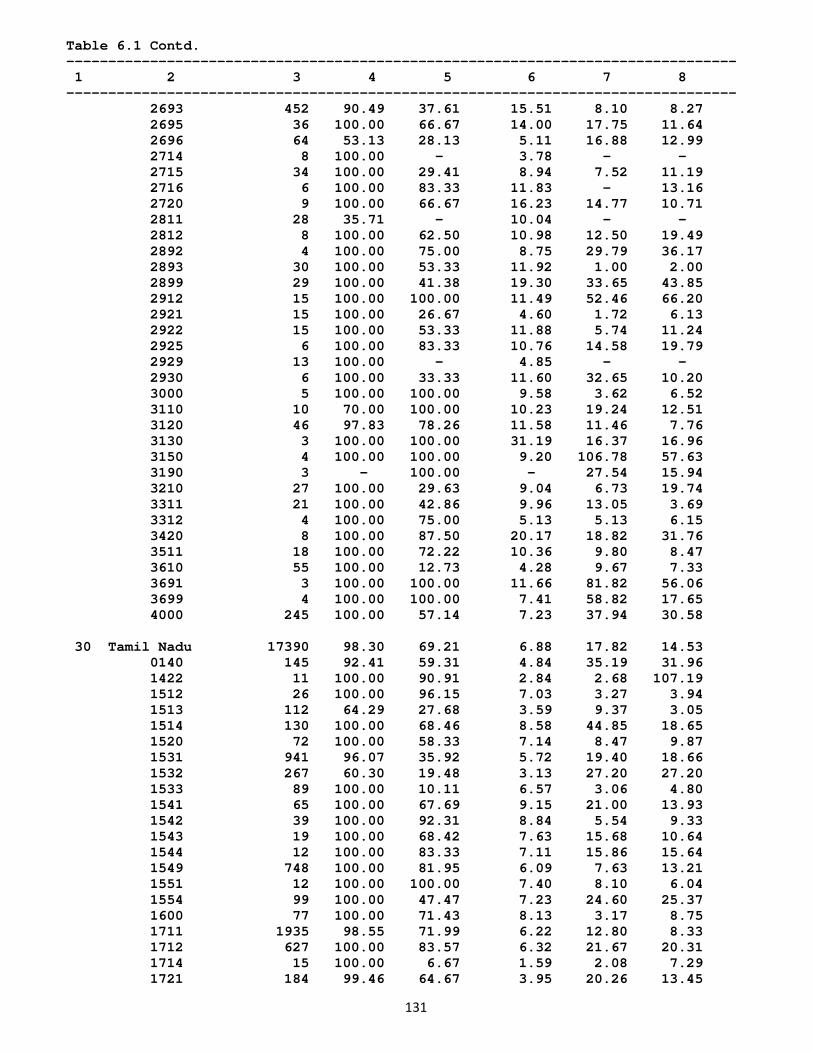
131
Table 6.1 Contd. -------------------------------------------------------------------------------- 1 2 3 4 5 6 7 8 -------------------------------------------------------------------------------- 2693 452 90.49 37.61 15.51 8.10 8.27 2695 36 100.00 66.67 14.00 17.75 11.64 2696 64 53.13 28.13 5.11 16.88 12.99 2714 8 100.00 - 3.78 - - 2715 34 100.00 29.41 8.94 7.52 11.19 2716 6 100.00 83.33 11.83 - 13.16 2720 9 100.00 66.67 16.23 14.77 10.71 2811 28 35.71 - 10.04 - - 2812 8 100.00 62.50 10.98 12.50 19.49 2892 4 100.00 75.00 8.75 29.79 36.17 2893 30 100.00 53.33 11.92 1.00 2.00 2899 29 100.00 41.38 19.30 33.65 43.85 2912 15 100.00 100.00 11.49 52.46 66.20 2921 15 100.00 26.67 4.60 1.72 6.13 2922 15 100.00 53.33 11.88 5.74 11.24 2925 6 100.00 83.33 10.76 14.58 19.79 2929 13 100.00 - 4.85 - - 2930 6 100.00 33.33 11.60 32.65 10.20 3000 5 100.00 100.00 9.58 3.62 6.52 3110 10 70.00 100.00 10.23 19.24 12.51 3120 46 97.83 78.26 11.58 11.46 7.76 3130 3 100.00 100.00 31.19 16.37 16.96 3150 4 100.00 100.00 9.20 106.78 57.63 3190 3 - 100.00 - 27.54 15.94 3210 27 100.00 29.63 9.04 6.73 19.74 3311 21 100.00 42.86 9.96 13.05 3.69 3312 4 100.00 75.00 5.13 5.13 6.15 3420 8 100.00 87.50 20.17 18.82 31.76 3511 18 100.00 72.22 10.36 9.80 8.47 3610 55 100.00 12.73 4.28 9.67 7.33 3691 3 100.00 100.00 11.66 81.82 56.06 3699 4 100.00 100.00 7.41 58.82 17.65 4000 245 100.00 57.14 7.23 37.94 30.58 30 Tamil Nadu 17390 98.30 69.21 6.88 17.82 14.53 0140 145 92.41 59.31 4.84 35.19 31.96 1422 11 100.00 90.91 2.84 2.68 107.19 1512 26 100.00 96.15 7.03 3.27 3.94 1513 112 64.29 27.68 3.59 9.37 3.05 1514 130 100.00 68.46 8.58 44.85 18.65 1520 72 100.00 58.33 7.14 8.47 9.87 1531 941 96.07 35.92 5.72 19.40 18.66 1532 267 60.30 19.48 3.13 27.20 27.20 1533 89 100.00 10.11 6.57 3.06 4.80 1541 65 100.00 67.69 9.15 21.00 13.93 1542 39 100.00 92.31 8.84 5.54 9.33 1543 19 100.00 68.42 7.63 15.68 10.64 1544 12 100.00 83.33 7.11 15.86 15.64 1549 748 100.00 81.95 6.09 7.63 13.21 1551 12 100.00 100.00 7.40 8.10 6.04 1554 99 100.00 47.47 7.23 24.60 25.37 1600 77 100.00 71.43 8.13 3.17 8.75 1711 1935 98.55 71.99 6.22 12.80 8.33 1712 627 100.00 83.57 6.32 21.67 20.31 1714 15 100.00 6.67 1.59 2.08 7.29 1721 184 99.46 64.67 3.95 20.26 13.45
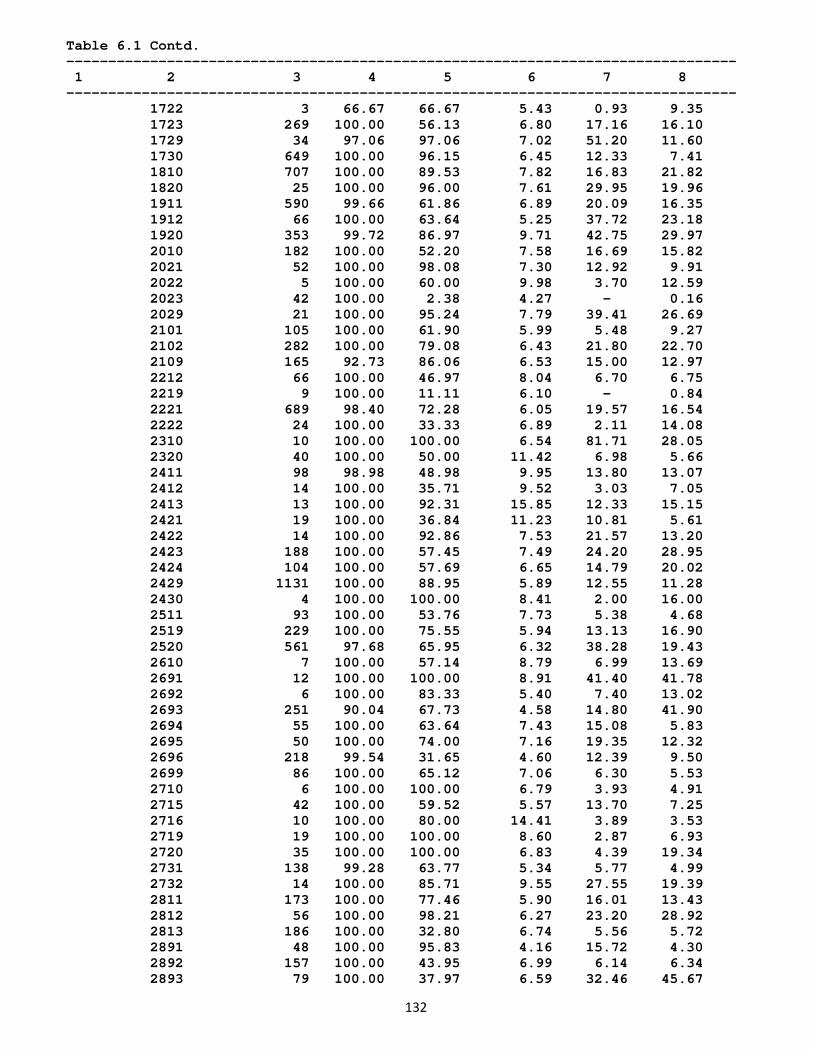
132
Table 6.1 Contd. -------------------------------------------------------------------------------- 1 2 3 4 5 6 7 8 -------------------------------------------------------------------------------- 1722 3 66.67 66.67 5.43 0.93 9.35 1723 269 100.00 56.13 6.80 17.16 16.10 1729 34 97.06 97.06 7.02 51.20 11.60 1730 649 100.00 96.15 6.45 12.33 7.41 1810 707 100.00 89.53 7.82 16.83 21.82 1820 25 100.00 96.00 7.61 29.95 19.96 1911 590 99.66 61.86 6.89 20.09 16.35 1912 66 100.00 63.64 5.25 37.72 23.18 1920 353 99.72 86.97 9.71 42.75 29.97 2010 182 100.00 52.20 7.58 16.69 15.82 2021 52 100.00 98.08 7.30 12.92 9.91 2022 5 100.00 60.00 9.98 3.70 12.59 2023 42 100.00 2.38 4.27 - 0.16 2029 21 100.00 95.24 7.79 39.41 26.69 2101 105 100.00 61.90 5.99 5.48 9.27 2102 282 100.00 79.08 6.43 21.80 22.70 2109 165 92.73 86.06 6.53 15.00 12.97 2212 66 100.00 46.97 8.04 6.70 6.75 2219 9 100.00 11.11 6.10 - 0.84 2221 689 98.40 72.28 6.05 19.57 16.54 2222 24 100.00 33.33 6.89 2.11 14.08 2310 10 100.00 100.00 6.54 81.71 28.05 2320 40 100.00 50.00 11.42 6.98 5.66 2411 98 98.98 48.98 9.95 13.80 13.07 2412 14 100.00 35.71 9.52 3.03 7.05 2413 13 100.00 92.31 15.85 12.33 15.15 2421 19 100.00 36.84 11.23 10.81 5.61 2422 14 100.00 92.86 7.53 21.57 13.20 2423 188 100.00 57.45 7.49 24.20 28.95 2424 104 100.00 57.69 6.65 14.79 20.02 2429 1131 100.00 88.95 5.89 12.55 11.28 2430 4 100.00 100.00 8.41 2.00 16.00 2511 93 100.00 53.76 7.73 5.38 4.68 2519 229 100.00 75.55 5.94 13.13 16.90 2520 561 97.68 65.95 6.32 38.28 19.43 2610 7 100.00 57.14 8.79 6.99 13.69 2691 12 100.00 100.00 8.91 41.40 41.78 2692 6 100.00 83.33 5.40 7.40 13.02 2693 251 90.04 67.73 4.58 14.80 41.90 2694 55 100.00 63.64 7.43 15.08 5.83 2695 50 100.00 74.00 7.16 19.35 12.32 2696 218 99.54 31.65 4.60 12.39 9.50 2699 86 100.00 65.12 7.06 6.30 5.53 2710 6 100.00 100.00 6.79 3.93 4.91 2715 42 100.00 59.52 5.57 13.70 7.25 2716 10 100.00 80.00 14.41 3.89 3.53 2719 19 100.00 100.00 8.60 2.87 6.93 2720 35 100.00 100.00 6.83 4.39 19.34 2731 138 99.28 63.77 5.34 5.77 4.99 2732 14 100.00 85.71 9.55 27.55 19.39 2811 173 100.00 77.46 5.90 16.01 13.43 2812 56 100.00 98.21 6.27 23.20 28.92 2813 186 100.00 32.80 6.74 5.56 5.72 2891 48 100.00 95.83 4.16 15.72 4.30 2892 157 100.00 43.95 6.99 6.14 6.34 2893 79 100.00 37.97 6.59 32.46 45.67
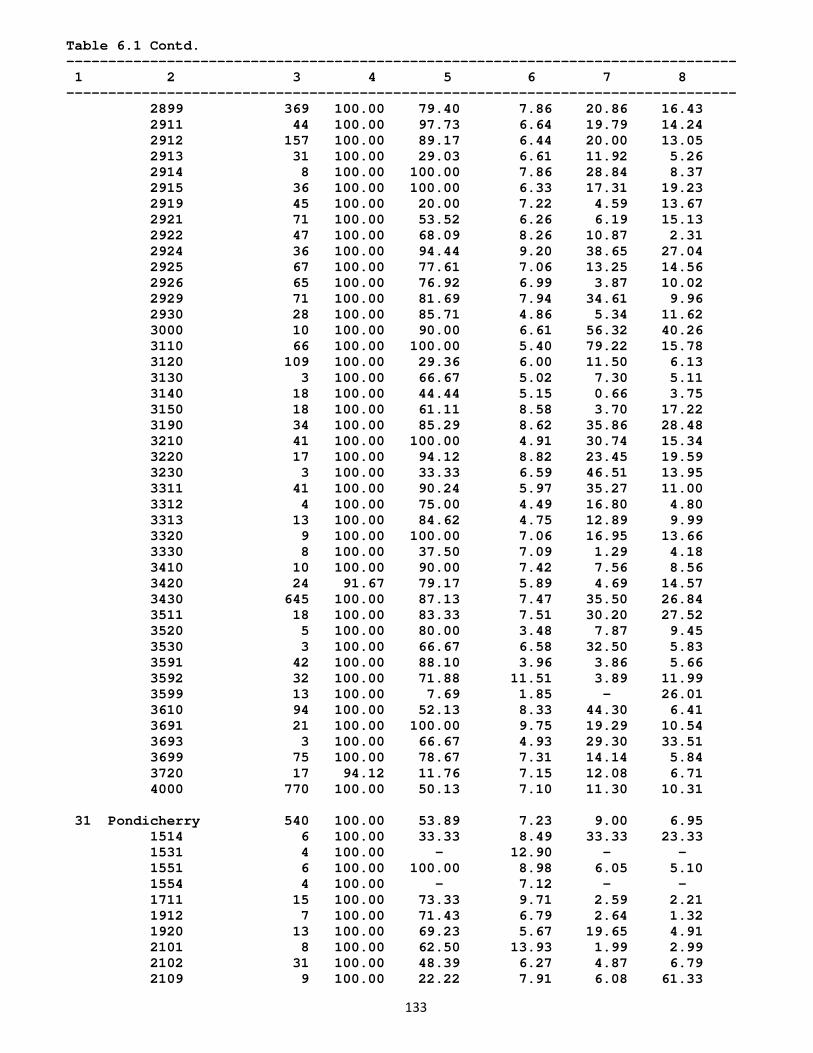
133
Table 6.1 Contd. -------------------------------------------------------------------------------- 1 2 3 4 5 6 7 8 -------------------------------------------------------------------------------- 2899 369 100.00 79.40 7.86 20.86 16.43 2911 44 100.00 97.73 6.64 19.79 14.24 2912 157 100.00 89.17 6.44 20.00 13.05 2913 31 100.00 29.03 6.61 11.92 5.26 2914 8 100.00 100.00 7.86 28.84 8.37 2915 36 100.00 100.00 6.33 17.31 19.23 2919 45 100.00 20.00 7.22 4.59 13.67 2921 71 100.00 53.52 6.26 6.19 15.13 2922 47 100.00 68.09 8.26 10.87 2.31 2924 36 100.00 94.44 9.20 38.65 27.04 2925 67 100.00 77.61 7.06 13.25 14.56 2926 65 100.00 76.92 6.99 3.87 10.02 2929 71 100.00 81.69 7.94 34.61 9.96 2930 28 100.00 85.71 4.86 5.34 11.62 3000 10 100.00 90.00 6.61 56.32 40.26 3110 66 100.00 100.00 5.40 79.22 15.78 3120 109 100.00 29.36 6.00 11.50 6.13 3130 3 100.00 66.67 5.02 7.30 5.11 3140 18 100.00 44.44 5.15 0.66 3.75 3150 18 100.00 61.11 8.58 3.70 17.22 3190 34 100.00 85.29 8.62 35.86 28.48 3210 41 100.00 100.00 4.91 30.74 15.34 3220 17 100.00 94.12 8.82 23.45 19.59 3230 3 100.00 33.33 6.59 46.51 13.95 3311 41 100.00 90.24 5.97 35.27 11.00 3312 4 100.00 75.00 4.49 16.80 4.80 3313 13 100.00 84.62 4.75 12.89 9.99 3320 9 100.00 100.00 7.06 16.95 13.66 3330 8 100.00 37.50 7.09 1.29 4.18 3410 10 100.00 90.00 7.42 7.56 8.56 3420 24 91.67 79.17 5.89 4.69 14.57 3430 645 100.00 87.13 7.47 35.50 26.84 3511 18 100.00 83.33 7.51 30.20 27.52 3520 5 100.00 80.00 3.48 7.87 9.45 3530 3 100.00 66.67 6.58 32.50 5.83 3591 42 100.00 88.10 3.96 3.86 5.66 3592 32 100.00 71.88 11.51 3.89 11.99 3599 13 100.00 7.69 1.85 - 26.01 3610 94 100.00 52.13 8.33 44.30 6.41 3691 21 100.00 100.00 9.75 19.29 10.54 3693 3 100.00 66.67 4.93 29.30 33.51 3699 75 100.00 78.67 7.31 14.14 5.84 3720 17 94.12 11.76 7.15 12.08 6.71 4000 770 100.00 50.13 7.10 11.30 10.31 31 Pondicherry 540 100.00 53.89 7.23 9.00 6.95 1514 6 100.00 33.33 8.49 33.33 23.33 1531 4 100.00 - 12.90 - - 1551 6 100.00 100.00 8.98 6.05 5.10 1554 4 100.00 - 7.12 - - 1711 15 100.00 73.33 9.71 2.59 2.21 1912 7 100.00 71.43 6.79 2.64 1.32 1920 13 100.00 69.23 5.67 19.65 4.91 2101 8 100.00 62.50 13.93 1.99 2.99 2102 31 100.00 48.39 6.27 4.87 6.79 2109 9 100.00 22.22 7.91 6.08 61.33
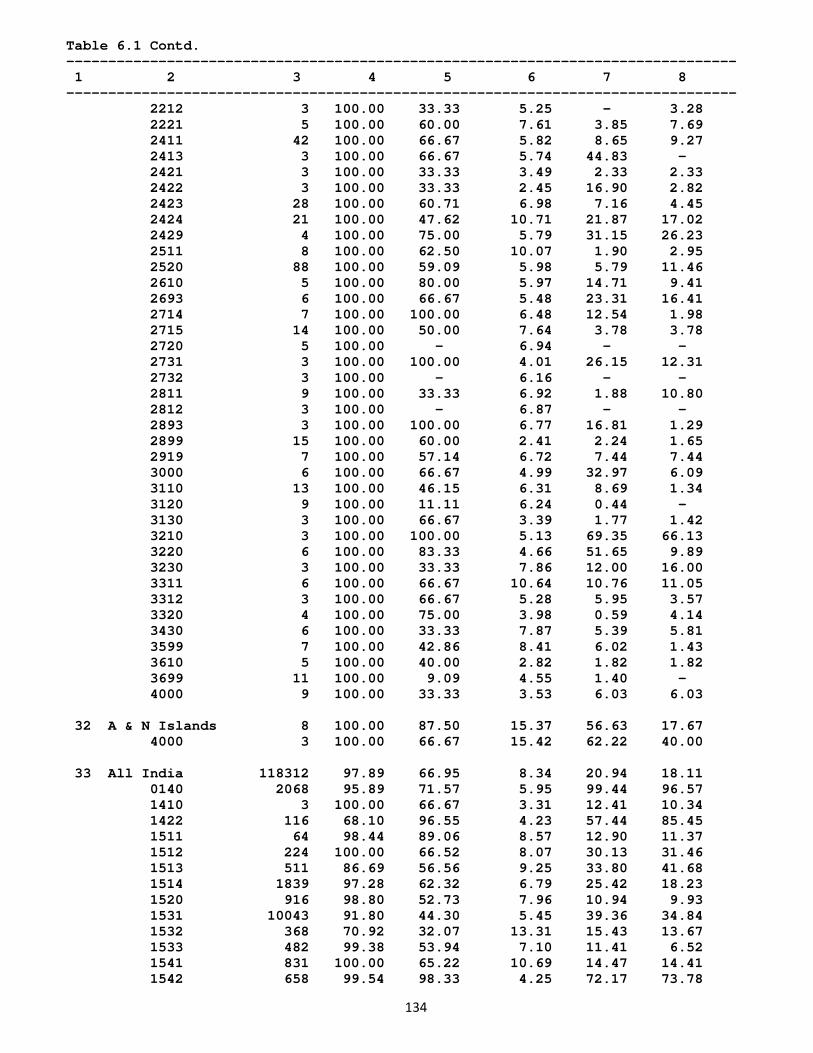
134
Table 6.1 Contd. -------------------------------------------------------------------------------- 1 2 3 4 5 6 7 8 -------------------------------------------------------------------------------- 2212 3 100.00 33.33 5.25 - 3.28 2221 5 100.00 60.00 7.61 3.85 7.69 2411 42 100.00 66.67 5.82 8.65 9.27 2413 3 100.00 66.67 5.74 44.83 - 2421 3 100.00 33.33 3.49 2.33 2.33 2422 3 100.00 33.33 2.45 16.90 2.82 2423 28 100.00 60.71 6.98 7.16 4.45 2424 21 100.00 47.62 10.71 21.87 17.02 2429 4 100.00 75.00 5.79 31.15 26.23 2511 8 100.00 62.50 10.07 1.90 2.95 2520 88 100.00 59.09 5.98 5.79 11.46 2610 5 100.00 80.00 5.97 14.71 9.41 2693 6 100.00 66.67 5.48 23.31 16.41 2714 7 100.00 100.00 6.48 12.54 1.98 2715 14 100.00 50.00 7.64 3.78 3.78 2720 5 100.00 - 6.94 - - 2731 3 100.00 100.00 4.01 26.15 12.31 2732 3 100.00 - 6.16 - - 2811 9 100.00 33.33 6.92 1.88 10.80 2812 3 100.00 - 6.87 - - 2893 3 100.00 100.00 6.77 16.81 1.29 2899 15 100.00 60.00 2.41 2.24 1.65 2919 7 100.00 57.14 6.72 7.44 7.44 3000 6 100.00 66.67 4.99 32.97 6.09 3110 13 100.00 46.15 6.31 8.69 1.34 3120 9 100.00 11.11 6.24 0.44 - 3130 3 100.00 66.67 3.39 1.77 1.42 3210 3 100.00 100.00 5.13 69.35 66.13 3220 6 100.00 83.33 4.66 51.65 9.89 3230 3 100.00 33.33 7.86 12.00 16.00 3311 6 100.00 66.67 10.64 10.76 11.05 3312 3 100.00 66.67 5.28 5.95 3.57 3320 4 100.00 75.00 3.98 0.59 4.14 3430 6 100.00 33.33 7.87 5.39 5.81 3599 7 100.00 42.86 8.41 6.02 1.43 3610 5 100.00 40.00 2.82 1.82 1.82 3699 11 100.00 9.09 4.55 1.40 - 4000 9 100.00 33.33 3.53 6.03 6.03 32 A & N Islands 8 100.00 87.50 15.37 56.63 17.67 4000 3 100.00 66.67 15.42 62.22 40.00 33 All India 118312 97.89 66.95 8.34 20.94 18.11 0140 2068 95.89 71.57 5.95 99.44 96.57 1410 3 100.00 66.67 3.31 12.41 10.34 1422 116 68.10 96.55 4.23 57.44 85.45 1511 64 98.44 89.06 8.57 12.90 11.37 1512 224 100.00 66.52 8.07 30.13 31.46 1513 511 86.69 56.56 9.25 33.80 41.68 1514 1839 97.28 62.32 6.79 25.42 18.23 1520 916 98.80 52.73 7.96 10.94 9.93 1531 10043 91.80 44.30 5.45 39.36 34.84 1532 368 70.92 32.07 13.31 15.43 13.67 1533 482 99.38 53.94 7.10 11.41 6.52 1541 831 100.00 65.22 10.69 14.47 14.41 1542 658 99.54 98.33 4.25 72.17 73.78
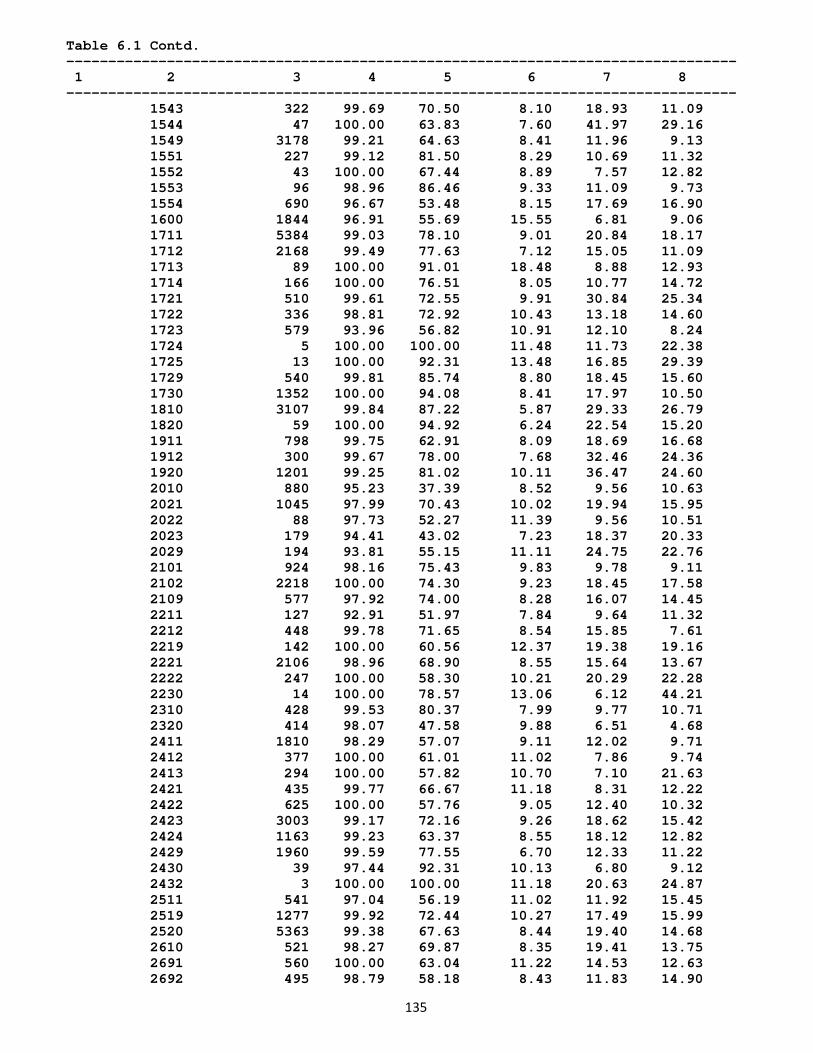
135
Table 6.1 Contd. -------------------------------------------------------------------------------- 1 2 3 4 5 6 7 8 -------------------------------------------------------------------------------- 1543 322 99.69 70.50 8.10 18.93 11.09 1544 47 100.00 63.83 7.60 41.97 29.16 1549 3178 99.21 64.63 8.41 11.96 9.13 1551 227 99.12 81.50 8.29 10.69 11.32 1552 43 100.00 67.44 8.89 7.57 12.82 1553 96 98.96 86.46 9.33 11.09 9.73 1554 690 96.67 53.48 8.15 17.69 16.90 1600 1844 96.91 55.69 15.55 6.81 9.06 1711 5384 99.03 78.10 9.01 20.84 18.17 1712 2168 99.49 77.63 7.12 15.05 11.09 1713 89 100.00 91.01 18.48 8.88 12.93 1714 166 100.00 76.51 8.05 10.77 14.72 1721 510 99.61 72.55 9.91 30.84 25.34 1722 336 98.81 72.92 10.43 13.18 14.60 1723 579 93.96 56.82 10.91 12.10 8.24 1724 5 100.00 100.00 11.48 11.73 22.38 1725 13 100.00 92.31 13.48 16.85 29.39 1729 540 99.81 85.74 8.80 18.45 15.60 1730 1352 100.00 94.08 8.41 17.97 10.50 1810 3107 99.84 87.22 5.87 29.33 26.79 1820 59 100.00 94.92 6.24 22.54 15.20 1911 798 99.75 62.91 8.09 18.69 16.68 1912 300 99.67 78.00 7.68 32.46 24.36 1920 1201 99.25 81.02 10.11 36.47 24.60 2010 880 95.23 37.39 8.52 9.56 10.63 2021 1045 97.99 70.43 10.02 19.94 15.95 2022 88 97.73 52.27 11.39 9.56 10.51 2023 179 94.41 43.02 7.23 18.37 20.33 2029 194 93.81 55.15 11.11 24.75 22.76 2101 924 98.16 75.43 9.83 9.78 9.11 2102 2218 100.00 74.30 9.23 18.45 17.58 2109 577 97.92 74.00 8.28 16.07 14.45 2211 127 92.91 51.97 7.84 9.64 11.32 2212 448 99.78 71.65 8.54 15.85 7.61 2219 142 100.00 60.56 12.37 19.38 19.16 2221 2106 98.96 68.90 8.55 15.64 13.67 2222 247 100.00 58.30 10.21 20.29 22.28 2230 14 100.00 78.57 13.06 6.12 44.21 2310 428 99.53 80.37 7.99 9.77 10.71 2320 414 98.07 47.58 9.88 6.51 4.68 2411 1810 98.29 57.07 9.11 12.02 9.71 2412 377 100.00 61.01 11.02 7.86 9.74 2413 294 100.00 57.82 10.70 7.10 21.63 2421 435 99.77 66.67 11.18 8.31 12.22 2422 625 100.00 57.76 9.05 12.40 10.32 2423 3003 99.17 72.16 9.26 18.62 15.42 2424 1163 99.23 63.37 8.55 18.12 12.82 2429 1960 99.59 77.55 6.70 12.33 11.22 2430 39 97.44 92.31 10.13 6.80 9.12 2432 3 100.00 100.00 11.18 20.63 24.87 2511 541 97.04 56.19 11.02 11.92 15.45 2519 1277 99.92 72.44 10.27 17.49 15.99 2520 5363 99.38 67.63 8.44 19.40 14.68 2610 521 98.27 69.87 8.35 19.41 13.75 2691 560 100.00 63.04 11.22 14.53 12.63 2692 495 98.79 58.18 8.43 11.83 14.90
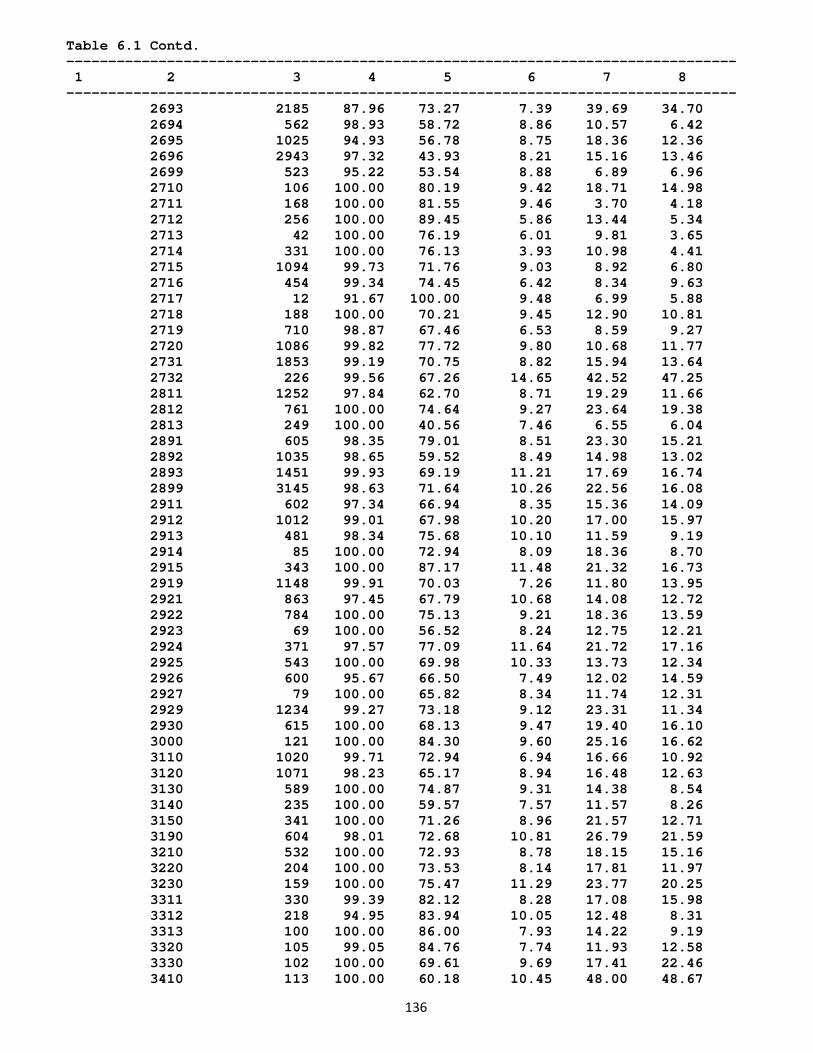
136
Table 6.1 Contd. -------------------------------------------------------------------------------- 1 2 3 4 5 6 7 8 -------------------------------------------------------------------------------- 2693 2185 87.96 73.27 7.39 39.69 34.70 2694 562 98.93 58.72 8.86 10.57 6.42 2695 1025 94.93 56.78 8.75 18.36 12.36 2696 2943 97.32 43.93 8.21 15.16 13.46 2699 523 95.22 53.54 8.88 6.89 6.96 2710 106 100.00 80.19 9.42 18.71 14.98 2711 168 100.00 81.55 9.46 3.70 4.18 2712 256 100.00 89.45 5.86 13.44 5.34 2713 42 100.00 76.19 6.01 9.81 3.65 2714 331 100.00 76.13 3.93 10.98 4.41 2715 1094 99.73 71.76 9.03 8.92 6.80 2716 454 99.34 74.45 6.42 8.34 9.63 2717 12 91.67 100.00 9.48 6.99 5.88 2718 188 100.00 70.21 9.45 12.90 10.81 2719 710 98.87 67.46 6.53 8.59 9.27 2720 1086 99.82 77.72 9.80 10.68 11.77 2731 1853 99.19 70.75 8.82 15.94 13.64 2732 226 99.56 67.26 14.65 42.52 47.25 2811 1252 97.84 62.70 8.71 19.29 11.66 2812 761 100.00 74.64 9.27 23.64 19.38 2813 249 100.00 40.56 7.46 6.55 6.04 2891 605 98.35 79.01 8.51 23.30 15.21 2892 1035 98.65 59.52 8.49 14.98 13.02 2893 1451 99.93 69.19 11.21 17.69 16.74 2899 3145 98.63 71.64 10.26 22.56 16.08 2911 602 97.34 66.94 8.35 15.36 14.09 2912 1012 99.01 67.98 10.20 17.00 15.97 2913 481 98.34 75.68 10.10 11.59 9.19 2914 85 100.00 72.94 8.09 18.36 8.70 2915 343 100.00 87.17 11.48 21.32 16.73 2919 1148 99.91 70.03 7.26 11.80 13.95 2921 863 97.45 67.79 10.68 14.08 12.72 2922 784 100.00 75.13 9.21 18.36 13.59 2923 69 100.00 56.52 8.24 12.75 12.21 2924 371 97.57 77.09 11.64 21.72 17.16 2925 543 100.00 69.98 10.33 13.73 12.34 2926 600 95.67 66.50 7.49 12.02 14.59 2927 79 100.00 65.82 8.34 11.74 12.31 2929 1234 99.27 73.18 9.12 23.31 11.34 2930 615 100.00 68.13 9.47 19.40 16.10 3000 121 100.00 84.30 9.60 25.16 16.62 3110 1020 99.71 72.94 6.94 16.66 10.92 3120 1071 98.23 65.17 8.94 16.48 12.63 3130 589 100.00 74.87 9.31 14.38 8.54 3140 235 100.00 59.57 7.57 11.57 8.26 3150 341 100.00 71.26 8.96 21.57 12.71 3190 604 98.01 72.68 10.81 26.79 21.59 3210 532 100.00 72.93 8.78 18.15 15.16 3220 204 100.00 73.53 8.14 17.81 11.97 3230 159 100.00 75.47 11.29 23.77 20.25 3311 330 99.39 82.12 8.28 17.08 15.98 3312 218 94.95 83.94 10.05 12.48 8.31 3313 100 100.00 86.00 7.93 14.22 9.19 3320 105 99.05 84.76 7.74 11.93 12.58 3330 102 100.00 69.61 9.69 17.41 22.46 3410 113 100.00 60.18 10.45 48.00 48.67
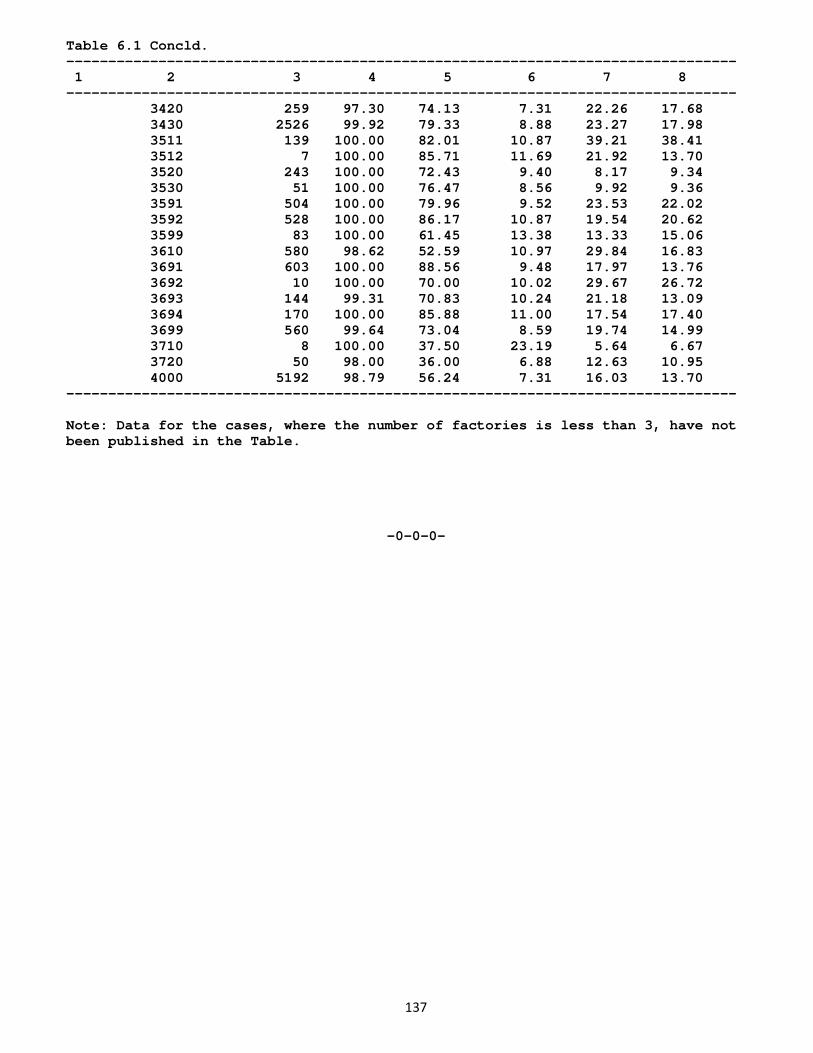
137
Table 6.1 Concld. -------------------------------------------------------------------------------- 1 2 3 4 5 6 7 8 -------------------------------------------------------------------------------- 3420 259 97.30 74.13 7.31 22.26 17.68 3430 2526 99.92 79.33 8.88 23.27 17.98 3511 139 100.00 82.01 10.87 39.21 38.41 3512 7 100.00 85.71 11.69 21.92 13.70 3520 243 100.00 72.43 9.40 8.17 9.34 3530 51 100.00 76.47 8.56 9.92 9.36 3591 504 100.00 79.96 9.52 23.53 22.02 3592 528 100.00 86.17 10.87 19.54 20.62 3599 83 100.00 61.45 13.38 13.33 15.06 3610 580 98.62 52.59 10.97 29.84 16.83 3691 603 100.00 88.56 9.48 17.97 13.76 3692 10 100.00 70.00 10.02 29.67 26.72 3693 144 99.31 70.83 10.24 21.18 13.09 3694 170 100.00 85.88 11.00 17.54 17.40 3699 560 99.64 73.04 8.59 19.74 14.99 3710 8 100.00 37.50 23.19 5.64 6.67 3720 50 98.00 36.00 6.88 12.63 10.95 4000 5192 98.79 56.24 7.31 16.03 13.70 -------------------------------------------------------------------------------- Note: Data for the cases, where the number of factories is less than 3, have not been published in the Table.
-0-0-0-
138
CHAPTER-VII
TREND TABLES
Sector-wise, state-wise and industry-wise trends in respect of various characteristics viz. average daily employment; wages/salaries per mandays worked; average labour cost; proportion of labour cost to total cost of production; absenteeism and labour turnover have been presented in Tables 7.1 to 7.6. A brief analysis of these data has been presented in the succeeding paragraphs. 7.1 Average Daily Employment
Table 7.1 depicts the trend in average daily employment of different categories of workers as well as all employees. At All India level, the average daily employment of all employees, all workers, directly employed men, women, children and contract workers generally increased over the preceding nine years from 1999-2000 to 2007-08. The average daily employment of contract workers was reported to have gone up steadily. The average daily employment of all employees in respect of all the three sectors viz. Private Sector, Public Sector and Joint Sector has gone up to 102.02 lakh, 0.69 lakh and 1.8 lakh respectively during 2007-08 from 101.28 lakh, 0.61 lakh and 1.4 lakh in the year 2006-07.
In comparison with the previous year i.e. 2006-07, the overall Average
Daily employment has increased in 44 industry groups during 2007-08. However, 20 industry groups registered a decline in average daily employment figures as compared to the previous year. A decreasing trend in respect of women workers has been noticed in 30 industry groups, the highest being in ‘171-Spinning, Weaving and finishing of textiles’ followed by ‘160-Manufacture of tobacco products, whereas it witnessed an increasing trend in remaining industry groups. Average daily employment has increased in the case of contract workers in 41 industry groups, highest being in industry group ’343-Manufacture of parts and accessories for motor vehicles and their engines’ followed by the industry groups, ‘281-Manufacture of structural metal products, tanks, reservoirs and steam generators’, ‘232-Manufacture of refined petroleum products’ and ‘242-Manuacture of other chemical products’, but it increased in respect of male workers in 45 industry groups.
The average daily employment of contract workers has increased in all
the States except in States of Punjab, Nagaland, Meghalaya, Assam, West Bengal, Jharkhand, Daman & Diu, Andhra Pradesh and Kerala. 7.2 Wage/Salaries Rates
Table 7.2 presents the trend in wages/salaries per manday worked by all categories of employees by industry, State and Sectors. It is observed that there has been an increase in wage rates of all categories of employees. The wage rates of all employees increased by 23.8 per cent, 9.5 per cent and 14.0 per cent respectively in the Public Sector, Joint Sector and Private Sectors. 7.3 Trend in Average Labour Cost
Table 7.3 gives the trend in average labour cost per manday worked by
employees at industry, State and Sector level. The average labour cost per manday worked by all employees at an all India level worked out to be Rs. 397.55 in 2007-08 as compared to previous year’s figure of Rs. 351.26, resulting in an increase of 13.18 per cent. It is observed that there has
139
been an increase in average labour cost in more or less all the industry groups and States. The average labour cost has registered an increasing trend in the Public and Private and Joint Sectors. The highest increase in average labour cost was recorded at about 13.05 per cent in the Private Sector, followed by 9.93 per cent in Public Sector and 3.04 per cent in the Joint Sector in 2007-08.
7.4 Percentage of Labour Cost on Employees to Total Cost of
production
Table 7.4 presents the trend in the percentage of labour cost to total cost of production by Industry, State and Sectors. At all India level, there has been a decreasing trend in the percentage of labour cost to total cost of production in 2007-08 (5.41 per cent). At the sector level too, more or less, a similar pattern is witnessed in all the three sectors. The percentage of labour cost to total cost of production in Public Sector, Joint sector and Private Sector decreased from 3.34 per cent to 3.26 per cent, 4.54 per cent to 4.51 per cent and 5.63 per cent to 5.50 per cent in 2007-08.
There has been a declining trend in the percentage of labour cost to total cost of production in 31 industry groups during 2007-08 as compared to previous year, the highest being in industry group ‘142-Mining and Quarrying’. However, the remaining industry groups exhibited more or less increasing pattern. But, the percentage of labour cost to total cost of production in the industry group ‘333-Manufacture of Watches & Clocks’ registered sharp increase from 16.49 per cent in 2006-07 to 25.57 per cent in 2007-08. As many as 22 states registered declining trend in percentage of labour cost to total cost of production, the most prominent being in Chandigarh where it declined from 14.24 per cent in 2006-07 to 8.87 per cent in 2007-08. 7.5 Percentage of Absenteeism and Labour Turnover
Table 7.5 depicts the trend in the percentage of absenteeism and labour turnover by Industry, State and Sectors. At all India level, the accession rate has increased from previous year’s level of 20.14 per cent to 20.94 per cent in 2007. The absenteeism rate also increased from 7.99 in 2006 to 8.34 in 2007 and the separation rate increased from 16.61 per cent in 2006 to 18.11 per cent during the same period. The trend in absenteeism rates in public sector has increased compared to previous year while percentage of Labour Turnover rate accession shows declining trends in Public and Private sectors. In Public sector, the percentage of absenteeism, accession and separation stood at 7.80 per cent, 8.85 per cent and 11.48 per cent as compared to previous year’s level of 3.46 per cent, 9.47 per cent and 12.68 per cent, respectively. In Private sector also, the percentage of absenteeism, accession and separation was recorded as 8.36 per cent, 21.43 per cent and 18.42 per cent in 2007 as compared to previous year’s 8.54 per cent, 20.68 per cent and 16.76 per cent respectively. The Percentage of absenteeism rate in the Joint sector increased from previous year’s level of 6.46 per cent to 8.34 per cent whereas the accession and separation rates exhibited a decreasing trend during the same period.
The trend is increasing in absenteeism rates at all India level in 24
industry groups, the highest being in industry group ‘353-Manufacture of aircraft and spacecraft’ and decreasing in 40 industry groups, registering the highest decline in the industry group, ‘141-Quarrying of Stones, Sand and Clay’. In the industry group ‘141-Quarrying of Stones, Sand and Clay’, the labour turnover rates in accession and separation registered a decline from 50.0 per cent and 59.09 per cent to 12.41 per cent and 10.34 per cent.
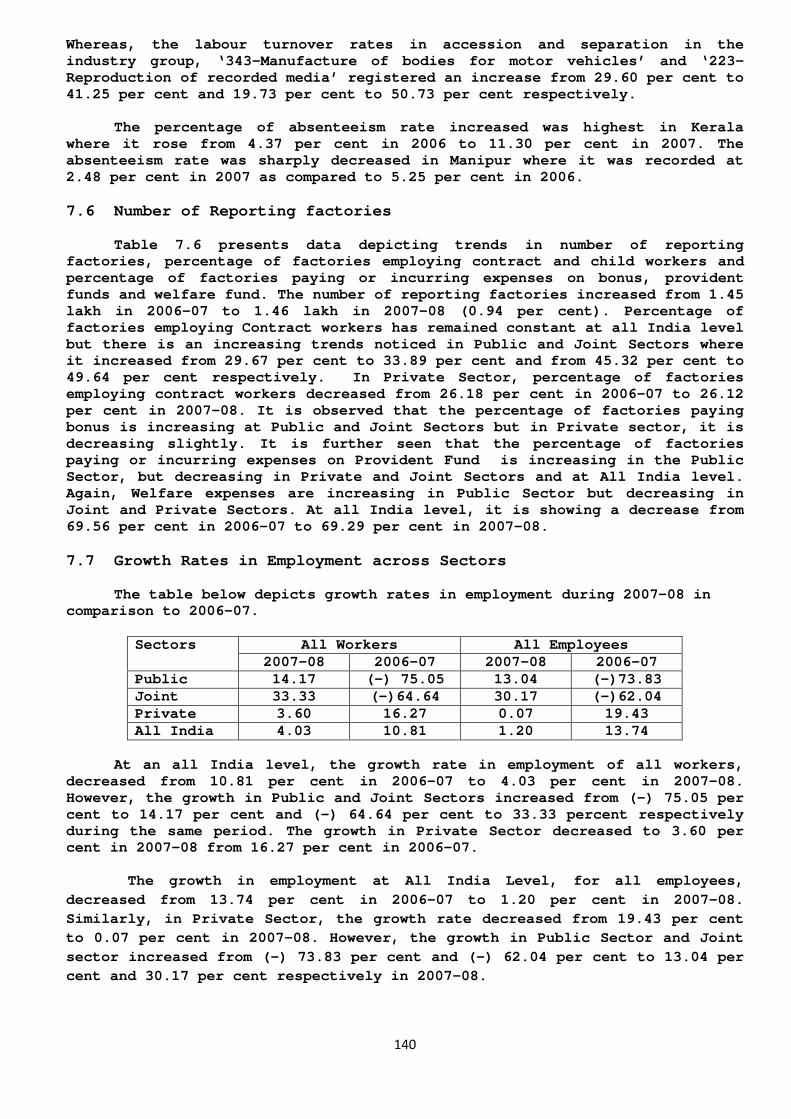
140
Whereas, the labour turnover rates in accession and separation in the industry group, ‘343-Manufacture of bodies for motor vehicles’ and ‘223-Reproduction of recorded media’ registered an increase from 29.60 per cent to 41.25 per cent and 19.73 per cent to 50.73 per cent respectively.
The percentage of absenteeism rate increased was highest in Kerala
where it rose from 4.37 per cent in 2006 to 11.30 per cent in 2007. The absenteeism rate was sharply decreased in Manipur where it was recorded at 2.48 per cent in 2007 as compared to 5.25 per cent in 2006.
7.6 Number of Reporting factories
Table 7.6 presents data depicting trends in number of reporting factories, percentage of factories employing contract and child workers and percentage of factories paying or incurring expenses on bonus, provident funds and welfare fund. The number of reporting factories increased from 1.45 lakh in 2006-07 to 1.46 lakh in 2007-08 (0.94 per cent). Percentage of factories employing Contract workers has remained constant at all India level but there is an increasing trends noticed in Public and Joint Sectors where it increased from 29.67 per cent to 33.89 per cent and from 45.32 per cent to 49.64 per cent respectively. In Private Sector, percentage of factories employing contract workers decreased from 26.18 per cent in 2006-07 to 26.12 per cent in 2007-08. It is observed that the percentage of factories paying bonus is increasing at Public and Joint Sectors but in Private sector, it is decreasing slightly. It is further seen that the percentage of factories paying or incurring expenses on Provident Fund is increasing in the Public Sector, but decreasing in Private and Joint Sectors and at All India level. Again, Welfare expenses are increasing in Public Sector but decreasing in Joint and Private Sectors. At all India level, it is showing a decrease from 69.56 per cent in 2006-07 to 69.29 per cent in 2007-08.
7.7 Growth Rates in Employment across Sectors
The table below depicts growth rates in employment during 2007-08 in comparison to 2006-07.
Sectors All Workers All Employees
2007-08 2006-07 2007-08 2006-07 Public 14.17 (-) 75.05 13.04 (-)73.83 Joint 33.33 (-)64.64 30.17 (-)62.04 Private 3.60 16.27 0.07 19.43 All India 4.03 10.81 1.20 13.74
At an all India level, the growth rate in employment of all workers,
decreased from 10.81 per cent in 2006-07 to 4.03 per cent in 2007-08. However, the growth in Public and Joint Sectors increased from (-) 75.05 per cent to 14.17 per cent and (-) 64.64 per cent to 33.33 percent respectively during the same period. The growth in Private Sector decreased to 3.60 per cent in 2007-08 from 16.27 per cent in 2006-07.
The growth in employment at All India Level, for all employees, decreased from 13.74 per cent in 2006-07 to 1.20 per cent in 2007-08. Similarly, in Private Sector, the growth rate decreased from 19.43 per cent to 0.07 per cent in 2007-08. However, the growth in Public Sector and Joint sector increased from (-) 73.83 per cent and (-) 62.04 per cent to 13.04 per cent and 30.17 per cent respectively in 2007-08.
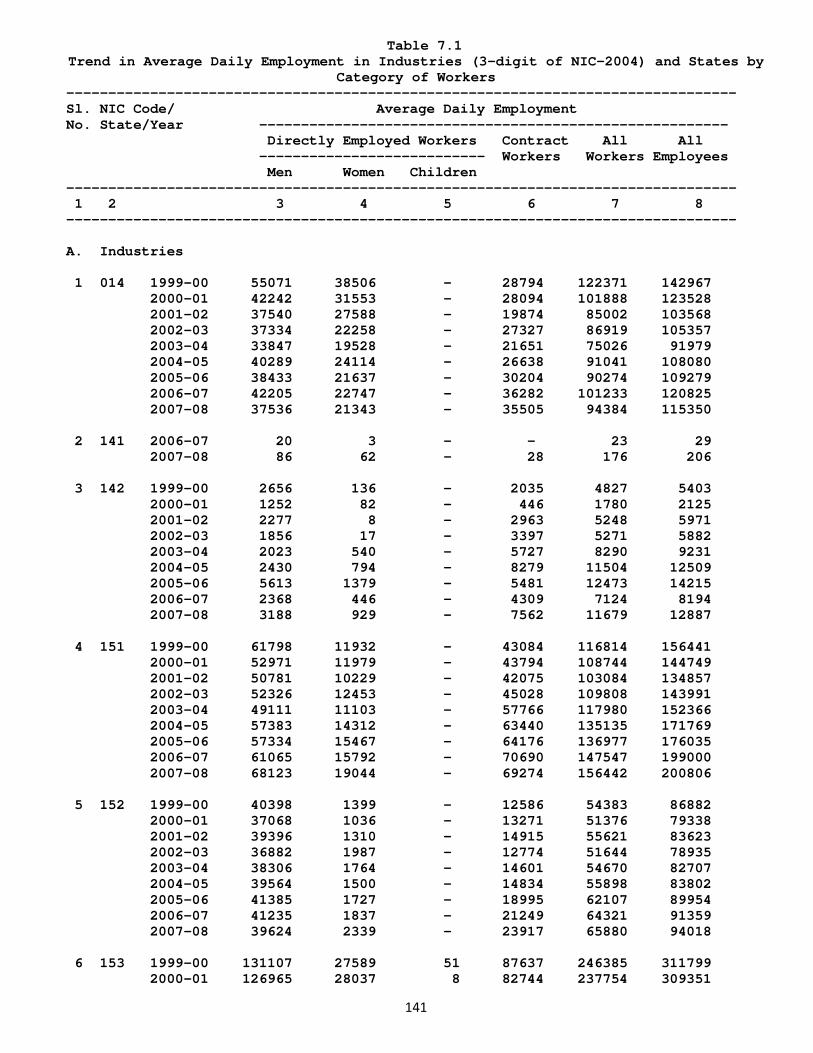
141
Table 7.1 Trend in Average Daily Employment in Industries (3-digit of NIC-2004) and States by
Category of Workers -------------------------------------------------------------------------------- Sl. NIC Code/ Average Daily Employment No. State/Year -------------------------------------------------------- Directly Employed Workers Contract All All --------------------------- Workers Workers Employees Men Women Children -------------------------------------------------------------------------------- 1 2 3 4 5 6 7 8 -------------------------------------------------------------------------------- A. Industries 1 014 1999-00 55071 38506 - 28794 122371 142967 2000-01 42242 31553 - 28094 101888 123528 2001-02 37540 27588 - 19874 85002 103568 2002-03 37334 22258 - 27327 86919 105357 2003-04 33847 19528 - 21651 75026 91979 2004-05 40289 24114 - 26638 91041 108080 2005-06 38433 21637 - 30204 90274 109279 2006-07 42205 22747 - 36282 101233 120825 2007-08 37536 21343 - 35505 94384 115350 2 141 2006-07 20 3 - - 23 29 2007-08 86 62 - 28 176 206 3 142 1999-00 2656 136 - 2035 4827 5403 2000-01 1252 82 - 446 1780 2125 2001-02 2277 8 - 2963 5248 5971 2002-03 1856 17 - 3397 5271 5882 2003-04 2023 540 - 5727 8290 9231 2004-05 2430 794 - 8279 11504 12509 2005-06 5613 1379 - 5481 12473 14215 2006-07 2368 446 - 4309 7124 8194 2007-08 3188 929 - 7562 11679 12887 4 151 1999-00 61798 11932 - 43084 116814 156441 2000-01 52971 11979 - 43794 108744 144749 2001-02 50781 10229 - 42075 103084 134857 2002-03 52326 12453 - 45028 109808 143991 2003-04 49111 11103 - 57766 117980 152366 2004-05 57383 14312 - 63440 135135 171769 2005-06 57334 15467 - 64176 136977 176035 2006-07 61065 15792 - 70690 147547 199000 2007-08 68123 19044 - 69274 156442 200806 5 152 1999-00 40398 1399 - 12586 54383 86882 2000-01 37068 1036 - 13271 51376 79338 2001-02 39396 1310 - 14915 55621 83623 2002-03 36882 1987 - 12774 51644 78935 2003-04 38306 1764 - 14601 54670 82707 2004-05 39564 1500 - 14834 55898 83802 2005-06 41385 1727 - 18995 62107 89954 2006-07 41235 1837 - 21249 64321 91359 2007-08 39624 2339 - 23917 65880 94018 6 153 1999-00 131107 27589 51 87637 246385 311799 2000-01 126965 28037 8 82744 237754 309351
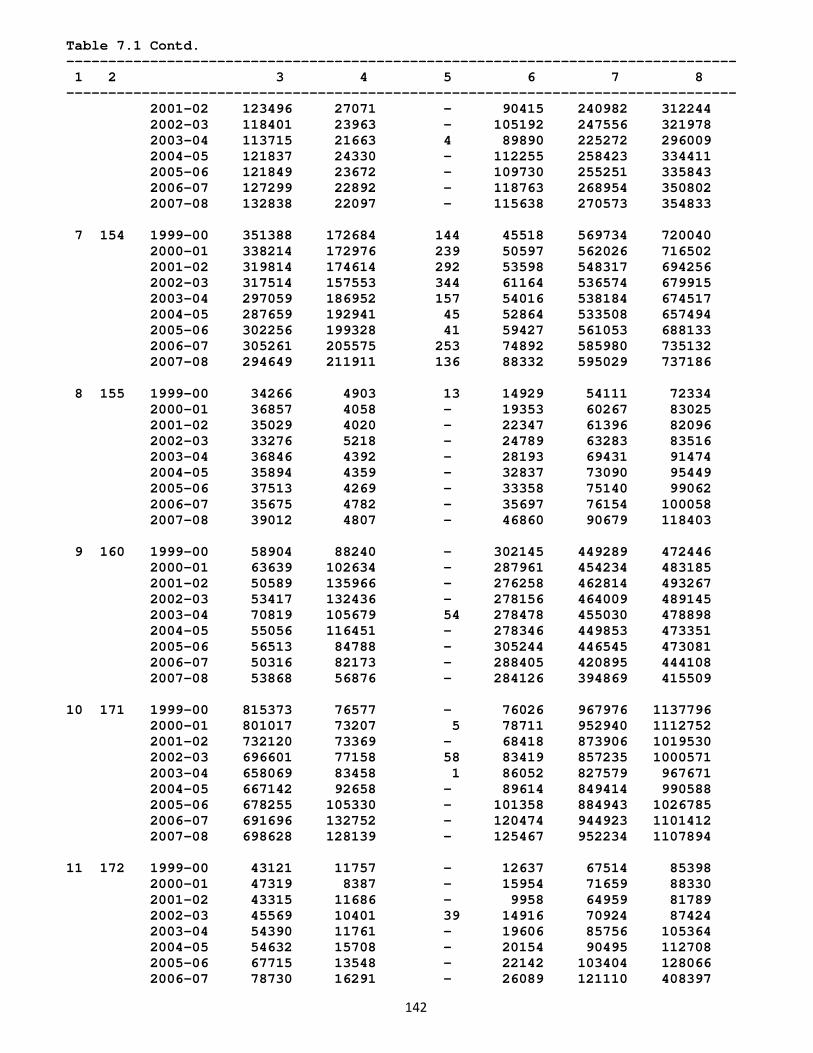
142
Table 7.1 Contd. -------------------------------------------------------------------------------- 1 2 3 4 5 6 7 8 -------------------------------------------------------------------------------- 2001-02 123496 27071 - 90415 240982 312244 2002-03 118401 23963 - 105192 247556 321978 2003-04 113715 21663 4 89890 225272 296009 2004-05 121837 24330 - 112255 258423 334411 2005-06 121849 23672 - 109730 255251 335843 2006-07 127299 22892 - 118763 268954 350802 2007-08 132838 22097 - 115638 270573 354833 7 154 1999-00 351388 172684 144 45518 569734 720040 2000-01 338214 172976 239 50597 562026 716502 2001-02 319814 174614 292 53598 548317 694256 2002-03 317514 157553 344 61164 536574 679915 2003-04 297059 186952 157 54016 538184 674517 2004-05 287659 192941 45 52864 533508 657494 2005-06 302256 199328 41 59427 561053 688133 2006-07 305261 205575 253 74892 585980 735132 2007-08 294649 211911 136 88332 595029 737186 8 155 1999-00 34266 4903 13 14929 54111 72334 2000-01 36857 4058 - 19353 60267 83025 2001-02 35029 4020 - 22347 61396 82096 2002-03 33276 5218 - 24789 63283 83516 2003-04 36846 4392 - 28193 69431 91474 2004-05 35894 4359 - 32837 73090 95449 2005-06 37513 4269 - 33358 75140 99062 2006-07 35675 4782 - 35697 76154 100058 2007-08 39012 4807 - 46860 90679 118403 9 160 1999-00 58904 88240 - 302145 449289 472446 2000-01 63639 102634 - 287961 454234 483185 2001-02 50589 135966 - 276258 462814 493267 2002-03 53417 132436 - 278156 464009 489145 2003-04 70819 105679 54 278478 455030 478898 2004-05 55056 116451 - 278346 449853 473351 2005-06 56513 84788 - 305244 446545 473081 2006-07 50316 82173 - 288405 420895 444108 2007-08 53868 56876 - 284126 394869 415509 10 171 1999-00 815373 76577 - 76026 967976 1137796 2000-01 801017 73207 5 78711 952940 1112752 2001-02 732120 73369 - 68418 873906 1019530 2002-03 696601 77158 58 83419 857235 1000571 2003-04 658069 83458 1 86052 827579 967671 2004-05 667142 92658 - 89614 849414 990588 2005-06 678255 105330 - 101358 884943 1026785 2006-07 691696 132752 - 120474 944923 1101412 2007-08 698628 128139 - 125467 952234 1107894 11 172 1999-00 43121 11757 - 12637 67514 85398 2000-01 47319 8387 - 15954 71659 88330 2001-02 43315 11686 - 9958 64959 81789 2002-03 45569 10401 39 14916 70924 87424 2003-04 54390 11761 - 19606 85756 105364 2004-05 54632 15708 - 20154 90495 112708 2005-06 67715 13548 - 22142 103404 128066 2006-07 78730 16291 - 26089 121110 408397
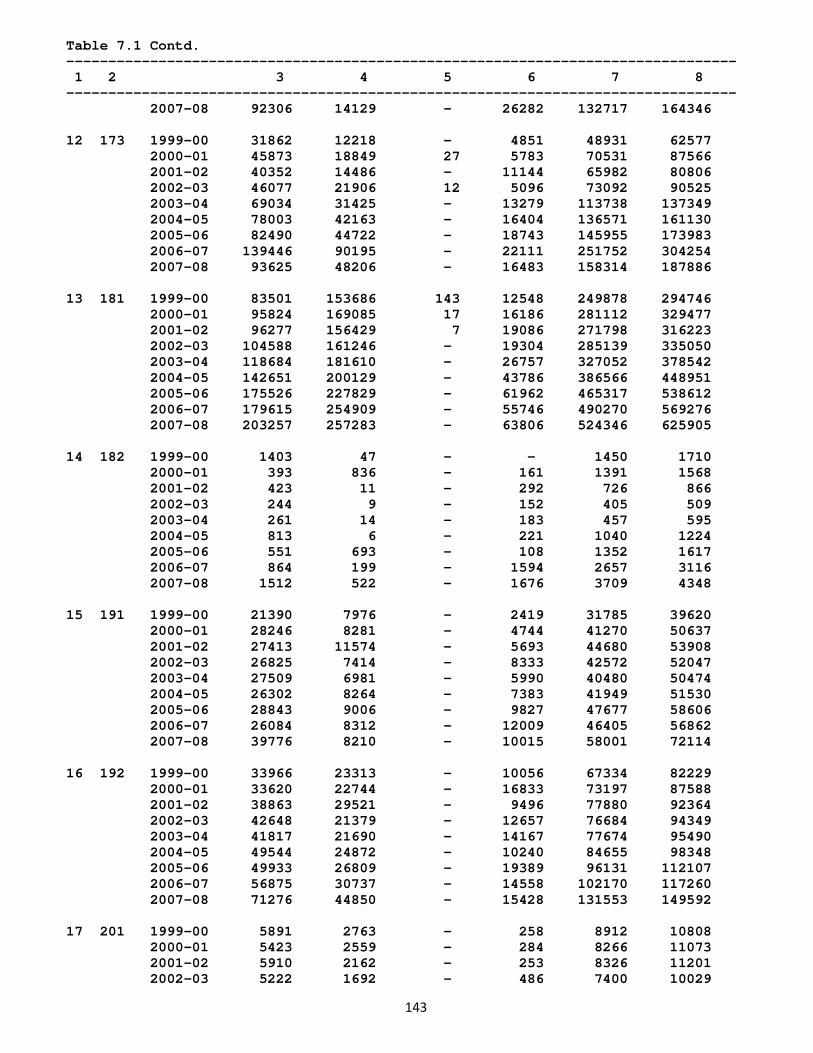
143
Table 7.1 Contd. -------------------------------------------------------------------------------- 1 2 3 4 5 6 7 8 -------------------------------------------------------------------------------- 2007-08 92306 14129 - 26282 132717 164346 12 173 1999-00 31862 12218 - 4851 48931 62577 2000-01 45873 18849 27 5783 70531 87566 2001-02 40352 14486 - 11144 65982 80806 2002-03 46077 21906 12 5096 73092 90525 2003-04 69034 31425 - 13279 113738 137349 2004-05 78003 42163 - 16404 136571 161130 2005-06 82490 44722 - 18743 145955 173983 2006-07 139446 90195 - 22111 251752 304254 2007-08 93625 48206 - 16483 158314 187886 13 181 1999-00 83501 153686 143 12548 249878 294746 2000-01 95824 169085 17 16186 281112 329477 2001-02 96277 156429 7 19086 271798 316223 2002-03 104588 161246 - 19304 285139 335050 2003-04 118684 181610 - 26757 327052 378542 2004-05 142651 200129 - 43786 386566 448951 2005-06 175526 227829 - 61962 465317 538612 2006-07 179615 254909 - 55746 490270 569276 2007-08 203257 257283 - 63806 524346 625905 14 182 1999-00 1403 47 - - 1450 1710 2000-01 393 836 - 161 1391 1568 2001-02 423 11 - 292 726 866 2002-03 244 9 - 152 405 509 2003-04 261 14 - 183 457 595 2004-05 813 6 - 221 1040 1224 2005-06 551 693 - 108 1352 1617 2006-07 864 199 - 1594 2657 3116 2007-08 1512 522 - 1676 3709 4348 15 191 1999-00 21390 7976 - 2419 31785 39620 2000-01 28246 8281 - 4744 41270 50637 2001-02 27413 11574 - 5693 44680 53908 2002-03 26825 7414 - 8333 42572 52047 2003-04 27509 6981 - 5990 40480 50474 2004-05 26302 8264 - 7383 41949 51530 2005-06 28843 9006 - 9827 47677 58606 2006-07 26084 8312 - 12009 46405 56862 2007-08 39776 8210 - 10015 58001 72114 16 192 1999-00 33966 23313 - 10056 67334 82229 2000-01 33620 22744 - 16833 73197 87588 2001-02 38863 29521 - 9496 77880 92364 2002-03 42648 21379 - 12657 76684 94349 2003-04 41817 21690 - 14167 77674 95490 2004-05 49544 24872 - 10240 84655 98348 2005-06 49933 26809 - 19389 96131 112107 2006-07 56875 30737 - 14558 102170 117260 2007-08 71276 44850 - 15428 131553 149592 17 201 1999-00 5891 2763 - 258 8912 10808 2000-01 5423 2559 - 284 8266 11073 2001-02 5910 2162 - 253 8326 11201 2002-03 5222 1692 - 486 7400 10029
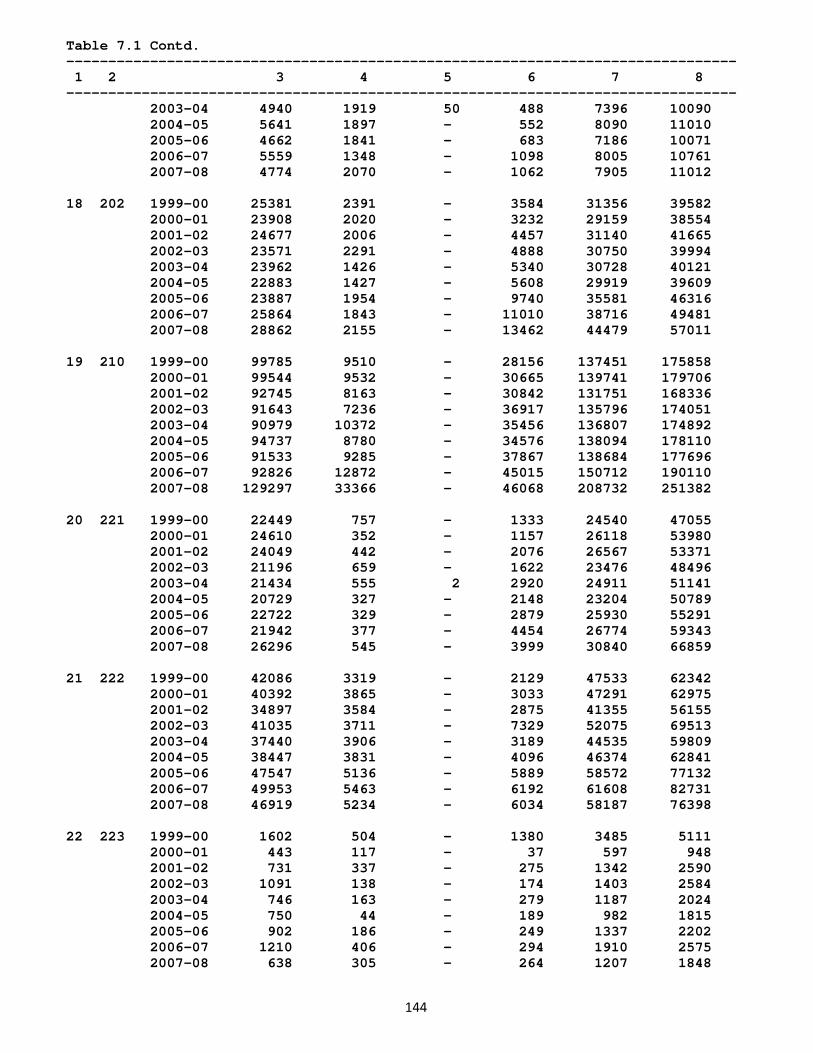
144
Table 7.1 Contd. -------------------------------------------------------------------------------- 1 2 3 4 5 6 7 8 -------------------------------------------------------------------------------- 2003-04 4940 1919 50 488 7396 10090 2004-05 5641 1897 - 552 8090 11010 2005-06 4662 1841 - 683 7186 10071 2006-07 5559 1348 - 1098 8005 10761 2007-08 4774 2070 - 1062 7905 11012 18 202 1999-00 25381 2391 - 3584 31356 39582 2000-01 23908 2020 - 3232 29159 38554 2001-02 24677 2006 - 4457 31140 41665 2002-03 23571 2291 - 4888 30750 39994 2003-04 23962 1426 - 5340 30728 40121 2004-05 22883 1427 - 5608 29919 39609 2005-06 23887 1954 - 9740 35581 46316 2006-07 25864 1843 - 11010 38716 49481 2007-08 28862 2155 - 13462 44479 57011 19 210 1999-00 99785 9510 - 28156 137451 175858 2000-01 99544 9532 - 30665 139741 179706 2001-02 92745 8163 - 30842 131751 168336 2002-03 91643 7236 - 36917 135796 174051 2003-04 90979 10372 - 35456 136807 174892 2004-05 94737 8780 - 34576 138094 178110 2005-06 91533 9285 - 37867 138684 177696 2006-07 92826 12872 - 45015 150712 190110 2007-08 129297 33366 - 46068 208732 251382 20 221 1999-00 22449 757 - 1333 24540 47055 2000-01 24610 352 - 1157 26118 53980 2001-02 24049 442 - 2076 26567 53371 2002-03 21196 659 - 1622 23476 48496 2003-04 21434 555 2 2920 24911 51141 2004-05 20729 327 - 2148 23204 50789 2005-06 22722 329 - 2879 25930 55291 2006-07 21942 377 - 4454 26774 59343 2007-08 26296 545 - 3999 30840 66859 21 222 1999-00 42086 3319 - 2129 47533 62342 2000-01 40392 3865 - 3033 47291 62975 2001-02 34897 3584 - 2875 41355 56155 2002-03 41035 3711 - 7329 52075 69513 2003-04 37440 3906 - 3189 44535 59809 2004-05 38447 3831 - 4096 46374 62841 2005-06 47547 5136 - 5889 58572 77132 2006-07 49953 5463 - 6192 61608 82731 2007-08 46919 5234 - 6034 58187 76398 22 223 1999-00 1602 504 - 1380 3485 5111 2000-01 443 117 - 37 597 948 2001-02 731 337 - 275 1342 2590 2002-03 1091 138 - 174 1403 2584 2003-04 746 163 - 279 1187 2024 2004-05 750 44 - 189 982 1815 2005-06 902 186 - 249 1337 2202 2006-07 1210 406 - 294 1910 2575 2007-08 638 305 - 264 1207 1848
145
Table 7.1 Contd. -------------------------------------------------------------------------------- 1 2 3 4 5 6 7 8 -------------------------------------------------------------------------------- 23 231 1999-00 18182 1516 - 2465 22163 28189 2000-01 16620 1067 - 2175 19862 26555 2001-02 16126 1140 - 2473 19739 24284 2002-03 14551 943 - 2415 17909 23053 2003-04 15722 1304 - 3713 20739 25900 2004-05 17216 940 - 7021 25178 31646 2005-06 16732 877 - 6421 24030 30396 2006-07 16904 882 - 10205 27992 33908 2007-08 16891 863 - 8484 26238 32887 24 232 1999-00 18372 331 - 12328 31031 43699 2000-01 19976 302 - 6874 27151 41324 2001-02 18776 200 - 12780 31755 44319 2002-03 18054 131 - 15746 33932 46887 2003-04 18711 187 - 15352 34250 48171 2004-05 19064 171 - 15635 34871 47824 2005-06 18757 271 - 21992 41020 54329 2006-07 18414 197 - 22387 40998 56151 2007-08 18440 205 - 41389 60035 76123 25 241 1999-00 121919 1805 - 38001 161725 248118 2000-01 121282 1957 - 43282 166521 251863 2001-02 106601 1299 - 42011 149911 231006 2002-03 98318 1038 - 38809 138164 208918 2003-04 88040 1361 - 41431 130832 197639 2004-05 88638 1659 - 45655 135952 201697 2005-06 85149 1555 - 49714 136419 201243 2006-07 91376 1361 - 52048 144786 213331 2007-08 81176 1922 - 57269 140368 208375 26 242 1999-00 206631 99645 784 63193 370253 542951 2000-01 203725 89056 - 63282 356064 520855 2001-02 189563 81370 - 65945 336877 501028 2002-03 184674 84264 27 85323 354288 520655 2003-04 183191 77509 1 85674 346374 516841 2004-05 187644 83340 - 108111 379095 556854 2005-06 204495 77236 - 119988 401719 596034 2006-07 214816 84131 - 129754 428702 639071 2007-08 222327 87549 - 147696 457571 668319 27 243 1999-00 17556 44 - 3668 21268 27094 2000-01 18064 65 - 2815 20944 26645 2001-02 18960 203 - 3860 23024 29210 2002-03 17328 99 - 2485 19913 25539 2003-04 17162 59 - 3158 20379 25961 2004-05 16996 769 - 3238 21003 26355 2005-06 16747 77 - 4750 21573 26612 2006-07 16381 109 - 3287 19777 24681 2007-08 10248 72 - 2764 13084 16250 28 251 1999-00 85040 5108 - 8180 98328 130313 2000-01 67733 5154 - 7412 80299 106100 2001-02 67753 4617 - 6915 79284 105152 2002-03 68161 5475 - 7190 80825 105375 2003-04 67996 4385 - 16437 88817 114585 2004-05 68121 5564 - 15143 88829 115481
146
Table 7.1 Contd. -------------------------------------------------------------------------------- 1 2 3 4 5 6 7 8 -------------------------------------------------------------------------------- 2005-06 70547 5215 - 16374 92136 119137 2006-07 72466 5713 - 21161 99340 128508 2007-08 75288 6107 - 22268 103663 131986 29 252 1999-00 83242 8343 - 13763 105348 142022 2000-01 81762 7820 124 17481 107187 146207 2001-02 91330 8106 - 22596 122031 164303 2002-03 86392 9412 - 20406 116210 156316 2003-04 87748 7531 - 26437 121717 164069 2004-05 94036 10267 - 35615 139918 188995 2005-06 97822 9544 - 42292 149658 196781 2006-07 110509 10966 - 43522 164997 214493 2007-08 121342 11181 - 39685 172208 228299 30 261 1999-00 29773 1217 - 9272 40261 50351 2000-01 28666 2640 - 9137 40443 50715 2001-02 28098 1233 - 15580 44911 55330 2002-03 29079 1170 - 8439 38688 48287 2003-04 27060 817 - 9642 37519 46969 2004-05 29479 1328 - 10467 41274 52099 2005-06 28856 1519 - 14843 45218 54903 2006-07 25980 1396 - 16766 44142 53917 2007-08 25987 910 - 13375 40272 50294 31 269 1999-00 182782 25300 - 111625 319707 400761 2000-01 178765 22323 14 105688 306790 393155 2001-02 182984 20662 2 125518 329166 411642 2002-03 248676 83364 4 134127 466171 549430 2003-04 168687 20678 111 134481 323958 408405 2004-05 189030 22709 - 169598 381337 472330 2005-06 187194 21028 - 217141 425364 522632 2006-07 204256 21650 - 276797 502702 611090 2007-08 204549 22652 - 285029 512231 624611 32 271 1999-00 255650 6985 - 68426 331061 429726 2000-01 211897 3745 100 67167 282909 379884 2001-02 199713 3673 - 64250 267637 367066 2002-03 196846 2960 - 64729 264535 357802 2003-04 190755 2413 - 75291 268459 364801 2004-05 204584 2184 - 88204 294973 396365 2005-06 212152 2198 - 108624 322974 429951 2006-07 236582 3741 - 150844 391167 513400 2007-08 263488 4229 - 168234 435950 564208 33 272 1999-00 48401 950 - 13873 63225 87388 2000-01 46638 560 - 12649 59847 80439 2001-02 42090 965 - 16419 59474 77540 2002-03 38073 822 - 13515 52410 68574 2003-04 38940 966 - 14950 54856 73249 2004-05 38659 631 - 18173 57463 79863 2005-06 43673 955 - 14360 58988 81106 2006-07 49713 1357 - 20493 71563 95807 2007-08 43661 1374 - 20980 66014 88356 34 273 1999-00 66824 823 - 17684 85331 113000 2000-01 58069 610 - 19334 78013 103407
147
Table 7.1 Contd. -------------------------------------------------------------------------------- 1 2 3 4 5 6 7 8 -------------------------------------------------------------------------------- 2001-02 53887 581 - 19295 73763 97791 2002-03 60987 506 - 21573 83067 108392 2003-04 54115 778 - 22072 76965 101365 2004-05 53328 887 - 24608 78824 101073 2005-06 63232 920 - 41658 105811 132030 2006-07 75590 792 - 50982 127365 159575 2007-08 75163 2470 - 48627 126260 157139 35 281 1999-00 48914 873 145 27349 77281 108000 2000-01 47192 657 55 32382 80286 108315 2001-02 44860 914 - 21464 67237 94548 2002-03 38768 682 - 25401 64851 93543 2003-04 36021 708 - 27734 64463 90275 2004-05 43784 470 - 39236 83490 111492 2005-06 44394 367 - 57068 101829 132889 2006-07 58894 872 - 67412 127178 167152 2007-08 69227 1326 - 87396 157948 206233 36 289 1999-00 107229 4490 10 18639 130368 172004 2000-01 106946 3345 17 28243 138551 186416 2001-02 95188 4153 - 31820 131161 172616 2002-03 99831 4173 - 41281 145284 190443 2003-04 99845 3595 - 44929 148369 192189 2004-05 105378 4273 - 50600 160251 208134 2005-06 124856 5166 - 58052 188074 239665 2006-07 142113 5078 - 73959 221150 280635 2007-08 153803 9185 - 84628 247616 315406 37 291 1999-00 114014 1458 - 13806 129278 211215 2000-01 106715 1273 - 14627 122615 193594 2001-02 105140 1782 - 19813 126735 196424 2002-03 106859 1538 - 19392 127789 197874 2003-04 99702 1399 - 21615 122716 191017 2004-05 103574 1860 - 31864 137298 208089 2005-06 107148 1626 - 34566 143340 219044 2006-07 118455 1486 - 47638 167579 247466 2007-08 117582 1260 - 46931 165773 249862 38 292 1999-00 126675 1334 - 10818 138827 214902 2000-01 115059 1516 - 12666 129241 196149 2001-02 99390 1774 - 16380 117543 181815 2002-03 95329 2168 - 17937 115434 173207 2003-04 97945 1457 6 19228 118636 177279 2004-05 108618 1973 - 28647 139238 200435 2005-06 114371 2274 - 31009 147654 213426 2006-07 123597 2573 - 39935 166105 239638 2007-08 148088 1951 - 47177 197215 279015 39 293 1999-00 24609 2766 - 3056 30431 42713 2000-01 21799 1546 - 2633 25979 36986 2001-02 17975 1852 - 1826 21653 30659 2002-03 19738 1917 - 3705 25359 34163 2003-04 15883 1823 - 3984 21689 29650 2004-05 15732 1759 - 4146 21638 29524 2005-06 15865 2294 - 6041 24200 32115 2006-07 17055 2226 - 9132 28414 35808
148
Table 7.1 Contd. -------------------------------------------------------------------------------- 1 2 3 4 5 6 7 8 -------------------------------------------------------------------------------- 2007-08 15893 1809 - 9531 27233 35207 40 300 1999-00 3876 3168 - 3701 10744 17645 2000-01 4698 1626 - 5430 11753 19343 2001-02 6206 1498 - 4690 12394 19709 2002-03 6400 1297 - 2097 9795 17831 2003-04 7200 1889 - 2964 12053 21310 2004-05 8441 1847 - 4854 15142 25850 2005-06 8976 1812 - 3580 14368 21776 2006-07 7723 2149 - 8421 18293 26179 2007-08 8786 2240 - 6830 17856 28643 41 311 1999-00 45265 1945 - 6288 53499 81520 2000-01 44380 3413 - 3934 51727 78240 2001-02 36853 1362 - 6031 44246 68718 2002-03 35947 1276 3 7267 44493 68648 2003-04 35984 1532 - 6462 43977 67344 2004-05 38709 1659 - 10312 50681 72270 2005-06 41091 1942 - 15173 58206 82232 2006-07 46988 3548 - 20309 70845 105598 2007-08 48635 2417 - 22763 73815 106260 42 312 1999-00 31360 3771 - 2848 37979 57457 2000-01 24740 3042 - 3455 31236 48760 2001-02 25318 3009 - 3084 31411 49678 2002-03 25405 2586 - 5643 33634 50409 2003-04 25683 2740 - 6549 34972 51752 2004-05 27221 3476 - 7991 38688 56998 2005-06 28674 6212 - 15124 50010 70745 2006-07 28331 4432 - 18517 51280 71210 2007-08 37380 6789 - 23906 68075 93206 43 313 1999-00 23769 867 - 4536 29172 44310 2000-01 20880 516 - 5198 26593 36194 2001-02 22257 644 - 4516 27417 39541 2002-03 20566 728 - 5372 26666 37077 2003-04 18181 682 - 5395 24259 34037 2004-05 16605 753 - 6588 23945 33161 2005-06 18664 566 - 8127 27357 36246 2006-07 18852 687 - 9694 29233 39333 2007-08 20432 872 - 11685 32989 43795 44 314 1999-00 10235 711 - 1592 12538 17748 2000-01 9732 1917 - 3066 14714 20574 2001-02 11033 347 - 3499 14879 20224 2002-03 10781 505 - 4085 15371 20898 2003-04 9029 575 - 3790 13394 19550 2004-05 8190 833 - 4883 13906 19878 2005-06 8259 368 - 5135 13762 19497 2006-07 9831 410 - 3924 14165 20481 2007-08 10875 1004 - 4473 16353 23145 45 315 1999-00 13330 2462 - 2344 18136 24124 2000-01 12986 2282 9 2605 17882 22838 2001-02 10345 2069 - 3854 16268 20937 2002-03 11513 2135 - 4619 18267 23623
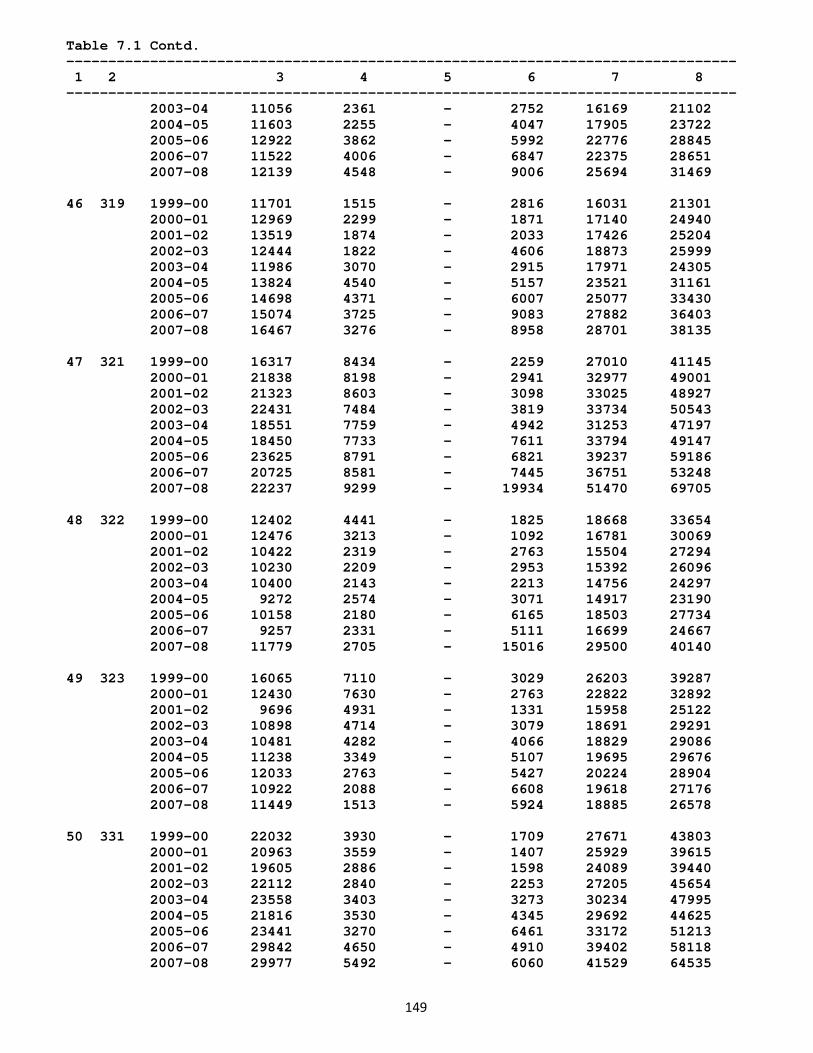
149
Table 7.1 Contd. -------------------------------------------------------------------------------- 1 2 3 4 5 6 7 8 -------------------------------------------------------------------------------- 2003-04 11056 2361 - 2752 16169 21102 2004-05 11603 2255 - 4047 17905 23722 2005-06 12922 3862 - 5992 22776 28845 2006-07 11522 4006 - 6847 22375 28651 2007-08 12139 4548 - 9006 25694 31469 46 319 1999-00 11701 1515 - 2816 16031 21301 2000-01 12969 2299 - 1871 17140 24940 2001-02 13519 1874 - 2033 17426 25204 2002-03 12444 1822 - 4606 18873 25999 2003-04 11986 3070 - 2915 17971 24305 2004-05 13824 4540 - 5157 23521 31161 2005-06 14698 4371 - 6007 25077 33430 2006-07 15074 3725 - 9083 27882 36403 2007-08 16467 3276 - 8958 28701 38135 47 321 1999-00 16317 8434 - 2259 27010 41145 2000-01 21838 8198 - 2941 32977 49001 2001-02 21323 8603 - 3098 33025 48927 2002-03 22431 7484 - 3819 33734 50543 2003-04 18551 7759 - 4942 31253 47197 2004-05 18450 7733 - 7611 33794 49147 2005-06 23625 8791 - 6821 39237 59186 2006-07 20725 8581 - 7445 36751 53248 2007-08 22237 9299 - 19934 51470 69705 48 322 1999-00 12402 4441 - 1825 18668 33654 2000-01 12476 3213 - 1092 16781 30069 2001-02 10422 2319 - 2763 15504 27294 2002-03 10230 2209 - 2953 15392 26096 2003-04 10400 2143 - 2213 14756 24297 2004-05 9272 2574 - 3071 14917 23190 2005-06 10158 2180 - 6165 18503 27734 2006-07 9257 2331 - 5111 16699 24667 2007-08 11779 2705 - 15016 29500 40140 49 323 1999-00 16065 7110 - 3029 26203 39287 2000-01 12430 7630 - 2763 22822 32892 2001-02 9696 4931 - 1331 15958 25122 2002-03 10898 4714 - 3079 18691 29291 2003-04 10481 4282 - 4066 18829 29086 2004-05 11238 3349 - 5107 19695 29676 2005-06 12033 2763 - 5427 20224 28904 2006-07 10922 2088 - 6608 19618 27176 2007-08 11449 1513 - 5924 18885 26578 50 331 1999-00 22032 3930 - 1709 27671 43803 2000-01 20963 3559 - 1407 25929 39615 2001-02 19605 2886 - 1598 24089 39440 2002-03 22112 2840 - 2253 27205 45654 2003-04 23558 3403 - 3273 30234 47995 2004-05 21816 3530 - 4345 29692 44625 2005-06 23441 3270 - 6461 33172 51213 2006-07 29842 4650 - 4910 39402 58118 2007-08 29977 5492 - 6060 41529 64535
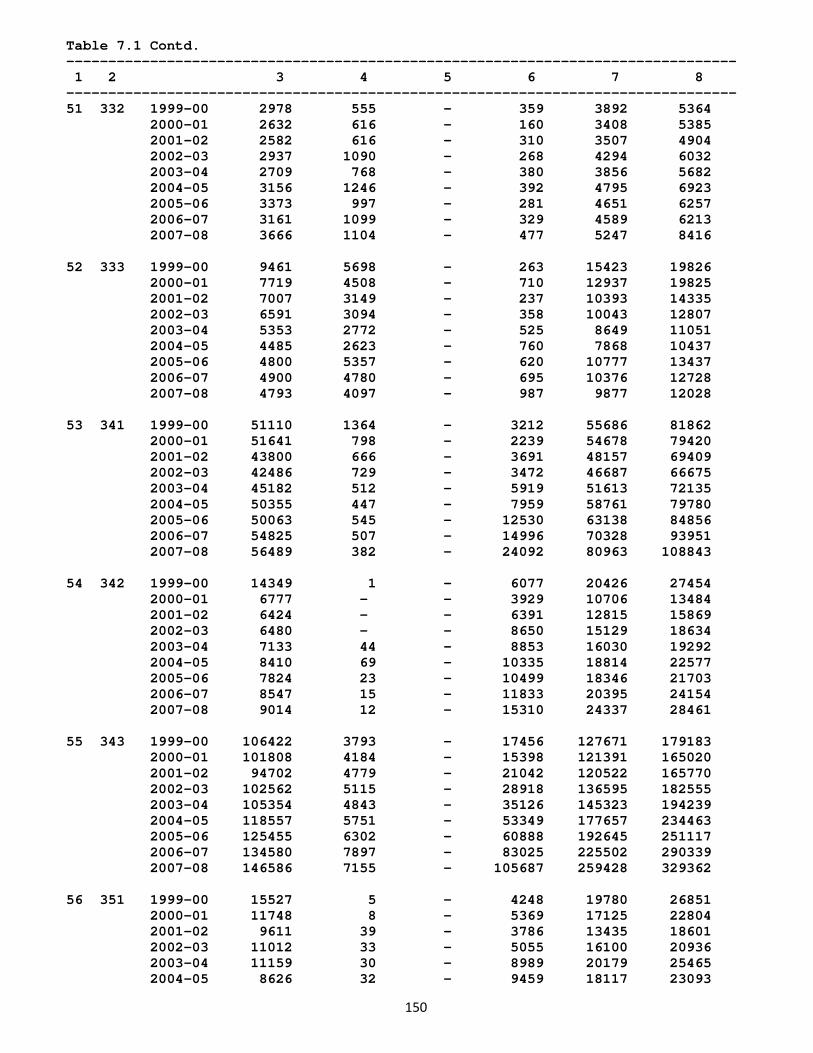
150
Table 7.1 Contd. -------------------------------------------------------------------------------- 1 2 3 4 5 6 7 8 -------------------------------------------------------------------------------- 51 332 1999-00 2978 555 - 359 3892 5364 2000-01 2632 616 - 160 3408 5385 2001-02 2582 616 - 310 3507 4904 2002-03 2937 1090 - 268 4294 6032 2003-04 2709 768 - 380 3856 5682 2004-05 3156 1246 - 392 4795 6923 2005-06 3373 997 - 281 4651 6257 2006-07 3161 1099 - 329 4589 6213 2007-08 3666 1104 - 477 5247 8416 52 333 1999-00 9461 5698 - 263 15423 19826 2000-01 7719 4508 - 710 12937 19825 2001-02 7007 3149 - 237 10393 14335 2002-03 6591 3094 - 358 10043 12807 2003-04 5353 2772 - 525 8649 11051 2004-05 4485 2623 - 760 7868 10437 2005-06 4800 5357 - 620 10777 13437 2006-07 4900 4780 - 695 10376 12728 2007-08 4793 4097 - 987 9877 12028 53 341 1999-00 51110 1364 - 3212 55686 81862 2000-01 51641 798 - 2239 54678 79420 2001-02 43800 666 - 3691 48157 69409 2002-03 42486 729 - 3472 46687 66675 2003-04 45182 512 - 5919 51613 72135 2004-05 50355 447 - 7959 58761 79780 2005-06 50063 545 - 12530 63138 84856 2006-07 54825 507 - 14996 70328 93951 2007-08 56489 382 - 24092 80963 108843 54 342 1999-00 14349 1 - 6077 20426 27454 2000-01 6777 - - 3929 10706 13484 2001-02 6424 - - 6391 12815 15869 2002-03 6480 - - 8650 15129 18634 2003-04 7133 44 - 8853 16030 19292 2004-05 8410 69 - 10335 18814 22577 2005-06 7824 23 - 10499 18346 21703 2006-07 8547 15 - 11833 20395 24154 2007-08 9014 12 - 15310 24337 28461 55 343 1999-00 106422 3793 - 17456 127671 179183 2000-01 101808 4184 - 15398 121391 165020 2001-02 94702 4779 - 21042 120522 165770 2002-03 102562 5115 - 28918 136595 182555 2003-04 105354 4843 - 35126 145323 194239 2004-05 118557 5751 - 53349 177657 234463 2005-06 125455 6302 - 60888 192645 251117 2006-07 134580 7897 - 83025 225502 290339 2007-08 146586 7155 - 105687 259428 329362 56 351 1999-00 15527 5 - 4248 19780 26851 2000-01 11748 8 - 5369 17125 22804 2001-02 9611 39 - 3786 13435 18601 2002-03 11012 33 - 5055 16100 20936 2003-04 11159 30 - 8989 20179 25465 2004-05 8626 32 - 9459 18117 23093
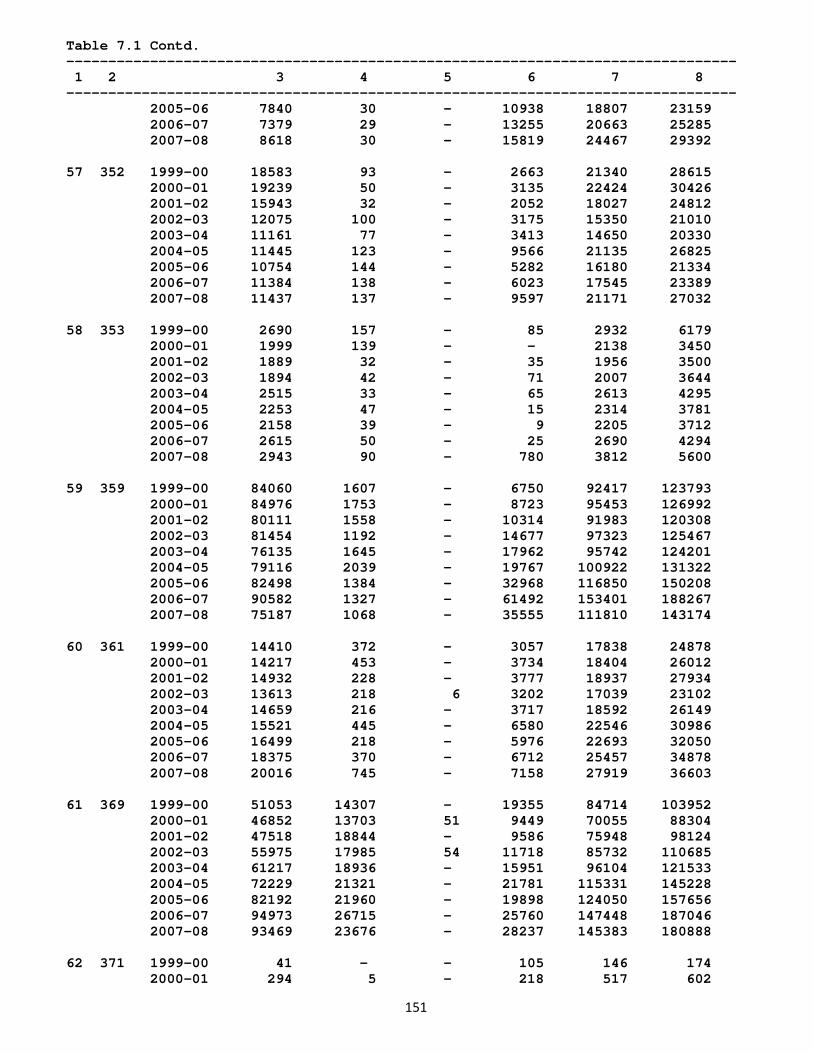
151
Table 7.1 Contd. -------------------------------------------------------------------------------- 1 2 3 4 5 6 7 8 -------------------------------------------------------------------------------- 2005-06 7840 30 - 10938 18807 23159 2006-07 7379 29 - 13255 20663 25285 2007-08 8618 30 - 15819 24467 29392 57 352 1999-00 18583 93 - 2663 21340 28615 2000-01 19239 50 - 3135 22424 30426 2001-02 15943 32 - 2052 18027 24812 2002-03 12075 100 - 3175 15350 21010 2003-04 11161 77 - 3413 14650 20330 2004-05 11445 123 - 9566 21135 26825 2005-06 10754 144 - 5282 16180 21334 2006-07 11384 138 - 6023 17545 23389 2007-08 11437 137 - 9597 21171 27032 58 353 1999-00 2690 157 - 85 2932 6179 2000-01 1999 139 - - 2138 3450 2001-02 1889 32 - 35 1956 3500 2002-03 1894 42 - 71 2007 3644 2003-04 2515 33 - 65 2613 4295 2004-05 2253 47 - 15 2314 3781 2005-06 2158 39 - 9 2205 3712 2006-07 2615 50 - 25 2690 4294 2007-08 2943 90 - 780 3812 5600 59 359 1999-00 84060 1607 - 6750 92417 123793 2000-01 84976 1753 - 8723 95453 126992 2001-02 80111 1558 - 10314 91983 120308 2002-03 81454 1192 - 14677 97323 125467 2003-04 76135 1645 - 17962 95742 124201 2004-05 79116 2039 - 19767 100922 131322 2005-06 82498 1384 - 32968 116850 150208 2006-07 90582 1327 - 61492 153401 188267 2007-08 75187 1068 - 35555 111810 143174 60 361 1999-00 14410 372 - 3057 17838 24878 2000-01 14217 453 - 3734 18404 26012 2001-02 14932 228 - 3777 18937 27934 2002-03 13613 218 6 3202 17039 23102 2003-04 14659 216 - 3717 18592 26149 2004-05 15521 445 - 6580 22546 30986 2005-06 16499 218 - 5976 22693 32050 2006-07 18375 370 - 6712 25457 34878 2007-08 20016 745 - 7158 27919 36603 61 369 1999-00 51053 14307 - 19355 84714 103952 2000-01 46852 13703 51 9449 70055 88304 2001-02 47518 18844 - 9586 75948 98124 2002-03 55975 17985 54 11718 85732 110685 2003-04 61217 18936 - 15951 96104 121533 2004-05 72229 21321 - 21781 115331 145228 2005-06 82192 21960 - 19898 124050 157656 2006-07 94973 26715 - 25760 147448 187046 2007-08 93469 23676 - 28237 145383 180888 62 371 1999-00 41 - - 105 146 174 2000-01 294 5 - 218 517 602
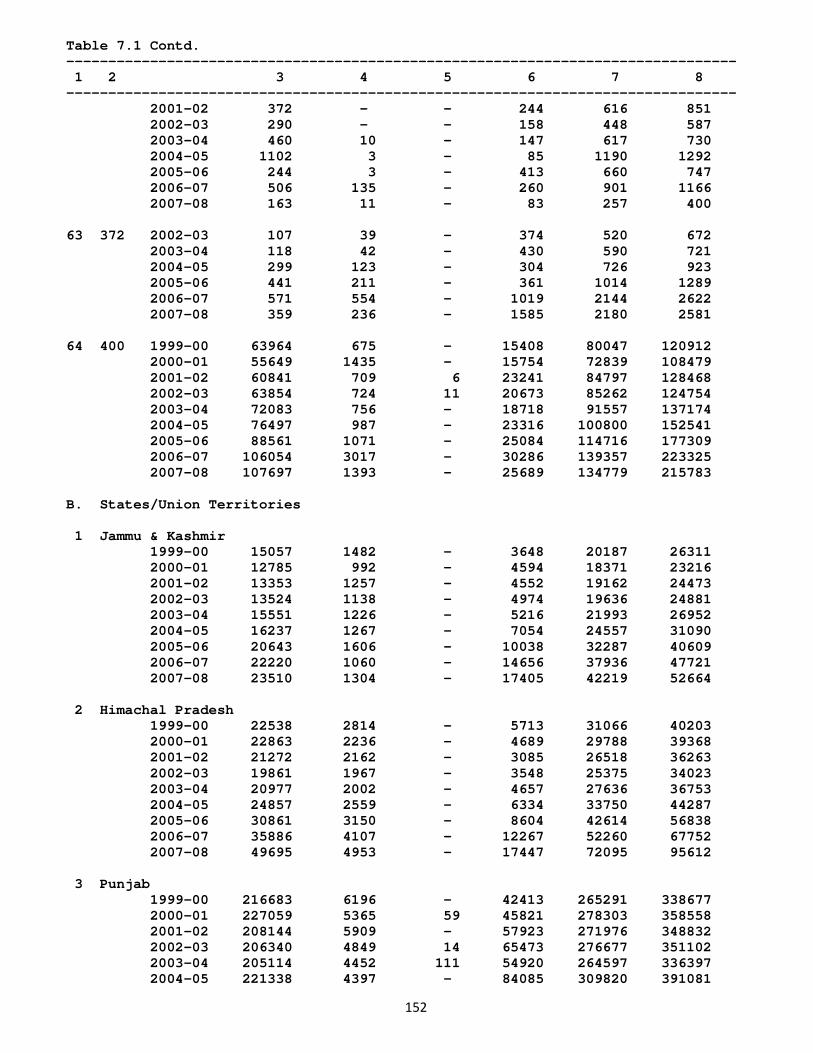
152
Table 7.1 Contd. -------------------------------------------------------------------------------- 1 2 3 4 5 6 7 8 -------------------------------------------------------------------------------- 2001-02 372 - - 244 616 851 2002-03 290 - - 158 448 587 2003-04 460 10 - 147 617 730 2004-05 1102 3 - 85 1190 1292 2005-06 244 3 - 413 660 747 2006-07 506 135 - 260 901 1166 2007-08 163 11 - 83 257 400 63 372 2002-03 107 39 - 374 520 672 2003-04 118 42 - 430 590 721 2004-05 299 123 - 304 726 923 2005-06 441 211 - 361 1014 1289 2006-07 571 554 - 1019 2144 2622 2007-08 359 236 - 1585 2180 2581 64 400 1999-00 63964 675 - 15408 80047 120912 2000-01 55649 1435 - 15754 72839 108479 2001-02 60841 709 6 23241 84797 128468 2002-03 63854 724 11 20673 85262 124754 2003-04 72083 756 - 18718 91557 137174 2004-05 76497 987 - 23316 100800 152541 2005-06 88561 1071 - 25084 114716 177309 2006-07 106054 3017 - 30286 139357 223325 2007-08 107697 1393 - 25689 134779 215783 B. States/Union Territories 1 Jammu & Kashmir 1999-00 15057 1482 - 3648 20187 26311 2000-01 12785 992 - 4594 18371 23216 2001-02 13353 1257 - 4552 19162 24473 2002-03 13524 1138 - 4974 19636 24881 2003-04 15551 1226 - 5216 21993 26952 2004-05 16237 1267 - 7054 24557 31090 2005-06 20643 1606 - 10038 32287 40609 2006-07 22220 1060 - 14656 37936 47721 2007-08 23510 1304 - 17405 42219 52664 2 Himachal Pradesh 1999-00 22538 2814 - 5713 31066 40203 2000-01 22863 2236 - 4689 29788 39368 2001-02 21272 2162 - 3085 26518 36263 2002-03 19861 1967 - 3548 25375 34023 2003-04 20977 2002 - 4657 27636 36753 2004-05 24857 2559 - 6334 33750 44287 2005-06 30861 3150 - 8604 42614 56838 2006-07 35886 4107 - 12267 52260 67752 2007-08 49695 4953 - 17447 72095 95612 3 Punjab 1999-00 216683 6196 - 42413 265291 338677 2000-01 227059 5365 59 45821 278303 358558 2001-02 208144 5909 - 57923 271976 348832 2002-03 206340 4849 14 65473 276677 351102 2003-04 205114 4452 111 54920 264597 336397 2004-05 221338 4397 - 84085 309820 391081
153
Table 7.1 Contd. -------------------------------------------------------------------------------- 1 2 3 4 5 6 7 8 -------------------------------------------------------------------------------- 2005-06 246501 6403 - 97842 350747 439246 2006-07 268375 8517 - 125696 402588 507463 2007-08 306434 8720 - 120232 435386 550351 4 Chandigarh 1999-00 6566 292 - 317 7175 11305 2000-01 6165 199 - 139 6503 9905 2001-02 5148 185 - 1028 6361 9513 2002-03 4987 138 3 52 5180 8243 2003-04 5082 179 - 300 5561 8938 2004-05 5320 209 - 812 6341 9972 2005-06 5511 209 - 1094 6814 10752 2006-07 6010 199 - 1471 7679 13443 2007-08 6211 178 - 1820 8209 12828 5 Uttaranchal 2000-01 22022 552 38 6092 28704 43132 2001-02 21655 417 - 5245 27317 40880 2002-03 20776 379 - 6660 27815 41485 2003-04 21036 389 6 6161 27592 41561 2004-05 24391 567 - 10390 35349 51762 2005-06 28500 2043 - 23058 53601 71097 2006-07 37675 3056 - 30384 71115 95061 2007-08 52736 4227 - 40724 97687 129585 6 Haryana 1999-00 147431 6170 - 61583 215185 298592 2000-01 142985 8706 17 65825 217532 300882 2001-02 136598 7875 - 63590 208062 287253 2002-03 142782 7172 - 73877 223831 299765 2003-04 141844 7176 - 85804 234824 318266 2004-05 150020 7105 - 111432 268557 354861 2005-06 158893 6978 - 135889 301760 391353 2006-07 171169 8883 - 151814 331865 426717 2007-08 196504 11250 - 193140 400895 509617 7 Delhi 1999-00 76121 6025 - 3840 85986 133136 2000-01 71602 5439 9 5187 82236 120574 2001-02 69325 5254 - 3965 78544 118351 2002-03 76264 4807 21 4602 85693 127935 2003-04 70480 5016 - 3920 79416 115478 2004-05 71574 4969 - 4380 80923 121128 2005-06 74670 4836 - 8095 87601 127621 2006-07 79494 5021 - 4916 89431 129952 2007-08 79526 4013 - 5124 88664 127960 8 Rajasthan 1999-00 138116 4071 - 35572 177758 237968 2000-01 132150 3463 51 39903 175566 232177 2001-02 129427 3633 - 45461 178521 231875 2002-03 128830 3809 6 58327 190971 244265 2003-04 127643 2626 - 61320 191589 245274 2004-05 134807 4018 - 68801 207625 268437 2005-06 146041 5041 - 75999 227081 290941 2006-07 152251 6656 - 81419 240326 305359
154
Table 7.1 Contd. -------------------------------------------------------------------------------- 1 2 3 4 5 6 7 8 -------------------------------------------------------------------------------- 2007-08 181818 8817 - 87906 278541 370261 9 Uttar Pradesh 1999-00 340732 10926 - 104005 455664 606064 2000-01 289712 10670 22 101272 401676 539739 2001-02 280290 7305 - 95225 382821 513190 2002-03 287308 7586 - 114222 409116 542160 2003-04 304504 8263 - 126501 439267 569603 2004-05 314238 8843 - 129926 453007 587702 2005-06 339842 8565 - 151457 499864 647749 2006-07 337239 10337 - 186217 533794 695199 2007-08 360645 10645 - 218405 589695 751165 10 Bihar 1999-00 165154 9593 - 41650 216397 271842 2000-01 28875 1503 - 18812 49190 62905 2001-02 28230 844 - 22301 51375 62618 2002-03 25417 512 2 18349 44280 54184 2003-04 23586 501 2 22697 46785 57404 2004-05 24834 506 - 26091 51430 61775 2005-06 24967 502 - 31433 56901 67447 2006-07 23773 554 - 30831 55159 66966 2007-08 24161 474 - 37685 62319 73676 11 Nagaland 1999-00 1376 140 - 1088 2604 3247 2000-01 1226 138 - 1076 2440 3130 2001-02 1085 127 - 1066 2278 2900 2002-03 926 120 - 1219 2265 2784 2003-04 838 156 - 1362 2356 2802 2004-05 976 99 - 1257 2332 2821 2005-06 858 76 - 1521 2455 2862 2006-07 730 80 - 2406 3216 3626 2007-08 796 136 - 1562 2494 2974 12 Manipur 1999-00 475 306 - 66 847 980 2000-01 444 214 - 37 695 814 2001-02 641 348 - 3 992 1127 2002-03 633 409 - 6 1048 1225 2003-04 669 413 - 8 1090 1231 2004-05 951 478 - 178 1607 1835 2005-06 1077 556 - 101 1734 1970 2006-07 1226 578 - 109 1913 2158 2007-08 1241 730 - 471 2442 2722 13 Tripura 1999-00 2708 135 - 3957 6800 7676 2000-01 2810 137 - 4892 7839 8955 2001-02 2863 93 - 6206 9162 10391 2002-03 2699 95 - 8116 10910 12147 2003-04 6608 82 - 6415 13105 14508 2004-05 11150 68 - 2600 13818 15392 2005-06 8023 114 - 9232 17369 19221 2006-07 6101 164 - 12845 19110 21077 2007-08 3370 103 - 17223 20696 22896
155
Table 7.1 Contd. -------------------------------------------------------------------------------- 1 2 3 4 5 6 7 8 -------------------------------------------------------------------------------- 14 Meghalaya 1999-00 467 44 - 231 742 1001 2000-01 537 19 - 314 870 1121 2001-02 591 44 - 647 1282 1539 2002-03 984 46 - 1012 2042 2461 2003-04 1031 55 - 687 1773 2228 2004-05 1599 75 - 731 2405 3037 2005-06 1866 79 - 1657 3602 4332 2006-07 2294 89 - 2396 4779 5725 2007-08 2379 154 - 2041 4574 5587 15 Assam 1999-00 84308 3671 144 7469 95592 113916 2000-01 83074 2498 221 6680 92474 112542 2001-02 77260 2493 246 13366 93365 110944 2002-03 78781 2905 304 11139 93129 110879 2003-04 78462 4260 151 13063 95936 113993 2004-05 83289 3627 45 14304 101265 119548 2005-06 87630 4115 41 17971 109757 128363 2006-07 87847 3840 253 24313 116253 136568 2007-08 85546 4747 136 22703 113132 134284 16 West Bengal 1999-00 415912 9938 - 36864 462714 589033 2000-01 399693 8250 - 47869 455812 569838 2001-02 368135 7071 - 58091 433297 545846 2002-03 363046 6402 - 58648 428096 538858 2003-04 342990 6747 - 59201 408938 515267 2004-05 348008 6437 - 63550 417996 517939 2005-06 328633 6999 - 79018 414650 508857 2006-07 306801 6382 - 89912 403095 510701 2007-08 327775 6340 - 87166 421280 515972 17 Jharkhand 2000-01 112317 5338 - 16661 134317 173481 2001-02 99062 5576 - 14986 119624 156402 2002-03 98171 4991 11 18254 121427 156497 2003-04 91817 5127 - 14129 111073 144529 2004-05 97145 4752 - 15569 117466 152530 2005-06 95271 4068 - 14008 113346 147958 2006-07 87440 5648 - 20343 113430 146769 2007-08 91445 5943 - 20160 117548 152668 18 Orissa 1999-00 62608 4576 - 32551 99735 132058 2000-01 64306 6335 - 28486 99127 128662 2001-02 55554 6549 - 27246 89349 115652 2002-03 56420 5524 - 30743 92686 118187 2003-04 56698 4026 - 37706 98430 124983 2004-05 55260 17844 - 43602 116706 145747 2005-06 58826 4840 - 46077 109744 143847 2006-07 67213 12663 - 45319 125195 162558 2007-08 81133 8798 - 55345 145276 184886
156
Table 7.1 Contd. -------------------------------------------------------------------------------- 1 2 3 4 5 6 7 8 -------------------------------------------------------------------------------- 19 Chhattisgarh 2000-01 47700 1875 - 16320 65894 96389 2001-02 47425 1764 - 15233 64421 93901 2002-03 45553 1649 - 16569 63771 93794 2003-04 47571 2152 - 21881 71604 99764 2004-05 47864 2528 - 27519 77910 106409 2005-06 51422 2103 - 30288 83813 111215 2006-07 65757 3273 - 36591 105621 138921 2007-08 71664 1962 - 44602 118228 155819 20 Madhya Pradesh 1999-00 214925 13666 37 46755 275383 369332 2000-01 133806 12183 - 45142 191131 253444 2001-02 114790 12324 - 31116 158230 209035 2002-03 113066 9506 52 33940 156565 208874 2003-04 118583 8433 - 33960 160976 214140 2004-05 114471 6671 - 42701 163843 216563 2005-06 113407 6516 - 45012 164936 216744 2006-07 122070 7013 - 49071 178154 237201 2007-08 130339 8527 - 55180 194046 255293 21 Gujarat 1999-00 428517 27046 903 156974 613439 822914 2000-01 383761 20955 - 148989 553704 752013 2001-02 343148 17516 7 160857 521528 712804 2002-03 344055 18387 - 165776 528217 717055 2003-04 338096 18428 - 181556 538080 729310 2004-05 381097 20971 - 204779 606847 808618 2005-06 413942 26840 - 227917 668699 886704 2006-07 461156 27156 - 261284 749597 983922 2007-08 473399 27588 - 296455 797443 1045475 22 Daman & Diu 1999-00 22494 5039 - 4423 31955 41285 2000-01 22223 2962 108 5694 30987 40030 2001-02 23714 4420 - 6563 34698 47035 2002-03 29255 4818 - 7636 41709 53810 2003-04 29784 6301 - 8670 44755 59877 2004-05 32082 7454 - 12105 51641 68812 2005-06 39215 7436 - 11359 58010 79434 2006-07 41760 7980 - 15682 65423 87095 2007-08 43882 6110 - 13920 63912 86519 23 D & Nagar Haveli 1999-00 17784 1706 - 4848 24338 33447 2000-01 23111 894 - 5539 29545 40456 2001-02 28425 1211 - 10605 40242 53926 2002-03 23592 1274 - 16416 41282 53723 2003-04 23007 1134 6 13926 38073 51861 2004-05 25383 1589 - 15186 42158 58306 2005-06 29758 1127 - 18433 49318 64820 2006-07 32184 1804 - 24519 58507 77481 2007-08 34670 2511 - 30287 67469 85709 24 Maharashtra 1999-00 618353 88854 - 147154 854361 1217281
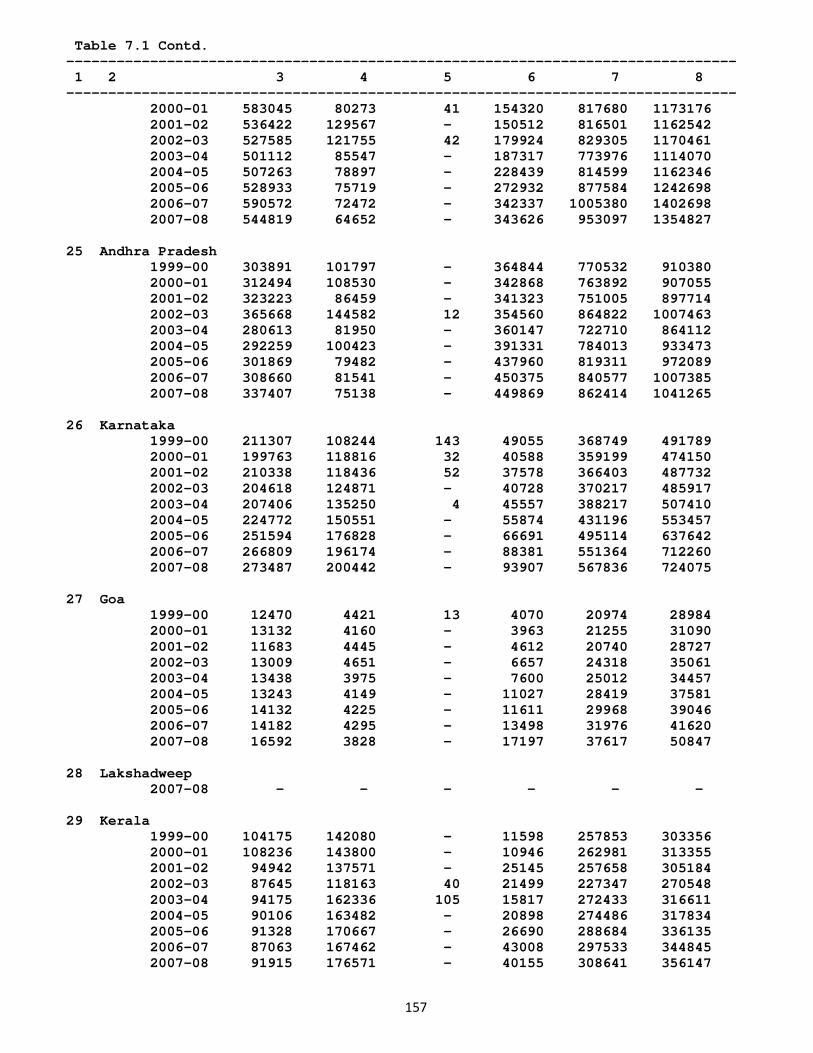
157
Table 7.1 Contd. -------------------------------------------------------------------------------- 1 2 3 4 5 6 7 8 -------------------------------------------------------------------------------- 2000-01 583045 80273 41 154320 817680 1173176 2001-02 536422 129567 - 150512 816501 1162542 2002-03 527585 121755 42 179924 829305 1170461 2003-04 501112 85547 - 187317 773976 1114070 2004-05 507263 78897 - 228439 814599 1162346 2005-06 528933 75719 - 272932 877584 1242698 2006-07 590572 72472 - 342337 1005380 1402698 2007-08 544819 64652 - 343626 953097 1354827 25 Andhra Pradesh 1999-00 303891 101797 - 364844 770532 910380 2000-01 312494 108530 - 342868 763892 907055 2001-02 323223 86459 - 341323 751005 897714 2002-03 365668 144582 12 354560 864822 1007463 2003-04 280613 81950 - 360147 722710 864112 2004-05 292259 100423 - 391331 784013 933473 2005-06 301869 79482 - 437960 819311 972089 2006-07 308660 81541 - 450375 840577 1007385 2007-08 337407 75138 - 449869 862414 1041265 26 Karnataka 1999-00 211307 108244 143 49055 368749 491789 2000-01 199763 118816 32 40588 359199 474150 2001-02 210338 118436 52 37578 366403 487732 2002-03 204618 124871 - 40728 370217 485917 2003-04 207406 135250 4 45557 388217 507410 2004-05 224772 150551 - 55874 431196 553457 2005-06 251594 176828 - 66691 495114 637642 2006-07 266809 196174 - 88381 551364 712260 2007-08 273487 200442 - 93907 567836 724075 27 Goa 1999-00 12470 4421 13 4070 20974 28984 2000-01 13132 4160 - 3963 21255 31090 2001-02 11683 4445 - 4612 20740 28727 2002-03 13009 4651 - 6657 24318 35061 2003-04 13438 3975 - 7600 25012 34457 2004-05 13243 4149 - 11027 28419 37581 2005-06 14132 4225 - 11611 29968 39046 2006-07 14182 4295 - 13498 31976 41620 2007-08 16592 3828 - 17197 37617 50847 28 Lakshadweep 2007-08 - - - - - - 29 Kerala 1999-00 104175 142080 - 11598 257853 303356 2000-01 108236 143800 - 10946 262981 313355 2001-02 94942 137571 - 25145 257658 305184 2002-03 87645 118163 40 21499 227347 270548 2003-04 94175 162336 105 15817 272433 316611 2004-05 90106 163482 - 20898 274486 317834 2005-06 91328 170667 - 26690 288684 336135 2006-07 87063 167462 - 43008 297533 344845 2007-08 91915 176571 - 40155 308641 356147
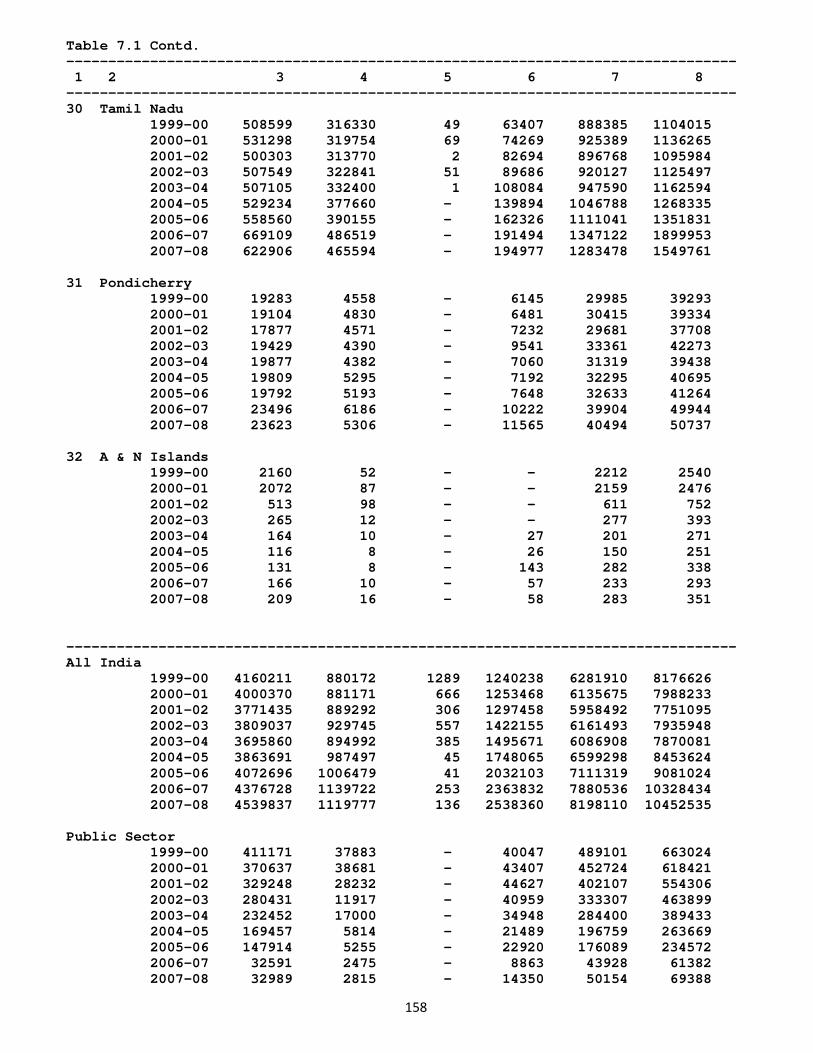
158
Table 7.1 Contd. -------------------------------------------------------------------------------- 1 2 3 4 5 6 7 8 -------------------------------------------------------------------------------- 30 Tamil Nadu 1999-00 508599 316330 49 63407 888385 1104015 2000-01 531298 319754 69 74269 925389 1136265 2001-02 500303 313770 2 82694 896768 1095984 2002-03 507549 322841 51 89686 920127 1125497 2003-04 507105 332400 1 108084 947590 1162594 2004-05 529234 377660 - 139894 1046788 1268335 2005-06 558560 390155 - 162326 1111041 1351831 2006-07 669109 486519 - 191494 1347122 1899953 2007-08 622906 465594 - 194977 1283478 1549761 31 Pondicherry 1999-00 19283 4558 - 6145 29985 39293 2000-01 19104 4830 - 6481 30415 39334 2001-02 17877 4571 - 7232 29681 37708 2002-03 19429 4390 - 9541 33361 42273 2003-04 19877 4382 - 7060 31319 39438 2004-05 19809 5295 - 7192 32295 40695 2005-06 19792 5193 - 7648 32633 41264 2006-07 23496 6186 - 10222 39904 49944 2007-08 23623 5306 - 11565 40494 50737 32 A & N Islands 1999-00 2160 52 - - 2212 2540 2000-01 2072 87 - - 2159 2476 2001-02 513 98 - - 611 752 2002-03 265 12 - - 277 393 2003-04 164 10 - 27 201 271 2004-05 116 8 - 26 150 251 2005-06 131 8 - 143 282 338 2006-07 166 10 - 57 233 293 2007-08 209 16 - 58 283 351 -------------------------------------------------------------------------------- All India 1999-00 4160211 880172 1289 1240238 6281910 8176626 2000-01 4000370 881171 666 1253468 6135675 7988233 2001-02 3771435 889292 306 1297458 5958492 7751095 2002-03 3809037 929745 557 1422155 6161493 7935948 2003-04 3695860 894992 385 1495671 6086908 7870081 2004-05 3863691 987497 45 1748065 6599298 8453624 2005-06 4072696 1006479 41 2032103 7111319 9081024 2006-07 4376728 1139722 253 2363832 7880536 10328434 2007-08 4539837 1119777 136 2538360 8198110 10452535 Public Sector 1999-00 411171 37883 - 40047 489101 663024 2000-01 370637 38681 - 43407 452724 618421 2001-02 329248 28232 - 44627 402107 554306 2002-03 280431 11917 - 40959 333307 463899 2003-04 232452 17000 - 34948 284400 389433 2004-05 169457 5814 - 21489 196759 263669 2005-06 147914 5255 - 22920 176089 234572 2006-07 32591 2475 - 8863 43928 61382 2007-08 32989 2815 - 14350 50154 69388
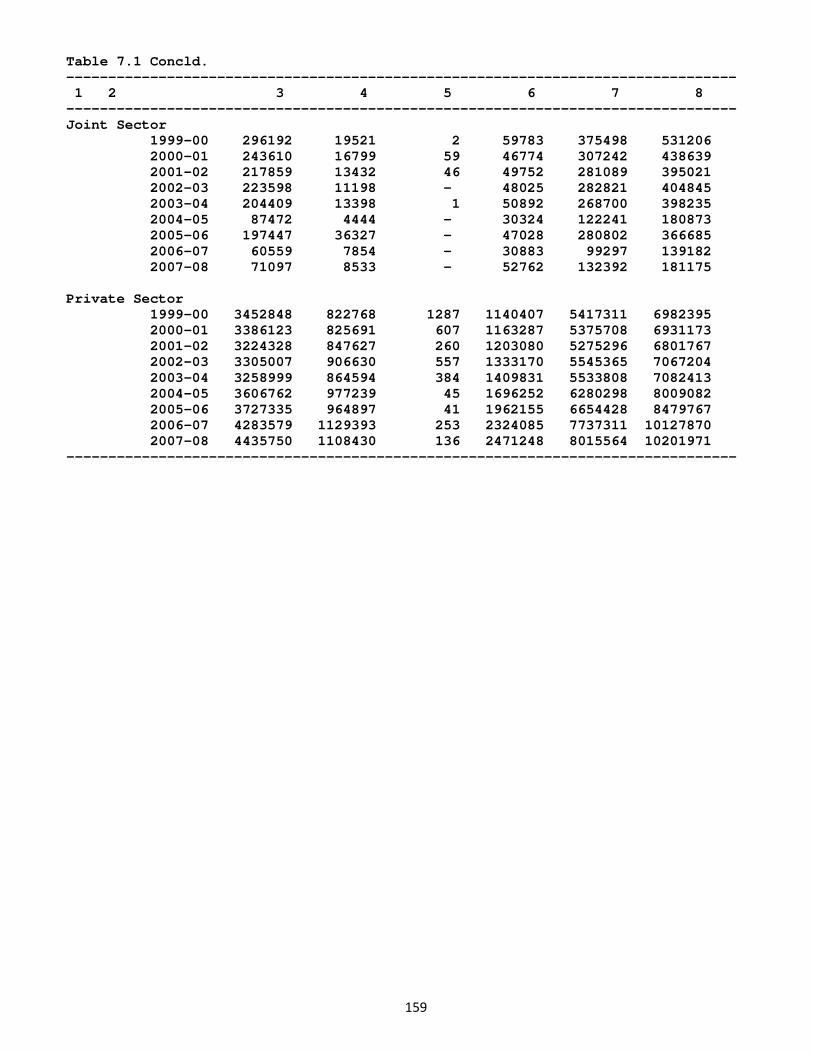
159
Table 7.1 Concld. -------------------------------------------------------------------------------- 1 2 3 4 5 6 7 8 -------------------------------------------------------------------------------- Joint Sector 1999-00 296192 19521 2 59783 375498 531206 2000-01 243610 16799 59 46774 307242 438639 2001-02 217859 13432 46 49752 281089 395021 2002-03 223598 11198 - 48025 282821 404845 2003-04 204409 13398 1 50892 268700 398235 2004-05 87472 4444 - 30324 122241 180873 2005-06 197447 36327 - 47028 280802 366685 2006-07 60559 7854 - 30883 99297 139182 2007-08 71097 8533 - 52762 132392 181175 Private Sector 1999-00 3452848 822768 1287 1140407 5417311 6982395 2000-01 3386123 825691 607 1163287 5375708 6931173 2001-02 3224328 847627 260 1203080 5275296 6801767 2002-03 3305007 906630 557 1333170 5545365 7067204 2003-04 3258999 864594 384 1409831 5533808 7082413 2004-05 3606762 977239 45 1696252 6280298 8009082 2005-06 3727335 964897 41 1962155 6654428 8479767 2006-07 4283579 1129393 253 2324085 7737311 10127870 2007-08 4435750 1108430 136 2471248 8015564 10201971 --------------------------------------------------------------------------------
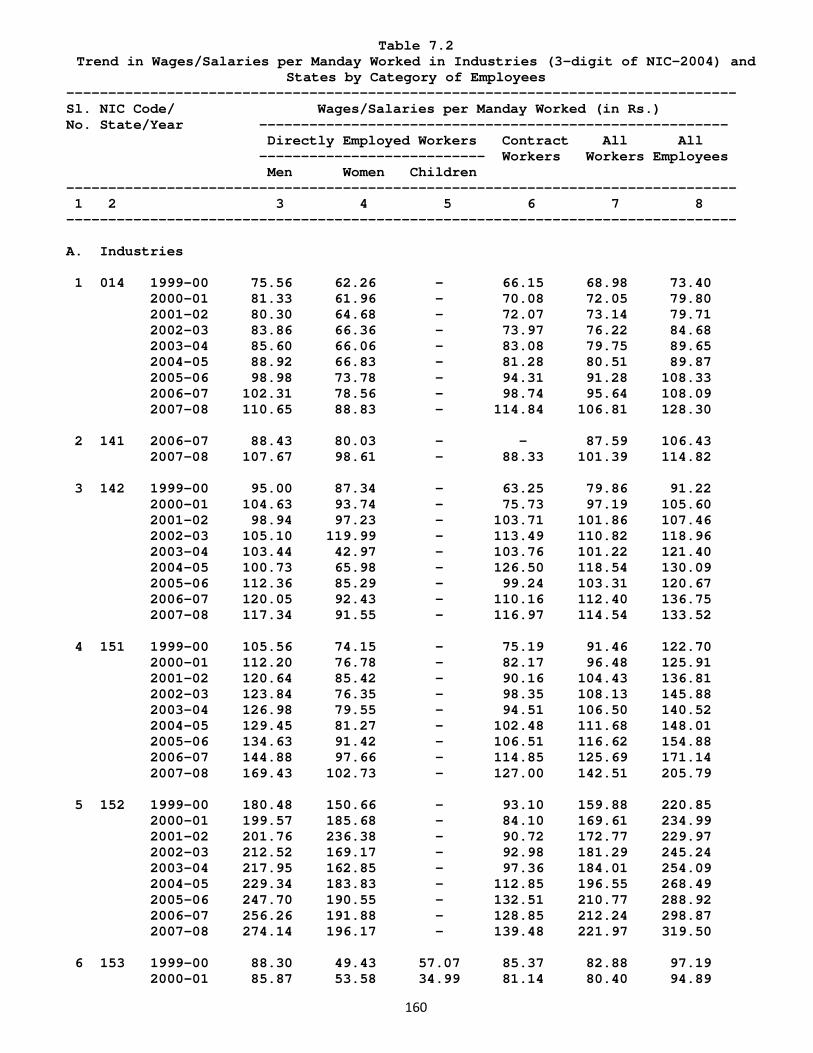
160
Table 7.2 Trend in Wages/Salaries per Manday Worked in Industries (3-digit of NIC-2004) and
States by Category of Employees -------------------------------------------------------------------------------- Sl. NIC Code/ Wages/Salaries per Manday Worked (in Rs.) No. State/Year -------------------------------------------------------- Directly Employed Workers Contract All All --------------------------- Workers Workers Employees Men Women Children -------------------------------------------------------------------------------- 1 2 3 4 5 6 7 8 -------------------------------------------------------------------------------- A. Industries 1 014 1999-00 75.56 62.26 - 66.15 68.98 73.40 2000-01 81.33 61.96 - 70.08 72.05 79.80 2001-02 80.30 64.68 - 72.07 73.14 79.71 2002-03 83.86 66.36 - 73.97 76.22 84.68 2003-04 85.60 66.06 - 83.08 79.75 89.65 2004-05 88.92 66.83 - 81.28 80.51 89.87 2005-06 98.98 73.78 - 94.31 91.28 108.33 2006-07 102.31 78.56 - 98.74 95.64 108.09 2007-08 110.65 88.83 - 114.84 106.81 128.30 2 141 2006-07 88.43 80.03 - - 87.59 106.43 2007-08 107.67 98.61 - 88.33 101.39 114.82 3 142 1999-00 95.00 87.34 - 63.25 79.86 91.22 2000-01 104.63 93.74 - 75.73 97.19 105.60 2001-02 98.94 97.23 - 103.71 101.86 107.46 2002-03 105.10 119.99 - 113.49 110.82 118.96 2003-04 103.44 42.97 - 103.76 101.22 121.40 2004-05 100.73 65.98 - 126.50 118.54 130.09 2005-06 112.36 85.29 - 99.24 103.31 120.67 2006-07 120.05 92.43 - 110.16 112.40 136.75 2007-08 117.34 91.55 - 116.97 114.54 133.52 4 151 1999-00 105.56 74.15 - 75.19 91.46 122.70 2000-01 112.20 76.78 - 82.17 96.48 125.91 2001-02 120.64 85.42 - 90.16 104.43 136.81 2002-03 123.84 76.35 - 98.35 108.13 145.88 2003-04 126.98 79.55 - 94.51 106.50 140.52 2004-05 129.45 81.27 - 102.48 111.68 148.01 2005-06 134.63 91.42 - 106.51 116.62 154.88 2006-07 144.88 97.66 - 114.85 125.69 171.14 2007-08 169.43 102.73 - 127.00 142.51 205.79 5 152 1999-00 180.48 150.66 - 93.10 159.88 220.85 2000-01 199.57 185.68 - 84.10 169.61 234.99 2001-02 201.76 236.38 - 90.72 172.77 229.97 2002-03 212.52 169.17 - 92.98 181.29 245.24 2003-04 217.95 162.85 - 97.36 184.01 254.09 2004-05 229.34 183.83 - 112.85 196.55 268.49 2005-06 247.70 190.55 - 132.51 210.77 288.92 2006-07 256.26 191.88 - 128.85 212.24 298.87 2007-08 274.14 196.17 - 139.48 221.97 319.50 6 153 1999-00 88.30 49.43 57.07 85.37 82.88 97.19 2000-01 85.87 53.58 34.99 81.14 80.40 94.89
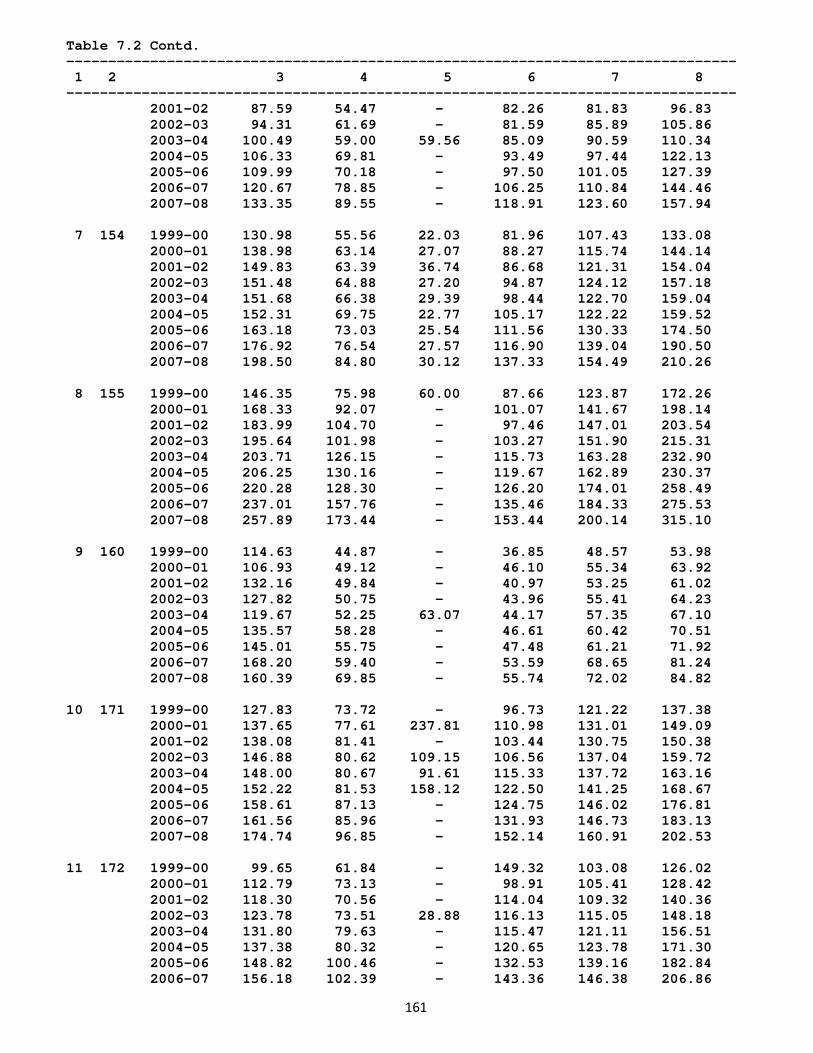
161
Table 7.2 Contd. -------------------------------------------------------------------------------- 1 2 3 4 5 6 7 8 -------------------------------------------------------------------------------- 2001-02 87.59 54.47 - 82.26 81.83 96.83 2002-03 94.31 61.69 - 81.59 85.89 105.86 2003-04 100.49 59.00 59.56 85.09 90.59 110.34 2004-05 106.33 69.81 - 93.49 97.44 122.13 2005-06 109.99 70.18 - 97.50 101.05 127.39 2006-07 120.67 78.85 - 106.25 110.84 144.46 2007-08 133.35 89.55 - 118.91 123.60 157.94 7 154 1999-00 130.98 55.56 22.03 81.96 107.43 133.08 2000-01 138.98 63.14 27.07 88.27 115.74 144.14 2001-02 149.83 63.39 36.74 86.68 121.31 154.04 2002-03 151.48 64.88 27.20 94.87 124.12 157.18 2003-04 151.68 66.38 29.39 98.44 122.70 159.04 2004-05 152.31 69.75 22.77 105.17 122.22 159.52 2005-06 163.18 73.03 25.54 111.56 130.33 174.50 2006-07 176.92 76.54 27.57 116.90 139.04 190.50 2007-08 198.50 84.80 30.12 137.33 154.49 210.26 8 155 1999-00 146.35 75.98 60.00 87.66 123.87 172.26 2000-01 168.33 92.07 - 101.07 141.67 198.14 2001-02 183.99 104.70 - 97.46 147.01 203.54 2002-03 195.64 101.98 - 103.27 151.90 215.31 2003-04 203.71 126.15 - 115.73 163.28 232.90 2004-05 206.25 130.16 - 119.67 162.89 230.37 2005-06 220.28 128.30 - 126.20 174.01 258.49 2006-07 237.01 157.76 - 135.46 184.33 275.53 2007-08 257.89 173.44 - 153.44 200.14 315.10 9 160 1999-00 114.63 44.87 - 36.85 48.57 53.98 2000-01 106.93 49.12 - 46.10 55.34 63.92 2001-02 132.16 49.84 - 40.97 53.25 61.02 2002-03 127.82 50.75 - 43.96 55.41 64.23 2003-04 119.67 52.25 63.07 44.17 57.35 67.10 2004-05 135.57 58.28 - 46.61 60.42 70.51 2005-06 145.01 55.75 - 47.48 61.21 71.92 2006-07 168.20 59.40 - 53.59 68.65 81.24 2007-08 160.39 69.85 - 55.74 72.02 84.82 10 171 1999-00 127.83 73.72 - 96.73 121.22 137.38 2000-01 137.65 77.61 237.81 110.98 131.01 149.09 2001-02 138.08 81.41 - 103.44 130.75 150.38 2002-03 146.88 80.62 109.15 106.56 137.04 159.72 2003-04 148.00 80.67 91.61 115.33 137.72 163.16 2004-05 152.22 81.53 158.12 122.50 141.25 168.67 2005-06 158.61 87.13 - 124.75 146.02 176.81 2006-07 161.56 85.96 - 131.93 146.73 183.13 2007-08 174.74 96.85 - 152.14 160.91 202.53 11 172 1999-00 99.65 61.84 - 149.32 103.08 126.02 2000-01 112.79 73.13 - 98.91 105.41 128.42 2001-02 118.30 70.56 - 114.04 109.32 140.36 2002-03 123.78 73.51 28.88 116.13 115.05 148.18 2003-04 131.80 79.63 - 115.47 121.11 156.51 2004-05 137.38 80.32 - 120.65 123.78 171.30 2005-06 148.82 100.46 - 132.53 139.16 182.84 2006-07 156.18 102.39 - 143.36 146.38 206.86
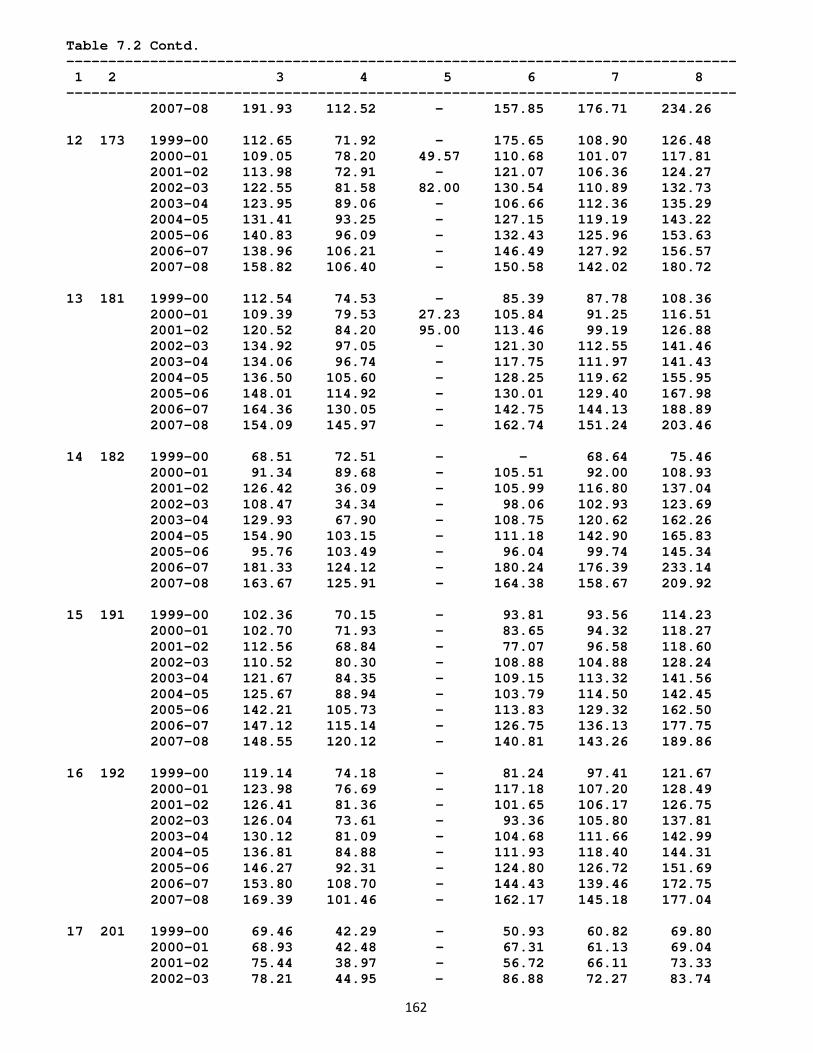
162
Table 7.2 Contd. -------------------------------------------------------------------------------- 1 2 3 4 5 6 7 8 -------------------------------------------------------------------------------- 2007-08 191.93 112.52 - 157.85 176.71 234.26 12 173 1999-00 112.65 71.92 - 175.65 108.90 126.48 2000-01 109.05 78.20 49.57 110.68 101.07 117.81 2001-02 113.98 72.91 - 121.07 106.36 124.27 2002-03 122.55 81.58 82.00 130.54 110.89 132.73 2003-04 123.95 89.06 - 106.66 112.36 135.29 2004-05 131.41 93.25 - 127.15 119.19 143.22 2005-06 140.83 96.09 - 132.43 125.96 153.63 2006-07 138.96 106.21 - 146.49 127.92 156.57 2007-08 158.82 106.40 - 150.58 142.02 180.72 13 181 1999-00 112.54 74.53 - 85.39 87.78 108.36 2000-01 109.39 79.53 27.23 105.84 91.25 116.51 2001-02 120.52 84.20 95.00 113.46 99.19 126.88 2002-03 134.92 97.05 - 121.30 112.55 141.46 2003-04 134.06 96.74 - 117.75 111.97 141.43 2004-05 136.50 105.60 - 128.25 119.62 155.95 2005-06 148.01 114.92 - 130.01 129.40 167.98 2006-07 164.36 130.05 - 142.75 144.13 188.89 2007-08 154.09 145.97 - 162.74 151.24 203.46 14 182 1999-00 68.51 72.51 - - 68.64 75.46 2000-01 91.34 89.68 - 105.51 92.00 108.93 2001-02 126.42 36.09 - 105.99 116.80 137.04 2002-03 108.47 34.34 - 98.06 102.93 123.69 2003-04 129.93 67.90 - 108.75 120.62 162.26 2004-05 154.90 103.15 - 111.18 142.90 165.83 2005-06 95.76 103.49 - 96.04 99.74 145.34 2006-07 181.33 124.12 - 180.24 176.39 233.14 2007-08 163.67 125.91 - 164.38 158.67 209.92 15 191 1999-00 102.36 70.15 - 93.81 93.56 114.23 2000-01 102.70 71.93 - 83.65 94.32 118.27 2001-02 112.56 68.84 - 77.07 96.58 118.60 2002-03 110.52 80.30 - 108.88 104.88 128.24 2003-04 121.67 84.35 - 109.15 113.32 141.56 2004-05 125.67 88.94 - 103.79 114.50 142.45 2005-06 142.21 105.73 - 113.83 129.32 162.50 2006-07 147.12 115.14 - 126.75 136.13 177.75 2007-08 148.55 120.12 - 140.81 143.26 189.86 16 192 1999-00 119.14 74.18 - 81.24 97.41 121.67 2000-01 123.98 76.69 - 117.18 107.20 128.49 2001-02 126.41 81.36 - 101.65 106.17 126.75 2002-03 126.04 73.61 - 93.36 105.80 137.81 2003-04 130.12 81.09 - 104.68 111.66 142.99 2004-05 136.81 84.88 - 111.93 118.40 144.31 2005-06 146.27 92.31 - 124.80 126.72 151.69 2006-07 153.80 108.70 - 144.43 139.46 172.75 2007-08 169.39 101.46 - 162.17 145.18 177.04 17 201 1999-00 69.46 42.29 - 50.93 60.82 69.80 2000-01 68.93 42.48 - 67.31 61.13 69.04 2001-02 75.44 38.97 - 56.72 66.11 73.33 2002-03 78.21 44.95 - 86.88 72.27 83.74

163
Table 7.2 Contd. -------------------------------------------------------------------------------- 1 2 3 4 5 6 7 8 -------------------------------------------------------------------------------- 2003-04 86.46 48.21 41.16 77.60 76.06 86.50 2004-05 88.09 57.96 - 90.47 81.65 92.85 2005-06 92.45 58.47 - 110.46 85.48 99.31 2006-07 104.56 68.74 - 86.69 96.42 112.48 2007-08 121.95 75.12 - 104.71 108.20 127.12 18 202 1999-00 101.03 56.85 - 85.23 96.07 109.86 2000-01 96.86 61.40 - 82.48 92.86 114.29 2001-02 103.33 72.80 - 92.93 100.02 127.67 2002-03 102.75 65.63 - 90.94 98.19 125.14 2003-04 106.95 75.28 - 107.70 105.68 136.27 2004-05 111.61 80.88 - 95.36 107.11 137.77 2005-06 127.12 97.13 - 123.40 124.47 169.31 2006-07 125.86 89.54 - 129.80 125.33 167.28 2007-08 129.78 99.56 - 158.03 136.42 188.54 19 210 1999-00 145.12 59.92 - 82.12 126.87 158.19 2000-01 167.67 67.18 - 96.11 145.36 180.26 2001-02 183.96 75.29 - 92.71 155.49 196.28 2002-03 182.12 71.76 - 95.77 152.37 196.78 2003-04 186.11 119.37 - 110.92 161.39 209.85 2004-05 194.76 82.16 - 120.50 169.01 218.88 2005-06 204.40 150.63 - 123.56 178.13 235.03 2006-07 209.62 132.50 - 130.10 178.90 242.49 2007-08 222.65 95.22 - 142.32 191.98 258.06 20 221 1999-00 260.79 151.05 - 76.66 247.82 291.50 2000-01 246.81 193.04 - 107.56 240.12 337.41 2001-02 265.77 187.95 - 124.82 253.45 354.76 2002-03 273.55 145.00 - 161.10 262.22 387.80 2003-04 296.74 127.91 269.76 139.40 274.53 424.13 2004-05 292.29 312.71 - 133.96 277.80 440.81 2005-06 328.65 267.86 - 172.86 310.21 534.06 2006-07 337.83 201.96 - 126.33 301.44 514.19 2007-08 354.31 187.99 - 175.10 327.87 609.92 21 222 1999-00 122.89 77.26 - 76.79 117.63 143.60 2000-01 143.84 82.67 - 94.56 135.75 169.55 2001-02 150.69 95.42 - 96.41 142.07 185.11 2002-03 159.69 89.74 - 120.19 149.29 195.81 2003-04 163.59 96.88 - 117.31 154.48 192.96 2004-05 163.49 118.58 - 111.34 155.19 204.07 2005-06 164.15 109.98 - 128.92 155.89 212.45 2006-07 190.72 111.37 - 146.14 179.15 248.56 2007-08 189.52 131.96 - 175.95 183.01 264.15 22 223 1999-00 161.83 106.96 - 85.33 122.93 199.44 2000-01 185.67 133.97 - 104.51 170.59 338.75 2001-02 189.29 98.01 - 91.83 146.55 282.47 2002-03 266.33 175.47 - 129.06 240.17 374.49 2003-04 179.20 158.35 - 166.98 173.44 310.40 2004-05 196.17 169.25 - 153.08 187.18 370.35 2005-06 191.17 117.59 - 128.48 169.37 352.41 2006-07 242.72 141.48 - 129.00 203.75 342.32 2007-08 244.07 158.32 - 141.40 199.93 359.73
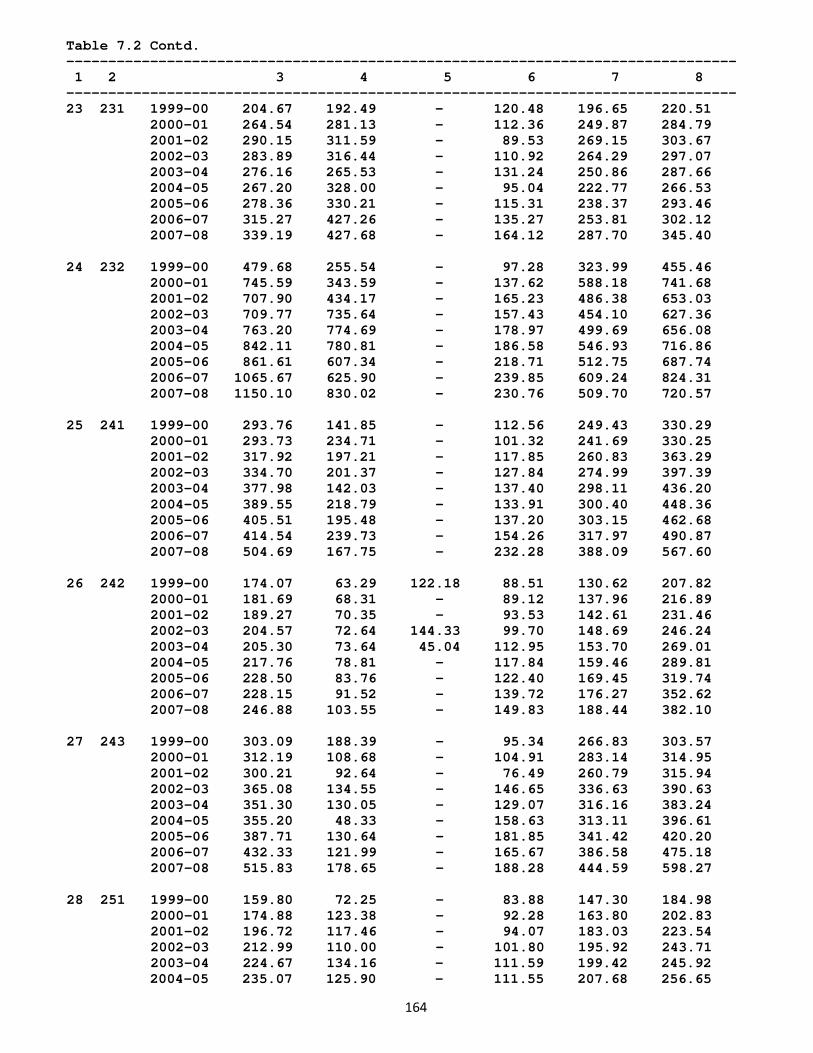
164
Table 7.2 Contd. -------------------------------------------------------------------------------- 1 2 3 4 5 6 7 8 -------------------------------------------------------------------------------- 23 231 1999-00 204.67 192.49 - 120.48 196.65 220.51 2000-01 264.54 281.13 - 112.36 249.87 284.79 2001-02 290.15 311.59 - 89.53 269.15 303.67 2002-03 283.89 316.44 - 110.92 264.29 297.07 2003-04 276.16 265.53 - 131.24 250.86 287.66 2004-05 267.20 328.00 - 95.04 222.77 266.53 2005-06 278.36 330.21 - 115.31 238.37 293.46 2006-07 315.27 427.26 - 135.27 253.81 302.12 2007-08 339.19 427.68 - 164.12 287.70 345.40 24 232 1999-00 479.68 255.54 - 97.28 323.99 455.46 2000-01 745.59 343.59 - 137.62 588.18 741.68 2001-02 707.90 434.17 - 165.23 486.38 653.03 2002-03 709.77 735.64 - 157.43 454.10 627.36 2003-04 763.20 774.69 - 178.97 499.69 656.08 2004-05 842.11 780.81 - 186.58 546.93 716.86 2005-06 861.61 607.34 - 218.71 512.75 687.74 2006-07 1065.67 625.90 - 239.85 609.24 824.31 2007-08 1150.10 830.02 - 230.76 509.70 720.57 25 241 1999-00 293.76 141.85 - 112.56 249.43 330.29 2000-01 293.73 234.71 - 101.32 241.69 330.25 2001-02 317.92 197.21 - 117.85 260.83 363.29 2002-03 334.70 201.37 - 127.84 274.99 397.39 2003-04 377.98 142.03 - 137.40 298.11 436.20 2004-05 389.55 218.79 - 133.91 300.40 448.36 2005-06 405.51 195.48 - 137.20 303.15 462.68 2006-07 414.54 239.73 - 154.26 317.97 490.87 2007-08 504.69 167.75 - 232.28 388.09 567.60 26 242 1999-00 174.07 63.29 122.18 88.51 130.62 207.82 2000-01 181.69 68.31 - 89.12 137.96 216.89 2001-02 189.27 70.35 - 93.53 142.61 231.46 2002-03 204.57 72.64 144.33 99.70 148.69 246.24 2003-04 205.30 73.64 45.04 112.95 153.70 269.01 2004-05 217.76 78.81 - 117.84 159.46 289.81 2005-06 228.50 83.76 - 122.40 169.45 319.74 2006-07 228.15 91.52 - 139.72 176.27 352.62 2007-08 246.88 103.55 - 149.83 188.44 382.10 27 243 1999-00 303.09 188.39 - 95.34 266.83 303.57 2000-01 312.19 108.68 - 104.91 283.14 314.95 2001-02 300.21 92.64 - 76.49 260.79 315.94 2002-03 365.08 134.55 - 146.65 336.63 390.63 2003-04 351.30 130.05 - 129.07 316.16 383.24 2004-05 355.20 48.33 - 158.63 313.11 396.61 2005-06 387.71 130.64 - 181.85 341.42 420.20 2006-07 432.33 121.99 - 165.67 386.58 475.18 2007-08 515.83 178.65 - 188.28 444.59 598.27 28 251 1999-00 159.80 72.25 - 83.88 147.30 184.98 2000-01 174.88 123.38 - 92.28 163.80 202.83 2001-02 196.72 117.46 - 94.07 183.03 223.54 2002-03 212.99 110.00 - 101.80 195.92 243.71 2003-04 224.67 134.16 - 111.59 199.42 245.92 2004-05 235.07 125.90 - 111.55 207.68 256.65
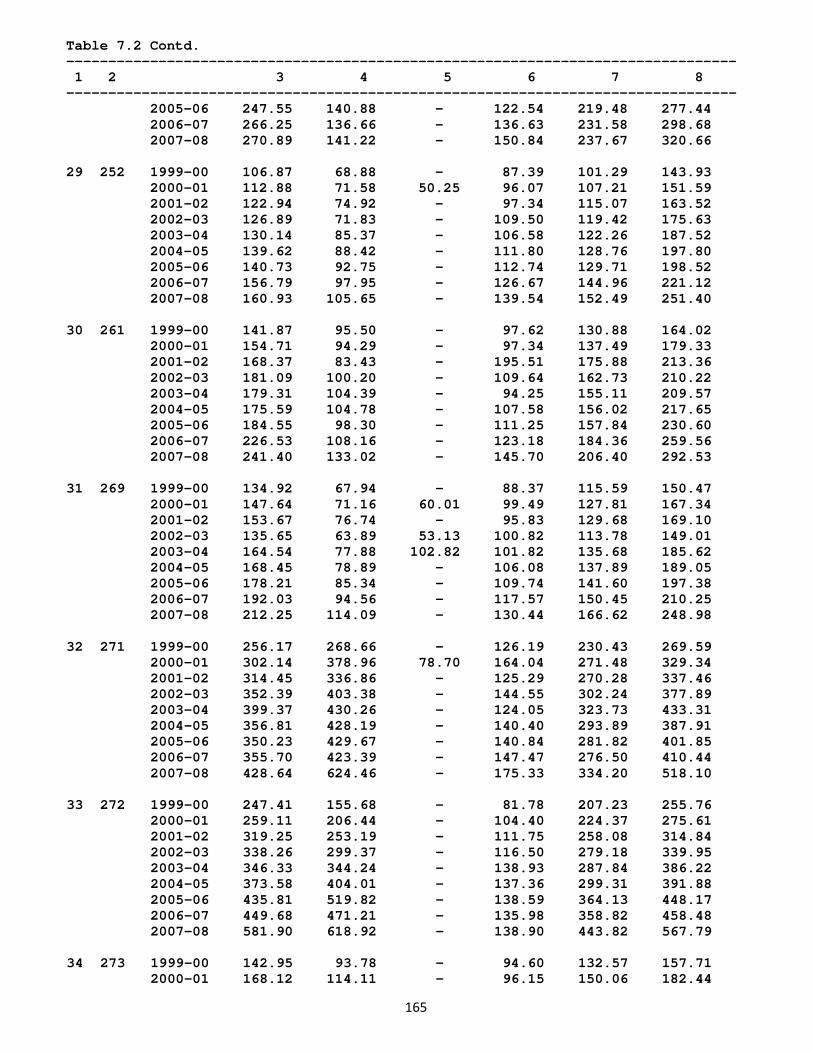
165
Table 7.2 Contd. -------------------------------------------------------------------------------- 1 2 3 4 5 6 7 8 -------------------------------------------------------------------------------- 2005-06 247.55 140.88 - 122.54 219.48 277.44 2006-07 266.25 136.66 - 136.63 231.58 298.68 2007-08 270.89 141.22 - 150.84 237.67 320.66 29 252 1999-00 106.87 68.88 - 87.39 101.29 143.93 2000-01 112.88 71.58 50.25 96.07 107.21 151.59 2001-02 122.94 74.92 - 97.34 115.07 163.52 2002-03 126.89 71.83 - 109.50 119.42 175.63 2003-04 130.14 85.37 - 106.58 122.26 187.52 2004-05 139.62 88.42 - 111.80 128.76 197.80 2005-06 140.73 92.75 - 112.74 129.71 198.52 2006-07 156.79 97.95 - 126.67 144.96 221.12 2007-08 160.93 105.65 - 139.54 152.49 251.40 30 261 1999-00 141.87 95.50 - 97.62 130.88 164.02 2000-01 154.71 94.29 - 97.34 137.49 179.33 2001-02 168.37 83.43 - 195.51 175.88 213.36 2002-03 181.09 100.20 - 109.64 162.73 210.22 2003-04 179.31 104.39 - 94.25 155.11 209.57 2004-05 175.59 104.78 - 107.58 156.02 217.65 2005-06 184.55 98.30 - 111.25 157.84 230.60 2006-07 226.53 108.16 - 123.18 184.36 259.56 2007-08 241.40 133.02 - 145.70 206.40 292.53 31 269 1999-00 134.92 67.94 - 88.37 115.59 150.47 2000-01 147.64 71.16 60.01 99.49 127.81 167.34 2001-02 153.67 76.74 - 95.83 129.68 169.10 2002-03 135.65 63.89 53.13 100.82 113.78 149.01 2003-04 164.54 77.88 102.82 101.82 135.68 185.62 2004-05 168.45 78.89 - 106.08 137.89 189.05 2005-06 178.21 85.34 - 109.74 141.60 197.38 2006-07 192.03 94.56 - 117.57 150.45 210.25 2007-08 212.25 114.09 - 130.44 166.62 248.98 32 271 1999-00 256.17 268.66 - 126.19 230.43 269.59 2000-01 302.14 378.96 78.70 164.04 271.48 329.34 2001-02 314.45 336.86 - 125.29 270.28 337.46 2002-03 352.39 403.38 - 144.55 302.24 377.89 2003-04 399.37 430.26 - 124.05 323.73 433.31 2004-05 356.81 428.19 - 140.40 293.89 387.91 2005-06 350.23 429.67 - 140.84 281.82 401.85 2006-07 355.70 423.39 - 147.47 276.50 410.44 2007-08 428.64 624.46 - 175.33 334.20 518.10 33 272 1999-00 247.41 155.68 - 81.78 207.23 255.76 2000-01 259.11 206.44 - 104.40 224.37 275.61 2001-02 319.25 253.19 - 111.75 258.08 314.84 2002-03 338.26 299.37 - 116.50 279.18 339.95 2003-04 346.33 344.24 - 138.93 287.84 386.22 2004-05 373.58 404.01 - 137.36 299.31 391.88 2005-06 435.81 519.82 - 138.59 364.13 448.17 2006-07 449.68 471.21 - 135.98 358.82 458.48 2007-08 581.90 618.92 - 138.90 443.82 567.79 34 273 1999-00 142.95 93.78 - 94.60 132.57 157.71 2000-01 168.12 114.11 - 96.15 150.06 182.44
166
Table 7.2 Contd. -------------------------------------------------------------------------------- 1 2 3 4 5 6 7 8 -------------------------------------------------------------------------------- 2001-02 167.73 91.11 - 102.94 150.82 188.11 2002-03 189.81 104.81 - 112.21 169.66 207.99 2003-04 182.38 84.14 - 116.00 162.43 206.59 2004-05 182.35 112.96 - 127.13 164.34 218.55 2005-06 194.53 95.58 - 126.27 167.14 219.41 2006-07 196.61 133.26 - 138.19 172.55 235.96 2007-08 218.51 103.16 - 151.58 190.57 270.10 35 281 1999-00 168.47 97.47 75.26 108.47 146.30 201.64 2000-01 242.06 169.45 112.14 97.87 183.62 274.80 2001-02 228.99 111.71 - 107.75 188.87 270.76 2002-03 258.66 135.23 - 118.39 202.13 280.33 2003-04 270.69 161.42 - 136.30 211.57 286.45 2004-05 265.90 172.65 - 131.89 202.60 278.72 2005-06 253.00 199.37 - 153.90 197.11 289.76 2006-07 277.70 153.90 - 143.61 205.80 332.03 2007-08 290.42 276.74 - 176.53 225.49 371.06 36 289 1999-00 148.63 109.80 65.10 92.71 139.13 174.97 2000-01 144.00 94.56 115.06 89.85 131.71 172.39 2001-02 157.71 94.55 - 97.42 141.02 183.12 2002-03 174.14 114.66 - 107.71 153.48 195.75 2003-04 173.01 108.10 - 104.52 150.76 199.04 2004-05 179.92 125.16 - 112.00 156.93 217.56 2005-06 186.28 146.23 - 115.98 163.36 237.66 2006-07 198.00 137.06 - 127.49 173.00 258.28 2007-08 221.10 122.05 - 141.68 190.13 282.55 37 291 1999-00 218.06 148.29 - 116.60 206.24 273.29 2000-01 246.01 212.71 - 121.83 230.76 321.29 2001-02 245.08 166.96 - 110.11 222.89 322.43 2002-03 264.08 219.02 - 116.85 241.26 337.36 2003-04 282.84 224.40 - 128.06 254.93 362.58 2004-05 293.81 198.98 - 135.38 255.72 371.42 2005-06 301.63 271.81 - 142.55 262.93 411.83 2006-07 322.86 307.20 - 161.90 277.19 435.14 2007-08 358.38 275.00 - 163.44 302.50 511.36 38 292 1999-00 198.97 156.10 - 104.36 191.07 259.42 2000-01 218.76 142.72 - 105.18 206.53 284.18 2001-02 236.46 141.83 - 116.07 218.11 317.69 2002-03 247.04 146.18 - 115.62 224.99 320.64 2003-04 261.98 171.91 156.96 119.92 237.90 338.33 2004-05 258.57 180.52 - 130.51 231.08 349.58 2005-06 273.72 165.35 - 145.58 245.06 389.54 2006-07 301.74 211.94 - 161.93 266.92 434.22 2007-08 305.12 224.71 - 198.50 278.45 475.38 39 293 1999-00 204.11 105.99 - 119.13 186.89 236.49 2000-01 196.39 126.61 - 82.56 180.45 243.43 2001-02 226.94 133.03 - 95.85 206.66 261.45 2002-03 219.64 142.72 - 109.67 197.14 261.41 2003-04 243.17 131.30 - 112.60 209.76 285.84 2004-05 224.68 132.42 - 113.70 195.58 277.90 2005-06 210.22 119.22 - 133.35 182.29 276.56 2006-07 230.24 131.97 - 132.73 190.47 267.73
167
Table 7.2 Contd. -------------------------------------------------------------------------------- 1 2 3 4 5 6 7 8 -------------------------------------------------------------------------------- 2007-08 222.28 145.93 - 148.42 191.24 305.21 40 300 1999-00 208.67 112.13 - 81.54 136.20 244.63 2000-01 209.66 138.98 - 175.41 184.20 386.62 2001-02 238.13 157.49 - 99.37 175.28 412.81 2002-03 263.12 167.30 - 105.88 214.40 507.97 2003-04 254.86 218.31 - 128.57 218.50 461.01 2004-05 271.35 176.69 - 122.25 213.13 477.92 2005-06 251.08 204.47 - 154.40 222.50 499.20 2006-07 271.17 218.97 - 155.83 212.51 457.53 2007-08 338.25 240.64 - 194.64 273.45 579.86 41 311 1999-00 274.01 157.53 - 100.72 248.36 308.82 2000-01 362.38 188.15 - 95.81 330.52 458.40 2001-02 327.02 216.93 - 108.35 293.88 391.89 2002-03 373.70 209.28 138.13 113.16 327.20 442.09 2003-04 361.76 265.96 - 110.80 320.97 446.21 2004-05 347.83 281.75 - 136.70 302.77 426.40 2005-06 372.64 242.91 - 144.18 309.02 465.04 2006-07 357.45 254.07 - 163.46 296.41 484.08 2007-08 407.00 229.07 - 180.72 331.37 589.80 42 312 1999-00 204.94 118.71 - 89.25 187.71 261.76 2000-01 240.52 142.84 - 101.66 216.21 331.08 2001-02 230.93 156.60 - 116.45 212.40 316.04 2002-03 261.55 155.38 - 103.80 227.09 342.44 2003-04 266.33 148.76 - 109.18 228.05 356.18 2004-05 285.29 140.26 - 114.86 237.50 376.03 2005-06 285.63 174.49 - 118.63 222.52 364.98 2006-07 318.76 234.24 - 114.88 238.53 399.85 2007-08 300.27 223.79 - 162.50 244.30 432.36 43 313 1999-00 185.57 110.14 - 90.41 168.69 225.89 2000-01 188.62 93.88 - 106.01 171.28 224.90 2001-02 201.82 103.83 - 98.26 182.06 244.91 2002-03 212.99 123.96 - 95.61 186.45 264.17 2003-04 210.20 146.97 - 104.31 184.28 264.91 2004-05 229.20 130.87 - 115.52 194.19 265.66 2005-06 208.35 124.49 - 117.62 179.36 282.67 2006-07 242.93 132.09 - 142.50 206.64 303.46 2007-08 289.40 199.99 - 157.24 239.52 407.86 44 314 1999-00 211.71 95.21 - 108.69 192.00 259.49 2000-01 217.53 119.80 - 118.96 184.25 234.06 2001-02 207.90 138.86 - 118.54 184.43 244.62 2002-03 246.15 152.42 - 110.42 205.50 277.88 2003-04 274.75 149.92 - 144.34 231.27 292.85 2004-05 286.05 118.46 - 132.10 222.39 300.19 2005-06 302.75 171.04 - 172.71 252.42 334.43 2006-07 331.03 200.70 - 189.92 290.47 379.07 2007-08 314.60 172.32 - 204.78 276.36 405.06 45 315 1999-00 183.47 119.17 - 83.31 162.11 197.48 2000-01 174.84 117.53 92.96 83.93 155.41 195.38 2001-02 187.94 103.00 - 109.05 158.69 206.71 2002-03 206.40 104.93 - 118.69 172.52 228.56
168
Table 7.2 Contd. -------------------------------------------------------------------------------- 1 2 3 4 5 6 7 8 -------------------------------------------------------------------------------- 2003-04 187.16 100.84 - 114.82 162.59 239.58 2004-05 189.74 121.03 - 118.62 165.12 228.08 2005-06 179.49 120.59 - 125.97 155.78 218.02 2006-07 210.92 135.21 - 147.21 178.01 242.88 2007-08 234.94 140.93 - 144.21 186.59 271.17 46 319 1999-00 144.62 109.53 - 72.64 128.58 185.88 2000-01 162.72 97.24 - 107.35 148.10 206.52 2001-02 161.64 114.58 - 113.15 150.84 207.81 2002-03 174.97 122.57 - 129.14 158.73 217.20 2003-04 182.68 124.72 - 96.47 159.60 226.28 2004-05 201.12 102.93 - 125.30 165.55 244.90 2005-06 221.38 147.35 - 138.16 188.51 306.05 2006-07 204.18 126.71 - 145.23 174.73 268.11 2007-08 217.09 168.30 - 188.00 202.22 332.44 47 321 1999-00 190.43 113.17 - 89.29 159.28 239.50 2000-01 205.04 133.33 - 82.80 176.84 281.13 2001-02 238.34 154.18 - 91.90 203.19 330.38 2002-03 251.06 171.91 - 100.66 216.73 343.67 2003-04 264.86 183.50 - 104.33 219.25 370.08 2004-05 272.90 179.96 - 134.28 220.74 376.35 2005-06 278.92 193.42 - 138.93 234.86 447.51 2006-07 341.60 222.45 - 156.93 275.99 481.12 2007-08 342.85 306.64 - 164.10 272.65 453.72 48 322 1999-00 254.72 148.97 - 72.96 211.18 317.34 2000-01 286.01 182.63 - 76.35 252.39 354.94 2001-02 270.69 164.22 - 123.46 228.82 368.24 2002-03 339.34 216.75 - 138.55 283.28 482.62 2003-04 357.56 259.06 - 93.37 302.90 485.87 2004-05 337.61 235.50 - 88.74 268.56 449.58 2005-06 331.42 249.68 - 169.88 267.88 451.23 2006-07 366.76 260.19 - 193.43 298.75 447.49 2007-08 379.06 273.05 - 185.02 270.88 547.20 49 323 1999-00 163.15 160.03 - 73.47 151.74 220.79 2000-01 171.45 150.56 - 86.72 154.24 252.35 2001-02 183.55 164.26 - 101.39 170.60 332.71 2002-03 208.14 204.87 - 129.27 193.60 364.65 2003-04 210.26 202.85 - 109.01 186.77 377.09 2004-05 207.82 222.45 - 141.20 192.96 440.93 2005-06 220.10 222.50 - 142.48 199.37 433.99 2006-07 257.97 244.43 - 196.69 236.36 598.00 2007-08 275.62 279.72 - 232.67 262.78 690.44 50 331 1999-00 193.46 116.97 - 114.61 177.80 267.71 2000-01 181.18 128.68 - 107.72 170.03 274.56 2001-02 218.71 188.25 - 104.28 207.53 351.54 2002-03 220.50 162.98 - 131.56 207.33 378.40 2003-04 218.54 158.74 - 120.31 201.06 387.34 2004-05 276.53 194.73 - 155.41 249.01 409.08 2005-06 267.31 177.26 - 127.05 230.99 382.61 2006-07 276.70 232.63 - 151.03 255.68 432.02 2007-08 334.06 358.51 - 185.61 314.92 637.74
169
Table 7.2 Contd. -------------------------------------------------------------------------------- 1 2 3 4 5 6 7 8 -------------------------------------------------------------------------------- 51 332 1999-00 142.28 132.20 - 87.23 135.88 189.88 2000-01 173.41 108.74 - 102.03 158.81 281.85 2001-02 178.47 129.86 - 95.75 163.13 226.93 2002-03 154.28 132.55 - 75.70 144.06 202.43 2003-04 173.86 162.51 - 99.88 164.52 262.90 2004-05 202.51 148.79 - 112.11 181.04 290.52 2005-06 198.23 131.89 - 139.20 180.47 277.38 2006-07 239.29 185.61 - 143.72 219.45 361.60 2007-08 245.93 181.15 - 199.01 228.05 375.67 52 333 1999-00 233.82 156.02 - 94.49 203.31 252.93 2000-01 276.46 138.15 - 68.23 216.40 270.76 2001-02 286.16 221.21 - 77.99 261.74 370.31 2002-03 312.67 183.68 - 112.03 265.86 341.52 2003-04 323.56 184.52 - 127.09 266.92 383.73 2004-05 266.96 133.95 - 104.47 207.23 278.94 2005-06 282.75 149.94 - 112.98 207.67 267.77 2006-07 313.10 144.36 - 136.11 223.14 302.33 2007-08 352.88 156.71 - 175.26 253.35 492.63 53 341 1999-00 377.33 334.76 - 118.31 362.11 453.20 2000-01 395.31 305.01 - 138.03 384.13 491.55 2001-02 433.97 395.58 - 146.69 412.62 532.39 2002-03 484.12 455.25 - 180.17 461.72 627.46 2003-04 521.90 440.21 - 137.13 477.89 675.94 2004-05 545.91 473.57 - 189.36 498.88 653.96 2005-06 549.63 394.35 - 174.11 477.24 711.43 2006-07 608.86 675.50 - 191.16 524.19 793.93 2007-08 599.84 844.86 - 256.07 503.82 824.41 54 342 1999-00 188.84 26.11 - 112.22 166.11 190.36 2000-01 169.60 - - 117.82 150.47 179.54 2001-02 150.54 - - 120.15 135.34 155.63 2002-03 164.29 - - 126.04 142.45 168.36 2003-04 156.16 89.01 - 134.23 143.88 174.34 2004-05 153.89 146.22 - 144.54 148.73 184.90 2005-06 184.49 98.08 - 156.57 168.40 207.67 2006-07 217.36 121.84 - 184.98 198.64 244.75 2007-08 254.59 239.92 - 174.41 204.19 268.19 55 343 1999-00 211.67 143.42 - 95.22 193.69 251.68 2000-01 223.36 173.70 - 112.32 207.68 268.75 2001-02 239.18 128.73 - 117.19 213.80 283.59 2002-03 246.34 156.46 - 127.35 218.18 295.36 2003-04 253.12 153.07 - 120.31 217.84 312.75 2004-05 271.88 180.00 - 130.86 226.64 329.45 2005-06 281.96 159.61 - 142.64 233.83 338.46 2006-07 292.35 162.26 - 160.97 239.09 356.68 2007-08 321.35 182.57 - 192.28 264.60 393.76 56 351 1999-00 243.48 303.39 - 179.80 228.44 279.24 2000-01 275.98 611.72 - 173.04 243.04 291.81 2001-02 309.31 292.04 - 185.64 274.65 331.30 2002-03 307.49 286.19 - 214.39 275.62 331.21 2003-04 321.71 299.15 - 217.88 272.12 332.61 2004-05 428.77 263.25 - 235.24 320.15 392.43
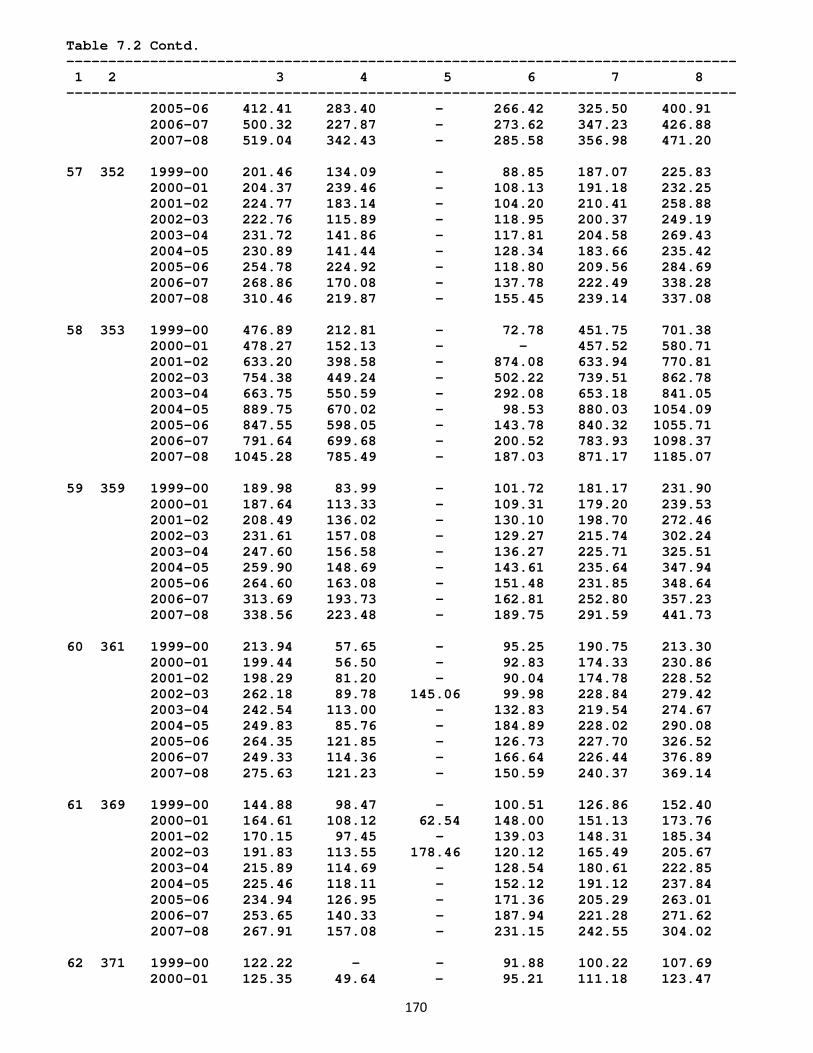
170
Table 7.2 Contd. -------------------------------------------------------------------------------- 1 2 3 4 5 6 7 8 -------------------------------------------------------------------------------- 2005-06 412.41 283.40 - 266.42 325.50 400.91 2006-07 500.32 227.87 - 273.62 347.23 426.88 2007-08 519.04 342.43 - 285.58 356.98 471.20 57 352 1999-00 201.46 134.09 - 88.85 187.07 225.83 2000-01 204.37 239.46 - 108.13 191.18 232.25 2001-02 224.77 183.14 - 104.20 210.41 258.88 2002-03 222.76 115.89 - 118.95 200.37 249.19 2003-04 231.72 141.86 - 117.81 204.58 269.43 2004-05 230.89 141.44 - 128.34 183.66 235.42 2005-06 254.78 224.92 - 118.80 209.56 284.69 2006-07 268.86 170.08 - 137.78 222.49 338.28 2007-08 310.46 219.87 - 155.45 239.14 337.08 58 353 1999-00 476.89 212.81 - 72.78 451.75 701.38 2000-01 478.27 152.13 - - 457.52 580.71 2001-02 633.20 398.58 - 874.08 633.94 770.81 2002-03 754.38 449.24 - 502.22 739.51 862.78 2003-04 663.75 550.59 - 292.08 653.18 841.05 2004-05 889.75 670.02 - 98.53 880.03 1054.09 2005-06 847.55 598.05 - 143.78 840.32 1055.71 2006-07 791.64 699.68 - 200.52 783.93 1098.37 2007-08 1045.28 785.49 - 187.03 871.17 1185.07 59 359 1999-00 189.98 83.99 - 101.72 181.17 231.90 2000-01 187.64 113.33 - 109.31 179.20 239.53 2001-02 208.49 136.02 - 130.10 198.70 272.46 2002-03 231.61 157.08 - 129.27 215.74 302.24 2003-04 247.60 156.58 - 136.27 225.71 325.51 2004-05 259.90 148.69 - 143.61 235.64 347.94 2005-06 264.60 163.08 - 151.48 231.85 348.64 2006-07 313.69 193.73 - 162.81 252.80 357.23 2007-08 338.56 223.48 - 189.75 291.59 441.73 60 361 1999-00 213.94 57.65 - 95.25 190.75 213.30 2000-01 199.44 56.50 - 92.83 174.33 230.86 2001-02 198.29 81.20 - 90.04 174.78 228.52 2002-03 262.18 89.78 145.06 99.98 228.84 279.42 2003-04 242.54 113.00 - 132.83 219.54 274.67 2004-05 249.83 85.76 - 184.89 228.02 290.08 2005-06 264.35 121.85 - 126.73 227.70 326.52 2006-07 249.33 114.36 - 166.64 226.44 376.89 2007-08 275.63 121.23 - 150.59 240.37 369.14 61 369 1999-00 144.88 98.47 - 100.51 126.86 152.40 2000-01 164.61 108.12 62.54 148.00 151.13 173.76 2001-02 170.15 97.45 - 139.03 148.31 185.34 2002-03 191.83 113.55 178.46 120.12 165.49 205.67 2003-04 215.89 114.69 - 128.54 180.61 222.85 2004-05 225.46 118.11 - 152.12 191.12 237.84 2005-06 234.94 126.95 - 171.36 205.29 263.01 2006-07 253.65 140.33 - 187.94 221.28 271.62 2007-08 267.91 157.08 - 231.15 242.55 304.02 62 371 1999-00 122.22 - - 91.88 100.22 107.69 2000-01 125.35 49.64 - 95.21 111.18 123.47
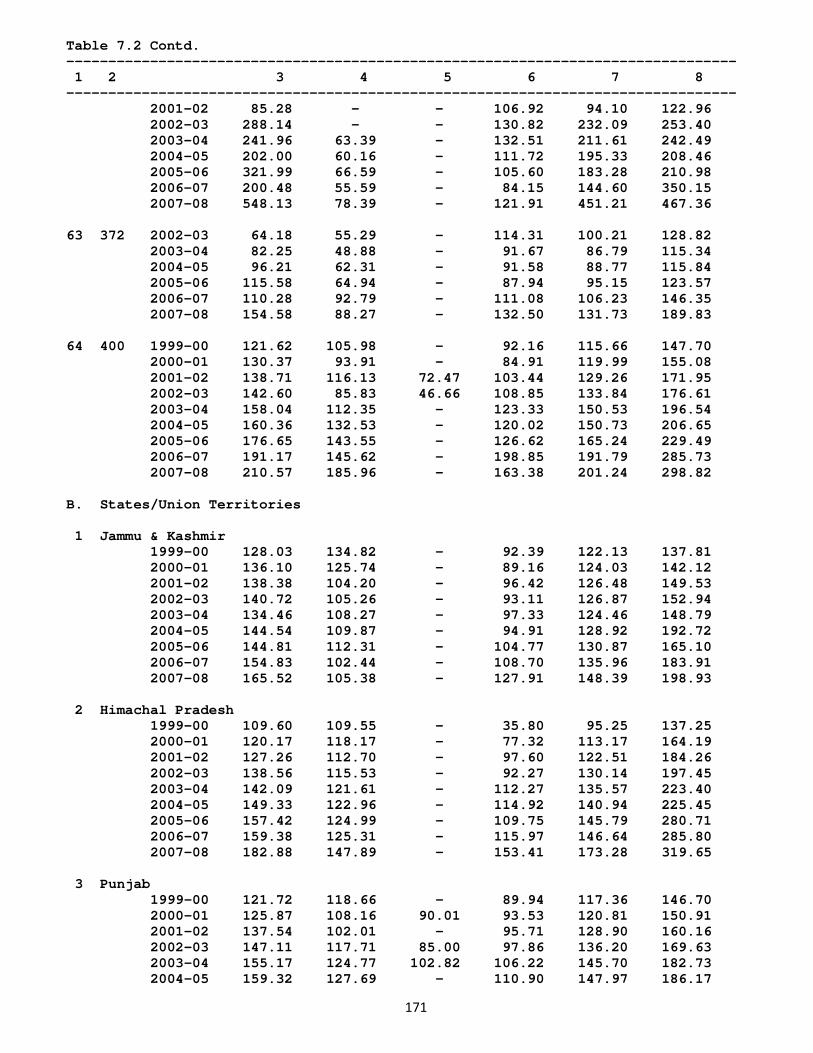
171
Table 7.2 Contd. -------------------------------------------------------------------------------- 1 2 3 4 5 6 7 8 -------------------------------------------------------------------------------- 2001-02 85.28 - - 106.92 94.10 122.96 2002-03 288.14 - - 130.82 232.09 253.40 2003-04 241.96 63.39 - 132.51 211.61 242.49 2004-05 202.00 60.16 - 111.72 195.33 208.46 2005-06 321.99 66.59 - 105.60 183.28 210.98 2006-07 200.48 55.59 - 84.15 144.60 350.15 2007-08 548.13 78.39 - 121.91 451.21 467.36 63 372 2002-03 64.18 55.29 - 114.31 100.21 128.82 2003-04 82.25 48.88 - 91.67 86.79 115.34 2004-05 96.21 62.31 - 91.58 88.77 115.84 2005-06 115.58 64.94 - 87.94 95.15 123.57 2006-07 110.28 92.79 - 111.08 106.23 146.35 2007-08 154.58 88.27 - 132.50 131.73 189.83 64 400 1999-00 121.62 105.98 - 92.16 115.66 147.70 2000-01 130.37 93.91 - 84.91 119.99 155.08 2001-02 138.71 116.13 72.47 103.44 129.26 171.95 2002-03 142.60 85.83 46.66 108.85 133.84 176.61 2003-04 158.04 112.35 - 123.33 150.53 196.54 2004-05 160.36 132.53 - 120.02 150.73 206.65 2005-06 176.65 143.55 - 126.62 165.24 229.49 2006-07 191.17 145.62 - 198.85 191.79 285.73 2007-08 210.57 185.96 - 163.38 201.24 298.82 B. States/Union Territories 1 Jammu & Kashmir 1999-00 128.03 134.82 - 92.39 122.13 137.81 2000-01 136.10 125.74 - 89.16 124.03 142.12 2001-02 138.38 104.20 - 96.42 126.48 149.53 2002-03 140.72 105.26 - 93.11 126.87 152.94 2003-04 134.46 108.27 - 97.33 124.46 148.79 2004-05 144.54 109.87 - 94.91 128.92 192.72 2005-06 144.81 112.31 - 104.77 130.87 165.10 2006-07 154.83 102.44 - 108.70 135.96 183.91 2007-08 165.52 105.38 - 127.91 148.39 198.93 2 Himachal Pradesh 1999-00 109.60 109.55 - 35.80 95.25 137.25 2000-01 120.17 118.17 - 77.32 113.17 164.19 2001-02 127.26 112.70 - 97.60 122.51 184.26 2002-03 138.56 115.53 - 92.27 130.14 197.45 2003-04 142.09 121.61 - 112.27 135.57 223.40 2004-05 149.33 122.96 - 114.92 140.94 225.45 2005-06 157.42 124.99 - 109.75 145.79 280.71 2006-07 159.38 125.31 - 115.97 146.64 285.80 2007-08 182.88 147.89 - 153.41 173.28 319.65 3 Punjab 1999-00 121.72 118.66 - 89.94 117.36 146.70 2000-01 125.87 108.16 90.01 93.53 120.81 150.91 2001-02 137.54 102.01 - 95.71 128.90 160.16 2002-03 147.11 117.71 85.00 97.86 136.20 169.63 2003-04 155.17 124.77 102.82 106.22 145.70 182.73 2004-05 159.32 127.69 - 110.90 147.97 186.17
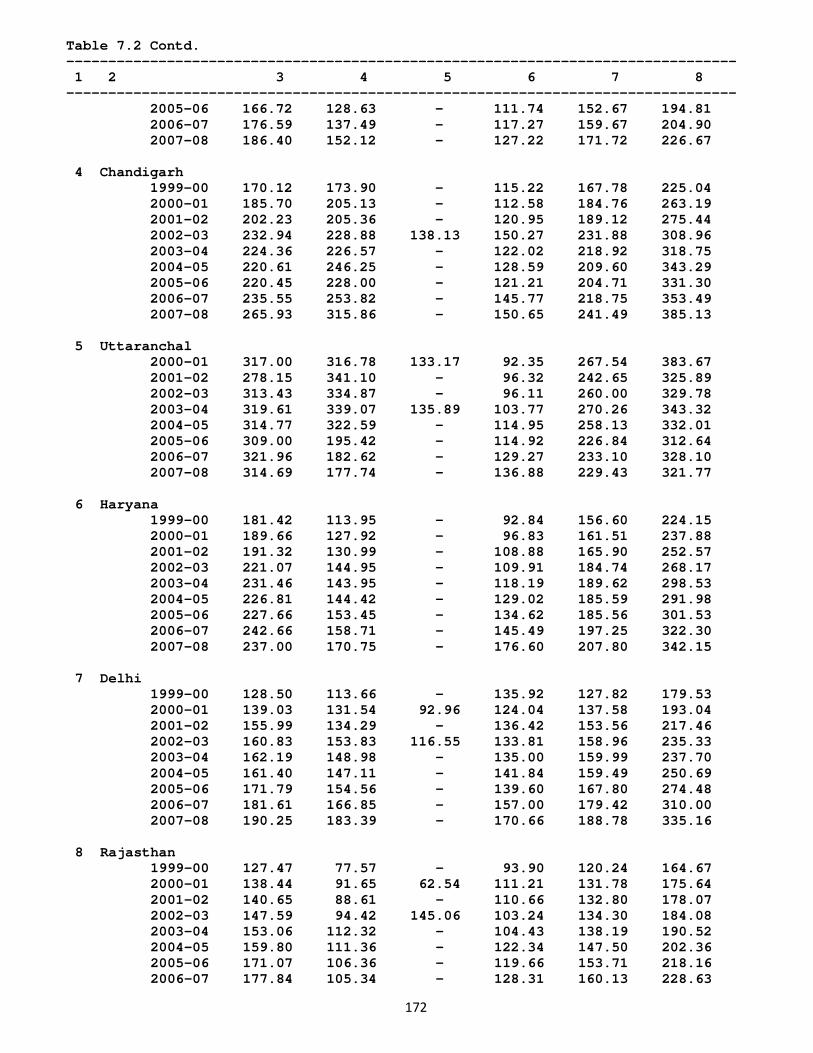
172
Table 7.2 Contd. -------------------------------------------------------------------------------- 1 2 3 4 5 6 7 8 -------------------------------------------------------------------------------- 2005-06 166.72 128.63 - 111.74 152.67 194.81 2006-07 176.59 137.49 - 117.27 159.67 204.90 2007-08 186.40 152.12 - 127.22 171.72 226.67 4 Chandigarh 1999-00 170.12 173.90 - 115.22 167.78 225.04 2000-01 185.70 205.13 - 112.58 184.76 263.19 2001-02 202.23 205.36 - 120.95 189.12 275.44 2002-03 232.94 228.88 138.13 150.27 231.88 308.96 2003-04 224.36 226.57 - 122.02 218.92 318.75 2004-05 220.61 246.25 - 128.59 209.60 343.29 2005-06 220.45 228.00 - 121.21 204.71 331.30 2006-07 235.55 253.82 - 145.77 218.75 353.49 2007-08 265.93 315.86 - 150.65 241.49 385.13 5 Uttaranchal 2000-01 317.00 316.78 133.17 92.35 267.54 383.67 2001-02 278.15 341.10 - 96.32 242.65 325.89 2002-03 313.43 334.87 - 96.11 260.00 329.78 2003-04 319.61 339.07 135.89 103.77 270.26 343.32 2004-05 314.77 322.59 - 114.95 258.13 332.01 2005-06 309.00 195.42 - 114.92 226.84 312.64 2006-07 321.96 182.62 - 129.27 233.10 328.10 2007-08 314.69 177.74 - 136.88 229.43 321.77 6 Haryana 1999-00 181.42 113.95 - 92.84 156.60 224.15 2000-01 189.66 127.92 - 96.83 161.51 237.88 2001-02 191.32 130.99 - 108.88 165.90 252.57 2002-03 221.07 144.95 - 109.91 184.74 268.17 2003-04 231.46 143.95 - 118.19 189.62 298.53 2004-05 226.81 144.42 - 129.02 185.59 291.98 2005-06 227.66 153.45 - 134.62 185.56 301.53 2006-07 242.66 158.71 - 145.49 197.25 322.30 2007-08 237.00 170.75 - 176.60 207.80 342.15 7 Delhi 1999-00 128.50 113.66 - 135.92 127.82 179.53 2000-01 139.03 131.54 92.96 124.04 137.58 193.04 2001-02 155.99 134.29 - 136.42 153.56 217.46 2002-03 160.83 153.83 116.55 133.81 158.96 235.33 2003-04 162.19 148.98 - 135.00 159.99 237.70 2004-05 161.40 147.11 - 141.84 159.49 250.69 2005-06 171.79 154.56 - 139.60 167.80 274.48 2006-07 181.61 166.85 - 157.00 179.42 310.00 2007-08 190.25 183.39 - 170.66 188.78 335.16 8 Rajasthan 1999-00 127.47 77.57 - 93.90 120.24 164.67 2000-01 138.44 91.65 62.54 111.21 131.78 175.64 2001-02 140.65 88.61 - 110.66 132.80 178.07 2002-03 147.59 94.42 145.06 103.24 134.30 184.08 2003-04 153.06 112.32 - 104.43 138.19 190.52 2004-05 159.80 111.36 - 122.34 147.50 202.36 2005-06 171.07 106.36 - 119.66 153.71 218.16 2006-07 177.84 105.34 - 128.31 160.13 228.63
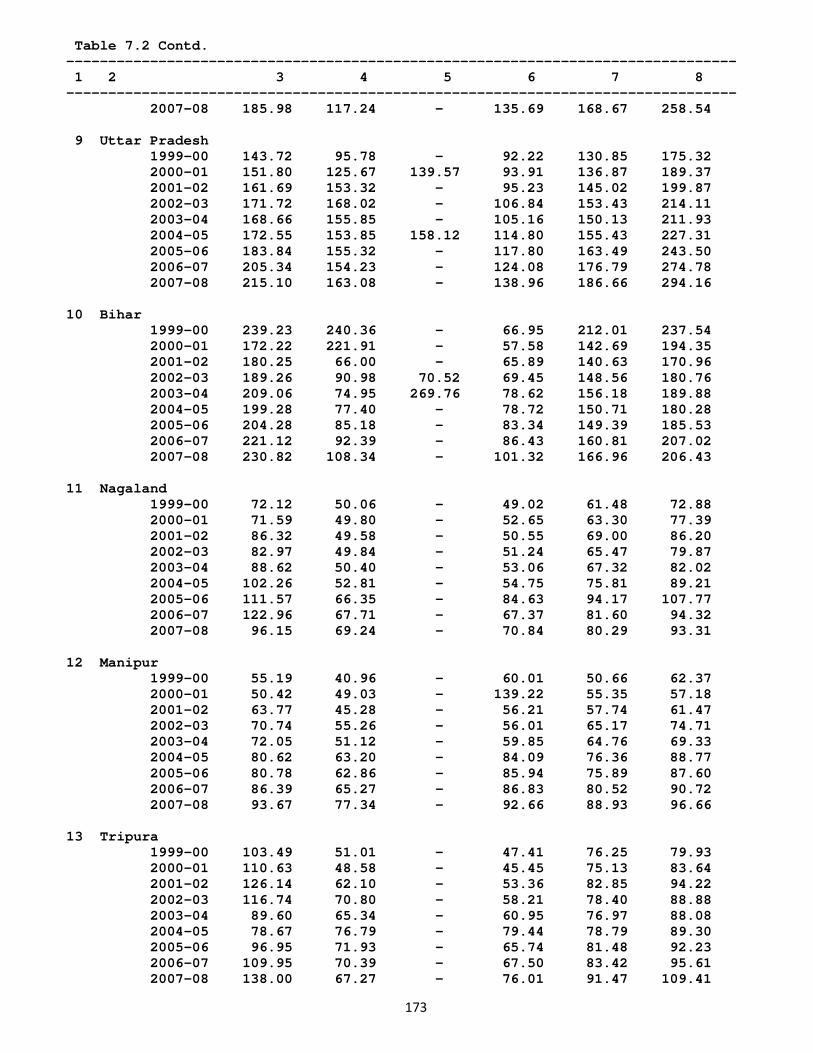
173
Table 7.2 Contd. -------------------------------------------------------------------------------- 1 2 3 4 5 6 7 8 -------------------------------------------------------------------------------- 2007-08 185.98 117.24 - 135.69 168.67 258.54 9 Uttar Pradesh 1999-00 143.72 95.78 - 92.22 130.85 175.32 2000-01 151.80 125.67 139.57 93.91 136.87 189.37 2001-02 161.69 153.32 - 95.23 145.02 199.87 2002-03 171.72 168.02 - 106.84 153.43 214.11 2003-04 168.66 155.85 - 105.16 150.13 211.93 2004-05 172.55 153.85 158.12 114.80 155.43 227.31 2005-06 183.84 155.32 - 117.80 163.49 243.50 2006-07 205.34 154.23 - 124.08 176.79 274.78 2007-08 215.10 163.08 - 138.96 186.66 294.16 10 Bihar 1999-00 239.23 240.36 - 66.95 212.01 237.54 2000-01 172.22 221.91 - 57.58 142.69 194.35 2001-02 180.25 66.00 - 65.89 140.63 170.96 2002-03 189.26 90.98 70.52 69.45 148.56 180.76 2003-04 209.06 74.95 269.76 78.62 156.18 189.88 2004-05 199.28 77.40 - 78.72 150.71 180.28 2005-06 204.28 85.18 - 83.34 149.39 185.53 2006-07 221.12 92.39 - 86.43 160.81 207.02 2007-08 230.82 108.34 - 101.32 166.96 206.43 11 Nagaland 1999-00 72.12 50.06 - 49.02 61.48 72.88 2000-01 71.59 49.80 - 52.65 63.30 77.39 2001-02 86.32 49.58 - 50.55 69.00 86.20 2002-03 82.97 49.84 - 51.24 65.47 79.87 2003-04 88.62 50.40 - 53.06 67.32 82.02 2004-05 102.26 52.81 - 54.75 75.81 89.21 2005-06 111.57 66.35 - 84.63 94.17 107.77 2006-07 122.96 67.71 - 67.37 81.60 94.32 2007-08 96.15 69.24 - 70.84 80.29 93.31 12 Manipur 1999-00 55.19 40.96 - 60.01 50.66 62.37 2000-01 50.42 49.03 - 139.22 55.35 57.18 2001-02 63.77 45.28 - 56.21 57.74 61.47 2002-03 70.74 55.26 - 56.01 65.17 74.71 2003-04 72.05 51.12 - 59.85 64.76 69.33 2004-05 80.62 63.20 - 84.09 76.36 88.77 2005-06 80.78 62.86 - 85.94 75.89 87.60 2006-07 86.39 65.27 - 86.83 80.52 90.72 2007-08 93.67 77.34 - 92.66 88.93 96.66 13 Tripura 1999-00 103.49 51.01 - 47.41 76.25 79.93 2000-01 110.63 48.58 - 45.45 75.13 83.64 2001-02 126.14 62.10 - 53.36 82.85 94.22 2002-03 116.74 70.80 - 58.21 78.40 88.88 2003-04 89.60 65.34 - 60.95 76.97 88.08 2004-05 78.67 76.79 - 79.44 78.79 89.30 2005-06 96.95 71.93 - 65.74 81.48 92.23 2006-07 109.95 70.39 - 67.50 83.42 95.61 2007-08 138.00 67.27 - 76.01 91.47 109.41
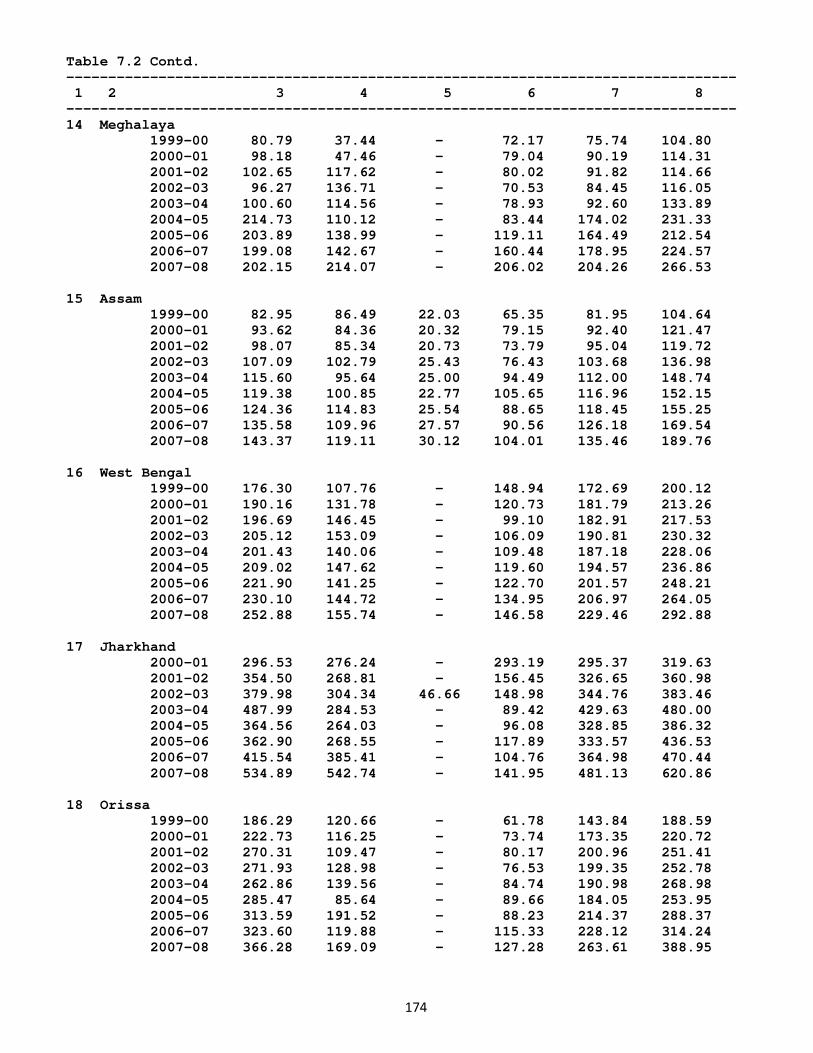
174
Table 7.2 Contd. -------------------------------------------------------------------------------- 1 2 3 4 5 6 7 8 -------------------------------------------------------------------------------- 14 Meghalaya 1999-00 80.79 37.44 - 72.17 75.74 104.80 2000-01 98.18 47.46 - 79.04 90.19 114.31 2001-02 102.65 117.62 - 80.02 91.82 114.66 2002-03 96.27 136.71 - 70.53 84.45 116.05 2003-04 100.60 114.56 - 78.93 92.60 133.89 2004-05 214.73 110.12 - 83.44 174.02 231.33 2005-06 203.89 138.99 - 119.11 164.49 212.54 2006-07 199.08 142.67 - 160.44 178.95 224.57 2007-08 202.15 214.07 - 206.02 204.26 266.53 15 Assam 1999-00 82.95 86.49 22.03 65.35 81.95 104.64 2000-01 93.62 84.36 20.32 79.15 92.40 121.47 2001-02 98.07 85.34 20.73 73.79 95.04 119.72 2002-03 107.09 102.79 25.43 76.43 103.68 136.98 2003-04 115.60 95.64 25.00 94.49 112.00 148.74 2004-05 119.38 100.85 22.77 105.65 116.96 152.15 2005-06 124.36 114.83 25.54 88.65 118.45 155.25 2006-07 135.58 109.96 27.57 90.56 126.18 169.54 2007-08 143.37 119.11 30.12 104.01 135.46 189.76 16 West Bengal 1999-00 176.30 107.76 - 148.94 172.69 200.12 2000-01 190.16 131.78 - 120.73 181.79 213.26 2001-02 196.69 146.45 - 99.10 182.91 217.53 2002-03 205.12 153.09 - 106.09 190.81 230.32 2003-04 201.43 140.06 - 109.48 187.18 228.06 2004-05 209.02 147.62 - 119.60 194.57 236.86 2005-06 221.90 141.25 - 122.70 201.57 248.21 2006-07 230.10 144.72 - 134.95 206.97 264.05 2007-08 252.88 155.74 - 146.58 229.46 292.88 17 Jharkhand 2000-01 296.53 276.24 - 293.19 295.37 319.63 2001-02 354.50 268.81 - 156.45 326.65 360.98 2002-03 379.98 304.34 46.66 148.98 344.76 383.46 2003-04 487.99 284.53 - 89.42 429.63 480.00 2004-05 364.56 264.03 - 96.08 328.85 386.32 2005-06 362.90 268.55 - 117.89 333.57 436.53 2006-07 415.54 385.41 - 104.76 364.98 470.44 2007-08 534.89 542.74 - 141.95 481.13 620.86 18 Orissa 1999-00 186.29 120.66 - 61.78 143.84 188.59 2000-01 222.73 116.25 - 73.74 173.35 220.72 2001-02 270.31 109.47 - 80.17 200.96 251.41 2002-03 271.93 128.98 - 76.53 199.35 252.78 2003-04 262.86 139.56 - 84.74 190.98 268.98 2004-05 285.47 85.64 - 89.66 184.05 253.95 2005-06 313.59 191.52 - 88.23 214.37 288.37 2006-07 323.60 119.88 - 115.33 228.12 314.24 2007-08 366.28 169.09 - 127.28 263.61 388.95
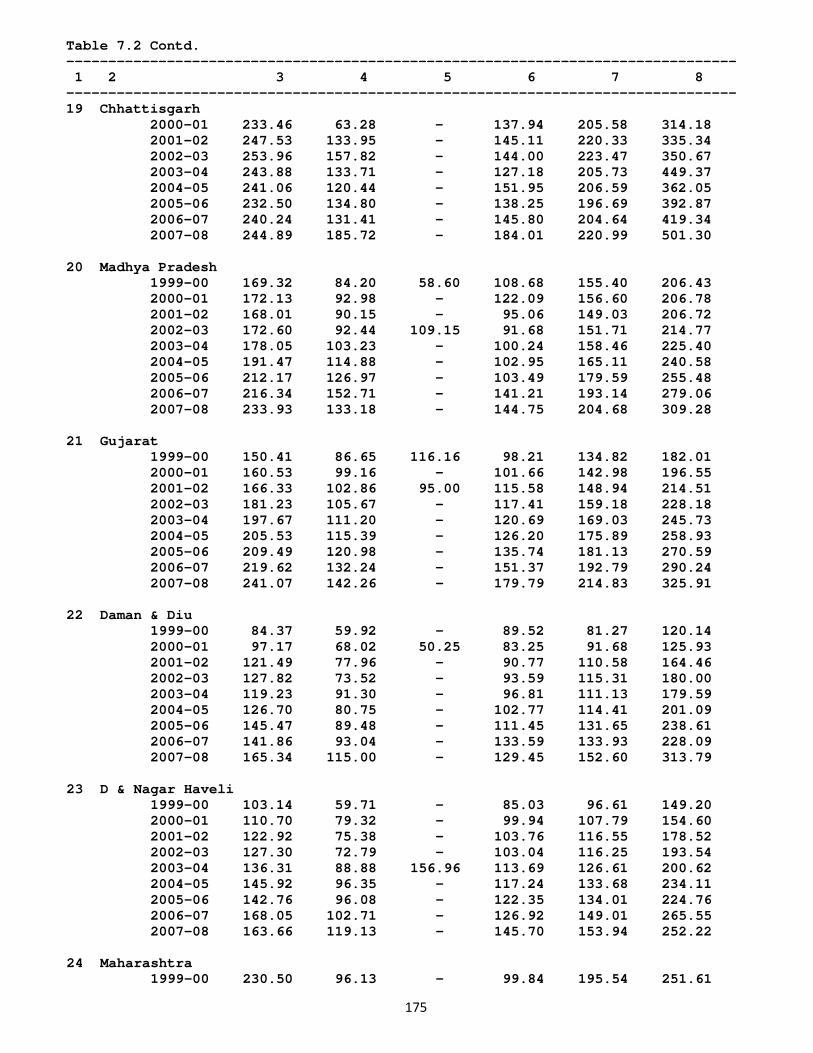
175
Table 7.2 Contd. -------------------------------------------------------------------------------- 1 2 3 4 5 6 7 8 -------------------------------------------------------------------------------- 19 Chhattisgarh 2000-01 233.46 63.28 - 137.94 205.58 314.18 2001-02 247.53 133.95 - 145.11 220.33 335.34 2002-03 253.96 157.82 - 144.00 223.47 350.67 2003-04 243.88 133.71 - 127.18 205.73 449.37 2004-05 241.06 120.44 - 151.95 206.59 362.05 2005-06 232.50 134.80 - 138.25 196.69 392.87 2006-07 240.24 131.41 - 145.80 204.64 419.34 2007-08 244.89 185.72 - 184.01 220.99 501.30 20 Madhya Pradesh 1999-00 169.32 84.20 58.60 108.68 155.40 206.43 2000-01 172.13 92.98 - 122.09 156.60 206.78 2001-02 168.01 90.15 - 95.06 149.03 206.72 2002-03 172.60 92.44 109.15 91.68 151.71 214.77 2003-04 178.05 103.23 - 100.24 158.46 225.40 2004-05 191.47 114.88 - 102.95 165.11 240.58 2005-06 212.17 126.97 - 103.49 179.59 255.48 2006-07 216.34 152.71 - 141.21 193.14 279.06 2007-08 233.93 133.18 - 144.75 204.68 309.28 21 Gujarat 1999-00 150.41 86.65 116.16 98.21 134.82 182.01 2000-01 160.53 99.16 - 101.66 142.98 196.55 2001-02 166.33 102.86 95.00 115.58 148.94 214.51 2002-03 181.23 105.67 - 117.41 159.18 228.18 2003-04 197.67 111.20 - 120.69 169.03 245.73 2004-05 205.53 115.39 - 126.20 175.89 258.93 2005-06 209.49 120.98 - 135.74 181.13 270.59 2006-07 219.62 132.24 - 151.37 192.79 290.24 2007-08 241.07 142.26 - 179.79 214.83 325.91 22 Daman & Diu 1999-00 84.37 59.92 - 89.52 81.27 120.14 2000-01 97.17 68.02 50.25 83.25 91.68 125.93 2001-02 121.49 77.96 - 90.77 110.58 164.46 2002-03 127.82 73.52 - 93.59 115.31 180.00 2003-04 119.23 91.30 - 96.81 111.13 179.59 2004-05 126.70 80.75 - 102.77 114.41 201.09 2005-06 145.47 89.48 - 111.45 131.65 238.61 2006-07 141.86 93.04 - 133.59 133.93 228.09 2007-08 165.34 115.00 - 129.45 152.60 313.79 23 D & Nagar Haveli 1999-00 103.14 59.71 - 85.03 96.61 149.20 2000-01 110.70 79.32 - 99.94 107.79 154.60 2001-02 122.92 75.38 - 103.76 116.55 178.52 2002-03 127.30 72.79 - 103.04 116.25 193.54 2003-04 136.31 88.88 156.96 113.69 126.61 200.62 2004-05 145.92 96.35 - 117.24 133.68 234.11 2005-06 142.76 96.08 - 122.35 134.01 224.76 2006-07 168.05 102.71 - 126.92 149.01 265.55 2007-08 163.66 119.13 - 145.70 153.94 252.22 24 Maharashtra 1999-00 230.50 96.13 - 99.84 195.54 251.61
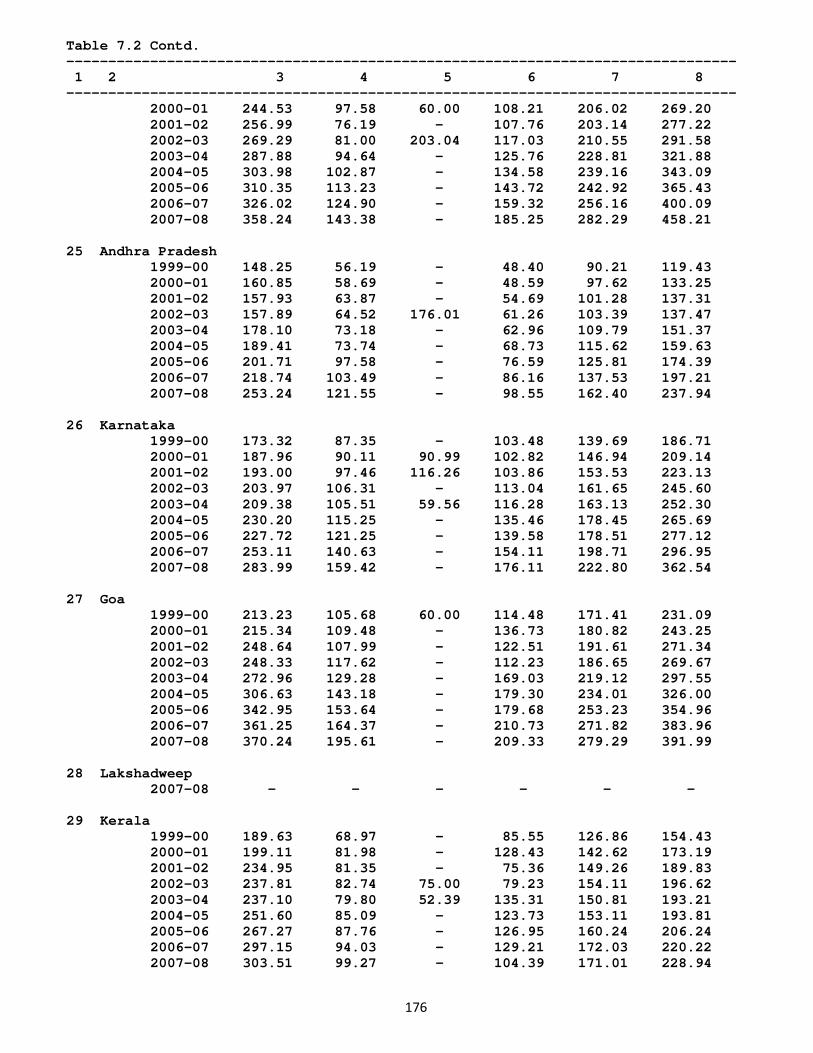
176
Table 7.2 Contd. -------------------------------------------------------------------------------- 1 2 3 4 5 6 7 8 -------------------------------------------------------------------------------- 2000-01 244.53 97.58 60.00 108.21 206.02 269.20 2001-02 256.99 76.19 - 107.76 203.14 277.22 2002-03 269.29 81.00 203.04 117.03 210.55 291.58 2003-04 287.88 94.64 - 125.76 228.81 321.88 2004-05 303.98 102.87 - 134.58 239.16 343.09 2005-06 310.35 113.23 - 143.72 242.92 365.43 2006-07 326.02 124.90 - 159.32 256.16 400.09 2007-08 358.24 143.38 - 185.25 282.29 458.21 25 Andhra Pradesh 1999-00 148.25 56.19 - 48.40 90.21 119.43 2000-01 160.85 58.69 - 48.59 97.62 133.25 2001-02 157.93 63.87 - 54.69 101.28 137.31 2002-03 157.89 64.52 176.01 61.26 103.39 137.47 2003-04 178.10 73.18 - 62.96 109.79 151.37 2004-05 189.41 73.74 - 68.73 115.62 159.63 2005-06 201.71 97.58 - 76.59 125.81 174.39 2006-07 218.74 103.49 - 86.16 137.53 197.21 2007-08 253.24 121.55 - 98.55 162.40 237.94 26 Karnataka 1999-00 173.32 87.35 - 103.48 139.69 186.71 2000-01 187.96 90.11 90.99 102.82 146.94 209.14 2001-02 193.00 97.46 116.26 103.86 153.53 223.13 2002-03 203.97 106.31 - 113.04 161.65 245.60 2003-04 209.38 105.51 59.56 116.28 163.13 252.30 2004-05 230.20 115.25 - 135.46 178.45 265.69 2005-06 227.72 121.25 - 139.58 178.51 277.12 2006-07 253.11 140.63 - 154.11 198.71 296.95 2007-08 283.99 159.42 - 176.11 222.80 362.54 27 Goa 1999-00 213.23 105.68 60.00 114.48 171.41 231.09 2000-01 215.34 109.48 - 136.73 180.82 243.25 2001-02 248.64 107.99 - 122.51 191.61 271.34 2002-03 248.33 117.62 - 112.23 186.65 269.67 2003-04 272.96 129.28 - 169.03 219.12 297.55 2004-05 306.63 143.18 - 179.30 234.01 326.00 2005-06 342.95 153.64 - 179.68 253.23 354.96 2006-07 361.25 164.37 - 210.73 271.82 383.96 2007-08 370.24 195.61 - 209.33 279.29 391.99 28 Lakshadweep 2007-08 - - - - - - 29 Kerala 1999-00 189.63 68.97 - 85.55 126.86 154.43 2000-01 199.11 81.98 - 128.43 142.62 173.19 2001-02 234.95 81.35 - 75.36 149.26 189.83 2002-03 237.81 82.74 75.00 79.23 154.11 196.62 2003-04 237.10 79.80 52.39 135.31 150.81 193.21 2004-05 251.60 85.09 - 123.73 153.11 193.81 2005-06 267.27 87.76 - 126.95 160.24 206.24 2006-07 297.15 94.03 - 129.21 172.03 220.22 2007-08 303.51 99.27 - 104.39 171.01 228.94
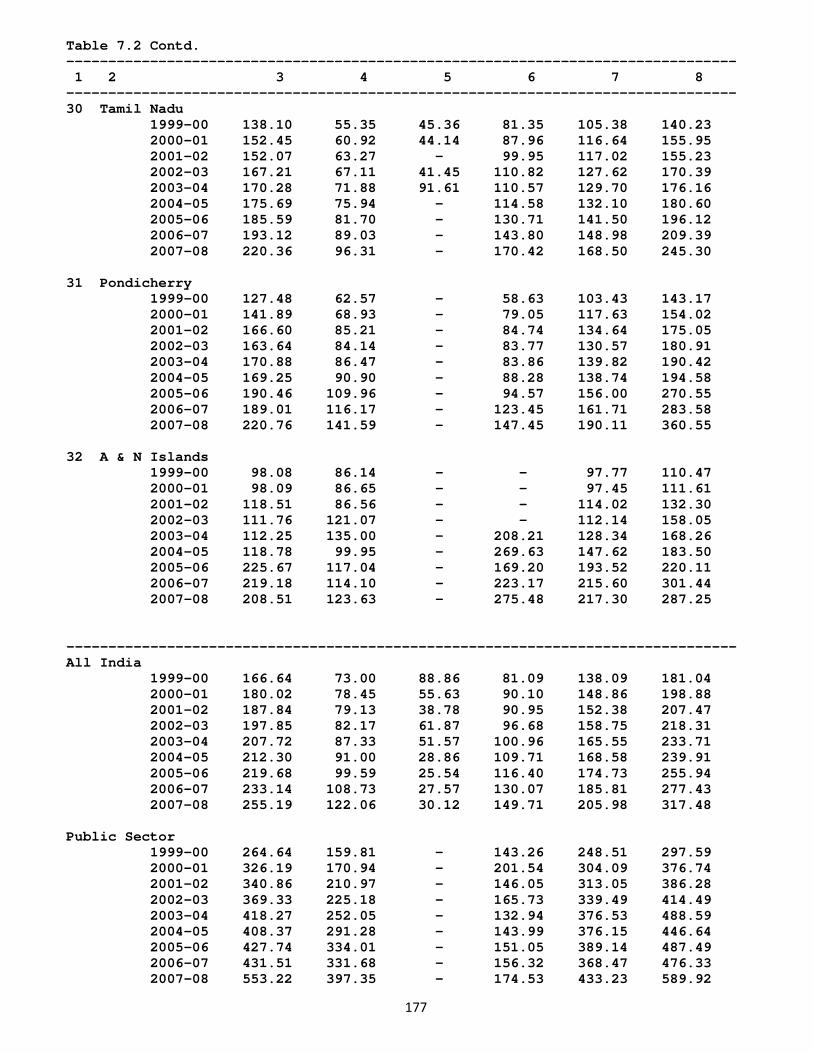
177
Table 7.2 Contd. -------------------------------------------------------------------------------- 1 2 3 4 5 6 7 8 -------------------------------------------------------------------------------- 30 Tamil Nadu 1999-00 138.10 55.35 45.36 81.35 105.38 140.23 2000-01 152.45 60.92 44.14 87.96 116.64 155.95 2001-02 152.07 63.27 - 99.95 117.02 155.23 2002-03 167.21 67.11 41.45 110.82 127.62 170.39 2003-04 170.28 71.88 91.61 110.57 129.70 176.16 2004-05 175.69 75.94 - 114.58 132.10 180.60 2005-06 185.59 81.70 - 130.71 141.50 196.12 2006-07 193.12 89.03 - 143.80 148.98 209.39 2007-08 220.36 96.31 - 170.42 168.50 245.30 31 Pondicherry 1999-00 127.48 62.57 - 58.63 103.43 143.17 2000-01 141.89 68.93 - 79.05 117.63 154.02 2001-02 166.60 85.21 - 84.74 134.64 175.05 2002-03 163.64 84.14 - 83.77 130.57 180.91 2003-04 170.88 86.47 - 83.86 139.82 190.42 2004-05 169.25 90.90 - 88.28 138.74 194.58 2005-06 190.46 109.96 - 94.57 156.00 270.55 2006-07 189.01 116.17 - 123.45 161.71 283.58 2007-08 220.76 141.59 - 147.45 190.11 360.55 32 A & N Islands 1999-00 98.08 86.14 - - 97.77 110.47 2000-01 98.09 86.65 - - 97.45 111.61 2001-02 118.51 86.56 - - 114.02 132.30 2002-03 111.76 121.07 - - 112.14 158.05 2003-04 112.25 135.00 - 208.21 128.34 168.26 2004-05 118.78 99.95 - 269.63 147.62 183.50 2005-06 225.67 117.04 - 169.20 193.52 220.11 2006-07 219.18 114.10 - 223.17 215.60 301.44 2007-08 208.51 123.63 - 275.48 217.30 287.25 -------------------------------------------------------------------------------- All India 1999-00 166.64 73.00 88.86 81.09 138.09 181.04 2000-01 180.02 78.45 55.63 90.10 148.86 198.88 2001-02 187.84 79.13 38.78 90.95 152.38 207.47 2002-03 197.85 82.17 61.87 96.68 158.75 218.31 2003-04 207.72 87.33 51.57 100.96 165.55 233.71 2004-05 212.30 91.00 28.86 109.71 168.58 239.91 2005-06 219.68 99.59 25.54 116.40 174.73 255.94 2006-07 233.14 108.73 27.57 130.07 185.81 277.43 2007-08 255.19 122.06 30.12 149.71 205.98 317.48 Public Sector 1999-00 264.64 159.81 - 143.26 248.51 297.59 2000-01 326.19 170.94 - 201.54 304.09 376.74 2001-02 340.86 210.97 - 146.05 313.05 386.28 2002-03 369.33 225.18 - 165.73 339.49 414.49 2003-04 418.27 252.05 - 132.94 376.53 488.59 2004-05 408.37 291.28 - 143.99 376.15 446.64 2005-06 427.74 334.01 - 151.05 389.14 487.49 2006-07 431.51 331.68 - 156.32 368.47 476.33 2007-08 553.22 397.35 - 174.53 433.23 589.92
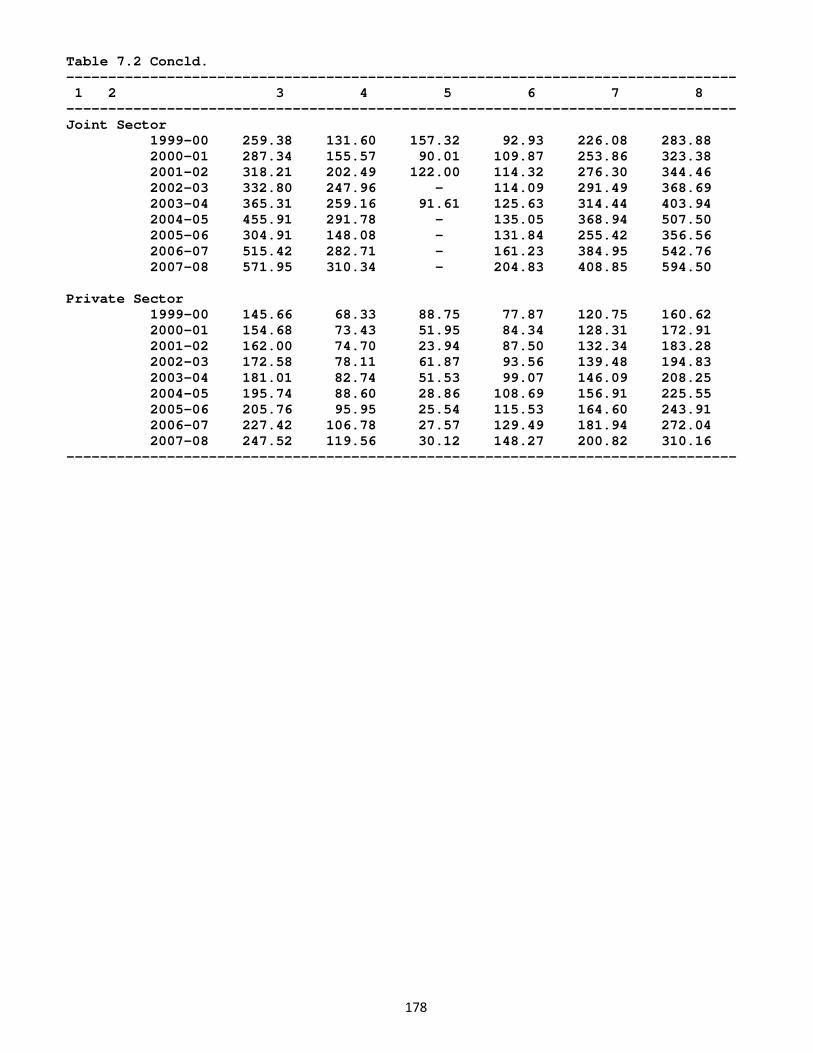
178
Table 7.2 Concld. -------------------------------------------------------------------------------- 1 2 3 4 5 6 7 8 -------------------------------------------------------------------------------- Joint Sector 1999-00 259.38 131.60 157.32 92.93 226.08 283.88 2000-01 287.34 155.57 90.01 109.87 253.86 323.38 2001-02 318.21 202.49 122.00 114.32 276.30 344.46 2002-03 332.80 247.96 - 114.09 291.49 368.69 2003-04 365.31 259.16 91.61 125.63 314.44 403.94 2004-05 455.91 291.78 - 135.05 368.94 507.50 2005-06 304.91 148.08 - 131.84 255.42 356.56 2006-07 515.42 282.71 - 161.23 384.95 542.76 2007-08 571.95 310.34 - 204.83 408.85 594.50 Private Sector 1999-00 145.66 68.33 88.75 77.87 120.75 160.62 2000-01 154.68 73.43 51.95 84.34 128.31 172.91 2001-02 162.00 74.70 23.94 87.50 132.34 183.28 2002-03 172.58 78.11 61.87 93.56 139.48 194.83 2003-04 181.01 82.74 51.53 99.07 146.09 208.25 2004-05 195.74 88.60 28.86 108.69 156.91 225.55 2005-06 205.76 95.95 25.54 115.53 164.60 243.91 2006-07 227.42 106.78 27.57 129.49 181.94 272.04 2007-08 247.52 119.56 30.12 148.27 200.82 310.16 --------------------------------------------------------------------------------
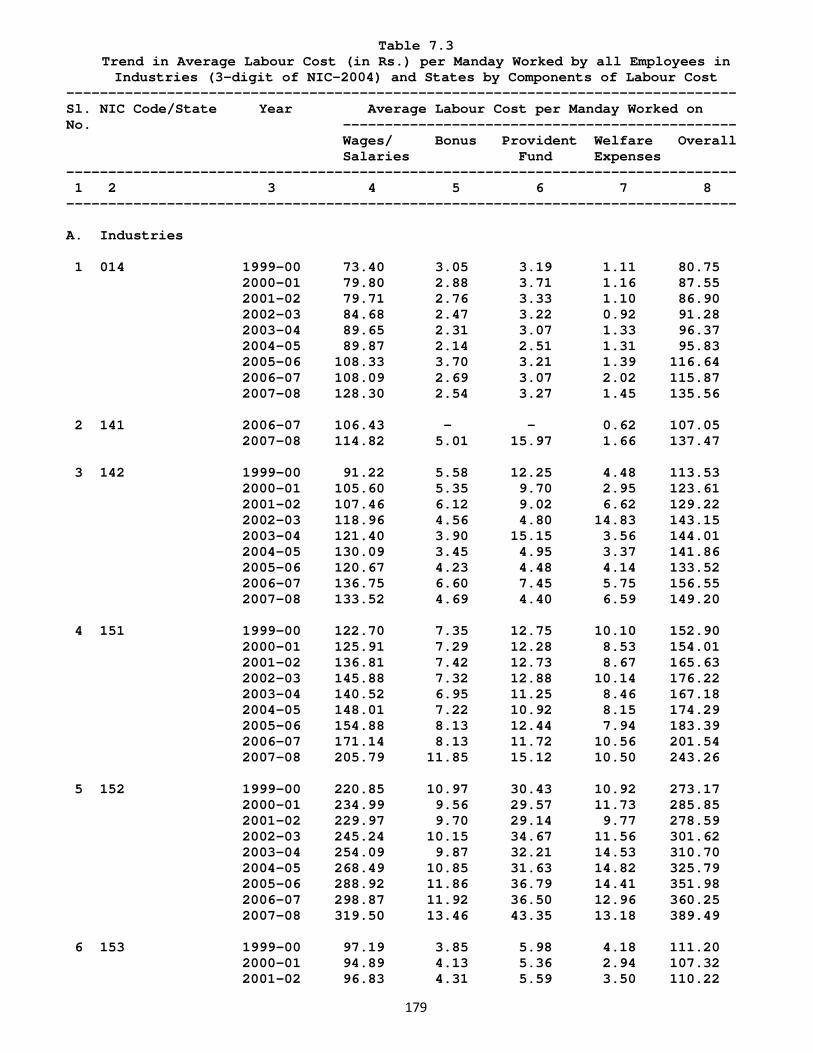
179
Table 7.3 Trend in Average Labour Cost (in Rs.) per Manday Worked by all Employees in Industries (3-digit of NIC-2004) and States by Components of Labour Cost
-------------------------------------------------------------------------------- Sl. NIC Code/State Year Average Labour Cost per Manday Worked on No. ----------------------------------------------- Wages/ Bonus Provident Welfare Overall Salaries Fund Expenses -------------------------------------------------------------------------------- 1 2 3 4 5 6 7 8 -------------------------------------------------------------------------------- A. Industries 1 014 1999-00 73.40 3.05 3.19 1.11 80.75 2000-01 79.80 2.88 3.71 1.16 87.55 2001-02 79.71 2.76 3.33 1.10 86.90 2002-03 84.68 2.47 3.22 0.92 91.28 2003-04 89.65 2.31 3.07 1.33 96.37 2004-05 89.87 2.14 2.51 1.31 95.83 2005-06 108.33 3.70 3.21 1.39 116.64 2006-07 108.09 2.69 3.07 2.02 115.87 2007-08 128.30 2.54 3.27 1.45 135.56 2 141 2006-07 106.43 - - 0.62 107.05 2007-08 114.82 5.01 15.97 1.66 137.47 3 142 1999-00 91.22 5.58 12.25 4.48 113.53 2000-01 105.60 5.35 9.70 2.95 123.61 2001-02 107.46 6.12 9.02 6.62 129.22 2002-03 118.96 4.56 4.80 14.83 143.15 2003-04 121.40 3.90 15.15 3.56 144.01 2004-05 130.09 3.45 4.95 3.37 141.86 2005-06 120.67 4.23 4.48 4.14 133.52 2006-07 136.75 6.60 7.45 5.75 156.55 2007-08 133.52 4.69 4.40 6.59 149.20 4 151 1999-00 122.70 7.35 12.75 10.10 152.90 2000-01 125.91 7.29 12.28 8.53 154.01 2001-02 136.81 7.42 12.73 8.67 165.63 2002-03 145.88 7.32 12.88 10.14 176.22 2003-04 140.52 6.95 11.25 8.46 167.18 2004-05 148.01 7.22 10.92 8.15 174.29 2005-06 154.88 8.13 12.44 7.94 183.39 2006-07 171.14 8.13 11.72 10.56 201.54 2007-08 205.79 11.85 15.12 10.50 243.26 5 152 1999-00 220.85 10.97 30.43 10.92 273.17 2000-01 234.99 9.56 29.57 11.73 285.85 2001-02 229.97 9.70 29.14 9.77 278.59 2002-03 245.24 10.15 34.67 11.56 301.62 2003-04 254.09 9.87 32.21 14.53 310.70 2004-05 268.49 10.85 31.63 14.82 325.79 2005-06 288.92 11.86 36.79 14.41 351.98 2006-07 298.87 11.92 36.50 12.96 360.25 2007-08 319.50 13.46 43.35 13.18 389.49 6 153 1999-00 97.19 3.85 5.98 4.18 111.20 2000-01 94.89 4.13 5.36 2.94 107.32 2001-02 96.83 4.31 5.59 3.50 110.22
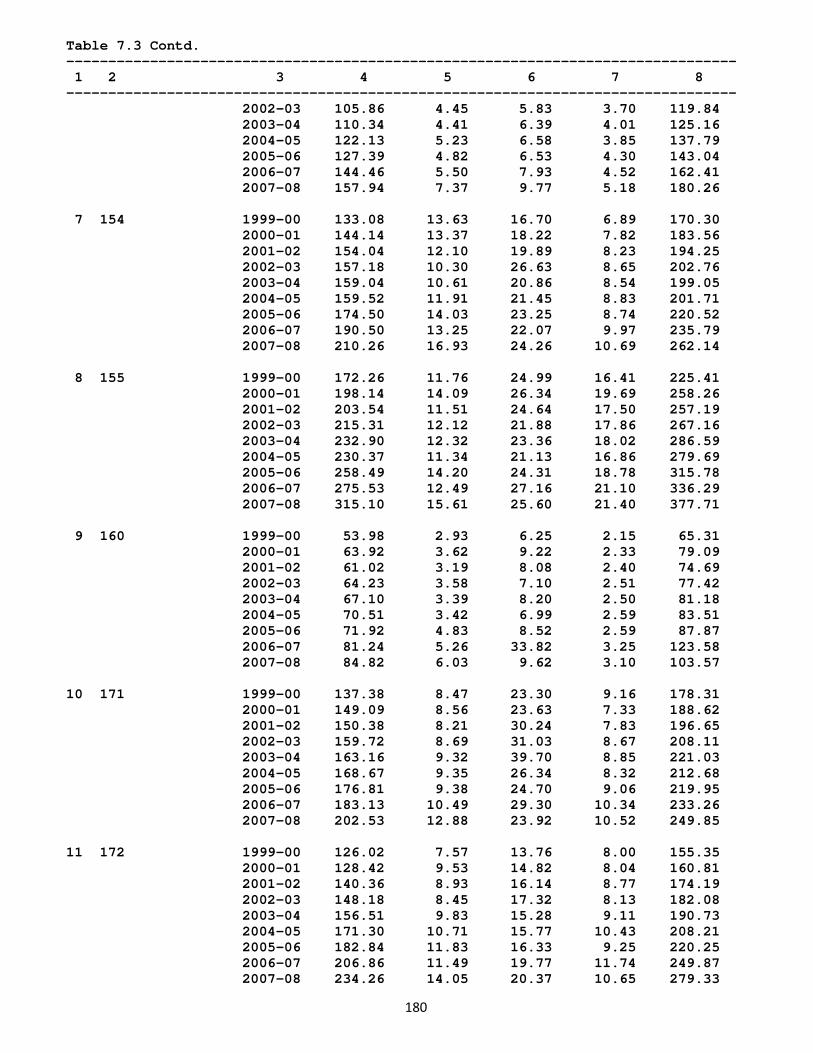
180
Table 7.3 Contd. -------------------------------------------------------------------------------- 1 2 3 4 5 6 7 8 -------------------------------------------------------------------------------- 2002-03 105.86 4.45 5.83 3.70 119.84 2003-04 110.34 4.41 6.39 4.01 125.16 2004-05 122.13 5.23 6.58 3.85 137.79 2005-06 127.39 4.82 6.53 4.30 143.04 2006-07 144.46 5.50 7.93 4.52 162.41 2007-08 157.94 7.37 9.77 5.18 180.26 7 154 1999-00 133.08 13.63 16.70 6.89 170.30 2000-01 144.14 13.37 18.22 7.82 183.56 2001-02 154.04 12.10 19.89 8.23 194.25 2002-03 157.18 10.30 26.63 8.65 202.76 2003-04 159.04 10.61 20.86 8.54 199.05 2004-05 159.52 11.91 21.45 8.83 201.71 2005-06 174.50 14.03 23.25 8.74 220.52 2006-07 190.50 13.25 22.07 9.97 235.79 2007-08 210.26 16.93 24.26 10.69 262.14 8 155 1999-00 172.26 11.76 24.99 16.41 225.41 2000-01 198.14 14.09 26.34 19.69 258.26 2001-02 203.54 11.51 24.64 17.50 257.19 2002-03 215.31 12.12 21.88 17.86 267.16 2003-04 232.90 12.32 23.36 18.02 286.59 2004-05 230.37 11.34 21.13 16.86 279.69 2005-06 258.49 14.20 24.31 18.78 315.78 2006-07 275.53 12.49 27.16 21.10 336.29 2007-08 315.10 15.61 25.60 21.40 377.71 9 160 1999-00 53.98 2.93 6.25 2.15 65.31 2000-01 63.92 3.62 9.22 2.33 79.09 2001-02 61.02 3.19 8.08 2.40 74.69 2002-03 64.23 3.58 7.10 2.51 77.42 2003-04 67.10 3.39 8.20 2.50 81.18 2004-05 70.51 3.42 6.99 2.59 83.51 2005-06 71.92 4.83 8.52 2.59 87.87 2006-07 81.24 5.26 33.82 3.25 123.58 2007-08 84.82 6.03 9.62 3.10 103.57 10 171 1999-00 137.38 8.47 23.30 9.16 178.31 2000-01 149.09 8.56 23.63 7.33 188.62 2001-02 150.38 8.21 30.24 7.83 196.65 2002-03 159.72 8.69 31.03 8.67 208.11 2003-04 163.16 9.32 39.70 8.85 221.03 2004-05 168.67 9.35 26.34 8.32 212.68 2005-06 176.81 9.38 24.70 9.06 219.95 2006-07 183.13 10.49 29.30 10.34 233.26 2007-08 202.53 12.88 23.92 10.52 249.85 11 172 1999-00 126.02 7.57 13.76 8.00 155.35 2000-01 128.42 9.53 14.82 8.04 160.81 2001-02 140.36 8.93 16.14 8.77 174.19 2002-03 148.18 8.45 17.32 8.13 182.08 2003-04 156.51 9.83 15.28 9.11 190.73 2004-05 171.30 10.71 15.77 10.43 208.21 2005-06 182.84 11.83 16.33 9.25 220.25 2006-07 206.86 11.49 19.77 11.74 249.87 2007-08 234.26 14.05 20.37 10.65 279.33
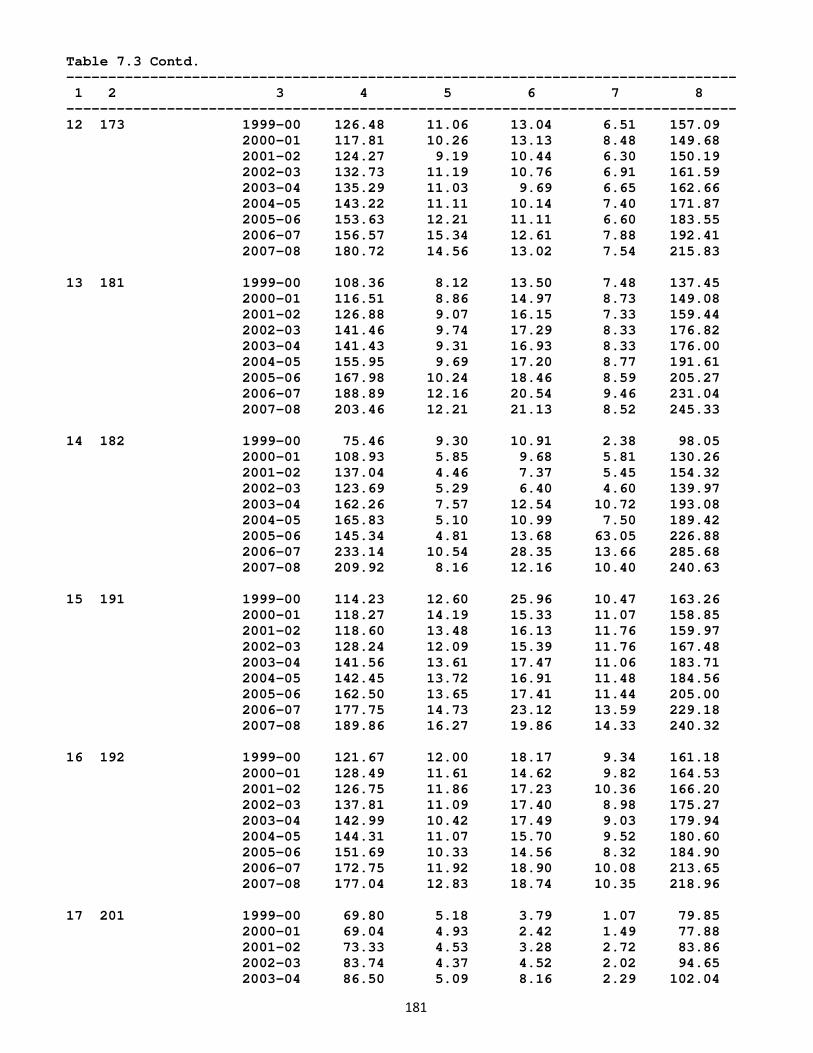
181
Table 7.3 Contd. -------------------------------------------------------------------------------- 1 2 3 4 5 6 7 8 -------------------------------------------------------------------------------- 12 173 1999-00 126.48 11.06 13.04 6.51 157.09 2000-01 117.81 10.26 13.13 8.48 149.68 2001-02 124.27 9.19 10.44 6.30 150.19 2002-03 132.73 11.19 10.76 6.91 161.59 2003-04 135.29 11.03 9.69 6.65 162.66 2004-05 143.22 11.11 10.14 7.40 171.87 2005-06 153.63 12.21 11.11 6.60 183.55 2006-07 156.57 15.34 12.61 7.88 192.41 2007-08 180.72 14.56 13.02 7.54 215.83 13 181 1999-00 108.36 8.12 13.50 7.48 137.45 2000-01 116.51 8.86 14.97 8.73 149.08 2001-02 126.88 9.07 16.15 7.33 159.44 2002-03 141.46 9.74 17.29 8.33 176.82 2003-04 141.43 9.31 16.93 8.33 176.00 2004-05 155.95 9.69 17.20 8.77 191.61 2005-06 167.98 10.24 18.46 8.59 205.27 2006-07 188.89 12.16 20.54 9.46 231.04 2007-08 203.46 12.21 21.13 8.52 245.33 14 182 1999-00 75.46 9.30 10.91 2.38 98.05 2000-01 108.93 5.85 9.68 5.81 130.26 2001-02 137.04 4.46 7.37 5.45 154.32 2002-03 123.69 5.29 6.40 4.60 139.97 2003-04 162.26 7.57 12.54 10.72 193.08 2004-05 165.83 5.10 10.99 7.50 189.42 2005-06 145.34 4.81 13.68 63.05 226.88 2006-07 233.14 10.54 28.35 13.66 285.68 2007-08 209.92 8.16 12.16 10.40 240.63 15 191 1999-00 114.23 12.60 25.96 10.47 163.26 2000-01 118.27 14.19 15.33 11.07 158.85 2001-02 118.60 13.48 16.13 11.76 159.97 2002-03 128.24 12.09 15.39 11.76 167.48 2003-04 141.56 13.61 17.47 11.06 183.71 2004-05 142.45 13.72 16.91 11.48 184.56 2005-06 162.50 13.65 17.41 11.44 205.00 2006-07 177.75 14.73 23.12 13.59 229.18 2007-08 189.86 16.27 19.86 14.33 240.32 16 192 1999-00 121.67 12.00 18.17 9.34 161.18 2000-01 128.49 11.61 14.62 9.82 164.53 2001-02 126.75 11.86 17.23 10.36 166.20 2002-03 137.81 11.09 17.40 8.98 175.27 2003-04 142.99 10.42 17.49 9.03 179.94 2004-05 144.31 11.07 15.70 9.52 180.60 2005-06 151.69 10.33 14.56 8.32 184.90 2006-07 172.75 11.92 18.90 10.08 213.65 2007-08 177.04 12.83 18.74 10.35 218.96 17 201 1999-00 69.80 5.18 3.79 1.07 79.85 2000-01 69.04 4.93 2.42 1.49 77.88 2001-02 73.33 4.53 3.28 2.72 83.86 2002-03 83.74 4.37 4.52 2.02 94.65 2003-04 86.50 5.09 8.16 2.29 102.04
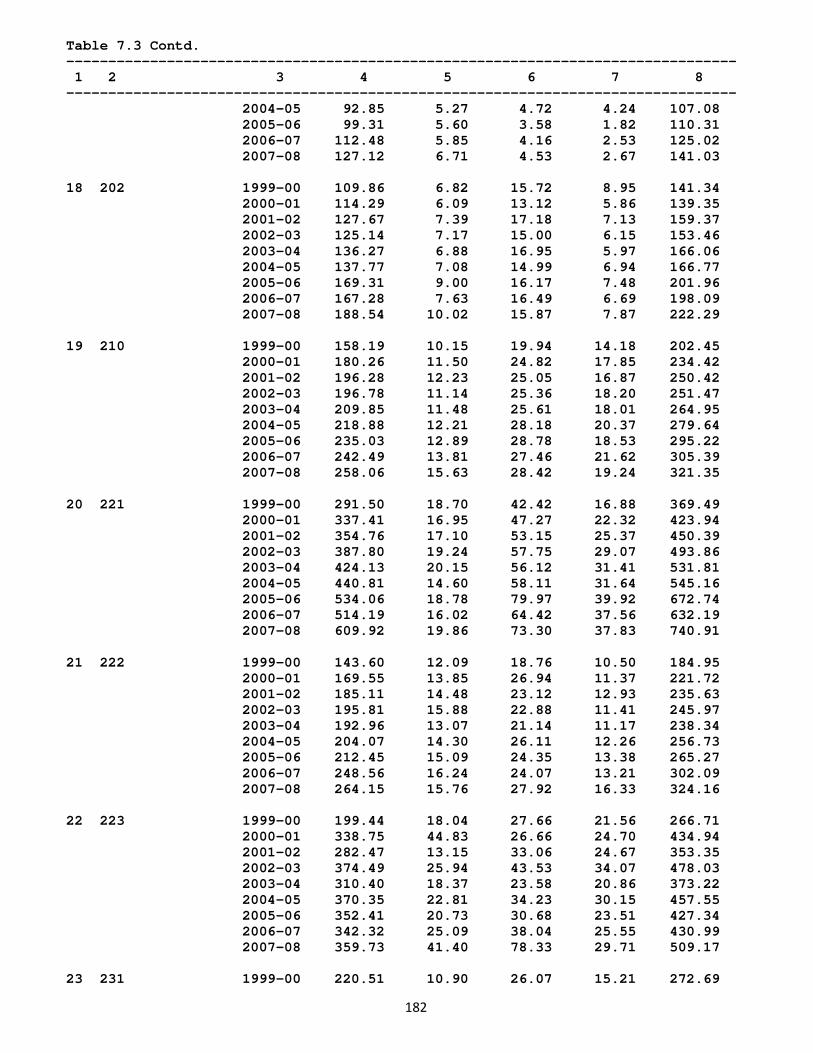
182
Table 7.3 Contd. -------------------------------------------------------------------------------- 1 2 3 4 5 6 7 8 -------------------------------------------------------------------------------- 2004-05 92.85 5.27 4.72 4.24 107.08 2005-06 99.31 5.60 3.58 1.82 110.31 2006-07 112.48 5.85 4.16 2.53 125.02 2007-08 127.12 6.71 4.53 2.67 141.03 18 202 1999-00 109.86 6.82 15.72 8.95 141.34 2000-01 114.29 6.09 13.12 5.86 139.35 2001-02 127.67 7.39 17.18 7.13 159.37 2002-03 125.14 7.17 15.00 6.15 153.46 2003-04 136.27 6.88 16.95 5.97 166.06 2004-05 137.77 7.08 14.99 6.94 166.77 2005-06 169.31 9.00 16.17 7.48 201.96 2006-07 167.28 7.63 16.49 6.69 198.09 2007-08 188.54 10.02 15.87 7.87 222.29 19 210 1999-00 158.19 10.15 19.94 14.18 202.45 2000-01 180.26 11.50 24.82 17.85 234.42 2001-02 196.28 12.23 25.05 16.87 250.42 2002-03 196.78 11.14 25.36 18.20 251.47 2003-04 209.85 11.48 25.61 18.01 264.95 2004-05 218.88 12.21 28.18 20.37 279.64 2005-06 235.03 12.89 28.78 18.53 295.22 2006-07 242.49 13.81 27.46 21.62 305.39 2007-08 258.06 15.63 28.42 19.24 321.35 20 221 1999-00 291.50 18.70 42.42 16.88 369.49 2000-01 337.41 16.95 47.27 22.32 423.94 2001-02 354.76 17.10 53.15 25.37 450.39 2002-03 387.80 19.24 57.75 29.07 493.86 2003-04 424.13 20.15 56.12 31.41 531.81 2004-05 440.81 14.60 58.11 31.64 545.16 2005-06 534.06 18.78 79.97 39.92 672.74 2006-07 514.19 16.02 64.42 37.56 632.19 2007-08 609.92 19.86 73.30 37.83 740.91 21 222 1999-00 143.60 12.09 18.76 10.50 184.95 2000-01 169.55 13.85 26.94 11.37 221.72 2001-02 185.11 14.48 23.12 12.93 235.63 2002-03 195.81 15.88 22.88 11.41 245.97 2003-04 192.96 13.07 21.14 11.17 238.34 2004-05 204.07 14.30 26.11 12.26 256.73 2005-06 212.45 15.09 24.35 13.38 265.27 2006-07 248.56 16.24 24.07 13.21 302.09 2007-08 264.15 15.76 27.92 16.33 324.16 22 223 1999-00 199.44 18.04 27.66 21.56 266.71 2000-01 338.75 44.83 26.66 24.70 434.94 2001-02 282.47 13.15 33.06 24.67 353.35 2002-03 374.49 25.94 43.53 34.07 478.03 2003-04 310.40 18.37 23.58 20.86 373.22 2004-05 370.35 22.81 34.23 30.15 457.55 2005-06 352.41 20.73 30.68 23.51 427.34 2006-07 342.32 25.09 38.04 25.55 430.99 2007-08 359.73 41.40 78.33 29.71 509.17 23 231 1999-00 220.51 10.90 26.07 15.21 272.69
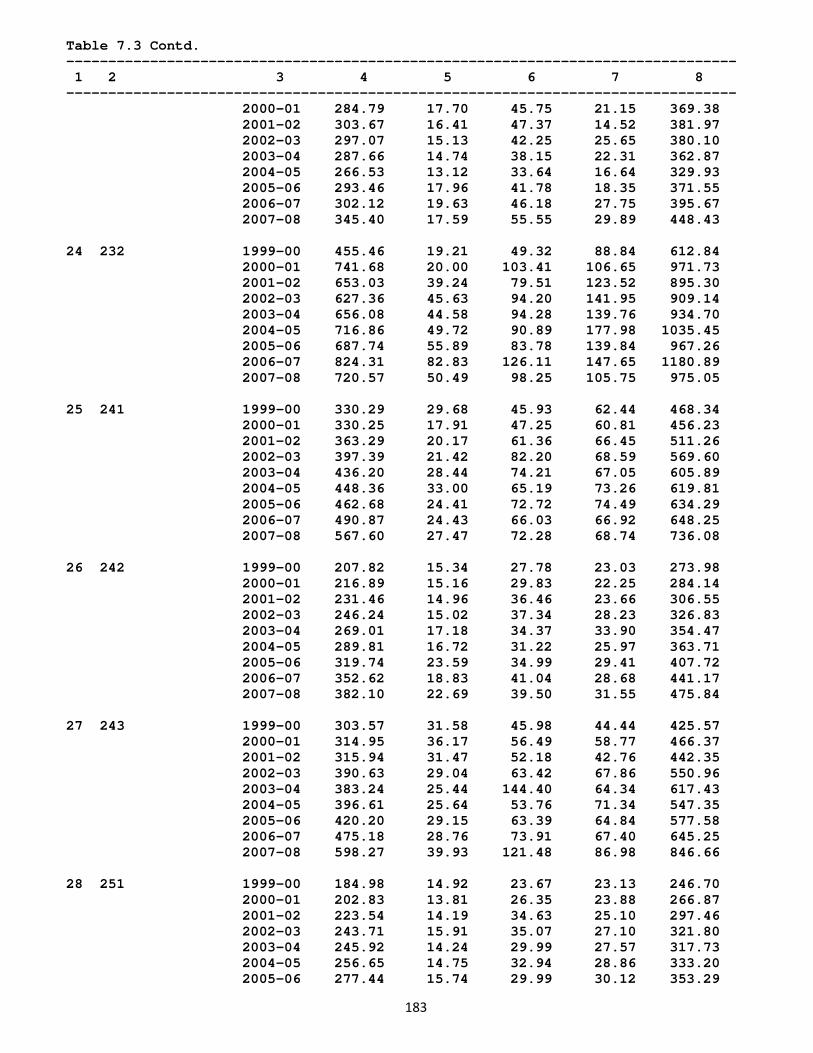
183
Table 7.3 Contd. -------------------------------------------------------------------------------- 1 2 3 4 5 6 7 8 -------------------------------------------------------------------------------- 2000-01 284.79 17.70 45.75 21.15 369.38 2001-02 303.67 16.41 47.37 14.52 381.97 2002-03 297.07 15.13 42.25 25.65 380.10 2003-04 287.66 14.74 38.15 22.31 362.87 2004-05 266.53 13.12 33.64 16.64 329.93 2005-06 293.46 17.96 41.78 18.35 371.55 2006-07 302.12 19.63 46.18 27.75 395.67 2007-08 345.40 17.59 55.55 29.89 448.43 24 232 1999-00 455.46 19.21 49.32 88.84 612.84 2000-01 741.68 20.00 103.41 106.65 971.73 2001-02 653.03 39.24 79.51 123.52 895.30 2002-03 627.36 45.63 94.20 141.95 909.14 2003-04 656.08 44.58 94.28 139.76 934.70 2004-05 716.86 49.72 90.89 177.98 1035.45 2005-06 687.74 55.89 83.78 139.84 967.26 2006-07 824.31 82.83 126.11 147.65 1180.89 2007-08 720.57 50.49 98.25 105.75 975.05 25 241 1999-00 330.29 29.68 45.93 62.44 468.34 2000-01 330.25 17.91 47.25 60.81 456.23 2001-02 363.29 20.17 61.36 66.45 511.26 2002-03 397.39 21.42 82.20 68.59 569.60 2003-04 436.20 28.44 74.21 67.05 605.89 2004-05 448.36 33.00 65.19 73.26 619.81 2005-06 462.68 24.41 72.72 74.49 634.29 2006-07 490.87 24.43 66.03 66.92 648.25 2007-08 567.60 27.47 72.28 68.74 736.08 26 242 1999-00 207.82 15.34 27.78 23.03 273.98 2000-01 216.89 15.16 29.83 22.25 284.14 2001-02 231.46 14.96 36.46 23.66 306.55 2002-03 246.24 15.02 37.34 28.23 326.83 2003-04 269.01 17.18 34.37 33.90 354.47 2004-05 289.81 16.72 31.22 25.97 363.71 2005-06 319.74 23.59 34.99 29.41 407.72 2006-07 352.62 18.83 41.04 28.68 441.17 2007-08 382.10 22.69 39.50 31.55 475.84 27 243 1999-00 303.57 31.58 45.98 44.44 425.57 2000-01 314.95 36.17 56.49 58.77 466.37 2001-02 315.94 31.47 52.18 42.76 442.35 2002-03 390.63 29.04 63.42 67.86 550.96 2003-04 383.24 25.44 144.40 64.34 617.43 2004-05 396.61 25.64 53.76 71.34 547.35 2005-06 420.20 29.15 63.39 64.84 577.58 2006-07 475.18 28.76 73.91 67.40 645.25 2007-08 598.27 39.93 121.48 86.98 846.66 28 251 1999-00 184.98 14.92 23.67 23.13 246.70 2000-01 202.83 13.81 26.35 23.88 266.87 2001-02 223.54 14.19 34.63 25.10 297.46 2002-03 243.71 15.91 35.07 27.10 321.80 2003-04 245.92 14.24 29.99 27.57 317.73 2004-05 256.65 14.75 32.94 28.86 333.20 2005-06 277.44 15.74 29.99 30.12 353.29
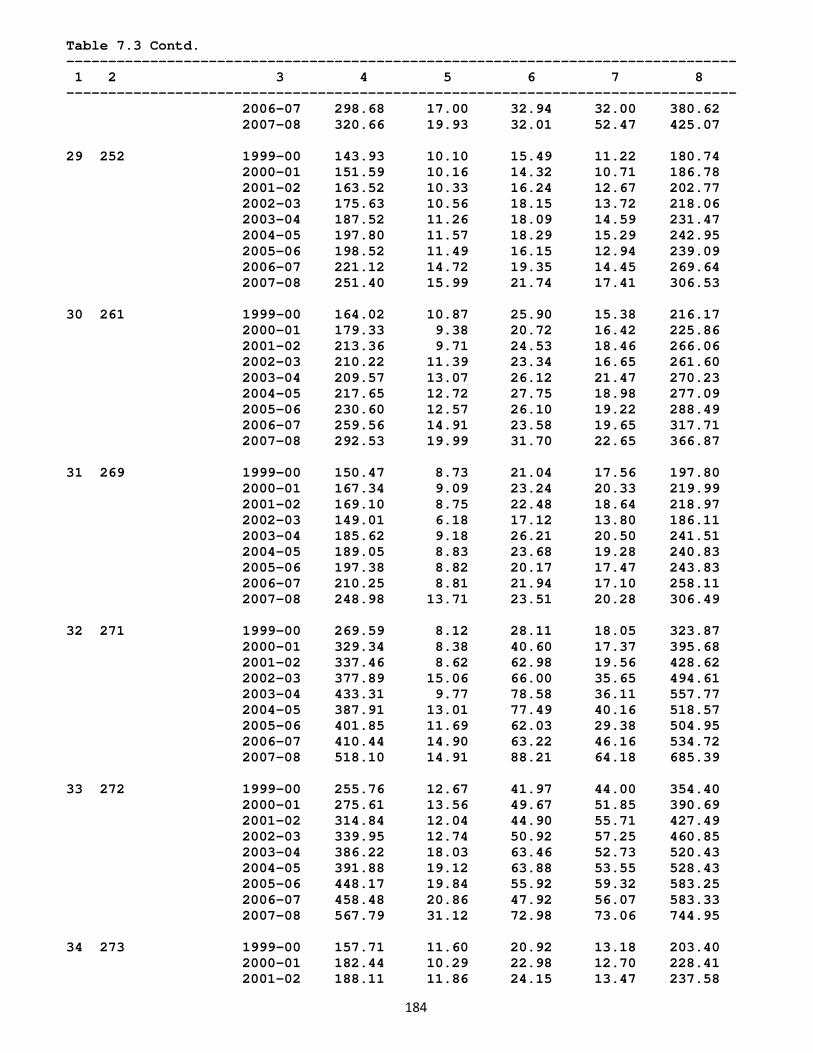
184
Table 7.3 Contd. -------------------------------------------------------------------------------- 1 2 3 4 5 6 7 8 -------------------------------------------------------------------------------- 2006-07 298.68 17.00 32.94 32.00 380.62 2007-08 320.66 19.93 32.01 52.47 425.07 29 252 1999-00 143.93 10.10 15.49 11.22 180.74 2000-01 151.59 10.16 14.32 10.71 186.78 2001-02 163.52 10.33 16.24 12.67 202.77 2002-03 175.63 10.56 18.15 13.72 218.06 2003-04 187.52 11.26 18.09 14.59 231.47 2004-05 197.80 11.57 18.29 15.29 242.95 2005-06 198.52 11.49 16.15 12.94 239.09 2006-07 221.12 14.72 19.35 14.45 269.64 2007-08 251.40 15.99 21.74 17.41 306.53 30 261 1999-00 164.02 10.87 25.90 15.38 216.17 2000-01 179.33 9.38 20.72 16.42 225.86 2001-02 213.36 9.71 24.53 18.46 266.06 2002-03 210.22 11.39 23.34 16.65 261.60 2003-04 209.57 13.07 26.12 21.47 270.23 2004-05 217.65 12.72 27.75 18.98 277.09 2005-06 230.60 12.57 26.10 19.22 288.49 2006-07 259.56 14.91 23.58 19.65 317.71 2007-08 292.53 19.99 31.70 22.65 366.87 31 269 1999-00 150.47 8.73 21.04 17.56 197.80 2000-01 167.34 9.09 23.24 20.33 219.99 2001-02 169.10 8.75 22.48 18.64 218.97 2002-03 149.01 6.18 17.12 13.80 186.11 2003-04 185.62 9.18 26.21 20.50 241.51 2004-05 189.05 8.83 23.68 19.28 240.83 2005-06 197.38 8.82 20.17 17.47 243.83 2006-07 210.25 8.81 21.94 17.10 258.11 2007-08 248.98 13.71 23.51 20.28 306.49 32 271 1999-00 269.59 8.12 28.11 18.05 323.87 2000-01 329.34 8.38 40.60 17.37 395.68 2001-02 337.46 8.62 62.98 19.56 428.62 2002-03 377.89 15.06 66.00 35.65 494.61 2003-04 433.31 9.77 78.58 36.11 557.77 2004-05 387.91 13.01 77.49 40.16 518.57 2005-06 401.85 11.69 62.03 29.38 504.95 2006-07 410.44 14.90 63.22 46.16 534.72 2007-08 518.10 14.91 88.21 64.18 685.39 33 272 1999-00 255.76 12.67 41.97 44.00 354.40 2000-01 275.61 13.56 49.67 51.85 390.69 2001-02 314.84 12.04 44.90 55.71 427.49 2002-03 339.95 12.74 50.92 57.25 460.85 2003-04 386.22 18.03 63.46 52.73 520.43 2004-05 391.88 19.12 63.88 53.55 528.43 2005-06 448.17 19.84 55.92 59.32 583.25 2006-07 458.48 20.86 47.92 56.07 583.33 2007-08 567.79 31.12 72.98 73.06 744.95 34 273 1999-00 157.71 11.60 20.92 13.18 203.40 2000-01 182.44 10.29 22.98 12.70 228.41 2001-02 188.11 11.86 24.15 13.47 237.58

185
Table 7.3 Contd. -------------------------------------------------------------------------------- 1 2 3 4 5 6 7 8 -------------------------------------------------------------------------------- 2002-03 207.99 12.12 25.00 14.19 259.30 2003-04 206.59 12.28 26.44 16.30 261.61 2004-05 218.55 13.60 27.29 17.95 277.40 2005-06 219.41 13.41 21.59 15.82 270.23 2006-07 235.96 13.67 22.03 16.54 288.20 2007-08 270.10 16.00 24.64 21.14 331.89 35 281 1999-00 201.64 9.96 24.08 19.26 254.94 2000-01 274.80 9.38 34.56 24.49 343.22 2001-02 270.76 11.03 57.20 23.19 362.18 2002-03 280.33 11.13 42.61 22.66 356.74 2003-04 286.45 10.64 68.64 17.21 382.96 2004-05 278.72 9.17 39.94 14.22 342.05 2005-06 289.76 11.24 37.82 16.63 355.46 2006-07 332.03 13.83 28.91 23.13 397.90 2007-08 371.06 16.92 28.11 15.07 431.16 36 289 1999-00 174.97 11.55 40.74 14.61 241.86 2000-01 172.39 12.02 23.41 14.31 222.14 2001-02 183.12 11.87 22.61 15.00 232.61 2002-03 195.75 10.66 23.04 15.14 244.59 2003-04 199.04 12.52 22.48 16.35 250.39 2004-05 217.56 13.27 21.36 17.43 269.62 2005-06 237.66 15.61 22.59 16.50 292.36 2006-07 258.28 14.92 24.17 17.83 315.21 2007-08 282.55 17.10 24.70 19.06 343.41 37 291 1999-00 273.29 17.37 38.75 32.94 362.35 2000-01 321.29 19.73 52.47 34.57 428.06 2001-02 322.43 19.29 65.27 36.05 443.04 2002-03 337.36 21.07 55.88 36.31 450.62 2003-04 362.58 21.97 60.26 42.19 487.01 2004-05 371.42 19.92 53.27 38.74 483.35 2005-06 411.83 24.58 53.41 43.73 533.55 2006-07 435.14 26.45 50.81 46.12 558.52 2007-08 511.36 26.94 50.95 48.09 637.34 38 292 1999-00 259.42 19.07 122.51 35.28 436.28 2000-01 284.18 18.03 46.18 36.11 384.50 2001-02 317.69 19.15 64.80 34.93 436.58 2002-03 320.64 19.80 55.50 40.10 436.04 2003-04 338.33 22.54 57.89 45.04 463.80 2004-05 349.58 21.20 56.76 50.34 477.88 2005-06 389.54 21.42 57.77 42.51 511.25 2006-07 434.22 23.31 60.56 55.62 573.71 2007-08 475.38 29.54 55.80 51.40 612.12 39 293 1999-00 236.49 16.56 32.52 35.23 320.80 2000-01 243.43 13.67 31.48 22.76 311.34 2001-02 261.45 15.86 37.58 25.90 340.79 2002-03 261.41 13.98 87.38 25.72 388.49 2003-04 285.84 14.63 71.33 28.18 399.97 2004-05 277.90 16.79 61.73 26.94 383.36 2005-06 276.56 10.76 27.70 24.24 339.26 2006-07 267.73 13.23 26.79 23.87 331.62 2007-08 305.21 17.35 29.68 27.56 379.79
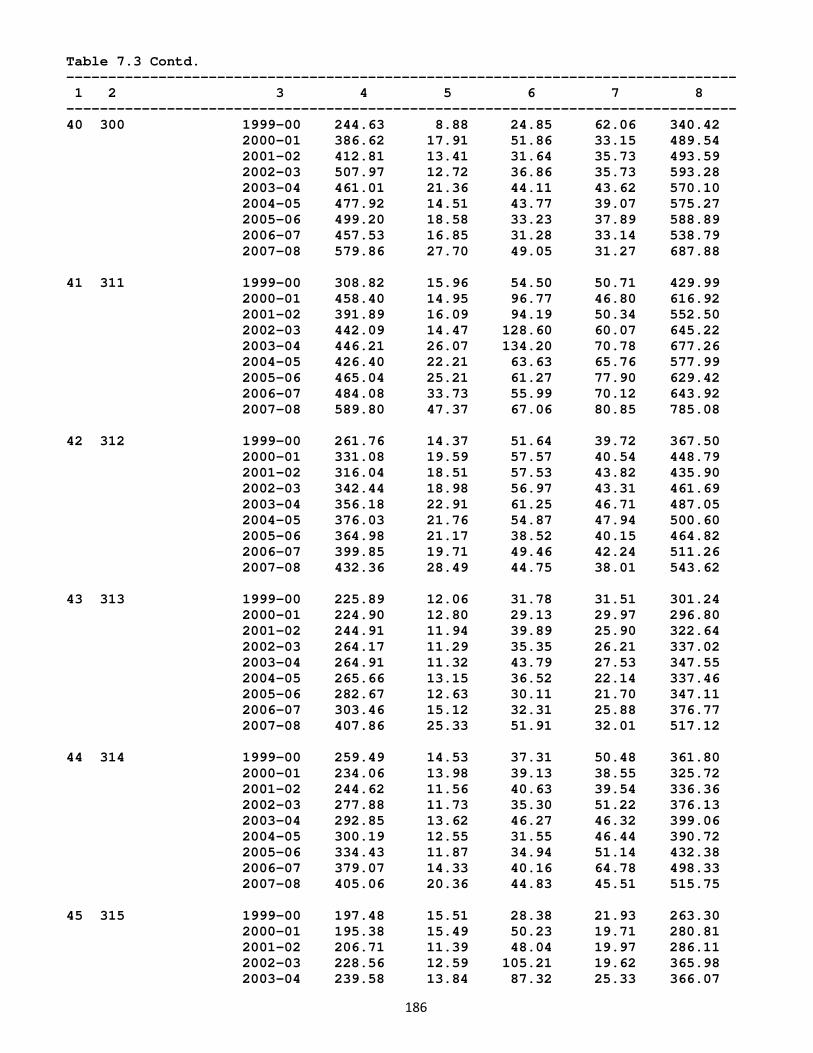
186
Table 7.3 Contd. -------------------------------------------------------------------------------- 1 2 3 4 5 6 7 8 -------------------------------------------------------------------------------- 40 300 1999-00 244.63 8.88 24.85 62.06 340.42 2000-01 386.62 17.91 51.86 33.15 489.54 2001-02 412.81 13.41 31.64 35.73 493.59 2002-03 507.97 12.72 36.86 35.73 593.28 2003-04 461.01 21.36 44.11 43.62 570.10 2004-05 477.92 14.51 43.77 39.07 575.27 2005-06 499.20 18.58 33.23 37.89 588.89 2006-07 457.53 16.85 31.28 33.14 538.79 2007-08 579.86 27.70 49.05 31.27 687.88 41 311 1999-00 308.82 15.96 54.50 50.71 429.99 2000-01 458.40 14.95 96.77 46.80 616.92 2001-02 391.89 16.09 94.19 50.34 552.50 2002-03 442.09 14.47 128.60 60.07 645.22 2003-04 446.21 26.07 134.20 70.78 677.26 2004-05 426.40 22.21 63.63 65.76 577.99 2005-06 465.04 25.21 61.27 77.90 629.42 2006-07 484.08 33.73 55.99 70.12 643.92 2007-08 589.80 47.37 67.06 80.85 785.08 42 312 1999-00 261.76 14.37 51.64 39.72 367.50 2000-01 331.08 19.59 57.57 40.54 448.79 2001-02 316.04 18.51 57.53 43.82 435.90 2002-03 342.44 18.98 56.97 43.31 461.69 2003-04 356.18 22.91 61.25 46.71 487.05 2004-05 376.03 21.76 54.87 47.94 500.60 2005-06 364.98 21.17 38.52 40.15 464.82 2006-07 399.85 19.71 49.46 42.24 511.26 2007-08 432.36 28.49 44.75 38.01 543.62 43 313 1999-00 225.89 12.06 31.78 31.51 301.24 2000-01 224.90 12.80 29.13 29.97 296.80 2001-02 244.91 11.94 39.89 25.90 322.64 2002-03 264.17 11.29 35.35 26.21 337.02 2003-04 264.91 11.32 43.79 27.53 347.55 2004-05 265.66 13.15 36.52 22.14 337.46 2005-06 282.67 12.63 30.11 21.70 347.11 2006-07 303.46 15.12 32.31 25.88 376.77 2007-08 407.86 25.33 51.91 32.01 517.12 44 314 1999-00 259.49 14.53 37.31 50.48 361.80 2000-01 234.06 13.98 39.13 38.55 325.72 2001-02 244.62 11.56 40.63 39.54 336.36 2002-03 277.88 11.73 35.30 51.22 376.13 2003-04 292.85 13.62 46.27 46.32 399.06 2004-05 300.19 12.55 31.55 46.44 390.72 2005-06 334.43 11.87 34.94 51.14 432.38 2006-07 379.07 14.33 40.16 64.78 498.33 2007-08 405.06 20.36 44.83 45.51 515.75 45 315 1999-00 197.48 15.51 28.38 21.93 263.30 2000-01 195.38 15.49 50.23 19.71 280.81 2001-02 206.71 11.39 48.04 19.97 286.11 2002-03 228.56 12.59 105.21 19.62 365.98 2003-04 239.58 13.84 87.32 25.33 366.07
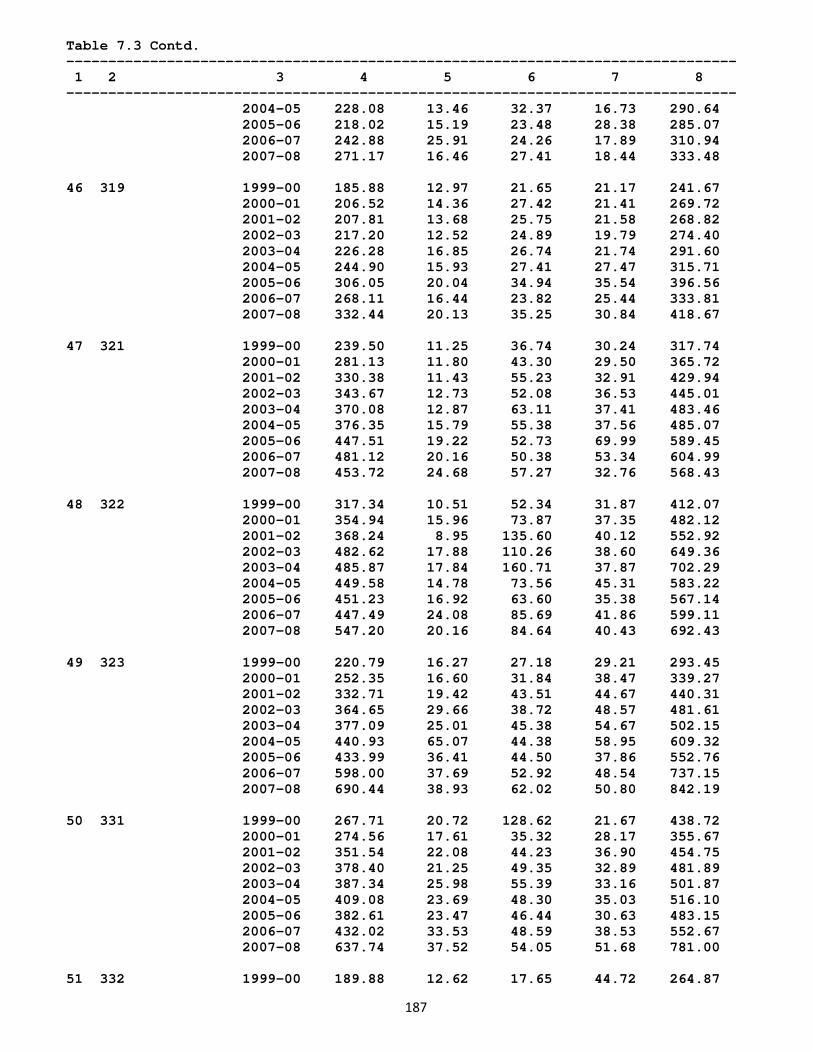
187
Table 7.3 Contd. -------------------------------------------------------------------------------- 1 2 3 4 5 6 7 8 -------------------------------------------------------------------------------- 2004-05 228.08 13.46 32.37 16.73 290.64 2005-06 218.02 15.19 23.48 28.38 285.07 2006-07 242.88 25.91 24.26 17.89 310.94 2007-08 271.17 16.46 27.41 18.44 333.48 46 319 1999-00 185.88 12.97 21.65 21.17 241.67 2000-01 206.52 14.36 27.42 21.41 269.72 2001-02 207.81 13.68 25.75 21.58 268.82 2002-03 217.20 12.52 24.89 19.79 274.40 2003-04 226.28 16.85 26.74 21.74 291.60 2004-05 244.90 15.93 27.41 27.47 315.71 2005-06 306.05 20.04 34.94 35.54 396.56 2006-07 268.11 16.44 23.82 25.44 333.81 2007-08 332.44 20.13 35.25 30.84 418.67 47 321 1999-00 239.50 11.25 36.74 30.24 317.74 2000-01 281.13 11.80 43.30 29.50 365.72 2001-02 330.38 11.43 55.23 32.91 429.94 2002-03 343.67 12.73 52.08 36.53 445.01 2003-04 370.08 12.87 63.11 37.41 483.46 2004-05 376.35 15.79 55.38 37.56 485.07 2005-06 447.51 19.22 52.73 69.99 589.45 2006-07 481.12 20.16 50.38 53.34 604.99 2007-08 453.72 24.68 57.27 32.76 568.43 48 322 1999-00 317.34 10.51 52.34 31.87 412.07 2000-01 354.94 15.96 73.87 37.35 482.12 2001-02 368.24 8.95 135.60 40.12 552.92 2002-03 482.62 17.88 110.26 38.60 649.36 2003-04 485.87 17.84 160.71 37.87 702.29 2004-05 449.58 14.78 73.56 45.31 583.22 2005-06 451.23 16.92 63.60 35.38 567.14 2006-07 447.49 24.08 85.69 41.86 599.11 2007-08 547.20 20.16 84.64 40.43 692.43 49 323 1999-00 220.79 16.27 27.18 29.21 293.45 2000-01 252.35 16.60 31.84 38.47 339.27 2001-02 332.71 19.42 43.51 44.67 440.31 2002-03 364.65 29.66 38.72 48.57 481.61 2003-04 377.09 25.01 45.38 54.67 502.15 2004-05 440.93 65.07 44.38 58.95 609.32 2005-06 433.99 36.41 44.50 37.86 552.76 2006-07 598.00 37.69 52.92 48.54 737.15 2007-08 690.44 38.93 62.02 50.80 842.19 50 331 1999-00 267.71 20.72 128.62 21.67 438.72 2000-01 274.56 17.61 35.32 28.17 355.67 2001-02 351.54 22.08 44.23 36.90 454.75 2002-03 378.40 21.25 49.35 32.89 481.89 2003-04 387.34 25.98 55.39 33.16 501.87 2004-05 409.08 23.69 48.30 35.03 516.10 2005-06 382.61 23.47 46.44 30.63 483.15 2006-07 432.02 33.53 48.59 38.53 552.67 2007-08 637.74 37.52 54.05 51.68 781.00 51 332 1999-00 189.88 12.62 17.65 44.72 264.87
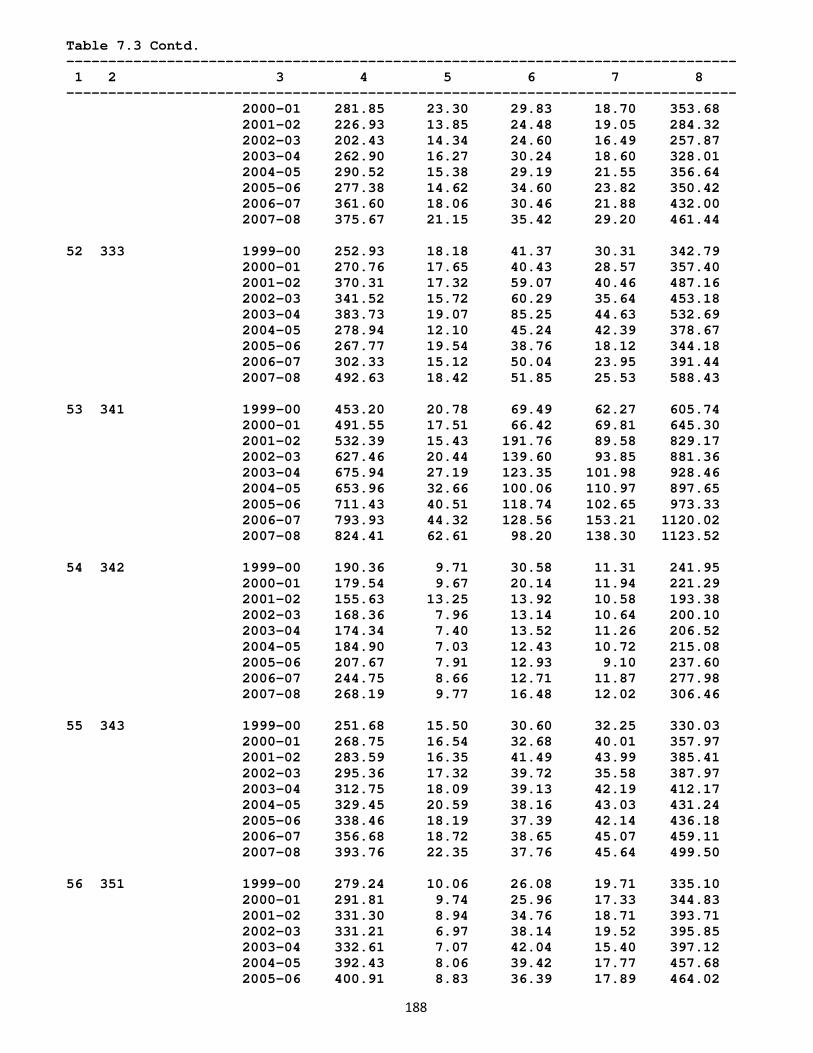
188
Table 7.3 Contd. -------------------------------------------------------------------------------- 1 2 3 4 5 6 7 8 -------------------------------------------------------------------------------- 2000-01 281.85 23.30 29.83 18.70 353.68 2001-02 226.93 13.85 24.48 19.05 284.32 2002-03 202.43 14.34 24.60 16.49 257.87 2003-04 262.90 16.27 30.24 18.60 328.01 2004-05 290.52 15.38 29.19 21.55 356.64 2005-06 277.38 14.62 34.60 23.82 350.42 2006-07 361.60 18.06 30.46 21.88 432.00 2007-08 375.67 21.15 35.42 29.20 461.44 52 333 1999-00 252.93 18.18 41.37 30.31 342.79 2000-01 270.76 17.65 40.43 28.57 357.40 2001-02 370.31 17.32 59.07 40.46 487.16 2002-03 341.52 15.72 60.29 35.64 453.18 2003-04 383.73 19.07 85.25 44.63 532.69 2004-05 278.94 12.10 45.24 42.39 378.67 2005-06 267.77 19.54 38.76 18.12 344.18 2006-07 302.33 15.12 50.04 23.95 391.44 2007-08 492.63 18.42 51.85 25.53 588.43 53 341 1999-00 453.20 20.78 69.49 62.27 605.74 2000-01 491.55 17.51 66.42 69.81 645.30 2001-02 532.39 15.43 191.76 89.58 829.17 2002-03 627.46 20.44 139.60 93.85 881.36 2003-04 675.94 27.19 123.35 101.98 928.46 2004-05 653.96 32.66 100.06 110.97 897.65 2005-06 711.43 40.51 118.74 102.65 973.33 2006-07 793.93 44.32 128.56 153.21 1120.02 2007-08 824.41 62.61 98.20 138.30 1123.52 54 342 1999-00 190.36 9.71 30.58 11.31 241.95 2000-01 179.54 9.67 20.14 11.94 221.29 2001-02 155.63 13.25 13.92 10.58 193.38 2002-03 168.36 7.96 13.14 10.64 200.10 2003-04 174.34 7.40 13.52 11.26 206.52 2004-05 184.90 7.03 12.43 10.72 215.08 2005-06 207.67 7.91 12.93 9.10 237.60 2006-07 244.75 8.66 12.71 11.87 277.98 2007-08 268.19 9.77 16.48 12.02 306.46 55 343 1999-00 251.68 15.50 30.60 32.25 330.03 2000-01 268.75 16.54 32.68 40.01 357.97 2001-02 283.59 16.35 41.49 43.99 385.41 2002-03 295.36 17.32 39.72 35.58 387.97 2003-04 312.75 18.09 39.13 42.19 412.17 2004-05 329.45 20.59 38.16 43.03 431.24 2005-06 338.46 18.19 37.39 42.14 436.18 2006-07 356.68 18.72 38.65 45.07 459.11 2007-08 393.76 22.35 37.76 45.64 499.50 56 351 1999-00 279.24 10.06 26.08 19.71 335.10 2000-01 291.81 9.74 25.96 17.33 344.83 2001-02 331.30 8.94 34.76 18.71 393.71 2002-03 331.21 6.97 38.14 19.52 395.85 2003-04 332.61 7.07 42.04 15.40 397.12 2004-05 392.43 8.06 39.42 17.77 457.68 2005-06 400.91 8.83 36.39 17.89 464.02
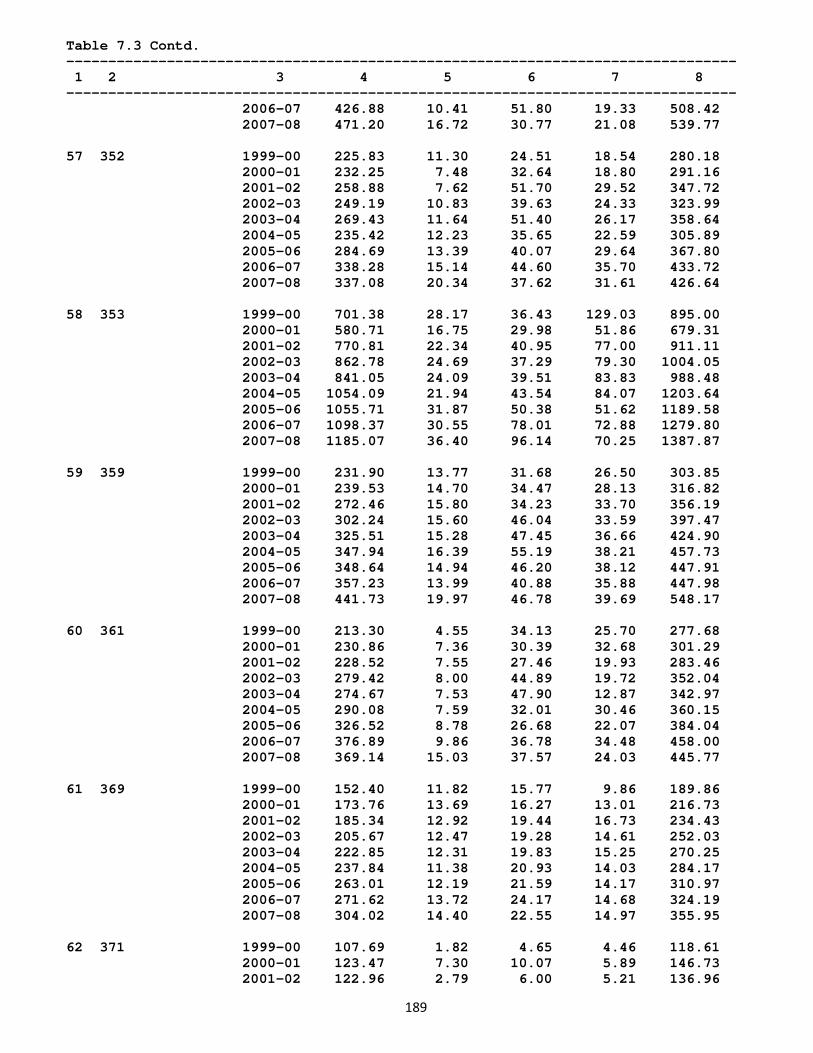
189
Table 7.3 Contd. -------------------------------------------------------------------------------- 1 2 3 4 5 6 7 8 -------------------------------------------------------------------------------- 2006-07 426.88 10.41 51.80 19.33 508.42 2007-08 471.20 16.72 30.77 21.08 539.77 57 352 1999-00 225.83 11.30 24.51 18.54 280.18 2000-01 232.25 7.48 32.64 18.80 291.16 2001-02 258.88 7.62 51.70 29.52 347.72 2002-03 249.19 10.83 39.63 24.33 323.99 2003-04 269.43 11.64 51.40 26.17 358.64 2004-05 235.42 12.23 35.65 22.59 305.89 2005-06 284.69 13.39 40.07 29.64 367.80 2006-07 338.28 15.14 44.60 35.70 433.72 2007-08 337.08 20.34 37.62 31.61 426.64 58 353 1999-00 701.38 28.17 36.43 129.03 895.00 2000-01 580.71 16.75 29.98 51.86 679.31 2001-02 770.81 22.34 40.95 77.00 911.11 2002-03 862.78 24.69 37.29 79.30 1004.05 2003-04 841.05 24.09 39.51 83.83 988.48 2004-05 1054.09 21.94 43.54 84.07 1203.64 2005-06 1055.71 31.87 50.38 51.62 1189.58 2006-07 1098.37 30.55 78.01 72.88 1279.80 2007-08 1185.07 36.40 96.14 70.25 1387.87 59 359 1999-00 231.90 13.77 31.68 26.50 303.85 2000-01 239.53 14.70 34.47 28.13 316.82 2001-02 272.46 15.80 34.23 33.70 356.19 2002-03 302.24 15.60 46.04 33.59 397.47 2003-04 325.51 15.28 47.45 36.66 424.90 2004-05 347.94 16.39 55.19 38.21 457.73 2005-06 348.64 14.94 46.20 38.12 447.91 2006-07 357.23 13.99 40.88 35.88 447.98 2007-08 441.73 19.97 46.78 39.69 548.17 60 361 1999-00 213.30 4.55 34.13 25.70 277.68 2000-01 230.86 7.36 30.39 32.68 301.29 2001-02 228.52 7.55 27.46 19.93 283.46 2002-03 279.42 8.00 44.89 19.72 352.04 2003-04 274.67 7.53 47.90 12.87 342.97 2004-05 290.08 7.59 32.01 30.46 360.15 2005-06 326.52 8.78 26.68 22.07 384.04 2006-07 376.89 9.86 36.78 34.48 458.00 2007-08 369.14 15.03 37.57 24.03 445.77 61 369 1999-00 152.40 11.82 15.77 9.86 189.86 2000-01 173.76 13.69 16.27 13.01 216.73 2001-02 185.34 12.92 19.44 16.73 234.43 2002-03 205.67 12.47 19.28 14.61 252.03 2003-04 222.85 12.31 19.83 15.25 270.25 2004-05 237.84 11.38 20.93 14.03 284.17 2005-06 263.01 12.19 21.59 14.17 310.97 2006-07 271.62 13.72 24.17 14.68 324.19 2007-08 304.02 14.40 22.55 14.97 355.95 62 371 1999-00 107.69 1.82 4.65 4.46 118.61 2000-01 123.47 7.30 10.07 5.89 146.73 2001-02 122.96 2.79 6.00 5.21 136.96
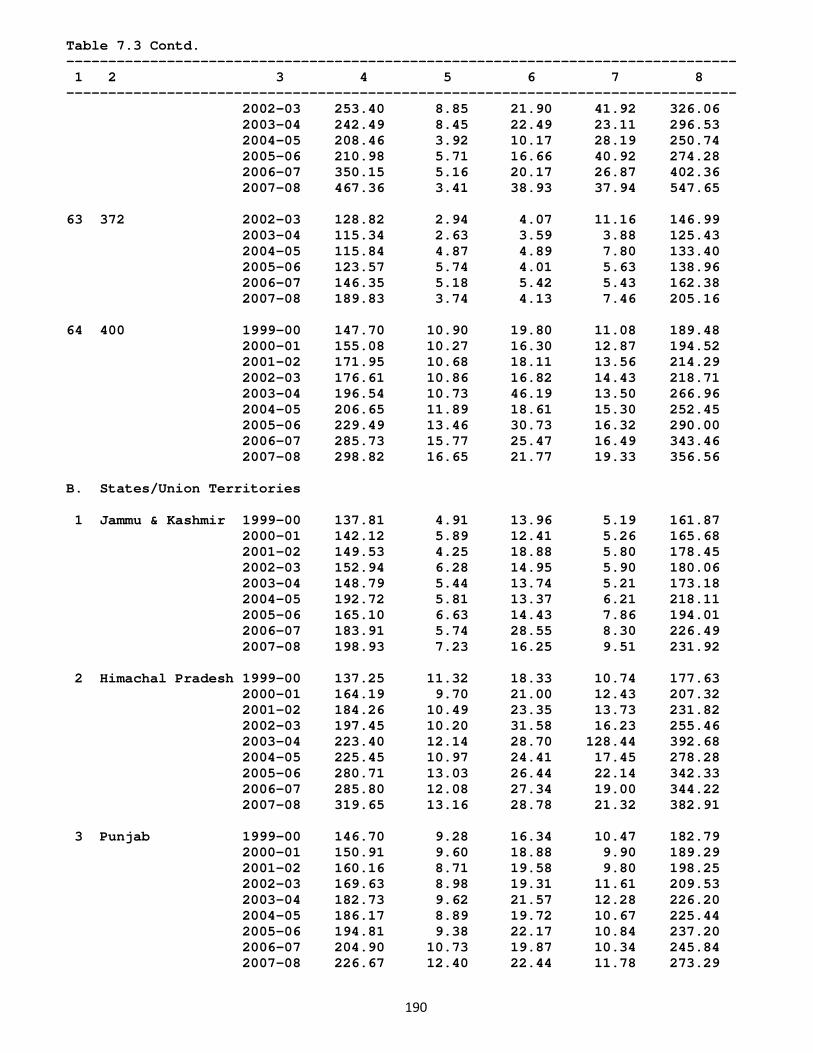
190
Table 7.3 Contd. -------------------------------------------------------------------------------- 1 2 3 4 5 6 7 8 -------------------------------------------------------------------------------- 2002-03 253.40 8.85 21.90 41.92 326.06 2003-04 242.49 8.45 22.49 23.11 296.53 2004-05 208.46 3.92 10.17 28.19 250.74 2005-06 210.98 5.71 16.66 40.92 274.28 2006-07 350.15 5.16 20.17 26.87 402.36 2007-08 467.36 3.41 38.93 37.94 547.65 63 372 2002-03 128.82 2.94 4.07 11.16 146.99 2003-04 115.34 2.63 3.59 3.88 125.43 2004-05 115.84 4.87 4.89 7.80 133.40 2005-06 123.57 5.74 4.01 5.63 138.96 2006-07 146.35 5.18 5.42 5.43 162.38 2007-08 189.83 3.74 4.13 7.46 205.16 64 400 1999-00 147.70 10.90 19.80 11.08 189.48 2000-01 155.08 10.27 16.30 12.87 194.52 2001-02 171.95 10.68 18.11 13.56 214.29 2002-03 176.61 10.86 16.82 14.43 218.71 2003-04 196.54 10.73 46.19 13.50 266.96 2004-05 206.65 11.89 18.61 15.30 252.45 2005-06 229.49 13.46 30.73 16.32 290.00 2006-07 285.73 15.77 25.47 16.49 343.46 2007-08 298.82 16.65 21.77 19.33 356.56 B. States/Union Territories 1 Jammu & Kashmir 1999-00 137.81 4.91 13.96 5.19 161.87 2000-01 142.12 5.89 12.41 5.26 165.68 2001-02 149.53 4.25 18.88 5.80 178.45 2002-03 152.94 6.28 14.95 5.90 180.06 2003-04 148.79 5.44 13.74 5.21 173.18 2004-05 192.72 5.81 13.37 6.21 218.11 2005-06 165.10 6.63 14.43 7.86 194.01 2006-07 183.91 5.74 28.55 8.30 226.49 2007-08 198.93 7.23 16.25 9.51 231.92 2 Himachal Pradesh 1999-00 137.25 11.32 18.33 10.74 177.63 2000-01 164.19 9.70 21.00 12.43 207.32 2001-02 184.26 10.49 23.35 13.73 231.82 2002-03 197.45 10.20 31.58 16.23 255.46 2003-04 223.40 12.14 28.70 128.44 392.68 2004-05 225.45 10.97 24.41 17.45 278.28 2005-06 280.71 13.03 26.44 22.14 342.33 2006-07 285.80 12.08 27.34 19.00 344.22 2007-08 319.65 13.16 28.78 21.32 382.91 3 Punjab 1999-00 146.70 9.28 16.34 10.47 182.79 2000-01 150.91 9.60 18.88 9.90 189.29 2001-02 160.16 8.71 19.58 9.80 198.25 2002-03 169.63 8.98 19.31 11.61 209.53 2003-04 182.73 9.62 21.57 12.28 226.20 2004-05 186.17 8.89 19.72 10.67 225.44 2005-06 194.81 9.38 22.17 10.84 237.20 2006-07 204.90 10.73 19.87 10.34 245.84 2007-08 226.67 12.40 22.44 11.78 273.29
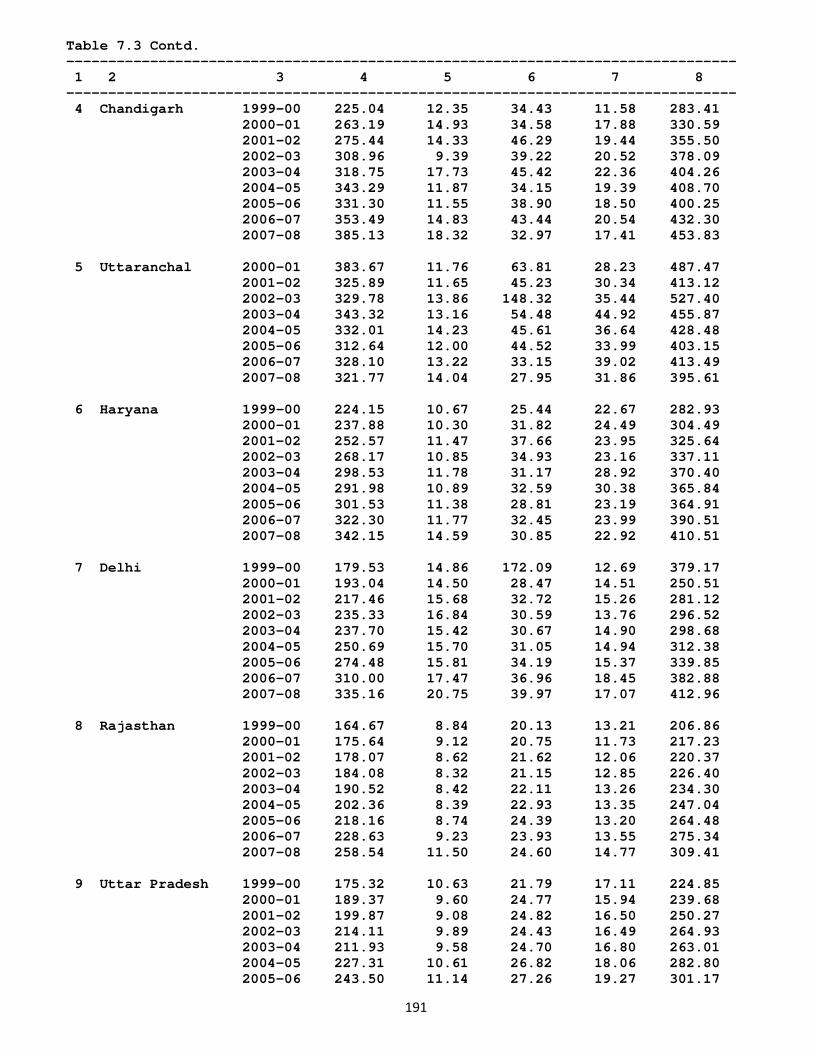
191
Table 7.3 Contd. -------------------------------------------------------------------------------- 1 2 3 4 5 6 7 8 -------------------------------------------------------------------------------- 4 Chandigarh 1999-00 225.04 12.35 34.43 11.58 283.41 2000-01 263.19 14.93 34.58 17.88 330.59 2001-02 275.44 14.33 46.29 19.44 355.50 2002-03 308.96 9.39 39.22 20.52 378.09 2003-04 318.75 17.73 45.42 22.36 404.26 2004-05 343.29 11.87 34.15 19.39 408.70 2005-06 331.30 11.55 38.90 18.50 400.25 2006-07 353.49 14.83 43.44 20.54 432.30 2007-08 385.13 18.32 32.97 17.41 453.83 5 Uttaranchal 2000-01 383.67 11.76 63.81 28.23 487.47 2001-02 325.89 11.65 45.23 30.34 413.12 2002-03 329.78 13.86 148.32 35.44 527.40 2003-04 343.32 13.16 54.48 44.92 455.87 2004-05 332.01 14.23 45.61 36.64 428.48 2005-06 312.64 12.00 44.52 33.99 403.15 2006-07 328.10 13.22 33.15 39.02 413.49 2007-08 321.77 14.04 27.95 31.86 395.61 6 Haryana 1999-00 224.15 10.67 25.44 22.67 282.93 2000-01 237.88 10.30 31.82 24.49 304.49 2001-02 252.57 11.47 37.66 23.95 325.64 2002-03 268.17 10.85 34.93 23.16 337.11 2003-04 298.53 11.78 31.17 28.92 370.40 2004-05 291.98 10.89 32.59 30.38 365.84 2005-06 301.53 11.38 28.81 23.19 364.91 2006-07 322.30 11.77 32.45 23.99 390.51 2007-08 342.15 14.59 30.85 22.92 410.51 7 Delhi 1999-00 179.53 14.86 172.09 12.69 379.17 2000-01 193.04 14.50 28.47 14.51 250.51 2001-02 217.46 15.68 32.72 15.26 281.12 2002-03 235.33 16.84 30.59 13.76 296.52 2003-04 237.70 15.42 30.67 14.90 298.68 2004-05 250.69 15.70 31.05 14.94 312.38 2005-06 274.48 15.81 34.19 15.37 339.85 2006-07 310.00 17.47 36.96 18.45 382.88 2007-08 335.16 20.75 39.97 17.07 412.96 8 Rajasthan 1999-00 164.67 8.84 20.13 13.21 206.86 2000-01 175.64 9.12 20.75 11.73 217.23 2001-02 178.07 8.62 21.62 12.06 220.37 2002-03 184.08 8.32 21.15 12.85 226.40 2003-04 190.52 8.42 22.11 13.26 234.30 2004-05 202.36 8.39 22.93 13.35 247.04 2005-06 218.16 8.74 24.39 13.20 264.48 2006-07 228.63 9.23 23.93 13.55 275.34 2007-08 258.54 11.50 24.60 14.77 309.41 9 Uttar Pradesh 1999-00 175.32 10.63 21.79 17.11 224.85 2000-01 189.37 9.60 24.77 15.94 239.68 2001-02 199.87 9.08 24.82 16.50 250.27 2002-03 214.11 9.89 24.43 16.49 264.93 2003-04 211.93 9.58 24.70 16.80 263.01 2004-05 227.31 10.61 26.82 18.06 282.80 2005-06 243.50 11.14 27.26 19.27 301.17
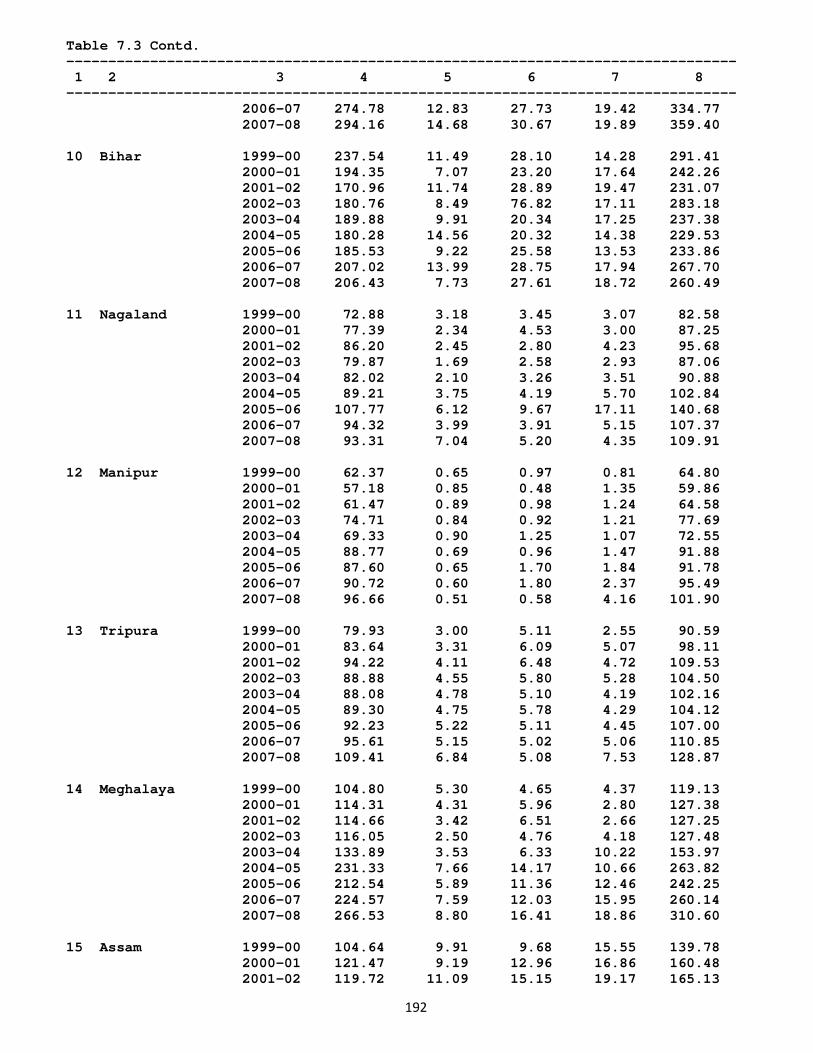
192
Table 7.3 Contd. -------------------------------------------------------------------------------- 1 2 3 4 5 6 7 8 -------------------------------------------------------------------------------- 2006-07 274.78 12.83 27.73 19.42 334.77 2007-08 294.16 14.68 30.67 19.89 359.40 10 Bihar 1999-00 237.54 11.49 28.10 14.28 291.41 2000-01 194.35 7.07 23.20 17.64 242.26 2001-02 170.96 11.74 28.89 19.47 231.07 2002-03 180.76 8.49 76.82 17.11 283.18 2003-04 189.88 9.91 20.34 17.25 237.38 2004-05 180.28 14.56 20.32 14.38 229.53 2005-06 185.53 9.22 25.58 13.53 233.86 2006-07 207.02 13.99 28.75 17.94 267.70 2007-08 206.43 7.73 27.61 18.72 260.49 11 Nagaland 1999-00 72.88 3.18 3.45 3.07 82.58 2000-01 77.39 2.34 4.53 3.00 87.25 2001-02 86.20 2.45 2.80 4.23 95.68 2002-03 79.87 1.69 2.58 2.93 87.06 2003-04 82.02 2.10 3.26 3.51 90.88 2004-05 89.21 3.75 4.19 5.70 102.84 2005-06 107.77 6.12 9.67 17.11 140.68 2006-07 94.32 3.99 3.91 5.15 107.37 2007-08 93.31 7.04 5.20 4.35 109.91 12 Manipur 1999-00 62.37 0.65 0.97 0.81 64.80 2000-01 57.18 0.85 0.48 1.35 59.86 2001-02 61.47 0.89 0.98 1.24 64.58 2002-03 74.71 0.84 0.92 1.21 77.69 2003-04 69.33 0.90 1.25 1.07 72.55 2004-05 88.77 0.69 0.96 1.47 91.88 2005-06 87.60 0.65 1.70 1.84 91.78 2006-07 90.72 0.60 1.80 2.37 95.49 2007-08 96.66 0.51 0.58 4.16 101.90 13 Tripura 1999-00 79.93 3.00 5.11 2.55 90.59 2000-01 83.64 3.31 6.09 5.07 98.11 2001-02 94.22 4.11 6.48 4.72 109.53 2002-03 88.88 4.55 5.80 5.28 104.50 2003-04 88.08 4.78 5.10 4.19 102.16 2004-05 89.30 4.75 5.78 4.29 104.12 2005-06 92.23 5.22 5.11 4.45 107.00 2006-07 95.61 5.15 5.02 5.06 110.85 2007-08 109.41 6.84 5.08 7.53 128.87 14 Meghalaya 1999-00 104.80 5.30 4.65 4.37 119.13 2000-01 114.31 4.31 5.96 2.80 127.38 2001-02 114.66 3.42 6.51 2.66 127.25 2002-03 116.05 2.50 4.76 4.18 127.48 2003-04 133.89 3.53 6.33 10.22 153.97 2004-05 231.33 7.66 14.17 10.66 263.82 2005-06 212.54 5.89 11.36 12.46 242.25 2006-07 224.57 7.59 12.03 15.95 260.14 2007-08 266.53 8.80 16.41 18.86 310.60 15 Assam 1999-00 104.64 9.91 9.68 15.55 139.78 2000-01 121.47 9.19 12.96 16.86 160.48 2001-02 119.72 11.09 15.15 19.17 165.13
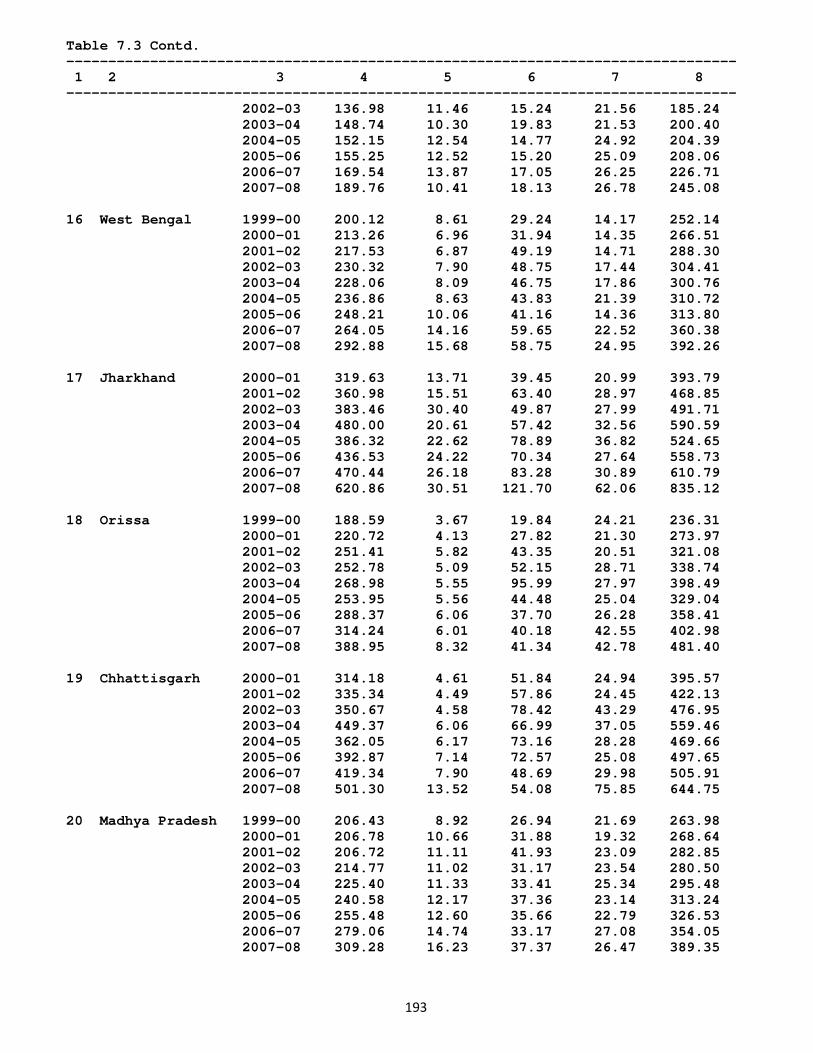
193
Table 7.3 Contd. -------------------------------------------------------------------------------- 1 2 3 4 5 6 7 8 -------------------------------------------------------------------------------- 2002-03 136.98 11.46 15.24 21.56 185.24 2003-04 148.74 10.30 19.83 21.53 200.40 2004-05 152.15 12.54 14.77 24.92 204.39 2005-06 155.25 12.52 15.20 25.09 208.06 2006-07 169.54 13.87 17.05 26.25 226.71 2007-08 189.76 10.41 18.13 26.78 245.08 16 West Bengal 1999-00 200.12 8.61 29.24 14.17 252.14 2000-01 213.26 6.96 31.94 14.35 266.51 2001-02 217.53 6.87 49.19 14.71 288.30 2002-03 230.32 7.90 48.75 17.44 304.41 2003-04 228.06 8.09 46.75 17.86 300.76 2004-05 236.86 8.63 43.83 21.39 310.72 2005-06 248.21 10.06 41.16 14.36 313.80 2006-07 264.05 14.16 59.65 22.52 360.38 2007-08 292.88 15.68 58.75 24.95 392.26 17 Jharkhand 2000-01 319.63 13.71 39.45 20.99 393.79 2001-02 360.98 15.51 63.40 28.97 468.85 2002-03 383.46 30.40 49.87 27.99 491.71 2003-04 480.00 20.61 57.42 32.56 590.59 2004-05 386.32 22.62 78.89 36.82 524.65 2005-06 436.53 24.22 70.34 27.64 558.73 2006-07 470.44 26.18 83.28 30.89 610.79 2007-08 620.86 30.51 121.70 62.06 835.12 18 Orissa 1999-00 188.59 3.67 19.84 24.21 236.31 2000-01 220.72 4.13 27.82 21.30 273.97 2001-02 251.41 5.82 43.35 20.51 321.08 2002-03 252.78 5.09 52.15 28.71 338.74 2003-04 268.98 5.55 95.99 27.97 398.49 2004-05 253.95 5.56 44.48 25.04 329.04 2005-06 288.37 6.06 37.70 26.28 358.41 2006-07 314.24 6.01 40.18 42.55 402.98 2007-08 388.95 8.32 41.34 42.78 481.40 19 Chhattisgarh 2000-01 314.18 4.61 51.84 24.94 395.57 2001-02 335.34 4.49 57.86 24.45 422.13 2002-03 350.67 4.58 78.42 43.29 476.95 2003-04 449.37 6.06 66.99 37.05 559.46 2004-05 362.05 6.17 73.16 28.28 469.66 2005-06 392.87 7.14 72.57 25.08 497.65 2006-07 419.34 7.90 48.69 29.98 505.91 2007-08 501.30 13.52 54.08 75.85 644.75 20 Madhya Pradesh 1999-00 206.43 8.92 26.94 21.69 263.98 2000-01 206.78 10.66 31.88 19.32 268.64 2001-02 206.72 11.11 41.93 23.09 282.85 2002-03 214.77 11.02 31.17 23.54 280.50 2003-04 225.40 11.33 33.41 25.34 295.48 2004-05 240.58 12.17 37.36 23.14 313.24 2005-06 255.48 12.60 35.66 22.79 326.53 2006-07 279.06 14.74 33.17 27.08 354.05 2007-08 309.28 16.23 37.37 26.47 389.35
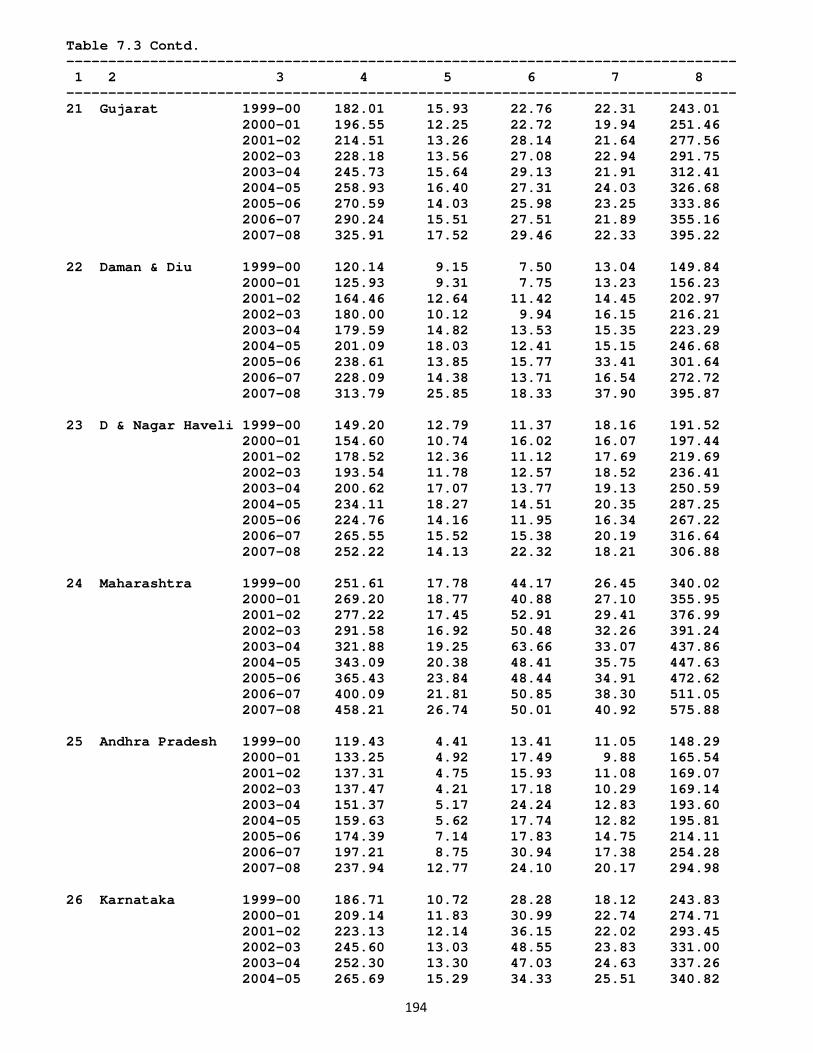
194
Table 7.3 Contd. -------------------------------------------------------------------------------- 1 2 3 4 5 6 7 8 -------------------------------------------------------------------------------- 21 Gujarat 1999-00 182.01 15.93 22.76 22.31 243.01 2000-01 196.55 12.25 22.72 19.94 251.46 2001-02 214.51 13.26 28.14 21.64 277.56 2002-03 228.18 13.56 27.08 22.94 291.75 2003-04 245.73 15.64 29.13 21.91 312.41 2004-05 258.93 16.40 27.31 24.03 326.68 2005-06 270.59 14.03 25.98 23.25 333.86 2006-07 290.24 15.51 27.51 21.89 355.16 2007-08 325.91 17.52 29.46 22.33 395.22 22 Daman & Diu 1999-00 120.14 9.15 7.50 13.04 149.84 2000-01 125.93 9.31 7.75 13.23 156.23 2001-02 164.46 12.64 11.42 14.45 202.97 2002-03 180.00 10.12 9.94 16.15 216.21 2003-04 179.59 14.82 13.53 15.35 223.29 2004-05 201.09 18.03 12.41 15.15 246.68 2005-06 238.61 13.85 15.77 33.41 301.64 2006-07 228.09 14.38 13.71 16.54 272.72 2007-08 313.79 25.85 18.33 37.90 395.87 23 D & Nagar Haveli 1999-00 149.20 12.79 11.37 18.16 191.52 2000-01 154.60 10.74 16.02 16.07 197.44 2001-02 178.52 12.36 11.12 17.69 219.69 2002-03 193.54 11.78 12.57 18.52 236.41 2003-04 200.62 17.07 13.77 19.13 250.59 2004-05 234.11 18.27 14.51 20.35 287.25 2005-06 224.76 14.16 11.95 16.34 267.22 2006-07 265.55 15.52 15.38 20.19 316.64 2007-08 252.22 14.13 22.32 18.21 306.88 24 Maharashtra 1999-00 251.61 17.78 44.17 26.45 340.02 2000-01 269.20 18.77 40.88 27.10 355.95 2001-02 277.22 17.45 52.91 29.41 376.99 2002-03 291.58 16.92 50.48 32.26 391.24 2003-04 321.88 19.25 63.66 33.07 437.86 2004-05 343.09 20.38 48.41 35.75 447.63 2005-06 365.43 23.84 48.44 34.91 472.62 2006-07 400.09 21.81 50.85 38.30 511.05 2007-08 458.21 26.74 50.01 40.92 575.88 25 Andhra Pradesh 1999-00 119.43 4.41 13.41 11.05 148.29 2000-01 133.25 4.92 17.49 9.88 165.54 2001-02 137.31 4.75 15.93 11.08 169.07 2002-03 137.47 4.21 17.18 10.29 169.14 2003-04 151.37 5.17 24.24 12.83 193.60 2004-05 159.63 5.62 17.74 12.82 195.81 2005-06 174.39 7.14 17.83 14.75 214.11 2006-07 197.21 8.75 30.94 17.38 254.28 2007-08 237.94 12.77 24.10 20.17 294.98 26 Karnataka 1999-00 186.71 10.72 28.28 18.12 243.83 2000-01 209.14 11.83 30.99 22.74 274.71 2001-02 223.13 12.14 36.15 22.02 293.45 2002-03 245.60 13.03 48.55 23.83 331.00 2003-04 252.30 13.30 47.03 24.63 337.26 2004-05 265.69 15.29 34.33 25.51 340.82
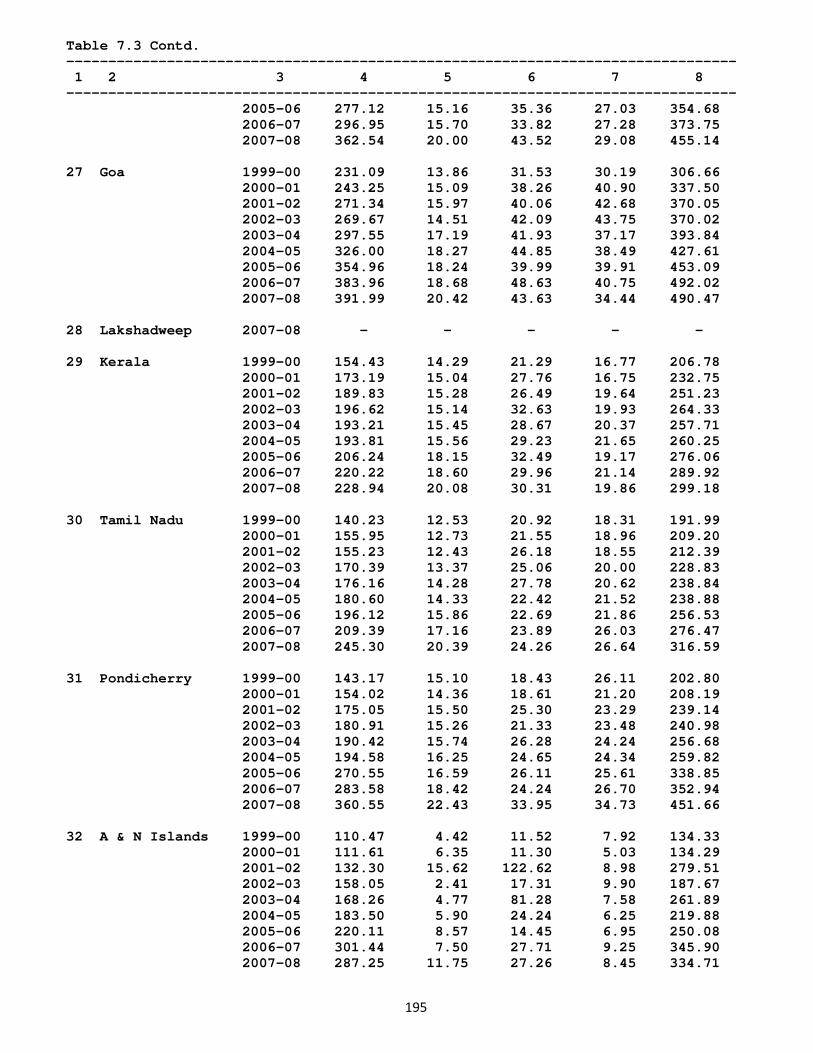
195
Table 7.3 Contd. -------------------------------------------------------------------------------- 1 2 3 4 5 6 7 8 -------------------------------------------------------------------------------- 2005-06 277.12 15.16 35.36 27.03 354.68 2006-07 296.95 15.70 33.82 27.28 373.75 2007-08 362.54 20.00 43.52 29.08 455.14 27 Goa 1999-00 231.09 13.86 31.53 30.19 306.66 2000-01 243.25 15.09 38.26 40.90 337.50 2001-02 271.34 15.97 40.06 42.68 370.05 2002-03 269.67 14.51 42.09 43.75 370.02 2003-04 297.55 17.19 41.93 37.17 393.84 2004-05 326.00 18.27 44.85 38.49 427.61 2005-06 354.96 18.24 39.99 39.91 453.09 2006-07 383.96 18.68 48.63 40.75 492.02 2007-08 391.99 20.42 43.63 34.44 490.47 28 Lakshadweep 2007-08 - - - - - 29 Kerala 1999-00 154.43 14.29 21.29 16.77 206.78 2000-01 173.19 15.04 27.76 16.75 232.75 2001-02 189.83 15.28 26.49 19.64 251.23 2002-03 196.62 15.14 32.63 19.93 264.33 2003-04 193.21 15.45 28.67 20.37 257.71 2004-05 193.81 15.56 29.23 21.65 260.25 2005-06 206.24 18.15 32.49 19.17 276.06 2006-07 220.22 18.60 29.96 21.14 289.92 2007-08 228.94 20.08 30.31 19.86 299.18 30 Tamil Nadu 1999-00 140.23 12.53 20.92 18.31 191.99 2000-01 155.95 12.73 21.55 18.96 209.20 2001-02 155.23 12.43 26.18 18.55 212.39 2002-03 170.39 13.37 25.06 20.00 228.83 2003-04 176.16 14.28 27.78 20.62 238.84 2004-05 180.60 14.33 22.42 21.52 238.88 2005-06 196.12 15.86 22.69 21.86 256.53 2006-07 209.39 17.16 23.89 26.03 276.47 2007-08 245.30 20.39 24.26 26.64 316.59 31 Pondicherry 1999-00 143.17 15.10 18.43 26.11 202.80 2000-01 154.02 14.36 18.61 21.20 208.19 2001-02 175.05 15.50 25.30 23.29 239.14 2002-03 180.91 15.26 21.33 23.48 240.98 2003-04 190.42 15.74 26.28 24.24 256.68 2004-05 194.58 16.25 24.65 24.34 259.82 2005-06 270.55 16.59 26.11 25.61 338.85 2006-07 283.58 18.42 24.24 26.70 352.94 2007-08 360.55 22.43 33.95 34.73 451.66 32 A & N Islands 1999-00 110.47 4.42 11.52 7.92 134.33 2000-01 111.61 6.35 11.30 5.03 134.29 2001-02 132.30 15.62 122.62 8.98 279.51 2002-03 158.05 2.41 17.31 9.90 187.67 2003-04 168.26 4.77 81.28 7.58 261.89 2004-05 183.50 5.90 24.24 6.25 219.88 2005-06 220.11 8.57 14.45 6.95 250.08 2006-07 301.44 7.50 27.71 9.25 345.90 2007-08 287.25 11.75 27.26 8.45 334.71
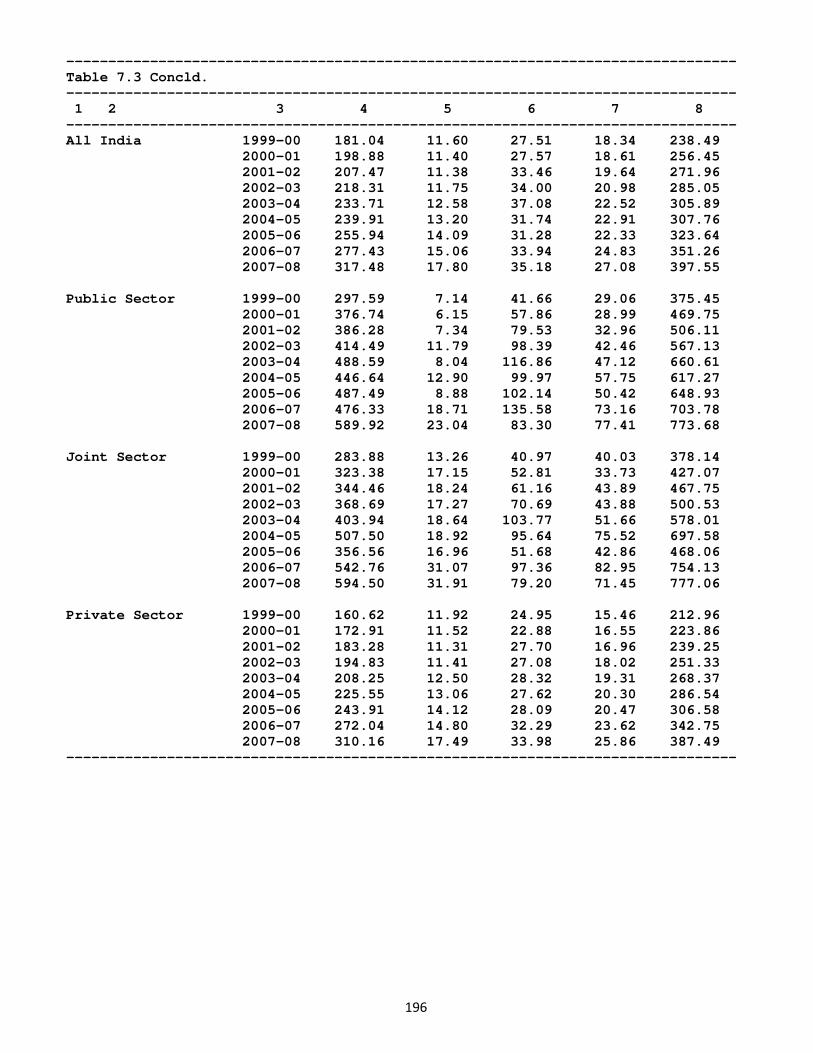
196
-------------------------------------------------------------------------------- Table 7.3 Concld. -------------------------------------------------------------------------------- 1 2 3 4 5 6 7 8 -------------------------------------------------------------------------------- All India 1999-00 181.04 11.60 27.51 18.34 238.49 2000-01 198.88 11.40 27.57 18.61 256.45 2001-02 207.47 11.38 33.46 19.64 271.96 2002-03 218.31 11.75 34.00 20.98 285.05 2003-04 233.71 12.58 37.08 22.52 305.89 2004-05 239.91 13.20 31.74 22.91 307.76 2005-06 255.94 14.09 31.28 22.33 323.64 2006-07 277.43 15.06 33.94 24.83 351.26 2007-08 317.48 17.80 35.18 27.08 397.55 Public Sector 1999-00 297.59 7.14 41.66 29.06 375.45 2000-01 376.74 6.15 57.86 28.99 469.75 2001-02 386.28 7.34 79.53 32.96 506.11 2002-03 414.49 11.79 98.39 42.46 567.13 2003-04 488.59 8.04 116.86 47.12 660.61 2004-05 446.64 12.90 99.97 57.75 617.27 2005-06 487.49 8.88 102.14 50.42 648.93 2006-07 476.33 18.71 135.58 73.16 703.78 2007-08 589.92 23.04 83.30 77.41 773.68 Joint Sector 1999-00 283.88 13.26 40.97 40.03 378.14 2000-01 323.38 17.15 52.81 33.73 427.07 2001-02 344.46 18.24 61.16 43.89 467.75 2002-03 368.69 17.27 70.69 43.88 500.53 2003-04 403.94 18.64 103.77 51.66 578.01 2004-05 507.50 18.92 95.64 75.52 697.58 2005-06 356.56 16.96 51.68 42.86 468.06 2006-07 542.76 31.07 97.36 82.95 754.13 2007-08 594.50 31.91 79.20 71.45 777.06 Private Sector 1999-00 160.62 11.92 24.95 15.46 212.96 2000-01 172.91 11.52 22.88 16.55 223.86 2001-02 183.28 11.31 27.70 16.96 239.25 2002-03 194.83 11.41 27.08 18.02 251.33 2003-04 208.25 12.50 28.32 19.31 268.37 2004-05 225.55 13.06 27.62 20.30 286.54 2005-06 243.91 14.12 28.09 20.47 306.58 2006-07 272.04 14.80 32.29 23.62 342.75 2007-08 310.16 17.49 33.98 25.86 387.49 --------------------------------------------------------------------------------
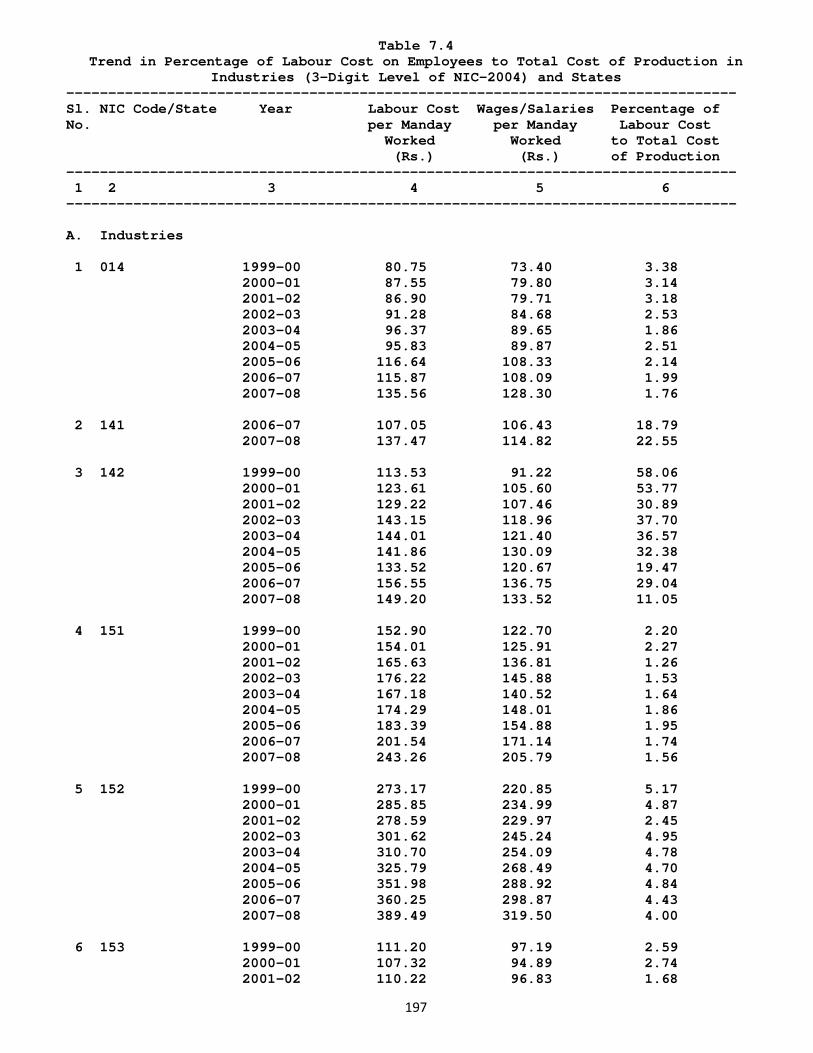
197
Table 7.4 Trend in Percentage of Labour Cost on Employees to Total Cost of Production in
Industries (3-Digit Level of NIC-2004) and States -------------------------------------------------------------------------------- Sl. NIC Code/State Year Labour Cost Wages/Salaries Percentage of No. per Manday per Manday Labour Cost Worked Worked to Total Cost (Rs.) (Rs.) of Production -------------------------------------------------------------------------------- 1 2 3 4 5 6 -------------------------------------------------------------------------------- A. Industries 1 014 1999-00 80.75 73.40 3.38 2000-01 87.55 79.80 3.14 2001-02 86.90 79.71 3.18 2002-03 91.28 84.68 2.53 2003-04 96.37 89.65 1.86 2004-05 95.83 89.87 2.51 2005-06 116.64 108.33 2.14 2006-07 115.87 108.09 1.99 2007-08 135.56 128.30 1.76 2 141 2006-07 107.05 106.43 18.79 2007-08 137.47 114.82 22.55 3 142 1999-00 113.53 91.22 58.06 2000-01 123.61 105.60 53.77 2001-02 129.22 107.46 30.89 2002-03 143.15 118.96 37.70 2003-04 144.01 121.40 36.57 2004-05 141.86 130.09 32.38 2005-06 133.52 120.67 19.47 2006-07 156.55 136.75 29.04 2007-08 149.20 133.52 11.05 4 151 1999-00 152.90 122.70 2.20 2000-01 154.01 125.91 2.27 2001-02 165.63 136.81 1.26 2002-03 176.22 145.88 1.53 2003-04 167.18 140.52 1.64 2004-05 174.29 148.01 1.86 2005-06 183.39 154.88 1.95 2006-07 201.54 171.14 1.74 2007-08 243.26 205.79 1.56 5 152 1999-00 273.17 220.85 5.17 2000-01 285.85 234.99 4.87 2001-02 278.59 229.97 2.45 2002-03 301.62 245.24 4.95 2003-04 310.70 254.09 4.78 2004-05 325.79 268.49 4.70 2005-06 351.98 288.92 4.84 2006-07 360.25 298.87 4.43 2007-08 389.49 319.50 4.00 6 153 1999-00 111.20 97.19 2.59 2000-01 107.32 94.89 2.74 2001-02 110.22 96.83 1.68
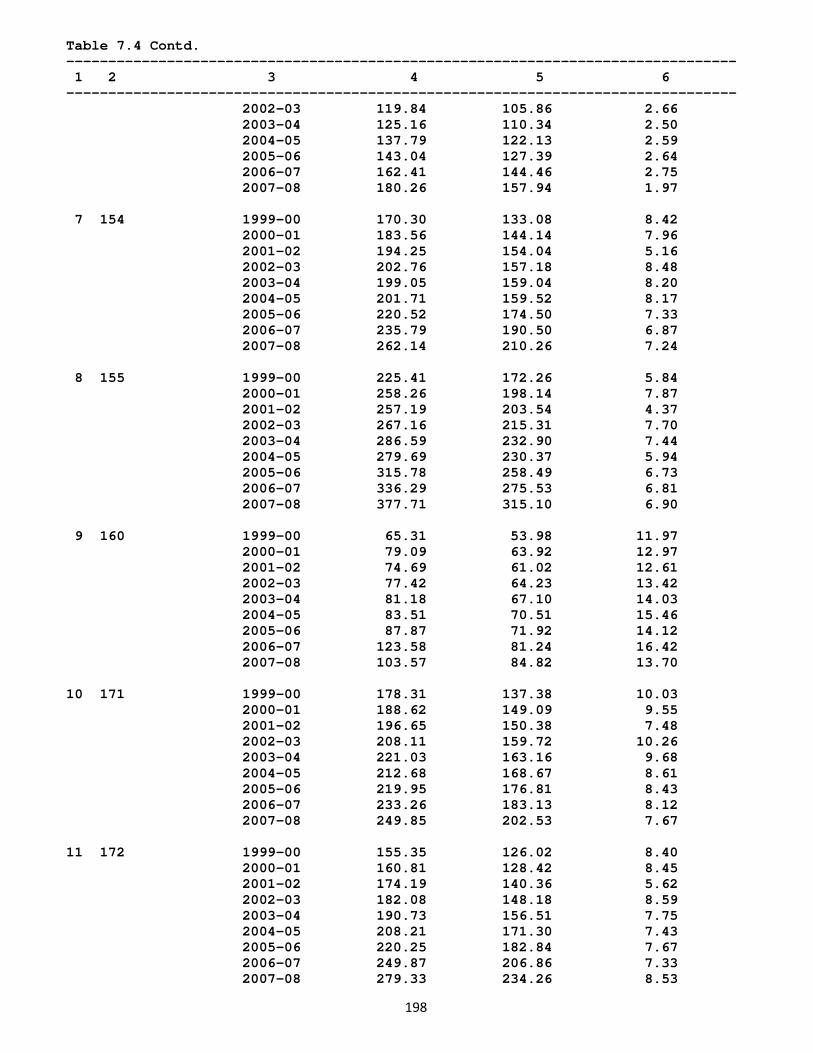
198
Table 7.4 Contd. -------------------------------------------------------------------------------- 1 2 3 4 5 6 -------------------------------------------------------------------------------- 2002-03 119.84 105.86 2.66 2003-04 125.16 110.34 2.50 2004-05 137.79 122.13 2.59 2005-06 143.04 127.39 2.64 2006-07 162.41 144.46 2.75 2007-08 180.26 157.94 1.97 7 154 1999-00 170.30 133.08 8.42 2000-01 183.56 144.14 7.96 2001-02 194.25 154.04 5.16 2002-03 202.76 157.18 8.48 2003-04 199.05 159.04 8.20 2004-05 201.71 159.52 8.17 2005-06 220.52 174.50 7.33 2006-07 235.79 190.50 6.87 2007-08 262.14 210.26 7.24 8 155 1999-00 225.41 172.26 5.84 2000-01 258.26 198.14 7.87 2001-02 257.19 203.54 4.37 2002-03 267.16 215.31 7.70 2003-04 286.59 232.90 7.44 2004-05 279.69 230.37 5.94 2005-06 315.78 258.49 6.73 2006-07 336.29 275.53 6.81 2007-08 377.71 315.10 6.90 9 160 1999-00 65.31 53.98 11.97 2000-01 79.09 63.92 12.97 2001-02 74.69 61.02 12.61 2002-03 77.42 64.23 13.42 2003-04 81.18 67.10 14.03 2004-05 83.51 70.51 15.46 2005-06 87.87 71.92 14.12 2006-07 123.58 81.24 16.42 2007-08 103.57 84.82 13.70 10 171 1999-00 178.31 137.38 10.03 2000-01 188.62 149.09 9.55 2001-02 196.65 150.38 7.48 2002-03 208.11 159.72 10.26 2003-04 221.03 163.16 9.68 2004-05 212.68 168.67 8.61 2005-06 219.95 176.81 8.43 2006-07 233.26 183.13 8.12 2007-08 249.85 202.53 7.67 11 172 1999-00 155.35 126.02 8.40 2000-01 160.81 128.42 8.45 2001-02 174.19 140.36 5.62 2002-03 182.08 148.18 8.59 2003-04 190.73 156.51 7.75 2004-05 208.21 171.30 7.43 2005-06 220.25 182.84 7.67 2006-07 249.87 206.86 7.33 2007-08 279.33 234.26 8.53
199
Table 7.4 Contd. -------------------------------------------------------------------------------- 1 2 3 4 5 6 -------------------------------------------------------------------------------- 12 173 1999-00 157.09 126.48 5.57 2000-01 149.68 117.81 6.40 2001-02 150.19 124.27 5.16 2002-03 161.59 132.73 6.75 2003-04 162.66 135.29 8.85 2004-05 171.87 143.22 8.65 2005-06 183.55 153.63 8.20 2006-07 192.41 156.57 5.97 2007-08 215.83 180.72 10.63 13 181 1999-00 137.45 108.36 9.81 2000-01 149.08 116.51 10.44 2001-02 159.44 126.88 8.02 2002-03 176.82 141.46 10.64 2003-04 176.00 141.43 13.01 2004-05 191.61 155.95 12.39 2005-06 205.27 167.98 13.60 2006-07 231.04 188.89 14.94 2007-08 245.33 203.46 15.13 14 182 1999-00 98.05 75.46 11.59 2000-01 130.26 108.93 8.80 2001-02 154.32 137.04 3.35 2002-03 139.97 123.69 5.22 2003-04 193.08 162.26 6.98 2004-05 189.42 165.83 3.48 2005-06 226.88 145.34 13.21 2006-07 285.68 233.14 10.75 2007-08 240.63 209.92 5.64 15 191 1999-00 163.26 114.23 7.42 2000-01 158.85 118.27 5.83 2001-02 159.97 118.60 4.37 2002-03 167.48 128.24 5.82 2003-04 183.71 141.56 5.31 2004-05 184.56 142.45 6.09 2005-06 205.00 162.50 6.13 2006-07 229.18 177.75 5.60 2007-08 240.32 189.86 6.26 16 192 1999-00 161.18 121.67 8.37 2000-01 164.53 128.49 8.22 2001-02 166.20 126.75 5.86 2002-03 175.27 137.81 9.70 2003-04 179.94 142.99 9.56 2004-05 180.60 144.31 8.48 2005-06 184.90 151.69 8.63 2006-07 213.65 172.75 8.71 2007-08 218.96 177.04 8.39 17 201 1999-00 79.85 69.80 10.56 2000-01 77.88 69.04 6.35 2001-02 83.86 73.33 4.47 2002-03 94.65 83.74 6.97 2003-04 102.04 86.50 5.88
200
Table 7.4 Contd. -------------------------------------------------------------------------------- 1 2 3 4 5 6 -------------------------------------------------------------------------------- 2004-05 107.08 92.85 3.30 2005-06 110.31 99.31 4.65 2006-07 125.02 112.48 4.09 2007-08 141.03 127.12 5.06 18 202 1999-00 141.34 109.86 10.81 2000-01 139.35 114.29 8.84 2001-02 159.37 127.67 4.76 2002-03 153.46 125.14 8.54 2003-04 166.06 136.27 7.93 2004-05 166.77 137.77 7.43 2005-06 201.96 169.31 8.77 2006-07 198.09 167.28 7.20 2007-08 222.29 188.54 7.46 19 210 1999-00 202.45 158.19 8.56 2000-01 234.42 180.26 8.28 2001-02 250.42 196.28 5.54 2002-03 251.47 196.78 7.93 2003-04 264.95 209.85 8.25 2004-05 279.64 218.88 6.84 2005-06 295.22 235.03 8.05 2006-07 305.39 242.49 7.99 2007-08 321.35 258.06 6.97 20 221 1999-00 369.49 291.50 13.15 2000-01 423.94 337.41 14.24 2001-02 450.39 354.76 5.09 2002-03 493.86 387.80 17.41 2003-04 531.81 424.13 16.89 2004-05 545.16 440.81 15.18 2005-06 672.74 534.06 16.70 2006-07 632.19 514.19 15.04 2007-08 740.91 609.92 15.70 21 222 1999-00 184.95 143.60 13.74 2000-01 221.72 169.55 13.75 2001-02 235.63 185.11 7.71 2002-03 245.97 195.81 13.51 2003-04 238.34 192.96 12.55 2004-05 256.73 204.07 11.25 2005-06 265.27 212.45 11.19 2006-07 302.09 248.56 9.63 2007-08 324.16 264.15 9.80 22 223 1999-00 266.71 199.44 7.54 2000-01 434.94 338.75 7.37 2001-02 353.35 282.47 3.67 2002-03 478.03 374.49 8.04 2003-04 373.22 310.40 8.81 2004-05 457.55 370.35 10.47 2005-06 427.34 352.41 10.89 2006-07 430.99 342.32 12.37 2007-08 509.17 359.73 16.39
201
Table 7.4 Contd. -------------------------------------------------------------------------------- 1 2 3 4 5 6 -------------------------------------------------------------------------------- 23 231 1999-00 272.69 220.51 7.50 2000-01 369.38 284.79 7.95 2001-02 381.97 303.67 5.79 2002-03 380.10 297.07 6.69 2003-04 362.87 287.66 5.92 2004-05 329.93 266.53 5.41 2005-06 371.55 293.46 5.79 2006-07 395.67 302.12 5.75 2007-08 448.43 345.40 5.29 24 232 1999-00 612.84 455.46 1.85 2000-01 971.73 741.68 1.98 2001-02 895.30 653.03 0.80 2002-03 909.14 627.36 1.17 2003-04 934.70 656.08 1.05 2004-05 1035.45 716.86 0.86 2005-06 967.26 687.74 0.75 2006-07 1180.89 824.31 0.71 2007-08 975.05 720.57 0.71 25 241 1999-00 468.34 330.29 6.42 2000-01 456.23 330.25 5.15 2001-02 511.26 363.29 2.72 2002-03 569.60 397.39 5.80 2003-04 605.89 436.20 5.51 2004-05 619.81 448.36 5.00 2005-06 634.29 462.68 4.69 2006-07 648.25 490.87 4.29 2007-08 736.08 567.60 4.32 26 242 1999-00 273.98 207.82 8.64 2000-01 284.14 216.89 8.85 2001-02 306.55 231.46 3.76 2002-03 326.83 246.24 9.02 2003-04 354.47 269.01 8.86 2004-05 363.71 289.81 9.24 2005-06 407.72 319.74 7.32 2006-07 441.17 352.62 8.24 2007-08 475.84 382.10 8.35 27 243 1999-00 425.57 303.57 9.03 2000-01 466.37 314.95 8.69 2001-02 442.35 315.94 6.39 2002-03 550.96 390.63 9.55 2003-04 617.43 383.24 10.95 2004-05 547.35 396.61 8.17 2005-06 577.58 420.20 7.67 2006-07 645.25 475.18 7.39 2007-08 846.66 598.27 6.87 28 251 1999-00 246.70 184.98 9.00 2000-01 266.87 202.83 9.30 2001-02 297.46 223.54 5.63 2002-03 321.80 243.71 9.28 2003-04 317.73 245.92 8.62 2004-05 333.20 256.65 8.10
202
Table 7.4 Contd. -------------------------------------------------------------------------------- 1 2 3 4 5 6 -------------------------------------------------------------------------------- 2005-06 353.29 277.44 7.72 2006-07 380.62 298.68 7.02 2007-08 425.07 320.66 7.88 29 252 1999-00 180.74 143.93 5.30 2000-01 186.78 151.59 5.59 2001-02 202.77 163.52 3.18 2002-03 218.06 175.63 5.30 2003-04 231.47 187.52 5.43 2004-05 242.95 197.80 4.53 2005-06 239.09 198.52 5.13 2006-07 269.64 221.12 4.18 2007-08 306.53 251.40 4.69 30 261 1999-00 216.17 164.02 11.58 2000-01 225.86 179.33 10.91 2001-02 266.06 213.36 9.18 2002-03 261.60 210.22 11.71 2003-04 270.23 209.57 10.68 2004-05 277.09 217.65 9.71 2005-06 288.49 230.60 11.73 2006-07 317.71 259.56 11.73 2007-08 366.87 292.53 9.22 31 269 1999-00 197.80 150.47 8.78 2000-01 219.99 167.34 9.95 2001-02 218.97 169.10 5.84 2002-03 186.11 149.01 10.52 2003-04 241.51 185.62 8.96 2004-05 240.83 189.05 7.16 2005-06 243.83 197.38 8.78 2006-07 258.11 210.25 8.61 2007-08 306.49 248.98 8.04 32 271 1999-00 323.87 269.59 7.56 2000-01 395.68 329.34 8.21 2001-02 428.62 337.46 4.58 2002-03 494.61 377.89 7.22 2003-04 557.77 433.31 7.01 2004-05 518.57 387.91 4.03 2005-06 504.95 401.85 4.63 2006-07 534.72 410.44 4.48 2007-08 685.39 518.10 4.98 33 272 1999-00 354.40 255.76 6.03 2000-01 390.69 275.61 6.43 2001-02 427.49 314.84 4.53 2002-03 460.85 339.95 6.41 2003-04 520.43 386.22 4.83 2004-05 528.43 391.88 3.93 2005-06 583.25 448.17 4.12 2006-07 583.33 458.48 3.56 2007-08 744.95 567.79 3.64 34 273 1999-00 203.40 157.71 13.18 2000-01 228.41 182.44 13.07
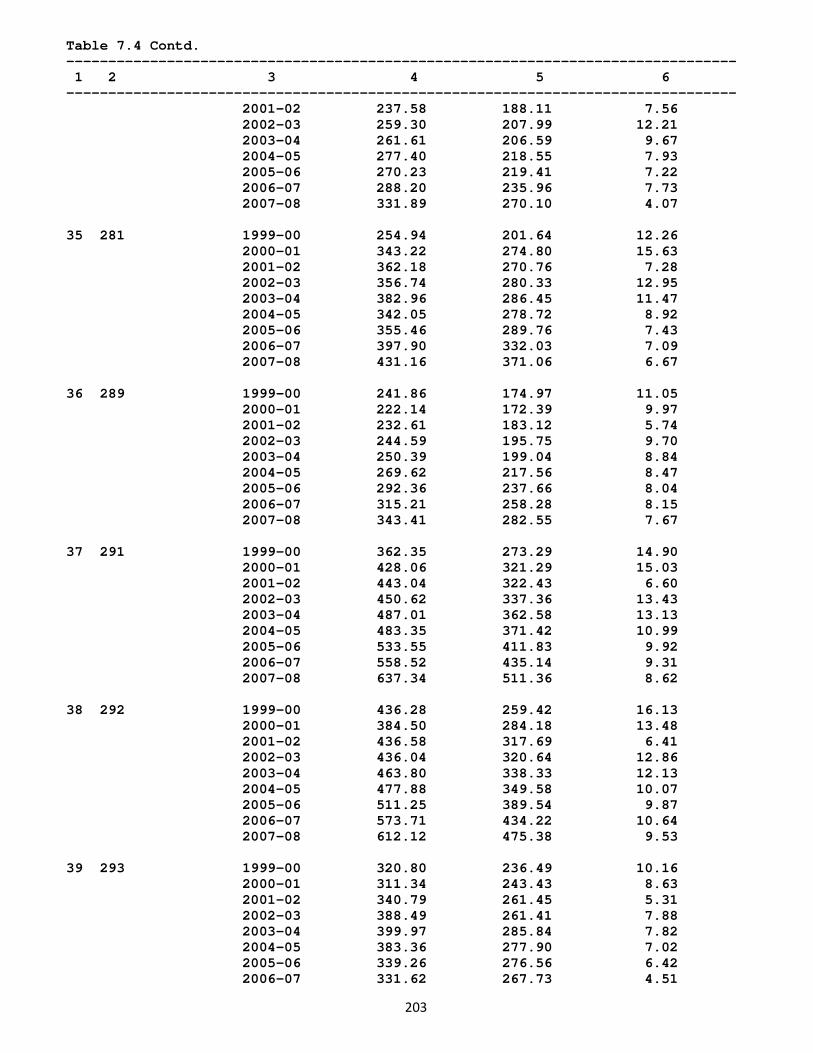
203
Table 7.4 Contd. -------------------------------------------------------------------------------- 1 2 3 4 5 6 -------------------------------------------------------------------------------- 2001-02 237.58 188.11 7.56 2002-03 259.30 207.99 12.21 2003-04 261.61 206.59 9.67 2004-05 277.40 218.55 7.93 2005-06 270.23 219.41 7.22 2006-07 288.20 235.96 7.73 2007-08 331.89 270.10 4.07 35 281 1999-00 254.94 201.64 12.26 2000-01 343.22 274.80 15.63 2001-02 362.18 270.76 7.28 2002-03 356.74 280.33 12.95 2003-04 382.96 286.45 11.47 2004-05 342.05 278.72 8.92 2005-06 355.46 289.76 7.43 2006-07 397.90 332.03 7.09 2007-08 431.16 371.06 6.67 36 289 1999-00 241.86 174.97 11.05 2000-01 222.14 172.39 9.97 2001-02 232.61 183.12 5.74 2002-03 244.59 195.75 9.70 2003-04 250.39 199.04 8.84 2004-05 269.62 217.56 8.47 2005-06 292.36 237.66 8.04 2006-07 315.21 258.28 8.15 2007-08 343.41 282.55 7.67 37 291 1999-00 362.35 273.29 14.90 2000-01 428.06 321.29 15.03 2001-02 443.04 322.43 6.60 2002-03 450.62 337.36 13.43 2003-04 487.01 362.58 13.13 2004-05 483.35 371.42 10.99 2005-06 533.55 411.83 9.92 2006-07 558.52 435.14 9.31 2007-08 637.34 511.36 8.62 38 292 1999-00 436.28 259.42 16.13 2000-01 384.50 284.18 13.48 2001-02 436.58 317.69 6.41 2002-03 436.04 320.64 12.86 2003-04 463.80 338.33 12.13 2004-05 477.88 349.58 10.07 2005-06 511.25 389.54 9.87 2006-07 573.71 434.22 10.64 2007-08 612.12 475.38 9.53 39 293 1999-00 320.80 236.49 10.16 2000-01 311.34 243.43 8.63 2001-02 340.79 261.45 5.31 2002-03 388.49 261.41 7.88 2003-04 399.97 285.84 7.82 2004-05 383.36 277.90 7.02 2005-06 339.26 276.56 6.42 2006-07 331.62 267.73 4.51

204
Table 7.4 Contd. -------------------------------------------------------------------------------- 1 2 3 4 5 6 -------------------------------------------------------------------------------- 2007-08 379.79 305.21 5.53 40 300 1999-00 340.42 244.63 7.81 2000-01 489.54 386.62 7.30 2001-02 493.59 412.81 1.86 2002-03 593.28 507.97 8.86 2003-04 570.10 461.01 7.25 2004-05 575.27 477.92 8.83 2005-06 588.89 499.20 6.70 2006-07 538.79 457.53 6.02 2007-08 687.88 579.86 7.58 41 311 1999-00 429.99 308.82 12.59 2000-01 616.92 458.40 18.98 2001-02 552.50 391.89 6.94 2002-03 645.22 442.09 13.20 2003-04 677.26 446.21 11.76 2004-05 577.99 426.40 9.94 2005-06 629.42 465.04 7.61 2006-07 643.92 484.08 5.69 2007-08 785.08 589.80 5.17 42 312 1999-00 367.50 261.76 14.69 2000-01 448.79 331.08 16.33 2001-02 435.90 316.04 5.84 2002-03 461.69 342.44 13.69 2003-04 487.05 356.18 14.29 2004-05 500.60 376.03 12.34 2005-06 464.82 364.98 8.33 2006-07 511.26 399.85 8.86 2007-08 543.62 432.36 8.10 43 313 1999-00 301.24 225.89 5.07 2000-01 296.80 224.90 5.09 2001-02 322.64 244.91 2.61 2002-03 337.02 264.17 5.05 2003-04 347.55 264.91 4.91 2004-05 337.46 265.66 4.71 2005-06 347.11 282.67 3.29 2006-07 376.77 303.46 2.47 2007-08 517.12 407.86 3.49 44 314 1999-00 361.80 259.49 10.53 2000-01 325.72 234.06 10.91 2001-02 336.36 244.62 5.42 2002-03 376.13 277.88 11.15 2003-04 399.06 292.85 11.08 2004-05 390.72 300.19 7.91 2005-06 432.38 334.43 9.13 2006-07 498.33 379.07 7.47 2007-08 515.75 405.06 6.44 45 315 1999-00 263.30 197.48 12.51 2000-01 280.81 195.38 13.07 2001-02 286.11 206.71 9.17 2002-03 365.98 228.56 14.13

205
Table 7.4 Contd. -------------------------------------------------------------------------------- 1 2 3 4 5 6 -------------------------------------------------------------------------------- 2003-04 366.07 239.58 13.37 2004-05 290.64 228.08 11.64 2005-06 285.07 218.02 10.87 2006-07 310.94 242.88 10.86 2007-08 333.48 271.17 9.48 46 319 1999-00 241.67 185.88 11.84 2000-01 269.72 206.52 9.70 2001-02 268.82 207.81 6.22 2002-03 274.40 217.20 11.60 2003-04 291.60 226.28 9.97 2004-05 315.71 244.90 8.10 2005-06 396.56 306.05 8.83 2006-07 333.81 268.11 6.66 2007-08 418.67 332.44 7.54 47 321 1999-00 317.74 239.50 11.35 2000-01 365.72 281.13 11.74 2001-02 429.94 330.38 5.89 2002-03 445.01 343.67 12.08 2003-04 483.46 370.08 12.39 2004-05 485.07 376.35 12.98 2005-06 589.45 447.51 10.26 2006-07 604.99 481.12 14.51 2007-08 568.43 453.72 13.28 48 322 1999-00 412.07 317.34 12.31 2000-01 482.12 354.94 13.07 2001-02 552.92 368.24 4.45 2002-03 649.36 482.62 12.89 2003-04 702.29 485.87 13.38 2004-05 583.22 449.58 12.07 2005-06 567.14 451.23 10.62 2006-07 599.11 447.49 10.32 2007-08 692.43 547.20 9.86 49 323 1999-00 293.45 220.79 4.67 2000-01 339.27 252.35 3.84 2001-02 440.31 332.71 1.84 2002-03 481.61 364.65 3.69 2003-04 502.15 377.09 3.73 2004-05 609.32 440.93 4.63 2005-06 552.76 433.99 5.66 2006-07 737.15 598.00 4.28 2007-08 842.19 690.44 4.40 50 331 1999-00 438.72 267.71 16.52 2000-01 355.67 274.56 14.26 2001-02 454.75 351.54 4.68 2002-03 481.89 378.40 14.31 2003-04 501.87 387.34 13.91 2004-05 516.10 409.08 11.12 2005-06 483.15 382.61 12.08 2006-07 552.67 432.02 11.33 2007-08 781.00 637.74 12.91

206
Table 7.4 Contd. -------------------------------------------------------------------------------- 1 2 3 4 5 6 -------------------------------------------------------------------------------- 51 332 1999-00 264.87 189.88 7.28 2000-01 353.68 281.85 17.31 2001-02 284.32 226.93 7.27 2002-03 257.87 202.43 14.29 2003-04 328.01 262.90 12.93 2004-05 356.64 290.52 13.30 2005-06 350.42 277.38 10.14 2006-07 432.00 361.60 14.79 2007-08 461.44 375.67 17.39 52 333 1999-00 342.79 252.93 18.51 2000-01 357.40 270.76 18.81 2001-02 487.16 370.31 11.34 2002-03 453.18 341.52 18.81 2003-04 532.69 383.73 16.77 2004-05 378.67 278.94 16.07 2005-06 344.18 267.77 13.16 2006-07 391.44 302.33 16.49 2007-08 588.43 492.63 25.57 53 341 1999-00 605.74 453.20 7.19 2000-01 645.30 491.55 7.09 2001-02 829.17 532.39 4.37 2002-03 881.36 627.46 5.96 2003-04 928.46 675.94 6.20 2004-05 897.65 653.96 4.70 2005-06 973.33 711.43 4.34 2006-07 1120.02 793.93 5.96 2007-08 1123.52 824.41 4.84 54 342 1999-00 241.95 190.36 14.62 2000-01 221.29 179.54 15.38 2001-02 193.38 155.63 11.08 2002-03 200.10 168.36 15.47 2003-04 206.52 174.34 11.02 2004-05 215.08 184.90 10.25 2005-06 237.60 207.67 9.91 2006-07 277.98 244.75 8.68 2007-08 306.46 268.19 9.36 55 343 1999-00 330.03 251.68 12.21 2000-01 357.97 268.75 12.28 2001-02 385.41 283.59 7.16 2002-03 387.97 295.36 11.59 2003-04 412.17 312.75 10.33 2004-05 431.24 329.45 9.07 2005-06 436.18 338.46 9.47 2006-07 459.11 356.68 8.42 2007-08 499.50 393.76 9.58 56 351 1999-00 335.10 279.24 11.92 2000-01 344.83 291.81 9.76 2001-02 393.71 331.30 4.09 2002-03 395.85 331.21 10.77 2003-04 397.12 332.61 11.47 2004-05 457.68 392.43 13.29
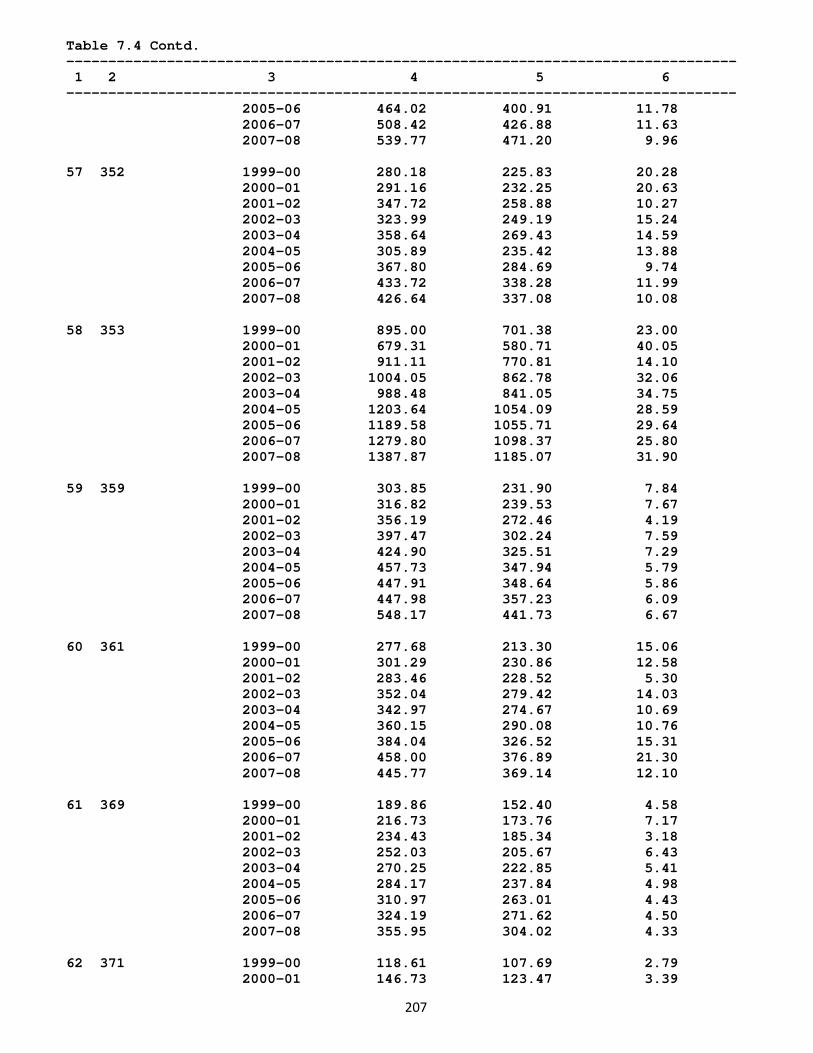
207
Table 7.4 Contd. -------------------------------------------------------------------------------- 1 2 3 4 5 6 -------------------------------------------------------------------------------- 2005-06 464.02 400.91 11.78 2006-07 508.42 426.88 11.63 2007-08 539.77 471.20 9.96 57 352 1999-00 280.18 225.83 20.28 2000-01 291.16 232.25 20.63 2001-02 347.72 258.88 10.27 2002-03 323.99 249.19 15.24 2003-04 358.64 269.43 14.59 2004-05 305.89 235.42 13.88 2005-06 367.80 284.69 9.74 2006-07 433.72 338.28 11.99 2007-08 426.64 337.08 10.08 58 353 1999-00 895.00 701.38 23.00 2000-01 679.31 580.71 40.05 2001-02 911.11 770.81 14.10 2002-03 1004.05 862.78 32.06 2003-04 988.48 841.05 34.75 2004-05 1203.64 1054.09 28.59 2005-06 1189.58 1055.71 29.64 2006-07 1279.80 1098.37 25.80 2007-08 1387.87 1185.07 31.90 59 359 1999-00 303.85 231.90 7.84 2000-01 316.82 239.53 7.67 2001-02 356.19 272.46 4.19 2002-03 397.47 302.24 7.59 2003-04 424.90 325.51 7.29 2004-05 457.73 347.94 5.79 2005-06 447.91 348.64 5.86 2006-07 447.98 357.23 6.09 2007-08 548.17 441.73 6.67 60 361 1999-00 277.68 213.30 15.06 2000-01 301.29 230.86 12.58 2001-02 283.46 228.52 5.30 2002-03 352.04 279.42 14.03 2003-04 342.97 274.67 10.69 2004-05 360.15 290.08 10.76 2005-06 384.04 326.52 15.31 2006-07 458.00 376.89 21.30 2007-08 445.77 369.14 12.10 61 369 1999-00 189.86 152.40 4.58 2000-01 216.73 173.76 7.17 2001-02 234.43 185.34 3.18 2002-03 252.03 205.67 6.43 2003-04 270.25 222.85 5.41 2004-05 284.17 237.84 4.98 2005-06 310.97 263.01 4.43 2006-07 324.19 271.62 4.50 2007-08 355.95 304.02 4.33 62 371 1999-00 118.61 107.69 2.79 2000-01 146.73 123.47 3.39
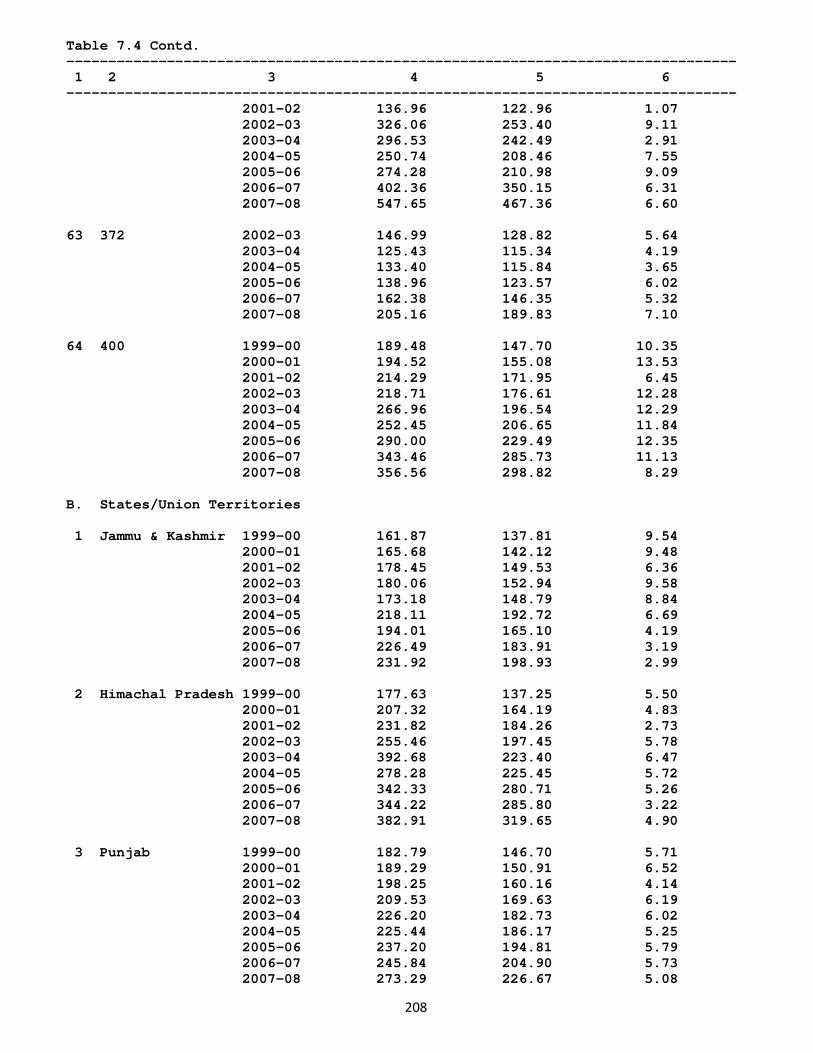
208
Table 7.4 Contd. -------------------------------------------------------------------------------- 1 2 3 4 5 6 -------------------------------------------------------------------------------- 2001-02 136.96 122.96 1.07 2002-03 326.06 253.40 9.11 2003-04 296.53 242.49 2.91 2004-05 250.74 208.46 7.55 2005-06 274.28 210.98 9.09 2006-07 402.36 350.15 6.31 2007-08 547.65 467.36 6.60 63 372 2002-03 146.99 128.82 5.64 2003-04 125.43 115.34 4.19 2004-05 133.40 115.84 3.65 2005-06 138.96 123.57 6.02 2006-07 162.38 146.35 5.32 2007-08 205.16 189.83 7.10 64 400 1999-00 189.48 147.70 10.35 2000-01 194.52 155.08 13.53 2001-02 214.29 171.95 6.45 2002-03 218.71 176.61 12.28 2003-04 266.96 196.54 12.29 2004-05 252.45 206.65 11.84 2005-06 290.00 229.49 12.35 2006-07 343.46 285.73 11.13 2007-08 356.56 298.82 8.29 B. States/Union Territories 1 Jammu & Kashmir 1999-00 161.87 137.81 9.54 2000-01 165.68 142.12 9.48 2001-02 178.45 149.53 6.36 2002-03 180.06 152.94 9.58 2003-04 173.18 148.79 8.84 2004-05 218.11 192.72 6.69 2005-06 194.01 165.10 4.19 2006-07 226.49 183.91 3.19 2007-08 231.92 198.93 2.99 2 Himachal Pradesh 1999-00 177.63 137.25 5.50 2000-01 207.32 164.19 4.83 2001-02 231.82 184.26 2.73 2002-03 255.46 197.45 5.78 2003-04 392.68 223.40 6.47 2004-05 278.28 225.45 5.72 2005-06 342.33 280.71 5.26 2006-07 344.22 285.80 3.22 2007-08 382.91 319.65 4.90 3 Punjab 1999-00 182.79 146.70 5.71 2000-01 189.29 150.91 6.52 2001-02 198.25 160.16 4.14 2002-03 209.53 169.63 6.19 2003-04 226.20 182.73 6.02 2004-05 225.44 186.17 5.25 2005-06 237.20 194.81 5.79 2006-07 245.84 204.90 5.73 2007-08 273.29 226.67 5.08
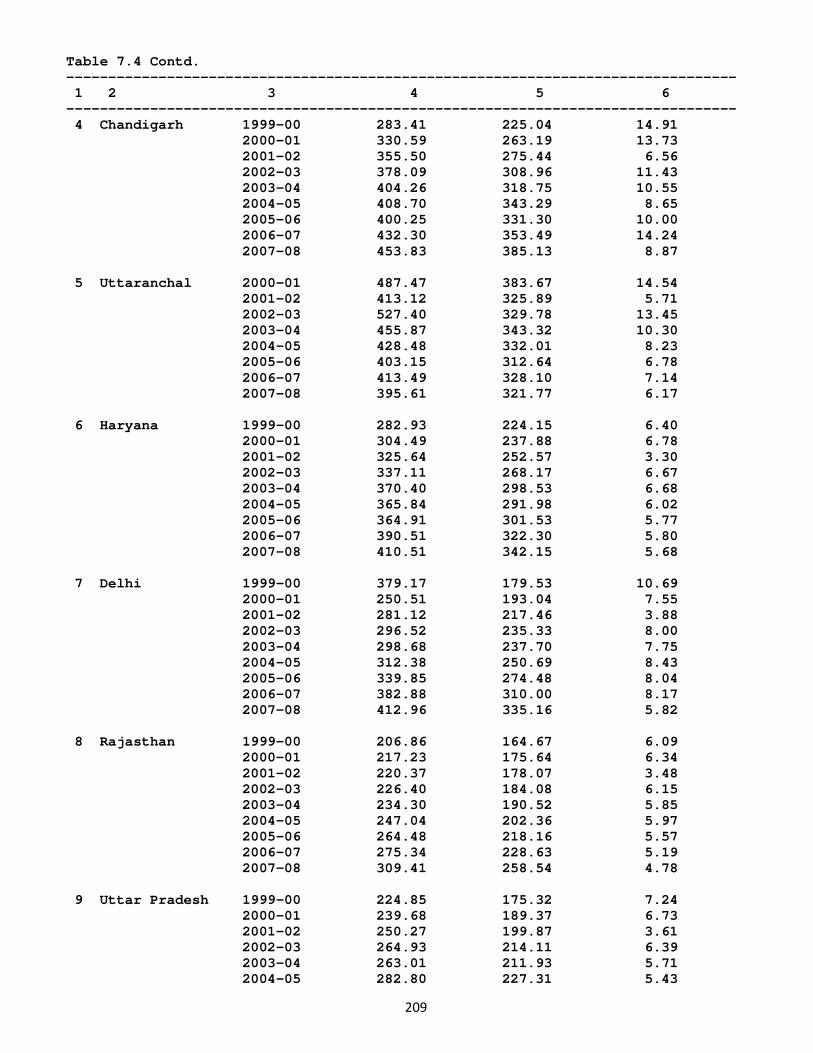
209
Table 7.4 Contd. -------------------------------------------------------------------------------- 1 2 3 4 5 6 -------------------------------------------------------------------------------- 4 Chandigarh 1999-00 283.41 225.04 14.91 2000-01 330.59 263.19 13.73 2001-02 355.50 275.44 6.56 2002-03 378.09 308.96 11.43 2003-04 404.26 318.75 10.55 2004-05 408.70 343.29 8.65 2005-06 400.25 331.30 10.00 2006-07 432.30 353.49 14.24 2007-08 453.83 385.13 8.87 5 Uttaranchal 2000-01 487.47 383.67 14.54 2001-02 413.12 325.89 5.71 2002-03 527.40 329.78 13.45 2003-04 455.87 343.32 10.30 2004-05 428.48 332.01 8.23 2005-06 403.15 312.64 6.78 2006-07 413.49 328.10 7.14 2007-08 395.61 321.77 6.17 6 Haryana 1999-00 282.93 224.15 6.40 2000-01 304.49 237.88 6.78 2001-02 325.64 252.57 3.30 2002-03 337.11 268.17 6.67 2003-04 370.40 298.53 6.68 2004-05 365.84 291.98 6.02 2005-06 364.91 301.53 5.77 2006-07 390.51 322.30 5.80 2007-08 410.51 342.15 5.68 7 Delhi 1999-00 379.17 179.53 10.69 2000-01 250.51 193.04 7.55 2001-02 281.12 217.46 3.88 2002-03 296.52 235.33 8.00 2003-04 298.68 237.70 7.75 2004-05 312.38 250.69 8.43 2005-06 339.85 274.48 8.04 2006-07 382.88 310.00 8.17 2007-08 412.96 335.16 5.82 8 Rajasthan 1999-00 206.86 164.67 6.09 2000-01 217.23 175.64 6.34 2001-02 220.37 178.07 3.48 2002-03 226.40 184.08 6.15 2003-04 234.30 190.52 5.85 2004-05 247.04 202.36 5.97 2005-06 264.48 218.16 5.57 2006-07 275.34 228.63 5.19 2007-08 309.41 258.54 4.78 9 Uttar Pradesh 1999-00 224.85 175.32 7.24 2000-01 239.68 189.37 6.73 2001-02 250.27 199.87 3.61 2002-03 264.93 214.11 6.39 2003-04 263.01 211.93 5.71 2004-05 282.80 227.31 5.43
210
Table 7.4 Contd. -------------------------------------------------------------------------------- 1 2 3 4 5 6 -------------------------------------------------------------------------------- 2005-06 301.17 243.50 5.87 2006-07 334.77 274.78 5.09 2007-08 359.40 294.16 4.91 10 Bihar 1999-00 291.41 237.54 10.69 2000-01 242.26 194.35 5.64 2001-02 231.07 170.96 3.64 2002-03 283.18 180.76 5.65 2003-04 237.38 189.88 3.87 2004-05 229.53 180.28 1.66 2005-06 233.86 185.53 2.16 2006-07 267.70 207.02 2.18 2007-08 260.49 206.43 2.03 11 Nagaland 1999-00 82.58 72.88 11.78 2000-01 87.25 77.39 7.33 2001-02 95.68 86.20 5.55 2002-03 87.06 79.87 7.35 2003-04 90.88 82.02 7.08 2004-05 102.84 89.21 8.40 2005-06 140.68 107.77 12.30 2006-07 107.37 94.32 11.27 2007-08 109.91 93.31 7.86 12 Manipur 1999-00 64.80 62.37 12.37 2000-01 59.86 57.18 6.86 2001-02 64.58 61.47 8.28 2002-03 77.69 74.71 13.57 2003-04 72.55 69.33 13.43 2004-05 91.88 88.77 12.43 2005-06 91.78 87.60 13.67 2006-07 95.49 90.72 16.32 2007-08 101.90 96.66 13.25 13 Tripura 1999-00 90.59 79.93 16.66 2000-01 98.11 83.64 10.84 2001-02 109.53 94.22 9.26 2002-03 104.50 88.88 12.58 2003-04 102.16 88.08 11.11 2004-05 104.12 89.30 8.92 2005-06 107.00 92.23 9.45 2006-07 110.85 95.61 8.22 2007-08 128.87 109.41 9.47 14 Meghalaya 1999-00 119.13 104.80 5.77 2000-01 127.38 114.31 4.71 2001-02 127.25 114.66 2.59 2002-03 127.48 116.05 3.70 2003-04 153.97 133.89 3.25 2004-05 263.82 231.33 5.39 2005-06 242.25 212.54 4.95 2006-07 260.14 224.57 5.55 2007-08 310.60 266.53 4.90 15 Assam 1999-00 139.78 104.64 7.11 2000-01 160.48 121.47 7.09
211
Table 7.4 Contd. -------------------------------------------------------------------------------- 1 2 3 4 5 6 -------------------------------------------------------------------------------- 2001-02 165.13 119.72 4.91 2002-03 185.24 136.98 6.06 2003-04 200.40 148.74 5.23 2004-05 204.39 152.15 3.90 2005-06 208.06 155.25 3.43 2006-07 226.71 169.54 3.36 2007-08 245.08 189.76 3.34 16 West Bengal 1999-00 252.14 200.12 13.92 2000-01 266.51 213.26 12.78 2001-02 288.30 217.53 8.02 2002-03 304.41 230.32 11.50 2003-04 300.76 228.06 10.55 2004-05 310.72 236.86 8.49 2005-06 313.80 248.21 7.64 2006-07 360.38 264.05 6.76 2007-08 392.26 292.88 6.93 17 Jharkhand 2000-01 393.79 319.63 13.33 2001-02 468.85 360.98 9.30 2002-03 491.71 383.46 12.87 2003-04 590.59 480.00 13.13 2004-05 524.65 386.32 11.19 2005-06 558.73 436.53 9.03 2006-07 610.79 470.44 7.78 2007-08 835.12 620.86 9.43 18 Orissa 1999-00 236.31 188.59 10.29 2000-01 273.97 220.72 9.63 2001-02 321.08 251.41 6.19 2002-03 338.74 252.78 9.99 2003-04 398.49 268.98 10.08 2004-05 329.04 253.95 3.49 2005-06 358.41 288.37 8.57 2006-07 402.98 314.24 8.10 2007-08 481.40 388.95 8.77 19 Chhattisgarh 2000-01 395.57 314.18 12.25 2001-02 422.13 335.34 5.54 2002-03 476.95 350.67 12.49 2003-04 559.46 449.37 11.75 2004-05 469.66 362.05 8.86 2005-06 497.65 392.87 8.16 2006-07 505.91 419.34 7.81 2007-08 644.75 501.30 8.08 20 Madhya Pradesh 1999-00 263.98 206.43 6.73 2000-01 268.64 206.78 7.22 2001-02 282.85 206.72 3.39 2002-03 280.50 214.77 5.90 2003-04 295.48 225.40 5.46 2004-05 313.24 240.58 5.77 2005-06 326.53 255.48 5.96 2006-07 354.05 279.06 5.62 2007-08 389.35 309.28 5.37
212
Table 7.4 Contd. -------------------------------------------------------------------------------- 1 2 3 4 5 6 -------------------------------------------------------------------------------- 21 Gujarat 1999-00 243.01 182.01 6.25 2000-01 251.46 196.55 5.27 2001-02 277.56 214.51 2.36 2002-03 291.75 228.18 4.12 2003-04 312.41 245.73 4.04 2004-05 326.68 258.93 3.71 2005-06 333.86 270.59 3.67 2006-07 355.16 290.24 3.55 2007-08 395.22 325.91 3.22 22 Daman & Diu 1999-00 149.84 120.14 2.60 2000-01 156.23 125.93 3.17 2001-02 202.97 164.46 1.60 2002-03 216.21 180.00 2.94 2003-04 223.29 179.59 3.59 2004-05 246.68 201.09 4.17 2005-06 301.64 238.61 3.72 2006-07 272.72 228.09 2.40 2007-08 395.87 313.79 4.56 23 D & Nagar Haveli 1999-00 191.52 149.20 1.74 2000-01 197.44 154.60 2.12 2001-02 219.69 178.52 1.20 2002-03 236.41 193.54 3.14 2003-04 250.59 200.62 2.10 2004-05 287.25 234.11 1.57 2005-06 267.22 224.76 1.84 2006-07 316.64 265.55 2.74 2007-08 306.88 252.22 2.16 24 Maharashtra 1999-00 340.02 251.61 8.70 2000-01 355.95 269.20 8.52 2001-02 376.99 277.22 4.70 2002-03 391.24 291.58 7.98 2003-04 437.86 321.88 7.95 2004-05 447.63 343.09 6.51 2005-06 472.62 365.43 6.06 2006-07 511.05 400.09 6.22 2007-08 575.88 458.21 6.17 25 Andhra Pradesh 1999-00 148.29 119.43 7.76 2000-01 165.54 133.25 8.10 2001-02 169.07 137.31 4.96 2002-03 169.14 137.47 7.08 2003-04 193.60 151.37 7.26 2004-05 195.81 159.63 6.77 2005-06 214.11 174.39 6.42 2006-07 254.28 197.21 5.95 2007-08 294.98 237.94 5.58 26 Karnataka 1999-00 243.83 186.71 10.03 2000-01 274.71 209.14 9.91 2001-02 293.45 223.13 4.75 2002-03 331.00 245.60 8.90 2003-04 337.26 252.30 7.65 2004-05 340.82 265.69 7.27
213
Table 7.4 Contd. -------------------------------------------------------------------------------- 1 2 3 4 5 6 -------------------------------------------------------------------------------- 2005-06 354.68 277.12 6.66 2006-07 373.75 296.95 6.76 2007-08 455.14 362.54 6.89 27 Goa 1999-00 306.66 231.09 5.15 2000-01 337.50 243.25 5.11 2001-02 370.05 271.34 2.65 2002-03 370.02 269.67 5.67 2003-04 393.84 297.55 4.88 2004-05 427.61 326.00 4.33 2005-06 453.09 354.96 4.53 2006-07 492.02 383.96 4.51 2007-08 490.47 391.99 4.10 28 Lakshadweep 2007-08 - - - 29 Kerala 1999-00 206.78 154.43 7.96 2000-01 232.75 173.19 7.45 2001-02 251.23 189.83 5.54 2002-03 264.33 196.62 7.44 2003-04 257.71 193.21 7.02 2004-05 260.25 193.81 6.55 2005-06 276.06 206.24 6.02 2006-07 289.92 220.22 5.41 2007-08 299.18 228.94 5.32 30 Tamil Nadu 1999-00 191.99 140.23 8.00 2000-01 209.20 155.95 8.15 2001-02 212.39 155.23 5.34 2002-03 228.83 170.39 8.06 2003-04 238.84 176.16 7.73 2004-05 238.88 180.60 6.73 2005-06 256.53 196.12 6.70 2006-07 276.47 209.39 6.44 2007-08 316.59 245.30 6.40 31 Pondicherry 1999-00 202.80 143.17 5.86 2000-01 208.19 154.02 5.35 2001-02 239.14 175.05 3.42 2002-03 240.98 180.91 4.87 2003-04 256.68 190.42 4.58 2004-05 259.82 194.58 4.71 2005-06 338.85 270.55 5.10 2006-07 352.94 283.58 4.55 2007-08 451.66 360.55 5.68 32 A & N Islands 1999-00 134.33 110.47 15.35 2000-01 134.29 111.61 20.23 2001-02 279.51 132.30 9.01 2002-03 187.67 158.05 14.34 2003-04 261.89 168.26 3.24 2004-05 219.88 183.50 2.51 2005-06 250.08 220.11 3.35 2006-07 345.90 301.44 3.19 2007-08 334.71 287.25 2.80
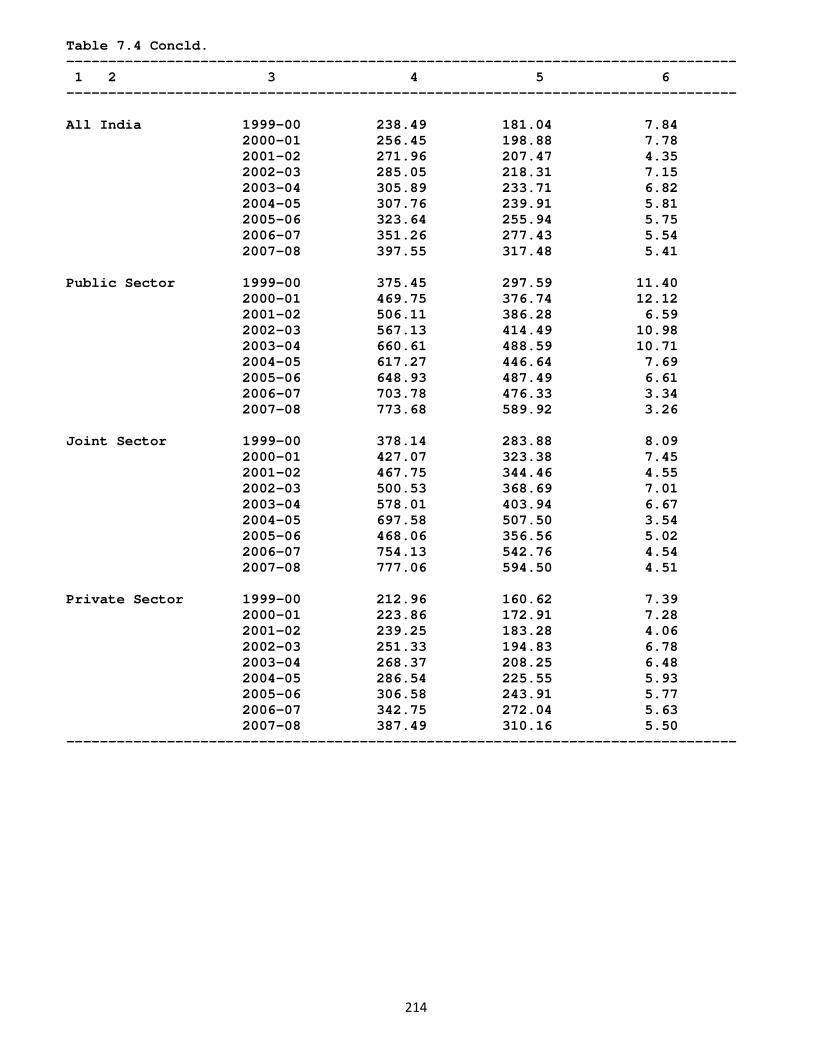
214
Table 7.4 Concld. -------------------------------------------------------------------------------- 1 2 3 4 5 6 -------------------------------------------------------------------------------- All India 1999-00 238.49 181.04 7.84 2000-01 256.45 198.88 7.78 2001-02 271.96 207.47 4.35 2002-03 285.05 218.31 7.15 2003-04 305.89 233.71 6.82 2004-05 307.76 239.91 5.81 2005-06 323.64 255.94 5.75 2006-07 351.26 277.43 5.54 2007-08 397.55 317.48 5.41 Public Sector 1999-00 375.45 297.59 11.40 2000-01 469.75 376.74 12.12 2001-02 506.11 386.28 6.59 2002-03 567.13 414.49 10.98 2003-04 660.61 488.59 10.71 2004-05 617.27 446.64 7.69 2005-06 648.93 487.49 6.61 2006-07 703.78 476.33 3.34 2007-08 773.68 589.92 3.26 Joint Sector 1999-00 378.14 283.88 8.09 2000-01 427.07 323.38 7.45 2001-02 467.75 344.46 4.55 2002-03 500.53 368.69 7.01 2003-04 578.01 403.94 6.67 2004-05 697.58 507.50 3.54 2005-06 468.06 356.56 5.02 2006-07 754.13 542.76 4.54 2007-08 777.06 594.50 4.51 Private Sector 1999-00 212.96 160.62 7.39 2000-01 223.86 172.91 7.28 2001-02 239.25 183.28 4.06 2002-03 251.33 194.83 6.78 2003-04 268.37 208.25 6.48 2004-05 286.54 225.55 5.93 2005-06 306.58 243.91 5.77 2006-07 342.75 272.04 5.63 2007-08 387.49 310.16 5.50 --------------------------------------------------------------------------------
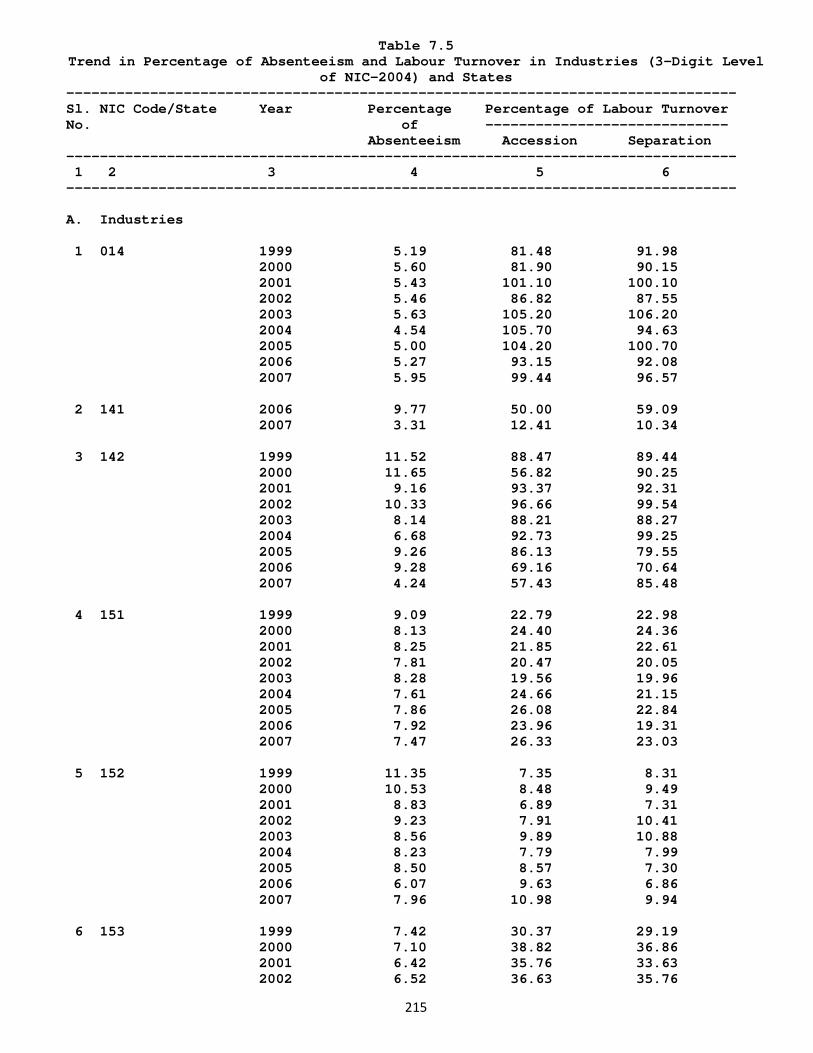
215
Table 7.5 Trend in Percentage of Absenteeism and Labour Turnover in Industries (3-Digit Level
of NIC-2004) and States -------------------------------------------------------------------------------- Sl. NIC Code/State Year Percentage Percentage of Labour Turnover No. of ----------------------------- Absenteeism Accession Separation -------------------------------------------------------------------------------- 1 2 3 4 5 6 -------------------------------------------------------------------------------- A. Industries 1 014 1999 5.19 81.48 91.98 2000 5.60 81.90 90.15 2001 5.43 101.10 100.10 2002 5.46 86.82 87.55 2003 5.63 105.20 106.20 2004 4.54 105.70 94.63 2005 5.00 104.20 100.70 2006 5.27 93.15 92.08 2007 5.95 99.44 96.57 2 141 2006 9.77 50.00 59.09 2007 3.31 12.41 10.34 3 142 1999 11.52 88.47 89.44 2000 11.65 56.82 90.25 2001 9.16 93.37 92.31 2002 10.33 96.66 99.54 2003 8.14 88.21 88.27 2004 6.68 92.73 99.25 2005 9.26 86.13 79.55 2006 9.28 69.16 70.64 2007 4.24 57.43 85.48 4 151 1999 9.09 22.79 22.98 2000 8.13 24.40 24.36 2001 8.25 21.85 22.61 2002 7.81 20.47 20.05 2003 8.28 19.56 19.96 2004 7.61 24.66 21.15 2005 7.86 26.08 22.84 2006 7.92 23.96 19.31 2007 7.47 26.33 23.03 5 152 1999 11.35 7.35 8.31 2000 10.53 8.48 9.49 2001 8.83 6.89 7.31 2002 9.23 7.91 10.41 2003 8.56 9.89 10.88 2004 8.23 7.79 7.99 2005 8.50 8.57 7.30 2006 6.07 9.63 6.86 2007 7.96 10.98 9.94 6 153 1999 7.42 30.37 29.19 2000 7.10 38.82 36.86 2001 6.42 35.76 33.63 2002 6.52 36.63 35.76
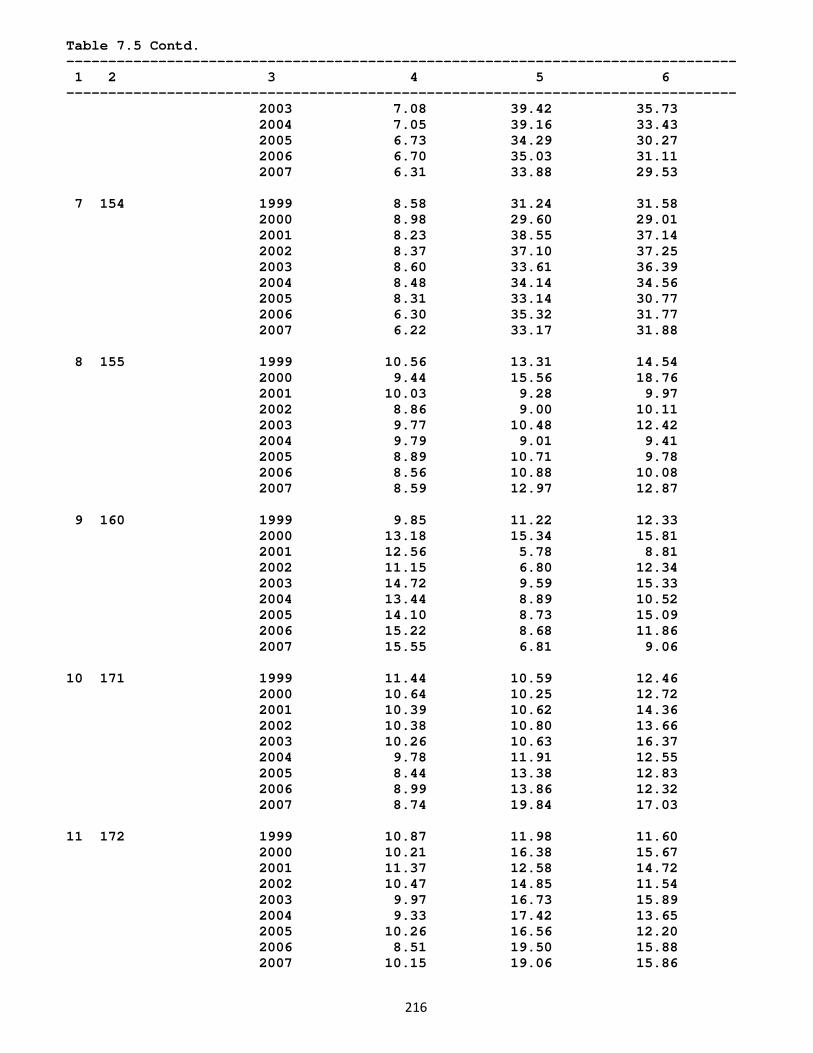
216
Table 7.5 Contd. -------------------------------------------------------------------------------- 1 2 3 4 5 6 -------------------------------------------------------------------------------- 2003 7.08 39.42 35.73 2004 7.05 39.16 33.43 2005 6.73 34.29 30.27 2006 6.70 35.03 31.11 2007 6.31 33.88 29.53 7 154 1999 8.58 31.24 31.58 2000 8.98 29.60 29.01 2001 8.23 38.55 37.14 2002 8.37 37.10 37.25 2003 8.60 33.61 36.39 2004 8.48 34.14 34.56 2005 8.31 33.14 30.77 2006 6.30 35.32 31.77 2007 6.22 33.17 31.88 8 155 1999 10.56 13.31 14.54 2000 9.44 15.56 18.76 2001 10.03 9.28 9.97 2002 8.86 9.00 10.11 2003 9.77 10.48 12.42 2004 9.79 9.01 9.41 2005 8.89 10.71 9.78 2006 8.56 10.88 10.08 2007 8.59 12.97 12.87 9 160 1999 9.85 11.22 12.33 2000 13.18 15.34 15.81 2001 12.56 5.78 8.81 2002 11.15 6.80 12.34 2003 14.72 9.59 15.33 2004 13.44 8.89 10.52 2005 14.10 8.73 15.09 2006 15.22 8.68 11.86 2007 15.55 6.81 9.06 10 171 1999 11.44 10.59 12.46 2000 10.64 10.25 12.72 2001 10.39 10.62 14.36 2002 10.38 10.80 13.66 2003 10.26 10.63 16.37 2004 9.78 11.91 12.55 2005 8.44 13.38 12.83 2006 8.99 13.86 12.32 2007 8.74 19.84 17.03 11 172 1999 10.87 11.98 11.60 2000 10.21 16.38 15.67 2001 11.37 12.58 14.72 2002 10.47 14.85 11.54 2003 9.97 16.73 15.89 2004 9.33 17.42 13.65 2005 10.26 16.56 12.20 2006 8.51 19.50 15.88 2007 10.15 19.06 15.86
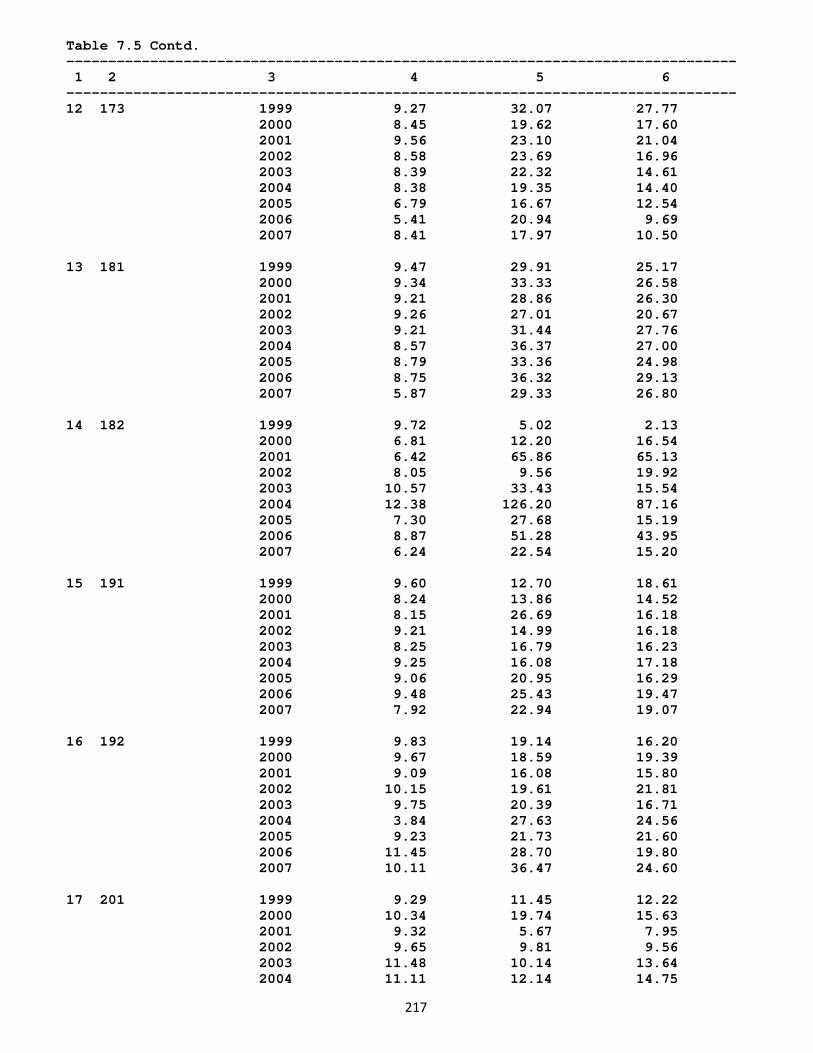
217
Table 7.5 Contd. -------------------------------------------------------------------------------- 1 2 3 4 5 6 -------------------------------------------------------------------------------- 12 173 1999 9.27 32.07 27.77 2000 8.45 19.62 17.60 2001 9.56 23.10 21.04 2002 8.58 23.69 16.96 2003 8.39 22.32 14.61 2004 8.38 19.35 14.40 2005 6.79 16.67 12.54 2006 5.41 20.94 9.69 2007 8.41 17.97 10.50 13 181 1999 9.47 29.91 25.17 2000 9.34 33.33 26.58 2001 9.21 28.86 26.30 2002 9.26 27.01 20.67 2003 9.21 31.44 27.76 2004 8.57 36.37 27.00 2005 8.79 33.36 24.98 2006 8.75 36.32 29.13 2007 5.87 29.33 26.80 14 182 1999 9.72 5.02 2.13 2000 6.81 12.20 16.54 2001 6.42 65.86 65.13 2002 8.05 9.56 19.92 2003 10.57 33.43 15.54 2004 12.38 126.20 87.16 2005 7.30 27.68 15.19 2006 8.87 51.28 43.95 2007 6.24 22.54 15.20 15 191 1999 9.60 12.70 18.61 2000 8.24 13.86 14.52 2001 8.15 26.69 16.18 2002 9.21 14.99 16.18 2003 8.25 16.79 16.23 2004 9.25 16.08 17.18 2005 9.06 20.95 16.29 2006 9.48 25.43 19.47 2007 7.92 22.94 19.07 16 192 1999 9.83 19.14 16.20 2000 9.67 18.59 19.39 2001 9.09 16.08 15.80 2002 10.15 19.61 21.81 2003 9.75 20.39 16.71 2004 3.84 27.63 24.56 2005 9.23 21.73 21.60 2006 11.45 28.70 19.80 2007 10.11 36.47 24.60 17 201 1999 9.29 11.45 12.22 2000 10.34 19.74 15.63 2001 9.32 5.67 7.95 2002 9.65 9.81 9.56 2003 11.48 10.14 13.64 2004 11.11 12.14 14.75
218
Table 7.5 Contd. -------------------------------------------------------------------------------- 1 2 3 4 5 6 -------------------------------------------------------------------------------- 2005 10.13 12.59 13.56 2006 9.42 10.57 10.67 2007 8.48 9.42 10.53 18 202 1999 10.81 15.65 18.32 2000 10.31 13.04 14.73 2001 11.83 13.30 16.62 2002 9.89 15.53 15.44 2003 12.14 14.03 14.14 2004 11.45 14.73 17.08 2005 11.29 16.51 15.58 2006 10.83 22.75 16.62 2007 10.00 19.22 16.35 19 210 1999 10.30 10.72 12.31 2000 9.62 9.30 9.25 2001 9.19 7.58 10.65 2002 9.22 9.42 11.23 2003 10.03 8.99 10.00 2004 9.28 9.59 10.18 2005 7.92 10.50 298.60 2006 8.34 12.51 10.17 2007 9.49 13.14 12.31 20 221 1999 9.66 6.97 11.20 2000 9.21 7.05 7.96 2001 8.27 7.91 7.86 2002 8.02 6.29 7.13 2003 8.44 6.92 9.21 2004 7.81 5.85 7.79 2005 7.79 6.78 11.09 2006 7.84 9.85 7.67 2007 8.76 15.23 9.93 21 222 1999 9.47 11.64 13.27 2000 10.00 9.99 11.85 2001 9.06 12.18 12.78 2002 8.60 8.01 8.65 2003 9.80 10.18 12.51 2004 9.20 11.45 12.03 2005 9.51 13.24 11.24 2006 8.74 18.59 11.93 2007 8.66 15.94 14.24 22 223 1999 10.49 5.45 14.35 2000 11.14 29.31 17.09 2001 2.08 11.59 18.36 2002 9.31 17.47 11.60 2003 10.66 12.25 27.57 2004 8.89 17.47 16.18 2005 8.37 19.63 16.54 2006 13.04 5.01 14.72 2007 13.06 6.12 44.21 23 231 1999 7.89 5.08 7.79 2000 8.59 4.58 9.23
219
Table 7.5 Contd. -------------------------------------------------------------------------------- 1 2 3 4 5 6 -------------------------------------------------------------------------------- 2001 7.81 4.09 8.10 2002 8.14 3.98 5.83 2003 8.66 5.48 7.48 2004 8.65 4.96 5.38 2005 7.53 5.42 7.17 2006 7.12 6.56 6.55 2007 7.97 9.77 10.76 24 232 1999 9.57 5.17 3.14 2000 9.63 4.95 5.40 2001 8.49 5.31 5.85 2002 11.30 3.74 4.17 2003 9.93 4.11 5.36 2004 11.08 3.84 5.76 2005 9.74 4.19 5.80 2006 9.67 3.70 4.15 2007 9.88 6.51 4.68 25 241 1999 10.30 6.25 7.78 2000 9.96 6.44 8.27 2001 9.61 5.19 8.68 2002 8.54 5.48 8.46 2003 10.92 4.56 10.38 2004 9.87 6.83 8.79 2005 9.45 6.30 9.11 2006 9.73 8.42 9.83 2007 9.87 10.11 11.54 26 242 1999 9.68 13.76 16.18 2000 9.46 14.14 15.98 2001 9.34 10.69 13.03 2002 8.55 11.46 13.04 2003 9.11 11.71 13.62 2004 6.07 12.48 12.51 2005 8.27 12.31 12.43 2006 8.21 14.17 11.99 2007 8.50 15.82 13.36 27 243 1999 12.49 4.31 5.93 2000 14.29 7.21 9.18 2001 11.83 3.04 6.30 2002 12.24 4.15 7.66 2003 12.37 3.44 9.90 2004 12.11 8.78 10.13 2005 11.70 11.05 9.64 2006 10.96 6.57 9.20 2007 10.15 7.04 9.38 28 251 1999 11.86 27.20 24.18 2000 12.80 19.55 19.61 2001 11.79 13.46 16.09 2002 13.16 13.97 14.33 2003 12.39 19.37 18.71 2004 12.35 17.57 18.30 2005 10.86 21.71 18.87 2006 12.18 11.78 10.89
220
Table 7.5 Contd. -------------------------------------------------------------------------------- 1 2 3 4 5 6 -------------------------------------------------------------------------------- 2007 10.70 14.36 15.69 29 252 1999 10.17 16.04 14.19 2000 9.64 13.51 13.02 2001 8.69 12.49 12.44 2002 8.30 12.01 11.29 2003 9.36 14.82 13.83 2004 9.31 15.19 13.81 2005 8.70 16.78 13.61 2006 9.06 15.75 11.65 2007 8.44 19.40 14.68 30 261 1999 11.09 20.39 20.35 2000 10.17 14.21 15.79 2001 9.45 9.50 10.76 2002 11.11 8.97 10.98 2003 10.91 11.35 17.09 2004 9.87 11.48 10.82 2005 10.09 15.48 13.67 2006 9.02 11.13 13.12 2007 8.35 19.41 13.74 31 269 1999 10.42 12.81 15.42 2000 10.23 13.49 15.72 2001 9.98 15.80 17.78 2002 9.64 15.45 17.04 2003 10.32 14.33 17.52 2004 10.12 16.68 16.71 2005 8.44 18.38 18.46 2006 8.86 14.45 14.33 2007 8.63 19.26 16.31 32 271 1999 10.36 6.45 12.17 2000 9.84 6.46 8.83 2001 5.53 5.09 8.81 2002 9.06 5.48 8.72 2003 11.01 7.20 8.79 2004 7.22 7.61 7.75 2005 8.14 7.88 8.02 2006 7.38 11.62 8.84 2007 7.04 9.45 7.48 33 272 1999 10.93 8.04 15.08 2000 10.51 7.34 12.92 2001 9.65 7.77 11.48 2002 10.58 5.91 9.69 2003 10.68 7.96 8.27 2004 10.41 8.52 9.73 2005 10.52 2.18 1.80 2006 9.15 14.89 8.21 2007 9.81 10.68 11.76 34 273 1999 10.80 13.32 13.50 2000 11.35 9.45 11.30 2001 10.83 9.79 15.28 2002 10.16 9.77 13.11
221
Table 7.5 Contd. -------------------------------------------------------------------------------- 1 2 3 4 5 6 -------------------------------------------------------------------------------- 2003 10.72 14.90 12.93 2004 10.63 17.36 14.63 2005 9.78 13.89 12.31 2006 9.57 14.76 10.92 2007 9.54 19.34 17.93 35 281 1999 9.74 10.88 14.14 2000 11.23 9.00 13.10 2001 10.31 8.37 15.94 2002 10.25 11.25 13.45 2003 10.51 9.52 11.62 2004 9.73 14.40 11.81 2005 9.65 16.08 13.89 2006 8.70 18.97 11.39 2007 8.63 18.34 12.54 36 289 1999 12.25 18.53 21.07 2000 11.70 17.45 19.03 2001 12.34 15.06 17.25 2002 11.25 15.95 16.23 2003 11.40 18.50 16.64 2004 11.25 19.37 17.09 2005 10.78 20.28 17.00 2006 10.84 18.23 16.78 2007 10.06 20.65 15.83 37 291 1999 10.13 11.50 14.65 2000 10.01 9.78 11.81 2001 9.23 7.10 11.61 2002 9.73 8.46 11.17 2003 9.92 9.60 11.25 2004 9.42 11.75 10.34 2005 9.16 12.19 10.17 2006 8.44 14.38 10.67 2007 9.13 14.72 13.65 38 292 1999 10.97 12.64 17.03 2000 11.20 9.55 12.67 2001 10.36 9.14 17.88 2002 10.83 11.40 14.03 2003 10.32 14.03 13.83 2004 9.89 17.06 13.60 2005 2.17 14.05 11.46 2006 9.81 17.38 13.10 2007 9.63 18.00 13.14 39 293 1999 9.38 6.83 11.90 2000 11.34 25.68 30.87 2001 11.91 15.36 23.29 2002 10.60 20.34 29.19 2003 10.96 11.45 22.87 2004 10.23 17.48 19.05 2005 9.43 14.47 14.46 2006 12.50 40.93 38.97 2007 9.52 18.84 15.86
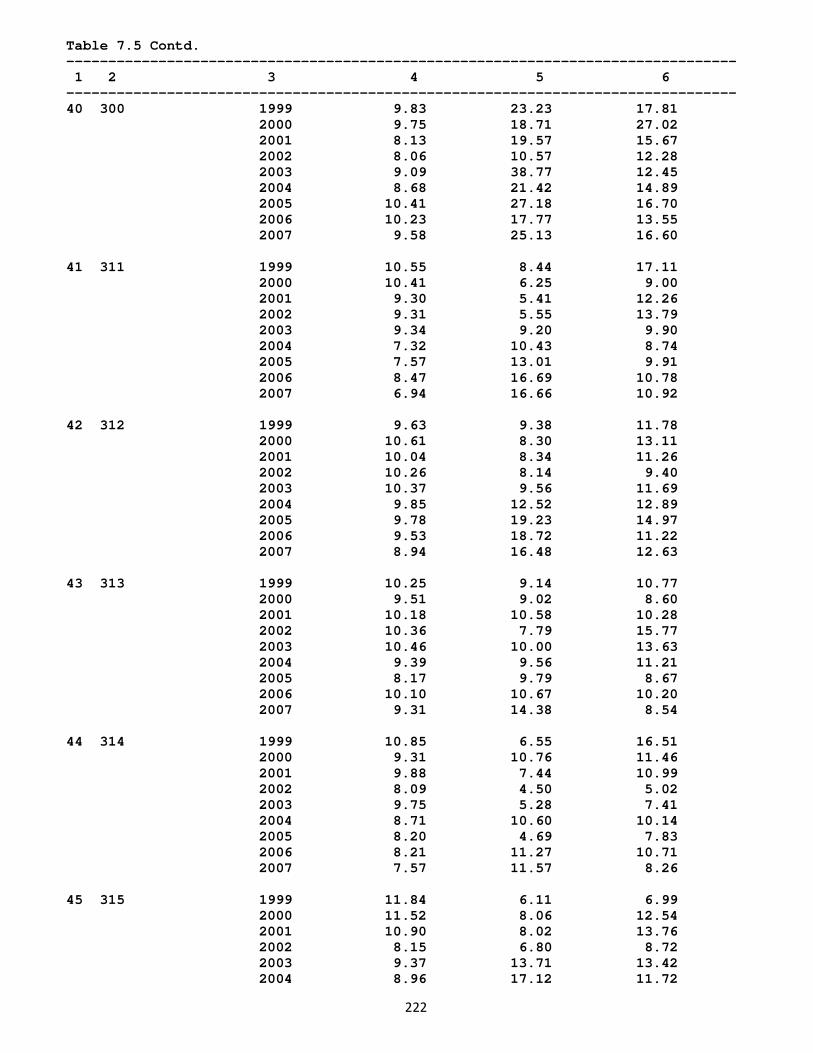
222
Table 7.5 Contd. -------------------------------------------------------------------------------- 1 2 3 4 5 6 -------------------------------------------------------------------------------- 40 300 1999 9.83 23.23 17.81 2000 9.75 18.71 27.02 2001 8.13 19.57 15.67 2002 8.06 10.57 12.28 2003 9.09 38.77 12.45 2004 8.68 21.42 14.89 2005 10.41 27.18 16.70 2006 10.23 17.77 13.55 2007 9.58 25.13 16.60 41 311 1999 10.55 8.44 17.11 2000 10.41 6.25 9.00 2001 9.30 5.41 12.26 2002 9.31 5.55 13.79 2003 9.34 9.20 9.90 2004 7.32 10.43 8.74 2005 7.57 13.01 9.91 2006 8.47 16.69 10.78 2007 6.94 16.66 10.92 42 312 1999 9.63 9.38 11.78 2000 10.61 8.30 13.11 2001 10.04 8.34 11.26 2002 10.26 8.14 9.40 2003 10.37 9.56 11.69 2004 9.85 12.52 12.89 2005 9.78 19.23 14.97 2006 9.53 18.72 11.22 2007 8.94 16.48 12.63 43 313 1999 10.25 9.14 10.77 2000 9.51 9.02 8.60 2001 10.18 10.58 10.28 2002 10.36 7.79 15.77 2003 10.46 10.00 13.63 2004 9.39 9.56 11.21 2005 8.17 9.79 8.67 2006 10.10 10.67 10.20 2007 9.31 14.38 8.54 44 314 1999 10.85 6.55 16.51 2000 9.31 10.76 11.46 2001 9.88 7.44 10.99 2002 8.09 4.50 5.02 2003 9.75 5.28 7.41 2004 8.71 10.60 10.14 2005 8.20 4.69 7.83 2006 8.21 11.27 10.71 2007 7.57 11.57 8.26 45 315 1999 11.84 6.11 6.99 2000 11.52 8.06 12.54 2001 10.90 8.02 13.76 2002 8.15 6.80 8.72 2003 9.37 13.71 13.42 2004 8.96 17.12 11.72
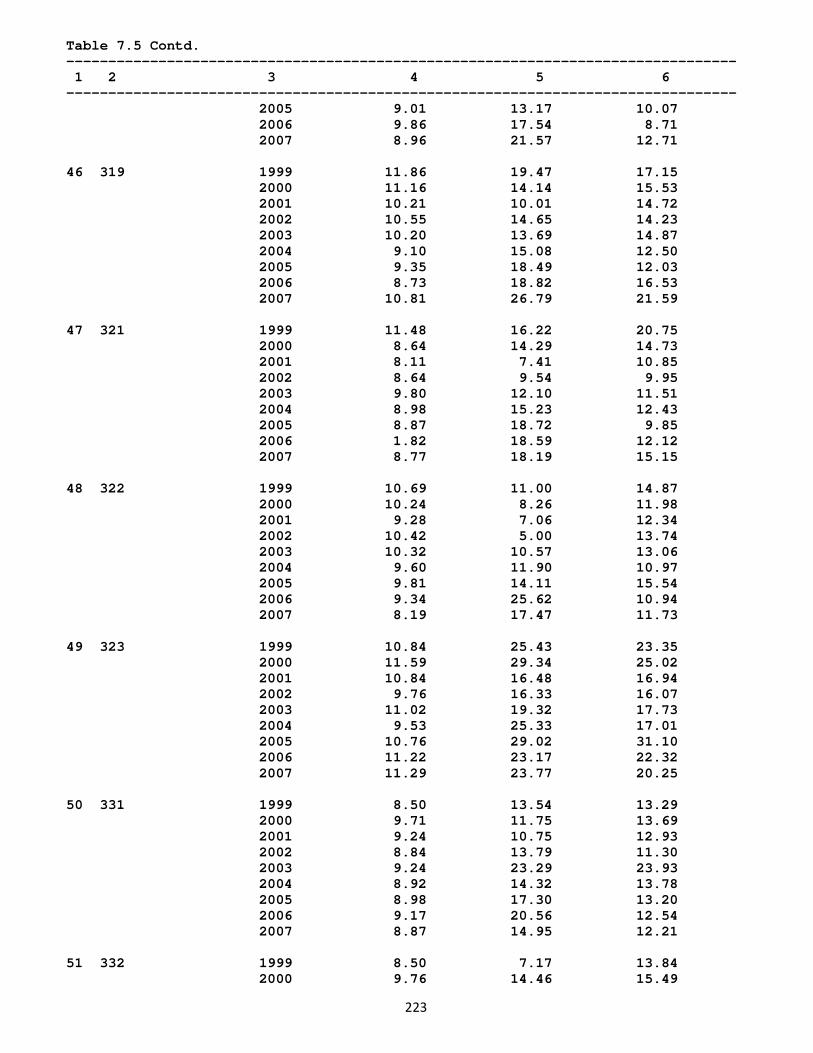
223
Table 7.5 Contd. -------------------------------------------------------------------------------- 1 2 3 4 5 6 -------------------------------------------------------------------------------- 2005 9.01 13.17 10.07 2006 9.86 17.54 8.71 2007 8.96 21.57 12.71 46 319 1999 11.86 19.47 17.15 2000 11.16 14.14 15.53 2001 10.21 10.01 14.72 2002 10.55 14.65 14.23 2003 10.20 13.69 14.87 2004 9.10 15.08 12.50 2005 9.35 18.49 12.03 2006 8.73 18.82 16.53 2007 10.81 26.79 21.59 47 321 1999 11.48 16.22 20.75 2000 8.64 14.29 14.73 2001 8.11 7.41 10.85 2002 8.64 9.54 9.95 2003 9.80 12.10 11.51 2004 8.98 15.23 12.43 2005 8.87 18.72 9.85 2006 1.82 18.59 12.12 2007 8.77 18.19 15.15 48 322 1999 10.69 11.00 14.87 2000 10.24 8.26 11.98 2001 9.28 7.06 12.34 2002 10.42 5.00 13.74 2003 10.32 10.57 13.06 2004 9.60 11.90 10.97 2005 9.81 14.11 15.54 2006 9.34 25.62 10.94 2007 8.19 17.47 11.73 49 323 1999 10.84 25.43 23.35 2000 11.59 29.34 25.02 2001 10.84 16.48 16.94 2002 9.76 16.33 16.07 2003 11.02 19.32 17.73 2004 9.53 25.33 17.01 2005 10.76 29.02 31.10 2006 11.22 23.17 22.32 2007 11.29 23.77 20.25 50 331 1999 8.50 13.54 13.29 2000 9.71 11.75 13.69 2001 9.24 10.75 12.93 2002 8.84 13.79 11.30 2003 9.24 23.29 23.93 2004 8.92 14.32 13.78 2005 8.98 17.30 13.20 2006 9.17 20.56 12.54 2007 8.87 14.95 12.21 51 332 1999 8.50 7.17 13.84 2000 9.76 14.46 15.49
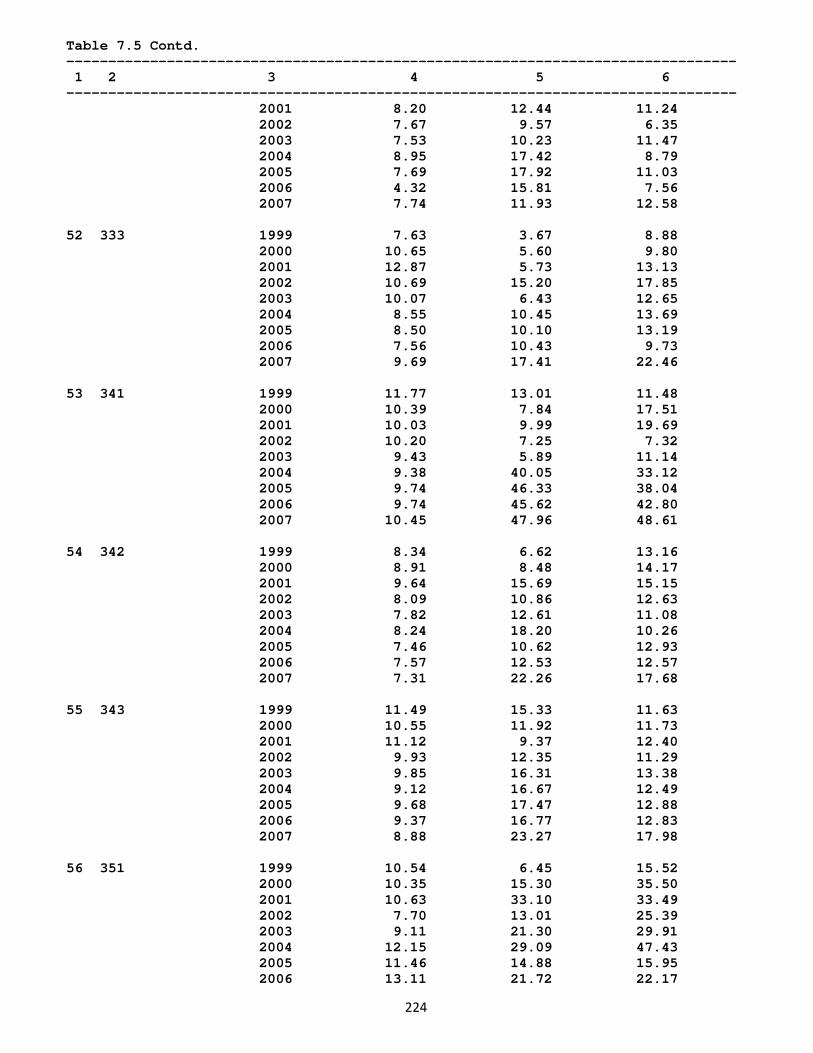
224
Table 7.5 Contd. -------------------------------------------------------------------------------- 1 2 3 4 5 6 -------------------------------------------------------------------------------- 2001 8.20 12.44 11.24 2002 7.67 9.57 6.35 2003 7.53 10.23 11.47 2004 8.95 17.42 8.79 2005 7.69 17.92 11.03 2006 4.32 15.81 7.56 2007 7.74 11.93 12.58 52 333 1999 7.63 3.67 8.88 2000 10.65 5.60 9.80 2001 12.87 5.73 13.13 2002 10.69 15.20 17.85 2003 10.07 6.43 12.65 2004 8.55 10.45 13.69 2005 8.50 10.10 13.19 2006 7.56 10.43 9.73 2007 9.69 17.41 22.46 53 341 1999 11.77 13.01 11.48 2000 10.39 7.84 17.51 2001 10.03 9.99 19.69 2002 10.20 7.25 7.32 2003 9.43 5.89 11.14 2004 9.38 40.05 33.12 2005 9.74 46.33 38.04 2006 9.74 45.62 42.80 2007 10.45 47.96 48.61 54 342 1999 8.34 6.62 13.16 2000 8.91 8.48 14.17 2001 9.64 15.69 15.15 2002 8.09 10.86 12.63 2003 7.82 12.61 11.08 2004 8.24 18.20 10.26 2005 7.46 10.62 12.93 2006 7.57 12.53 12.57 2007 7.31 22.26 17.68 55 343 1999 11.49 15.33 11.63 2000 10.55 11.92 11.73 2001 11.12 9.37 12.40 2002 9.93 12.35 11.29 2003 9.85 16.31 13.38 2004 9.12 16.67 12.49 2005 9.68 17.47 12.88 2006 9.37 16.77 12.83 2007 8.88 23.27 17.98 56 351 1999 10.54 6.45 15.52 2000 10.35 15.30 35.50 2001 10.63 33.10 33.49 2002 7.70 13.01 25.39 2003 9.11 21.30 29.91 2004 12.15 29.09 47.43 2005 11.46 14.88 15.95 2006 13.11 21.72 22.17
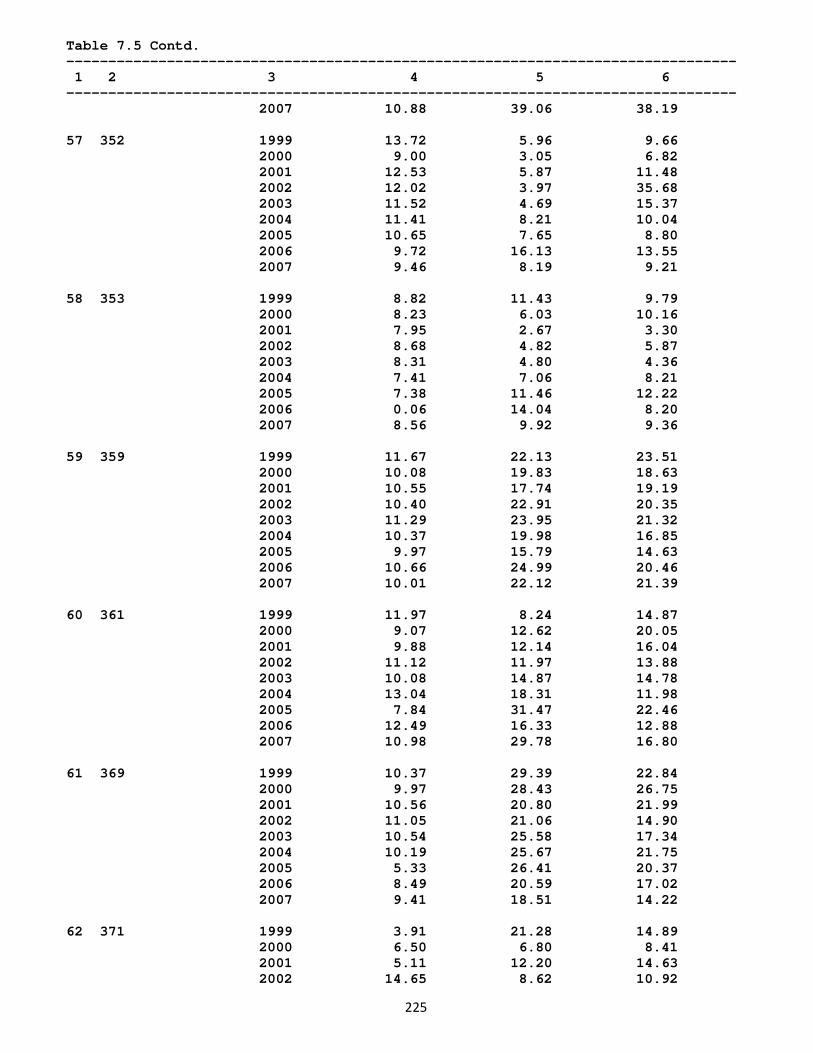
225
Table 7.5 Contd. -------------------------------------------------------------------------------- 1 2 3 4 5 6 -------------------------------------------------------------------------------- 2007 10.88 39.06 38.19 57 352 1999 13.72 5.96 9.66 2000 9.00 3.05 6.82 2001 12.53 5.87 11.48 2002 12.02 3.97 35.68 2003 11.52 4.69 15.37 2004 11.41 8.21 10.04 2005 10.65 7.65 8.80 2006 9.72 16.13 13.55 2007 9.46 8.19 9.21 58 353 1999 8.82 11.43 9.79 2000 8.23 6.03 10.16 2001 7.95 2.67 3.30 2002 8.68 4.82 5.87 2003 8.31 4.80 4.36 2004 7.41 7.06 8.21 2005 7.38 11.46 12.22 2006 0.06 14.04 8.20 2007 8.56 9.92 9.36 59 359 1999 11.67 22.13 23.51 2000 10.08 19.83 18.63 2001 10.55 17.74 19.19 2002 10.40 22.91 20.35 2003 11.29 23.95 21.32 2004 10.37 19.98 16.85 2005 9.97 15.79 14.63 2006 10.66 24.99 20.46 2007 10.01 22.12 21.39 60 361 1999 11.97 8.24 14.87 2000 9.07 12.62 20.05 2001 9.88 12.14 16.04 2002 11.12 11.97 13.88 2003 10.08 14.87 14.78 2004 13.04 18.31 11.98 2005 7.84 31.47 22.46 2006 12.49 16.33 12.88 2007 10.98 29.78 16.80 61 369 1999 10.37 29.39 22.84 2000 9.97 28.43 26.75 2001 10.56 20.80 21.99 2002 11.05 21.06 14.90 2003 10.54 25.58 17.34 2004 10.19 25.67 21.75 2005 5.33 26.41 20.37 2006 8.49 20.59 17.02 2007 9.41 18.51 14.22 62 371 1999 3.91 21.28 14.89 2000 6.50 6.80 8.41 2001 5.11 12.20 14.63 2002 14.65 8.62 10.92
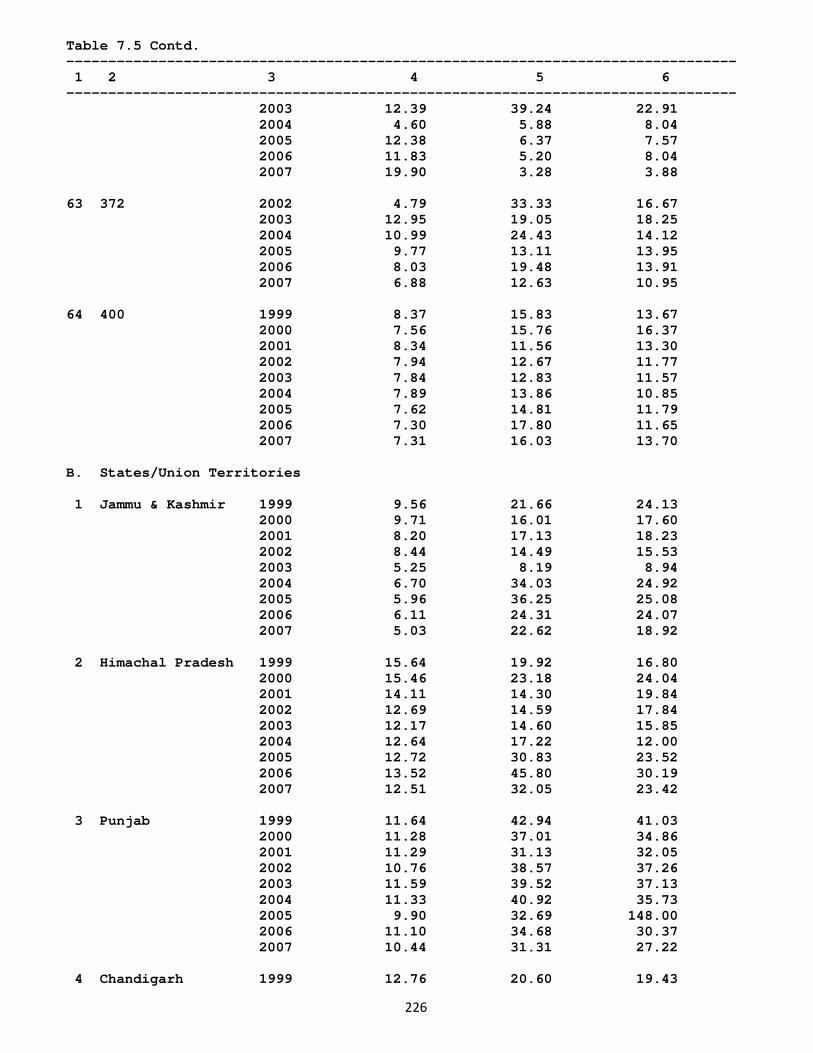
226
Table 7.5 Contd. -------------------------------------------------------------------------------- 1 2 3 4 5 6 -------------------------------------------------------------------------------- 2003 12.39 39.24 22.91 2004 4.60 5.88 8.04 2005 12.38 6.37 7.57 2006 11.83 5.20 8.04 2007 19.90 3.28 3.88 63 372 2002 4.79 33.33 16.67 2003 12.95 19.05 18.25 2004 10.99 24.43 14.12 2005 9.77 13.11 13.95 2006 8.03 19.48 13.91 2007 6.88 12.63 10.95 64 400 1999 8.37 15.83 13.67 2000 7.56 15.76 16.37 2001 8.34 11.56 13.30 2002 7.94 12.67 11.77 2003 7.84 12.83 11.57 2004 7.89 13.86 10.85 2005 7.62 14.81 11.79 2006 7.30 17.80 11.65 2007 7.31 16.03 13.70 B. States/Union Territories 1 Jammu & Kashmir 1999 9.56 21.66 24.13 2000 9.71 16.01 17.60 2001 8.20 17.13 18.23 2002 8.44 14.49 15.53 2003 5.25 8.19 8.94 2004 6.70 34.03 24.92 2005 5.96 36.25 25.08 2006 6.11 24.31 24.07 2007 5.03 22.62 18.92 2 Himachal Pradesh 1999 15.64 19.92 16.80 2000 15.46 23.18 24.04 2001 14.11 14.30 19.84 2002 12.69 14.59 17.84 2003 12.17 14.60 15.85 2004 12.64 17.22 12.00 2005 12.72 30.83 23.52 2006 13.52 45.80 30.19 2007 12.51 32.05 23.42 3 Punjab 1999 11.64 42.94 41.03 2000 11.28 37.01 34.86 2001 11.29 31.13 32.05 2002 10.76 38.57 37.26 2003 11.59 39.52 37.13 2004 11.33 40.92 35.73 2005 9.90 32.69 148.00 2006 11.10 34.68 30.37 2007 10.44 31.31 27.22 4 Chandigarh 1999 12.76 20.60 19.43
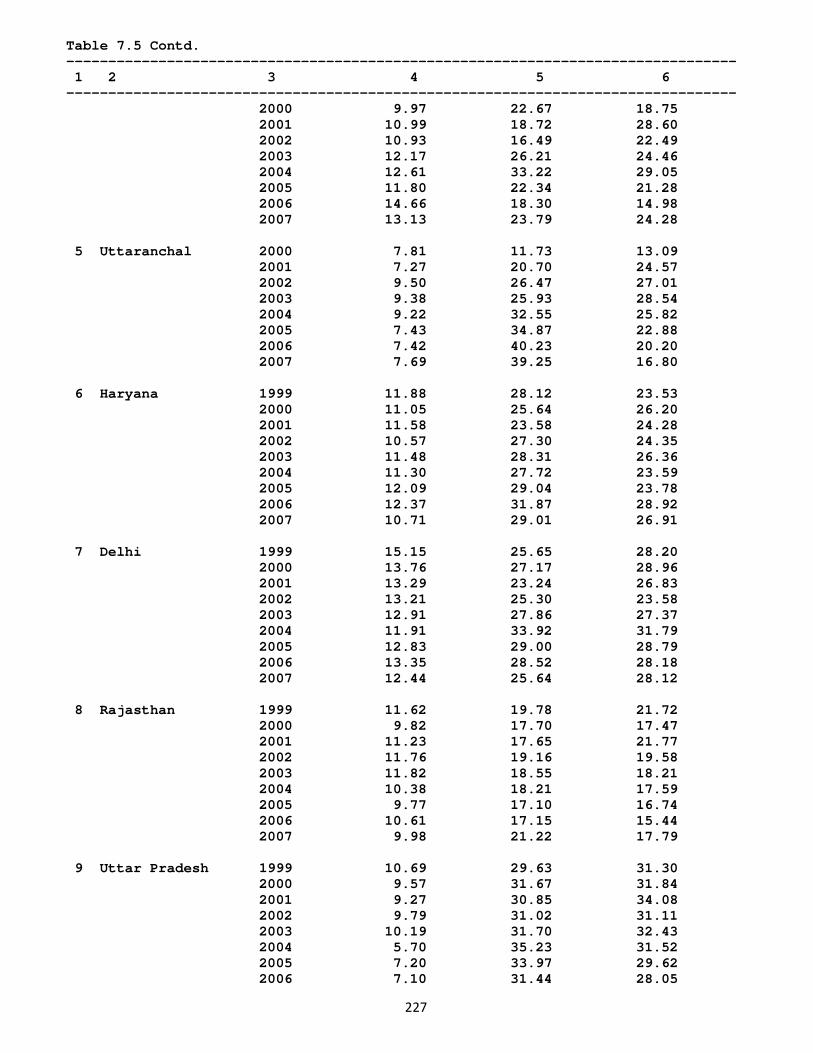
227
Table 7.5 Contd. -------------------------------------------------------------------------------- 1 2 3 4 5 6 -------------------------------------------------------------------------------- 2000 9.97 22.67 18.75 2001 10.99 18.72 28.60 2002 10.93 16.49 22.49 2003 12.17 26.21 24.46 2004 12.61 33.22 29.05 2005 11.80 22.34 21.28 2006 14.66 18.30 14.98 2007 13.13 23.79 24.28 5 Uttaranchal 2000 7.81 11.73 13.09 2001 7.27 20.70 24.57 2002 9.50 26.47 27.01 2003 9.38 25.93 28.54 2004 9.22 32.55 25.82 2005 7.43 34.87 22.88 2006 7.42 40.23 20.20 2007 7.69 39.25 16.80 6 Haryana 1999 11.88 28.12 23.53 2000 11.05 25.64 26.20 2001 11.58 23.58 24.28 2002 10.57 27.30 24.35 2003 11.48 28.31 26.36 2004 11.30 27.72 23.59 2005 12.09 29.04 23.78 2006 12.37 31.87 28.92 2007 10.71 29.01 26.91 7 Delhi 1999 15.15 25.65 28.20 2000 13.76 27.17 28.96 2001 13.29 23.24 26.83 2002 13.21 25.30 23.58 2003 12.91 27.86 27.37 2004 11.91 33.92 31.79 2005 12.83 29.00 28.79 2006 13.35 28.52 28.18 2007 12.44 25.64 28.12 8 Rajasthan 1999 11.62 19.78 21.72 2000 9.82 17.70 17.47 2001 11.23 17.65 21.77 2002 11.76 19.16 19.58 2003 11.82 18.55 18.21 2004 10.38 18.21 17.59 2005 9.77 17.10 16.74 2006 10.61 17.15 15.44 2007 9.98 21.22 17.79 9 Uttar Pradesh 1999 10.69 29.63 31.30 2000 9.57 31.67 31.84 2001 9.27 30.85 34.08 2002 9.79 31.02 31.11 2003 10.19 31.70 32.43 2004 5.70 35.23 31.52 2005 7.20 33.97 29.62 2006 7.10 31.44 28.05
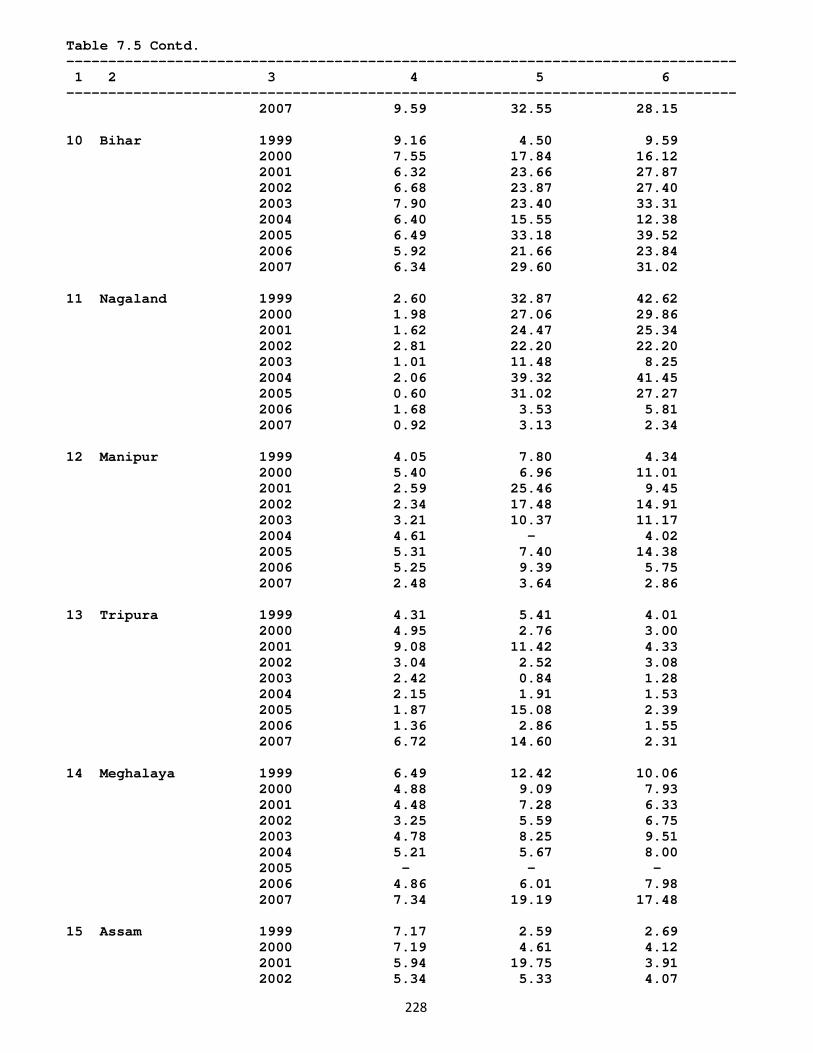
228
Table 7.5 Contd. -------------------------------------------------------------------------------- 1 2 3 4 5 6 -------------------------------------------------------------------------------- 2007 9.59 32.55 28.15 10 Bihar 1999 9.16 4.50 9.59 2000 7.55 17.84 16.12 2001 6.32 23.66 27.87 2002 6.68 23.87 27.40 2003 7.90 23.40 33.31 2004 6.40 15.55 12.38 2005 6.49 33.18 39.52 2006 5.92 21.66 23.84 2007 6.34 29.60 31.02 11 Nagaland 1999 2.60 32.87 42.62 2000 1.98 27.06 29.86 2001 1.62 24.47 25.34 2002 2.81 22.20 22.20 2003 1.01 11.48 8.25 2004 2.06 39.32 41.45 2005 0.60 31.02 27.27 2006 1.68 3.53 5.81 2007 0.92 3.13 2.34 12 Manipur 1999 4.05 7.80 4.34 2000 5.40 6.96 11.01 2001 2.59 25.46 9.45 2002 2.34 17.48 14.91 2003 3.21 10.37 11.17 2004 4.61 - 4.02 2005 5.31 7.40 14.38 2006 5.25 9.39 5.75 2007 2.48 3.64 2.86 13 Tripura 1999 4.31 5.41 4.01 2000 4.95 2.76 3.00 2001 9.08 11.42 4.33 2002 3.04 2.52 3.08 2003 2.42 0.84 1.28 2004 2.15 1.91 1.53 2005 1.87 15.08 2.39 2006 1.36 2.86 1.55 2007 6.72 14.60 2.31 14 Meghalaya 1999 6.49 12.42 10.06 2000 4.88 9.09 7.93 2001 4.48 7.28 6.33 2002 3.25 5.59 6.75 2003 4.78 8.25 9.51 2004 5.21 5.67 8.00 2005 - - - 2006 4.86 6.01 7.98 2007 7.34 19.19 17.48 15 Assam 1999 7.17 2.59 2.69 2000 7.19 4.61 4.12 2001 5.94 19.75 3.91 2002 5.34 5.33 4.07
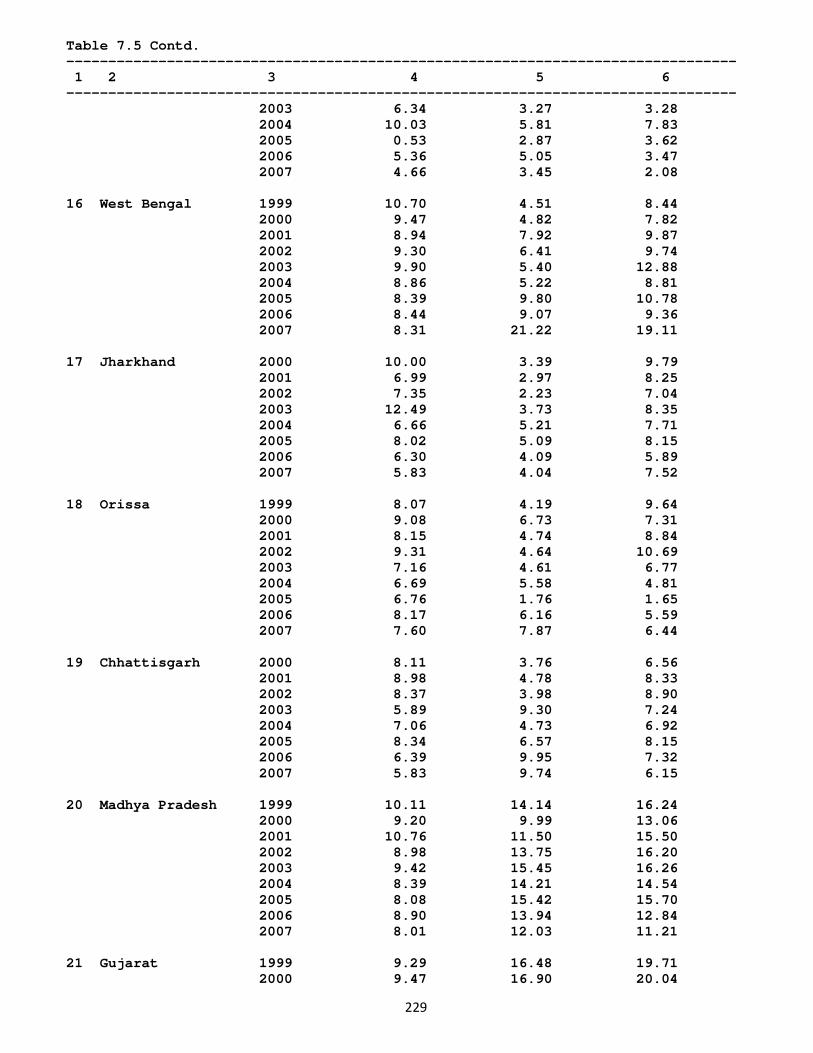
229
Table 7.5 Contd. -------------------------------------------------------------------------------- 1 2 3 4 5 6 -------------------------------------------------------------------------------- 2003 6.34 3.27 3.28 2004 10.03 5.81 7.83 2005 0.53 2.87 3.62 2006 5.36 5.05 3.47 2007 4.66 3.45 2.08 16 West Bengal 1999 10.70 4.51 8.44 2000 9.47 4.82 7.82 2001 8.94 7.92 9.87 2002 9.30 6.41 9.74 2003 9.90 5.40 12.88 2004 8.86 5.22 8.81 2005 8.39 9.80 10.78 2006 8.44 9.07 9.36 2007 8.31 21.22 19.11 17 Jharkhand 2000 10.00 3.39 9.79 2001 6.99 2.97 8.25 2002 7.35 2.23 7.04 2003 12.49 3.73 8.35 2004 6.66 5.21 7.71 2005 8.02 5.09 8.15 2006 6.30 4.09 5.89 2007 5.83 4.04 7.52 18 Orissa 1999 8.07 4.19 9.64 2000 9.08 6.73 7.31 2001 8.15 4.74 8.84 2002 9.31 4.64 10.69 2003 7.16 4.61 6.77 2004 6.69 5.58 4.81 2005 6.76 1.76 1.65 2006 8.17 6.16 5.59 2007 7.60 7.87 6.44 19 Chhattisgarh 2000 8.11 3.76 6.56 2001 8.98 4.78 8.33 2002 8.37 3.98 8.90 2003 5.89 9.30 7.24 2004 7.06 4.73 6.92 2005 8.34 6.57 8.15 2006 6.39 9.95 7.32 2007 5.83 9.74 6.15 20 Madhya Pradesh 1999 10.11 14.14 16.24 2000 9.20 9.99 13.06 2001 10.76 11.50 15.50 2002 8.98 13.75 16.20 2003 9.42 15.45 16.26 2004 8.39 14.21 14.54 2005 8.08 15.42 15.70 2006 8.90 13.94 12.84 2007 8.01 12.03 11.21 21 Gujarat 1999 9.29 16.48 19.71 2000 9.47 16.90 20.04
230
Table 7.5 Contd. -------------------------------------------------------------------------------- 1 2 3 4 5 6 -------------------------------------------------------------------------------- 2001 9.36 14.72 17.45 2002 9.10 14.27 15.25 2003 9.45 17.38 17.50 2004 8.95 18.08 16.69 2005 8.19 20.28 17.30 2006 8.45 19.64 14.84 2007 5.92 19.02 15.34 22 Daman & Diu 1999 7.95 16.88 9.01 2000 8.53 19.91 10.75 2001 7.21 15.57 14.30 2002 6.55 10.78 8.30 2003 8.10 12.90 9.22 2004 7.54 10.69 7.76 2005 8.90 15.82 12.62 2006 8.26 16.17 9.90 2007 7.59 14.13 15.44 23 D & Nagar Haveli 1999 5.12 20.56 15.86 2000 5.45 12.33 9.86 2001 5.42 9.48 5.87 2002 9.30 11.32 11.46 2003 8.31 16.17 10.96 2004 9.59 20.18 18.77 2005 7.24 14.18 9.38 2006 8.52 10.18 8.70 2007 8.07 14.64 11.34 24 Maharashtra 1999 13.21 17.05 19.44 2000 13.69 16.49 20.10 2001 12.63 14.43 19.04 2002 12.56 15.16 17.84 2003 12.90 15.96 20.50 2004 12.28 20.06 19.58 2005 12.08 21.61 18.71 2006 9.87 23.20 20.59 2007 11.81 23.86 23.28 25 Andhra Pradesh 1999 7.37 7.62 8.86 2000 7.08 8.59 8.42 2001 6.96 10.27 11.64 2002 7.39 10.40 11.45 2003 7.25 10.09 10.57 2004 7.49 9.05 8.37 2005 7.65 10.30 9.09 2006 6.95 13.26 9.97 2007 6.71 12.41 9.13 26 Karnataka 1999 9.40 18.24 18.20 2000 9.32 19.44 17.87 2001 6.55 18.87 18.39 2002 9.47 18.32 17.59 2003 8.93 22.95 21.37 2004 8.47 26.87 21.10 2005 6.89 24.55 20.11 2006 8.06 26.49 20.06
231
Table 7.5 Contd. -------------------------------------------------------------------------------- 1 2 3 4 5 6 -------------------------------------------------------------------------------- 2007 6.66 22.96 19.76 27 Goa 1999 13.47 24.50 19.35 2000 12.93 25.99 24.90 2001 12.41 26.69 20.11 2002 11.73 21.19 16.88 2003 12.81 22.28 19.74 2004 13.02 20.85 15.55 2005 13.04 21.88 21.14 2006 12.16 30.66 23.49 2007 11.71 26.60 25.00 28 Lakshadweep 2007 1.05 29.20 16.80 29 Kerala 1999 11.27 6.16 5.54 2000 11.85 6.05 5.54 2001 11.46 6.44 7.32 2002 11.54 4.37 5.62 2003 12.47 5.46 7.47 2004 11.84 6.63 7.07 2005 11.43 6.24 7.44 2006 4.37 13.05 10.19 2007 11.30 11.71 9.00 30 Tamil Nadu 1999 8.09 14.62 14.45 2000 8.01 14.34 14.51 2001 7.66 12.33 13.57 2002 7.10 11.35 12.10 2003 7.40 13.16 13.37 2004 6.87 14.13 12.38 2005 6.83 13.86 11.44 2006 6.10 15.91 11.42 2007 6.88 17.82 14.53 31 Pondicherry 1999 8.08 10.13 12.08 2000 7.89 14.10 13.31 2001 7.87 12.40 13.33 2002 6.82 9.96 10.20 2003 7.14 8.53 7.56 2004 7.41 11.59 10.47 2005 6.71 10.47 7.96 2006 7.41 9.63 9.96 2007 7.23 9.00 6.95 32 A & N Islands 1999 15.47 4.56 11.89 2000 9.54 8.52 37.81 2001 16.91 13.14 36.92 2002 9.68 16.56 17.83 2003 10.33 13.58 21.60 2004 16.36 38.93 46.56 2005 20.87 18.86 12.57 2006 10.64 15.68 7.03 2007 15.37 56.63 17.67
232
Table 7.5 Concld. -------------------------------------------------------------------------------- 1 2 3 4 5 6 -------------------------------------------------------------------------------- All India 1999 10.32 16.38 17.74 2000 10.08 15.97 17.16 2001 9.44 15.26 17.43 2002 9.61 15.44 16.57 2003 10.01 16.79 18.11 2004 8.96 18.45 16.94 2005 8.10 18.25 22.37 2006 7.99 20.14 16.61 2007 8.34 20.94 18.11 Public Sector 1999 11.20 5.06 10.94 2000 10.38 5.31 9.21 2001 10.12 7.86 13.36 2002 10.80 6.74 14.89 2003 10.51 6.76 15.15 2004 8.59 8.90 13.47 2005 8.91 7.96 13.83 2006 3.46 9.47 12.68 2007 7.80 8.85 11.48 Joint Sector 1999 11.30 13.67 15.87 2000 11.13 15.64 18.89 2001 10.52 15.54 20.23 2002 9.34 18.08 22.04 2003 10.90 15.31 23.00 2004 9.18 14.41 17.62 2005 6.74 9.31 9.07 2006 6.46 18.74 17.92 2007 8.34 18.22 15.22 Private Sector 1999 10.15 17.94 18.70 2000 9.98 17.20 17.96 2001 9.30 16.05 17.69 2002 9.52 16.03 16.37 2003 9.92 17.65 18.06 2004 8.97 19.30 17.13 2005 8.14 19.59 23.98 2006 8.54 20.68 16.76 2007 8.36 21.43 18.42 --------------------------------------------------------------------------------
233
Table 7.6 Trend in Number of Reporting Factories in Industries (3-digit of NIC-2004) and
States -------------------------------------------------------------------------------- Sl. NIC Code/ Number Percentage of Percentage of Factories No. State/Year of Factories Paying or Incurring Reporting Employing Expenses on Factories ----------------- ---------------------------- Contract Child Bonus PF and Welfare Workers Workers Others Funds -------------------------------------------------------------------------------- 1 2 3 4 5 6 7 8 -------------------------------------------------------------------------------- A. Industries 1 014 1999-00 3205 32.64 - 53.70 50.11 44.84 2000-01 3243 31.21 - 50.05 50.85 46.32 2001-02 3050 30.95 - 41.67 50.52 42.85 2002-03 2840 32.96 - 40.25 54.01 35.81 2003-04 2701 35.43 - 41.43 52.98 40.06 2004-05 2992 29.08 - 35.63 46.72 35.19 2005-06 2869 37.12 - 36.08 54.34 34.02 2006-07 3018 37.21 - 38.90 57.16 38.83 2007-08 2986 43.03 - 33.15 59.58 35.63 2 141 2006-07 2 - - - - 50.00 2007-08 5 40.00 - 40.00 20.00 80.00 3 142 1999-00 86 41.86 - 69.77 56.98 70.93 2000-01 64 20.31 - 64.06 25.00 76.56 2001-02 88 37.50 - 87.50 63.64 87.50 2002-03 70 37.14 - 67.14 68.57 84.29 2003-04 116 56.90 - 55.17 61.21 70.69 2004-05 150 50.00 - 61.33 62.67 90.67 2005-06 179 47.49 - 57.54 59.78 84.92 2006-07 155 52.90 - 49.03 84.52 94.19 2007-08 186 72.58 - 60.22 44.62 60.75 4 151 1999-00 3591 21.50 - 57.67 57.23 56.00 2000-01 3587 25.51 - 53.25 55.45 52.63 2001-02 3413 22.68 - 51.54 52.21 49.25 2002-03 3218 26.72 - 49.32 58.30 53.36 2003-04 3228 29.46 - 54.93 58.46 52.35 2004-05 3483 29.54 - 52.83 56.73 52.80 2005-06 3549 30.32 - 50.83 57.79 53.28 2006-07 3459 33.16 - 53.17 57.27 55.71 2007-08 3663 34.92 - 53.81 58.72 55.26 5 152 1999-00 777 26.51 - 72.59 78.89 77.22 2000-01 718 32.73 - 73.68 84.68 82.31 2001-02 835 30.42 - 64.79 79.52 85.51 2002-03 761 30.49 - 70.30 86.60 83.44 2003-04 905 30.50 - 67.29 74.92 80.55 2004-05 927 29.23 - 67.21 73.03 80.91 2005-06 1048 33.87 - 66.60 77.39 83.49 2006-07 1015 30.94 - 69.95 78.62 79.80 2007-08 1092 38.00 - 67.03 77.20 81.23 6 153 1999-00 11896 35.04 0.09 53.80 43.32 41.01
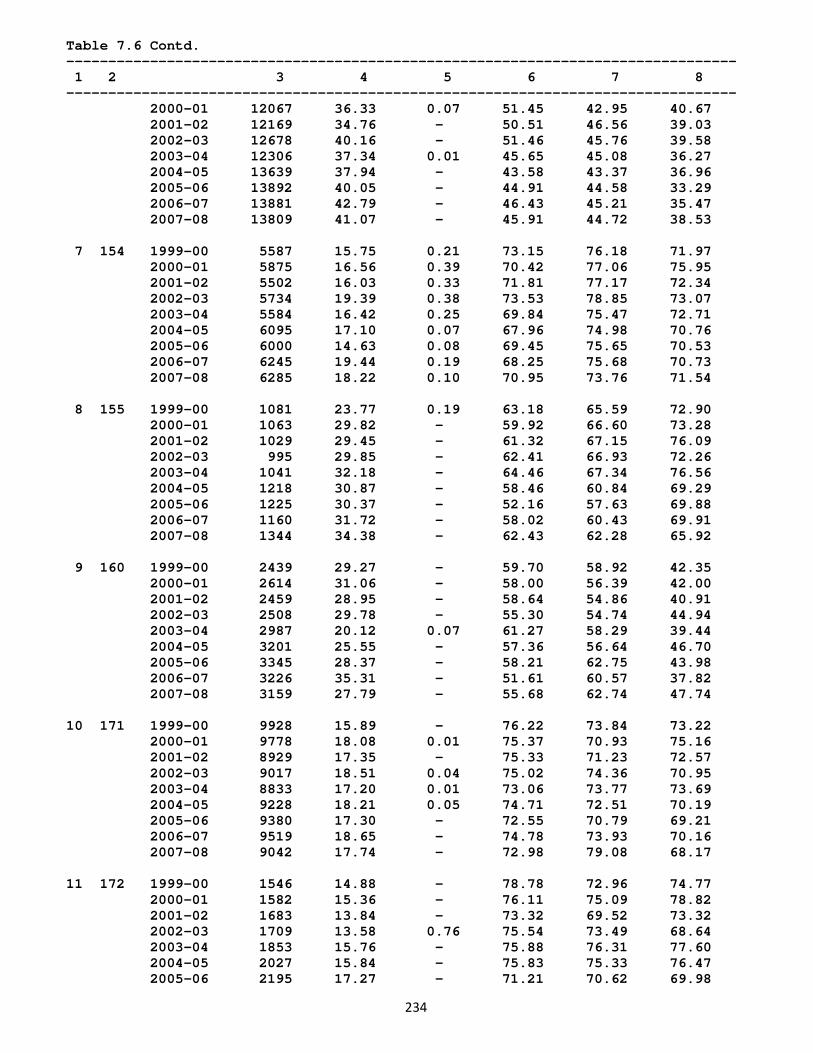
234
Table 7.6 Contd. -------------------------------------------------------------------------------- 1 2 3 4 5 6 7 8 -------------------------------------------------------------------------------- 2000-01 12067 36.33 0.07 51.45 42.95 40.67 2001-02 12169 34.76 - 50.51 46.56 39.03 2002-03 12678 40.16 - 51.46 45.76 39.58 2003-04 12306 37.34 0.01 45.65 45.08 36.27 2004-05 13639 37.94 - 43.58 43.37 36.96 2005-06 13892 40.05 - 44.91 44.58 33.29 2006-07 13881 42.79 - 46.43 45.21 35.47 2007-08 13809 41.07 - 45.91 44.72 38.53 7 154 1999-00 5587 15.75 0.21 73.15 76.18 71.97 2000-01 5875 16.56 0.39 70.42 77.06 75.95 2001-02 5502 16.03 0.33 71.81 77.17 72.34 2002-03 5734 19.39 0.38 73.53 78.85 73.07 2003-04 5584 16.42 0.25 69.84 75.47 72.71 2004-05 6095 17.10 0.07 67.96 74.98 70.76 2005-06 6000 14.63 0.08 69.45 75.65 70.53 2006-07 6245 19.44 0.19 68.25 75.68 70.73 2007-08 6285 18.22 0.10 70.95 73.76 71.54 8 155 1999-00 1081 23.77 0.19 63.18 65.59 72.90 2000-01 1063 29.82 - 59.92 66.60 73.28 2001-02 1029 29.45 - 61.32 67.15 76.09 2002-03 995 29.85 - 62.41 66.93 72.26 2003-04 1041 32.18 - 64.46 67.34 76.56 2004-05 1218 30.87 - 58.46 60.84 69.29 2005-06 1225 30.37 - 52.16 57.63 69.88 2006-07 1160 31.72 - 58.02 60.43 69.91 2007-08 1344 34.38 - 62.43 62.28 65.92 9 160 1999-00 2439 29.27 - 59.70 58.92 42.35 2000-01 2614 31.06 - 58.00 56.39 42.00 2001-02 2459 28.95 - 58.64 54.86 40.91 2002-03 2508 29.78 - 55.30 54.74 44.94 2003-04 2987 20.12 0.07 61.27 58.29 39.44 2004-05 3201 25.55 - 57.36 56.64 46.70 2005-06 3345 28.37 - 58.21 62.75 43.98 2006-07 3226 35.31 - 51.61 60.57 37.82 2007-08 3159 27.79 - 55.68 62.74 47.74 10 171 1999-00 9928 15.89 - 76.22 73.84 73.22 2000-01 9778 18.08 0.01 75.37 70.93 75.16 2001-02 8929 17.35 - 75.33 71.23 72.57 2002-03 9017 18.51 0.04 75.02 74.36 70.95 2003-04 8833 17.20 0.01 73.06 73.77 73.69 2004-05 9228 18.21 0.05 74.71 72.51 70.19 2005-06 9380 17.30 - 72.55 70.79 69.21 2006-07 9519 18.65 - 74.78 73.93 70.16 2007-08 9042 17.74 - 72.98 79.08 68.17 11 172 1999-00 1546 14.88 - 78.78 72.96 74.77 2000-01 1582 15.36 - 76.11 75.09 78.82 2001-02 1683 13.84 - 73.32 69.52 73.32 2002-03 1709 13.58 0.76 75.54 73.49 68.64 2003-04 1853 15.76 - 75.88 76.31 77.60 2004-05 2027 15.84 - 75.83 75.33 76.47 2005-06 2195 17.27 - 71.21 70.62 69.98
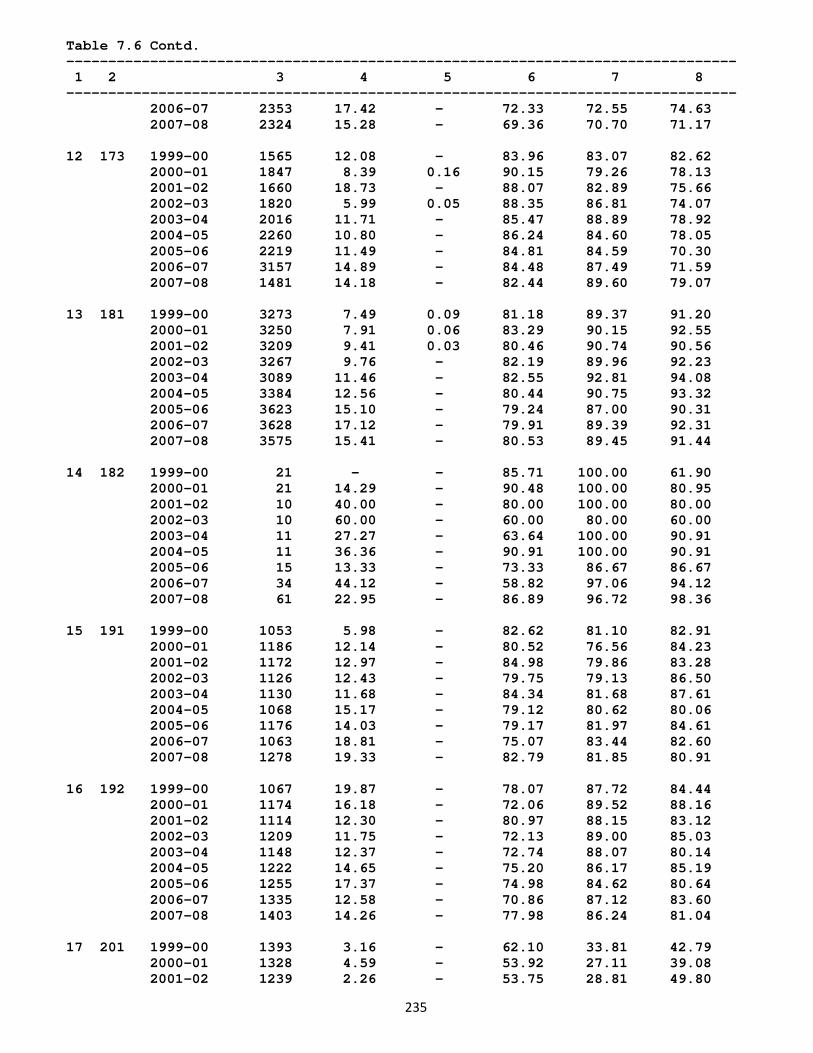
235
Table 7.6 Contd. -------------------------------------------------------------------------------- 1 2 3 4 5 6 7 8 -------------------------------------------------------------------------------- 2006-07 2353 17.42 - 72.33 72.55 74.63 2007-08 2324 15.28 - 69.36 70.70 71.17 12 173 1999-00 1565 12.08 - 83.96 83.07 82.62 2000-01 1847 8.39 0.16 90.15 79.26 78.13 2001-02 1660 18.73 - 88.07 82.89 75.66 2002-03 1820 5.99 0.05 88.35 86.81 74.07 2003-04 2016 11.71 - 85.47 88.89 78.92 2004-05 2260 10.80 - 86.24 84.60 78.05 2005-06 2219 11.49 - 84.81 84.59 70.30 2006-07 3157 14.89 - 84.48 87.49 71.59 2007-08 1481 14.18 - 82.44 89.60 79.07 13 181 1999-00 3273 7.49 0.09 81.18 89.37 91.20 2000-01 3250 7.91 0.06 83.29 90.15 92.55 2001-02 3209 9.41 0.03 80.46 90.74 90.56 2002-03 3267 9.76 - 82.19 89.96 92.23 2003-04 3089 11.46 - 82.55 92.81 94.08 2004-05 3384 12.56 - 80.44 90.75 93.32 2005-06 3623 15.10 - 79.24 87.00 90.31 2006-07 3628 17.12 - 79.91 89.39 92.31 2007-08 3575 15.41 - 80.53 89.45 91.44 14 182 1999-00 21 - - 85.71 100.00 61.90 2000-01 21 14.29 - 90.48 100.00 80.95 2001-02 10 40.00 - 80.00 100.00 80.00 2002-03 10 60.00 - 60.00 80.00 60.00 2003-04 11 27.27 - 63.64 100.00 90.91 2004-05 11 36.36 - 90.91 100.00 90.91 2005-06 15 13.33 - 73.33 86.67 86.67 2006-07 34 44.12 - 58.82 97.06 94.12 2007-08 61 22.95 - 86.89 96.72 98.36 15 191 1999-00 1053 5.98 - 82.62 81.10 82.91 2000-01 1186 12.14 - 80.52 76.56 84.23 2001-02 1172 12.97 - 84.98 79.86 83.28 2002-03 1126 12.43 - 79.75 79.13 86.50 2003-04 1130 11.68 - 84.34 81.68 87.61 2004-05 1068 15.17 - 79.12 80.62 80.06 2005-06 1176 14.03 - 79.17 81.97 84.61 2006-07 1063 18.81 - 75.07 83.44 82.60 2007-08 1278 19.33 - 82.79 81.85 80.91 16 192 1999-00 1067 19.87 - 78.07 87.72 84.44 2000-01 1174 16.18 - 72.06 89.52 88.16 2001-02 1114 12.30 - 80.97 88.15 83.12 2002-03 1209 11.75 - 72.13 89.00 85.03 2003-04 1148 12.37 - 72.74 88.07 80.14 2004-05 1222 14.65 - 75.20 86.17 85.19 2005-06 1255 17.37 - 74.98 84.62 80.64 2006-07 1335 12.58 - 70.86 87.12 83.60 2007-08 1403 14.26 - 77.98 86.24 81.04 17 201 1999-00 1393 3.16 - 62.10 33.81 42.79 2000-01 1328 4.59 - 53.92 27.11 39.08 2001-02 1239 2.26 - 53.75 28.81 49.80
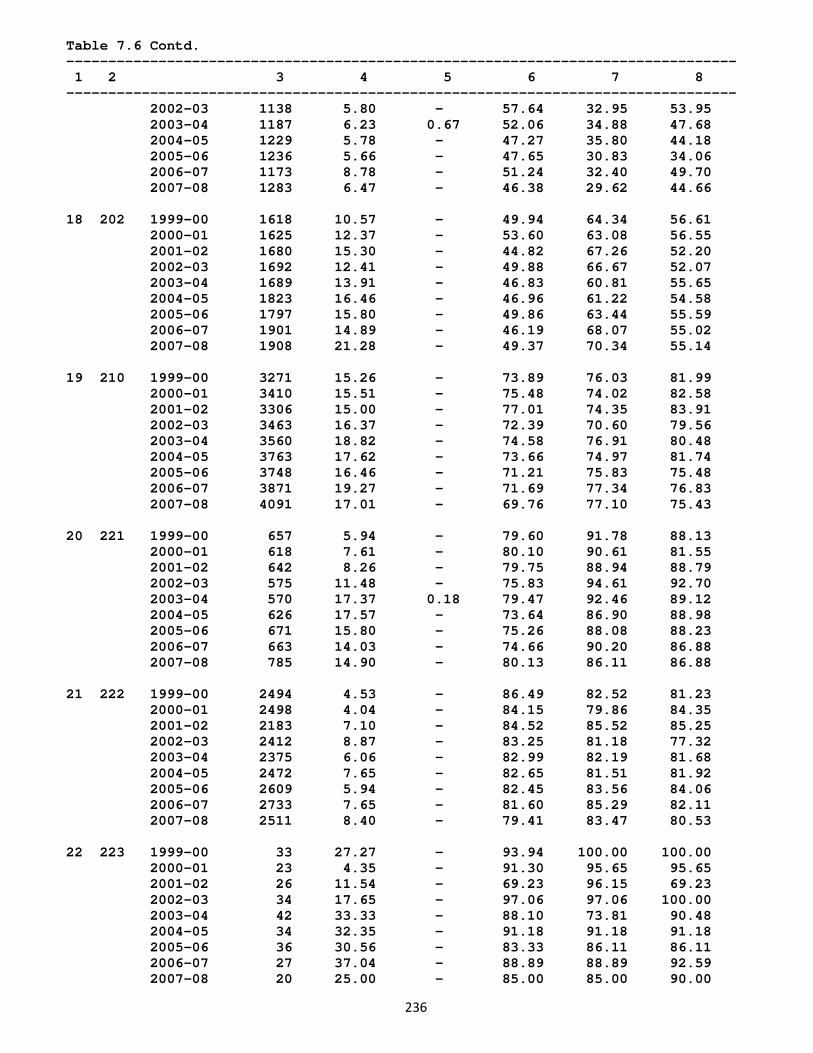
236
Table 7.6 Contd. -------------------------------------------------------------------------------- 1 2 3 4 5 6 7 8 -------------------------------------------------------------------------------- 2002-03 1138 5.80 - 57.64 32.95 53.95 2003-04 1187 6.23 0.67 52.06 34.88 47.68 2004-05 1229 5.78 - 47.27 35.80 44.18 2005-06 1236 5.66 - 47.65 30.83 34.06 2006-07 1173 8.78 - 51.24 32.40 49.70 2007-08 1283 6.47 - 46.38 29.62 44.66 18 202 1999-00 1618 10.57 - 49.94 64.34 56.61 2000-01 1625 12.37 - 53.60 63.08 56.55 2001-02 1680 15.30 - 44.82 67.26 52.20 2002-03 1692 12.41 - 49.88 66.67 52.07 2003-04 1689 13.91 - 46.83 60.81 55.65 2004-05 1823 16.46 - 46.96 61.22 54.58 2005-06 1797 15.80 - 49.86 63.44 55.59 2006-07 1901 14.89 - 46.19 68.07 55.02 2007-08 1908 21.28 - 49.37 70.34 55.14 19 210 1999-00 3271 15.26 - 73.89 76.03 81.99 2000-01 3410 15.51 - 75.48 74.02 82.58 2001-02 3306 15.00 - 77.01 74.35 83.91 2002-03 3463 16.37 - 72.39 70.60 79.56 2003-04 3560 18.82 - 74.58 76.91 80.48 2004-05 3763 17.62 - 73.66 74.97 81.74 2005-06 3748 16.46 - 71.21 75.83 75.48 2006-07 3871 19.27 - 71.69 77.34 76.83 2007-08 4091 17.01 - 69.76 77.10 75.43 20 221 1999-00 657 5.94 - 79.60 91.78 88.13 2000-01 618 7.61 - 80.10 90.61 81.55 2001-02 642 8.26 - 79.75 88.94 88.79 2002-03 575 11.48 - 75.83 94.61 92.70 2003-04 570 17.37 0.18 79.47 92.46 89.12 2004-05 626 17.57 - 73.64 86.90 88.98 2005-06 671 15.80 - 75.26 88.08 88.23 2006-07 663 14.03 - 74.66 90.20 86.88 2007-08 785 14.90 - 80.13 86.11 86.88 21 222 1999-00 2494 4.53 - 86.49 82.52 81.23 2000-01 2498 4.04 - 84.15 79.86 84.35 2001-02 2183 7.10 - 84.52 85.52 85.25 2002-03 2412 8.87 - 83.25 81.18 77.32 2003-04 2375 6.06 - 82.99 82.19 81.68 2004-05 2472 7.65 - 82.65 81.51 81.92 2005-06 2609 5.94 - 82.45 83.56 84.06 2006-07 2733 7.65 - 81.60 85.29 82.11 2007-08 2511 8.40 - 79.41 83.47 80.53 22 223 1999-00 33 27.27 - 93.94 100.00 100.00 2000-01 23 4.35 - 91.30 95.65 95.65 2001-02 26 11.54 - 69.23 96.15 69.23 2002-03 34 17.65 - 97.06 97.06 100.00 2003-04 42 33.33 - 88.10 73.81 90.48 2004-05 34 32.35 - 91.18 91.18 91.18 2005-06 36 30.56 - 83.33 86.11 86.11 2006-07 27 37.04 - 88.89 88.89 92.59 2007-08 20 25.00 - 85.00 85.00 90.00
237
Table 7.6 Contd. -------------------------------------------------------------------------------- 1 2 3 4 5 6 7 8 -------------------------------------------------------------------------------- 23 231 1999-00 421 13.06 - 64.61 50.83 66.03 2000-01 421 15.44 - 57.01 55.58 63.66 2001-02 375 12.53 - 58.67 52.00 58.67 2002-03 391 14.83 - 62.66 54.22 67.01 2003-04 402 19.90 - 71.64 61.69 69.65 2004-05 478 19.04 - 60.67 55.86 62.34 2005-06 512 19.53 - 57.42 58.01 64.65 2006-07 493 22.52 - 61.87 56.59 63.08 2007-08 524 21.76 - 62.79 65.46 63.36 24 232 1999-00 402 21.64 - 73.38 70.40 78.36 2000-01 433 25.40 - 69.98 72.98 80.37 2001-02 467 29.34 - 73.02 76.66 79.87 2002-03 501 38.72 - 70.46 70.66 70.86 2003-04 462 30.52 - 71.86 74.89 80.95 2004-05 512 33.59 - 70.31 71.48 82.03 2005-06 528 39.02 - 76.70 74.24 84.09 2006-07 473 42.49 - 75.90 81.18 87.74 2007-08 523 40.15 - 75.72 77.06 78.59 25 241 1999-00 2935 20.37 - 76.29 70.26 88.07 2000-01 3126 23.13 - 72.36 72.26 86.34 2001-02 3027 29.24 - 74.17 72.05 86.32 2002-03 2718 24.32 - 75.75 75.72 84.77 2003-04 2548 24.88 - 72.57 72.88 84.97 2004-05 2808 23.93 - 74.54 71.08 82.16 2005-06 2886 25.09 - 72.49 69.61 83.96 2006-07 3033 25.22 - 73.19 70.66 82.29 2007-08 2912 28.09 - 70.91 70.05 81.22 26 242 1999-00 7125 17.45 0.18 83.96 79.83 84.52 2000-01 7308 17.79 - 81.53 78.76 85.55 2001-02 7296 21.07 - 78.67 79.03 85.20 2002-03 7452 21.89 0.03 80.39 79.52 86.07 2003-04 7425 23.46 0.01 81.78 79.52 86.36 2004-05 7855 23.48 - 78.85 78.74 84.46 2005-06 8025 24.97 - 79.81 77.53 83.93 2006-07 7970 24.34 - 77.68 77.53 82.74 2007-08 8193 27.19 - 78.01 80.34 84.45 27 243 1999-00 32 40.63 - 62.50 87.50 100.00 2000-01 51 25.49 - 78.43 90.20 76.47 2001-02 76 23.68 - 88.16 90.79 98.68 2002-03 51 37.25 - 78.43 96.08 96.08 2003-04 58 31.03 - 70.69 91.38 96.55 2004-05 82 23.17 - 76.83 73.17 96.34 2005-06 72 30.56 - 77.78 87.50 95.83 2006-07 65 30.77 - 84.62 90.77 93.85 2007-08 45 28.89 - 86.67 93.33 93.33 28 251 1999-00 2029 8.13 - 78.91 81.62 84.03 2000-01 1986 11.93 - 77.54 80.41 82.43 2001-02 1915 9.30 - 76.03 81.46 82.87 2002-03 1954 8.80 - 78.20 82.14 85.93 2003-04 1949 13.65 - 73.47 81.22 77.94
238
Table 7.6 Contd. -------------------------------------------------------------------------------- 1 2 3 4 5 6 7 8 -------------------------------------------------------------------------------- 2004-05 1973 12.52 - 72.68 76.08 77.50 2005-06 1918 15.48 - 73.93 80.08 78.73 2006-07 2051 15.26 - 74.94 82.25 81.81 2007-08 2062 15.62 - 71.10 80.89 76.58 29 252 1999-00 4383 9.72 - 73.88 75.13 81.88 2000-01 4705 10.69 0.17 75.49 73.01 83.80 2001-02 5063 12.82 - 73.06 69.76 81.45 2002-03 4793 12.46 - 70.48 70.77 83.23 2003-04 4931 14.46 - 73.53 71.67 82.21 2004-05 5251 14.34 - 71.05 69.74 80.06 2005-06 5430 15.58 - 69.41 69.13 79.30 2006-07 5755 16.58 - 69.28 70.67 78.37 2007-08 6115 15.63 - 67.77 68.85 77.37 30 261 1999-00 647 20.25 - 64.45 67.85 67.54 2000-01 577 26.69 - 65.34 77.30 67.76 2001-02 542 17.90 - 65.87 76.38 68.08 2002-03 552 14.49 - 75.36 78.08 69.02 2003-04 541 17.93 - 66.73 76.16 70.79 2004-05 567 17.99 - 67.55 83.95 70.37 2005-06 601 17.30 - 69.88 79.87 71.21 2006-07 600 22.83 - 76.50 82.33 74.50 2007-08 614 17.75 - 71.66 83.88 80.62 31 269 1999-00 10488 24.40 - 53.27 50.50 55.61 2000-01 10732 24.08 0.01 50.04 47.27 55.02 2001-02 10829 25.93 - 48.61 47.72 55.98 2002-03 10780 28.65 0.04 46.90 45.12 50.54 2003-04 10862 29.21 0.01 46.33 45.31 50.57 2004-05 12657 29.65 - 40.52 44.10 50.47 2005-06 13395 36.78 - 39.32 43.70 48.38 2006-07 14487 42.67 - 39.14 43.30 47.93 2007-08 15229 41.38 - 36.95 44.28 46.86 32 271 1999-00 3356 27.98 - 72.91 87.60 77.71 2000-01 3491 26.93 0.49 64.71 88.37 74.05 2001-02 3450 31.22 - 65.42 84.43 75.22 2002-03 3269 28.88 - 65.68 83.33 72.87 2003-04 3239 30.19 - 65.48 85.46 75.08 2004-05 3516 33.59 - 65.96 85.61 73.18 2005-06 3820 34.58 - 62.04 85.45 72.43 2006-07 4043 35.72 - 63.37 88.37 73.66 2007-08 4077 34.54 - 63.53 86.63 73.22 33 272 1999-00 1122 10.96 - 74.15 82.35 77.63 2000-01 1234 12.40 - 75.77 75.53 78.20 2001-02 1143 12.69 - 63.08 79.00 74.02 2002-03 1025 15.90 - 65.56 69.76 69.66 2003-04 1072 13.62 - 78.17 77.15 80.88 2004-05 1150 19.57 - 65.83 71.74 75.13 2005-06 1151 15.12 - 70.46 75.33 81.06 2006-07 1289 18.15 - 70.05 76.49 77.04 2007-08 1275 21.73 - 69.73 73.57 76.71 34 273 1999-00 2369 20.68 - 84.21 85.39 81.98
239
Table 7.6 Contd. -------------------------------------------------------------------------------- 1 2 3 4 5 6 7 8 -------------------------------------------------------------------------------- 2000-01 2225 28.40 - 79.64 81.93 79.15 2001-02 2044 24.76 - 80.23 82.09 75.64 2002-03 2210 21.72 - 74.66 82.13 75.20 2003-04 2069 24.46 - 80.14 87.14 82.89 2004-05 2070 24.15 - 78.16 84.01 78.79 2005-06 2255 27.49 - 74.94 83.02 79.25 2006-07 2465 31.89 - 78.42 87.87 82.31 2007-08 2401 23.07 - 77.26 84.84 78.38 35 281 1999-00 2311 27.87 0.43 83.12 82.22 85.63 2000-01 2409 30.76 0.37 75.88 80.24 88.46 2001-02 2192 30.70 - 74.64 80.70 86.59 2002-03 2165 25.82 - 75.29 78.52 86.97 2003-04 2219 32.99 - 74.13 74.67 82.69 2004-05 2325 34.06 - 73.94 78.58 82.62 2005-06 2331 32.26 - 71.60 77.48 80.39 2006-07 2568 37.31 - 75.39 78.70 84.15 2007-08 2897 38.97 - 70.83 77.98 78.70 36 289 1999-00 5561 11.24 0.18 79.66 81.48 79.12 2000-01 5738 13.35 0.14 74.90 81.46 78.48 2001-02 5672 13.24 - 75.04 85.16 79.27 2002-03 5662 13.33 - 74.83 80.47 77.96 2003-04 5689 16.14 - 76.18 80.19 80.03 2004-05 5813 16.45 - 75.80 81.46 81.46 2005-06 6199 18.41 - 76.19 79.11 77.59 2006-07 6458 19.96 - 76.77 83.28 78.86 2007-08 6961 17.64 - 75.82 80.26 81.45 37 291 1999-00 3988 11.99 - 91.12 90.07 91.17 2000-01 3982 13.66 - 85.46 85.84 87.80 2001-02 3701 16.40 - 86.00 87.92 88.03 2002-03 3774 17.30 - 85.98 89.59 88.39 2003-04 3749 18.11 - 84.66 86.61 89.22 2004-05 4049 20.30 - 86.02 85.97 90.39 2005-06 4074 18.83 - 82.57 85.08 88.41 2006-07 4052 23.05 - 86.60 88.52 87.02 2007-08 4139 23.53 - 82.19 88.74 87.82 38 292 1999-00 4565 9.68 - 89.68 89.29 89.07 2000-01 4546 11.99 - 82.34 84.73 86.69 2001-02 4412 14.19 - 85.24 84.00 85.56 2002-03 4279 11.68 - 80.74 86.02 87.29 2003-04 4365 13.56 0.02 83.85 86.71 86.25 2004-05 4629 16.46 - 83.78 85.94 87.34 2005-06 4762 17.39 - 81.39 84.36 86.01 2006-07 4886 15.74 - 83.40 85.71 86.51 2007-08 4936 19.17 - 80.75 84.64 84.89 39 293 1999-00 643 11.51 - 76.21 86.47 84.45 2000-01 757 8.06 - 76.22 86.00 91.28 2001-02 625 8.80 - 73.44 82.56 78.24 2002-03 742 17.39 - 69.41 83.29 81.13 2003-04 655 13.74 - 73.89 86.41 84.73 2004-05 706 14.31 - 72.95 83.85 80.17 2005-06 686 19.24 - 69.53 83.24 82.94
240
Table 7.6 Contd. -------------------------------------------------------------------------------- 1 2 3 4 5 6 7 8 -------------------------------------------------------------------------------- 2006-07 641 23.71 - 69.11 85.65 86.43 2007-08 683 20.06 - 63.25 78.92 78.18 40 300 1999-00 216 22.69 - 77.31 84.72 88.43 2000-01 222 22.97 - 79.73 95.95 93.69 2001-02 183 24.04 - 84.15 88.52 96.72 2002-03 161 19.25 - 85.71 89.44 97.52 2003-04 172 18.02 - 79.07 89.53 94.19 2004-05 200 21.50 - 78.00 90.00 91.50 2005-06 180 28.33 - 78.89 88.33 91.67 2006-07 193 34.72 - 83.42 93.78 94.82 2007-08 170 42.94 - 81.18 92.35 92.94 41 311 1999-00 1213 17.07 - 87.96 91.43 91.18 2000-01 1163 9.80 - 85.81 81.00 88.56 2001-02 1126 12.61 - 83.48 85.26 91.39 2002-03 1069 17.87 0.09 81.38 84.75 88.03 2003-04 1080 14.72 - 83.06 86.39 88.89 2004-05 1033 18.97 - 77.06 82.67 86.83 2005-06 1144 23.25 - 79.63 84.70 88.90 2006-07 1178 23.09 - 76.91 86.08 90.15 2007-08 1143 22.92 - 79.27 86.53 88.10 42 312 1999-00 978 12.37 - 86.20 93.87 90.18 2000-01 988 11.23 - 80.67 83.20 90.18 2001-02 960 16.35 - 85.94 94.69 95.94 2002-03 960 17.29 - 82.29 90.42 92.81 2003-04 895 15.20 - 86.03 89.16 90.28 2004-05 1062 13.37 - 83.33 88.98 91.71 2005-06 1083 20.13 - 81.53 89.29 89.38 2006-07 1032 20.54 - 81.69 86.53 88.76 2007-08 1206 22.55 - 79.35 87.98 87.15 43 313 1999-00 587 15.67 - 82.62 89.61 93.87 2000-01 627 19.46 - 79.43 82.78 87.56 2001-02 639 17.53 - 77.46 82.47 90.45 2002-03 605 21.65 - 75.70 84.63 89.59 2003-04 636 22.64 - 74.53 84.43 92.61 2004-05 627 23.44 - 73.05 83.89 87.72 2005-06 636 21.70 - 73.74 77.99 83.65 2006-07 607 24.55 - 77.10 81.88 92.26 2007-08 666 28.83 - 72.52 78.98 87.69 44 314 1999-00 251 13.15 - 70.12 67.73 82.47 2000-01 198 18.69 - 79.80 79.29 90.40 2001-02 221 15.38 - 80.09 85.97 80.54 2002-03 221 14.48 - 66.97 73.30 72.40 2003-04 236 16.95 - 63.56 71.19 81.78 2004-05 206 19.90 - 66.02 74.76 76.21 2005-06 204 24.02 - 62.75 71.08 77.45 2006-07 247 21.86 - 61.13 69.64 74.90 2007-08 249 18.88 - 57.03 77.51 72.69 45 315 1999-00 402 6.22 - 78.86 83.83 78.11 2000-01 330 12.12 0.91 78.18 86.97 83.03 2001-02 361 13.30 - 73.96 80.33 78.67
241
Table 7.6 Contd. -------------------------------------------------------------------------------- 1 2 3 4 5 6 7 8 -------------------------------------------------------------------------------- 2002-03 360 21.94 - 79.17 83.89 80.83 2003-04 392 14.80 - 83.16 87.50 92.35 2004-05 367 13.08 - 69.75 82.29 76.29 2005-06 397 12.85 - 77.33 86.90 81.61 2006-07 377 19.63 - 70.56 81.96 75.60 2007-08 382 25.65 - 73.82 86.13 77.23 46 319 1999-00 608 13.65 - 75.99 85.69 85.69 2000-01 557 11.49 - 85.46 84.56 88.51 2001-02 725 12.69 - 82.21 87.31 89.24 2002-03 614 13.36 - 84.53 88.27 85.67 2003-04 569 14.41 - 77.86 81.72 84.89 2004-05 627 16.43 - 79.59 83.73 87.56 2005-06 600 10.83 - 80.17 82.67 86.00 2006-07 603 18.08 - 78.77 81.59 86.07 2007-08 641 16.85 - 81.75 83.78 88.77 47 321 1999-00 547 11.52 1.28 85.56 96.16 93.97 2000-01 559 13.06 - 81.75 93.92 94.99 2001-02 547 11.70 - 79.34 93.97 93.05 2002-03 563 15.63 - 78.51 93.61 91.65 2003-04 514 16.54 - 86.19 94.75 94.75 2004-05 492 16.67 - 83.94 88.82 94.31 2005-06 563 19.36 - 88.63 91.30 96.09 2006-07 523 18.16 - 85.85 96.37 91.78 2007-08 621 23.03 - 78.90 89.53 90.82 48 322 1999-00 302 10.26 - 83.11 94.04 91.06 2000-01 262 6.11 - 84.73 91.22 94.66 2001-02 300 12.33 - 77.33 86.33 96.33 2002-03 250 15.20 - 79.60 98.00 96.40 2003-04 233 14.16 - 78.97 92.70 89.70 2004-05 239 21.76 - 76.57 92.05 89.96 2005-06 238 22.27 - 76.89 84.87 86.55 2006-07 231 23.38 - 75.32 93.51 91.34 2007-08 228 30.26 - 81.58 92.98 98.25 49 323 1999-00 403 7.94 - 88.59 90.32 93.05 2000-01 323 20.12 - 88.85 97.21 94.43 2001-02 256 13.67 - 84.38 92.58 94.92 2002-03 253 21.74 - 78.26 91.70 93.28 2003-04 221 19.46 - 83.71 90.95 92.76 2004-05 271 23.25 - 81.18 90.77 92.25 2005-06 235 31.91 - 80.43 86.81 89.36 2006-07 204 25.49 - 76.47 89.71 89.22 2007-08 203 27.59 - 75.37 82.76 86.70 50 331 1999-00 652 5.52 - 94.33 94.63 96.32 2000-01 662 9.97 - 88.37 88.82 93.96 2001-02 662 7.55 - 88.37 90.18 90.33 2002-03 691 11.00 - 89.73 90.59 94.21 2003-04 754 11.14 - 87.27 90.32 93.63 2004-05 694 12.82 - 85.59 88.90 93.23 2005-06 706 12.75 - 84.99 89.80 91.36 2006-07 799 12.89 - 85.73 87.48 88.99 2007-08 732 17.90 - 84.29 89.75 94.26
242
Table 7.6 Contd. -------------------------------------------------------------------------------- 1 2 3 4 5 6 7 8 -------------------------------------------------------------------------------- 51 332 1999-00 138 14.49 - 89.86 86.96 87.68 2000-01 140 3.57 - 83.57 87.14 92.14 2001-02 113 16.81 - 88.50 88.50 87.61 2002-03 124 13.71 - 91.13 91.94 88.71 2003-04 108 7.41 - 87.04 86.11 94.44 2004-05 128 11.72 - 82.81 85.94 85.16 2005-06 136 7.35 - 74.26 85.29 82.35 2006-07 102 22.55 - 94.12 85.29 75.49 2007-08 109 12.84 - 90.83 88.99 88.07 52 333 1999-00 197 8.63 - 87.82 73.60 88.83 2000-01 178 16.85 - 84.83 97.19 85.96 2001-02 129 10.85 - 75.19 86.82 91.47 2002-03 150 8.00 - 70.00 76.00 70.67 2003-04 129 8.53 - 71.32 79.84 92.25 2004-05 167 8.38 - 65.27 73.65 85.63 2005-06 143 9.79 - 83.22 89.51 88.11 2006-07 124 9.68 - 68.55 75.81 82.26 2007-08 125 18.40 - 77.60 88.00 83.20 53 341 1999-00 164 26.83 - 75.00 77.44 84.76 2000-01 175 13.71 - 81.71 83.43 80.57 2001-02 112 24.11 - 66.07 79.46 83.04 2002-03 91 17.58 - 69.23 97.80 97.80 2003-04 101 31.68 - 80.20 98.02 99.01 2004-05 122 43.44 - 69.67 89.34 91.80 2005-06 113 34.51 - 72.57 89.38 90.27 2006-07 135 42.96 - 85.93 94.81 98.52 2007-08 141 38.30 - 80.14 86.52 95.74 54 342 1999-00 432 24.77 - 79.86 72.69 83.56 2000-01 301 32.89 - 63.12 69.77 73.09 2001-02 357 36.13 - 58.26 65.27 79.55 2002-03 302 44.37 - 60.93 71.52 73.51 2003-04 305 40.98 - 68.85 70.49 79.67 2004-05 365 40.82 - 69.32 75.34 75.34 2005-06 321 35.20 - 65.42 77.57 77.88 2006-07 325 36.62 - 66.46 70.46 74.15 2007-08 330 37.88 - 64.24 73.33 71.82 55 343 1999-00 2175 16.64 - 88.14 92.37 89.61 2000-01 2185 15.84 - 81.24 89.38 91.90 2001-02 2239 19.16 - 82.89 90.71 94.69 2002-03 2443 22.84 - 86.49 96.19 94.56 2003-04 2312 23.88 - 85.12 93.81 91.70 2004-05 2604 31.72 - 85.83 91.82 94.82 2005-06 2638 30.78 - 84.91 89.61 93.33 2006-07 2800 30.96 - 85.39 89.86 92.04 2007-08 2829 35.52 - 82.96 92.90 93.43 56 351 1999-00 229 13.10 - 80.79 93.01 88.65 2000-01 193 18.13 - 85.49 85.49 76.68 2001-02 168 13.10 - 85.12 92.86 80.36 2002-03 188 13.30 - 87.77 95.21 81.91 2003-04 164 17.07 - 82.93 91.46 83.54
243
Table 7.6 Contd. -------------------------------------------------------------------------------- 1 2 3 4 5 6 7 8 -------------------------------------------------------------------------------- 2004-05 179 17.88 - 86.59 95.53 79.33 2005-06 156 21.79 - 87.18 91.67 87.82 2006-07 175 24.00 - 86.86 89.14 74.86 2007-08 201 15.42 - 77.61 85.57 82.59 57 352 1999-00 280 13.21 - 79.64 85.36 89.29 2000-01 248 14.52 - 83.06 95.97 91.53 2001-02 267 18.73 - 80.90 94.38 87.27 2002-03 259 18.15 - 83.01 90.73 87.26 2003-04 256 16.41 - 81.64 85.55 85.55 2004-05 288 26.39 - 78.47 90.28 91.32 2005-06 268 22.01 - 72.39 79.48 78.36 2006-07 281 14.59 - 72.95 91.81 82.92 2007-08 273 25.27 - 76.92 90.48 81.68 58 353 1999-00 44 11.36 - 75.00 100.00 97.73 2000-01 39 - - 82.05 94.87 92.31 2001-02 36 2.78 - 50.00 100.00 100.00 2002-03 30 10.00 - 80.00 96.67 93.33 2003-04 41 9.76 - 78.05 92.68 95.12 2004-05 36 8.33 - 88.89 86.11 97.22 2005-06 37 5.41 - 78.38 100.00 94.59 2006-07 46 8.70 - 65.22 86.96 89.13 2007-08 55 18.18 - 89.09 98.18 87.27 59 359 1999-00 1456 12.16 - 84.00 89.42 87.16 2000-01 1425 10.67 - 88.21 89.89 91.58 2001-02 1589 10.20 - 84.52 88.04 92.13 2002-03 1380 12.97 - 87.54 92.25 93.62 2003-04 1223 17.58 - 87.16 90.02 92.23 2004-05 1485 12.26 - 85.19 89.43 91.18 2005-06 1427 15.84 - 83.81 92.29 89.42 2006-07 1276 21.87 - 85.50 91.22 91.61 2007-08 1331 18.63 - 79.19 82.27 82.49 60 361 1999-00 773 18.50 - 61.58 66.11 63.52 2000-01 753 12.62 - 57.50 66.27 68.79 2001-02 779 15.28 - 58.28 68.29 63.03 2002-03 577 20.28 0.17 56.85 73.14 73.14 2003-04 676 19.08 - 58.73 73.37 64.50 2004-05 861 19.98 - 55.17 69.92 65.16 2005-06 795 21.26 - 62.01 75.22 73.96 2006-07 825 19.64 - 61.33 69.94 71.27 2007-08 746 16.89 - 52.41 71.58 58.31 61 369 1999-00 1431 13.70 - 77.92 77.92 81.27 2000-01 1314 8.52 0.23 74.28 78.84 77.17 2001-02 1400 9.50 - 72.14 79.57 84.43 2002-03 1385 10.69 0.22 75.81 86.57 85.85 2003-04 1459 12.47 - 70.94 80.81 87.39 2004-05 1824 14.09 - 67.93 77.96 85.91 2005-06 1767 16.24 - 69.27 80.14 83.53 2006-07 1830 18.20 - 71.26 83.44 85.46 2007-08 1758 17.75 - 66.72 80.15 80.77 62 371 1999-00 3 66.67 - 33.33 66.67 33.33
244
Table 7.6 Contd. -------------------------------------------------------------------------------- 1 2 3 4 5 6 7 8 -------------------------------------------------------------------------------- 2000-01 10 30.00 - 70.00 80.00 100.00 2001-02 32 50.00 - 53.13 53.13 96.88 2002-03 16 25.00 - 75.00 37.50 37.50 2003-04 17 17.65 - 76.47 100.00 64.71 2004-05 26 23.08 - 53.85 53.85 73.08 2005-06 18 33.33 - 33.33 44.44 50.00 2006-07 50 18.00 - 48.00 68.00 40.00 2007-08 17 23.53 - 29.41 35.29 58.82 63 372 2002-03 33 54.55 - 15.15 75.76 81.82 2003-04 31 48.39 - 25.81 48.39 48.39 2004-05 45 26.67 - 42.22 64.44 71.11 2005-06 71 15.49 - 39.44 39.44 59.15 2006-07 95 23.16 - 50.53 42.11 47.37 2007-08 71 18.31 - 32.39 36.62 43.66 64 400 1999-00 4101 19.07 - 79.13 72.25 77.15 2000-01 4197 19.87 - 75.03 70.88 81.01 2001-02 4413 22.30 0.05 72.22 69.18 78.90 2002-03 4514 22.97 0.24 74.17 71.09 81.06 2003-04 4711 20.10 - 74.53 72.38 80.13 2004-05 5119 22.11 - 72.69 70.78 80.95 2005-06 5492 20.10 - 73.23 72.05 78.75 2006-07 5742 20.20 - 70.79 71.44 78.58 2007-08 6013 19.47 - 72.61 72.54 78.21 B. States/Union Territories 1 Jammu & Kashmir 1999-00 369 24.93 - 61.52 70.46 81.03 2000-01 338 27.51 - 54.14 67.16 83.73 2001-02 340 31.18 - 53.82 73.53 88.53 2002-03 323 30.03 - 54.18 76.47 84.83 2003-04 323 28.48 - 51.70 72.76 82.04 2004-05 423 29.55 - 42.55 70.45 82.03 2005-06 519 31.79 - 47.78 74.57 81.31 2006-07 618 31.55 - 45.79 76.05 84.47 2007-08 672 34.38 - 51.79 75.74 78.57 2 Himachal Pradesh 1999-00 497 12.88 - 62.58 88.93 85.92 2000-01 504 19.05 - 67.06 88.29 88.10 2001-02 493 16.84 - 64.50 85.40 87.22 2002-03 501 16.77 - 56.89 89.02 87.43 2003-04 517 20.12 - 60.15 85.88 91.10 2004-05 653 24.66 - 55.90 85.76 86.68 2005-06 809 18.91 - 54.76 85.78 84.55 2006-07 851 24.32 - 61.46 86.25 89.78 2007-08 1122 25.22 - 58.56 86.81 87.88 3 Punjab 1999-00 6759 20.91 - 72.84 81.39 78.24 2000-01 7036 26.81 0.11 67.98 82.02 75.92 2001-02 7174 28.37 - 68.75 85.17 74.06 2002-03 6913 28.18 0.04 71.30 86.74 78.56 2003-04 6699 26.84 0.01 66.73 83.07 75.03
245
Table 7.6 Contd. -------------------------------------------------------------------------------- 1 2 3 4 5 6 7 8 -------------------------------------------------------------------------------- 2004-05 7575 32.83 - 61.66 80.50 72.36 2005-06 8332 34.09 - 60.15 80.86 66.61 2006-07 9256 40.70 - 58.88 80.69 63.61 2007-08 10179 37.55 - 56.65 77.61 63.97 4 Chandigarh 1999-00 300 2.33 - 69.33 95.33 89.00 2000-01 291 1.03 - 69.42 89.00 86.25 2001-02 274 9.12 - 68.98 96.35 78.47 2002-03 252 0.79 0.40 67.46 92.46 78.17 2003-04 261 5.36 - 70.50 96.55 88.89 2004-05 287 5.57 - 65.51 96.17 90.59 2005-06 296 8.45 - 66.22 90.20 82.43 2006-07 274 6.93 - 67.52 94.16 91.97 2007-08 294 6.80 - 65.65 96.94 86.73 5 Uttaranchal 2000-01 730 40.82 0.14 40.41 47.81 56.71 2001-02 673 24.52 - 41.31 54.83 54.98 2002-03 697 37.59 - 42.18 49.35 64.71 2003-04 666 38.14 0.30 44.29 51.20 55.86 2004-05 751 41.01 - 44.34 53.40 62.45 2005-06 900 37.33 - 42.78 59.11 66.33 2006-07 1151 35.19 - 40.66 59.43 64.03 2007-08 1454 32.19 - 37.14 64.86 71.32 6 Haryana 1999-00 4168 29.63 - 59.81 82.49 72.22 2000-01 4436 31.09 - 58.77 85.30 73.78 2001-02 4398 31.90 - 55.68 85.24 70.35 2002-03 4429 27.37 - 60.13 87.22 76.81 2003-04 4227 31.37 - 61.11 86.99 77.48 2004-05 4339 32.27 - 61.49 88.36 76.08 2005-06 4295 33.74 - 60.75 87.89 74.71 2006-07 4408 33.05 - 61.55 87.16 74.84 2007-08 4691 31.78 - 65.27 90.47 78.02 7 Delhi 1999-00 3430 3.09 - 89.77 96.68 90.70 2000-01 3451 5.42 0.09 86.76 95.83 96.67 2001-02 3292 4.07 - 87.03 95.78 93.32 2002-03 3333 3.36 0.12 86.20 95.29 93.19 2003-04 3082 5.16 - 87.61 95.81 93.96 2004-05 3156 5.10 - 85.68 94.99 92.02 2005-06 3306 5.32 - 83.33 91.50 89.62 2006-07 3270 4.92 - 86.67 94.68 91.56 2007-08 3199 5.56 - 85.31 94.90 94.12 8 Rajasthan 1999-00 4945 21.17 - 51.73 72.40 63.68 2000-01 4965 21.77 0.06 52.61 74.70 67.49 2001-02 5132 24.22 - 52.44 71.36 61.71 2002-03 5360 23.81 0.02 53.23 71.23 58.49 2003-04 5323 24.08 - 53.20 74.24 64.85 2004-05 5740 23.21 - 54.09 75.68 61.55 2005-06 6005 25.18 - 49.61 76.07 57.55
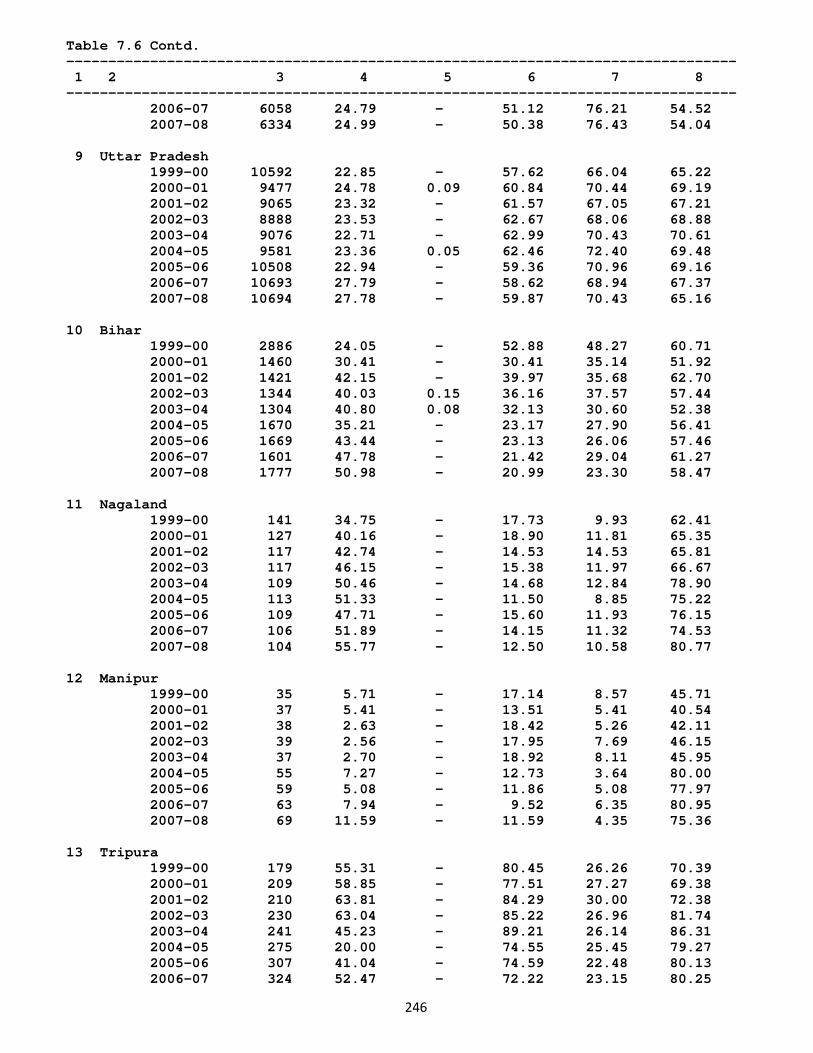
246
Table 7.6 Contd. -------------------------------------------------------------------------------- 1 2 3 4 5 6 7 8 -------------------------------------------------------------------------------- 2006-07 6058 24.79 - 51.12 76.21 54.52 2007-08 6334 24.99 - 50.38 76.43 54.04 9 Uttar Pradesh 1999-00 10592 22.85 - 57.62 66.04 65.22 2000-01 9477 24.78 0.09 60.84 70.44 69.19 2001-02 9065 23.32 - 61.57 67.05 67.21 2002-03 8888 23.53 - 62.67 68.06 68.88 2003-04 9076 22.71 - 62.99 70.43 70.61 2004-05 9581 23.36 0.05 62.46 72.40 69.48 2005-06 10508 22.94 - 59.36 70.96 69.16 2006-07 10693 27.79 - 58.62 68.94 67.37 2007-08 10694 27.78 - 59.87 70.43 65.16 10 Bihar 1999-00 2886 24.05 - 52.88 48.27 60.71 2000-01 1460 30.41 - 30.41 35.14 51.92 2001-02 1421 42.15 - 39.97 35.68 62.70 2002-03 1344 40.03 0.15 36.16 37.57 57.44 2003-04 1304 40.80 0.08 32.13 30.60 52.38 2004-05 1670 35.21 - 23.17 27.90 56.41 2005-06 1669 43.44 - 23.13 26.06 57.46 2006-07 1601 47.78 - 21.42 29.04 61.27 2007-08 1777 50.98 - 20.99 23.30 58.47 11 Nagaland 1999-00 141 34.75 - 17.73 9.93 62.41 2000-01 127 40.16 - 18.90 11.81 65.35 2001-02 117 42.74 - 14.53 14.53 65.81 2002-03 117 46.15 - 15.38 11.97 66.67 2003-04 109 50.46 - 14.68 12.84 78.90 2004-05 113 51.33 - 11.50 8.85 75.22 2005-06 109 47.71 - 15.60 11.93 76.15 2006-07 106 51.89 - 14.15 11.32 74.53 2007-08 104 55.77 - 12.50 10.58 80.77 12 Manipur 1999-00 35 5.71 - 17.14 8.57 45.71 2000-01 37 5.41 - 13.51 5.41 40.54 2001-02 38 2.63 - 18.42 5.26 42.11 2002-03 39 2.56 - 17.95 7.69 46.15 2003-04 37 2.70 - 18.92 8.11 45.95 2004-05 55 7.27 - 12.73 3.64 80.00 2005-06 59 5.08 - 11.86 5.08 77.97 2006-07 63 7.94 - 9.52 6.35 80.95 2007-08 69 11.59 - 11.59 4.35 75.36 13 Tripura 1999-00 179 55.31 - 80.45 26.26 70.39 2000-01 209 58.85 - 77.51 27.27 69.38 2001-02 210 63.81 - 84.29 30.00 72.38 2002-03 230 63.04 - 85.22 26.96 81.74 2003-04 241 45.23 - 89.21 26.14 86.31 2004-05 275 20.00 - 74.55 25.45 79.27 2005-06 307 41.04 - 74.59 22.48 80.13 2006-07 324 52.47 - 72.22 23.15 80.25
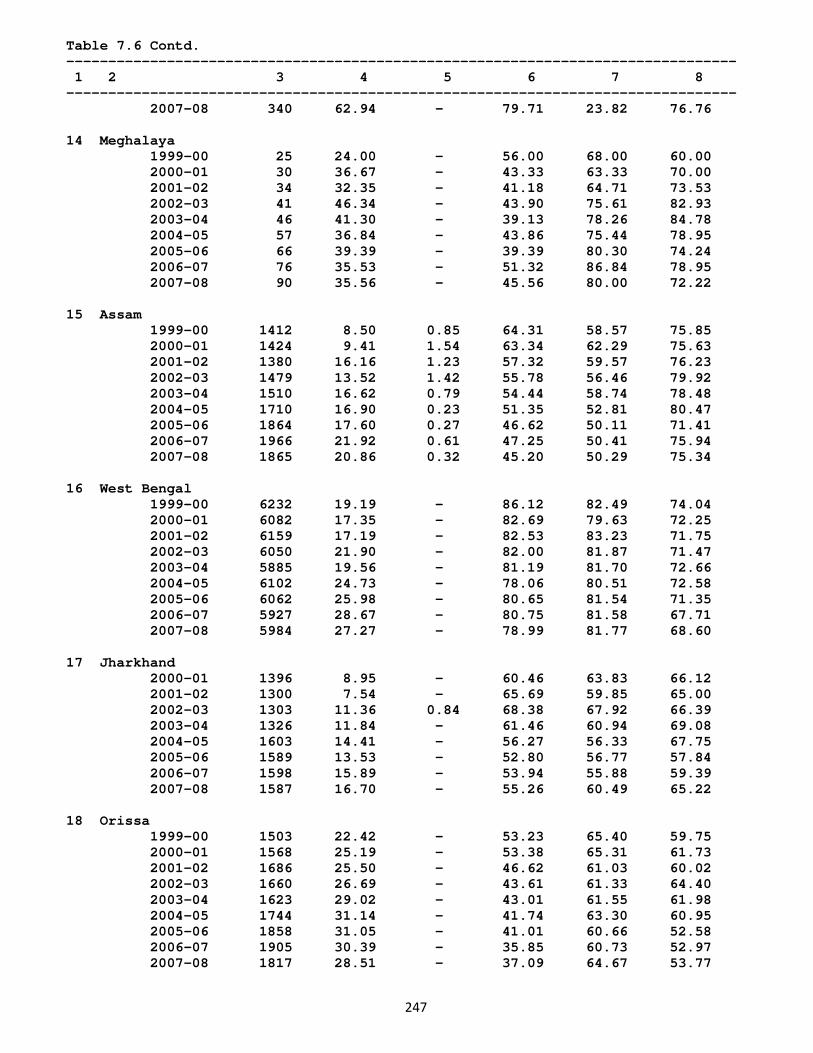
247
Table 7.6 Contd. -------------------------------------------------------------------------------- 1 2 3 4 5 6 7 8 -------------------------------------------------------------------------------- 2007-08 340 62.94 - 79.71 23.82 76.76 14 Meghalaya 1999-00 25 24.00 - 56.00 68.00 60.00 2000-01 30 36.67 - 43.33 63.33 70.00 2001-02 34 32.35 - 41.18 64.71 73.53 2002-03 41 46.34 - 43.90 75.61 82.93 2003-04 46 41.30 - 39.13 78.26 84.78 2004-05 57 36.84 - 43.86 75.44 78.95 2005-06 66 39.39 - 39.39 80.30 74.24 2006-07 76 35.53 - 51.32 86.84 78.95 2007-08 90 35.56 - 45.56 80.00 72.22 15 Assam 1999-00 1412 8.50 0.85 64.31 58.57 75.85 2000-01 1424 9.41 1.54 63.34 62.29 75.63 2001-02 1380 16.16 1.23 57.32 59.57 76.23 2002-03 1479 13.52 1.42 55.78 56.46 79.92 2003-04 1510 16.62 0.79 54.44 58.74 78.48 2004-05 1710 16.90 0.23 51.35 52.81 80.47 2005-06 1864 17.60 0.27 46.62 50.11 71.41 2006-07 1966 21.92 0.61 47.25 50.41 75.94 2007-08 1865 20.86 0.32 45.20 50.29 75.34 16 West Bengal 1999-00 6232 19.19 - 86.12 82.49 74.04 2000-01 6082 17.35 - 82.69 79.63 72.25 2001-02 6159 17.19 - 82.53 83.23 71.75 2002-03 6050 21.90 - 82.00 81.87 71.47 2003-04 5885 19.56 - 81.19 81.70 72.66 2004-05 6102 24.73 - 78.06 80.51 72.58 2005-06 6062 25.98 - 80.65 81.54 71.35 2006-07 5927 28.67 - 80.75 81.58 67.71 2007-08 5984 27.27 - 78.99 81.77 68.60 17 Jharkhand 2000-01 1396 8.95 - 60.46 63.83 66.12 2001-02 1300 7.54 - 65.69 59.85 65.00 2002-03 1303 11.36 0.84 68.38 67.92 66.39 2003-04 1326 11.84 - 61.46 60.94 69.08 2004-05 1603 14.41 - 56.27 56.33 67.75 2005-06 1589 13.53 - 52.80 56.77 57.84 2006-07 1598 15.89 - 53.94 55.88 59.39 2007-08 1587 16.70 - 55.26 60.49 65.22 18 Orissa 1999-00 1503 22.42 - 53.23 65.40 59.75 2000-01 1568 25.19 - 53.38 65.31 61.73 2001-02 1686 25.50 - 46.62 61.03 60.02 2002-03 1660 26.69 - 43.61 61.33 64.40 2003-04 1623 29.02 - 43.01 61.55 61.98 2004-05 1744 31.14 - 41.74 63.30 60.95 2005-06 1858 31.05 - 41.01 60.66 52.58 2006-07 1905 30.39 - 35.85 60.73 52.97 2007-08 1817 28.51 - 37.09 64.67 53.77
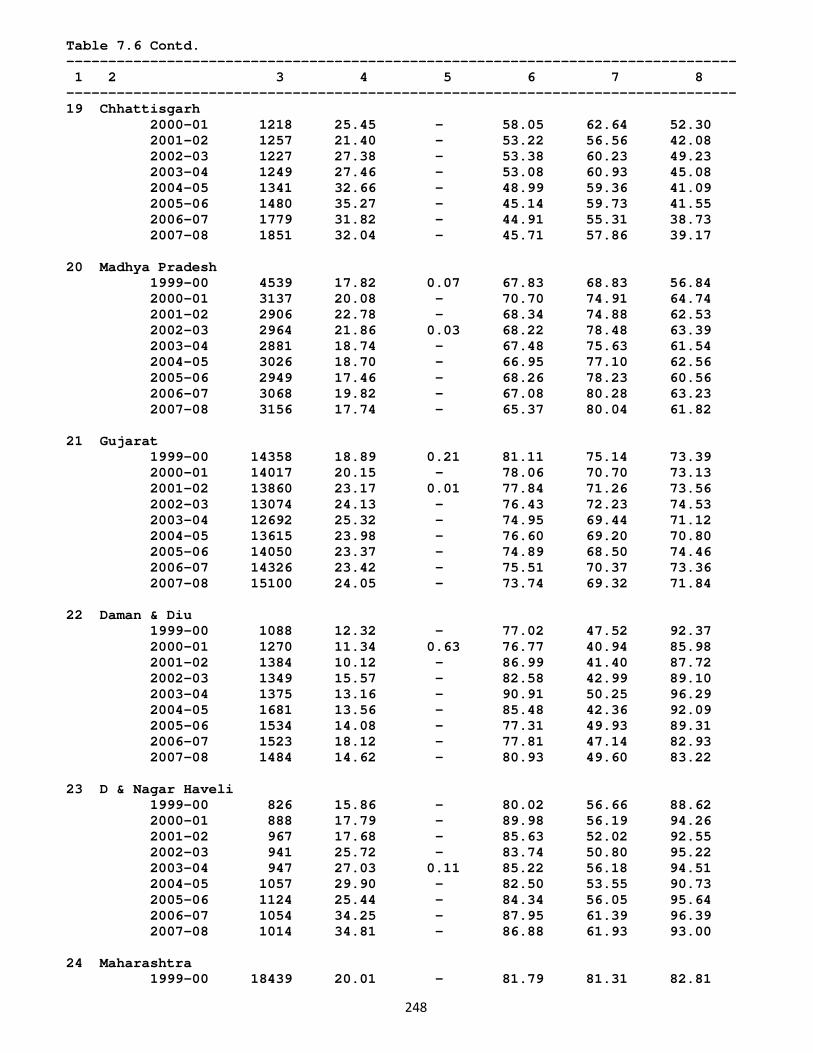
248
Table 7.6 Contd. -------------------------------------------------------------------------------- 1 2 3 4 5 6 7 8 -------------------------------------------------------------------------------- 19 Chhattisgarh 2000-01 1218 25.45 - 58.05 62.64 52.30 2001-02 1257 21.40 - 53.22 56.56 42.08 2002-03 1227 27.38 - 53.38 60.23 49.23 2003-04 1249 27.46 - 53.08 60.93 45.08 2004-05 1341 32.66 - 48.99 59.36 41.09 2005-06 1480 35.27 - 45.14 59.73 41.55 2006-07 1779 31.82 - 44.91 55.31 38.73 2007-08 1851 32.04 - 45.71 57.86 39.17 20 Madhya Pradesh 1999-00 4539 17.82 0.07 67.83 68.83 56.84 2000-01 3137 20.08 - 70.70 74.91 64.74 2001-02 2906 22.78 - 68.34 74.88 62.53 2002-03 2964 21.86 0.03 68.22 78.48 63.39 2003-04 2881 18.74 - 67.48 75.63 61.54 2004-05 3026 18.70 - 66.95 77.10 62.56 2005-06 2949 17.46 - 68.26 78.23 60.56 2006-07 3068 19.82 - 67.08 80.28 63.23 2007-08 3156 17.74 - 65.37 80.04 61.82 21 Gujarat 1999-00 14358 18.89 0.21 81.11 75.14 73.39 2000-01 14017 20.15 - 78.06 70.70 73.13 2001-02 13860 23.17 0.01 77.84 71.26 73.56 2002-03 13074 24.13 - 76.43 72.23 74.53 2003-04 12692 25.32 - 74.95 69.44 71.12 2004-05 13615 23.98 - 76.60 69.20 70.80 2005-06 14050 23.37 - 74.89 68.50 74.46 2006-07 14326 23.42 - 75.51 70.37 73.36 2007-08 15100 24.05 - 73.74 69.32 71.84 22 Daman & Diu 1999-00 1088 12.32 - 77.02 47.52 92.37 2000-01 1270 11.34 0.63 76.77 40.94 85.98 2001-02 1384 10.12 - 86.99 41.40 87.72 2002-03 1349 15.57 - 82.58 42.99 89.10 2003-04 1375 13.16 - 90.91 50.25 96.29 2004-05 1681 13.56 - 85.48 42.36 92.09 2005-06 1534 14.08 - 77.31 49.93 89.31 2006-07 1523 18.12 - 77.81 47.14 82.93 2007-08 1484 14.62 - 80.93 49.60 83.22 23 D & Nagar Haveli 1999-00 826 15.86 - 80.02 56.66 88.62 2000-01 888 17.79 - 89.98 56.19 94.26 2001-02 967 17.68 - 85.63 52.02 92.55 2002-03 941 25.72 - 83.74 50.80 95.22 2003-04 947 27.03 0.11 85.22 56.18 94.51 2004-05 1057 29.90 - 82.50 53.55 90.73 2005-06 1124 25.44 - 84.34 56.05 95.64 2006-07 1054 34.25 - 87.95 61.39 96.39 2007-08 1014 34.81 - 86.88 61.93 93.00 24 Maharashtra 1999-00 18439 20.01 - 81.79 81.31 82.81
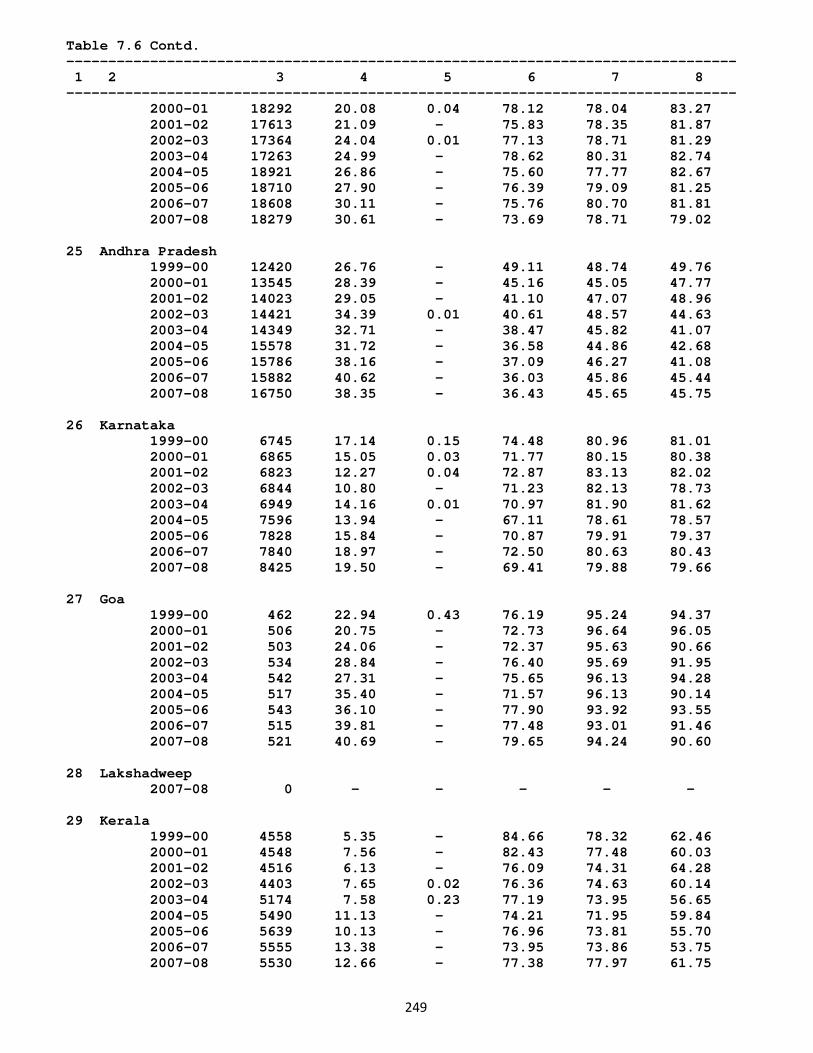
249
Table 7.6 Contd. -------------------------------------------------------------------------------- 1 2 3 4 5 6 7 8 -------------------------------------------------------------------------------- 2000-01 18292 20.08 0.04 78.12 78.04 83.27 2001-02 17613 21.09 - 75.83 78.35 81.87 2002-03 17364 24.04 0.01 77.13 78.71 81.29 2003-04 17263 24.99 - 78.62 80.31 82.74 2004-05 18921 26.86 - 75.60 77.77 82.67 2005-06 18710 27.90 - 76.39 79.09 81.25 2006-07 18608 30.11 - 75.76 80.70 81.81 2007-08 18279 30.61 - 73.69 78.71 79.02 25 Andhra Pradesh 1999-00 12420 26.76 - 49.11 48.74 49.76 2000-01 13545 28.39 - 45.16 45.05 47.77 2001-02 14023 29.05 - 41.10 47.07 48.96 2002-03 14421 34.39 0.01 40.61 48.57 44.63 2003-04 14349 32.71 - 38.47 45.82 41.07 2004-05 15578 31.72 - 36.58 44.86 42.68 2005-06 15786 38.16 - 37.09 46.27 41.08 2006-07 15882 40.62 - 36.03 45.86 45.44 2007-08 16750 38.35 - 36.43 45.65 45.75 26 Karnataka 1999-00 6745 17.14 0.15 74.48 80.96 81.01 2000-01 6865 15.05 0.03 71.77 80.15 80.38 2001-02 6823 12.27 0.04 72.87 83.13 82.02 2002-03 6844 10.80 - 71.23 82.13 78.73 2003-04 6949 14.16 0.01 70.97 81.90 81.62 2004-05 7596 13.94 - 67.11 78.61 78.57 2005-06 7828 15.84 - 70.87 79.91 79.37 2006-07 7840 18.97 - 72.50 80.63 80.43 2007-08 8425 19.50 - 69.41 79.88 79.66 27 Goa 1999-00 462 22.94 0.43 76.19 95.24 94.37 2000-01 506 20.75 - 72.73 96.64 96.05 2001-02 503 24.06 - 72.37 95.63 90.66 2002-03 534 28.84 - 76.40 95.69 91.95 2003-04 542 27.31 - 75.65 96.13 94.28 2004-05 517 35.40 - 71.57 96.13 90.14 2005-06 543 36.10 - 77.90 93.92 93.55 2006-07 515 39.81 - 77.48 93.01 91.46 2007-08 521 40.69 - 79.65 94.24 90.60 28 Lakshadweep 2007-08 0 - - - - - 29 Kerala 1999-00 4558 5.35 - 84.66 78.32 62.46 2000-01 4548 7.56 - 82.43 77.48 60.03 2001-02 4516 6.13 - 76.09 74.31 64.28 2002-03 4403 7.65 0.02 76.36 74.63 60.14 2003-04 5174 7.58 0.23 77.19 73.95 56.65 2004-05 5490 11.13 - 74.21 71.95 59.84 2005-06 5639 10.13 - 76.96 73.81 55.70 2006-07 5555 13.38 - 73.95 73.86 53.75 2007-08 5530 12.66 - 77.38 77.97 61.75
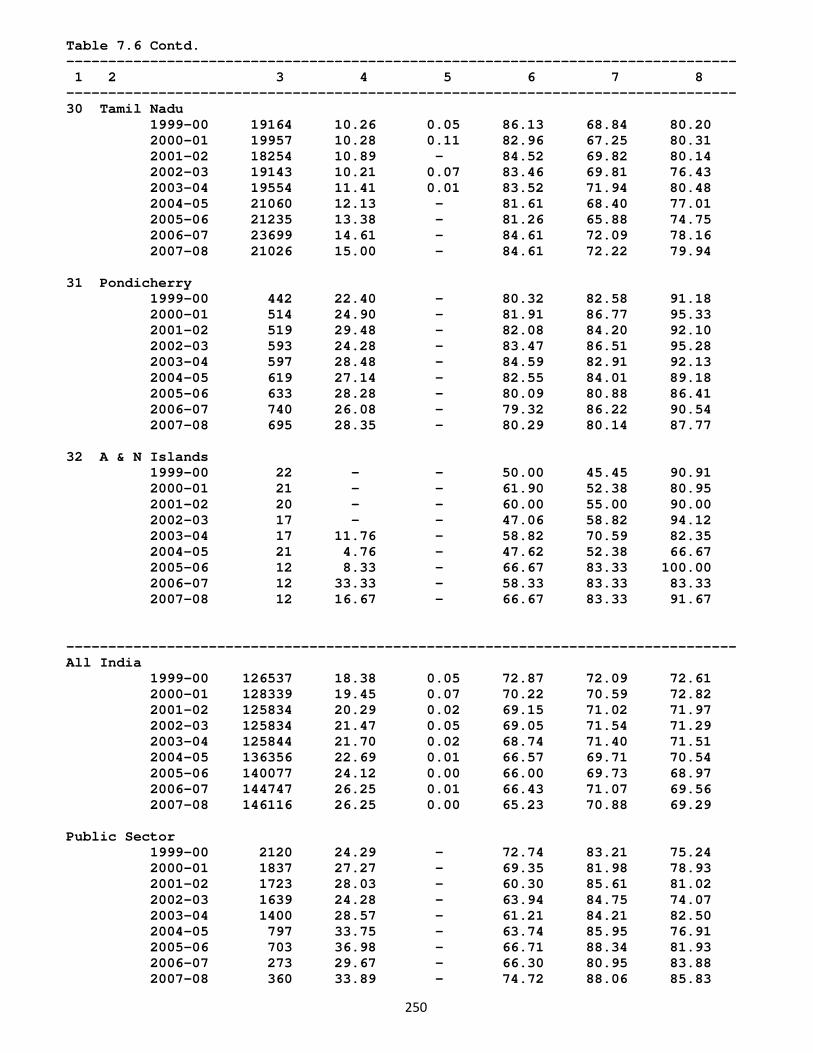
250
Table 7.6 Contd. -------------------------------------------------------------------------------- 1 2 3 4 5 6 7 8 -------------------------------------------------------------------------------- 30 Tamil Nadu 1999-00 19164 10.26 0.05 86.13 68.84 80.20 2000-01 19957 10.28 0.11 82.96 67.25 80.31 2001-02 18254 10.89 - 84.52 69.82 80.14 2002-03 19143 10.21 0.07 83.46 69.81 76.43 2003-04 19554 11.41 0.01 83.52 71.94 80.48 2004-05 21060 12.13 - 81.61 68.40 77.01 2005-06 21235 13.38 - 81.26 65.88 74.75 2006-07 23699 14.61 - 84.61 72.09 78.16 2007-08 21026 15.00 - 84.61 72.22 79.94 31 Pondicherry 1999-00 442 22.40 - 80.32 82.58 91.18 2000-01 514 24.90 - 81.91 86.77 95.33 2001-02 519 29.48 - 82.08 84.20 92.10 2002-03 593 24.28 - 83.47 86.51 95.28 2003-04 597 28.48 - 84.59 82.91 92.13 2004-05 619 27.14 - 82.55 84.01 89.18 2005-06 633 28.28 - 80.09 80.88 86.41 2006-07 740 26.08 - 79.32 86.22 90.54 2007-08 695 28.35 - 80.29 80.14 87.77 32 A & N Islands 1999-00 22 - - 50.00 45.45 90.91 2000-01 21 - - 61.90 52.38 80.95 2001-02 20 - - 60.00 55.00 90.00 2002-03 17 - - 47.06 58.82 94.12 2003-04 17 11.76 - 58.82 70.59 82.35 2004-05 21 4.76 - 47.62 52.38 66.67 2005-06 12 8.33 - 66.67 83.33 100.00 2006-07 12 33.33 - 58.33 83.33 83.33 2007-08 12 16.67 - 66.67 83.33 91.67 -------------------------------------------------------------------------------- All India 1999-00 126537 18.38 0.05 72.87 72.09 72.61 2000-01 128339 19.45 0.07 70.22 70.59 72.82 2001-02 125834 20.29 0.02 69.15 71.02 71.97 2002-03 125834 21.47 0.05 69.05 71.54 71.29 2003-04 125844 21.70 0.02 68.74 71.40 71.51 2004-05 136356 22.69 0.01 66.57 69.71 70.54 2005-06 140077 24.12 0.00 66.00 69.73 68.97 2006-07 144747 26.25 0.01 66.43 71.07 69.56 2007-08 146116 26.25 0.00 65.23 70.88 69.29 Public Sector 1999-00 2120 24.29 - 72.74 83.21 75.24 2000-01 1837 27.27 - 69.35 81.98 78.93 2001-02 1723 28.03 - 60.30 85.61 81.02 2002-03 1639 24.28 - 63.94 84.75 74.07 2003-04 1400 28.57 - 61.21 84.21 82.50 2004-05 797 33.75 - 63.74 85.95 76.91 2005-06 703 36.98 - 66.71 88.34 81.93 2006-07 273 29.67 - 66.30 80.95 83.88 2007-08 360 33.89 - 74.72 88.06 85.83
251
Table 7.6 Concld. -------------------------------------------------------------------------------- 1 2 3 4 5 6 7 8 -------------------------------------------------------------------------------- Joint Sector 1999-00 1911 27.89 0.05 77.86 84.51 80.90 2000-01 1742 27.73 0.46 75.49 81.29 77.67 2001-02 1483 32.43 0.07 77.55 84.49 83.61 2002-03 1637 30.85 - 68.85 82.47 77.03 2003-04 1707 33.45 0.06 67.55 84.89 77.86 2004-05 642 35.98 - 69.31 87.23 82.71 2005-06 1445 33.56 - 78.62 91.97 91.42 2006-07 459 45.32 - 69.93 92.59 89.11 2007-08 697 49.64 - 70.30 85.65 77.47 Private Sector 1999-00 122506 18.13 0.05 72.79 71.71 72.44 2000-01 124759 19.22 0.06 70.16 70.27 72.66 2001-02 122628 20.03 0.02 69.17 70.65 71.70 2002-03 122558 21.30 0.05 69.12 71.22 71.17 2003-04 122737 21.46 0.02 68.84 71.07 71.29 2004-05 134916 22.56 0.01 66.58 69.53 70.45 2005-06 137928 23.96 0.00 65.87 69.40 68.67 2006-07 144014 26.18 0.01 66.42 70.98 69.47 2007-08 145059 26.12 0.00 65.18 70.76 69.21 --------------------------------------------------------------------------------
-0-0-0-
252
ANNEXURE-I CONFIDENTIAL
Government of India Ministry of Statistics & Programme Implementation
Return under rule 3 and 4 of the Collection of Statistics(Central) Rules, 1959 Annual Survey of Industries 2007-08 (Part-I)
(Please read the instructions before filling the return) A. FOR OFFICIAL USE ONLY B. TO BE FILLED BY OWNER 1. Schedule Despatch No. 1. Name & address of the industrial
undertaking Vill/Town: District: State: PIN Code:
2. PSL No. 3. Scheme Code (Census-1, Sample-2) 4. Industry Code as per frame (4-digit level of NIC-2004)
5. Industry Code as per Return (5-digit level of NIC-2004)
2. Name & designation of contact person Tele (with STD code):
Fax No.: E-mail :
6. Description of Industry
7. State Code 8. District Code 3. Type of organisation(code) 9. Sector Code(Rural-1, Urban-2) 4. Type of ownership(code) 10. RO/SRO 5. Year of initial production 11. No. of Units 6. Accounting year (---- to ----) 12. Status of Unit(code) 7. Number of months of operation
8. Does your unit have any computers? (Yes-1, No-2) 9. Can you supply ASI data in computer floppy if
software provided? (Yes-1, No-2)
DECLARATION
I hereby declare that information furnished in this return is correct and complete to the best of my knowledge and belief. Date: Place: (Name and Signature of owner with stamp)

253
BLOCK E: EMPLOYMENT AND LABOUR COST DSL No./PSL No._________ Sl. No.
Category of staff Man-days worked Average Number of
Persons worked
No. of Mandays paid for
Wages/ salaries (in Rs.)
Bonus (in Rs.)
Contrib-ution to Provident & Other funds
(in Rs.)
Workman & staff welfare expenses (in Rs.)
Manufac-turing
Non Manufac-turing
Total
1 2 3 4 5 6 7 8 9 10 11 1 Male Workers employed
directly
2 Female Workers employed directly
3 Child Workers employed directly
4 Sub-total (1+2+3)
5 Workers employed through contractors
6 Total Workers (4+5)
7 Supervisory & managerial staff
8 Other employees
9 Unpaid family members/ proprietor/ Coop. members
X X X X X X X X
10 Total employees (6+7+8+9)
11
Number of working days
(i) Manufacturing days
(ii) Non-Manufacturing days (iii) Total
12
Total Cost of Production (in Rs.) Item 10. Col.8,9,10 & 11 of Bl. E (+) item 7.8.9 & 10 Col 3 of Bl. F (+) item 17 of Col 6 of Bl. H (+) item 7, Col 6 Bl.I
254
F. OTHER EXPENSES DSL NO./PSL NO. Sl. No. Items Expenditure(in Rs.)
1 2 3 1
Work done by others on material supplied by the industrial undertaking
2
Repair & Maintenance of (i) Building (ii) Plant & Machinery (iii) Pollution Control Equipment (iv) Other Fixed Assets
3
Operating Expenses
4
Non-operating Expenses (excluding insurance charges)
5
Insurance Charges
6
Rent paid for P & M and other Fixed Assets
7
Total Expenses (1 to 6)
8
Rent Paid for Buildings
9
Rent Paid for Land on Lease or Royalties on Mines, Quarries and similar Assets
10
Interest Paid
11
Purchase Value of goods sold in the same condition as purchased
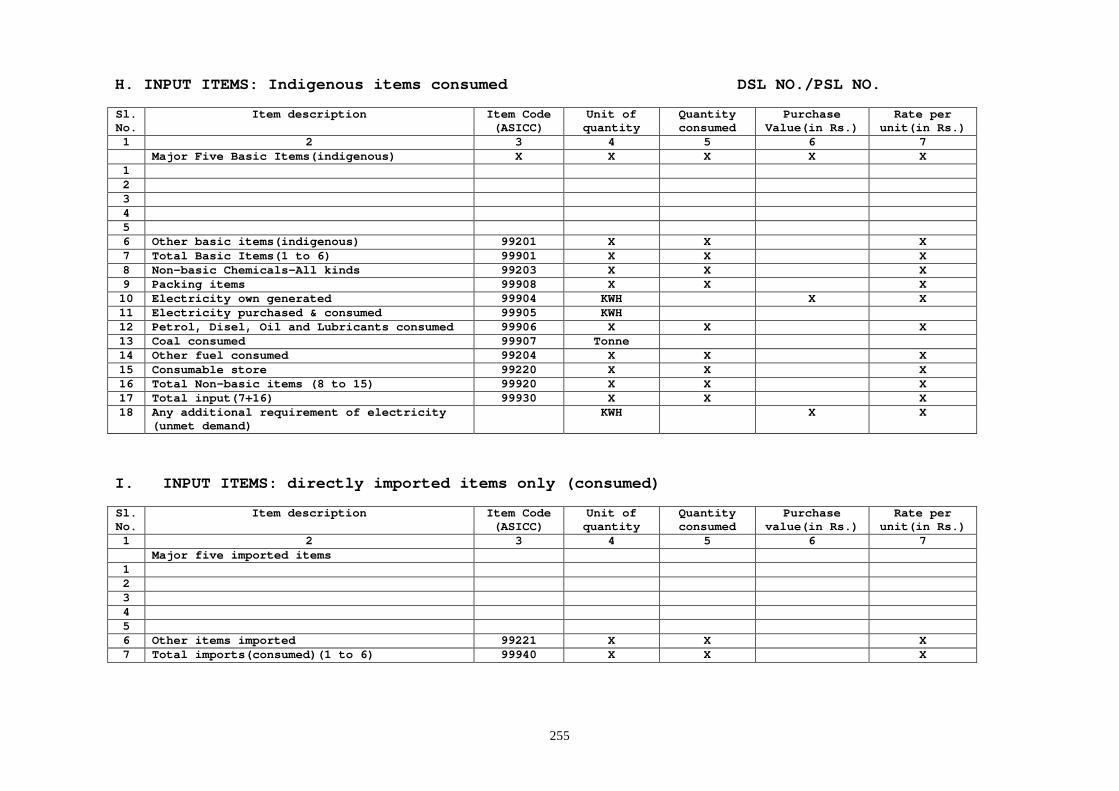
255
H. INPUT ITEMS: Indigenous items consumed DSL NO./PSL NO. Sl. No.
Item description Item Code (ASICC)
Unit of quantity
Quantity consumed
Purchase Value(in Rs.)
Rate per unit(in Rs.)
1 2 3 4 5 6 7 Major Five Basic Items(indigenous) X X X X X 1 2 3 4 5 6 Other basic items(indigenous) 99201 X X X 7 Total Basic Items(1 to 6) 99901 X X X 8 Non-basic Chemicals-All kinds 99203 X X X 9 Packing items 99908 X X X 10 Electricity own generated 99904 KWH X X 11 Electricity purchased & consumed 99905 KWH 12 Petrol, Disel, Oil and Lubricants consumed 99906 X X X 13 Coal consumed 99907 Tonne 14 Other fuel consumed 99204 X X X 15 Consumable store 99220 X X X 16 Total Non-basic items (8 to 15) 99920 X X X 17 Total input(7+16) 99930 X X X 18 Any additional requirement of electricity
(unmet demand) KWH X X
I. INPUT ITEMS: directly imported items only (consumed) Sl. No.
Item description Item Code (ASICC)
Unit of quantity
Quantity consumed
Purchase value(in Rs.)
Rate per unit(in Rs.)
1 2 3 4 5 6 7 Major five imported items 1 2 3 4 5 6 Other items imported 99221 X X X 7 Total imports(consumed)(1 to 6) 99940 X X X
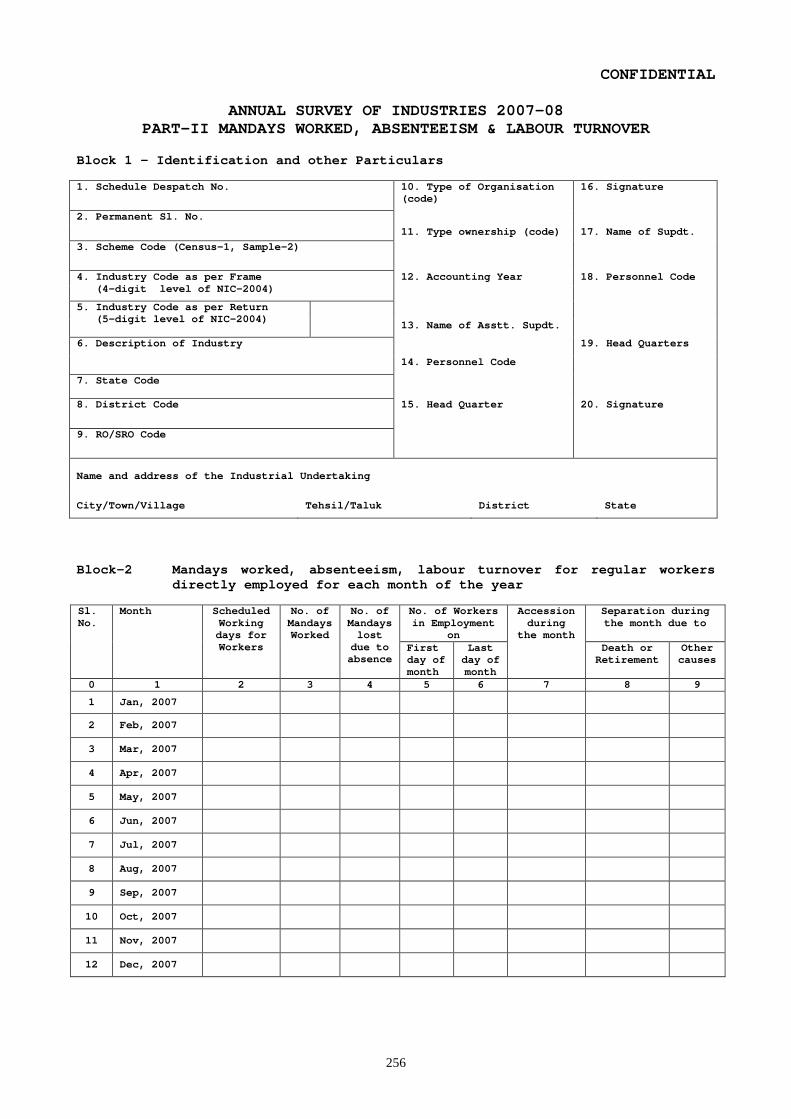
256
CONFIDENTIAL
ANNUAL SURVEY OF INDUSTRIES 2007-08 PART-II MANDAYS WORKED, ABSENTEEISM & LABOUR TURNOVER
Block 1 - Identification and other Particulars 1. Schedule Despatch No. 10. Type of Organisation
(code) 16. Signature
2. Permanent Sl. No. 11. Type ownership (code) 17. Name of Supdt.
3. Scheme Code (Census-1, Sample-2)
4. Industry Code as per Frame (4-digit level of NIC-2004)
12. Accounting Year 18. Personnel Code
5. Industry Code as per Return (5-digit level of NIC-2004)
13. Name of Asstt. Supdt.
6. Description of Industry
19. Head Quarters
14. Personnel Code
7. State Code
8. District Code 15. Head Quarter 20. Signature
9. RO/SRO Code
Name and address of the Industrial Undertaking
City/Town/Village Tehsil/Taluk District State
Block-2 Mandays worked, absenteeism, labour turnover for regular workers directly employed for each month of the year
Sl. No.
Month Scheduled Working days for Workers
No. of Mandays Worked
No. of Mandays lost due to absence
No. of Workers in Employment
on
Accession during
the month
Separation during the month due to
First day of month
Last day of month
Death or Retirement
Other causes
0 1 2 3 4 5 6 7 8 9
1 Jan, 2007
2 Feb, 2007
3 Mar, 2007
4 Apr, 2007
5 May, 2007
6 Jun, 2007
7 Jul, 2007
8 Aug, 2007
9 Sep, 2007
10 Oct, 2007
11 Nov, 2007
12 Dec, 2007
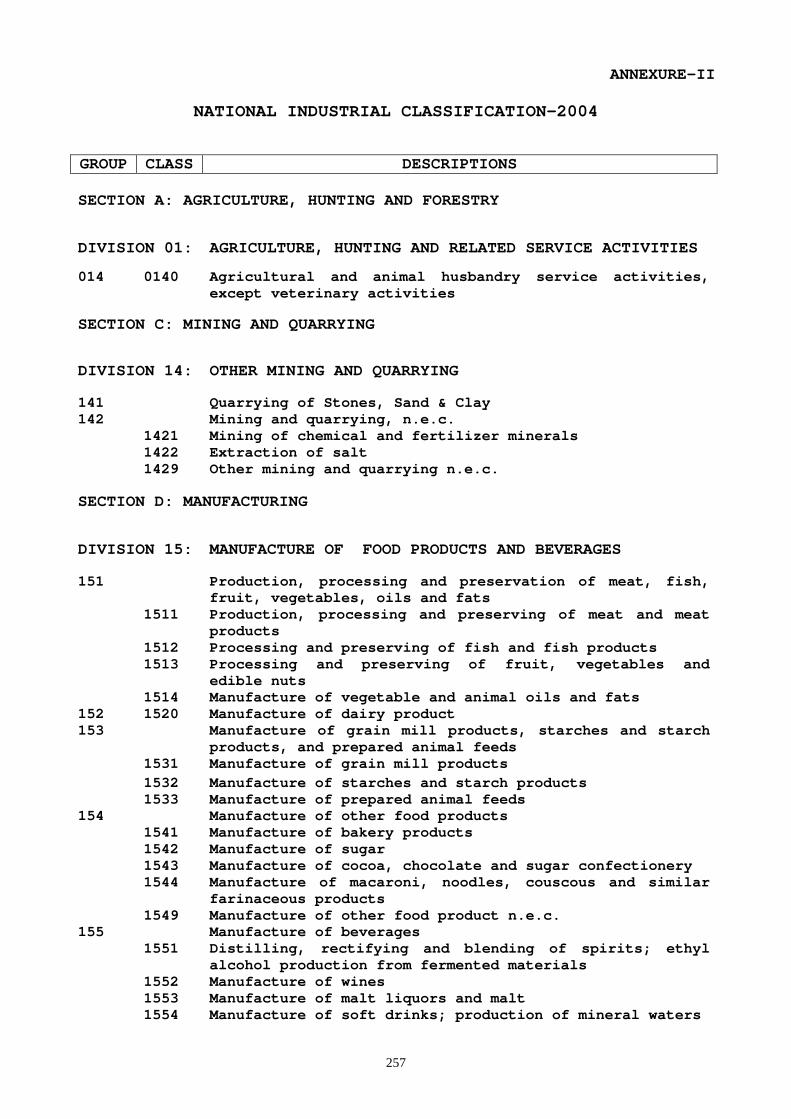
257
ANNEXURE-II
NATIONAL INDUSTRIAL CLASSIFICATION-2004 GROUP CLASS DESCRIPTIONS
SECTION A: AGRICULTURE, HUNTING AND FORESTRY
DIVISION 01: AGRICULTURE, HUNTING AND RELATED SERVICE ACTIVITIES
014 0140 Agricultural and animal husbandry service activities, except veterinary activities
SECTION C: MINING AND QUARRYING
DIVISION 14: OTHER MINING AND QUARRYING
141 Quarrying of Stones, Sand & Clay 142 Mining and quarrying, n.e.c. 1421 Mining of chemical and fertilizer minerals 1422 Extraction of salt 1429 Other mining and quarrying n.e.c.
SECTION D: MANUFACTURING
DIVISION 15: MANUFACTURE OF FOOD PRODUCTS AND BEVERAGES
151 Production, processing and preservation of meat, fish, fruit, vegetables, oils and fats
1511 Production, processing and preserving of meat and meat products
1512 Processing and preserving of fish and fish products 1513 Processing and preserving of fruit, vegetables and
edible nuts 1514 Manufacture of vegetable and animal oils and fats 152 1520 Manufacture of dairy product 153 Manufacture of grain mill products, starches and starch
products, and prepared animal feeds 1531 Manufacture of grain mill products 1532 Manufacture of starches and starch products 1533 Manufacture of prepared animal feeds 154 Manufacture of other food products 1541 Manufacture of bakery products 1542 Manufacture of sugar 1543 Manufacture of cocoa, chocolate and sugar confectionery 1544 Manufacture of macaroni, noodles, couscous and similar
farinaceous products 1549 Manufacture of other food product n.e.c. 155 Manufacture of beverages 1551 Distilling, rectifying and blending of spirits; ethyl
alcohol production from fermented materials 1552 Manufacture of wines 1553 Manufacture of malt liquors and malt 1554 Manufacture of soft drinks; production of mineral waters
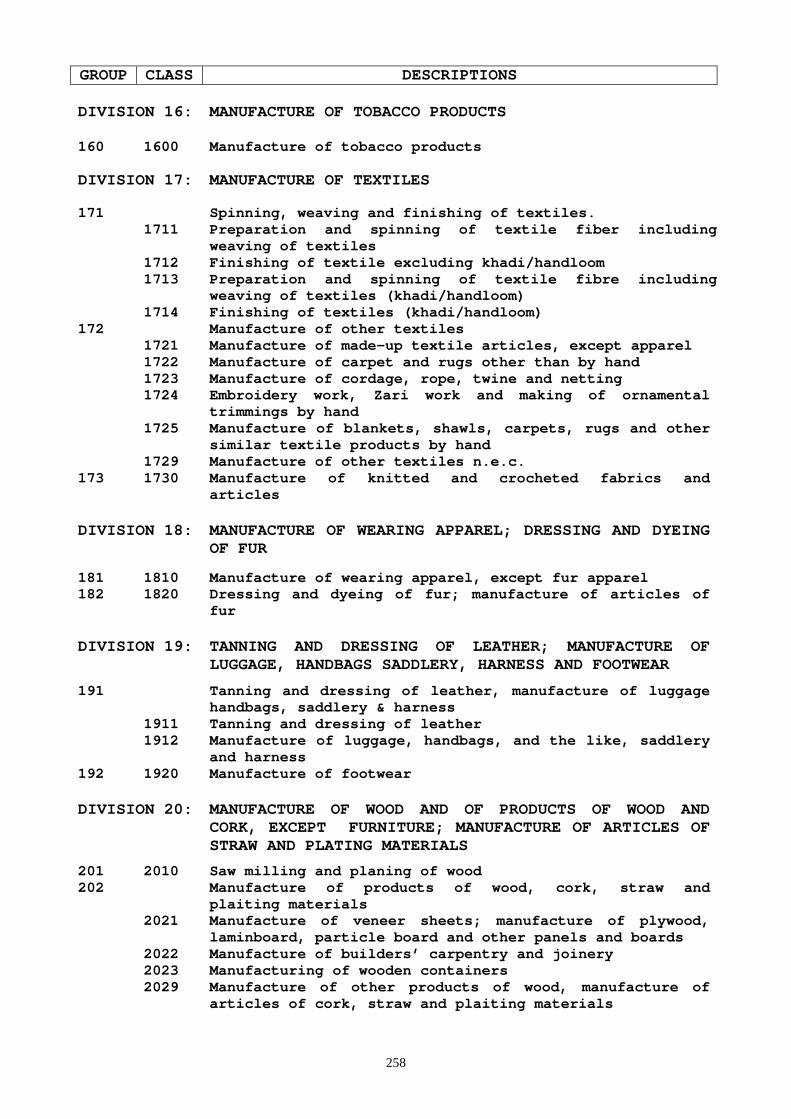
258
GROUP CLASS DESCRIPTIONS
DIVISION 16: MANUFACTURE OF TOBACCO PRODUCTS
160 1600 Manufacture of tobacco products
DIVISION 17: MANUFACTURE OF TEXTILES
171 Spinning, weaving and finishing of textiles. 1711 Preparation and spinning of textile fiber including
weaving of textiles 1712 Finishing of textile excluding khadi/handloom 1713 Preparation and spinning of textile fibre including
weaving of textiles (khadi/handloom) 1714 Finishing of textiles (khadi/handloom) 172 Manufacture of other textiles 1721 Manufacture of made-up textile articles, except apparel 1722 Manufacture of carpet and rugs other than by hand 1723 Manufacture of cordage, rope, twine and netting 1724 Embroidery work, Zari work and making of ornamental
trimmings by hand 1725 Manufacture of blankets, shawls, carpets, rugs and other
similar textile products by hand 1729 Manufacture of other textiles n.e.c. 173 1730 Manufacture of knitted and crocheted fabrics and
articles DIVISION 18:
MANUFACTURE OF WEARING APPAREL; DRESSING AND DYEING OF FUR
181 1810 Manufacture of wearing apparel, except fur apparel 182 1820 Dressing and dyeing of fur; manufacture of articles of
fur DIVISION 19:
TANNING AND DRESSING OF LEATHER; MANUFACTURE OF LUGGAGE, HANDBAGS SADDLERY, HARNESS AND FOOTWEAR
191 Tanning and dressing of leather, manufacture of luggage handbags, saddlery & harness
1911 Tanning and dressing of leather 1912 Manufacture of luggage, handbags, and the like, saddlery
and harness 192 1920 Manufacture of footwear DIVISION 20:
MANUFACTURE OF WOOD AND OF PRODUCTS OF WOOD AND CORK, EXCEPT FURNITURE; MANUFACTURE OF ARTICLES OF STRAW AND PLATING MATERIALS
201 2010 Saw milling and planing of wood 202 Manufacture of products of wood, cork, straw and
plaiting materials 2021 Manufacture of veneer sheets; manufacture of plywood,
laminboard, particle board and other panels and boards 2022 Manufacture of builders’ carpentry and joinery 2023 Manufacturing of wooden containers 2029 Manufacture of other products of wood, manufacture of
articles of cork, straw and plaiting materials
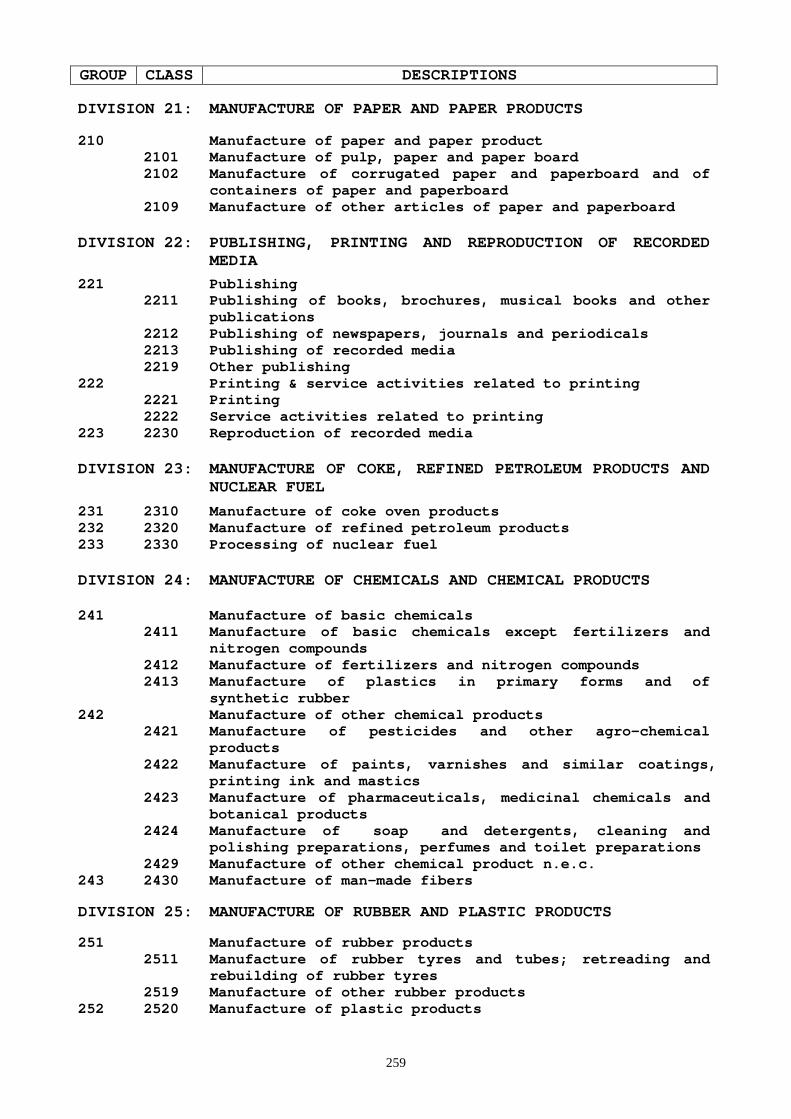
259
GROUP CLASS DESCRIPTIONS
DIVISION 21: MANUFACTURE OF PAPER AND PAPER PRODUCTS
210 Manufacture of paper and paper product 2101 Manufacture of pulp, paper and paper board 2102 Manufacture of corrugated paper and paperboard and of
containers of paper and paperboard 2109 Manufacture of other articles of paper and paperboard DIVISION 22:
PUBLISHING, PRINTING AND REPRODUCTION OF RECORDED MEDIA
221 Publishing 2211 Publishing of books, brochures, musical books and other
publications 2212 Publishing of newspapers, journals and periodicals 2213 Publishing of recorded media 2219 Other publishing 222 Printing & service activities related to printing 2221 Printing 2222 Service activities related to printing 223 2230 Reproduction of recorded media DIVISION 23:
MANUFACTURE OF COKE, REFINED PETROLEUM PRODUCTS AND NUCLEAR FUEL
231 2310 Manufacture of coke oven products 232 2320 Manufacture of refined petroleum products 233 2330 Processing of nuclear fuel DIVISION 24:
MANUFACTURE OF CHEMICALS AND CHEMICAL PRODUCTS
241 Manufacture of basic chemicals 2411 Manufacture of basic chemicals except fertilizers and
nitrogen compounds 2412 Manufacture of fertilizers and nitrogen compounds 2413 Manufacture of plastics in primary forms and of
synthetic rubber 242 Manufacture of other chemical products 2421 Manufacture of pesticides and other agro-chemical
products 2422 Manufacture of paints, varnishes and similar coatings,
printing ink and mastics 2423 Manufacture of pharmaceuticals, medicinal chemicals and
botanical products 2424 Manufacture of soap and detergents, cleaning and
polishing preparations, perfumes and toilet preparations 2429 Manufacture of other chemical product n.e.c. 243 2430 Manufacture of man-made fibers
DIVISION 25: MANUFACTURE OF RUBBER AND PLASTIC PRODUCTS
251 Manufacture of rubber products 2511 Manufacture of rubber tyres and tubes; retreading and
rebuilding of rubber tyres 2519 Manufacture of other rubber products 252 2520 Manufacture of plastic products
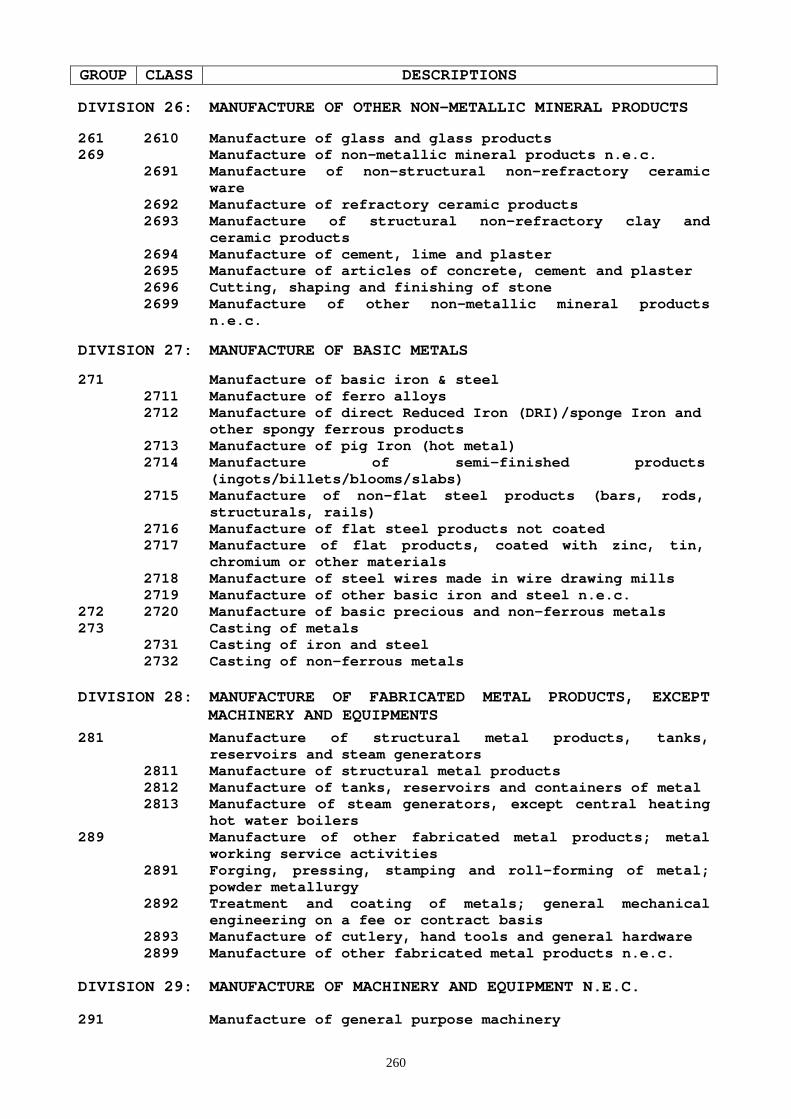
260
GROUP CLASS DESCRIPTIONS
DIVISION 26: MANUFACTURE OF OTHER NON-METALLIC MINERAL PRODUCTS
261 2610 Manufacture of glass and glass products 269 Manufacture of non-metallic mineral products n.e.c. 2691 Manufacture of non-structural non-refractory ceramic
ware 2692 Manufacture of refractory ceramic products 2693 Manufacture of structural non-refractory clay and
ceramic products 2694 Manufacture of cement, lime and plaster 2695 Manufacture of articles of concrete, cement and plaster 2696 Cutting, shaping and finishing of stone 2699 Manufacture of other non-metallic mineral products
n.e.c.
DIVISION 27: MANUFACTURE OF BASIC METALS
271 Manufacture of basic iron & steel 2711 Manufacture of ferro alloys 2712 Manufacture of direct Reduced Iron (DRI)/sponge Iron and
other spongy ferrous products 2713 Manufacture of pig Iron (hot metal) 2714 Manufacture of semi-finished products
(ingots/billets/blooms/slabs) 2715 Manufacture of non-flat steel products (bars, rods,
structurals, rails) 2716 Manufacture of flat steel products not coated 2717 Manufacture of flat products, coated with zinc, tin,
chromium or other materials 2718 Manufacture of steel wires made in wire drawing mills 2719 Manufacture of other basic iron and steel n.e.c. 272 2720 Manufacture of basic precious and non-ferrous metals 273 Casting of metals 2731 Casting of iron and steel 2732 Casting of non-ferrous metals DIVISION 28:
MANUFACTURE OF FABRICATED METAL PRODUCTS, EXCEPT MACHINERY AND EQUIPMENTS
281 Manufacture of structural metal products, tanks, reservoirs and steam generators
2811 Manufacture of structural metal products 2812 Manufacture of tanks, reservoirs and containers of metal 2813 Manufacture of steam generators, except central heating
hot water boilers 289 Manufacture of other fabricated metal products; metal
working service activities 2891 Forging, pressing, stamping and roll-forming of metal;
powder metallurgy 2892 Treatment and coating of metals; general mechanical
engineering on a fee or contract basis 2893 Manufacture of cutlery, hand tools and general hardware 2899 Manufacture of other fabricated metal products n.e.c.
DIVISION 29: MANUFACTURE OF MACHINERY AND EQUIPMENT N.E.C.
291 Manufacture of general purpose machinery
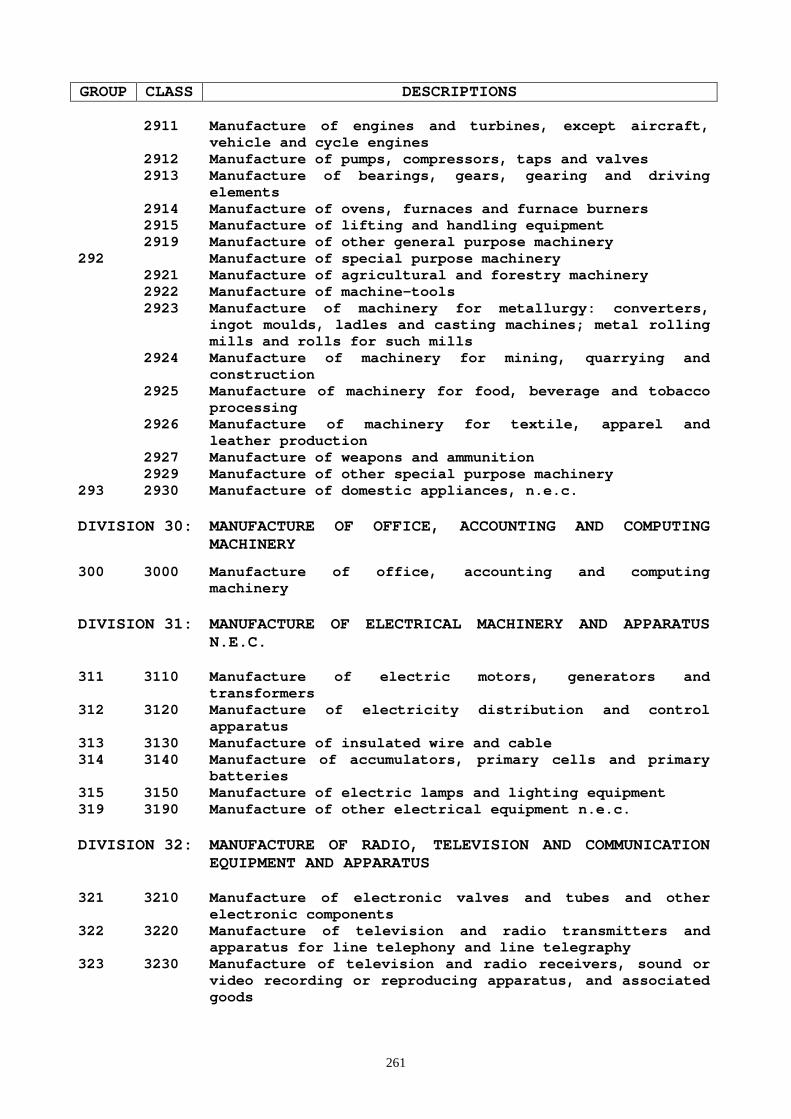
261
GROUP CLASS DESCRIPTIONS 2911 Manufacture of engines and turbines, except aircraft,
vehicle and cycle engines 2912 Manufacture of pumps, compressors, taps and valves 2913 Manufacture of bearings, gears, gearing and driving
elements 2914 Manufacture of ovens, furnaces and furnace burners 2915 Manufacture of lifting and handling equipment 2919 Manufacture of other general purpose machinery 292 Manufacture of special purpose machinery 2921 Manufacture of agricultural and forestry machinery 2922 Manufacture of machine-tools 2923 Manufacture of machinery for metallurgy: converters,
ingot moulds, ladles and casting machines; metal rolling mills and rolls for such mills
2924 Manufacture of machinery for mining, quarrying and construction
2925 Manufacture of machinery for food, beverage and tobacco processing
2926 Manufacture of machinery for textile, apparel and leather production
2927 Manufacture of weapons and ammunition 2929 Manufacture of other special purpose machinery 293 2930 Manufacture of domestic appliances, n.e.c. DIVISION 30:
MANUFACTURE OF OFFICE, ACCOUNTING AND COMPUTING MACHINERY
300 3000 Manufacture of office, accounting and computing machinery
DIVISION 31:
MANUFACTURE OF ELECTRICAL MACHINERY AND APPARATUS N.E.C.
311 3110 Manufacture of electric motors, generators and transformers
312 3120 Manufacture of electricity distribution and control apparatus
313 3130 Manufacture of insulated wire and cable 314 3140 Manufacture of accumulators, primary cells and primary
batteries 315 3150 Manufacture of electric lamps and lighting equipment 319 3190 Manufacture of other electrical equipment n.e.c. DIVISION 32:
MANUFACTURE OF RADIO, TELEVISION AND COMMUNICATION EQUIPMENT AND APPARATUS
321 3210 Manufacture of electronic valves and tubes and other electronic components
322 3220 Manufacture of television and radio transmitters and apparatus for line telephony and line telegraphy
323 3230 Manufacture of television and radio receivers, sound or video recording or reproducing apparatus, and associated goods
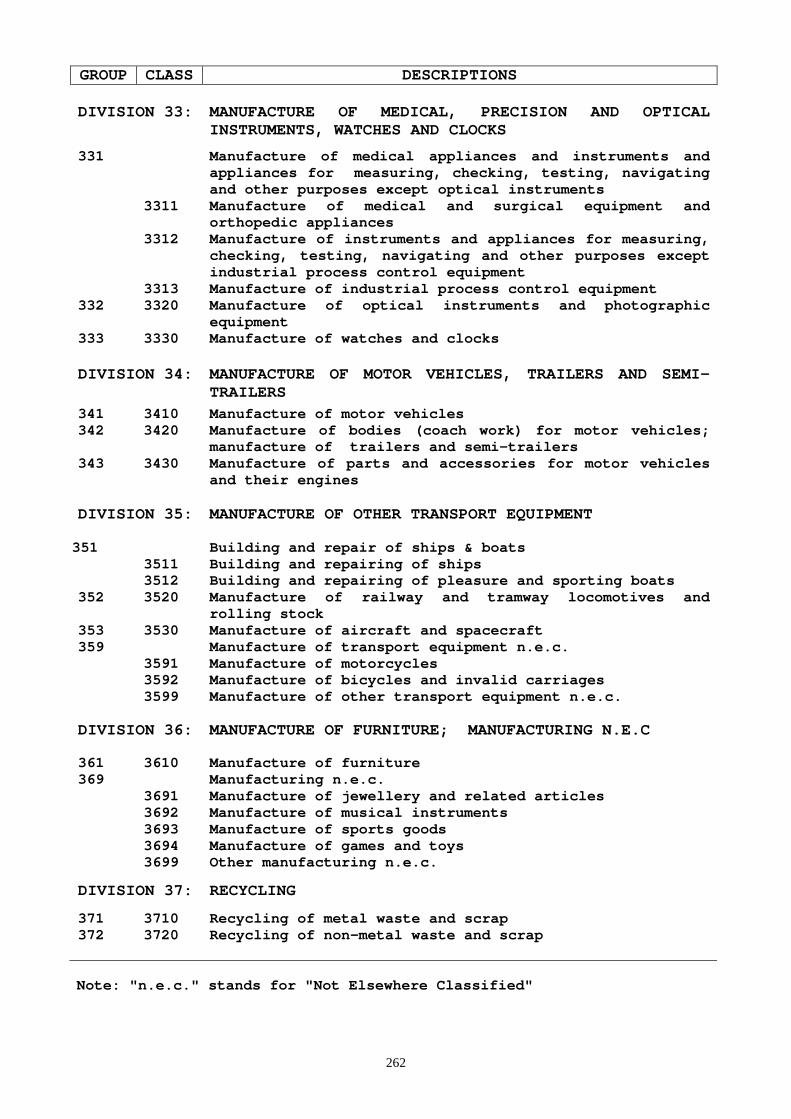
262
GROUP CLASS DESCRIPTIONS DIVISION 33:
MANUFACTURE OF MEDICAL, PRECISION AND OPTICAL INSTRUMENTS, WATCHES AND CLOCKS
331 Manufacture of medical appliances and instruments and appliances for measuring, checking, testing, navigating and other purposes except optical instruments
3311 Manufacture of medical and surgical equipment and orthopedic appliances
3312 Manufacture of instruments and appliances for measuring, checking, testing, navigating and other purposes except industrial process control equipment
3313 Manufacture of industrial process control equipment 332 3320 Manufacture of optical instruments and photographic
equipment 333 3330 Manufacture of watches and clocks DIVISION 34:
MANUFACTURE OF MOTOR VEHICLES, TRAILERS AND SEMI-TRAILERS
341 3410 Manufacture of motor vehicles 342 3420 Manufacture of bodies (coach work) for motor vehicles;
manufacture of trailers and semi-trailers 343 3430 Manufacture of parts and accessories for motor vehicles
and their engines
DIVISION 35: MANUFACTURE OF OTHER TRANSPORT EQUIPMENT
351 Building and repair of ships & boats 3511 Building and repairing of ships 3512 Building and repairing of pleasure and sporting boats 352 3520 Manufacture of railway and tramway locomotives and
rolling stock 353 3530 Manufacture of aircraft and spacecraft 359 Manufacture of transport equipment n.e.c. 3591 Manufacture of motorcycles 3592 Manufacture of bicycles and invalid carriages 3599 Manufacture of other transport equipment n.e.c.
DIVISION 36: MANUFACTURE OF FURNITURE; MANUFACTURING N.E.C
361 3610 Manufacture of furniture 369 Manufacturing n.e.c. 3691 Manufacture of jewellery and related articles 3692 Manufacture of musical instruments 3693 Manufacture of sports goods 3694 Manufacture of games and toys 3699 Other manufacturing n.e.c.
DIVISION 37: RECYCLING
371 3710 Recycling of metal waste and scrap 372 3720 Recycling of non-metal waste and scrap Note: "n.e.c." stands for "Not Elsewhere Classified"
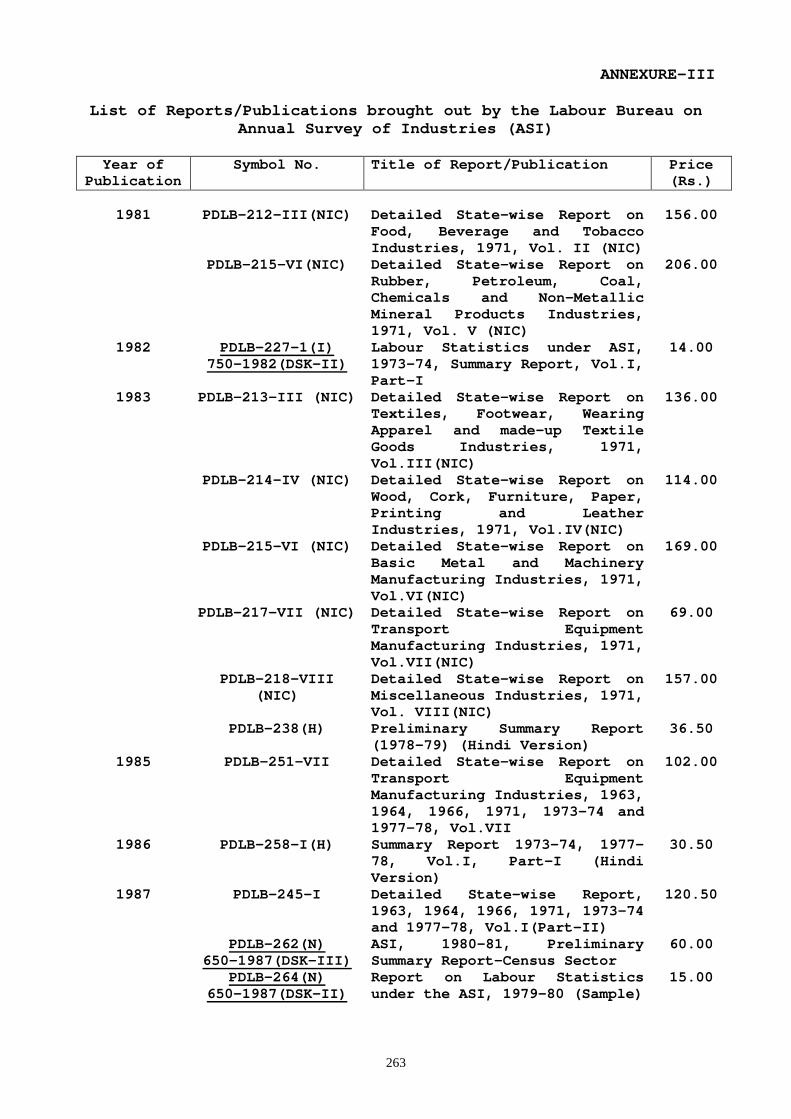
263
ANNEXURE-III List of Reports/Publications brought out by the Labour Bureau on
Annual Survey of Industries (ASI)
Year of Publication
Symbol No. Title of Report/Publication Price (Rs.)
1981 PDLB-212-III(NIC) Detailed State-wise Report on
Food, Beverage and Tobacco Industries, 1971, Vol. II (NIC)
156.00
PDLB-215-VI(NIC) Detailed State-wise Report on Rubber, Petroleum, Coal, Chemicals and Non-Metallic Mineral Products Industries, 1971, Vol. V (NIC)
206.00
1982 PDLB-227-1(I) 750-1982(DSK-II)
Labour Statistics under ASI, 1973-74, Summary Report, Vol.I, Part-I
14.00
1983 PDLB-213-III (NIC) Detailed State-wise Report on Textiles, Footwear, Wearing Apparel and made-up Textile Goods Industries, 1971, Vol.III(NIC)
136.00
PDLB-214-IV (NIC) Detailed State-wise Report on Wood, Cork, Furniture, Paper, Printing and Leather Industries, 1971, Vol.IV(NIC)
114.00
PDLB-215-VI (NIC) Detailed State-wise Report on Basic Metal and Machinery Manufacturing Industries, 1971, Vol.VI(NIC)
169.00
PDLB-217-VII (NIC) Detailed State-wise Report on Transport Equipment Manufacturing Industries, 1971, Vol.VII(NIC)
69.00
PDLB-218-VIII (NIC)
Detailed State-wise Report on Miscellaneous Industries, 1971, Vol. VIII(NIC)
157.00
PDLB-238(H) Preliminary Summary Report (1978-79) (Hindi Version)
36.50
1985 PDLB-251-VII Detailed State-wise Report on Transport Equipment Manufacturing Industries, 1963, 1964, 1966, 1971, 1973-74 and 1977-78, Vol.VII
102.00
1986 PDLB-258-I(H) Summary Report 1973-74, 1977-78, Vol.I, Part-I (Hindi Version)
30.50
1987 PDLB-245-I Detailed State-wise Report, 1963, 1964, 1966, 1971, 1973-74 and 1977-78, Vol.I(Part-II)
120.50
PDLB-262(N) 650-1987(DSK-III)
ASI, 1980-81, Preliminary Summary Report-Census Sector
60.00
PDLB-264(N) 650-1987(DSK-II)
Report on Labour Statistics under the ASI, 1979-80 (Sample)
15.00
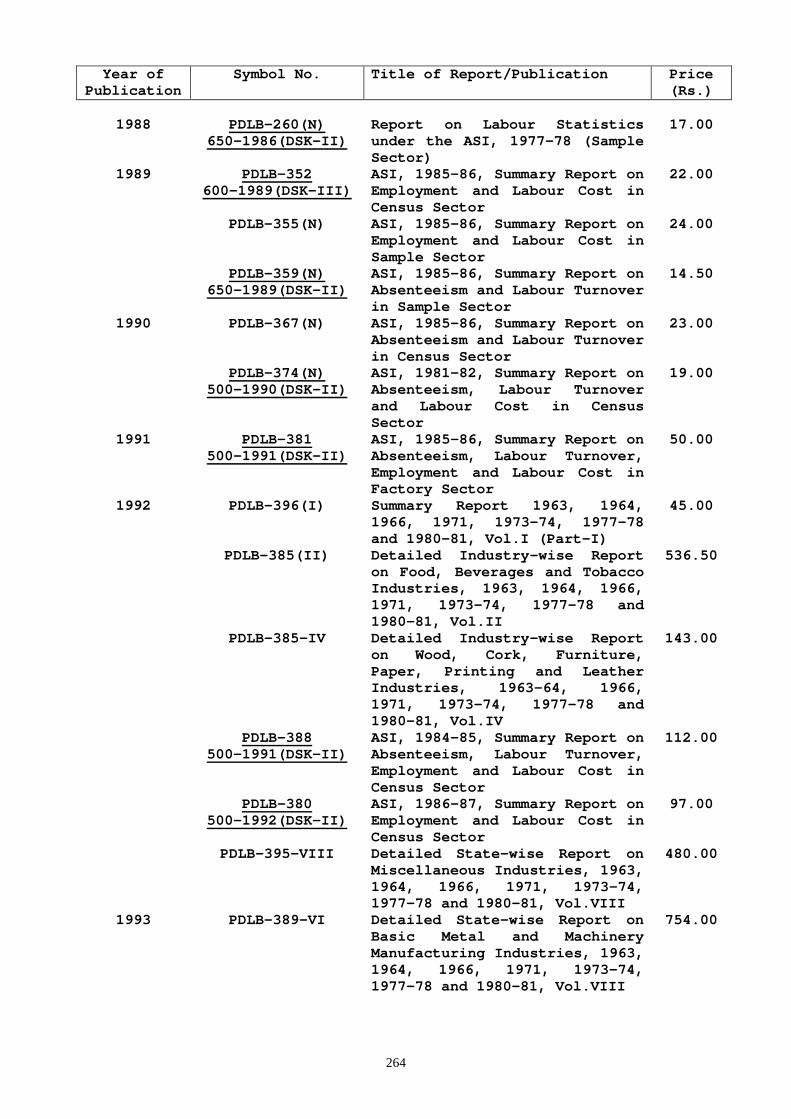
264
Year of Publication
Symbol No. Title of Report/Publication Price (Rs.)
1988 PDLB-260(N)
650-1986(DSK-II) Report on Labour Statistics under the ASI, 1977-78 (Sample Sector)
17.00
1989 PDLB-352 600-1989(DSK-III)
ASI, 1985-86, Summary Report on Employment and Labour Cost in Census Sector
22.00
PDLB-355(N) ASI, 1985-86, Summary Report on Employment and Labour Cost in Sample Sector
24.00
PDLB-359(N) 650-1989(DSK-II)
ASI, 1985-86, Summary Report on Absenteeism and Labour Turnover in Sample Sector
14.50
1990 PDLB-367(N) ASI, 1985-86, Summary Report on Absenteeism and Labour Turnover in Census Sector
23.00
PDLB-374(N) 500-1990(DSK-II)
ASI, 1981-82, Summary Report on Absenteeism, Labour Turnover and Labour Cost in Census Sector
19.00
1991 PDLB-381 500-1991(DSK-II)
ASI, 1985-86, Summary Report on Absenteeism, Labour Turnover, Employment and Labour Cost in Factory Sector
50.00
1992 PDLB-396(I) Summary Report 1963, 1964, 1966, 1971, 1973-74, 1977-78 and 1980-81, Vol.I (Part-I)
45.00
PDLB-385(II) Detailed Industry-wise Report on Food, Beverages and Tobacco Industries, 1963, 1964, 1966, 1971, 1973-74, 1977-78 and 1980-81, Vol.II
536.50
PDLB-385-IV Detailed Industry-wise Report on Wood, Cork, Furniture, Paper, Printing and Leather Industries, 1963-64, 1966, 1971, 1973-74, 1977-78 and 1980-81, Vol.IV
143.00
PDLB-388 500-1991(DSK-II)
ASI, 1984-85, Summary Report on Absenteeism, Labour Turnover, Employment and Labour Cost in Census Sector
112.00
PDLB-380 500-1992(DSK-II)
ASI, 1986-87, Summary Report on Employment and Labour Cost in Census Sector
97.00
PDLB-395-VIII Detailed State-wise Report on Miscellaneous Industries, 1963, 1964, 1966, 1971, 1973-74, 1977-78 and 1980-81, Vol.VIII
480.00
1993 PDLB-389-VI Detailed State-wise Report on Basic Metal and Machinery Manufacturing Industries, 1963, 1964, 1966, 1971, 1973-74, 1977-78 and 1980-81, Vol.VIII
754.00
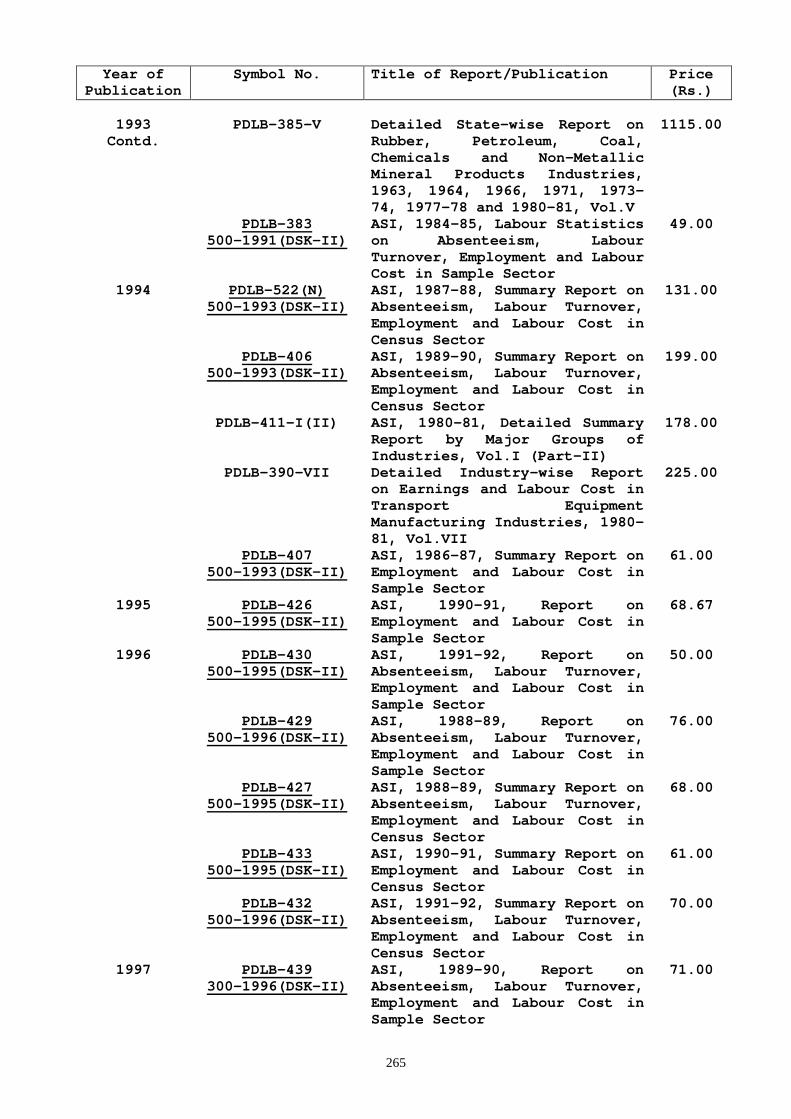
265
Year of Publication
Symbol No. Title of Report/Publication Price (Rs.)
1993 Contd.
PDLB-385-V Detailed State-wise Report on Rubber, Petroleum, Coal, Chemicals and Non-Metallic Mineral Products Industries, 1963, 1964, 1966, 1971, 1973-74, 1977-78 and 1980-81, Vol.V
1115.00
PDLB-383 500-1991(DSK-II)
ASI, 1984-85, Labour Statistics on Absenteeism, Labour Turnover, Employment and Labour Cost in Sample Sector
49.00
1994 PDLB-522(N) 500-1993(DSK-II)
ASI, 1987-88, Summary Report on Absenteeism, Labour Turnover, Employment and Labour Cost in Census Sector
131.00
PDLB-406 500-1993(DSK-II)
ASI, 1989-90, Summary Report on Absenteeism, Labour Turnover, Employment and Labour Cost in Census Sector
199.00
PDLB-411-I(II) ASI, 1980-81, Detailed Summary Report by Major Groups of Industries, Vol.I (Part-II)
178.00
PDLB-390-VII Detailed Industry-wise Report on Earnings and Labour Cost in Transport Equipment Manufacturing Industries, 1980-81, Vol.VII
225.00
PDLB-407 500-1993(DSK-II)
ASI, 1986-87, Summary Report on Employment and Labour Cost in Sample Sector
61.00
1995 PDLB-426 500-1995(DSK-II)
ASI, 1990-91, Report on Employment and Labour Cost in Sample Sector
68.67
1996 PDLB-430 500-1995(DSK-II)
ASI, 1991-92, Report on Absenteeism, Labour Turnover, Employment and Labour Cost in Sample Sector
50.00
PDLB-429 500-1996(DSK-II)
ASI, 1988-89, Report on Absenteeism, Labour Turnover, Employment and Labour Cost in Sample Sector
76.00
PDLB-427 500-1995(DSK-II)
ASI, 1988-89, Summary Report on Absenteeism, Labour Turnover, Employment and Labour Cost in Census Sector
68.00
PDLB-433 500-1995(DSK-II)
ASI, 1990-91, Summary Report on Employment and Labour Cost in Census Sector
61.00
PDLB-432 500-1996(DSK-II)
ASI, 1991-92, Summary Report on Absenteeism, Labour Turnover, Employment and Labour Cost in Census Sector
70.00
1997 PDLB-439 300-1996(DSK-II)
ASI, 1989-90, Report on Absenteeism, Labour Turnover, Employment and Labour Cost in Sample Sector
71.00
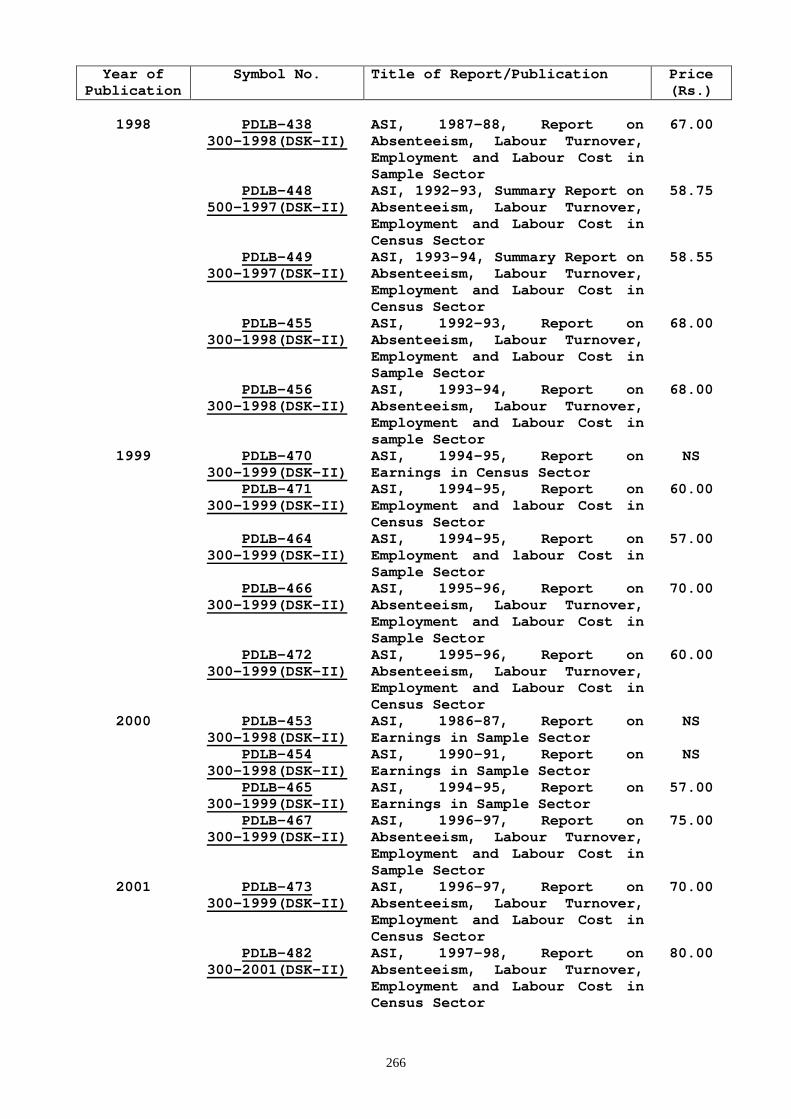
266
Year of Publication
Symbol No. Title of Report/Publication Price (Rs.)
1998 PDLB-438
300-1998(DSK-II) ASI, 1987-88, Report on Absenteeism, Labour Turnover, Employment and Labour Cost in Sample Sector
67.00
PDLB-448 500-1997(DSK-II)
ASI, 1992-93, Summary Report on Absenteeism, Labour Turnover, Employment and Labour Cost in Census Sector
58.75
PDLB-449 300-1997(DSK-II)
ASI, 1993-94, Summary Report on Absenteeism, Labour Turnover, Employment and Labour Cost in Census Sector
58.55
PDLB-455 300-1998(DSK-II)
ASI, 1992-93, Report on Absenteeism, Labour Turnover, Employment and Labour Cost in Sample Sector
68.00
PDLB-456 300-1998(DSK-II)
ASI, 1993-94, Report on Absenteeism, Labour Turnover, Employment and Labour Cost in sample Sector
68.00
1999 PDLB-470 300-1999(DSK-II)
ASI, 1994-95, Report on Earnings in Census Sector
NS
PDLB-471 300-1999(DSK-II)
ASI, 1994-95, Report on Employment and labour Cost in Census Sector
60.00
PDLB-464 300-1999(DSK-II)
ASI, 1994-95, Report on Employment and labour Cost in Sample Sector
57.00
PDLB-466 300-1999(DSK-II)
ASI, 1995-96, Report on Absenteeism, Labour Turnover, Employment and Labour Cost in Sample Sector
70.00
PDLB-472 300-1999(DSK-II)
ASI, 1995-96, Report on Absenteeism, Labour Turnover, Employment and Labour Cost in Census Sector
60.00
2000 PDLB-453 300-1998(DSK-II)
ASI, 1986-87, Report on Earnings in Sample Sector
NS
PDLB-454 300-1998(DSK-II)
ASI, 1990-91, Report on Earnings in Sample Sector
NS
PDLB-465 300-1999(DSK-II)
ASI, 1994-95, Report on Earnings in Sample Sector
57.00
PDLB-467 300-1999(DSK-II)
ASI, 1996-97, Report on Absenteeism, Labour Turnover, Employment and Labour Cost in Sample Sector
75.00
2001 PDLB-473 300-1999(DSK-II)
ASI, 1996-97, Report on Absenteeism, Labour Turnover, Employment and Labour Cost in Census Sector
70.00
PDLB-482 300-2001(DSK-II)
ASI, 1997-98, Report on Absenteeism, Labour Turnover, Employment and Labour Cost in Census Sector
80.00
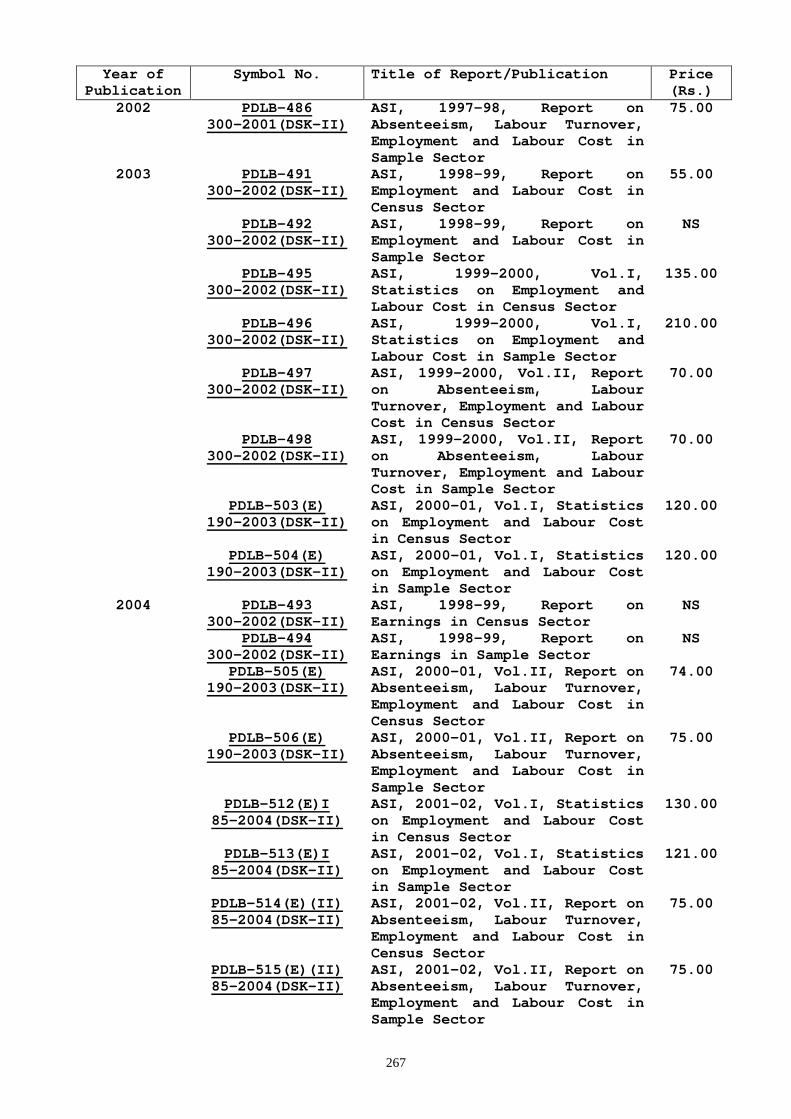
267
Year of Publication
Symbol No. Title of Report/Publication Price (Rs.)
2002 PDLB-486 300-2001(DSK-II)
ASI, 1997-98, Report on Absenteeism, Labour Turnover, Employment and Labour Cost in Sample Sector
75.00
2003 PDLB-491 300-2002(DSK-II)
ASI, 1998-99, Report on Employment and Labour Cost in Census Sector
55.00
PDLB-492 300-2002(DSK-II)
ASI, 1998-99, Report on Employment and Labour Cost in Sample Sector
NS
PDLB-495 300-2002(DSK-II)
ASI, 1999-2000, Vol.I, Statistics on Employment and Labour Cost in Census Sector
135.00
PDLB-496 300-2002(DSK-II)
ASI, 1999-2000, Vol.I, Statistics on Employment and Labour Cost in Sample Sector
210.00
PDLB-497 300-2002(DSK-II)
ASI, 1999-2000, Vol.II, Report on Absenteeism, Labour Turnover, Employment and Labour Cost in Census Sector
70.00
PDLB-498 300-2002(DSK-II)
ASI, 1999-2000, Vol.II, Report on Absenteeism, Labour Turnover, Employment and Labour Cost in Sample Sector
70.00
PDLB-503(E) 190-2003(DSK-II)
ASI, 2000-01, Vol.I, Statistics on Employment and Labour Cost in Census Sector
120.00
PDLB-504(E) 190-2003(DSK-II)
ASI, 2000-01, Vol.I, Statistics on Employment and Labour Cost in Sample Sector
120.00
2004 PDLB-493 300-2002(DSK-II)
ASI, 1998-99, Report on Earnings in Census Sector
NS
PDLB-494 300-2002(DSK-II)
ASI, 1998-99, Report on Earnings in Sample Sector
NS
PDLB-505(E) 190-2003(DSK-II)
ASI, 2000-01, Vol.II, Report on Absenteeism, Labour Turnover, Employment and Labour Cost in Census Sector
74.00
PDLB-506(E) 190-2003(DSK-II)
ASI, 2000-01, Vol.II, Report on Absenteeism, Labour Turnover, Employment and Labour Cost in Sample Sector
75.00
PDLB-512(E)I 85-2004(DSK-II)
ASI, 2001-02, Vol.I, Statistics on Employment and Labour Cost in Census Sector
130.00
PDLB-513(E)I 85-2004(DSK-II)
ASI, 2001-02, Vol.I, Statistics on Employment and Labour Cost in Sample Sector
121.00
PDLB-514(E)(II) 85-2004(DSK-II)
ASI, 2001-02, Vol.II, Report on Absenteeism, Labour Turnover, Employment and Labour Cost in Census Sector
75.00
PDLB-515(E)(II) 85-2004(DSK-II)
ASI, 2001-02, Vol.II, Report on Absenteeism, Labour Turnover, Employment and Labour Cost in Sample Sector
75.00
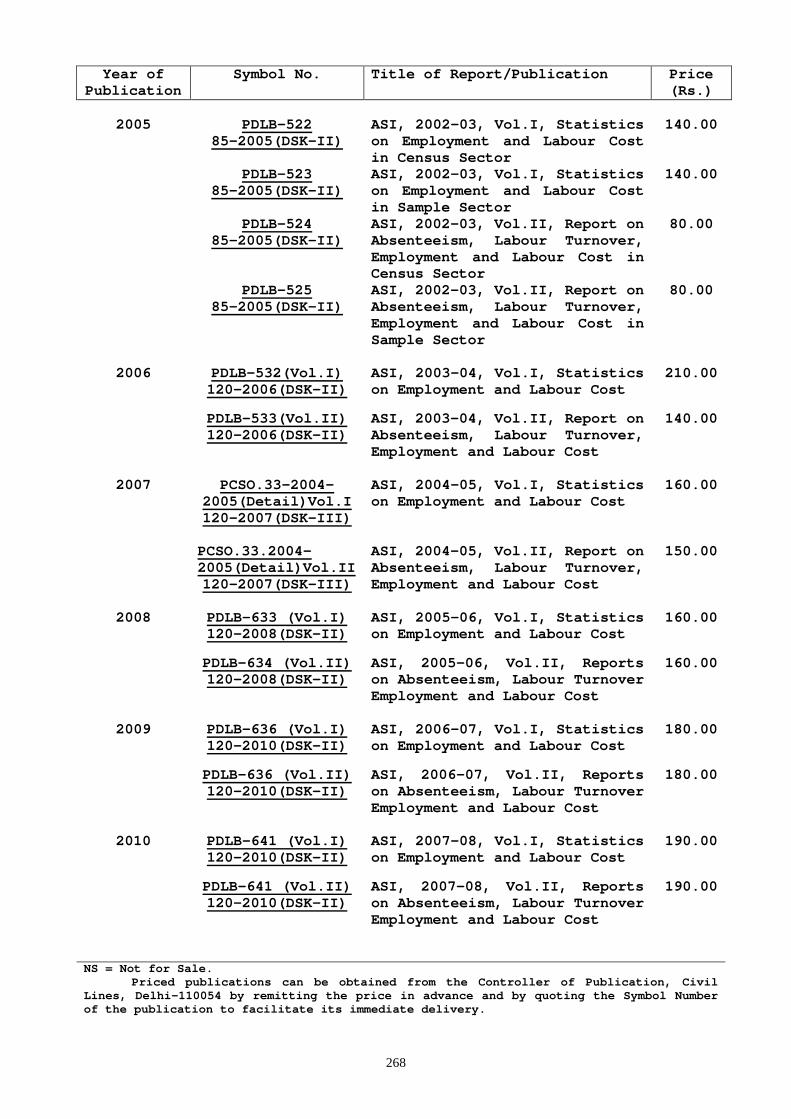
268
Year of Publication
Symbol No. Title of Report/Publication Price (Rs.)
2005 PDLB-522
85-2005(DSK-II) ASI, 2002-03, Vol.I, Statistics on Employment and Labour Cost in Census Sector
140.00
PDLB-523 85-2005(DSK-II)
ASI, 2002-03, Vol.I, Statistics on Employment and Labour Cost in Sample Sector
140.00
PDLB-524 85-2005(DSK-II)
ASI, 2002-03, Vol.II, Report on Absenteeism, Labour Turnover, Employment and Labour Cost in Census Sector
80.00
PDLB-525 85-2005(DSK-II)
ASI, 2002-03, Vol.II, Report on Absenteeism, Labour Turnover, Employment and Labour Cost in Sample Sector
80.00
2006 PDLB-532(Vol.I) 120-2006(DSK-II)
ASI, 2003-04, Vol.I, Statistics on Employment and Labour Cost
210.00
PDLB-533(Vol.II) 120-2006(DSK-II)
ASI, 2003-04, Vol.II, Report on Absenteeism, Labour Turnover, Employment and Labour Cost
140.00
2007 PCSO.33-2004-2005(Detail)Vol.I 120-2007(DSK-III)
ASI, 2004-05, Vol.I, Statistics on Employment and Labour Cost
160.00
PCSO.33.2004-2005(Detail)Vol.II 120-2007(DSK-III)
ASI, 2004-05, Vol.II, Report on Absenteeism, Labour Turnover, Employment and Labour Cost
150.00
2008 PDLB-633 (Vol.I) 120-2008(DSK-II)
ASI, 2005-06, Vol.I, Statistics on Employment and Labour Cost
160.00
PDLB-634 (Vol.II) 120-2008(DSK-II)
ASI, 2005-06, Vol.II, Reports on Absenteeism, Labour Turnover Employment and Labour Cost
160.00
2009 PDLB-636 (Vol.I) 120-2010(DSK-II)
ASI, 2006-07, Vol.I, Statistics on Employment and Labour Cost
180.00
PDLB-636 (Vol.II) 120-2010(DSK-II)
ASI, 2006-07, Vol.II, Reports on Absenteeism, Labour Turnover Employment and Labour Cost
180.00
2010 PDLB-641 (Vol.I) 120-2010(DSK-II)
ASI, 2007-08, Vol.I, Statistics on Employment and Labour Cost
190.00
PDLB-641 (Vol.II) 120-2010(DSK-II)
ASI, 2007-08, Vol.II, Reports on Absenteeism, Labour Turnover Employment and Labour Cost
190.00
NS = Not for Sale.
Priced publications can be obtained from the Controller of Publication, Civil Lines, Delhi-110054 by remitting the price in advance and by quoting the Symbol Number of the publication to facilitate its immediate delivery.
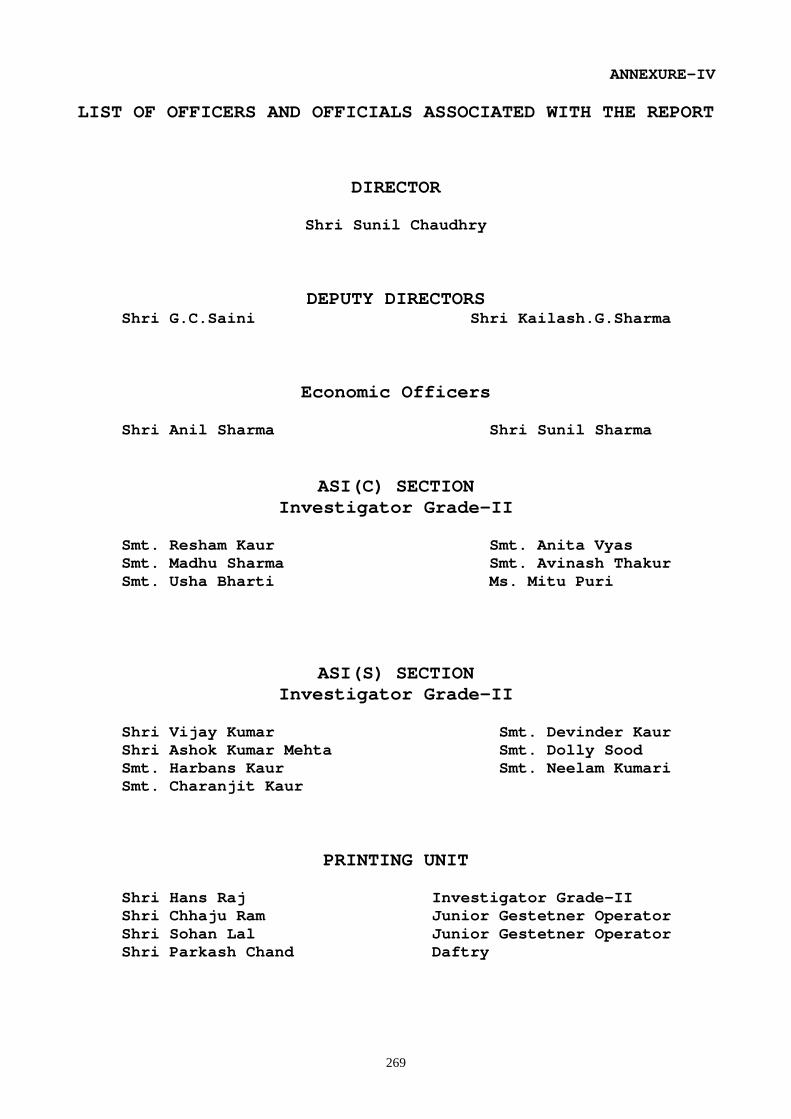
269
ANNEXURE-IV LIST OF OFFICERS AND OFFICIALS ASSOCIATED WITH THE REPORT
DIRECTOR
Shri Sunil Chaudhry
DEPUTY DIRECTORS Shri G.C.Saini Shri Kailash.G.Sharma
Economic Officers
Shri Anil Sharma Shri Sunil Sharma
ASI(C) SECTION Investigator Grade-II
Smt. Resham Kaur Smt. Anita Vyas Smt. Madhu Sharma Smt. Avinash Thakur Smt. Usha Bharti Ms. Mitu Puri
ASI(S) SECTION Investigator Grade-II
Shri Vijay Kumar Smt. Devinder Kaur Shri Ashok Kumar Mehta Smt. Dolly Sood Smt. Harbans Kaur Smt. Neelam Kumari Smt. Charanjit Kaur
PRINTING UNIT
Shri Hans Raj Investigator Grade-II Shri Chhaju Ram Junior Gestetner Operator Shri Sohan Lal Junior Gestetner Operator Shri Parkash Chand Daftry
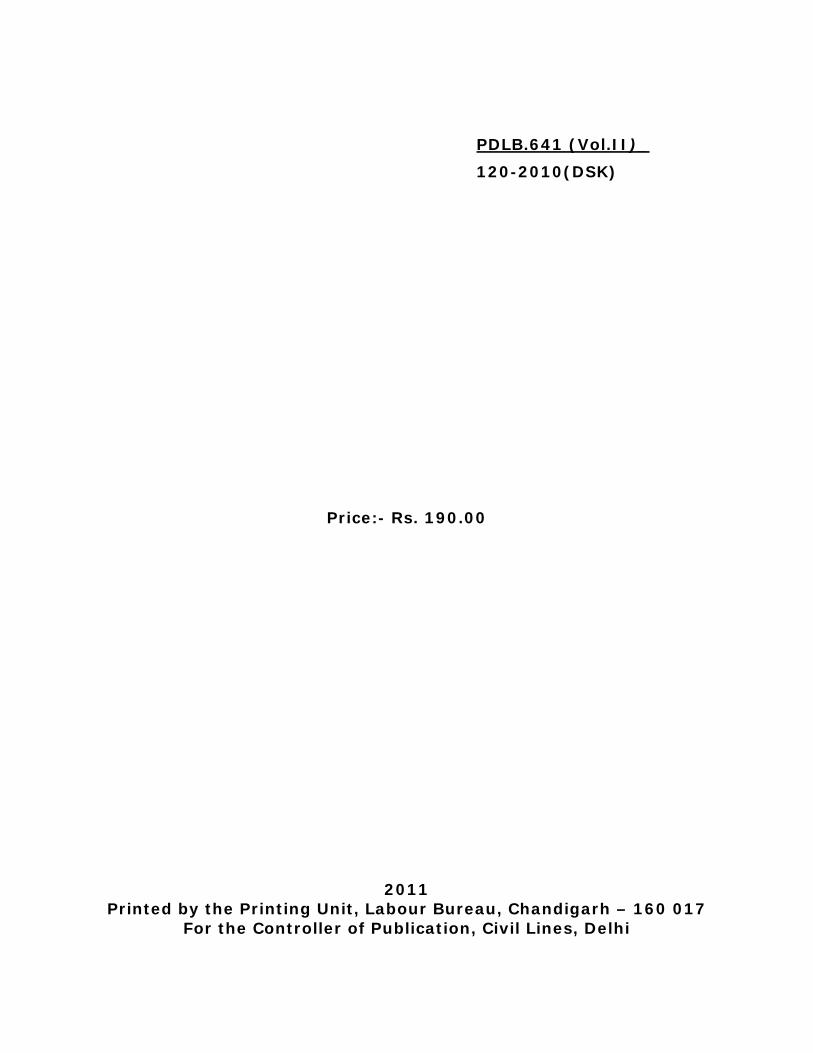
PDLB.641 (Vol.II)_ 120-2010(DSK)
Price:- Rs. 190.00
2011 Printed by the Printing Unit, Labour Bureau, Chandigarh – 160 017
For the Controller of Publication, Civil Lines, Delhi
Related Documents