This article appeared in a journal published by Elsevier. The attached copy is furnished to the author for internal non-commercial research and education use, including for instruction at the authors institution and sharing with colleagues. Other uses, including reproduction and distribution, or selling or licensing copies, or posting to personal, institutional or third party websites are prohibited. In most cases authors are permitted to post their version of the article (e.g. in Word or Tex form) to their personal website or institutional repository. Authors requiring further information regarding Elsevier’s archiving and manuscript policies are encouraged to visit: http://www.elsevier.com/copyright

Welcome message from author
This document is posted to help you gain knowledge. Please leave a comment to let me know what you think about it! Share it to your friends and learn new things together.
Transcript

This article appeared in a journal published by Elsevier. The attachedcopy is furnished to the author for internal non-commercial researchand education use, including for instruction at the authors institution
and sharing with colleagues.
Other uses, including reproduction and distribution, or selling orlicensing copies, or posting to personal, institutional or third party
websites are prohibited.
In most cases authors are permitted to post their version of thearticle (e.g. in Word or Tex form) to their personal website orinstitutional repository. Authors requiring further information
regarding Elsevier’s archiving and manuscript policies areencouraged to visit:
http://www.elsevier.com/copyright

Author's personal copy
Above- and belowground nutrients storage and biomass accumulation in
marginal Nothofagus antarctica forests in Southern Patagonia
Pablo L. Peri a,c,*, Veronica Gargaglione a, Guillermo Martınez Pastur b,c
a INTA EEA-Santa Cruz – UNPA – cc 332 (9400) Rıo Gallegos, Santa Cruz, Argentinab Centro Austral de Investigaciones Cientıficas (CADIC) cc 92 (9410) Ushuaia, Tierra del Fuego, Argentina
c Consejo Nacional de Investigaciones Cientificas y Tecnicas (CONICET), Argentina
Received 25 June 2007; received in revised form 28 December 2007; accepted 7 January 2008
Abstract
The above- and belowground biomass and nutrient content (N, P, K, Ca, S and Mg) of pure deciduous Nothofagus antarctica (Forster f.) Oersted
stands grown in a marginal site and aged from 8 to 180 years were measured in Southern Patagonia. The total biomass accumulated ranged from
60.8 to 70.8 Mg ha�1 for regeneration and final growth stand, respectively. The proportions of belowground components were 51.6, 47.2, 43.9 and
46.7% for regeneration, initial growth, final growth and mature stand, respectively. Also, crown classes affected the biomass accumulation where
dominant trees had 38.4 Mg ha�1 and suppressed trees 2.6 Mg ha�1 to the stand biomass in mature stand. Nutrient concentrations varied according
to tree component, crown class and stand age. Total nutrient concentration graded in the fallowing order: leaves > bark > middle roots > small
branches > fine roots > sapwood > coarse roots > heartwood. While N and K concentrations increased with age in leaves and fine roots,
concentration of Ca increased with stand age in all components. Dominant trees had higher N, K and Ca concentrations in leaves, and higher P, K
and S concentrations in roots, compared with suppressed trees. Although the stands had similar biomass at different ages, there were important
differences in nutrient accumulation per hectare from 979.8 kg ha�1 at the initial growth phase to 665.5 kg ha�1 at mature stands. Nutrient storage
for mature and final growth stands was in the order Ca > N > K > P > Mg > S, and for regeneration stand was Ca > N > K > Mg > P > S.
Belowground biomass represented an important budget of all nutrients. At early ages, N, K, S, Ca and Mg were about 50% in the belowground
components. However, P was 60% in belowground biomass and then increased to 70% in mature stands. These data can assist to quantify the
impact of different silviculture practices which should aim to leave material (mainly leaves, small branches and bark) on the site to ameliorate
nutrient removal and to avoid a decline of long-term yields.
# 2008 Elsevier B.V. All rights reserved.
Keywords: Growth phase; Nutrients accumulation; Root/shoot ratio; Crown classes; Marginal forest
1. Introduction
The cool temperate forest of Patagonia is dominated by
deciduous Nothofagus species which occurs from 468 to 568 S
and ranges in elevation from sea level to more than
2000 m a.s.l. Nothofagus antarctica (Forster f.) Oersted (nire)
grows at sites that are harsh for most other species, thus on
poorly drained or drier eastern sites in the ecotone with the
Patagonian steppe. Within its natural distribution, tree growth
rate is clearly site quality-dependent, reflecting the influence of
soil, geologic, orientation and microclimatic factors. On the
best sites N. antarctica trees can reach height of up to 15 m with
straight trunks form but on rocky, dry and exposed sites trees
only reach 2–3 m tall with a shrubby form (Veblen et al., 1996).
Therefore, trees growing in better sites would store more
biomass and nutrients (Palm, 1995) or increase nutrient
concentrations in plant tissues (Diehl et al., 2003) than others
developed in inferior site classes. Also, concentration of
nutrients in leaf litterfall of trees may differ from those in live
tissues due to a resorption from senescing tissues into perennial
pools. Peri et al. (2006) reported that nutrient accumulation of
N. antarctica varied according to the age, crown classes and
components, but this study was carried out only in a middle site
quality (total height of mature trees reached 7.8 m) and at an
individual trees level in Southern Patagonia.
Most of the nutrient cycling researches in forest ecosystems
have been focussed on aboveground pools (Caldentey, 1992;
Santa Regina, 2000). However, net primary production, nutrient
www.elsevier.com/locate/foreco
Available online at www.sciencedirect.com
Forest Ecology and Management 255 (2008) 2502–2511
* Corresponding author. Tel.: +54 2966 442305; fax: +54 2966 442305.
E-mail address: [email protected] (P.L. Peri).
0378-1127/$ – see front matter # 2008 Elsevier B.V. All rights reserved.
doi:10.1016/j.foreco.2008.01.014
Author's personal copy
concentrations and fine roots turnover rates of belowground
components in forest system can equal or even exceed those
from aboveground pools (Caldwell, 1987; Ranger and Gelhaye,
2001). Therefore, research of belowground pools in trees is
necessary to quantify nutrient sequestration in the underground
woody structures.
As N. antarctica is often harvested mainly for wood products
such as firewood and poles, data on biomass and nutrient
accumulation at stand level in both above- and belowground
components are essential for evaluating the impacts of
silviculture practices on bioelement recycling and long-term
effects on the mineral balance (Santa Regina, 2000). Also, N.
antarctica forests are usually used as silvopastoral systems
(trees growing with natural pastures in the same unit of land to
feed cattle) where it is important to know the amount of
nutrients up taken by the trees, the nutrients returned by leaves
fall and the impact of the thinning on nutrients dynamic at a
surface level.
The aim was to quantify the amount of biomass and nutrients
in both above- and belowground components at different stands
age and crown classes of N. antarctica forest growing in a dry
and windy marginal site in South Patagonia, near the
Patagonian steppe.
2. Materials and methods
2.1. Study area
This study was carried out in four naturally pure stands of N.
antarctica in the southern west of Santa Cruz province,
Argentina (518 400 5900 SL, 728 150 5600 WL) corresponding to
different growth phases (mature phase 140–180 years, final
growth phase 80–100 years, initial growth phase 40–60 years
and regeneration phase 8–20 years) growing at a low site
quality where total height of mature trees reached 5.3 m.
Climate is cold temperate with a mean annual temperature of
6.2 8C and a long-term annual rainfall of 280 mm. Soils were
classified as Molisols. Thirty bulked soil sample cores from the
four stands to different depths (0–5, 5–21 and 21–50 cm) were
taken at random (Table 1). The soil pH and minerals was higher
in the upper layer. Increasing the quantity of cations (mainly
Ca+, Mg+ and K+) in soil solution (or increasing the base
saturation) in the upper layer leads to higher pH. The declines in
exchangeable soil minerals (particularly Ca+) in the lower
layers (where most of roots are distributed) could have resulted
from an increase in nutrients uptake by trees. The mean
dasometric characteristics of the four sampled stand are given
in Table 2.
2.2. Biomass
Three randomly replicate sample plots for each growth
phases stands were selected. These plots had a hierarchical
design according to trees size which differs between growth
phases stands. Thus, trees in mature phase stands were sampled
in 150 and 50 m2 for final growth phase, 10 m2 for initial
growth phase 40–60 years, and for 2 m2 regeneration phase.
Similar hierarchical designs according to trees size or trees age
were used previously for trees biomass sampling (De Castilho
et al., 2006; Laclau et al., 2000). Within each plot four N.
antarctica trees were selected, felled and sorted in four crown
classes: dominant, codominant, intermediate and suppressed
trees, depending of their crown position.
Total height and diameter at breast height were measured,
and the stem was cut at 0.1 m (stump), 1.3 m and every 1 m up
to an end diameter of 10 mm after the harvesting to calculate
wood volume for heartwood, sapwood, bark and rotten wood
components using Smalian formula. Each tree was separated
into the following components: leaves; small branches
(diameter < 10 mm); sapwood, heartwood and bark from the
main stem and coarse branches (>10 mm); and roots with bark
classified as fine (diameter < 2 mm) medium (<30 mm) or
coarse roots (>30 mm).
Three samples of each component in every tree were taken
for biomass calculations and nutrient analysis. For coarse
branches, stem and roots, three cross-sectional discs of 30 mm
at different lengths were taken and separated into their
component pool (heartwood, sapwood and bark) to determinate
density for biomass calculations. All small branches, leaves and
dead branches from each sampled tree were separated and
weighed in fresh. Roots from individual tree were excavated to
a depth of 0.5 m (maximum rooting depth for all crown classes)
in circular plots centred on the stump of the selected trees
minimizing the loss of the fine root fraction. These roots were
sorted in 3 diameter classes (<2 mm, from 2 to <30 mm and
>30 mm) and weighed in fresh.
At each sampled stand, four litter traps (1 m2 collecting
surface) were placed randomly under the canopy and collected
at the end of the growing season (autumn). From total litterfall
leaf litter was separated to estimate nutrient resorption.
Sub-samples from all components and leaf litter were taken
to estimate biomass and for nutrients analysis.
2.3. Chemical nutrient analysis
Samples from all age classes were dried in a forced draft
oven at 65 8C to constant weight and ground in a mill
containing 1 mm stainless steel screen for nutrient analysis.
Nitrogen (N) was determined using the Kjeldahl technique.
Phosphorus (P), potassium (K), calcium (Ca), magnesium (Mg)
Table 1
Soil properties in sampled marginal sites of N. antarctica forest
Organic horizon Mineral horizon I Mineral horizon II
Depth (cm) 0–5 5–21 21–50
Clay (%) – 26 25
Silt (%) – 22.5 19.9
Sand (%) – 51.5 55.1
pH 5.6 4.7 4.5
N total (ppm) 5190 2810 1890
P Truog (ppm) 66 25 6
K+ (cmol/kg) 1.3 0.9 0.5
Mg+ (cmol/kg) 6.3 2.3 2.1
Ca+ (cmol/kg) 24.6 8.5 5.1
P.L. Peri et al. / Forest Ecology and Management 255 (2008) 2502–2511 2503

Author's personal copy
and sulphur (S) concentrations were determined with a plasma
emission spectrometry (Shimadzu ICPS—1000 III).
2.4. Data and statistical analysis
Nutrient accumulation of trees was estimated by multiplying
nutrient concentrations from chemical analysis and the biomass
of each component (dry weight measurements). Age of each
sample tree was obtained through counting rings at the stump
(0.3 m from the soil). Comparisons of main factors (age and
crown classes) were carried out by analyses of variance
(ANOVA) with the F-test. Significant differences were
separated with standard errors of means to evaluate least
significant differences (LSD). All tests were evaluated at
p < 0.05. Statistical analysis were carried out by using the
Genstat statistical package (Genstat 5, 1997).
3. Results
3.1. Stand biomass
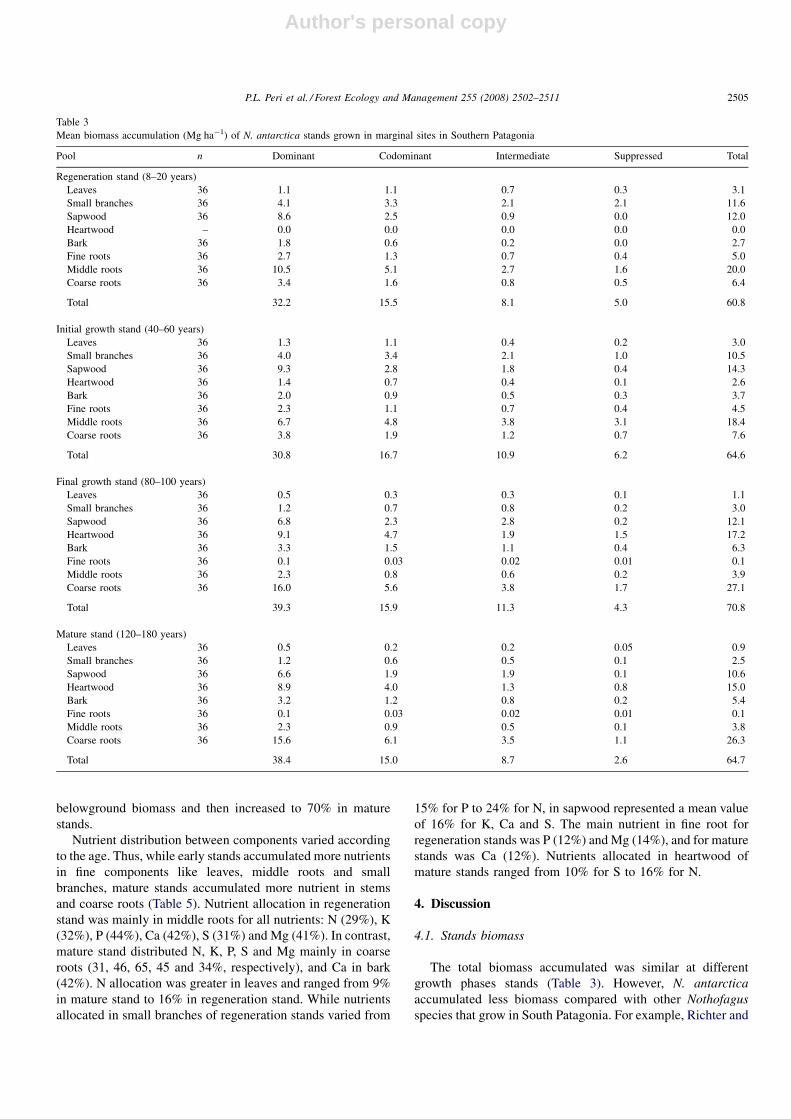
The total biomass accumulated by hectare ranged from 60.8
to 70.8 Mg ha�1 for regeneration and final growth phase stands,
respectively (Table 3). Although the stands presented similar
amount of biomass, their distribution in components depended
on age. While regeneration class age presented 31.8% of total
biomass distributed in fine components (leaves and small
branches), the mature stand had only 5.2% (Table 3). The
proportions of belowground components were 51.6, 47.2, 43.9
and 46.7% for regeneration, initial growth, final growth and
mature growth phase stands, respectively. However, the fine and
middle roots in regeneration stands contributed in 79.6 and
12.9% in mature stands (Table 3).
At all ages, significant differences were found in the
accumulated biomass according to the crown class. In
regeneration stands, dominant trees accounted 32.2 Mg ha�1
and only 5.0 Mg ha�1 for suppressed trees. Similarly, in mature
stand, dominant trees had 38.4 Mg ha�1 and suppressed trees
2.6 Mg ha�1 to the stand biomass.
3.2. Nutrient concentrations in the tree components
Nutrient concentrations varied according to tree component
(Table 4). At all ages, N, K, Mg and S were more concentrated
in leaves, while P was more concentrated in fine roots and Ca in
bark. Total nutrient concentration generally graded in the
fallowing order: leaves > bark > middle roots > small bran-
ches > fine roots > sapwood > coarse roots > heartwood.
Nutrient concentrations in some components varied according
to the age gradient (Table 4). For example, N concentration
increased with age in leaves and fine roots, and decreased with
age in bark, middle and coarse roots. The concentration of K
increased with age in leaves, fine roots and coarse roots, and P
decreased with age in fine and middle roots. While
concentration of Ca increased with stand age in all
components, Mg increased only in small branches and fine
roots. S concentration increased with age in fine and coarse
roots.
In general, nutrient concentration varied according to the
crown class. Dominant trees had higher N, K and Ca
concentrations in leaves, and higher P, K and S concentrations
in roots, compared with suppressed trees. In contrast, Ca was
more concentrated in suppressed than dominant trees for all
components and Mg did not show differences according to the
crown class.
Nutrients concentration of leaf litter did not differ
significantly between different growth phase stands with mean
values of 0.56 � 0.123% for N, 0.13 � 0.038% for P,
0.11 � 0.022% for K, 1.20 � 0.091% for Ca, 0.24 � 0.046%
for Mg and 0.06 � 0.010% for S.
3.3. Total nutrient storage at stand level
Total accumulation of N, P, K, Ca, Mg and S per hectare for
all ages is presented in Table 5. Although the stands had similar
biomass at different ages, there were important differences in
nutrient accumulation. The stand that accounted more quantity
of nutrients was at the initial growth phase (979.8 kg ha�1),
followed by regeneration (962.2 kg ha�1), mature stand
(665.5 kg ha�1) and final growth phase stand (663.4 kg ha�1).
Nutrient storage varied depending on the stand age. Nutrient
storage for mature and final growth stands was in the order
Ca > N > K > P > Mg > S, for initial growth stand Ca >N > K > Mg > S > P, and for regeneration stand was Ca >N > K > Mg > P > S.
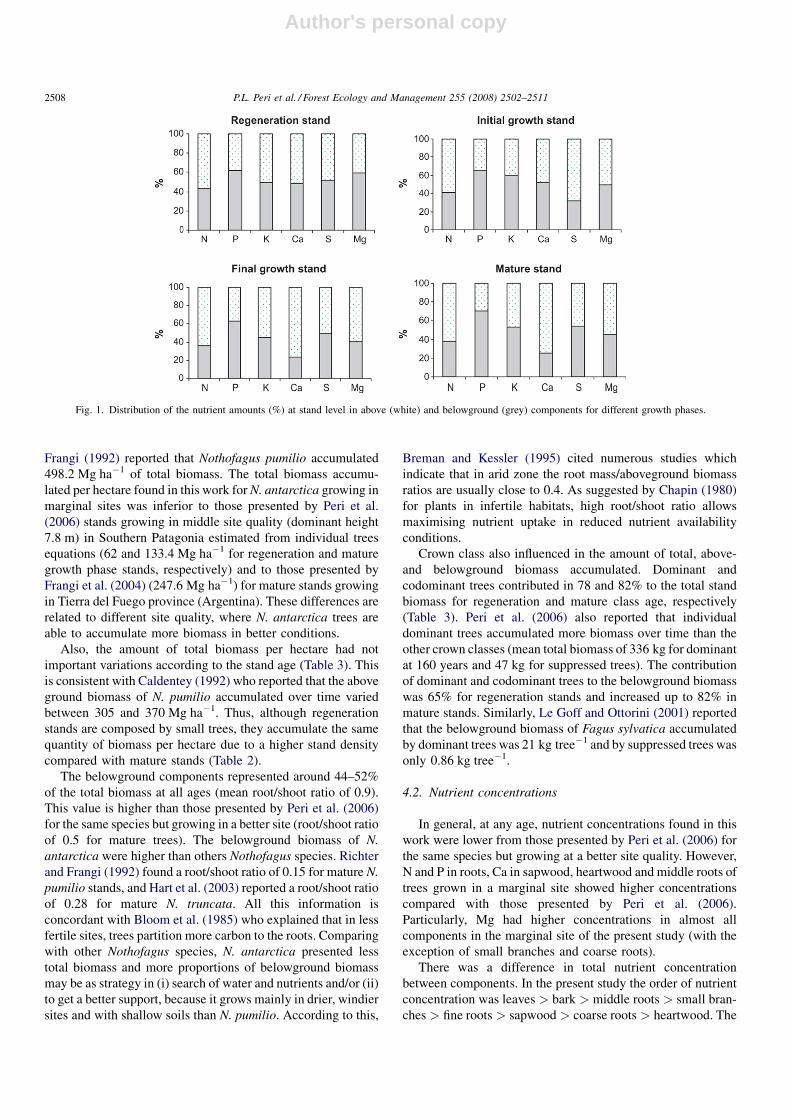
Belowground biomass represented an important budget of
all nutrients (Fig. 1). At early ages, N was presented in 43% in
the belowground components and this percentage decreased to
38% in mature stand. Similarly, Ca and Mg were about 50 and
60% at early ages and then decreased to 25 and 45% in mature
stands, respectively. However, K and S were around 50% in the
belowground biomass at all ages, and P was about 60% in
Table 2
Mean dasometric characteristics of sampled N. antarctica stands grown at marginal sites in Southern Patagonia
Growth phase Age class (years) Density (trees ha�1) Height (m) DBH (m) Basal area
(m2 ha�1)
Crown classes (%)
D C I S
Regeneration 8–20 161200 � 10800 1.1 � 0.6 0.02 � 0.003 32.3 � 3.1 20 24 25 31
Initial growth 40–60 5540 � 2300 2.7 � 0.8 0.08 � 0.002 30.8 � 2.9 25 28 24 23
Final growth 80–100 1120 � 220 4.2 � 0.7 0.136 � 0.04 27.8 � 1.7 29 25 27 19
Mature 140–180 440 � 35 5.3 � 0.3 0.202 � 0.05 25.4 � 2.7 36 27 23 14
Crown classes = D: dominant trees, C: codominant trees, I: intermediate trees, S: suppressed trees.
P.L. Peri et al. / Forest Ecology and Management 255 (2008) 2502–25112504
Author's personal copy
belowground biomass and then increased to 70% in mature
stands.
Nutrient distribution between components varied according
to the age. Thus, while early stands accumulated more nutrients
in fine components like leaves, middle roots and small
branches, mature stands accumulated more nutrient in stems
and coarse roots (Table 5). Nutrient allocation in regeneration
stand was mainly in middle roots for all nutrients: N (29%), K
(32%), P (44%), Ca (42%), S (31%) and Mg (41%). In contrast,
mature stand distributed N, K, P, S and Mg mainly in coarse
roots (31, 46, 65, 45 and 34%, respectively), and Ca in bark
(42%). N allocation was greater in leaves and ranged from 9%
in mature stand to 16% in regeneration stand. While nutrients
allocated in small branches of regeneration stands varied from
15% for P to 24% for N, in sapwood represented a mean value
of 16% for K, Ca and S. The main nutrient in fine root for
regeneration stands was P (12%) and Mg (14%), and for mature
stands was Ca (12%). Nutrients allocated in heartwood of
mature stands ranged from 10% for S to 16% for N.
4. Discussion
4.1. Stands biomass
The total biomass accumulated was similar at different
growth phases stands (Table 3). However, N. antarctica
accumulated less biomass compared with other Nothofagus
species that grow in South Patagonia. For example, Richter and
Table 3
Mean biomass accumulation (Mg ha�1) of N. antarctica stands grown in marginal sites in Southern Patagonia
Pool n Dominant Codominant Intermediate Suppressed Total
Regeneration stand (8–20 years)
Leaves 36 1.1 1.1 0.7 0.3 3.1
Small branches 36 4.1 3.3 2.1 2.1 11.6
Sapwood 36 8.6 2.5 0.9 0.0 12.0
Heartwood – 0.0 0.0 0.0 0.0 0.0
Bark 36 1.8 0.6 0.2 0.0 2.7
Fine roots 36 2.7 1.3 0.7 0.4 5.0
Middle roots 36 10.5 5.1 2.7 1.6 20.0
Coarse roots 36 3.4 1.6 0.8 0.5 6.4
Total 32.2 15.5 8.1 5.0 60.8
Initial growth stand (40–60 years)
Leaves 36 1.3 1.1 0.4 0.2 3.0
Small branches 36 4.0 3.4 2.1 1.0 10.5
Sapwood 36 9.3 2.8 1.8 0.4 14.3
Heartwood 36 1.4 0.7 0.4 0.1 2.6
Bark 36 2.0 0.9 0.5 0.3 3.7
Fine roots 36 2.3 1.1 0.7 0.4 4.5
Middle roots 36 6.7 4.8 3.8 3.1 18.4
Coarse roots 36 3.8 1.9 1.2 0.7 7.6
Total 30.8 16.7 10.9 6.2 64.6
Final growth stand (80–100 years)
Leaves 36 0.5 0.3 0.3 0.1 1.1
Small branches 36 1.2 0.7 0.8 0.2 3.0
Sapwood 36 6.8 2.3 2.8 0.2 12.1
Heartwood 36 9.1 4.7 1.9 1.5 17.2
Bark 36 3.3 1.5 1.1 0.4 6.3
Fine roots 36 0.1 0.03 0.02 0.01 0.1
Middle roots 36 2.3 0.8 0.6 0.2 3.9
Coarse roots 36 16.0 5.6 3.8 1.7 27.1
Total 39.3 15.9 11.3 4.3 70.8
Mature stand (120–180 years)
Leaves 36 0.5 0.2 0.2 0.05 0.9
Small branches 36 1.2 0.6 0.5 0.1 2.5
Sapwood 36 6.6 1.9 1.9 0.1 10.6
Heartwood 36 8.9 4.0 1.3 0.8 15.0
Bark 36 3.2 1.2 0.8 0.2 5.4
Fine roots 36 0.1 0.03 0.02 0.01 0.1
Middle roots 36 2.3 0.9 0.5 0.1 3.8
Coarse roots 36 15.6 6.1 3.5 1.1 26.3
Total 38.4 15.0 8.7 2.6 64.7
P.L. Peri et al. / Forest Ecology and Management 255 (2008) 2502–2511 2505

Author's personal copy
Table 4
Mean nutrient concentration of N. antarctica components (data expressed as percentage of dry matter) grown at marginal sites in Southern Patagonia
n Leaves Small branches Sapwood Heartwood Bark Roots
144 144 144 108 144 <2 mm <30 mm >30 mm
144 144 144
N
Age class
8–20 years 1.29 0.50 0.24 – 0.46 0.42 0.38 0.23
40–60 years 1.48 0.52 0.26 0.16 0.29 0.44 0.39 0.16
80–100 years 1.58 0.50 0.25 0.17 0.29 0.45 0.36 0.19
140–180 years 1.69 0.48 0.24 0.18 0.29 0.47 0.32 0.18
Crown class
Dominant 1.55 0.50 0.25 0.16 0.24 0.44 0.36 0.21
Codominant 1.48 0.53 0.23 0.16 0.31 0.45 0.40 0.20
Intermediate 1.52 0.47 0.22 0.19 0.34 0.46 0.38 0.19
Suppressed 1.40 0.48 0.23 0.20 0.19 0.43 0.31 0.16
Age class effect ** ns ns ns ** * * *
Crown class effect ** ns ns ns ** ns * ns
Interaction ns ns ns ns * ns ns ns
P
Age Class
8–20 years 0.16 0.05 0.05 – 0.06 0.32 0.11 0.05
40–60 years 0.14 0.08 0.04 0.01 0.04 0.31 0.16 0.04
80–100 years 0.15 0.06 0.05 0.01 0.03 0.22 0.12 0.08
140–180 years 0.19 0.07 0.06 0.02 0.02 0.14 0.08 0.13
Crown class
Dominant 0.18 0.07 0.06 0.02 0.02 0.33 0.12 0.14
Codominant 0.18 0.07 0.05 0.01 0.02 0.28 0.15 0.09
Intermediate 0.15 0.05 0.06 0.01 0.02 0.20 0.14 0.05
Suppressed 0.15 0.07 0.04 0.004 0.02 0.18 0.06 0.04
Age class effect * ns ns ns ns ** ** **
Crown class effect ns ns ns * ns ** * **
Interaction ns ns ns ns ns * ns ns
K
Age class
8–20 years 0.24 0.16 0.15 – 0.13 0.16 0.15 0.12
40–60 years 0.27 0.16 0.14 0.07 0.10 0.18 0.17 0.10
80–100 years 0.30 0.17 0.15 0.07 0.09 0.22 0.16 0.12
140–180 years 0.34 0.18 0.16 0.07 0.07 0.26 0.16 0.17
Crown class
Dominant 0.31 0.17 0.16 0.07 0.06 0.28 0.16 0.12
Codominant 0.33 0.18 0.15 0.07 0.06 0.22 0.18 0.16
Intermediate 0.26 0.18 0.14 0.08 0.08 0.20 0.16 0.13
Suppressed 0.26 0.17 0.16 0.07 0.08 0.12 0.14 0.08
Age class effect * ns ns ns ns ** ns *
Crown class effect * ns ns ns ns ** ns *
Interaction ns ns ns ns ns * ns ns
Ca
Age Class
8–20 years 0.60 0.72 0.13 – 1.12 0.37 0.80 0.07
40–60 years 0.64 0.74 0.15 0.15 1.65 0.38 0.77 0.06
80–100 years 0.74 0.71 0.14 0.13 2.08 0.42 0.85 0.12
140–180 years 0.83 0.89 0.18 0.16 2.51 0.45 0.97 0.19
Crown class
Dominant 0.70 0.66 0.22 0.08 2.4 0.42 0.88 0.08
Codominant 0.77 0.66 0.24 0.10 2.12 0.38 0.81 0.11
Intermediate 0.81 0.77 0.16 0.15 2.35 0.44 0.93 0.15
Suppressed 0.63 0.84 0.32 0.16 2.62 0.50 1.05 0.22
Age class effect ** * * ns ** * ** *
P.L. Peri et al. / Forest Ecology and Management 255 (2008) 2502–25112506

Author's personal copy
Table 4 (Continued )
n Leaves Small branches Sapwood Heartwood Bark Roots
144 144 144 108 144 <2 mm <30 mm >30 mm
144 144 144
Crown class effect * * ** * * * * **
Interaction ns ns ns * ns ns ns ns
Mg
Age Class
8–20 years 0.24 0.09 0.04 – 0.09 0.17 0.13 0.05
40–60 years 0.32 0.14 0.05 0.03 0.10 0.25 0.12 0.04
80–100 years 0.25 0.14 0.05 0.03 0.08 0.23 0.12 0.04
140–180 years 0.29 0.15 0.05 0.02 0.07 0.20 0.11 0.05
Crown class
Dominant 0.26 0.16 0.05 0.02 0.08 0.28 0.12 0.05
Codominant 0.27 0.14 0.05 0.03 0.05 0.22 0.14 0.05
Intermediate 0.23 0.10 0.06 0.03 0.06 0.20 0.11 0.04
Suppressed 0.23 0.13 0.04 0.02 0.05 0.15 0.10 0.03
Age class effect ns * ns ns ns * ns ns
Crown class effect ns ns ns ns ns * ns ns
Interaction ns ns ns ns ns ns ns ns
S
Age class
8–20 years 0.12 0.07 0.06 - 0.07 0.06 0.07 0.02
40–60 years 0.14 0.08 0.05 0.01 0.08 0.07 0.06 0.05
80–100 years 0.15 0.08 0.04 0.02 0.08 0.09 0.07 0.05
140–180 years 0.15 0.09 0.05 0.02 0.07 0.11 0.08 0.06
Crown class
Dominant 0.15 0.08 0.06 0.01 0.08 0.10 0.07 0.07
Codominant 0.14 0.08 0.04 0.01 0.07 0.11 0.09 0.05
Intermediate 0.13 0.08 0.04 0.02 0.08 0.08 0.06 0.04
Suppressed 0.14 0.08 0.04 0.05 0.08 0.04 0.06 0.02
Age class effect ns ns ns ns ns * ns *
Crown class effect ns ns ns * ns * ns *
Interaction ns ns ns * ns ns ns ns
Table 5
Nutrient amount at stand level (kg ha�1) of N. antarctica grown at marginal sites in Southern Patagonia
Pool n N P K Ca S Mg Total n N P K Ca S Mg Total
Regeneration stand (8–20 years) Initial growth stand (40–60 years)
Leaves 36 44.4 5.6 8.6 21.3 4.2 8.6 92.7 36 45.3 4.5 8.0 19.3 4.3 10.3 91.7
Small branches 36 66.7 8.3 20.3 94.5 9.8 11.8 211.4 36 54.8 8.0 28.0 57.5 23.3 15.0 186.6
Sapwood 36 33.5 5.0 18.7 61.6 7.6 4.2 130.6 36 37.6 5.2 20.0 13.1 8.0 6.4 90.3
Heartwood – 0.0 0.0 0.0 0.0 0.0 0.0 0.0 36 10.5 1.4 5.5 18.6 2.9 3.0 41.9
Bark 36 13.3 1.7 3.7 32.3 2.0 2.6 55.6 36 10.5 1.4 3.8 60.4 2.7 3.6 82.4
Fine roots 36 23.0 6.9 8.9 22.8 6.3 9.2 77.1 36 19.6 6.0 8.1 17.3 4.9 11.3 67.2
Middle roots 36 82.0 24.0 32.3 173.1 14.9 27.4 353.8 36 71.6 29.9 31.4 162.2 10.9 22.6 328.6
Coarse roots 36 16.4 3.5 8.7 5.2 3.8 3.4 41.0 36 20.9 3.0 56.2 4.3 3.5 3.0 90.9
Total 279.3 55.0 101.1 411.0 48.6 67.2 962.2 270.8 59.4 161.0 352.8 60.6 75.2 979.8
Final growth stand (80–100 years) Mature stand (120–180 years)
Leaves 36 18.8 2.0 3.7 8.9 1.7 3.1 38.2 36 15.8 2.0 3.5 8.9 1.5 1.9 33.6
Small branches 36 16.1 2.2 5.4 23.2 2.5 4.5 53.9 36 13.2 1.8 4.7 22.5 2.2 3.8 48.2
Sapwood 36 36.9 7.4 18.6 32.4 5.4 6.4 107.1 36 31.0 7.3 16.8 29.3 4.5 5.4 94.3
Heartwood 36 31.4 3.4 14.6 36.3 4.3 5.6 95.6 36 28.3 3.3 12.5 30.6 3.5 4.2 82.4
Bark 36 19.9 2.8 7.4 91.4 4.6 6.7 132.8 36 18.6 1.4 4.9 117.6 4.0 4.8 151.3
Fine roots 36 0.7 0.2 0.3 0.6 0.2 0.4 2.4 36 0.6 0.2 0.4 0.7 0.2 0.3 2.4
Middle roots 36 14.8 4.9 6.7 37.7 2.8 4.8 71.7 36 11.5 2.8 5.7 34.7 2.8 4.1 61.6
Coarse roots 36 53.6 25.2 34.1 20.9 15.3 12.6 161.7 36 53.6 34.3 41.5 35.0 15.2 12.3 191.9
Total 192.1 48.1 90.9 251.4 36.8 44.1 663.4 172.6 53.1 90.0 279.3 33.9 36.6 665.5
P.L. Peri et al. / Forest Ecology and Management 255 (2008) 2502–2511 2507
Author's personal copy
Frangi (1992) reported that Nothofagus pumilio accumulated
498.2 Mg ha�1 of total biomass. The total biomass accumu-
lated per hectare found in this work for N. antarctica growing in
marginal sites was inferior to those presented by Peri et al.
(2006) stands growing in middle site quality (dominant height
7.8 m) in Southern Patagonia estimated from individual trees
equations (62 and 133.4 Mg ha�1 for regeneration and mature
growth phase stands, respectively) and to those presented by
Frangi et al. (2004) (247.6 Mg ha�1) for mature stands growing
in Tierra del Fuego province (Argentina). These differences are
related to different site quality, where N. antarctica trees are
able to accumulate more biomass in better conditions.
Also, the amount of total biomass per hectare had not
important variations according to the stand age (Table 3). This
is consistent with Caldentey (1992) who reported that the above
ground biomass of N. pumilio accumulated over time varied
between 305 and 370 Mg ha�1. Thus, although regeneration
stands are composed by small trees, they accumulate the same
quantity of biomass per hectare due to a higher stand density
compared with mature stands (Table 2).
The belowground components represented around 44–52%
of the total biomass at all ages (mean root/shoot ratio of 0.9).
This value is higher than those presented by Peri et al. (2006)
for the same species but growing in a better site (root/shoot ratio
of 0.5 for mature trees). The belowground biomass of N.
antarctica were higher than others Nothofagus species. Richter
and Frangi (1992) found a root/shoot ratio of 0.15 for mature N.
pumilio stands, and Hart et al. (2003) reported a root/shoot ratio
of 0.28 for mature N. truncata. All this information is
concordant with Bloom et al. (1985) who explained that in less
fertile sites, trees partition more carbon to the roots. Comparing
with other Nothofagus species, N. antarctica presented less
total biomass and more proportions of belowground biomass
may be as strategy in (i) search of water and nutrients and/or (ii)
to get a better support, because it grows mainly in drier, windier
sites and with shallow soils than N. pumilio. According to this,
Breman and Kessler (1995) cited numerous studies which
indicate that in arid zone the root mass/aboveground biomass
ratios are usually close to 0.4. As suggested by Chapin (1980)
for plants in infertile habitats, high root/shoot ratio allows
maximising nutrient uptake in reduced nutrient availability
conditions.
Crown class also influenced in the amount of total, above-
and belowground biomass accumulated. Dominant and
codominant trees contributed in 78 and 82% to the total stand
biomass for regeneration and mature class age, respectively
(Table 3). Peri et al. (2006) also reported that individual
dominant trees accumulated more biomass over time than the
other crown classes (mean total biomass of 336 kg for dominant
at 160 years and 47 kg for suppressed trees). The contribution
of dominant and codominant trees to the belowground biomass
was 65% for regeneration stands and increased up to 82% in
mature stands. Similarly, Le Goff and Ottorini (2001) reported
that the belowground biomass of Fagus sylvatica accumulated
by dominant trees was 21 kg tree�1 and by suppressed trees was
only 0.86 kg tree�1.
4.2. Nutrient concentrations
In general, at any age, nutrient concentrations found in this
work were lower from those presented by Peri et al. (2006) for
the same species but growing at a better site quality. However,
N and P in roots, Ca in sapwood, heartwood and middle roots of
trees grown in a marginal site showed higher concentrations
compared with those presented by Peri et al. (2006).
Particularly, Mg had higher concentrations in almost all
components in the marginal site of the present study (with the
exception of small branches and coarse roots).
There was a difference in total nutrient concentration
between components. In the present study the order of nutrient
concentration was leaves > bark > middle roots > small bran-
ches > fine roots > sapwood > coarse roots > heartwood. The
Fig. 1. Distribution of the nutrient amounts (%) at stand level in above (white) and belowground (grey) components for different growth phases.
P.L. Peri et al. / Forest Ecology and Management 255 (2008) 2502–25112508
Author's personal copy
higher concentration in the fine roots component compared
with coarse roots was consistent with Gordon and Jackson
(2000) who reported a significant inverse relationship between
root diameter and nutrient concentration for N, P and Mg
based on a review data from 56 studies of trees. Also, there
was a difference in the order of total nutrient concentration
between components according to site classes. Peri et al. (2006)
reported for the same species growing in a better site leaves >bark > small branches > fine roots > middle roots > coarse
roots > sapwood > heartwood. Hart et al. (2003) working
with mature stands of N. truncata, reported that the order
of nutrient concentration was: leaves > small branches > mid-
middle roots > coarse roots > bark > fine roots > stem.
Similarly, Santa Regina (2000) reported that the above ground
biomass of Quercus pyrenaica, the components which
presented the highest concentrations were leaves > small
branches > stem. In some cases, differences in tree nutrients
concentration between class sites may be due to differences
in soil fertility. Diehl et al. (2003) working with 10 native
Andean-Patagonian species from different functional groups,
found a significant positive correlation between N in mature
leaves and soil N.
Different tendencies were found in nutrient concentrations
according to the age. Some nutrients in components increased
with age and others decreased. In contrast, Peri et al. (2006)
reported that almost all nutrient concentrations decreased as
age increased, as a consequence of an increment in cell wall
components, e.g. carbonated structures (Lambers et al., 1998).
Das and Chaturvedi (2005) and Laclau et al. (2000) working
with Populus deltoides and Eucalyptus, respectively, also
reported a systematic reduction in nutrient concentrations as
age increases. In our study case, this ‘‘dilution effect’’ was not
so evident because the trees biomass growth rate was slower
compared with trees grown in better sites. Thus, at similar age
our trees accumulated a 51.5% less biomass per hectare than
trees growing in a middle site quality class (Peri et al., 2006).
The only nutrient that presented a similar response in both
studies was Ca, which increased as age increased in all cases.
This macronutrient is the main nutrient in structural tissues and
in the bark, being more important in mature trees. In contrast,
young trees have less bark biomass with green stems with
chlorophyll presence, as was cited by Damesin (2003) for
Fagus.
In general, nutrient concentration also varied according to
the class crown. Dominant tree presented higher N, K and Ca
concentrations in leaves, and higher P, K and S concentrations
in roots, compared with suppressed trees (Table 4). This is
consistent with Peri et al. (2006) who reported that suppressed
trees presented smaller concentrations than dominant trees for
the majority of nutrients. This information is also consistent
with Lambers et al. (1998), who reported that plants have
greater concentrations of N, P and K when growth conditions
becomes more favourable.
Resorption is a strategy of plants to conserve nutrients.
Based on nutrients concentration of leaf litter data and the mean
concentration values of green live leaves on trees (Table 4), the
resorption found in the present work was 66, 20, 63, 14 and 50%
for N, P, K, Mg and S, respectively. In contrast, there was no
difference in Ca. This is consistent with Aerts (1996) who
reported that nutrient resorption from foliage before senescence
can reach values up to 50% (mainly N and P) of the maximum
concentrations during a growing period. Similarly, Rapp et al.
(1999) showed that there was a translocation of N, P and K from
leaves of Quercus species to perennial tissues.
4.3. Nutrients amounts by hectare and distribution in
components
Total nutrient amounts found in this work were lower than
other values presented for other Nothofagus species (Table 5).
Richter and Frangi (1992) reported greater quantities of all
nutrients in mature N. pumilio (dominant height of 19 m)
forests in Tierra del Fuego, Argentina: 1009 kg N ha�1,
165 kg N ha�1, 806 kg K ha�1 and 1235 kg Ca ha�1. The site
quality appears to have a strong effect on nutrients accumula-
tion in N. antarctica stands. In a better site quality, Peri et al.
(2006) reported for the same species higher quantities of all
nutrients by hectare using models of individual trees (e.g. stand
of 400 trees ha�1 at age 191 years 292.6 kg N ha�1, 68.9 kg
P ha�1, 177.2 kg K ha�1, 492.4 kg Ca ha�1, 71.8 kg S ha�1
and 44.8 kg Mg ha�1).
These differences could be determined by the combination
of environmental factors that define the quality of a particular
site such as soil fertility, soil depth, period of water stress, etc.
The reduction in nutrient accumulation of N. antarctica stands
grown in this marginal site compared with data reported by Peri
et al. (2006) could be due to the available water acting as a main
limiting factor during the growth period rather than soil
nutrition which did not differ significantly between sites. The
marginal site of the present study is located near the steppe in a
windy environment with higher evapotranspiration rate which
can reduce tree growth, nutrients uptake and nutrients
concentration. Thus, soil water availability is an abiotic factor
that mainly controls ecosystem processes such as carbon
fixation, nutrient cycles, mineralization and uptake (Landsberg
and Gower, 1997). Also, Frangi et al. (2005) working with N.
pumilio forests growing along an altitudinal gradient in Tierra
del Fuego, Argentina found that the total nutrient (K, Ca, Mg, N
and P) stocks of mature erect stands grown in better site
conditions decreased with elevation by reducing the rates of
nutrient uptake and trees requirements.
Although there were no differences in biomass accumulated
by hectare between stands at different age (Table 3), there were
great differences in nutrient accumulation (Table 5). Young
stands accumulated approximately 30% more nutrients than
mature stands. This was because young stands presented a big
proportion (65%) of the biomass distributed in fine components
(leaves, small branches and fine and middle roots), which
accounted with the highest nutrient concentrations. In contrast,
in mature stands, fine components only represented the 11% of
the total biomass, being the stems and coarse roots the
components that accounted the majority of their biomass. Peri
et al. (2006) also reported that in young stands the amounts of
nutrients was greater than in mature stands with also a large
P.L. Peri et al. / Forest Ecology and Management 255 (2008) 2502–2511 2509

Author's personal copy
proportion of biomass allocated in leaves, small branches and
medium roots. In contrast, Ponette et al. (2001) showed there
was no age pattern for any nutrient (N, K, P, Mg and Ca)
contents in Pseudotsuga menziesii stands from 26 to 54 years of
age.
The order of nutrient storage in this work (Ca > N >K > P > Mg > S) was consistent with those reported by
Richter and Frangi (1992) for mature N. pumilio forests.
However, Peri et al. (2006) found a little different order for
mature N. antarctica growing in a better site quality class
(Ca > N > K > S > P > Mg). Hart et al. (2003) working with
N. truncata in New Zealand presented the following order:
Ca > K > N > P > Mg. These differences may be related to
site conditions, like differences in soil nutrient availability.
Nutrient distribution in N. antarctica was different accord-
ing to the components. In mature stands, P was more abundant
in roots, N and K in trunks (including bark). In contrast, while
we found that P and K were more abundant in coarse roots, Hart
et al. (2003) reported for hard beech that the largest amount of P
(28%) and K (21%) was allocated in the stem wood.
The root/shoot nutrient ratios found in this work for mature
stands (N = 0.61; P = 2.4; K = 1.1; Ca = 0.34; S = 1.16;
Mg = 0.84) were higher than others presented for Nothofagus
species. Hart et al. (2003) found lower root/shoot ratios in N.
truncata for N (0.24), P (0.40), K (0.34), Ca (0.20) and Mg
(0.40). Also, Richter and Frangi (1992) reported lower root/
shoot ratios in N. pumilio for N (0.27), P (0.32), K (0.32), and
Ca (0.24). This indicates that N. antarctica accumulates more
belowground biomass and nutrients as an adaptation to infertile
and dry sites. Therefore, a characteristic of N. antarctica is that
it can grow in marginal sites compared with others Nothofagus
species which occupies better sites. Furthermore, Peri et al.
(2006) reported lower values of root/shoot ratio for mature N.
antarctica developed in a better site (0.3, 1.4, 0.62, 0.3, 0.4 and
0.42 for N, P, K, Ca, S and Mg, respectively).
In our work, young stands had higher root/shoot ratios for
some nutrients (N = 0.77, Ca = 0.96, Mg = 1.5) than mature
stands. This is consistent with the results presented by Peri et al.
(2006) who informed that root/shoot nutrient ratios decreased
from its maximum value in regeneration stage to a steady state
asymptote beyond 50 years of age. Thus, nutrient accumulation
in roots was greater during the regeneration phase, and then
aboveground accumulation of nutrients increased over time.
Also their nutrient amounts in N. antarctica stands were
affected by crown classes where suppressed trees accumulated
less biomass and nutrients. Similar trend was reported for the
same species grown in a better site class (Peri et al., 2006).
In conclusion, the biomass and nutrient accumulation in
components of above- and belowground of N. antarctica stands
found in the present work can assist to quantify the impact of
different management strategies. For example, based on the
nutrients requirements of N. antarctica trees grown in marginal
sites at a final growth stage (80–100 years), the proportion of
nutrients reabsorbed by trees, and the amount of nutrients
returned from litterfall, a thinning intensity of 50% may not
satisfy the demand for nutrients of the remaining trees.
Therefore, to maintain the productivity of this particular
ecosystem, it is necessary to remove less trees from the original
structure. Also, thinning practices should aim to leave material
(mainly leaves, small branches and bark) on the site to
ameliorate nutrient removal and to avoid a decline of long-term
yields.
References
Aerts, R., 1996. Nutrient resorption from senescing leaves of perennials: are
there general patterns? J. Ecol. 84, 597–608.
Bloom, A.J., Chapin, F.S., Mooney, H.A., 1985. Resource limitation in plants—
an economic analogy. Ann. Rev. Ecol. Syst. 16, 369–393.
Breman, H., Kessler, J.J., 1995. Woody Plants in Agro-Ecosystems of Semi-
Arid Regions. Springer-Verlag, Berlin, pp. 340.
Chapin, F.S., 1980. The mineral nutrition of wild plants. Ecol. Syst. 11, 233–
260.
Caldentey, J., 1992. Acumulacion de nutrientes en rodales naturales de Lenga
(Nothofagus pumilio) en Magallanes. Chile. Ciencias Forestales 8, 19–25.
Caldwell, M.M., 1987. Competition between roots in natural communities. In:
Gregory, P.J., Lake, J.V., Rose, D.A. (Eds.), Root Development and Func-
tion. Cambridge University Press, New York, USA, pp. 167–185.
Damesin, C., 2003. Respiration and photosynthesis characteristics of current
year stems of Fagus sylvatica: from the seasonal pattern to an annual
balance. New Phytol. 158, 465–475.
Das, D.K., Chaturvedi, O.P., 2005. Structure and function of Populus deltoides
agroforestry systems in eastern India: 2. Nutrient Dyn. Agroforestry Syst.
65, 223–230.
De Castilho, C.V., Magnusson, W.E., De Araujo, R.N.O., Luizao, R.C.C.,
Luizao, F.J., Lima, A.P., Higuchi, N., 2006. Variation in aboveground tree
live biomass in a central Amazonian forest: effects of soil and topography.
Forest Ecol. Manage. 234, 85–96.
Diehl, P., Mazzarino, M.J., Funes, F., Fontenla, S., Gobbi, M., Ferrari, J., 2003.
Nutrient conservation strategies in native Andean-Patagonian forest. J. Veg.
Sci. 14, 63–70.
Frangi, J.L., Barrera, M.D., Puigdefabregas, J., Yapura, P.F., Arambarri, A.M.,
Richter, L.L., 2004. Ecologıa de los bosques de Tierra del Fuego. In: Arturo,
M., Frangi, J.L., Goya, J. (Eds.), Ecologıa y Manejo de los Bosques de
Argentina. Editorial de la Universidad Nacional de la Plata, Buenos Aires,
pp. 1–88.
Frangi, J.L., Barrera, M.D., Richter, L.L., Lugo, A.E., 2005. Nutrient cycling in
Nothofagus pumilio forests along an altitudinal gradient in Tierra del Fuego,
Argentina. Forest Ecol. Manage. 217, 80–94.
Gordon, W.S., Jackson, R.B., 2000. Nutrient concentrations in fines roots.
Ecology 81, 275–280.
Hart, P., Clinton, P., Allen, R., Nordmeyer, A., Evans, G., 2003. Biomass and
macro-nutrients (above and below- ground) in a New Zealand beech
(Nothofagus) forest ecosystem: implications for storage and sustainable
forest management. Forest Ecol. Manage. 174, 281–294.
Laclau, J.P., Bouillet, J.P., Ranger, J., 2000. Dynamics of biomass and nutrient
accumulation in a clonal plantation of Eucalyptus in Congo. Forest Ecol.
Manage. 128, 181–196.
Lambers, H., Chapin III, F.S., Pons, T.L., 1998. Plant Physiological Ecology.
Springer-Verlag New York Inc., New York, pp. 540.
Landsberg, J.J., Gower, S.T., 1997. Applications of Physiological Ecology to
Forest Management. Academic Press, California, pp. 354.
Le Goff, N., Ottorini, J., 2001. Root biomass and biomass increment in a beech
(Fagus sylvatica L.) stand in North-East France. Ann. For. Sci. 58, 1–13.
Palm, C.A., 1995. Contribution of agroforestry trees to nutrients requirements
of intercropped plants. Agroforestry Syst. 30, 105–124.
Peri, P.L., Gargaglione, V., Martınez Pastur, G., 2006. Dynamics of above and
below-ground biomass and nutrient accumulation in an age sequence of
Nothofagus antarctica forest of Southern Patagonia. Forest Ecol. Manage.
233, 85–99.
Ponette, Q., Ranger, J., Ottorini, J.-M., Ulrich, E., 2001. Aboveground biomass
and nutrient content of five Douglas-fir stands in France. Forest Ecol.
Manage. 142, 109–127.
P.L. Peri et al. / Forest Ecology and Management 255 (2008) 2502–25112510

Author's personal copy
Ranger, J., Gelhaye, D., 2001. Belowground biomass and nutrient content in a
47-year-old Douglas-fir plantation. Ann. For. Sci. 58, 423–430.
Richter, L., Frangi, J., 1992. Bases ecologicas para el manejo del Bosque de
Nothofagus pumilio de Tierra del Fuego. Revista de la Facultad de Agro-
nomıa, La Plata 68, pp. 35–52.
Santa Regina, I., 2000. Biomass estimation and nutrient pools in four Quercus
pyrenaica in Sierra de Gata Mountains, Salamanca, Spain. Forest Ecol.
Manage. 132, 127–141.
Rapp, M., Santa Regina, I., Rico, M., Gallego, H.A., 1999. Biomass, nutrient
content, literfall and nutrient return to the soil in Mediterranean oak forest.
Forest Ecol. Manage. 119, 39–49.
Veblen, T.T., Donoso, C., Kitzberger, T., Rebertus, A.J., 1996. Ecology of
southern Chilean and Argentinean Nothofagus forests. In: Veblen, T., Hill,
R., Read, J. (Eds.), The Ecology and Biogeography of Nothofagus Forests.
Yale University Press, New Haven, pp. 293–353.
P.L. Peri et al. / Forest Ecology and Management 255 (2008) 2502–2511 2511
Related Documents