A Water Quality Loading Model for Tillamook Bay Patrice A. Melancon Thanks to: Dr. David Maidment Dr. Michael Barrett Dr. Francisco Olivera Dr. Maidment’s Research Group

A Water Quality Loading Model for Tillamook Bay
Dec 31, 2015
A Water Quality Loading Model for Tillamook Bay. Patrice A. Melancon Thanks to: Dr. David Maidment Dr. Michael Barrett Dr. Francisco Olivera Dr. Maidment’s Research Group. Outline. Introduction Problem and Objective Why use GIS? Developing the Model Using the Model - PowerPoint PPT Presentation
Welcome message from author
This document is posted to help you gain knowledge. Please leave a comment to let me know what you think about it! Share it to your friends and learn new things together.
Transcript
A Water Quality Loading Model for Tillamook Bay
Patrice A. Melancon
Thanks to:Dr. David MaidmentDr. Michael Barrett
Dr. Francisco OliveraDr. Maidment’s Research Group
Outline
Introduction Problem and Objective Why use GIS? Developing the Model Using the Model Conclusions and Future Work

Introduction
National Estuary Program Tillamook Bay
Problem and Objective
My work is focusing on two issues: High Coliform loads High Sediment loads
Developing a model that can serve as a Management Tool
Problem History Coliform contamination:
Animals confined in winter; manure storage
Liquid and solid manure applied as fertilizer
Cow access to streams
Sediment contamination: Largely linked to logging practices Roads linked to frequent landslides

Why Use GIS?
Basic precept of Water Quality Modeling Load = Flow x Concentration
Spatial Variability ArcView’s Hydrology Function Grids and Coverages
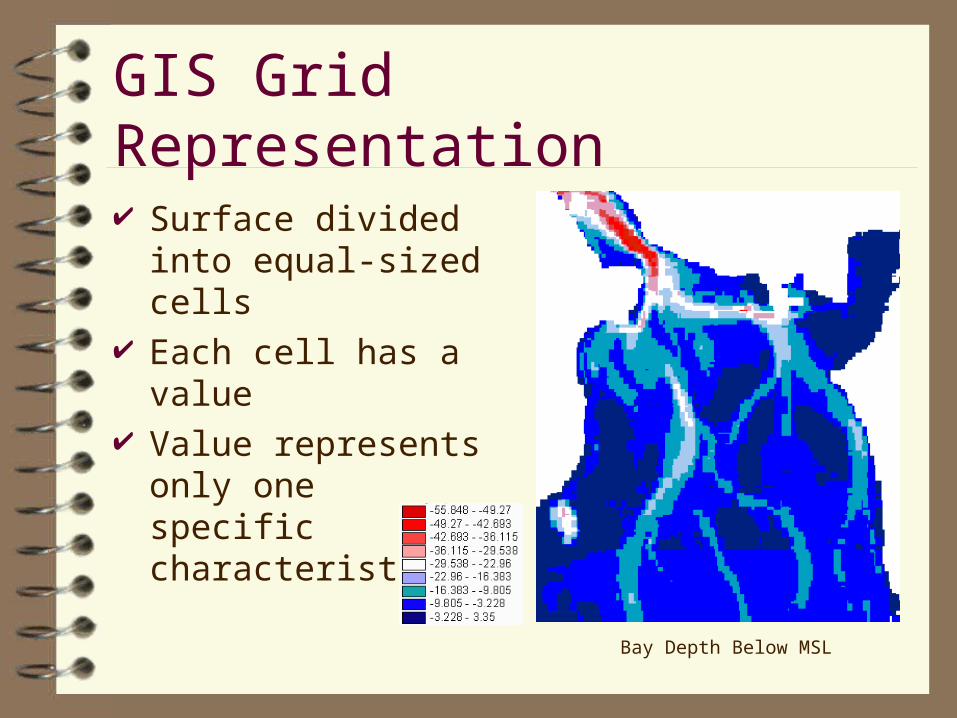
GIS Grid Representation
Surface divided into equal-sized cells
Each cell has a value
Value represents only one specific characteristic
Bay Depth Below MSL
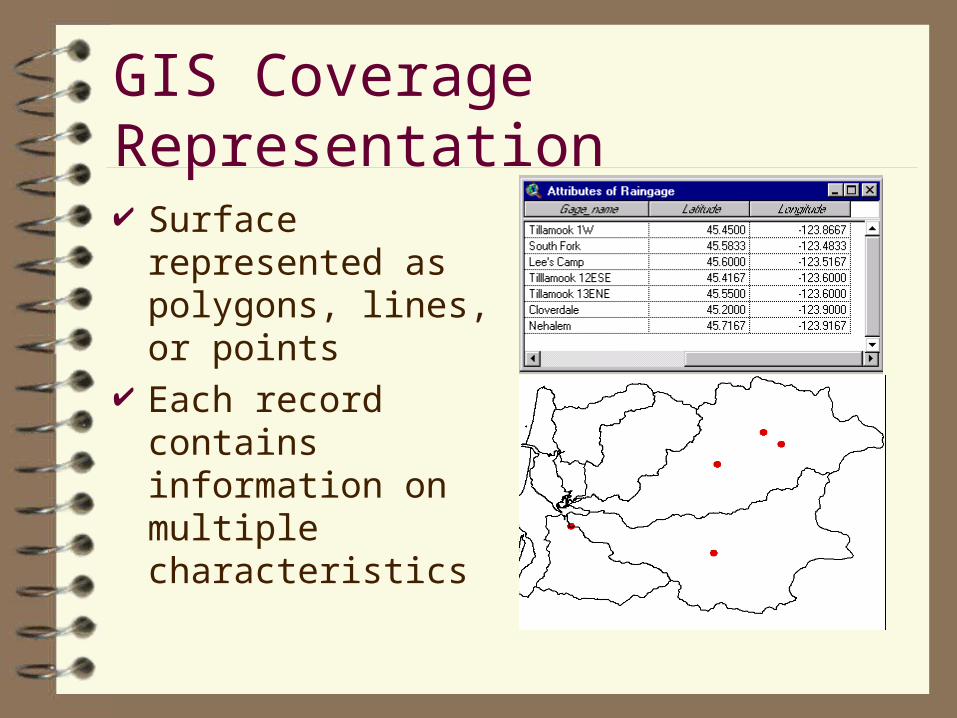
GIS Coverage Representation Surface
represented as polygons, lines, or points
Each record contains information on multiple characteristics

Developing the Model
ArcView Hydrology Functions
Flow Direction
Flow Accumulation
DEM Accumulation in Streams

Hydrology Model
Streamflow =
Runoff
+
Baseflow
Precip
Precip
Flow
Runoff,R
Baseflow,B B
R
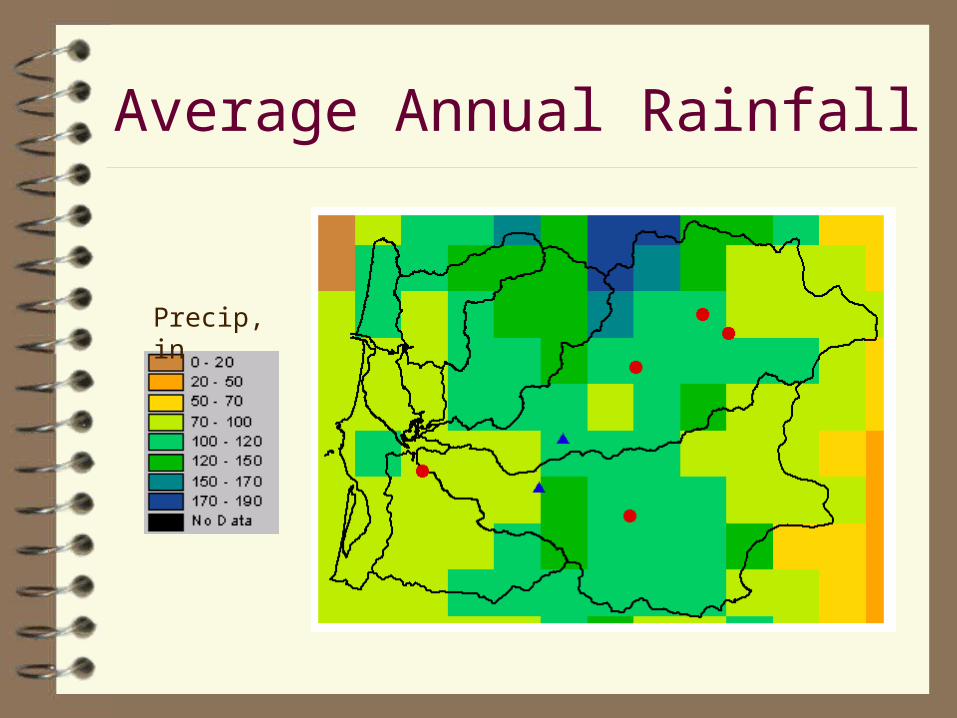
Average Annual Rainfall
Precip, in

Hydrology Model
20.00
40.00
60.00
80.00
100.00
120.00
40.00 60.00 80.00 100.00 120.00 140.00 160.00 180.00 200.00
0.00
10.00
20.00
30.00
40.00
50.00
60.00
40.00 60.00 80.00 100.00 120.00 140.00 160.00 180.00 200.00
P
RO
P
BF
Runoff Grid
Baseflow Grid
Precip Grid
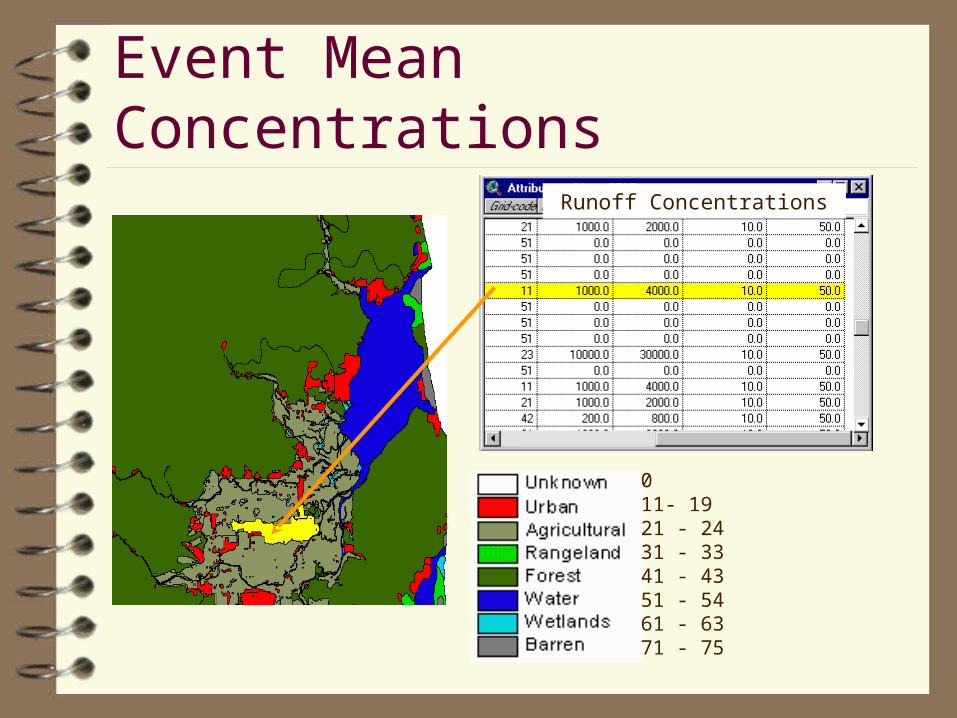
Event Mean Concentrations
011- 1921 - 2431 - 3341 - 4351 - 5461 - 6371 - 75
Runoff Concentrations
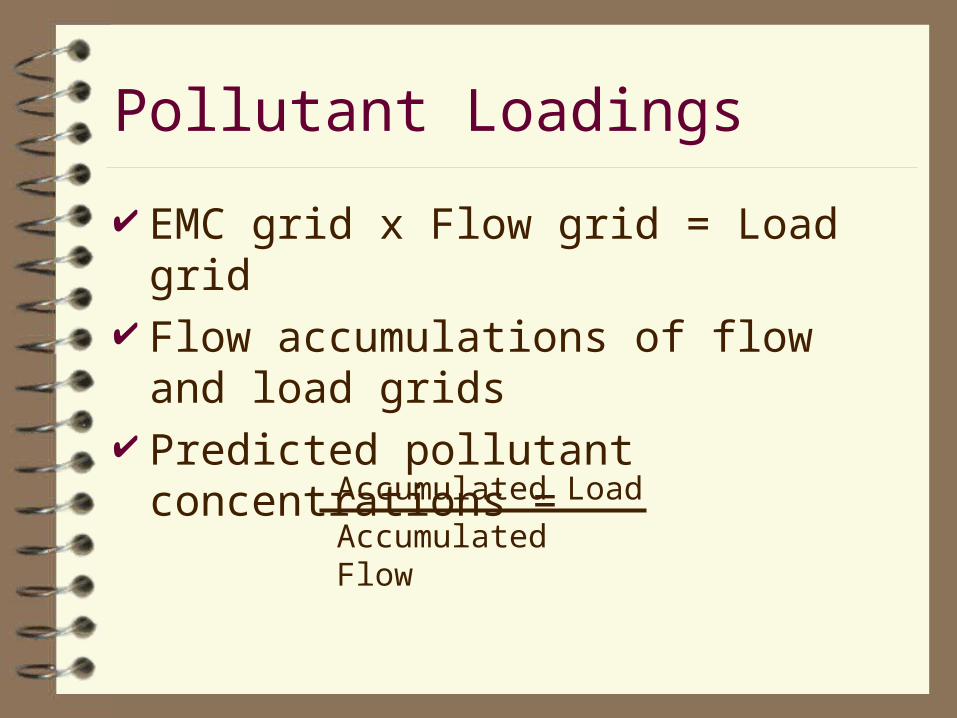
Pollutant Loadings
EMC grid x Flow grid = Load grid Flow accumulations of flow and
load grids Predicted pollutant concentrations
= Accumulated Load
Accumulated Flow

Using the Model
Incorporate Effects of BMPs Current focus is on CAFOs 3 BMPs to model
Representing spatial distribution Farm location vs land affected Use spatial average
Analysis by subwatershed or land use

Model Analysis
Clip out subwatershed of interest Export data to analyze BMP effects
or contribution
Trask River Land Use Trask River Coliform Runoff Load

Conclusions
Can build effective management tool
Effects of BMPs and relative contributions can be examined
Land UseStreamflow, %
ContributedFecal Coliform, %
ContributedUrban 0.76 2.01
Rural Residential 0.44 4.69
Dairy Operations 2.66 87.21
Forest 89.04 3.84
Other 7.10 2.24
100 100
Future Work
More work on sediment Incorporate BMP effects Model calibration
Related Documents


