454 36 A User-Centered Approach for Testing Spreadsheets Yirsaw Ayalew Spreadsheets are a special form of computer program, which are widely used in areas such as accounting, finance, business management, science and engineering. The wide use of spreadsheets can be attributed to the fact that they appeal to end-user programmers because they are easy to use and require no formal training on designing and programming techniques. However, as the literature indicates, a significant proportion of spreadsheets contain faults. This paper presents an approach for checking spreadsheets on the premises that their developers are not software professionals. It takes inherent characteristics of spreadsheets as well as the conceptual models of spread- sheet programmers into account and incorporates ideas from symbolic testing and interval analysis. To evaluate the methodology proposed, a prototype-tool preserving the look-and-feel spreadsheets developers are accustomed to has been developed. Introduction In business, many important decisions are based on the results of spreadsheet computations. Spreadsheet systems are also used for a variety of other important tasks such as mathematical modeling, scientific computation, tabular and graphical data presentation, data analysis and decision-making. The computational model of spreadsheets is even adapted to areas such as information visualization (Chi 1999), concurrent computation (Yoder and Cohn 1993, 1994), or user interface specifications (Hudson 1994) to name just a few. There was even a proposal to use the spreadsheet model as a general model for end-user programming (Nardi and Miller 1990). In light of this popularity, it seems surprising that a significant proportion of spreadsheets have severe quality problems. In recent years, there has been increased awareness of the potential impact of faulty spreadsheets on business and decision- making. A number of experimental studies and field audits (Brown and Gould 1987; Panko and Halverson 1996; Panko and Sprague 1998; Panko 1998, 1999; Panko 2000) have shown the serious impact spreadsheet errors have on business and other spreadsheet-based decisions. In (Clermont et al. 2002), it is indicated that even in environments where great care is taken for the correctness of “numbers”, spreadsheet quality is assessed on a value-based surface structure only. The deeper layer, i.e., the formula structure, is not sufficiently considered. Hence, users show undue reliance on accidental correctness of specific spreadsheet instances, instances that might even after moderate evolution show wrong and highly misleading results.

Welcome message from author
This document is posted to help you gain knowledge. Please leave a comment to let me know what you think about it! Share it to your friends and learn new things together.
Transcript
454
A User-Centered Approach for Testing Spreadsheets 455 454 Advances in Systems Modelling and ICT Applications
36A User-Centered Approach for Testing
Spreadsheets Yirsaw Ayalew
Spreadsheets are a special form of computer program, which are widely used in areas such as accounting, finance, business management, science and engineering. The wide use of spreadsheets can be attributed to the fact that they appeal to end-user programmers because they are easy to use and require no formal training on designing and programming techniques. However, as the literature indicates, a significant proportion of spreadsheets contain faults. This paper presents an approach for checking spreadsheets on the premises that their developers are not software professionals. It takes inherent characteristics of spreadsheets as well as the conceptual models of spread-sheet programmers into account and incorporates ideas from symbolic testing and interval analysis. To evaluate the methodology proposed, a prototype-tool preserving the look-and-feel spreadsheets developers are accustomed to has been developed.
IntroductionIn business, many important decisions are based on the results of spreadsheet computations. Spreadsheet systems are also used for a variety of other important tasks such as mathematical modeling, scientific computation, tabular and graphical data presentation, data analysis and decision-making. The computational model of spreadsheets is even adapted to areas such as information visualization (Chi 1999), concurrent computation (Yoder and Cohn 1993, 1994), or user interface specifications (Hudson 1994) to name just a few. There was even a proposal to use the spreadsheet model as a general model for end-user programming (Nardi and Miller 1990).
In light of this popularity, it seems surprising that a significant proportion of spreadsheets have severe quality problems. In recent years, there has been increased awareness of the potential impact of faulty spreadsheets on business and decision-making. A number of experimental studies and field audits (Brown and Gould 1987; Panko and Halverson 1996; Panko and Sprague 1998; Panko 1998, 1999; Panko 2000) have shown the serious impact spreadsheet errors have on business and other spreadsheet-based decisions. In (Clermont et al. 2002), it is indicated that even in environments where great care is taken for the correctness of “numbers”, spreadsheet quality is assessed on a value-based surface structure only. The deeper layer, i.e., the formula structure, is not sufficiently considered. Hence, users show undue reliance on accidental correctness of specific spreadsheet instances, instances that might even after moderate evolution show wrong and highly misleading results.
A User-Centered Approach for Testing Spreadsheets 455 454 Advances in Systems Modelling and ICT Applications
In trying to address the issue of spreadsheet quality, one has to recognize that spreadsheets are programming artifacts developed by application experts who are not professional programmers. The perceived simplicity of writing simple spread-sheets leads to write sheets of a size and/or complexity where formal quality assurance would be needed. However, conventional testing, as used with con-ventional software, is – for good reasons – not part of spreadsheet development methodologies. One might even question - whether there is any methodology comparable to classical software development methodologies, where a mix of methods and techniques for testing consumes a substantial portion of the overall life-cycle cost (Beizer 1990; Myers 1979; Sommerville 1992).
To address this issue, there are some attempts tackling the problem from different perspectives. Faults, which are not prevented during the earlier stages of development, can only be identified through detective mechanisms. Since with spreadsheet development, no well defined and user accepted development process can be postulated, many of the research works focus on detective approaches looking for (symptoms of) faults. This can be achieved through visualization and testing tools. Visualization approaches (Chen and Chan 2000; Clermont et al. 2002; Clermont 2003; Davis 1996; Igarashi et al. 1998; Mittermeir et al. 2000; Sajaniemi 2000; Shiozawa et al. 1999) are used to examine the validity of spreadsheet programs by tracing the interactions among cells to uncover unintended or missing connections. They indicate irregularities or mismatches between the physical structure and the invisible dataflow structure. However, visualization approaches do not focus on faults within the formulas; they rather try to highlight anomalies by investigating relationships among cells showing signs of potential errors. To our knowledge there have been only few attempts so far to tackle the problem of spreadsheet quality from a testing perspective. The most accessible systematic testing approach is the one proposed by (Rothermel et al. 1998; Rothermel et al. 2001). They introduced the idea of the all-uses dataflow adequacy criterion to spreadsheets.
This paper presents an approach for checking spreadsheets based on the premises that their developers are not software professionals. The approach takes inherent characteristics of spreadsheets as well as the conceptual models of spreadsheet programmers into account. In the broader context of this research, we distinguish between spreadsheet developers having rather a spatial model in mind – considering the sheet as an arrangement of values (and hence the formulas for computing them) in a plane – and developers having rather a numerical model in mind. The latter are assumed to consider a sheet as a network of formulas to compute certain (mutually related) values. This paper focuses on the second category of users. Hence, we assume this category of spreadsheet developers/users builds their sheet based on some numerical domain model of the problem to be solved. Thus, this category of users could at least for critical parts of the sheet indicate the ranges into which expected values of given cells might fall. These ranges are used for interval-calculations as explained in the sections to follow.
A User-Centered Approach for Testing Spreadsheets 457 456 Advances in Systems Modelling and ICT Applications A User-Centered Approach for Testing Spreadsheets 457 456 Advances in Systems Modelling and ICT Applications
Conventional Vs. Spreadsheet ProgramsTo assure not only theoretical feasibility but also practical applicability of a quality assurance methodology, it is important to consider the similarities and differences between spreadsheets and conventional software.
(Rothermel et al. 1998), identified order of evaluation, interactivity, and expertise of users as key-differences between spreadsheets and procedural programs. We noted some further aspects, which may have impact on testing spreadsheets.
• Structure of code: The structure of a spreadsheet is two-dimensional while the structure of a procedural code is represented linearly. In spreadsheet programming, placement of code is guided by the tabular layout of the results. Hence, the geometrical layout plays a major role.
• Separation of input/program/output: In procedural programs, there is a clear separation between input, program, and output. Spreadsheets, on the contrary, at least from the user’s point of view, do not have this explicit separation. A sheet’s cells contain both the input and the program (formula) while their visible part constitutes the spreadsheet’s output. The main part of the spreadsheet program, its formulas, is hidden below the surface. Thus, the computational structure is not readily available to the user
• Declarativeness: The ease of use of spreadsheet languages rests on their declarative nature (Miller 1990). The value of a cell is computed by the formula associated with the cell. The detailed procedure of computation is transferred to the system and hence no longer the programmer’s assumed responsibility. Formulas describe relations, which specify what is to be computed. Users’ understanding of the dependencies is at a higher semantic level.
Since spreadsheet writers would never classify themselves as programmers and since most of them might not even consider the artifacts they produced to be programs, they are not ready to listen to conventional teachings of software development methodology. As application experts, however, they have a gut feeling as to what a reasonable result of their sheets might be – at least for certain critical portions of the sheet. If this “gut feeling” can be systematically made known to the sheet, a tool can check it for consistency not only with computed values but also with the system of formulas constituting the better part of the sheet, a kind of indirect cross-validation can be obtained that will improve the overall quality of the sheet. The next section will show how this can be done systematically.
Interval-based Spreadsheet TestingSpreadsheets shield users from low-level details of traditional programming. They allow users to think in terms of tabular layouts of adequately arranged and tex-tually designated numbers, with formulas being the crucial constitutive element of spreadsheet programs. These formulas are mathematical expressions containing
A User-Centered Approach for Testing Spreadsheets 457 456 Advances in Systems Modelling and ICT Applications A User-Centered Approach for Testing Spreadsheets 457 456 Advances in Systems Modelling and ICT Applications
references to the values of other cells. It is fair to assume that most spreadsheet errors are introduced while creating formulas. Indeed, studies in (Brown and Gould 1987; Chadwick et al. 2000; Saariluoma and Sajaniemi 1994) have shown that the number of errors in formulas is higher than other errors found in spreadsheets. The proposed interval-analysis focuses specifically on the correctness of formulas in numerical computations based on previous work in (Ayalew et al. 2000; Ayalew 2001; Ayalew and Mittermeir 2002, 2003).
Rationale: A testing methodology for spreadsheets should take into consideration at least three points: It should be user-centered; it has to be spreadsheet-based; and it should take care of the situational characteristics of spreadsheets.
• A user-centered approach refers to a methodology, which takes into account both the expertise of users and the conceptual models users have in mind about their programs. Users just specify formulas to establish dependencies so that values of other cells can be used in a computation. Users of spreadsheet systems often do not know the far-reaching dependencies (full data-flow) relating computations in their sheet. Hence, they will not base their testing on the details of interrelated computations. The declarative nature of spreadsheet languages allows them to reason about their program just on the basis of short sections (adjacencies) in the full data-flow network connecting the sheet implicitly. Nevertheless, these (movable) limited windows of awareness allow them to state bounds on the expected values of outcomes of elementary computations based on the intended functionality of a given formula rather than on the structure of the sheet.
• A spreadsheet-based approach has to consider the coupling of input/program/output. In conventional testing, code and data are distinct entities. Hence, varying data has no effect on the integrity of the code. Since in spreadsheets code (formulas) and data are tightly interwoven, it is hard to assure that testers varying input are not sub-consciously also destroying figurative numeric constants or even full-fledged formulas. An approach assessing the sheet without directly manipulating the cells themselves would be preferable.
• Situational characteristics of spreadsheets: Users prefer spreadsheet systems because they are easy to use and enable them to develop working applications rapidly. Thus, they may not have the time and patience to check their programs by varying inputs (i.e., in essence generating test cases) for each formula cell in all environmental situations this cell might be evaluated. They might appreciate possibilities of validating groups of cells together, if this block of cells follows a common pattern. Assuming that the user/developer of the sheet is an application expert knowing “his/her” numbers, it is fair to ask him/her, what can be expected as reasonable results (expected minima and maxima), even if not all intermediate figures
A User-Centered Approach for Testing Spreadsheets 459 458 Advances in Systems Modelling and ICT Applications A User-Centered Approach for Testing Spreadsheets 459 458 Advances in Systems Modelling and ICT Applications
can be correctly assessed. However, with this implicit arithmetic model, an evaluation of the sheet can be performed.
Based on these considerations, we refrain from asking users to specify voluminous test suites. Instead, spreadsheet developers are asked to indicate the expected range of values a particular cell might assume. These intervals need not necessarily be given for each cell. They have to be given for critical cells though, i.e. for cells serving as sources in the (implicit) data flow – per default, one might say, for cells assuming the role of input cells – and for cells that are considered to be result cells, i.e. cells containing values that would be printed output with conventional programs or cells leading to important intermediate results.
Model: The previous section established that spreadsheets could be seen on several levels. For the purpose of this exposition, we need three levels:
• Value level: The values actually presented on the fully displayed sheet as desired by the application expert.
• Formula level: The formulas residing in those cells that are neither meant to be pure input cells nor void. For the sake of consistency, constants and input-cells are treated as formula containing just this value as constant.
• Data-flow level: It represents the network-structure of data-flow dependencies expressed by the references in the individual formulas. The computational requirements of spreadsheets ensure that this network has the form of a lattice for each well-defined sheet.
To accomplish our quality assurance goals, we add a fourth layer:• Interval level: Here the user can specify for desired cells the range of
expected values.
This additional level can be interpreted in two ways and thus opens up the opportunity to perceive the sheet from three perspectives (see Fig. 1).
• The actual sheet of discrete values computed by the regular spreadsheet program the user has written. This sheet contains the results of the computations the user wanted to have.
• The intervals in intermediate or source cells, interpreted as range specified by the human oracle.
• The interval program resulting from evaluating the formulas of the individual cells not by means of conventional arithmetic but by means of interval arithmetic over all those subsections of the data-flow network, where, due to interval-input in the source, interval computations can be performed. (Note that constants are treated as intervals of length 0). As will be shown later this allows not only to check numerical results for their reasonableness, it also allows to check whether the users’ expec-tations are consistent among themselves and consistent with respect to the model of the application expressed by the various interrelated spreadsheet formulas.
A User-Centered Approach for Testing Spreadsheets 459 458 Advances in Systems Modelling and ICT Applications A User-Centered Approach for Testing Spreadsheets 459 458 Advances in Systems Modelling and ICT Applications
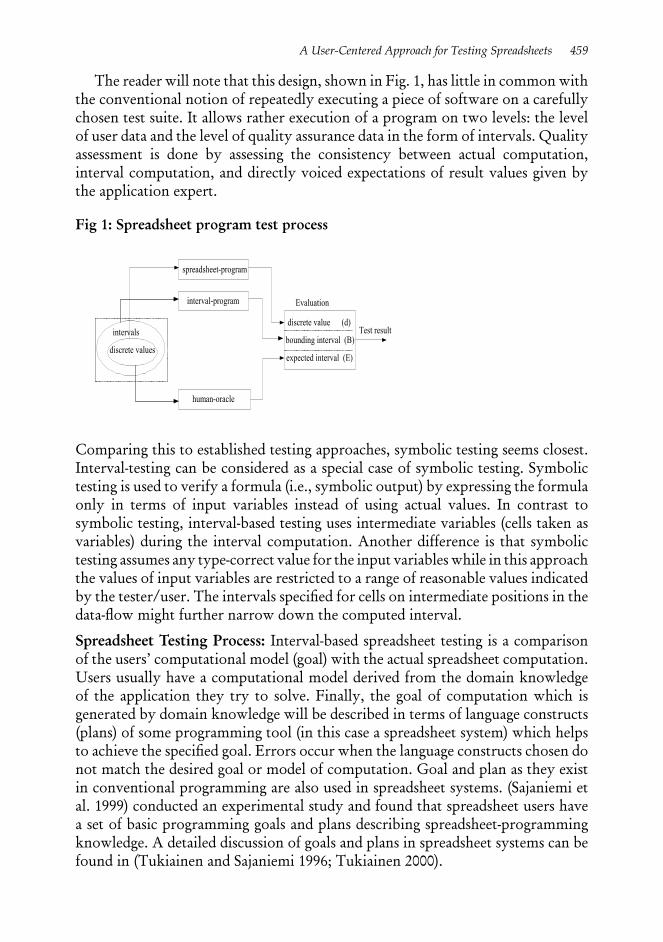
The reader will note that this design, shown in Fig. 1, has little in common with the conventional notion of repeatedly executing a piece of software on a carefully chosen test suite. It allows rather execution of a program on two levels: the level of user data and the level of quality assurance data in the form of intervals. Quality assessment is done by assessing the consistency between actual computation, interval computation, and directly voiced expectations of result values given by the application expert.
Fig 1: Spreadsheet program test process
intervals
discrete values
interval-program
human-oracle
discrete value (d)
bounding interval (B)
expected interval (E)
Test result
Evaluation
spreadsheet-program
Comparing this to established testing approaches, symbolic testing seems closest. Interval-testing can be considered as a special case of symbolic testing. Symbolic testing is used to verify a formula (i.e., symbolic output) by expressing the formula only in terms of input variables instead of using actual values. In contrast to symbolic testing, interval-based testing uses intermediate variables (cells taken as variables) during the interval computation. Another difference is that symbolic testing assumes any type-correct value for the input variables while in this approach the values of input variables are restricted to a range of reasonable values indicated by the tester/user. The intervals specified for cells on intermediate positions in the data-flow might further narrow down the computed interval.
Spreadsheet Testing Process: Interval-based spreadsheet testing is a comparison of the users’ computational model (goal) with the actual spreadsheet computation. Users usually have a computational model derived from the domain knowledge of the application they try to solve. Finally, the goal of computation which is generated by domain knowledge will be described in terms of language constructs (plans) of some programming tool (in this case a spreadsheet system) which helps to achieve the specified goal. Errors occur when the language constructs chosen do not match the desired goal or model of computation. Goal and plan as they exist in conventional programming are also used in spreadsheet systems. (Sajaniemi et al. 1999) conducted an experimental study and found that spreadsheet users have a set of basic programming goals and plans describing spreadsheet-programming knowledge. A detailed discussion of goals and plans in spreadsheet systems can be found in (Tukiainen and Sajaniemi 1996; Tukiainen 2000).
A User-Centered Approach for Testing Spreadsheets 461 460 Advances in Systems Modelling and ICT Applications A User-Centered Approach for Testing Spreadsheets 461 460 Advances in Systems Modelling and ICT Applications
In the interval-based model, the intervals specified by the application expert might be considered as goal, while the formulas are the expressions of the plan. However, since each operator in these formulas can be interpreted with conventional point arithmetic semantic as well as with interval arithmetic semantic, two versions of the plan exist. Both plans can be executed and this execution offers three chances of comparison (cf. Fig. 1). The discrete values d, resulting from executing the formulas with conventional point semantic, have to be within both, the intervals expected by the human oracle (application expert), E, as well as within the intervals resulting from executing the sheet with interval semantics, B. Since interval arithmetic yields the overall minimum and maximum, the bounding intervals B, resulting from the execution with interval semantics, have to contain the intervals E expected by the human oracle. Thus, one assumes that the expert’s deeper insight in the specific application semantic should lead to narrower ranges. If one of these comparisons fails, there is either a mismatch between the conceptual model and its realization in the formulas written into the cells or there is a mismatch in the expectations as to what ranges might actually be covered by the sheet. Either of these indicates a symptom of inconsistency or of a fault.
Thus, the comparison d ∈ E ∧ E ⊆ B reports no symptom of fault, whereas d ∉ E ∨ E ⊄ B indicates a symptom of fault. Currently, we are investigating the issue of decision making when there is some intersection between E and B but one is not a subset of the other. For those formula cells for which a symptom of fault is generated, further investigation is carried out using a fault tracing strategy. A discussion of the fault tracing strategy can be found in (Ayalew and Mittermeir 2003).
To summarize, one might note that these considerations have the following assumptions and consequences.
• Users do not have in mind exact values about the results of formulas, but they have some range of reasonable values, which can be expressed as intervals.
• Quality assessment can be conducted without touching any value of the original spreadsheet.
• During the comparison of spreadsheet computation, user expectation, and interval computation, boundary violations are only indicators of symptoms of faults.
• Errors within the boundaries of expected intervals can go unnoticed but might not harm dramatically.
• Ripple effects might lead to noticeable boundary violations.
System ArchitectureIn order to demonstrate the effectiveness of the interval-based testing methodology, a prototype tool was built. The tool incorporates a parser, an interval arithmetic
A User-Centered Approach for Testing Spreadsheets 461 460 Advances in Systems Modelling and ICT Applications A User-Centered Approach for Testing Spreadsheets 461 460 Advances in Systems Modelling and ICT Applications
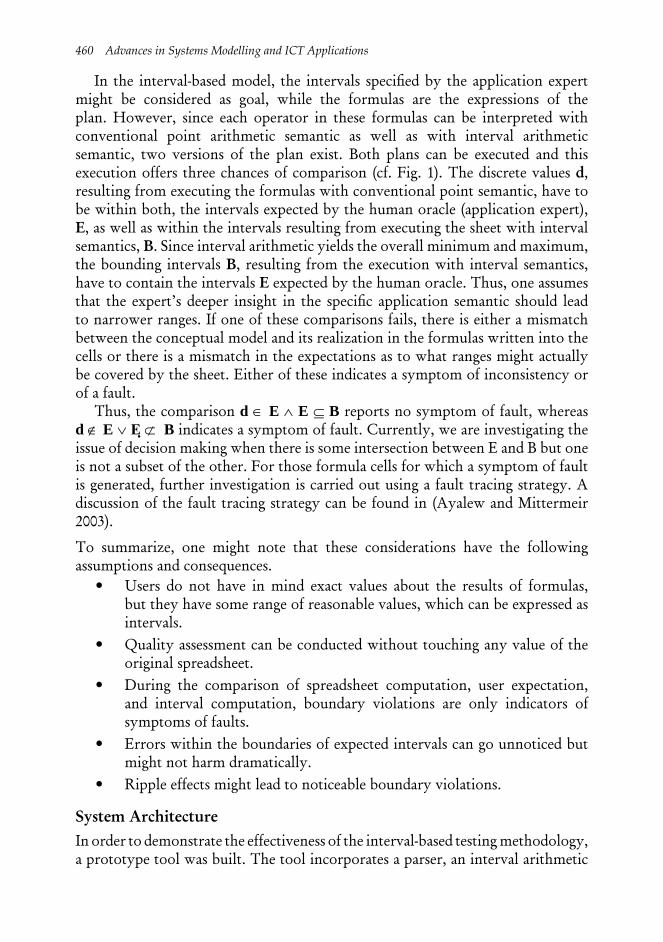
module, a comparator, and a fault tracer. Lead by its widespread use, we chose MS-Excel as pilot environment for demonstrating interval-based testing. For integration of this add-on, MS-Excel’s object model was used. The extensions were coded in Visual Basic. Fig. 2 depicts the general architecture chosen to integrate the interval-based testing prototype on top of MS Excel. This architecture indicates the dataflow between the different components of the system.
Fig 2: Architecture of the interval-based testing
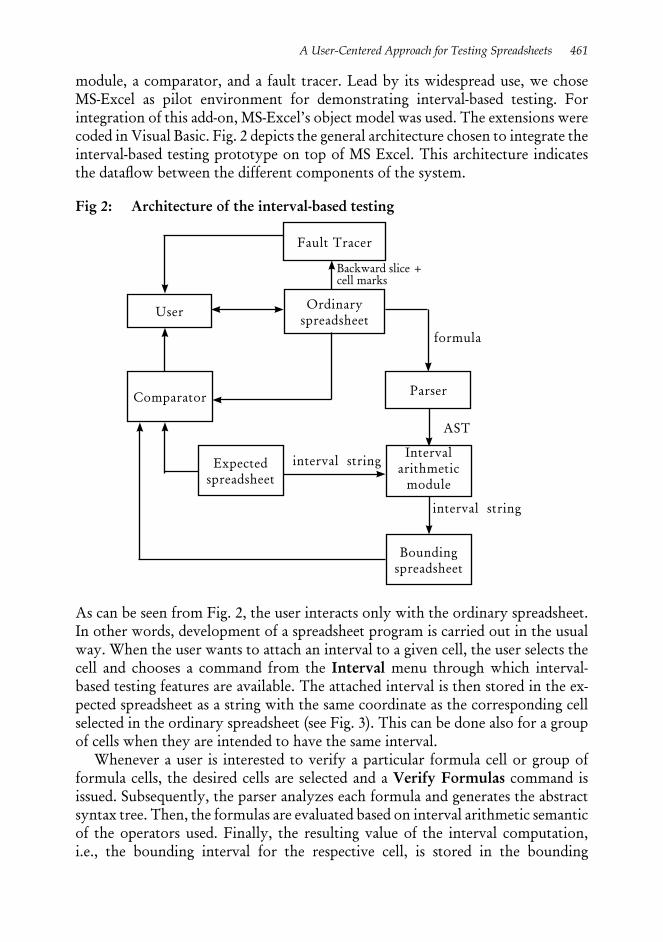
As can be seen from Fig. 2, the user interacts only with the ordinary spreadsheet. In other words, development of a spreadsheet program is carried out in the usual way. When the user wants to attach an interval to a given cell, the user selects the cell and chooses a command from the Interval menu through which interval-based testing features are available. The attached interval is then stored in the ex-pected spreadsheet as a string with the same coordinate as the corresponding cell selected in the ordinary spreadsheet (see Fig. 3). This can be done also for a group of cells when they are intended to have the same interval.
Whenever a user is interested to verify a particular formula cell or group of formula cells, the desired cells are selected and a Verify Formulas command is issued. Subsequently, the parser analyzes each formula and generates the abstract syntax tree. Then, the formulas are evaluated based on interval arithmetic semantic of the operators used. Finally, the resulting value of the interval computation, i.e., the bounding interval for the respective cell, is stored in the bounding
Fault Tracer
Ordinary spreadsheet
User
Comparator Parser
Expected spreadsheet
Interval arithmetic
module
Bounding spreadsheet
Backward slice + cell marks
formula
AST
interval string
interval string
A User-Centered Approach for Testing Spreadsheets 463 462 Advances in Systems Modelling and ICT Applications A User-Centered Approach for Testing Spreadsheets 463 462 Advances in Systems Modelling and ICT Applications
spreadsheet as a string since Excel neither supports interval data types nor allows user-defined data types. Once the necessary values are available from the three sources, i.e. spreadsheet computation, user expectation, and interval computation, the comparator determines the existence of symptoms of faults. Among those cells with symptoms of faults that contribute to a given faulty cell, the fault tracer identifies the most influential faulty cell.
Fig 3: Attaching an interval to a numeric cell
In a typical spreadsheet system, the majority of formulas are non-conditional. In those cases, applying interval arithmetic is straightforward. In conditional formulas, different computations are performed based on the computed truth-value of a condition. This implies that the result of executing a cell holding a conditional is not a single interval but a pair of intervals and the user is expected to attach intervals corresponding to each branch of the decision that will be executed. For example, for the formula IF(A1 > 5, A1*B1, A1-B1), the expectations are different based on whether the comparison A1 > 5 is true or false. For nested IFs the same procedure is applied. However, the representation becomes a set of intervals. To generalize the number of expected intervals, which are needed for nested IFs, let N be the number of nested IFs used in a formula. Then, N + 1 expected intervals are required. However, for a formula which involves N IFs without being nested (e.g. IF(...) + IF(...)), 2N expected intervals are needed. Since deep nesting of alternatives is rather exceptional, the current implementation supports only ordinary conditionals but not nested or multiple IFs.
A User-Centered Approach for Testing Spreadsheets 463 462 Advances in Systems Modelling and ICT Applications A User-Centered Approach for Testing Spreadsheets 463 462 Advances in Systems Modelling and ICT Applications
DiscussionSome initial experiments with the prototype showed that this approach is promising especially for cases where sheets go beyond a threshold of structural complexity while remaining (at least in the respective portion) small enough so that the users’ conceptual numeric model comes into play. An important observation in those cases was that actual deviations of bounding and expected intervals or of discrete values falling outside of the permissible interval were only part of the cases where faults were identified. Of about the same importance was the fact that spreadsheet-writers saw the need to systematically walk through their sheets and reflect on what actual permissible intervals could be. Doing so, they themselves made some top-of-the head interval calculations and doing so was in many cases sufficient to identify a problem in the sheet itself. Thus, we conclude that although we would not dare to recommend spreadsheet-writers a formal review of their work, the proposed methodology induces them to perform such a review in a systematic way along various dataflow-branches through the sheet. Another aspect worth reporting is the way users define their expected intervals varies. Some are using their domain knowledge and propose the tight bounds expected by the requirement E ⊆ B. Others, however, reason with “easy numbers”, i.e. with those suitable for doing mental calculations. This might lead to situations where E yields wider intervals than B and the system will point out this inconsistency. Situations like these require some additional explanations. However, even these users realize the value of the exercise since the reported inconsistency between the expected and computed intervals allows them to reflect again on what they have actually specified by the respective formula.
ConclusionThe rationale for interval-based testing is that testing approaches for spreadsheets should take into account the inherent characteristics of spreadsheets as well as the conceptual models of spreadsheet developers. Therefore, interval-based testing is proposed based on the premises that spreadsheets are mainly used for numerical computations and spreadsheet developers are end-users who are not expected to follow the formal process of software development.
Interval-based testing tries to establish a connection between the users’ numeric expectations relative to individual cells and how these expectations lead to intervals of potential values. Discrepancy between computed intervals and expected intervals will inform the user about divergences between the conceptual model and the specified model. Despite the requirement to attach intervals, the proposed approach does not require any knowledge of conventional software testing. As such, it is a user-centered approach. Further, the interval-definition phase requires the user to check and think about the functionality of the particular formula cell once again. Hence, this phase also serves as a kind of manual review process giving the methodology a combined feature of automatic testing and manual reviews.
A User-Centered Approach for Testing Spreadsheets 465 464 Advances in Systems Modelling and ICT Applications A User-Centered Approach for Testing Spreadsheets 465 464 Advances in Systems Modelling and ICT Applications
ReferencesAyalew, Y. (2001), ‘Spreadsheet Testing Using Interval Analysis’, (Klagenfurt University).
Ayalew, Y. and Mittermeir, R. (2002), ‘Interval-based Testing for Spreadsheets’, International Arab Conference on Information Technology (University of Qatar, Doha), 414 – 22.
--- (2003), ‘Spreadsheet Debugging’, Fourth International EuSpRIG Conference (Trinity College, Dublin, Ireland), 67 – 79.
Ayalew, Y., Clermont, M., and Mittermeir, R. (2000), ‘Detecting Errors in Spreadsheets’, EuSpRIG Symposium: Spreadsheet Risks, Audit & Development Methods (London: University of Greenwich), 51-62.
Beizer, B. (1990), Software Testing Techniques (2 edn.; New York: Van Nostrand Reinhold).
Brown, P. and Gould, J. (1987), ‘An Experimental Study of People Creating Spreadsheets’, ACM Transactions on Office Information Systems, 5 (3), 258-72.
Chadwick, D., Knight, B., and Rajalingham, K. (2000), ‘Quality Control in Spreadsheets: A Visual Approach using Color Codings to Reduce Errors in Formula’, . 8th International Conference on Software Quality Management.
Chen, Y. and Chan, H. (2000), ‘Visual Checking of Spreadsheet’, EuSpRIG 2000 Symposium: Spreadsheet Risks, Audit & Development Methods (London), 75 – 85.
Chi, E. (1999), ‘A Framework for Information Visualization Spreadsheets’, (University of Minnesota).
Clermont, M. (2003), ‘A Scalable Approach to Spreadsheet Visualization’, (Klagenfurt University).
Clermont, M., Hanin, C., and Mittermeir, R. (2002), ‘A Spreadsheet Auditing Tool Evaluated in an Industrial Context’, EuSpRIG, 35 - 46.
Davis, J. (1996), ‘Tools for Spreadsheet Auditing’, International Journal of Human-Computer Studies, 45 (4), 429-42.
Hudson, S. (1994), ‘User Interface Specification Using an Enhanced Spreadsheet Model’, ACM Transactions on Graphics, 209 – 39.
Igarashi, T., et al. (1998), ‘Fluid Visualization of Spreadsheet Structures’, IEEE Symposium on Visual Languages, 118 – 25
Miller, R. (1990), Computer-Aided Financial Analysis (Addison-Wesley).
Mittermeir, R., Clermont, M., and Ayalew, Y. (2000), ‘User-Centered Approaches for Improving Spreadsheet Quality’, (Klagenfurt: Klagenfurt University), 12.
Myers, G.J. (1979), The Art of Software Testing (Wiley-Interscience).
Nardi, B. and Miller, J. (1990), ‘The Spreadsheet Interface: A Basis for End User Programming’, (Hewlett-Packard Software Technology Laboratory).
Panko, R. R. (2000), ‘Two Corpuses of Spreadsheet Errors’, 33rd Hawaii International Conference on System Sciences.
Panko, R. R. and Halverson, R. P. (1996), ‘Spreadsheets on Trial: A Survey of Research on Spreadsheet Risks’, 29th Hawaii International Conference on System Sciences, 326-35.
A User-Centered Approach for Testing Spreadsheets 465 464 Advances in Systems Modelling and ICT Applications A User-Centered Approach for Testing Spreadsheets 465 464 Advances in Systems Modelling and ICT Applications
Panko, R. R. and Sprague, R. (1998), ‘Hitting the wall: Errors in developing and code inspecting a ‘simple’ spreadsheet model’, Decision Support Systems, 22 (4), 337-53.
Panko, R.R. (1998), ‘What We Know About Spreadsheet Errors’, Journal of End User Computing: Special Issue on Scaling up End User Development, 10 (2), 15-21.
--- (1999), ‘Applying Code Inspection to Spreadsheet Testing’, Journal of Management Information Systems, 16 (2), 159-76.
Rothermel, G., et al. (1998), ‘What You See Is What You Test: A Methodology for Testing Form-based Visual programs’, 20th International Conference on Software Engineering, 198-207.
--- (2001), ‘A Methodology for Testing Spreadsheets’, ACM Transactions on Software Engineering and Methodology, 10 (1), 110 – 47.
Saariluoma, P. and Sajaniemi, J. (1994), ‘Transforming Verbal Descriptions into Mathematical Formulas in Spreadsheet Calculation’, International Journal of Human-Computer Studies, 41 (6), 915-48.
Sajaniemi, J. (2000), ‘Modeling Spreadsheet Audit: A Rigorous Approach to Automatic Visualization’, Journal of Visual Languages and Computing, 11 (1), 49-82.
Sajaniemi, J., Tukiainen, M., and Vaisanen, J. (1999), ‘Goals and Plans In Spreadsheet Calculation’, (Department of Computer Science, University of Joensuu).
Shiozawa, H., Okada, K., and Matsushita, Y. (1999), ‘3D Interactive Visualization for Inter-Cell Dependencies of Spreadsheets’, IEEE Symposium on Information Visualization, 79-82.
Sommerville, I. (1992), Software Engineering (4th edn.: Addison-Wesley).
Tukiainen, M. (2000), ‘Uncovering Effects of Programming Paradigms: Errors in Two Spreadsheet Systems’, 12th Workshop of the Psychology of Programming Interest Group, 247-66.
Tukiainen, M. and Sajaniemi, J. (1996), ‘Spreadsheet Goal and Plan Catalog: Additive and Multiplicative Computational Goals and Plans in Spreadsheet Calculation’, (Department of Computer Science, University of Joensuu, Finland).
Yoder, A. and Cohn, D. (1993), ‘Architectural Issues in Spreadsheet Languages’, International Conference on Programming Languages and System Architectures.
--- (1994), ‘Real Spreadsheets for Real Programmers’, International Conference on Computer Languages, 20-30.
Related Documents