econstor Make Your Publications Visible. A Service of zbw Leibniz-Informationszentrum Wirtschaft Leibniz Information Centre for Economics Burns, Richard; Walker, Joe Article A Survey of Working Capital Policy among Small Manufacturing Firms Journal of Small Business Finance Provided in Cooperation with: The Academy of Entrepreneurial Finance (AEF), Los Angeles, CA, USA Suggested Citation: Burns, Richard; Walker, Joe (1991) : A Survey of Working Capital Policy among Small Manufacturing Firms, Journal of Small Business Finance, ISSN 1057-2287, JAI Press, Greenwich, CT, Vol. 1, Iss. 1, pp. 61-74 This Version is available at: http://hdl.handle.net/10419/114627 Standard-Nutzungsbedingungen: Die Dokumente auf EconStor dürfen zu eigenen wissenschaftlichen Zwecken und zum Privatgebrauch gespeichert und kopiert werden. Sie dürfen die Dokumente nicht für öffentliche oder kommerzielle Zwecke vervielfältigen, öffentlich ausstellen, öffentlich zugänglich machen, vertreiben oder anderweitig nutzen. Sofern die Verfasser die Dokumente unter Open-Content-Lizenzen (insbesondere CC-Lizenzen) zur Verfügung gestellt haben sollten, gelten abweichend von diesen Nutzungsbedingungen die in der dort genannten Lizenz gewährten Nutzungsrechte. Terms of use: Documents in EconStor may be saved and copied for your personal and scholarly purposes. You are not to copy documents for public or commercial purposes, to exhibit the documents publicly, to make them publicly available on the internet, or to distribute or otherwise use the documents in public. If the documents have been made available under an Open Content Licence (especially Creative Commons Licences), you may exercise further usage rights as specified in the indicated licence. www.econstor.eu

Welcome message from author
This document is posted to help you gain knowledge. Please leave a comment to let me know what you think about it! Share it to your friends and learn new things together.
Transcript
econstorMake Your Publications Visible.
A Service of
zbwLeibniz-InformationszentrumWirtschaftLeibniz Information Centrefor Economics
Burns, Richard; Walker, Joe
Article
A Survey of Working Capital Policy among SmallManufacturing Firms
Journal of Small Business Finance
Provided in Cooperation with:The Academy of Entrepreneurial Finance (AEF), Los Angeles, CA, USA
Suggested Citation: Burns, Richard; Walker, Joe (1991) : A Survey of Working Capital Policyamong Small Manufacturing Firms, Journal of Small Business Finance, ISSN 1057-2287, JAIPress, Greenwich, CT, Vol. 1, Iss. 1, pp. 61-74
This Version is available at:http://hdl.handle.net/10419/114627
Standard-Nutzungsbedingungen:
Die Dokumente auf EconStor dürfen zu eigenen wissenschaftlichenZwecken und zum Privatgebrauch gespeichert und kopiert werden.
Sie dürfen die Dokumente nicht für öffentliche oder kommerzielleZwecke vervielfältigen, öffentlich ausstellen, öffentlich zugänglichmachen, vertreiben oder anderweitig nutzen.
Sofern die Verfasser die Dokumente unter Open-Content-Lizenzen(insbesondere CC-Lizenzen) zur Verfügung gestellt haben sollten,gelten abweichend von diesen Nutzungsbedingungen die in der dortgenannten Lizenz gewährten Nutzungsrechte.
Terms of use:
Documents in EconStor may be saved and copied for yourpersonal and scholarly purposes.
You are not to copy documents for public or commercialpurposes, to exhibit the documents publicly, to make thempublicly available on the internet, or to distribute or otherwiseuse the documents in public.
If the documents have been made available under an OpenContent Licence (especially Creative Commons Licences), youmay exercise further usage rights as specified in the indicatedlicence.
www.econstor.eu
A Survey of Working Capital Policy Among Small Manufacturing Firms
Richard Burns Joe Walker
This study reports results of a nationwide survey on overall working capital policy of small manufacturing firms. The survey instrument used was a modified version of the 1980 Smith and Sell study [18] on large firms. A detailed 36-question form queried firms on their overall working capital policies as well as on the management of the components of working capital. Statistically significant measures of association between working capital policies and tools were found among many of the variables. However, many other expected relationships were not confirmed.
I. IN TR O D U C TIO N
Surveys indicate that a large portion of the financial manager’s time is devoted to working capital management. T his is not surprising in that current assets represent over 40% of the total assets of the typical manufacturing firm [12, p. 12]. Because of the magnitude and turnover rate of this investment, working capital policy and management are important to financial management.
W orking capital management is of particular importance to the small business. W ith lim ited access to the long-term capital markets, these firms must rely more heavily on owner financing, trade credit and short-term bank loans to finance their needed investment in cash, accounts receivable and inventory. In addition, poor financial management is one of the major causes of failure am ong smaller firms [1, 16].
If this failure rate could be reduced, it w ould go a long way towards improving the innovative capacity of the economy. It w ould also help reduce the unem ploym ent rate since new small businesses are one of the major sources of em ploym ent in the economy today (though there is controversy [22] as to the m agnitude of this effect.)
For working capital decisions, surveys to date^ on small businesses, like their counterparts on large businesses, have focused on the management of
Richard Bums and Joe Walker • Department of Finance, University of Alabama at Birmingham, Birmingham, AL 35294.
The Journal of Small Business Finance, 1(1): 61-74 Copyright® 1991 by JAI Press, Inc.ISSN: 1057-2287 All rights of reproduction in any form reserved.
the individual assets (e.g., cash [3,8,10,], accounts receivable [7,10], accounts payable [3, 8, 21] and inventory [9, 10, 13, 14]. But the only studies [18, 19] of overall working capital policy used samples based on Fortune’s 1000 and 500 largest industrial firms. The important finding of those studies was a sign ifican t relationsh ip between various success m easures and the employm ent of formal working capital policies and procedures. However, no similar broad-based studies have been made of overall working capital management am ong small firms.
T his study, therefore, is primarily an exploratory investigation of the extent to w hich various management tools and procedures are used in the overall management of working capital in small m anufacturing businesses.
T he questionnaire for the survey herein is based on the Smith and Sell study [18] referenced above,^ but some of the questions were deleted or modified to better target the small business audience. In addition, other questions were added to look at areas of small business financial management that the authors felt were relevant. T he survey was sent to small manufacturing firms across the United States. T he response rate was 8.5%. A lthough a copy of the survey itself can be obtained upon request from the authors, it was omitted from this paper due to space lim itations.
T he organization of this paper first describes the survey instrument and research design in Section II, reviews the results in Section III, presents an overall summary in Section IV, and then suggests im plications and directions for further research in Section V.
II. SURVEY AND RESEARCH DESIGN
The survey instrument used was an im posing seven page questionnadre that included 36 questions w ithin three major parts. Part I, “Company Inform ation,” was designed to establish the relative size and success of the firm. Part II, “Working Capital Policy,” was concerned with overall working capital policy including type, decision-maker, frequency of review, relative importance, and tools and procedures for management of overall working capital. Part III, “M anaging W orking Capital Com ponents,” investigated specific tools and procedures for m anaging the individual components of working capital, viz., cash, marketable securities, accounts receivable, inventory, accounts payable, and short-term borrowing.
Follow ing Smith and Sell [18], some questions asked the respondent to write in a response whereas others asked for a selection am ong alternatives or a ranking of the alternatives. Therefore, in the RESULTS section which follows shortly, the reader is cautioned to watch for a change in the style of summarization. An “other” alternative was provided on many questions,
62 JOURNAL OF SMALL BUSINESS FINANCE 1(1) 1991
and respondents were encouraged to write in comments wherever they felt appropriate.
The surveys were sent out during the period from January 1990 to July 1990. Questionnaires w ith cover letters and return envelopes were mailed after phone contact to 2127 small manufacturing firms in the United States. Although manufacturing firms are only about 9% of the population of firms, this category was chosen because of the anticipated hom ogeneity of responses. T he m ailing list was obtained from Zeller & Letica, and it included all manufacturing firms with an employee range of 25 to 100. A lthough this size range was originally chosen as part of an earlier SBA research proposal, many of the firms on the m ailing list had experienced significant growth in the number of employees. Therefore, it was decided to include all size firms up to 500 employees, the SBA size definition for most small manufacturing businesses [4]. Out of 186 responses, 184 were w ithin the 500 employee limit. Although this sample is obviously biased toward the lower end of that range, it may not be a serious problem since firms with 100 employees or less comprise 97.9% of the SBA Small Business Data Base [11].
III. RESULTS
The results in this section are covered under three headings:
(1) Company Information,(2) W orking Capital Policy, and(3) M anaging W orking Capital Components.
Company Information Results
The first five questions in the “company inform ation” section were designed to collect summary statistics on the firm. Statistics on this are given in Table 1.
T he average age of the small businesses in this survey is probably high when compared to that of small businesses in general. However, it is probably more typical of the manufacturing segment which has been losing ground to newer service-oriented firms in the last decade and also because the capital intensity of manufacturing industries discourages entry. In any case, this sample thus represents a group of more stable small businesses.
Follow ing the Sm ith and Sell [18] m ethodology, for statistical inference purposes, the responding firms were broken down into three subgroups according to sales^: large (greater than $6 m illion), medium (between $4 and $6 m illion), and small (under |4 m illion). However, because of lack of access
A Survey of Working Capital Policy Among Small Manufacturing Firms 63
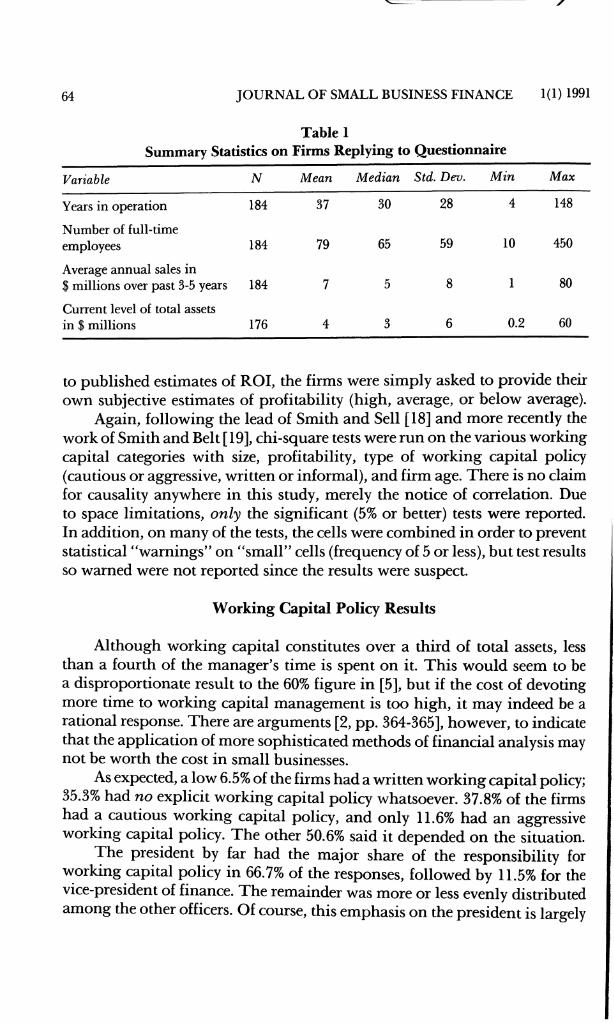
Table 1Summary Statistics on Firms Replying to Questionnaire
64 JOURNAL OF SMALL BUSINESS FINANCE 1(1)1991
Variable N Mean Median Std. Dev. Min Max
Years in operation 184 37 30 28 4 148
Number of full-time employees 184 79 65 59 10 450
Average annual sales in $ millions over past 3-5 years 184 7 5 8 1 80
Current level of total assets in 1 millions 176 4 3 6 0.2 60
to published estimates of ROI, the firms were sim ply asked to provide their own subjective estimates of profitability (high, average, or below average).
Again, follow ing the lead of Smith and Sell [18] and more recently the work of Smith and Belt [19], chi-square tests were run on the various working capital categories with size, profitability, type of working capital policy (cautious or aggressive, written or informal), and firm age. There is no claim for causality anywhere in this study, merely the notice of correlation. Due to space lim itations, only the significant (5% or better) tests were reported. In addition, on many of the tests, the cells were combined in order to prevent statistical “warnings” on “sm all” cells (frequency of 5 or less), but test results so warned were not reported since the results were suspect.
W orking Capital Policy Results
Although working capital constitutes over a third of total assets, less than a fourth of the manager’s time is spent on it. T his w ould seem to be a disproportionate result to the 60% figure in [5], but if the cost of devoting more time to working capital management is too high, it may indeed be a rational response. There are arguments [2, pp. 364-365], however, to indicate that the application of more sophisticated methods of financial analysis may not be worth the cost in small businesses.
As expected, a low 6.5% of the firms had a written working capital policy; 35.3% had no explicit working capital policy whatsoever. 37.8% of the firms had a cautious working capital policy, and only 11.6% had an aggressive working capital policy. The other 50.6% said it depended on the situation.
The president by far had the major share of the responsibility for working capital policy in 66.7% of the responses, followed by 11.5% for the vice-president of finance. The remainder was more or less evenly distributed among the other officers. Of course, this emphasis on the president is largely
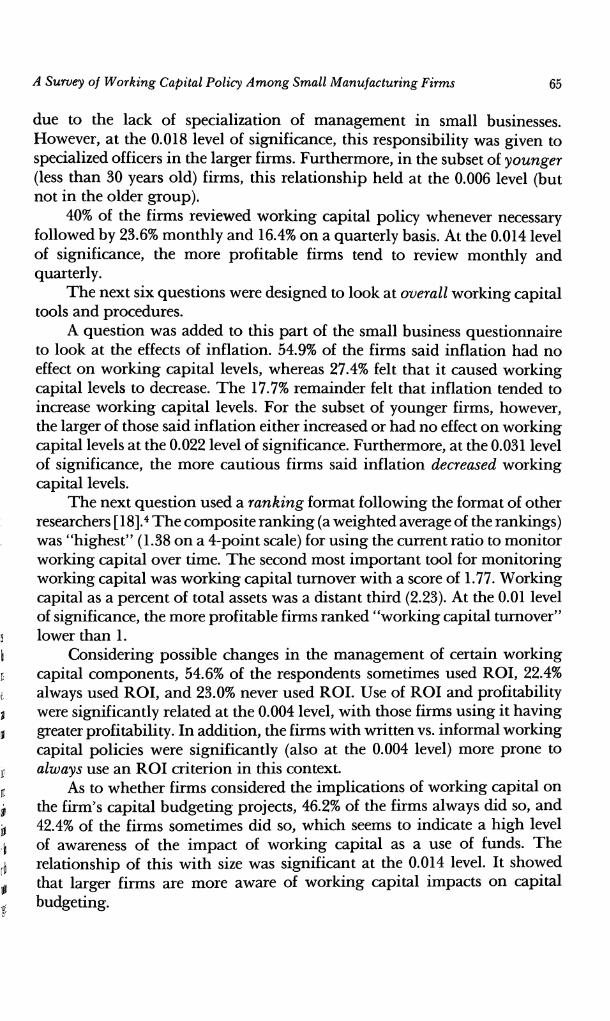
due to the lack of specialization of management in small businesses. However, at the 0.018 level of significance, this responsibility was given to specialized officers in the larger firms. Furthermore, in the subset of younger (less than 30 years old) firms, this relationship held at the 0.006 level (but not in the older group).
40% of the firms reviewed working capital policy whenever necessary followed by 23.6% m onthly and 16.4% on a quarterly basis. At the 0.014 level of significance, the more profitable firms tend to review m onthly and quarterly.
T he next six questions were designed to look at overall working capital tools and procedures.
A question was added to this part of the small business questionnaire to look at the effects of inflation. 54.9% of the firms said inflation had no effect on working capital levels, whereas 27.4% felt that it caused working capital levels to decrease. T he 17.7% remainder felt that inflation tended to increase working capital levels. For the subset of younger firms, however, the larger of those said inflation either increased or had no effect on working capital levels at the 0.022 level of significance. Furthermore, at the 0.031 level of significance, the more cautious firms said inflation decreased working capital levels.
T he next question used a ranking format follow ing the format of other researchers [18].^ T he com posite ranking (a weighted average of the rankings) was “highest” (1.38 on a 4-point scale) for using the current ratio to monitor working capital over dme. T he second most important tool for m onitoring working capital was working capital turnover with a score of 1.77. Working capital as a percent of total assets was a distant third (2.23). At the 0.01 level of significance, the more profitable firms ranked “working capital turnover” lower than 1.
Considering possible changes in the management of certain working capital components, 54.6% of the respondents sometimes used ROI, 22.4% always used ROI, and 23.0% never used ROI. Use of ROI and profitability were significantly related at the 0.004 level, w ith those firms using it having greater profitability. In addition, the firms w ith written vs. informal working capital policies were significantly (also at the 0.004 level) more prone to always use an ROI criterion in this context.
As to whether firms considered the im plications of working capital on the firm’s capital budgeting projects, 46.2% of the firms always did so, and 42.4% of the firms sometimes did so, w hich seems to indicate a high level of awareness of the im pact of working capital as a use of funds. The relationship of this w ith size was significant at the 0.014 level. It showed that larger firms are more aware of working capital impacts on capital budgeting.
A Survey of Working Capital Policy Among Small Manufacturing Firms 65
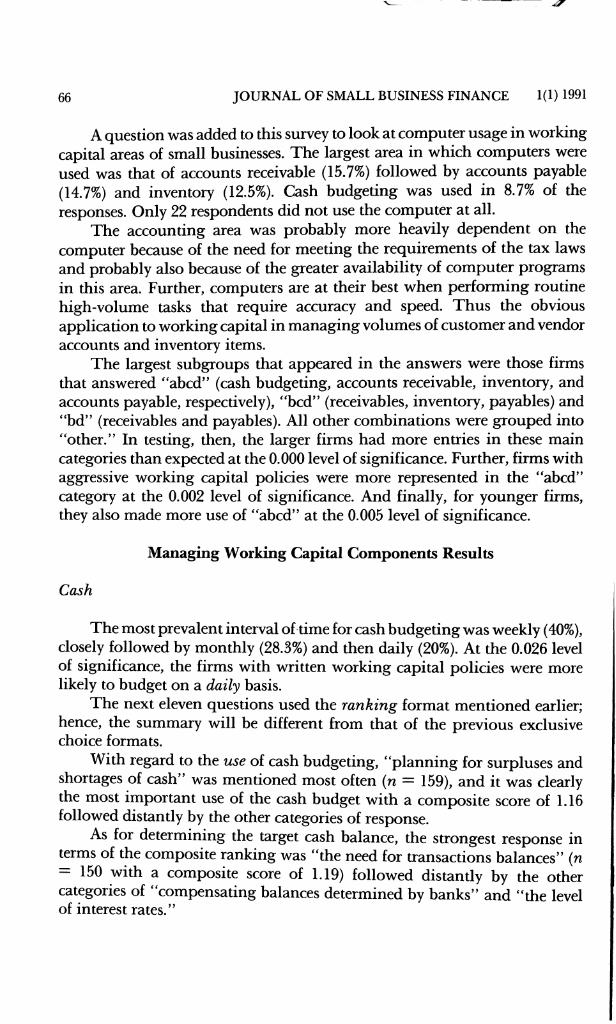
A question was added to this survey to look at computer usage in working capital areas of small businesses. The largest area in which computers were used was that of accounts receivable (15.7%) followed by accounts payable (14.7%) and inventory (12.5%). Cash budgeting was used in 8.7% of the responses. Only 22 respondents did not use the computer at all.
The accounting area was probably more heavily dependent on the computer because of the need for meeting the requirements of the tax laws and probably also because of the greater availability of computer programs in this area. Further, computers are at their best when performing routine high-volum e tasks that require accuracy and speed. T hus the obvious application to working capital in m anaging volum es of customer and vendor accounts and inventory items.
T he largest subgroups that appeared in the answers were those firms that answered “abed” (cash budgeting, accounts receivable, inventory, and accounts payable, respectively), “bed” (receivables, inventory, payables) and “bd” (receivables and payables). All other com binations were grouped into “other.” In testing, then, the larger firms had more entries in these main categories than expected at the 0.000 level of significance. Further, firms with aggressive working capital policies were more represented in the “abed” category at the 0.002 level of significance. And finally, for younger firms, they also made more use of “abed” at the 0.005 level of significance.
M anaging Working Capital Components Results
Cash
T he most prevalent interval of time for cash budgeting was weekly (40%), closely followed by monthly (28.3%) and then daily (20%). At the 0.026 level of significance, the firms with written working capital policies were more likely to budget on a daily basis.
The next eleven questions used the ranking format mentioned earlier; hence, the summary w ill be different from that of the previous exclusive choice formats.
With regard to the use of cash budgeting, “planning for surpluses and shortages of cash” was mentioned most often (n = 159), and it was clearly the most important use of the cash budget with a com posite score of 1.16 followed distantly by the other categories of response.
As for determining the target cash balance, the strongest response in terms of the composite ranking was “the need for transactions balances” (n = 150 with a composite score of 1.19) followed distantly by the other categories of “compensating balances determined by banks” and “the level of interest rates.”
66 JOURNAL OF SMALL BUSINESS FINANCE 1(1) 1991
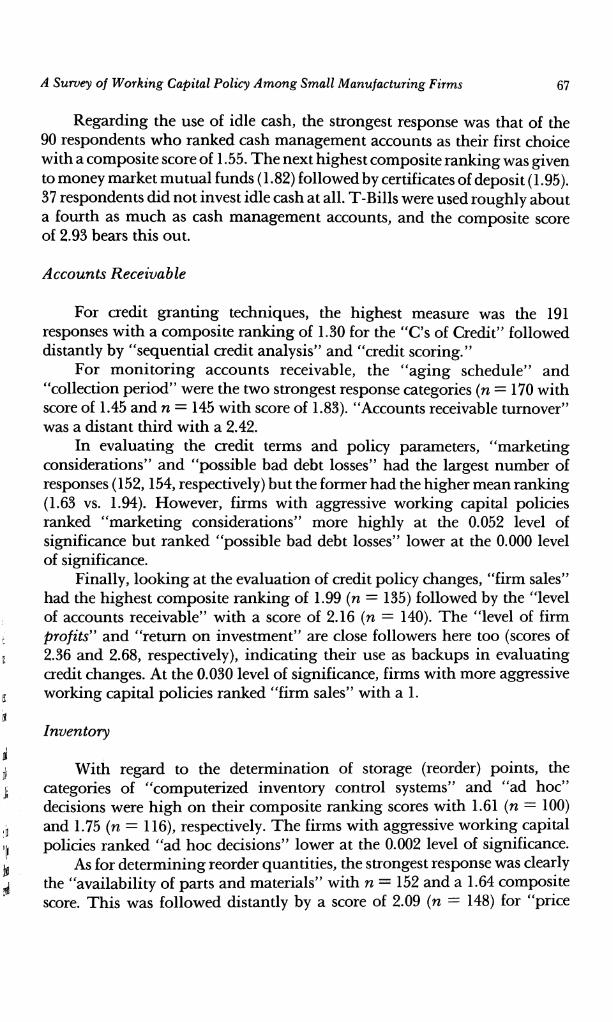
Regarding the use of idle cash, the strongest response was that of the 90 respondents w ho ranked cash management accounts as their first choice with a com posite score of 1.55. T he next highest composite ranking was given to money market mutual funds (1.82) followed by certificates of deposit (1.95). 37 respondents did not invest idle cash at all. T-Bills were used roughly about a fourth as m uch as cash management accounts, and the composite score of 2.93 bears this out.
Accounts Receivable
For credit granting techniques, the highest measure was the 191 responses w ith a com posite ranking of 1.30 for the “C’s of Credit” followed distantly by “sequential credit analysis” and “credit scoring.”
For m onitoring accounts receivable, the “aging schedule” and “collection period” were the two strongest response categories (n = 170 with score of 1.45 and n = 145 w ith score of 1.83). “Accounts receivable turnover” was a distant third w ith a 2.42.
In evaluating the credit terms and policy parameters, “marketing considerations” and “possible bad debt losses” had the largest number of responses (152,154, respectively) but the former had the higher mean ranking (1.63 vs. 1.94). However, firms with aggressive working capital policies ranked “marketing considerations” more highly at the 0.052 level of significance but ranked “possible bad debt losses” lower at the 0.000 level of significance.
Finally, looking at the evaluation of credit policy changes, “firm sales” had the highest com posite ranking of 1.99 (n = 135) followed by the “level of accounts receivable” w ith a score of 2.16 (n = 140). T he “level of firm profits” and “return on investment” are close followers here too (scores of 2.36 and 2.68, respectively), indicating their use as backups in evaluating credit changes. At the 0.030 level of significance, firms with more aggressive working capital policies ranked “firm sales” w ith a 1.
Inventory
With regard to the determination of storage (reorder) points, the categories of “computerized inventory control systems” and “ad hoc” decisions were high on their com posite ranking scores with 1.61 {n = 100) and 1.75 {n = 116), respectively. The firms w ith aggressive working capital policies ranked “ad hoc decisions” lower at the 0.002 level of significance.
As for determ ining reorder quantities, the strongest response was clearly the “availability of parts and materials” with n = 152 and a 1.64 composite score. T his was followed distantly by a score of 2.09 (n = 148) for “price
A Survey of Working Capital Policy Among Small Manufacturing Firms 67
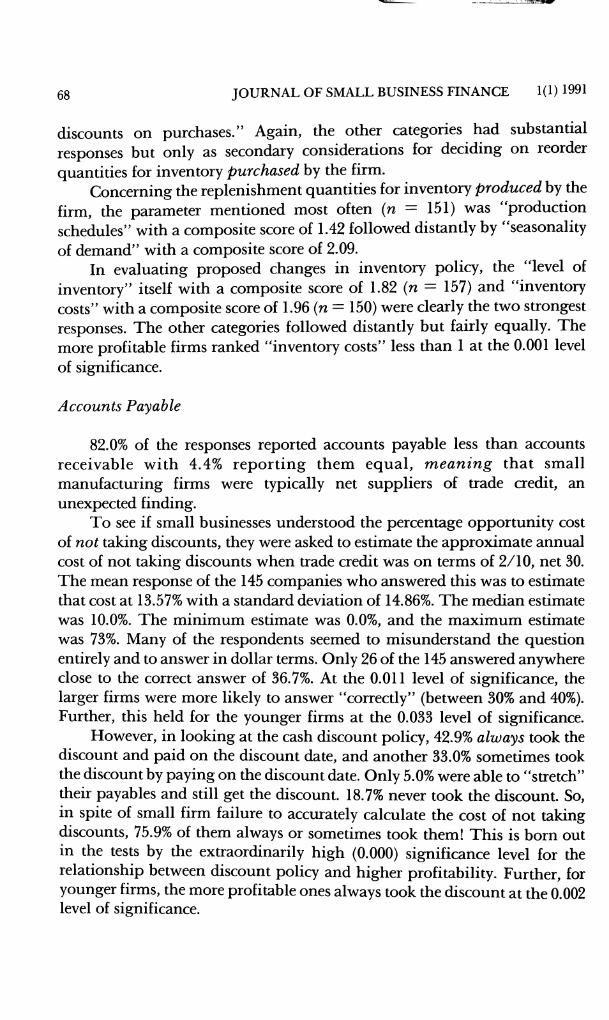
discounts on purchases.” Again, the other categories had substantial responses but only as secondary considerations for deciding on reorder
quantities for inventory purchased by the firm.Concerning the replenishment quantities for inventory produced by the
firm, the parameter mentioned most often (n = 151) was “production schedules” with a composite score of 1.42 followed distantly by “seasonality
of demand” with a composite score of 2.09.In evaluating proposed changes in inventory policy, the “level of
inventory” itself with a composite score of 1.82 {n = 157) and “inventory costs” with a composite score of 1.96 (n = 150) were clearly the two strongest responses. T he other categories followed distantly but fairly equally. The more profitable firms ranked “inventory costs” less than 1 at the 0.001 level of significance.
Accounts Payable
82.0% of the responses reported accounts payable less than accounts receivable w ith 4.4% rep ortin g them eq u a l, m ean in g that sm all manufacturing firms were typically net suppliers of trade credit, an unexpected finding.
T o see if small businesses understood the percentage opportunity cost of not taking discounts, they were asked to estimate the approximate annual cost of not taking discounts when trade credit was on terms of 2/10, net 30. The mean response of the 145 companies w ho answered this was to estimate that cost at 13.57% with a standard deviation of 14.86%. T he median estimate was 10.0%. T he m inim um estimate was 0.0%, and the m axim um estimate was 73%. Many of the respondents seemed to misunderstand the question entirely and to answer in dollar terms. Only 26 of the 145 answered anywhere close to the correct answer of 36.7%. At the 0.011 level of significance, the larger firms were more likely to answer “correctly” (between 30% and 40%). Further, this held for the younger firms at the 0.033 level of significance.
However, in looking at the cash discount policy, 42.9% always took the discount and paid on the discount date, and another 33.0% sometimes took the discount by paying on the discount date. Only 5.0% were able to “stretch” their payables and still get the discount. 18.7% never took the discount. So, in spite of small firm failure to accurately calculate the cost of not taking discounts, 75.9% of them always or sometimes took them! T his is born out in the tests by the extraordinarily high (0.000) significance level for the relationship between discount policy and higher profitability. Further, for younger firms, the more profitable ones always took the discount at the 0.002 level of significance.
68 JOURNAL OF SMALL BUSINESS FINANCE 1(1) 1991
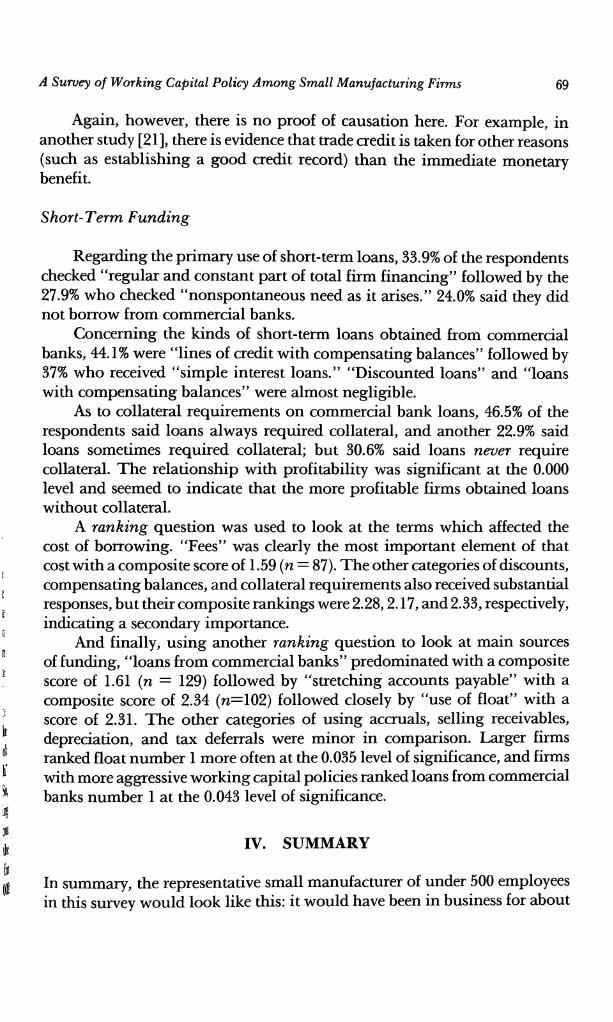
Again, however, there is no proof of causation here. For example, in another study [21], there is evidence that trade credit is taken for other reasons (such as establishing a good credit record) than the immediate monetary benefit.
Short-Term Funding
Regarding the primary use of short-term loans, 33.9% of the respondents checked “regular and constant part of total firm financing” follov^ed by the 27.9% w ho checked “nonspontaneous need as it arises.” 24.0% said they did not borrow from commercial banks.
Concerning the kinds of short-term loans obtained from commercial banks, 44.1% were “lines of credit w ith compensating balances” followed by 37% w ho received “sim ple interest loans.” “Discounted loans” and “loans with com pensating balances” were almost negligible.
As to collateral requirements on commercial bank loans, 46.5% of the respondents said loans always required collateral, and another 22.9% said loans sometimes required collateral; but 30.6% said loans never require collateral. T he relationship w ith profitability was significant at the 0.000 level and seemed to indicate that the more profitable firms obtained loans without collateral.
A ranking question was used to look at the terms which affected the cost of borrowing. “Fees” was clearly the most important element of that cost with a com posite score of 1.59 (n = 87). The other categories of discounts, compensating balances, and collateral requirements also received substantial responses, but their com posite rankings were 2.28,2.17, and 2.33, respectively, indicating a secondary importance.
And finally, using another ranking question to look at main sources of funding, “loans from commercial banks” predominated with a composite score of 1.61 (n — 129) followed by “stretching accounts payable” with a composite score of 2.34 (n=102) followed closely by “use of float” with a score of 2.31. T he other categories of using accruals, selling receivables, depreciation, and tax deferrals were minor in comparison. Larger firms ranked float number 1 more often at the 0.035 level of significance, and firms with more aggressive working capital policies ranked loans from commercial banks number 1 at the 0.043 level of significance.
IV. SUMMARY
In summary, the representative small manufacturer of under 500 employees in this survey w ould look like this: it w ould have been in business for about
A Survey of Working Capital Policy Among Small Manufacturing Firms 69
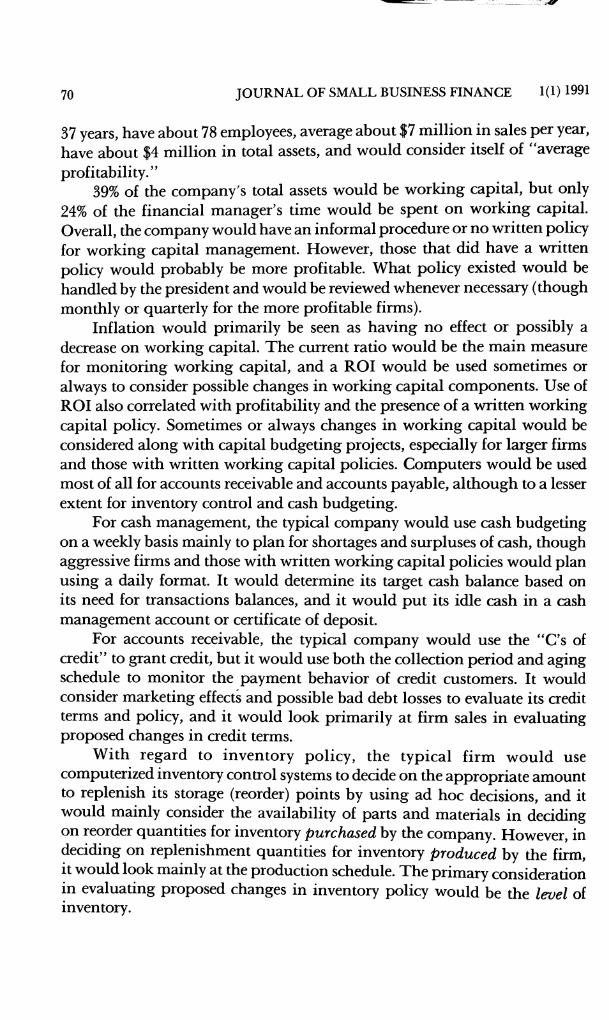
37 years, have about 78 employees, average about $7 m illion in sales per year, have about $4 m illion in total assets, and w ould consider itself of “average
profitability.”39% of the company's total assets w ould be working capital, but only
24% of the financial manager’s time w ould be spent on working capital. Overall, the company w ould have an informal procedure or no written policy for working capital management. However, those that did have a written policy would probably be more profitable. What policy existed w ould be handled by the president and would be reviewed whenever necessary (though monthly or quarterly for the more profitable firms).
Inflation w ould primarily be seen as having no effect or possibly a decrease on working capital. The current ratio w ould be the m ain measure for m onitoring working capital, and a ROI w ould be used sometimes or always to consider possible changes in working capital com ponents. Use of ROI also correlated with profitability and the presence of a written working capital policy. Sometimes or always changes in working capital would be considered along with capital budgeting projects, especially for larger firms and those with written working capital policies. Computers w ould be used most of all for accounts receivable and accounts payable, although to a lesser extent for inventory control and cash budgeting.
For cash management, the typical company w ould use cash budgeting on a weekly basis m ainly to plan for shortages and surpluses of cash, though aggressive firms and those w ith written working capital policies w ould plan using a daily format. It w ould determine its target cash balance based on its need for transactions balances, and it w ould put its idle cash in a cash management account or certificate of deposit.
For accounts receivable, the typical company w ould use the “C’s of credit” to grant credit, but it would use both the collection period and aging schedule to monitor the payment behavior of credit customers. It would consider marketing effects and possible bad debt losses to evaluate its credit terms and policy, and it would look primarily at firm sales in evaluating proposed changes in credit terms.
W ith regard to inventory p o licy , the typical firm w ou ld use computerized inventory control systems to decide on the appropriate amount to replenish its storage (reorder) points by using ad hoc decisions, and it would mainly consider the availability of parts and materials in deciding on reorder quantities for inventory purchased by the company. However, in deciding on replenishment quantities for inventory produced by the firm, it would look m ainly at the production schedule. The primary consideration in evaluating proposed changes in inventory policy w ould be the level of inventory.
70 JOURNAL OF SMALL BUSINESS FINANCE 1(1) 1991
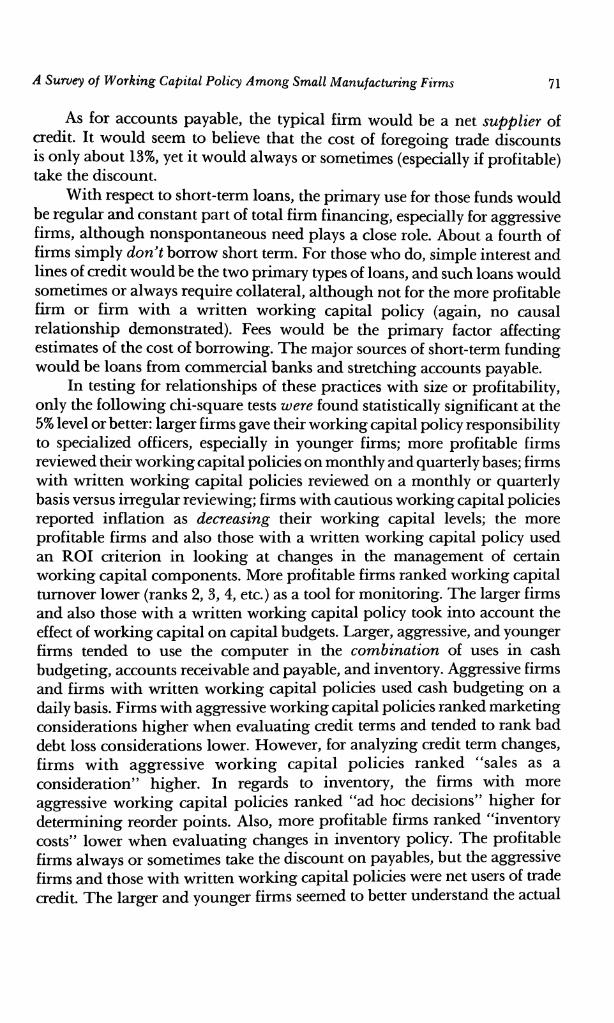
As for accounts payable, the typical firm w ould be a net supplier of credit. It w ould seem to believe that the cost of foregoing trade discounts is only about 13%, yet it w ould always or sometimes (especially if profitable) take the discount.
W ith respect to short-term loans, the primary use for those funds would be regular and constant part of total firm financing, especially for aggressive firms, although nonspontaneous need plays a close role. About a fourth of firms sim ply don’t borrow short term. For those who do, simple interest and lines of credit w ould be the two primary types of loans, and such loans would sometimes or always require collateral, although not for the more profitable firm or firm with a written working capital policy (again, no causal relationship demonstrated). Fees would be the primary factor affecting estimates of the cost of borrowing. The major sources of short-term funding w ould be loans from commercial banks and stretching accounts payable.
In testing for relationships of these practices with size or profitability, only the fo llow ing chi-square tests were found statistically significant at the 5% level or better: larger firms gave their working capital policy responsibility to specialized officers, especially in younger firms; more profitable firms reviewed their working capital policies on m onthly and quarterly bases; firms with v^itten working capital policies reviewed on a m onthly or quarterly basis versus irregular reviewing; firms w ith cautious working capital policies reported inflation as decreasing their working capital levels; the more profitable firms and also those w ith a written working capital policy used an ROI criterion in looking at changes in the management of certain working capital components. More profitable firms ranked working capital turnover lower (ranks 2, 3, 4, etc.) as a tool for monitoring. The larger firms and also those w ith a written working capital policy took into account the effect of working capital on capital budgets. Larger, aggressive, and younger firms tended to use the computer in the combination of uses in cash budgeting, accounts receivable and payable, and inventory. Aggressive firms and firms w ith written working capital policies used cash budgeting on a daily basis. Firms w ith aggressive working capital policies ranked marketing considerations higher when evaluating credit terms and tended to rank bad debt loss considerations lower. However, for analyzing credit term changes, firms w ith aggressive w orking capital policies ranked “sales as a consideration” higher. In regards to inventory, the firms with more aggressive working capital policies ranked “ad hoc decisions” higher for determining reorder points. Also, more profitable firms ranked “inventory costs” lower when evaluating changes in inventory policy. T he profitable firms always or sometimes take the discount on payables, but the aggressive firms and those w ith written working capital policies were net users of trade credit. The larger and younger firms seemed to better understand the actual
A Survey of Working Capital Policy Among Small Manufacturing Firms 71
cost of using trade credit. T he more profitable firms and also those with written working capital policies obtain loans w hich don’t require collateral. Firms with aggressive working capital policies used short-term loans for regular and cyclical uses as opposed to irregular need. Larger firms ranked the use of float higher, and firms w ith aggressive working capital policies ranked the use of commercial bank loans higher.
V. FU TU R E RESEARCH
Much of the data of this research tend to support what financial theory would describe as value-m aximizing working capital policies, as shown above. However, it is puzzling why other sound practices don’t show up as distinguishing successful from unsuccessful firms. Directions for further research would seem to lie in more detailed longitudinal studies of the life cycles of small firms in regard to their working capital policies. Many of the tests seemed to indicate similar policies for small and large firms, but not for the intermediate sizes.
In addition, there probably are interrelationships among the various working capital categories, and that possibility was also (purposefully) neglected in this study. Future studies may yet show “clustering” of policies amid the categories of size, profitability, policy formality or aggressiveness.
One interesting example in particular is how firms can be so ignorant of the cost of not taking discounts, and yet have the incentives to do so anyway.
T he problems of surveys like this one are only too well-known, but in spite of such they represent an attempt to learn more about actual small business financial practices and their working capital practices in pzirticular. Whatever its shortcomings, it adds more to the knowledge and database of this relatively unexplored area of finance, and provides the profession with new questions to direct further research.
Acknowledgments: The authors wish to thank Gail Stephens, Ron Barnes, Marc Lawson, Nancy Hickey, Donna Best, Shabbir Hussain and the other finance students who tirelessly lent their time to the completion of this survey. In addition, we thank Fred Scherr of West Virginia University and Jerome Osteryoung of Florida State for especially helpful comments.
NOTES
1. The authors are greatly indebted to Richard G.P. McMahon [15] for sending his study which greatly assisted in the literature search.
2. Permission was obtained from Smith and Sell to duplicate and/or modify their survey for the authors’ use.
72 JOURNAL OF SMALL BUSINESS FINANCE 1(1) 1991
3. The breakdown according to size could have been done with number of employees or total assets. However, these were all highly and significantly correlated. The chi-square tests were run with these other measures but differed very little in results. The decision to use sales was therefore made on the basis of precedent set by [18, 19].
4. The composite average is merely a weighted average of the rankings (weighted by the percent of respondents). Smith and Sell [18] declined to statistically analyze this figure since it implied cardinal measurability which was inappropriate for the kinds of questions asked in this study. Since this study is highly similar to theirs, the authors herein follow suit. Chi-square tests were run, however, on the frequencies of the rankings with other variables.
A Survey of Working Capital Policy Among Small Manufacturing Firms 73
REFERENCES
[1] Berryman, J., “Small Business Failure and Bankruptcy: A Survey of the Literature,” European Small Business Journal, Volume 1, Winter 1983, pp. 47-59.
[2] Brigham, Eugene F., Fundamentals of Financial Management, 5th edition, Dryden Press: Chicago, 1989.
[3] Cooley, Philip L. and Richard J. Pullen, “Small Business Cash Management Practices,” American Journal of Small Business, Volume 8, October 1979, pp. 27-31.
[4] Federal Register, Rules and Regulations, Volume 54, Number 244, December 21,1989.[5] Gitman, Lawrence J. and Charles E. Maxwell, “Financial Activities of Major U.S.
Firms: Survey and Analysis of Fortune’s 1000,” Financial Management, Volume 14, Winter 1985, pp. 57-65.
[6] Gitman, Lawrence J., Edward A. Moses and I. Thomas White, “An Assessment of Corporate Cash Management Practices,” Financial Management, Volume 8, Spring 1979, pp. 32-41.
[7] Grablowsky, Bemie J., “Mismanagement of Accounts Receivable by Small Business,” Journal of Small Business, Volume 14, October 1976, pp. 23-28.
[8] Grablowsky, Bernie J., “Management of the Cash Position,” Journal of Small Business, Volume 16, July 1978, pp. 38-43.
[9] Grablowsky, Bernie J., “Financial Management of Inventory,” Journal of Small Business Management, Volume 22, July 1984, pp. 59-65.
[10] Grablowsky, Bemie J. and D. R. Rowell, Small Business Financial Management: Theory and Practice, Old Dominion University: Norfolk, VA, 1980.
[11] Handbook of Small Business Data 1988, U.S. Small Business Administration, Office of Advocacy, U.S. Government Printing Office: Washington, DC, 1988.
[12] Hill, Ned C. and William L. Sartoris, Short-Term Financial Management, MacMillan Publishing Company: New York, 1988.
[13] Kathawala, Yunus, “Applications of Quantitative Techniques in Large and Small Organisations in the United States; An Empirical Analysis,” Journal of the Operational Research Society, Volume 39, November 1988, pp. 981-989.
[14] Luoma, G. A., “Accounting Information in Managerial Decision-Making for Small and Medium Manufacturers,” Research Monograph, Number 2, National Association of Accountants: New York, 1967.
[15] McMahon, Richard G.P. and S. Holmes, “Small Business Financial Management: A Review of Practice,” Accounting and Finance Research Paper 89/4, Flinders University of South Australia, 1989.
[16] Peacock, Rolffe W., “Finding the Causes of Small Business Failure/’ Management Forum, Volume 11, Fall 1985, pp. 77-89.
[17] Scott, David F. and Dana J. Johnson, “Financing Policies and Practices in Large Corporations,” Financial Management, Volume 11, Summer 1982, pp. 51-59.
[18] Smith, Keith V. and Shirley B. Sell, “Working Capital Management in Practice,” in Readings on the Management of Working Capital, 2nd edition, K.V. Smith (ed.). West Publishing Company: New York, 1980.
[19] Smith, Keith V. and Brian Belt, “Working Capital Management in Practice: An Update,” Paper no. 951, Institute for Research in the Behavioral, Economic, and Management Sciences, Krannert Graduate School of Management, Purdue University, West Lafayette, IN, March 1989.
[20] Soldofsky, Robert M., “Capital Budgeting Practices in Small Manufacturing Companies,” in Studies in the Factor Markets for Small Business Firms, D.G. Luckett (ed.). Small Business Administration: Washington, DC, 1964.
[21] Walker, David A., “Trade Credit Supply for Small Businesses,” American Journal of Small Business, Volume 9, Winter 1985, pp. 30-40.
[22] Wall Street Journal, “The Hyping of Small-Firm Job Grov^th,” November 8, 1988, pp. Bl:3.
74 JOURNAL OF SMALL BUSINESS FINANCE 1(1) 1991
Related Documents