Human Capital Diversication among Children Helene Bie Lillelr Rockwool Foundation Research Unit February 9, 2015 Abstract In the child labor literature, liquidity constraints are the dominating explanation for low schooling in LDCs. However, letting children work is also consistent with a diversication strategy among children under no liquidity constraints. A portfolio model yields testable implications allowing me to distinguish empirically between liquidity constraints and other reasons for human capital diversication among children, such as spreading risk or decreasing returns to farm labor. Consistent with social norms in rural Tanzania, the empirical ndings support a portfolio decision among sons, and not among daughters. This suggests that conditional transfer policies to increase schooling may have limited success. Keywords : child labor, schooling, liquidity constraints, Tanzania. JEL codes : J13, J24, O15 Contact: hbl@r/.dk, Rockwool Foundation Research Unit, Sllvgade 10, 2tv, DK-1307 K Copenhagen, Den- mark. www.r/.dk. Acknowledgements: I would like to thank Signe Hald Andersen, Kathleen Beegle, Martin Browning, Stefan Dercon, Joachim De Weerdt, Mette Ejrns, Joªo Miguel Ejarque, Marcel Fafchamps, David Dreyer Lassen as well as participants at the Centre for Applied Microeconometrics seminar and the CSAE 2014 conference for their valuable comments. 1

Welcome message from author
This document is posted to help you gain knowledge. Please leave a comment to let me know what you think about it! Share it to your friends and learn new things together.
Transcript
Human Capital Diversi�cation among Children
Helene Bie Lilleør�
Rockwool Foundation Research Unit
February 9, 2015
Abstract
In the child labor literature, liquidity constraints are the dominating explanation for low
schooling in LDCs. However, letting children work is also consistent with a diversi�cation
strategy among children under no liquidity constraints. A portfolio model yields testable
implications allowing me to distinguish empirically between liquidity constraints and other
reasons for human capital diversi�cation among children, such as spreading risk or decreasing
returns to farm labor. Consistent with social norms in rural Tanzania, the empirical �ndings
support a portfolio decision among sons, and not among daughters. This suggests that
conditional transfer policies to increase schooling may have limited success.
Keywords: child labor, schooling, liquidity constraints, Tanzania. JEL codes: J13, J24, O15
�Contact: hbl@r¤.dk, Rockwool Foundation Research Unit, Sølvgade 10, 2tv, DK-1307 K Copenhagen, Den-mark. www.r¤.dk. Acknowledgements: I would like to thank Signe Hald Andersen, Kathleen Beegle, MartinBrowning, Stefan Dercon, Joachim De Weerdt, Mette Ejrnæs, João Miguel Ejarque, Marcel Fafchamps, DavidDreyer Lassen as well as participants at the Centre for Applied Microeconometrics seminar and the CSAE 2014conference for their valuable comments.
1
1 Introduction
Primary school enrolment rates are low in many developing countries, and often lower than
policy-makers aim for. Low school enrolment rates are often associated with widespread child
labor, and a vast empirical literature has emerged on this topic (Edmonds 2007). The theoretical
underpinnings of this literature are based on seminal papers on child labor or schooling such as
Basu and Van (1998), Baland and Robinson (2000), or Ranjan (2001). These papers, and most
of those that followed in their wake �e.g. Soares, Kruger, and Berthelon (2012) and Lafortune
and Lee (2014) �are based on the idea that poor parents are liquidity-constrained, in that they
cannot borrow against future returns to �nance schooling investment in their children, as the key
explanation for the co-existence of child labor and low school enrolment in developing countries.
In this paper, I revisit the liquidity constraint explanation. Parents may choose human
capital diversi�cation among their children for other reasons, such as minimizing risk and/or
due to decreasing returns to labor in agriculture. Building on insights from various strands of
literature and qualitative ethnographic �ndings from Northern Tanzania, I construct a human
capital portfolio model of children in rural households. I think of it as a portfolio model because
parents can diversify their human capital investments among their �portfolio�of children. The
key contribution of the model is that it generates testable empirical implications that allow
me to distinguish between whether liquidity constraints or other reasons for human capital
diversi�cation dominate the schooling decision among children in a sibship.
In the model, parents can invest in one of two types of human capital; general human
capital by sending a child through formal schooling and speci�c human capital by educating
a child �traditionally� in their own �eld of expertise, namely agriculture, through learning-by-
2
doing.1 Allowing for a strong rural-urban divide, as in most developing countries, returns to
formal education are assumed to be higher on average in the urban sector, whereas traditionally-
educated children have a comparative advantage in the agricultural sector. In addition, parents
rely on transfers from their children for old age security. In families with more than one child,
parents have the possibility of diversifying their future old-age income sources between the
agricultural and the urban sectors by correspondingly diversifying the human capital investments
in their children. Stochastic future returns can thus be a reason for portfolio diversi�cation or
lack of school investments, as suggested by Pouliot (2005) and Estevan and Baland (2007).
Classic diminishing returns can also be at play if the �rst units of farm labor into household
agriculture production yield high returns but additional units do not, either due to lack of
available land or due to other technological factors. Both of these examples of alternative
explanations will induce parents to enroll some, but not all, of their children in formal education.
With the empirical implications of the portfolio model, I can distinguish between whether or
not liquidity constraints are binding in the human capital investment decisions made by parents.
When these constraints bind there is a negative relationship between the number of children and
the proportion of them sent to school. However, if parents are not bound by liquidity constraints,
but there are other reasons for diversifying the human capital portfolio among children, then
both a positive and a negative relationship between the number of children and the proportion of
them in school are possible. Finding a negative relationship in the data is thus not necessarily an
indication of the existence of liquidity constraints. However, the relationship cannot be positive
under binding constraints. Therefore �nding a positive correlation in the data is an indication
of parents choosing a diversi�ed human capital portfolio of their children for reasons other than
1Child labor in this paper is thus to be understood as working along side your parents in productive activitiesof the rural household. I do thus not consider the very hazardous forms of child labor as discussed e.g. by Dessyand Pallage (2005).
3
binding liquidity constraints.
I use an extraordinarily long panel data set spanning 13 years collected in a largely rural area
in Kagera, north-western Tanzania, to calibrate the model and test its empirical implications.
These particular data allow me to analyze the outcomes of human capital investment decisions
made by parents for all their children by observing the �nal educational attainment of each
child, which I can then relate to economic, demographic and community characteristics of the
household the children lived in during their childhood observed 13 years earlier. Very few
data sets2 can provide both completed fertility and human capital investment decisions for a
full sibship, because they typically only provide a snapshot of the educational attainment and
fertility level of current household members, disregarding children that have left home.
The children in the sample were in their childhood in the early 1990s. At that point in time,
Tanzania was characterized by a strong rural-urban dichotomy, where traditional agriculture
dominated in the rural areas (as it still does). Primary school enrolment was still not obligatory
by law, more than thirty percent of school-aged children were not enrolled and even more
never completed full primary school. In addition, widespread social norms in the area, which
is inhabited by patrilineal ethnic groups, dictate that only sons can be relied upon for old-age
support, as the obligations of daughters shift to their husbands�families upon marriage. The
empirical setting therefore provides the possibility for a strong falsi�cation exercise, because
model predictions will di¤er by gender, with only sons from agricultural households ful�lling the
model assumptions.
The empirical evidence is clear. I �nd that there is a signi�cant positive correlation between
the number of children and the proportion of them that completed primary education. This
2 I am only aware of one other data set from a developing country which may contain the same information,the RAND Indonesian Family Life Survey.
4
result is entirely driven by sons in agricultural households. There is no conclusive evidence that
binding liquidity constraints is a valid explanation for the lack of primary school completion
observed among daughters.
Since rural sons form a large subset of all children, this stylized fact suggests that policies -
such as conditional transfers - aimed at ensuring full primary school enrolment by lifting liquidity
constraints, may not be fully successful if parents choose a diversi�ed human capital portfolio
of their children for other reasons. In such cases other policy approaches are needed to achieve
full primary schooling enrollment.
The paper is organized as follows. In Section 2, I outline the di¤erent strands of literature
which, together with the qualitative �ndings in Section 3, form the basis for the model principles
and assumptions. The model and its empirical implications are described in Section 4, while
these are taken to the data in Section 5. I conclude in Section 6.
2 Literature
Both the theoretical and empirical literature on child labor and schooling has focused on binding
liquidity constraints as the major reason for children being sent to work. The most in�uencial
theoretical models analyze how liquidity constraints can increase child work and reduce schooling
because poor parents are unable to reduce current consumption su¢ ciently to cover the costs of
schooling and unable to borrow against the future earnings of their children, e.g. Basu and Van
(1998), Baland and Robinson (2000) and Ranjan (1999, 2001).
However, turning to the empirical literature, the evidence is rather mixed, see a thorough
review in Edmonds (2007). While papers that estimate the causal e¤ects of income on child
labor using transitory negative income shocks �nd positive impacts, (Jacoby and Skou�as (1997),
5
Jensen (2000), Krutikova (2010) and Beegle, Dehejia, and Gatti (2006)), negative associations
between child labor and income can come about due to land and labor market imperfections
(Bhalotra and Heady (2003)) or due to highly nonlinear local relationships as found by Edmonds
(2005).
Soares, Kruger, and Berthelon (2012) provide a theoretical structure showing that the seem-
ingly con�icting results of the empirical literature are consistent with both substitution and
income e¤ects being at play in the allocation of children�s time between work and schooling.
Maintaining the assumption of liquidity constrained households, they show that a positive tem-
porary income shock may increase child labor due to substitution e¤ects, whereas a positive
permanent income increase will decrease child labor if the income e¤ect dominates.3
This paper o¤ers an alternative theoretical structure, which makes it possible to distinguish
empirically between the central role of liquidity constraints relative to alternative explanations
for lack of schooling. I build on di¤erent strands of literature to highlight the potential impor-
tance of three factors which have received only limited attention in the child labor literature;
that children typically have siblings; that parents in developing countries rely on their o¤spring
for old-age support; and that children working alongside their parents in family-based agricul-
tural production may in fact be acquiring important skills for their future adulthood in the same
farming system.
First, although children typically have siblings, most theoretical models of child labor or
schooling reviewed above "normalize" the number of children within a household to one.4 In
doing so, they explicitly do not consider the possibility of diversi�cation across children in the
3Similarly, Adhvaryu and Nyshadham (2012) discuss how a productivity shock that a¤ects the child directlyex-ante can be expected to impact both schooling and child labor in the same direction. It is therefore an empiricalquestion as to how it a¤ects the allocation of time across both schooling and labor.
4One exception is Dessy (2000), although he does also not allow for diversi�cation across siblings.
6
human capital investment decisions made by parents. Only a very recent paper by Lafortune and
Lee (2014) present a model allowing for sibling dependence ruled by birth order, where parents
- under liquidity constraints - rely on the income of older children to �nance the schooling of
the younger children. Similarly, there are a variety of papers on what has come to be known as
"sibling rivalry" over scarce resources (e.g. Garg and Morduch (1998) and Morduch (2000)) and
on positive birth order e¤ects on school enrolment, e.g. Willis and Parish (1993), Ejrnæs and
Pörtner (2004), Manacorda (2006) and Edmonds (2006b). Only Bommier and Lambert (2004)
discuss the possibility that sibling rivalry need not only arise from competitions over resources,
but can also arise due to "more complicated interactions between siblings", e.g. through direct
sibling interactions in the family production function.
Second, parents are found to rely on their children for old-age support in developing coun-
tries (e.g. Lee, Parish, and Willis (1994) and Lillard and Willis (1997, 2002)). In the fertility
literature, children are naturally considered as part of the ex-ante risk management and the ar-
gument for having children is often related to old-age security, just as children may function as
security assets in terms of insurance, (Nugent (1985), Appelbaum and Katz (1991), Cain (1981,
1983) and Pörtner (2001)). In the child labor and schooling literature, the old-age security
motive for investing in the general human capital of children has been dismissed due to agency
problems, e.g. Baland and Robinson (2000). Nugent (1985) is aware of the problems of agency,
in what he terms loyalty of children to their parents in old-age. Along with De Vos (1985) and
Lucas and Stark (1985), he argues that cultural norms in traditional societies are e¤ective means
of overcoming agency problems. In the child labor literature, Rogers and Swinnerton (2004),
Chakraborty and Das (2005) and Raut and Tran (2005) discuss the role of future intergener-
ational transfers for human capital investment decisions in the present, while Pouliot (2005)
7
and Estevan and Baland (2007) adress the negative role of uncertainty when future returns to
schooling are considered.5
Third, in a rural setting of household farming, child labor may in fact cover a long tradition
of letting children work and thereby accumulate speci�c human capital in the agricultural sector
through learning-by-doing, Grootaert and Kanbur (1995). This is an important element in the
transfer of speci�c knowledge about local land and animals from parents to children, central to
the formation of future farming households, Fafchamps and Quisumbing (2007). The existence
of such an alternative educational choice in rural areas is likely to in�uence the schooling decision
of parents, Rodgers and Standing (1981).
In the social anthropology literature, the accumulation of speci�c human capital through
learning-by-doing is a way of socializing the child, i.e. of adapting it to its environment and
teaching it the life skills necessary for survival, Andvig (2000) and Bradley (1993). Bekombo
(1981) notes this type of traditional education is concentrated in rural areas and is less applicable
to children in urban areas, and cannot be likened to paid work. While Bock (1998, 2002) notes
that parents are faced with a choice when allocating their children�s time to di¤erent tasks,
since there is a trade-o¤ between task complexity, learning and future agricultural returns on
one hand and immediate output on the other.
Similarly, in the economics literature Rosenzweig (1995) argues that there have to be "pro-
ductive learning opportunities" for schooling to result in positive returns.6 In simple traditional
agricultural production systems, children can accumulate the necessary speci�c human capital
by working alongside their parents and best practices have been �ne-tuned over decades and
5Along similar lines, Appelbaum and Katz (1991) and Fitzsimons (2007) �nd negative e¤ects of future uncer-tainty in parental income in general on schooling when credit markets are incomplete.
6An example of this is the introduction of high-yielding seed varieties under the Green Revolution in India,where Foster and Rosenzweig (1996) �nd increasing returns to primary education in agriculture during periodsof more complex technical progress.
8
are passed on from one generation to the next, (Rosenzweig (1996) and Rosenzweig and Wolpin
(1985)). This is con�rmed by Fafchamps and Quisumbing (1999) and Jolli¤e (2004) who show
that on-farm returns to education are low, but o¤-farm returns can be high. Correspondingly,
Beegle, Dehejia, and Gatti (2009) �nd that returns to child labor exceed returns to schooling
substantially in early adulthood, although the di¤erence is reduced and eventually reversed with
age.7
3 Qualitative �ndings
Qualitative data can be useful to gain a better understanding of the local context, which is
very di¤erent from modern industrialized societies in many ways. The following is based on
semi-structured focus group discussions in 12 out of 51 villages or clusters, that constituted the
sampling frame for the Kagera Health and Development Survey (KHDS). The KHDS data set
is the empirical backbone of this paper. The data will be decribed in more detail in Section
5. During the focus group discussions on schooling, family, networks, migration and old-age
security, a picture emerged about norms and expectations in the relationship between parents
and children, which is re�ected in the model of this paper.
First, old people rely �rst and foremost on their children for subsistence and care. If they
have no children or if these fail to provide the assistance needed, old-age support can also be
provided by clan members or by fellow villagers who then, in return, inherit any assets. "The
property one has may help him when he is sick as he may sell some so as to get some money or
may give a will to someone he trusts to take care of him and take his property when he dies...
7Apart from Beegle, Dehejia, and Gatti (2009), to the best of my knowledge, only Bommier and Lambert (2000)have more explicitly distinguished between speci�c and general human capital to explain delayed enrolment intoprimary schools and sibling di¤erences in educational attainment.
9
�Take care of me and you will take my property when I die.�"(Cluster 12). Old people without
assets or "faithful and loving" children can expect little assistance.
Second, the expected assistance from children di¤ers according to their gender, education
and residence. Norms clearly dictate that sons should provide for their elderly parents, whereas
daughters cannot be expected to do so. Once married, the obligations of a daughter lie with her
husband�s family. "A boy is the heir of the family because a girl will later on be married and
go away (...) a girl is likely to bene�t the clan of her husband" (Cluster 8), and "educating a
girl is taking the whole wealth to her in-laws" (Cluster 21), meaning that only the in-laws will
bene�t from any human capital investments made in daughters. There is even a local saying in
Haya, "Omswisiki taba wawe", meaning "the daughter is always not yours" (Cluster 21), and a
ritual carried out in infancy linked to gender, "When a female child is born, at the age of three
months she is brought into the living room and directed to the front door facing out as a ritual
that she will have to leave the family when she is old enough" (Cluster 50).
Even so, it seems that many daughters still try to help their elderly parents as much as they
can, and they are therefore often considered "more faithful" and to "show more love" than their
brothers (Cluster 17). This expectation of daughters being more loving is repeatedly given as
a reason for sending girls to school, in the hope of future returns even though they will marry
and belong to the families of di¤erent clans. "Girls have a reputation for caring more for their
parents than boys when they succeed in life" (Cluster 23). "Boys tend to forget their past
and their families" (Cluster 8). However, when asked who would be given priority in terms of
schooling if they had to choose between a daughter and a son, the general conclusion was that
people would send a boy to school if they had to choose. This clear gender di¤erence in the
social norms of what is expected of daughters versus sons has important empirical implications,
10
since in a strict interpretation of norms the assumption of children providing old-age security
for parents can only be expected to hold for sons and not for daughters.
Third, the expected migration pattern, and with it the type of old-age assistance, also seem
to di¤er for sons and daughters. Whereas marriage seems to be the primary factor determining
the migration of a daughter, education is the key for whether or not a son migrates. Sons without
primary school education are not expected to migrate, and indeed are expected to fail if they do
so, because their area of familiarity lies in the local agricultural environment. They will engage
in farming and be of general assistance to their parents in terms of supplying "farm produce,
manual work, and nursing the sick". "Their education limits them from gaining more than their
working strength. Since they live closer to their families they assist with daily events" (Cluster
13). Likewise, in the general description of an uneducated son, informants note that "His most
important asset is his own strength, which can be used any where that he is familiar with", "He
will attend to all the cultural practices for the family, and help the father with manual work",
and "His help is important, as he is used to the environment [of the village]" (Cluster 50). In
return for his assistance, a son without formal education "expects all life support, e.g. shamba,
from parents, so he has to work hard for them" (Cluster 21).8
Sons with education, on the other hand, are seen as likely to migrate out of the rural village,
and their assistance will be in terms of remittances, upon request, if they succeed in life and are
"good and loving sons that do not forget their past and their family". The educated migrant son
sends "more remittances as much as he can to keep his family relative to his income" (Cluster10),
"sends cash money when requested, more than once" and "has good income but only responds
to the call of the father" (Cluster 50), meaning that only at the demand of the father, the son
8Shamba is a Swahili word for a small plot used for growing subsistence crops and fruit-bearing trees, oftenincluding the dwelling of the farmer.
11
will send money. In addition, migrant children living far away are generally thought of as harder
to reach and less reliable when it comes to ald-age assistance. The focus group in Cluster 12
pointed this out by using a Swahili saying �"Fimbo ya mbali haiui nyoka"� the far away stick
cannot kill a snake nearby.
Finally, investing in schooling also carries an element of uncertainty to the parents. In these
Kagera villages, schooling is seen as "risky" if the educated child is not able to �nd employment
and does not become �nancially independent, but rather continues to be a burden to the parents.
It is seen as "not risky" if the educated child �nds employment and becomes independent and
as a "good investment" if in addition he is a "loving" child and starts remitting. "Schooling is
a good investment when a child does not turn back to the parents to depend on them" (Cluster
12). "Primary education is the good investment only if a child after school does not depend on
parents, but works for himself; if he/she is employed by the government, a child will be sure
of monthly salary and out of this will be helping the parents at home, if he/she remits home"
(Cluster 17).
By setting up a model for human capital investment decisions which allows for uncertain
returns, for diversi�cation across children, for old-age dependency of parents on their children,
and for two types of human capital, general and speci�c, I seek to bring together these qualitative
�ndings with the main �ndings from the di¤erent strands of literature reviewed above.
4 Model of human capital investment among children
The portfolio model is a two-period model of human capital investment, where rural parents
invest in the human capital of their children in the �rst period and in turn rely on income
transfers from their adult children in the second period. It allows for N children, a rural and an
12
urban sector, and two associated types of human capital, speci�c and general, in which parents
have to invest in the �rst period. General human capital is accumulated through formal primary
schooling, and speci�c human capital can be interpreted as traditional education accumulated
through on-farm learning-by-doing, often termed child labor. In the model, traditional education
directs children towards second-period employment in the agricultural sector (a) with income
ya2 , whereas formal education directs children towards second-period employment in the non-
agricultural urban sector (b) earning income yb2. In the second period, for old-age security and
support, parents rely fully on their savings and the returns to the human capital investments
made in their children, modeled as income transfers. at the outset, both ya2 and yb2 are modelled
as random variables with realizations known at the start of period two.
In the �rst period, parents earn agricultural income Y1; which they allocate between �rst-
period household consumption c1, savings s; and educational expenses for their N children.
Parents face a discrete choice for each of the N children as to whether he or she should be
educated traditionally or formally. A child can only receive one type of education.9
Parents maximize a joint expected utility function de�ned over and separable in household
consumption, ct, where t = 1; 2: The utility function is assumed to be concave, such that
U 0(c) > 0 and U 00(c) < 0:
The household solves the following expected welfare maximization problem
max�;s
EW (c1; c2) = U(c1) + EU(c2) (1)
9This is a simplifying assumption, as many children may both work and attend school. The choice here is noton how many hours a child spends in school or working, but rather whether he or she completes full primary-schooleducation or not. Children without a complete primary school education are assumed to be educated traditionally.
13
subject to the budget constraints for period 1 and period 2, respectively
c1 = Y1 � (1� �)Nea � �Neb � s (2)
c2 = N��([(1� �)N ] ya2 + �Nyb2) + s
where � is the proportion of children chosen for formal schooling. The number of children who
receive schooling in the �rst period is thus given by �N and the number who are educated within
the traditional agricultural system is (1 � �)N . When < 1 there are decreasing returns to
labor in agriculture. Unless stated otherwise, = 1: As in Lafortune and Lee (2014), fertility is
modeled as exogenous. In the calibration below, the model is solved for all relevant levels of N .
The educational expenditure for each child in traditional education is ea, covering, for example,
supervision costs to the parents, and eb is the educational expenditure for each child in formal
education, e.g. school fees and uniform costs. Educational expenditures are allowed to di¤er
across the two sectors, and they are, for now, both non-negative, and therefore considered as
costs. Letting ea be negative would be equivalent to introducing an immediate economic return
from having children engaged in on-farm work.10
Parents pass on speci�c and local human capital to their children when they educate them
traditionally. The returns to this education, i.e. second-period agricultural income of non-
migrant children, ya2 , are therefore positively correlated with the current agricultural income of
the parents, Y1, such that ya2 = f(Y1), where f 0 > 0: Children with formal education migrate
10While the literature on child labor and schooling generally set ea as negative and thus as a source of income,I here follow Bock (2002) in stating that the overall learning potential in the tasks completed by children inagriculture is higher than the immediate return. If children were only undertaking tasks with no learning involvedbut with high immediate output, such as fetching water or �rewood, there would be no transfer of farm-speci�chuman capital from parents to children and therefore no future agricultural return from such activities. For ea
to be an educational expense, children have to be allocated tasks of a certain degree of complexity and, thus, alearning potential.
14
to urban areas for urban sector employment, which is assumed to be more remunerative than
returns to labor in the agricultural sector, such that E(yb2) > E(ya2). Children are assumed
to transfer a fraction of their income to their parents, 1=N��, where 0 < � � 1. The model
allows for savings (s > 0) and credit (s < 0): The discount rate and the interest rate are both
normalized to zero.
Liquidity constraints can be imporsed by forcing savings to be non-negative (s � 0). The
model thus encompasses the standard models of child labor, with the number of children nor-
malized to one and immediate returns arising from child labor: when s = 0; N = 1 and ea < 0.
This allows me to compare the empirical implications with and without liquidity constraints.
When there are no liquidity constraints, parents are faced with two choice variables: how
much to save or dissave s, and what proportion of their children to educate formally through
schooling, �. The �rst order condition of the model with respect to s ensures that marginal
utility in period one equals the expected marginal utility of period two. The �rst order condition
with respect to � ensures that the most pro�table type of human capital investment is chosen.11
The model cannot be estimated structurally, since both the costs of traditional education ea
and the expected future returns (Eya2 ; Eyb2) cannot be observed in the data. However, it can be
calibrated. Model calibrations are useful for revealing testable implications of the model, which
can then guide the empirical analysis.
4.1 Model Calibrations
I calibrate the model using standard CRRA preferences under two scenarios� with and without
liquidity constraints. The calibration results show that the model gives very distinct predictions
11When there are no liquidity constraints, no uncertainty and with constant returns to labor in agriculture, ��
is always a corner solution (�� = 1) in this model.
15
for the relationship between �� and N depending on whether the human capital investment
decisions are being made under binding liquidity constrains or as an optinal portfolio decision
taking for instance future uncertainty or decreasing returns to labor in the agricultural sector
into account, as exempli�ed in the model above.
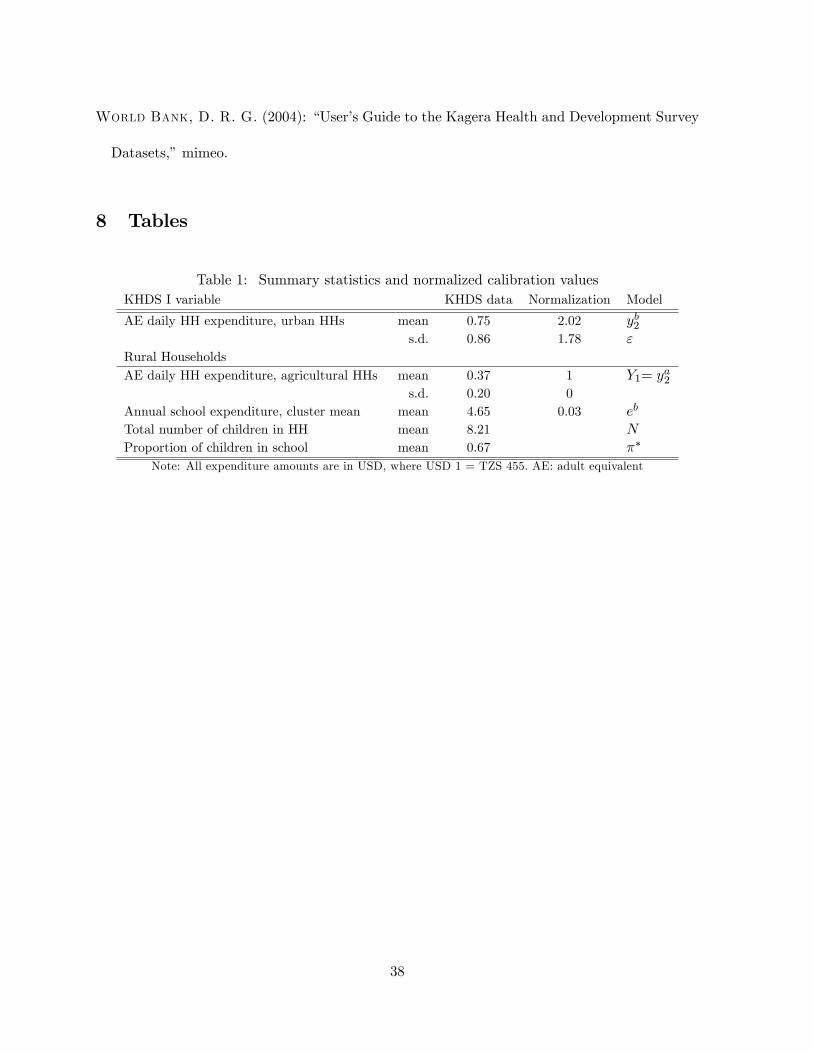
I calibrate the model using summary statistics from the �rst round of the KHDS data
described in Section 5. I use average values for household expenditure to proxy agricultural
incomes Y1 and ya2 , using a 1:1 mapping between the two. All values are normalized with
respect to agricultural income. Second-period urban income, yb2, is proxied by the average level
of household expenditure in urban areas in the region. All expenditure variables are measured
as daily adult equivalent terms in USD.
The average annual expenditure on schooling at village level in rural areas, including school
fees and school uniform costs, is 3% of household expenditures per child, thus eb = 0:03. Since
I have no plausible measure of the supervision costs of traditional education, I simply set it at
half of the schooling costs, such that ea = 0:015 under the "no child labor" scenario. Child
labor is introduced by letting ea = �0:03. The variable values and their normalization in the
calibrations are listed in Table 1. In the �gures below, the model is calibrated using a relative
risk aversion parameter of two in the CRRA utility function. To avoid heavy consumption
smoothing incentives, the second period transfer parameter, � = 0:95, which ensures that �rst-
and second-period consumption levels are of the same magnitude. There are constant returns
to scale in agriculture ( = 1) unless stated otherwise.
Thus, in this simple sketch, where income can only be consumed, saved or invested in human
capital, the individual returns of formal schooling are more pro�table than the returns of tradi-
tional education for the average KHDS household. However, when parents have to decide on the
16
human capital investment for a sibship (N > 1) and not just for an individual child (N = 1),
liquidity constraints may start to bind, or other reasons for human capital diversi�cation may
dominate.
4.2 Calibration Results
As we shall see from the �gures below, the results from calibrating the model under three
di¤erent scenarios� liquidity constraints, uncertainty and decreasing returns to agriculture�
yield di¤erent empirical implications for the relationship between �� and N , which in turn can
be used for examining the relevance of the liquidity constraint explanation for less than full
enrolment in the data.
Liquidity constraints and child labor
Figure 1 shows the calibration results of the optimal choice of �� for the full range of N under
liquidity constraints (s � 0). Once the liquidity constraint starts binding for higher levels of
N , the relationship is clearly negative. In this scenario, children working in agriculture are
considered to be undergoing traditional education, and they therefore represent an educational
cost to the parents (ea = 0:015). As can be seen from Figure 2, if instead children generate
immediate income when undergoing traditional education in childhood (ea = �0:03) and not
just in adulthood, the optimal proportion of children in schooling �� is even lower. There is
nothing new here; Figures 1 and 2 represent the main explanation in the literature of liquidity
constraints and child labor driving the lack of schooling among children in developing countries,
only here the analysis is done for a full sibship rather than a situation where N is normalized to
one. In either case, whether or not we allow for the existence of immediate returns from child
labor, the relationship between �� and N is negative, as expected.
17
Uncertainty about future income
Risk and uncertainty about future income are common reasons for households to employ dif-
ferent types of income source diversi�cation (Dercon and Krishnan (1996), Dercon (2002) and
Fafchamps (2003)). Since educational choice correlates with future types of income source,
human capital diversi�cation among children is a possible channel of future income source di-
versi�cation of parents. Introducing uncertainty changes the nature of the �rst order condition
for �. It results in risk-averse parents having an incentive to diversify their human capital in-
vestment away from the most pro�table, but also most uncertain, investment in order to reduce
future risk exposure. This requires that one type of human capital investment does not stochas-
tically dominate the other, and that the uncertainties associated with the two types of return
are not perfectly correlated. Thus, when second-period urban income transfers are higher, but
for the parents also more uncertain, than agricultural income transfers, then this may have a
negative impact on the optimal proportion of children sent to school, such that �� < 1.
In the calibrations, uncertainty is imposed as a mean-preserving spread of " around urban
income transfers such that yb2 = � � ", where a good or a bad " draw each comes with proba-
bility of 0.5.12 For simplicity, I assume no covariant uncertainty between second-period income
transfers from children in the urban sector and children in the agricultural sector, and there-
fore only focus on imposing future uncertainty on the parental returns from the most pro�table
investment, schooling.13
12 In Figure 3, the uncertainty is modeled as being perfectly uncorrelated across siblings in the urban sector inperiod 2. The other extreme would be to model it as being perfectly correlated. One can think of this as eitherall siblings getting a bad draw or all getting a good draw in the urban labor market. Having perfectly correlated" across siblings increases the impact of uncertainty and lowers the preference for formal education dramaticallyand to such an extent that the relationship between � and N may become negative for large N .13The calibrations yield similar results when there is uncertainty about income in both sectors as long as the
uncertainties are not perfectly correlated and income in one sector does not stochastically dominate income fromthe other.
18
Figure 3 shows that with moderate uncertainty (" = 1) and the current level of relative
risk aversion in the utility function, the optimal human capital portfolio of a sibship is still full
schooling of all children. However, as " increases and reaches the normalized standard deviations
of yb2 it becomes optimal to diversify away from formal education, especially for lower levels of
N where there are fewer children and thus fewer future income sources to diversify among.
This results in a positive relationship between �� and N , which is distinctly di¤erent from the
negative relationship found in Figures 1 and 2.
Decreasing returns in agriculture
Another plausible reason for parents wanting to diversify their human capital investments in
their children could simply be that their agricultural land holdings are not large enough to
sustain more than one or two families working productively on the farm, i.e. that there are
decreasing returns to labor given the land available. In Kagera, it is not uncommon for land to
be a scarce resource; some land is even considered "clan land" and cannot be bought or sold,
but only inherited. In the model above, if the parental returns to traditional education are at
least as large as the returns to formal education (i.e. ya2 = yb2)� as the literature reviewed above
suggests could be the case when the agricultural technologies are largely traditional� but there
are decreasing returns to agricultural labor (0 < < 1), then it will be optimal for parents to
maintain one out of the N children in traditional education, even when there are no liquidity
constraints and there is no uncertainty. This can be seen from Figure 4, which also clearly
shows a positive correlation between �� and N . This result is observationally equivalent to a
situation where one particular son in a sibship is destined to inherit the land and take over
farming activities from the parents, as is commonly seen in many farming cultures across the
19
world.
Human capital diversi�cation or need for child labor?
As it is evident from Figures 3 and 4, there can be reasons other than liquidity constraints
and immediate returns to child labor for not sending all children in a sibship through formal
schooling. This is not to say that liquidity constraints and poverty do not play a role in the
human capital investment decisions made by parents; they may very well do so. The point is
that it may not be the only reason for not sending a child to school. The calibration graphs show
that examining the relationship between the proportion of children in school, ��, and the total
number of children, N , conditional on income and schooling costs, may yield further insights
into the strength of the liquidity constraint explanation relative to other potential explanations
such as the two examples chosen here. More examples can be thought of. Building on insights
from Bacolod and Ranjan (2008) and Lafortune and Lee (2014), ability related to talent or to
birth order may also play an important role in the schooling decisions of parents. Heterogeneity
in ability across siblings could be another reason for parents choosing a diversi�ed human capital
portfolio, also in the absence of liquidity constraints.
To sum up, there are two distinct empirical implications concerning the relationship between
� and N , depending on whether or not households are liquidity-constrained in their human cap-
ital investment decisions. When the liquidity constraint binds in the human capital investment
decision, the relationship will be negative. If it does not bind, but there are other reasons for
diversifying the human capital portfolio among children, then the relationship may be positive.
The relationship cannot be positive under binding liquidity constraints. Therefore, �nding a
positive relationship between � and N in the data is indicative of parents choosing a diversi�ed
20
human capital portfolio of their children for reasons other than binding liquidity constraints.
5 Data and empirical setting
The quantitative data is based on the Kagera Health and Development Survey I & II, which is
an extraordinarily long tracking panel based on household surveys with a time span of 13 years.
The �rst round of surveys were conducted in 1991-1994 (KHDS I), and the second round in
2004 (KHDS II). This time horizon is particularly advantageous for studying the human capital
investment decision outlined in the model above, since it provides information about completed
fertility, N , and completed human capital investment, ��, both found in KHDS II, while at the
same time also containing information about household characteristics, including income and
wealth during the childhood of the sibships under consideration, when the fertility and human
capital investment decisions were being formed by the parents (KHDS I). In addition, KHDS I
has an explicit module with detailed information on migrant children and their characteristics,
making it possible to establish and follow the full sibships in the data. This is unusual for
household surveys, which normally only survey household members.
The data from the Kagera Health and Development Surveys I & II consist of �ve waves.
The �rst four waves were conducted at six-monthly intervals from 1991 to 1994, covering 915
households in total (KHDS I). Attempts were made to re-interview all individual household
members from the �rst four waves in a �fth wave in 2004 (KHDS II) (Beegle, DeWeerdt, and
Dercon (2006)).14 This meant tracking each individual, even if they had moved out of the
village, region or country. The tracking in KHDS I is exceptional, with a re-interview rate of
14KHDS I was undertaken by the World Bank and e Muhimbili University College of Health Sciences, whereasKHDS II was funded by DANIDA and the World Bank and implemented by E.D.I. (Economic DevelopmentInitiatives) in Kagera.
21
91% of surviving baseline households in KHDS II, and an overall re-interview rate of 82% of
surviving household members, Beegle, DeWeerdt, and Dercon (2006).15 For the selected sample
of households used below, the re-interview rate among the surviving children is almost 93%.
Slightly more than 8% of the children in these households died between KHDS I and KHDS II.
5.1 Sample Selection
The sample selection for this paper was based on the following criteria. Only households with
children of the head or his/her spouse were included. At least one of these children must have
been of school age in wave 1, which I de�ne to have been between 7-17 years old, allowing for the
then widespread delayed enrolment. Households must have been interviewed in both the �rst
wave and the �fth wave, but there were no requirements regarding survey participation in the
three intermediate waves. This means that all the households included had at least one child
aged between 20 and 30 in KHDS II in 2004, and typically they included a group of siblings. To
ensure that the households included had completed both their fertility and schooling decisions
in 2004, only households where all children were aged 14 years or older in wave 5 were included.
This resulted in a �nal sample of 330 households.
I created a pseudo cross-section in which measures ofN and �� are based on 2004 information,
whereas educational expenditures and household income (i.e. measures of ea; eb and Y1) and
other household characteristics are based on averages from the pooled 1991-94 data. The �ve
waves are thus collapsed into one, in which the variable values are either an average over time of
the �rst four waves, or 2004 values. To get the most exact measure of completed fertility, N , and
completed human capital investment decisions, ��, I include educational information on dead
15A household is designated as having been re-interviewed when at least one member of the baseline householdwas re-interviewed in 2004.
22
or untraced children using the latest information available in KHDS I. In this way, attrition is
virtually nil among children of participatings households.
5.2 Summary statistics
Table 2 shows the summary statistics for the variables used as controls for household, school
and village characteristics in the empirical analyses below. By 2004, the households included
in the �nal sample had an average of 8 children, and 69% of these completed primary school
(�). There is no statistically signi�cant di¤erence in the numbers of sons and daughters and,
on average, girls and boys were educated equally in terms of schooling. The intra-household
proportions of children with formal education is given by the total number of children allocated
to primary school divided by the total number of children in the household.16
Households in Kagera have many children. 20 percent of the household heads in the sample
had more than ten children and �ve percent had more than 16 children. Polygamy is not
uncommon and I therefore control for polygamous households when more than one spouse of
the head is registered in the data.17
In the early 1990s, the sample households had average daily expenditure levels per adult
equivalent of USD 0.36. The households owned slightly more than 2 hectares of land on average,
and 85% of the households included listed agriculture as their main source of income. A �fth
of the households were located in what was recorded as an urbanized area of Kagera, but even
among these households more than 60% had agriculture as their main source of income (not
shown), suggesting that these areas also had strong rural characteristics. Below I therefore dis-
16 I include children that later died if they were at least 7 years of age at time of death. They are included inboth the fertility measure and the portfolio measure using the most recent schooling information available.17The key results in this paper are robust to dropping the top 20 percent of the sample households where the
head has more than 10 children.
23
tinguish between agricultural and non-agricultural households, depending on their main source
of income.
In wave 1, household heads were on average 51 years old, and around a third of them had
completed primary school. The Kagera region is predominantly inhabited by Haya people. The
tribal fractionalization index - which is a measure between 0-1 of how ethnically diverse an area
is - is therefore also relatively low, with a value of 0.2. The households lived in villages with
almost 2645 inhabitants on average, and the average distance within the village to the local
primary school was less than 2 km.18 The annual school fee was 42 cents, but school uniforms
were considerably more expensive, and cost USD 4.71 on average. Class sizes were almost 50
students, and generally there were 3-4 students per text book. 70% of the teachers had either
a grade A or grade B degree. These last variables will be used as school quality controls in the
regression analyses below.
6 Testing the empirical implications of the model
6.1 Empirical speci�cation
The allocation of children between formal and traditional education, ��, is by construction a
variable censored at 0 and at 1. To take this into account, I estimate the reduced form of the
(�; N ) relationship using a two-sided censored Tobit regression.19 I also employ the linear
probability model for comparative and later more exploratory purposes, thereby ignoring the
18There is some variation across villages in the average distance to school, and as shown by Kondylis andManacorda (2012), school distance has a negative impact on the likelihood of children being enrolled.19Given the somewhat discrete nature of �, an obvious alternative to the Tobit model is a binomial count model.
The dependent variable is then no longer the proportion of formally educated children, but rather the number offormally educated children, Nb = �N out of the total number of children in the household, N . Nb is assumed tobe binomially distributed and should be thought of as a sum of independent and homogenous Bernoulli trials upuntil N . It is possible to relax the, in this setting, very restrictive assumptions of homogeneity and independenceamong siblings by estimating the model using quasi-maximum likelihood. The results presented below are robustto such a speci�cation and available upon request.
24
censoring. The reduced form is estimated both unconditionally and conditional on the observable
model variables Y1; eb, as well as on various sets of controls for household, school and village
characteristics, all included in x. For each household h the optimal diversi�cation choice can
then be described as
��h = �1N + �0xh+uh
where ��h is the latent variable. uh is a normally distributed error term. Given the natural
censoring of ��h; I observe the following in the data:
�h = 0; if ��h � 0
�h = ��h; if 0 < ��h < 1
�h = 1; if ��h � 1
The Tobit model is estimated using robust standard errors clustered at village level. I estimate
the (�;N) relationship among all children, among sons only and among daughters only. When
analyzing the sibling correlation among, for example, brothers, I look at the correlation between
the proportion of sons who have completed primary school and the total number of sons.
6.2 Results
In Table 3, the unconditional reduced form Tobit estimations (I) as well as those conditional
on model variables (II) are shown for the full sample, for agricultural households and for non-
agricultural households. It is clear that for the full sample, the unconditional relationship
between � and N is positive and statistically signi�cant. This is driven by the majority of
the households in the sample, who rely on agriculture as their main source of income. This is
25
consistent with the model set-up, where only these households can o¤er the traditional agricul-
tural alternative to formal education. There are only 51 households in the sample, which do
not depend on agriculture as the main source of income. Among these, there is no signi�cant
unconditional or conditional correlation between � and N , and based on this it is not possible
to determine which explanation dominates the human capital investment decision among these
children.
Focusing on the agricultural households, Table 4 shows the same unconditional (�;N) rela-
tionship (I) as well as relationships conditional on model variables (II) and household character-
istics (III) for all children, for sons only and for daughters only.20 Splitting the data by gender
provides another test of the simple human capital portfolio model above, which should only hold
for sons in agricultural households. We see that the unconditional relationship between � and
N is clearly positive when we focus on sons. Furthermore, there is no statistically signi�cant
correlation between the number of daughters and the proportion of daughters with a primary
school degree. The same pattern holds when conditioning on the variables included in the simple
model as well as other household characteristics or community characteristics (see Model (IV) in
Table 5). For sons, the household size (excluding the children of the head), the age of the head
and whether or not the head has completed primary school himself are all positively correlated
with the proportion of sons who complete primary school. The signi�cant positive association
between � and the level of household expenditures in the full sample is mainly driven by the
schooling choices made for daughters.21 This suggests that the schooling decisions related to
daughters could be in�uenced by liquidity constraints.
In Table 5, results from the same Tobit regressions, but now controlling for community level
20Results are similar if I focus on rural households, i.e. using a de�nition based on geographical location ratherthan on main income source.21 In the linear probability model below, the association is also signi�cant at the 10 percent level among sons.
26
characteristics in terms of the school quality measures, measures of the ethnic composition in
the village and the village population size are shown in (IV). The corresponding linear prob-
ability model estimations are shown in (V). Although the coe¢ cients change with the change
of econometric model, the signs and signi�cance levels do not. Community level characteristics
matter for the human capital investment decisions of parents. As a robustness check of whether
unobserved village level characteristics could be in�uencing the results, the linear probability
model is also estimated with a village level �xed e¤ect in (VI). The estimated coe¢ cients of the
key variables and their signi�cance levels are stable across speci�cations.
As in similar papers examing the choice between chooling and child labor, e.g. Bommier and
Lambert (2000, 2004), Soares, Kruger, and Berthelon (2012), and Lafortune and Lee (2014), I
do not model fertility as a choice variable. One may worry, though, that endogeneity of fertility
could be driving the positive correlation between � and N . This would be the case if parents who
have preferences for many children also have preferences for formal education. However, this
is somewhat contrary to the large literature adressing the quantity-quality trade-o¤ regarding
children originally suggested by Gary Becker and more recently discussed by Ponczek & Souza
(2012) and Lafortune and Lee (2014). Because the model, based on local social norms, predict
di¤erent correlations among sons and among daughters, endogenous fertility is less problematic
in this setting. In the local setting of rural Kagera, sex-selective abortion is not an option.
This is con�rmed by the data where households on average have the same numbers of sons and
daughters. Furthermore, households also educate the same proportions of sons and daughters,
but there are clear gender di¤erences in what drives the schooling choices made for these sons
and daughters. This suggests that endogenous fertility is not a main driver of the positive (�;N)
27
correlation found for sons only.22
Finally, it is conceivable that liquidity constraints only start binding for larger sibships, while
at the same time parents may choose to diversify the human capital portfolio of their children.
In such a case, the portfolio model under liquidity constraints predicts that there should be
a positive correlation between (�;N) for smaller Ns and a negative correlation for larger Ns.
I have therefore also estimated the model allowing the total number of children (as well as
numbers of sons and daughters) enter with a quadratic term in the OLS estimation of the linear
probability model (not shown). The model results are very similar to those of column (V),
except for the quadratic term. For all children and for sons only, it results in the functional form
being characterized by an inverse U, with turning points of 22 children and 14 sons, respectively,
after which liquidity constraints may start to bind. Human capital diversi�cation within the
household thus seem to occur for reasons other than liquidity constraints for the majority of the
children.
Figure 5 illustrates the raw relationship between � and N for sons graphically. It shows
(i) the raw mean of � among brothers for each group of sons N (the unconnected dots); (ii)
a non-parametric �t of � on N using a Kernel-weighted local smoothing function and its 95%
con�dence interval (dark blue line and shaded area). Although the �gure exhibits an inverse
U relationship, it is also clear that the positive correlation between (�;N) dominates. Such a
positive relationship cannot exist if the human capital investment decision for sons is constrained
by binding liquidity constraints or households relying on the economic contribution of sons
22To examine the potential role of endogeneity further, I have also run 2SLS regressions instrumenting fertilitywith the genders of the �rst-born child and of the second-born child as well as their interaction are used asinstruments for the total number of children, N; following Gupta and Dubey (2006) and Conley and Glauber(2006). The instruments have signi�cant explanatory power in the �rst stages of total numbers of sons and ofdaughters, but are weak in the prediction of overall fertility. Focusing on sons only and daughters only, the�ndings from (VII) are con�rmed by the 2SLS model. Results are available upon request.
28
engaged in child labor.
7 Conclusion
This paper �nds no evidence in support of liquidity constraints being the key reason for low
primary school enrolment among agricultural households. Instead, the human capital investment
decisions made by parents who have more than one child may be driven by diversi�cation
concerns among children in a sibship. This can arise if there are uncertain returns to education
or decreasing returns in agriculture.
The tendency in the child labor literature not to incorporate the fact that children have
siblings limits the theoretical possibilities for going beyond the binding liquidity constraint ex-
planation when analysing schooling and thus child labor decisions in a family.
I use a portfolio model of human capital investment among children in sibship to show
that the diversi�cation seen in the data - and especially among sons - is consistent with the
equilibrium of a model without liquidity constraints.
This suggests that there is a need for more research into the reasons for lack of schooling to
better inform policy. Introducing policies which only act on the liquidity constraint may have
limited success in settings similar to the one studied in this paper. The increasingly widespread
use of conditional transfers to raise school attendance by shifting the liquidity constraint may
therefore only result in higher levels of completed schooling among subsets of children for whom
liquidity constraints are indeed a binding factor in the schooling decision.
The stylized fact found in this paper of a positive relationship between the proportion of sons
with full primary education and the total number of sons may well extend to other similar rural
and patrilineal settings. Policies to enhance school enrolment have to address the local returns to
29
schooling so that sons destined to become farmers also experience su¢ ciently high returns from
schooling for it to be considered worthwhile for them and for their parents in the agricultural
sector. This can happen when the complexity in farming systems moves beyond traditional
agriculture, as suggested by Rosenzweig (1995). If speci�c human capital accumulation through
learning-by-doing is important for the farming household, then this o¤ers an explanation as to
why many conditional transfer programmes although able to increase school attendance may
only do so to a limited extent (Filmer and Schady, 2011) as they are less successful in decreasing
child work (e.g. Ravallion and Wodon (2000), Edmonds and Shrestha (2014)).
30
References
Adhvaryu, A. R., and A. Nyshadham (2012): �Schooling, Child Labor, and the Returns to
Healthcare in Tanzania,�Journal of Human Resources, 47(2), 364�396, 00006.
Andvig, J. (2000): �Family-Controlled Child Labor in Sub-Saharan Africa: A Survey of Re-
search,�NUPI Working Paper.
Appelbaum, E., and E. Katz (1991): �The Demand for Children in the Absence of Capital
and Risk Markets: A Portfolio Approach,�Oxford Economic Papers, 43(2), 292�304.
Bacolod, M. P., and P. Ranjan (2008): �Why Children Work, Attend School, or Stay Idle:
The Roles of Ability and Household Wealth,�Economic Development and Cultural Change,
56(4), 791�828.
Baland, J.-M., and J. A. Robinson (2000): �Is Child Labor Ine¢ cient?,�Journal of Political
Economy, 108(4), 663�679.
Basu, K., and P. Van (1998): �The Economics of Child Labor,� The American Economic
Review, 88(3), 412�427.
Beegle, K., R. Dehejia, and R. Gatti (2006): �Child Labor and Agricultural Shocks,�
Journal of Development Economics, 81(1), 80�96.
Beegle, K., R. Dehejia, and R. Gatti (2009): �Why Should We Care About Child Labor?
The Education, Labor Market, and Health Consequences of Child Labor,�Journal of Human
Resources, 44(4), 871�889, 00037.
Beegle, K., J. DeWeerdt, and S. Dercon (2006): �Kagera Health and Development Survey
2004 Basic Information Document,�mimeo, World Bank.
31
Bekombo, M. (1981): �The Child in Africa: Socialisation, Education and Work,� in Child
Work, Poverty and Underdevelopment, ed. by G. Rodgers, and G. Standing, chap. 4, pp.
113�130. International Labour O¢ ce.
Bhalotra, S., and C. Heady (2003): �Child Farm Labor: The Wealth Paradox,�World
Bank Economic Review.
Bock, J. (1998): �Economic Development and Cultural Change Among the Okavango Delta
Peoples of Botswana,�Botswana Notes and Records, 30, 27�44.
(2002): �Learning, Life History, and Productivity. Children�s Lives in the Okavango
Delta, Botswana,�Human Nature, 13(2), 161�197.
Bommier, A., and S. Lambert (2000): �Education Demand and Age at School Enrollment
in Tanzania,�Journal of Human Resources, 35(1), 177�203.
Bommier, A., and S. Lambert (2004): �Human Capital Investments and Family Composi-
tion,�Applied Economics Letters, 11, 193�196.
Bradley, C. (1993): �Women�s Power, Children�s Labor,�Cross-Cultural Research, 27(1-2),
70�96.
Cain, M. (1981): �Risk and Insurance: Perspectives on Fertility and Agrarian Change in India
and Bangladesh,�Population and Development Review, 7(3), 435�474.
(1983): �Fertility as an Adjustment to Risk,� Population and Development Review,
9(4), 688�702.
Chakraborty, S., and M. Das (2005): �Mortality, Fertility and Child Labor,�Economics
Letters, 86(2), 273�278.
32
Conley, D., and R. Glauber (2006): �Parental educational investment and children�s acad-
emic risk estimates of the impact of sibship size and birth order from exogenous variation in
fertility,�Journal of Human Resources, 41(4), 722�737.
De Vos, S. (1985): �An Old-Age Security Incentive for Children in the Philippines and Taiwan,�
Economic Development and Cultural Change, 33(4), 793�814.
Dercon, S. (2002): �Income Risk, Coping Strategies, and Safety Nets,� The World Bank
Research Observer, 17(2), 141�166.
Dercon, S., and P. Krishnan (1996): �Income Portfolios in Rural Ethiopia and Tanzania:
Choices and Constraints,�Journal of Development Studies, 32(6), 850�875.
Dessy, S. E. (2000): �A defense of compulsive measures against child labor,�Journal of De-
velopment Economics, 62(1), 261�275.
Dessy, S. E., and S. Pallage (2005): �A Theory of the Worst Forms of Child Labour*,�The
Economic Journal, 115(500), 68�87.
Edmonds, E. (2005): �Does Child Labor Decline with Improving Economic Status?,�Journal
of Human Resources, 40(1).
(2006b): �Understanding Sibling Di¤erences in Child Labor,� Journal of Population
Economics, 19(4), 795�821.
Edmonds, E. V. (2007): �Child Labor,� in Handbook of Development Economics, ed. by
T. Schultz, and J. Strauss, vol. 4. Elsevier Science, Amsterdam, North-Holland.
Edmonds, E. V., and M. Shrestha (2014): �You get what you pay for: Schooling incentives
and child labor,�Journal of Development Economics, 111, 196�211.
33
Ejrnæs, M., and C. Pörtner (2004): �Birth Order and the Intrahousehold Allocation of
Time and Education,�Review of Economics and Statistics, 86(4), 1008�1019.
Estevan, F., and J. Baland (2007): �Mortality Risks, Education and Child Labor Star,
Open,�Journal of Development Economics, 84(1), 118�137.
Fafchamps, M. (2003): Rural Poverty, Risk and Development. Edward Elgar Publishing.
Fafchamps, M., and A. Quisumbing (1999): �Human Capital, Productivity, and Labor
Allocation in Rural Pakistan,�The Journal of Human Resources, 34(2), 369�406.
Fafchamps, M., and A. R. Quisumbing (2007): �Chapter 51 Household Formation and
Marriage Markets in Rural Areas,� in Handbook of Development Economics, ed. by T. Paul
Schultz and John A. Strauss, vol. Volume 4, pp. 3187�3247. Elsevier.
Filmer, D., and N. Schady (2011): �Does more cash in conditional cash transfer programs
always lead to larger impacts on school attendance?,� Journal of Development Economics,
96(1), 150�157.
Fitzsimons, E. (2007): �The E¤ects of Risk on Education in Indonesia,�Economic Develop-
ment and Cultural Change.
Foster, A., and M. Rosenzweig (1996): �Technical Change and Human-Capital Returns
and Investments: Evidence from the Green Revolution,� The American Economic Review,
86(4), 931�953.
Garg, A., and J. Morduch (1998): �Sibling Rivalry and the Gender Gap: Evidence from
Child Health Outcomes in Ghana,�Journal of Population Economics, 11(4), 471�493.
34
Grootaert, C., and R. Kanbur (1995): �Child Labor: An Economic Perspective,�Interna-
tional Labor Review, 134(2), 187�203.
Gupta, N. D., and A. Dubey (2006): �Fertility and the household�s economic status: A
natural experiment using Indian micro data,� Journal of Development Studies, 42(1), 110�
138.
Jacoby, H., and E. Skoufias (1997): �Risk, Financial Markets and Human Capital in a
Developing Country,�Review of Economic Studies, 64, 311�336.
Jensen, R. (2000): �Agricultural Volatility and Investments in Children,�The American Eco-
nomic Review, 90(2), 399�404.
Jolliffe, D. (2004): �The Impact of Education in Rural Ghana: Examining Household Labour
Allocation and Returns on and of the Farm,�Journal of Development Economics, 73, 287�314.
Kondylis, F., and M. Manacorda (2012): �School Proximity and Child Labor Evidence
from Rural Tanzania,�Journal of Human Resources, 47(1), 32�63.
Krutikova, S. (2010): �Who Gets to Stay in School? Long-run Impact of Income Shocks on
Schooling in Rural Tanzania,�Discussion paper, CSAE.
Lafortune, J., and S. Lee (2014): �All for One? Family Size and Children�s Educational
Distribution under Credit Constraints,�The American Economic Review, 104(5), 365�369.
Lee, Y.-J., W. L. Parish, and R. J. Willis (1994): �Sons, Daughters, and Intergenerational
Support in Taiwan,�American Journal of Sociology, 99, 1010�1041.
Lillard, L. A., and R. J. Willis (1997): �Motives for Intergenerational Transfers: Evidence
from Malaysia,�Demography, 34, 115�134.
35
(2002): �Patterns on Intergenerational Transfers in Southeast Asia,�Journal of Mar-
riage and the Family, 64, 627�641.
Lucas, R. E., and O. Stark (1985): �Motivations to Remit: Evidence from Botswana,�
Journal of Political Economy, 93(5), 901�918.
Manacorda, M. (2006): �Child Labor and the Labor Supply of Other Household Members:
Evidence from 1920 America,�The American Economic Review, 96(5), 1788�1801.
Morduch, J. (2000): �Sibling Rivalry in Africa,� American Economic Review, Papers and
Proceedings, 90(2), 405�409.
Nugent, J. B. (1985): �The Old-Age Security Motive for Fertility,�Population and Develop-
ment Review, 11, 75�97.
Ponczek, V., and A. P. Souza (2012): �New Evidence of the Causal E¤ect of Family Size
on Child Quality in a Developing Country,�Journal of Human Resources, 47(1), 64�106.
Pörtner, C. (2001): �Children as Insurance,�Journal of Population Economics, 14(1), 119�
136.
Pouliot, W. (2005): �Introducing Uncertainty Into Baland and Robinson�s Model of Child
Labour,�Journal of Development Economics.
Ranjan, P. (1999): �An Economic Analysis of Child Labor,�Economics Letters, 64, 99�105.
(2001): �Credit Constraints and the Phenomenon of Child Labor,�Journal of Devel-
opment Economics, 64(1), 81�102.
36
Raut, L., and L. Tran (2005): �Parental Human Capital Investment and Old-Age Transfers
from Children: Is It a Loan Contract or Reciprocity for Indonesian Families?,� Journal of
Development Economics, 77(2), 389�414.
Ravallion, M., and Q. Wodon (2000): �Does Child Labour Displace Schooling? Evidence on
Behavioural Responses to an Enrollment Subsidy,�The Economic Journal, 110(462), 158�175.
Rodgers, G., and G. Standing (1981): Child Work, Poverty and Underdevelopment. Inter-
national Labour O¢ ce.
Rogers, C., and K. Swinnerton (2004): �Does Child Labor Decrease When Parental Incomes
Rise?,�Journal of Political Economy, 112(4), 939�946.
Rosenzweig, M. (1995): �Why Are There Returns to Schooling?,�The American Economic
Review, 85(2), 153�158.
(1996): �When Investing in Education Matters and When It Does Not.,�Challenge,
39(2).
Rosenzweig, M., and K. Wolpin (1985): �Speci�c Experience, Household Structure, and In-
tergenerational Transfers: Farm Family Land and Labor Arrangements in Developing Coun-
tries,�The Quarterly Journal of Economics, 100, 961�987.
Soares, R. R., D. Kruger, and M. Berthelon (2012): �Household Choices of Child Labor
and Schooling A Simple Model with Application to Brazil,� Journal of Human Resources,
47(1), 1�31.
Willis, R., and W. Parish (1993): �Daughters, Education, and Family Budgets,�Journal of
Human Resources, 28(4), 863�898.
37
World Bank, D. R. G. (2004): �User�s Guide to the Kagera Health and Development Survey
Datasets,�mimeo.
8 Tables
Table 1: Summary statistics and normalized calibration valuesKHDS I variable KHDS data Normalization Model
AE daily HH expenditure, urban HHs mean 0.75 2.02 yb2s.d. 0.86 1.78 "
Rural HouseholdsAE daily HH expenditure, agricultural HHs mean 0.37 1 Y1= y
a2
s.d. 0.20 0Annual school expenditure, cluster mean mean 4.65 0.03 eb
Total number of children in HH mean 8.21 NProportion of children in school mean 0.67 ��
Note: All expenditure amounts are in USD, where USD 1 = TZS 455. AE: adult equivalent
38
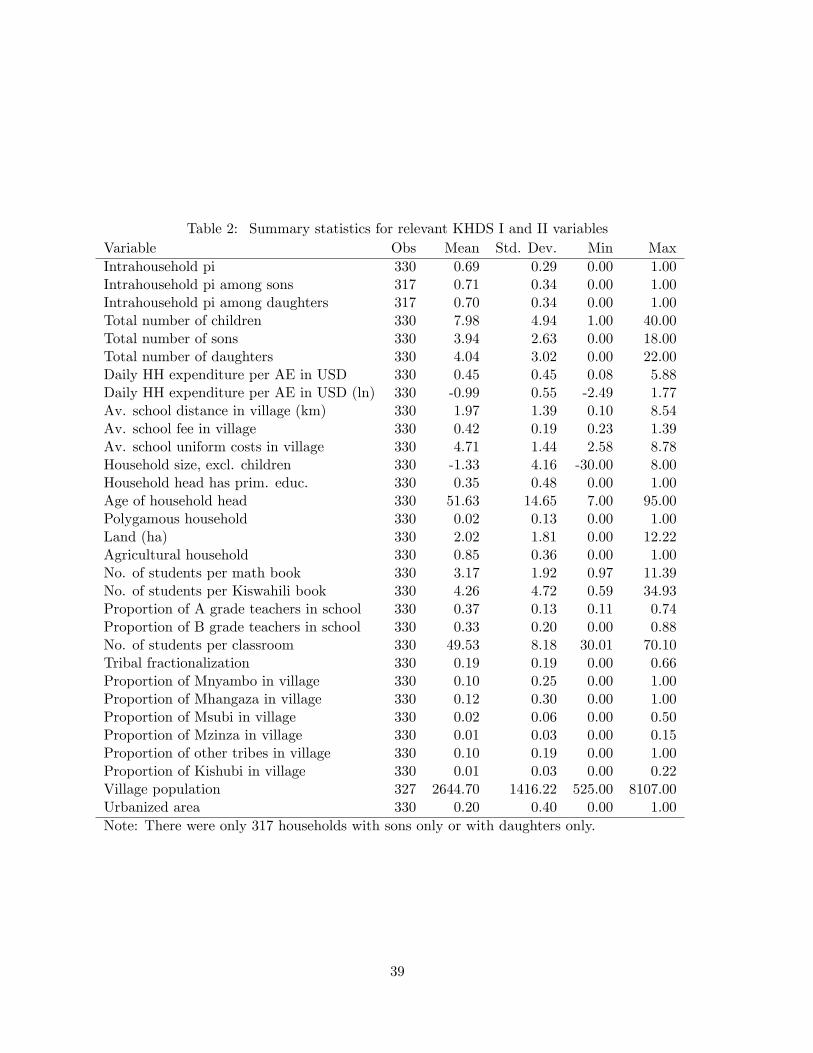
Table 2: Summary statistics for relevant KHDS I and II variablesVariable Obs Mean Std. Dev. Min MaxIntrahousehold pi 330 0.69 0.29 0.00 1.00Intrahousehold pi among sons 317 0.71 0.34 0.00 1.00Intrahousehold pi among daughters 317 0.70 0.34 0.00 1.00Total number of children 330 7.98 4.94 1.00 40.00Total number of sons 330 3.94 2.63 0.00 18.00Total number of daughters 330 4.04 3.02 0.00 22.00Daily HH expenditure per AE in USD 330 0.45 0.45 0.08 5.88Daily HH expenditure per AE in USD (ln) 330 -0.99 0.55 -2.49 1.77Av. school distance in village (km) 330 1.97 1.39 0.10 8.54Av. school fee in village 330 0.42 0.19 0.23 1.39Av. school uniform costs in village 330 4.71 1.44 2.58 8.78Household size, excl. children 330 -1.33 4.16 -30.00 8.00Household head has prim. educ. 330 0.35 0.48 0.00 1.00Age of household head 330 51.63 14.65 7.00 95.00Polygamous household 330 0.02 0.13 0.00 1.00Land (ha) 330 2.02 1.81 0.00 12.22Agricultural household 330 0.85 0.36 0.00 1.00No. of students per math book 330 3.17 1.92 0.97 11.39No. of students per Kiswahili book 330 4.26 4.72 0.59 34.93Proportion of A grade teachers in school 330 0.37 0.13 0.11 0.74Proportion of B grade teachers in school 330 0.33 0.20 0.00 0.88No. of students per classroom 330 49.53 8.18 30.01 70.10Tribal fractionalization 330 0.19 0.19 0.00 0.66Proportion of Mnyambo in village 330 0.10 0.25 0.00 1.00Proportion of Mhangaza in village 330 0.12 0.30 0.00 1.00Proportion of Msubi in village 330 0.02 0.06 0.00 0.50Proportion of Mzinza in village 330 0.01 0.03 0.00 0.15Proportion of other tribes in village 330 0.10 0.19 0.00 1.00Proportion of Kishubi in village 330 0.01 0.03 0.00 0.22Village population 327 2644.70 1416.22 525.00 8107.00Urbanized area 330 0.20 0.40 0.00 1.00Note: There were only 317 households with sons only or with daughters only.
39
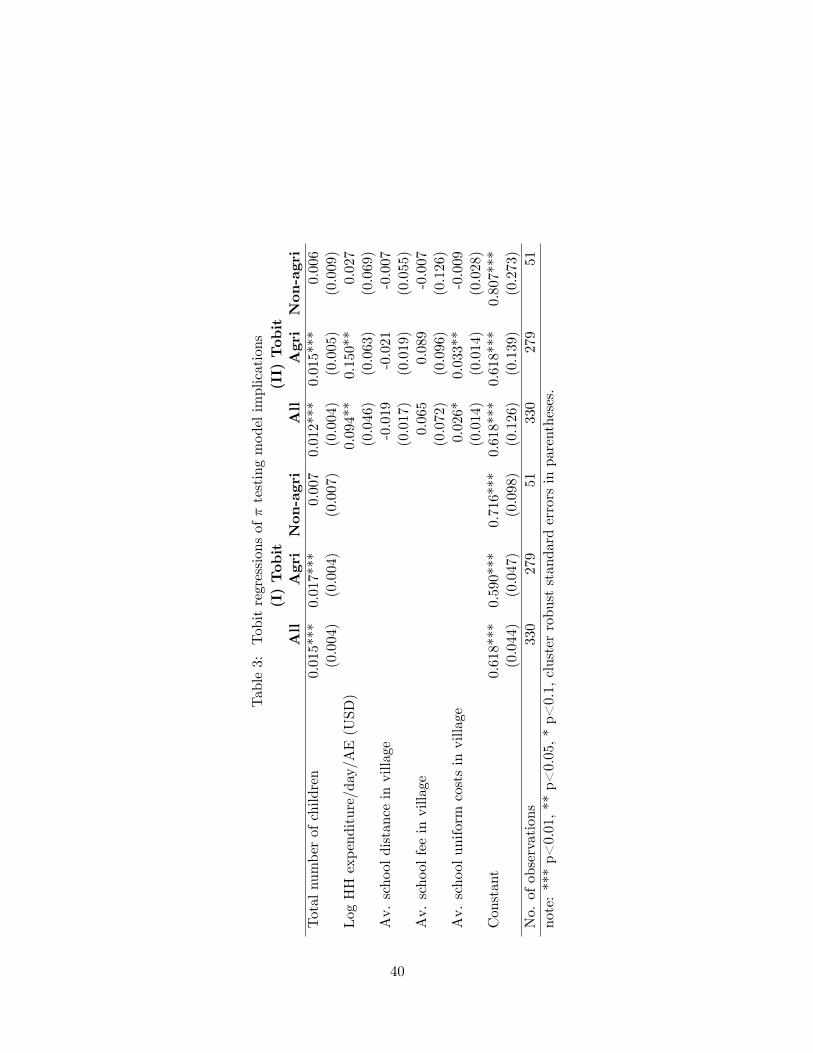
Table3:
Tobitregressionsof�testingmodelimplications
(I)Tobit
(II)Tobit
All
AgriNon-agri
All
AgriNon-agri
Totalnumberofchildren
0.015***
0.017***
0.007
0.012***
0.015***
0.006
(0.004)
(0.004)
(0.007)
(0.004)
(0.005)
(0.009)
LogHHexpenditure/day/AE(USD)
0.094**
0.150**
0.027
(0.046)
(0.063)
(0.069)
Av.schooldistanceinvillage
-0.019
-0.021
-0.007
(0.017)
(0.019)
(0.055)
Av.schoolfeeinvillage
0.065
0.089
-0.007
(0.072)
(0.096)
(0.126)
Av.schooluniformcostsinvillage
0.026*
0.033**
-0.009
(0.014)
(0.014)
(0.028)
Constant
0.618***
0.590***
0.716***
0.618***
0.618***
0.807***
(0.044)
(0.047)
(0.098)
(0.126)
(0.139)
(0.273)
No.ofobservations
330
279
51330
279
51note:***p<0.01,**p<0.05,*p<0.1,clusterrobuststandarderrorsinparentheses.
40
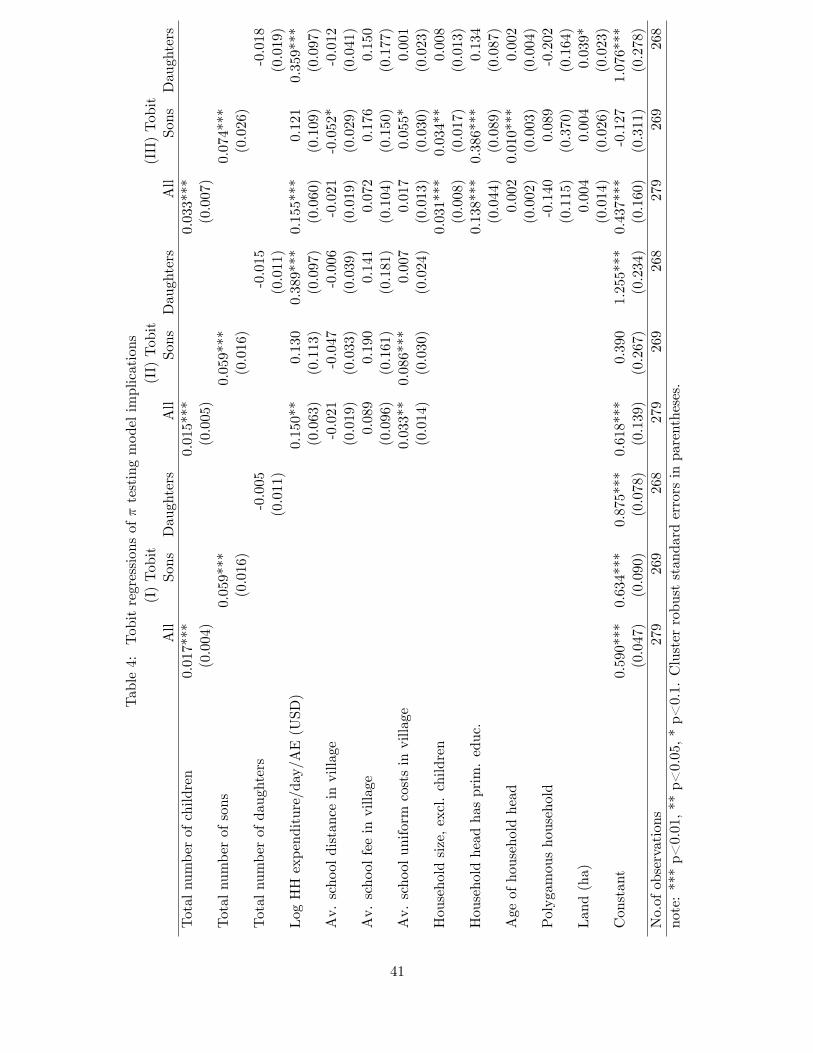
Table4:
Tobitregressionsof�testingmodelimplications
(I)Tobit
(II)Tobit
(III)Tobit
All
Sons
Daughters
All
Sons
Daughters
All
Sons
Daughters
Totalnumberofchildren
0.017***
0.015***
0.033***
(0.004)
(0.005)
(0.007)
Totalnumberofsons
0.059***
0.059***
0.074***
(0.016)
(0.016)
(0.026)
Totalnumberofdaughters
-0.005
-0.015
-0.018
(0.011)
(0.011)
(0.019)
LogHHexpenditure/day/AE(USD)
0.150**
0.130
0.389***
0.155***
0.121
0.359***
(0.063)
(0.113)
(0.097)
(0.060)
(0.109)
(0.097)
Av.schooldistanceinvillage
-0.021
-0.047
-0.006
-0.021
-0.052*
-0.012
(0.019)
(0.033)
(0.039)
(0.019)
(0.029)
(0.041)
Av.schoolfeeinvillage
0.089
0.190
0.141
0.072
0.176
0.150
(0.096)
(0.161)
(0.181)
(0.104)
(0.150)
(0.177)
Av.schooluniformcostsinvillage
0.033**
0.086***
0.007
0.017
0.055*
0.001
(0.014)
(0.030)
(0.024)
(0.013)
(0.030)
(0.023)
Householdsize,excl.children
0.031***
0.034**
0.008
(0.008)
(0.017)
(0.013)
Householdheadhasprim.educ.
0.138***
0.386***
0.134
(0.044)
(0.089)
(0.087)
Ageofhouseholdhead
0.002
0.010***
0.002
(0.002)
(0.003)
(0.004)
Polygamoushousehold
-0.140
0.089
-0.202
(0.115)
(0.370)
(0.164)
Land(ha)
0.004
0.004
0.039*
(0.014)
(0.026)
(0.023)
Constant
0.590***
0.634***
0.875***
0.618***
0.390
1.255***
0.437***
-0.127
1.076***
(0.047)
(0.090)
(0.078)
(0.139)
(0.267)
(0.234)
(0.160)
(0.311)
(0.278)
No.ofobservations
279
269
268
279
269
268
279
269
268
note:***p<0.01,**p<0.05,*p<0.1.Clusterrobuststandarderrorsinparentheses.
41
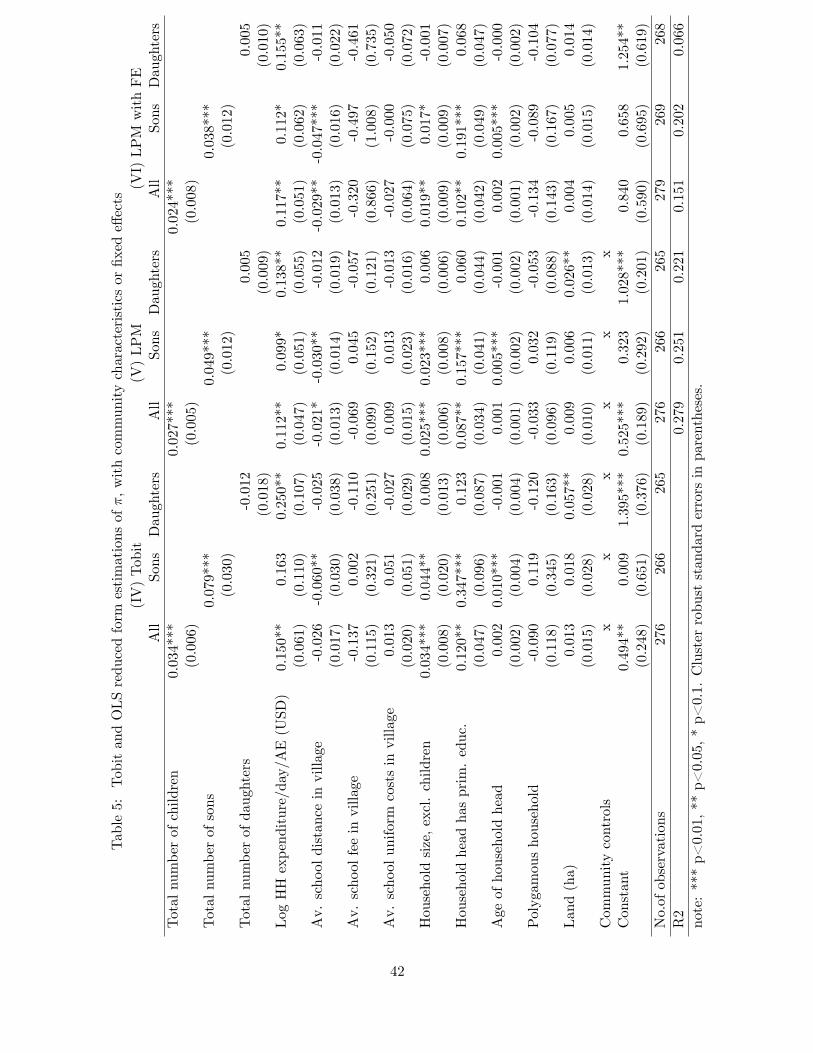
Table5:
TobitandOLSreducedform
estimationsof�,withcommunitycharacteristicsor�xede¤ects
(IV)Tobit
(V)LPM
(VI)LPMwithFE
All
Sons
Daughters
All
Sons
Daughters
All
Sons
Daughters
Totalnumberofchildren
0.034***
0.027***
0.024***
(0.006)
(0.005)
(0.008)
Totalnumberofsons
0.079***
0.049***
0.038***
(0.030)
(0.012)
(0.012)
Totalnumberofdaughters
-0.012
0.005
0.005
(0.018)
(0.009)
(0.010)
LogHHexpenditure/day/AE(USD)
0.150**
0.163
0.250**
0.112**
0.099*
0.138**
0.117**
0.112*
0.155**
(0.061)
(0.110)
(0.107)
(0.047)
(0.051)
(0.055)
(0.051)
(0.062)
(0.063)
Av.schooldistanceinvillage
-0.026
-0.060**
-0.025
-0.021*
-0.030**
-0.012
-0.029**
-0.047***
-0.011
(0.017)
(0.030)
(0.038)
(0.013)
(0.014)
(0.019)
(0.013)
(0.016)
(0.022)
Av.schoolfeeinvillage
-0.137
0.002
-0.110
-0.069
0.045
-0.057
-0.320
-0.497
-0.461
(0.115)
(0.321)
(0.251)
(0.099)
(0.152)
(0.121)
(0.866)
(1.008)
(0.735)
Av.schooluniformcostsinvillage
0.013
0.051
-0.027
0.009
0.013
-0.013
-0.027
-0.000
-0.050
(0.020)
(0.051)
(0.029)
(0.015)
(0.023)
(0.016)
(0.064)
(0.075)
(0.072)
Householdsize,excl.children
0.034***
0.044**
0.008
0.025***
0.023***
0.006
0.019**
0.017*
-0.001
(0.008)
(0.020)
(0.013)
(0.006)
(0.008)
(0.006)
(0.009)
(0.009)
(0.007)
Householdheadhasprim.educ.
0.120**
0.347***
0.123
0.087**
0.157***
0.060
0.102**
0.191***
0.068
(0.047)
(0.096)
(0.087)
(0.034)
(0.041)
(0.044)
(0.042)
(0.049)
(0.047)
Ageofhouseholdhead
0.002
0.010***
-0.001
0.001
0.005***
-0.001
0.002
0.005***
-0.000
(0.002)
(0.004)
(0.004)
(0.001)
(0.002)
(0.002)
(0.001)
(0.002)
(0.002)
Polygamoushousehold
-0.090
0.119
-0.120
-0.033
0.032
-0.053
-0.134
-0.089
-0.104
(0.118)
(0.345)
(0.163)
(0.096)
(0.119)
(0.088)
(0.143)
(0.167)
(0.077)
Land(ha)
0.013
0.018
0.057**
0.009
0.006
0.026**
0.004
0.005
0.014
(0.015)
(0.028)
(0.028)
(0.010)
(0.011)
(0.013)
(0.014)
(0.015)
(0.014)
Communitycontrols
xx
xx
xx
Constant
0.494**
0.009
1.395***
0.525***
0.323
1.028***
0.840
0.658
1.254**
(0.248)
(0.651)
(0.376)
(0.189)
(0.292)
(0.201)
(0.590)
(0.695)
(0.619)
No.ofobservations
276
266
265
276
266
265
279
269
268
R2
0.279
0.251
0.221
0.151
0.202
0.066
note:***p<0.01,**p<0.05,*p<0.1.Clusterrobuststandarderrorsinparentheses.
42
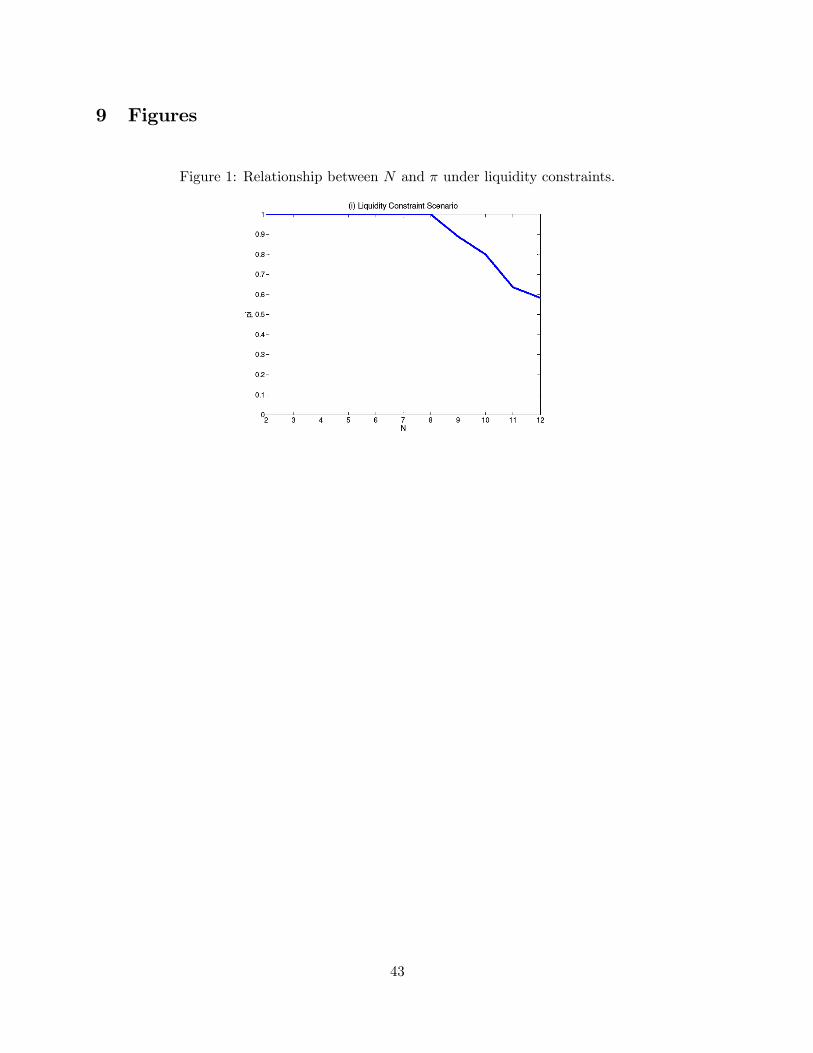
9 Figures
Figure 1: Relationship between N and � under liquidity constraints.
43
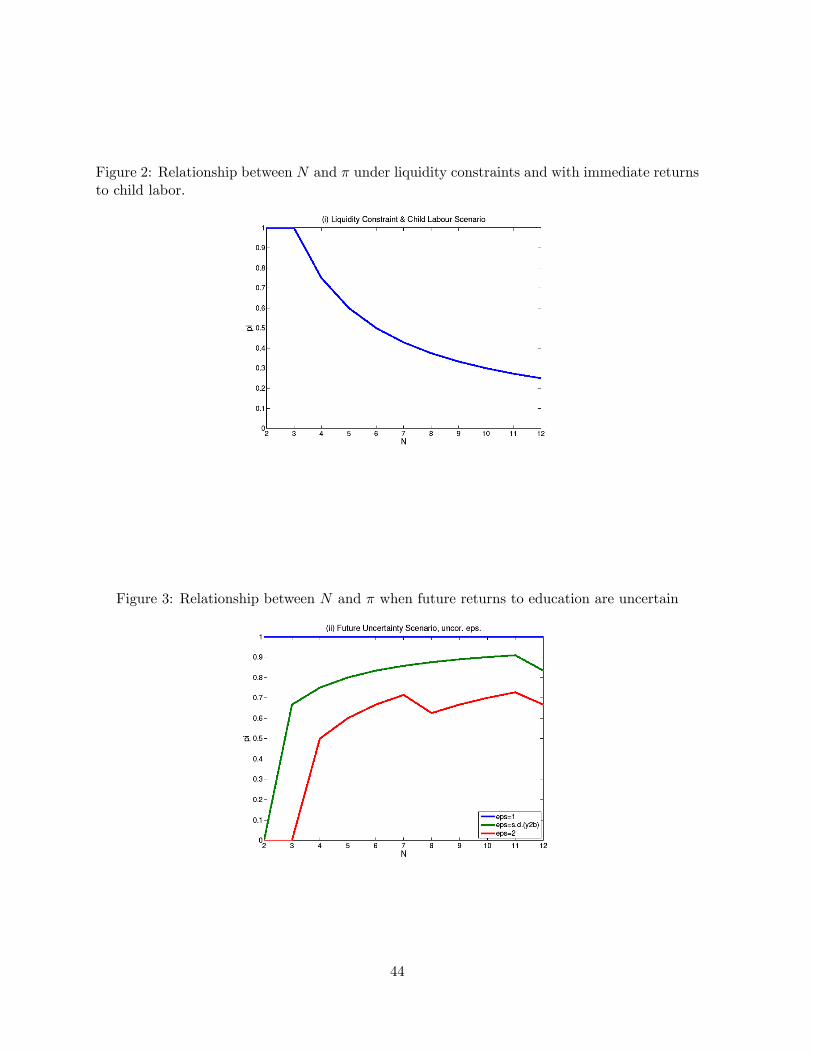
Figure 2: Relationship between N and � under liquidity constraints and with immediate returnsto child labor.
Figure 3: Relationship between N and � when future returns to education are uncertain
44
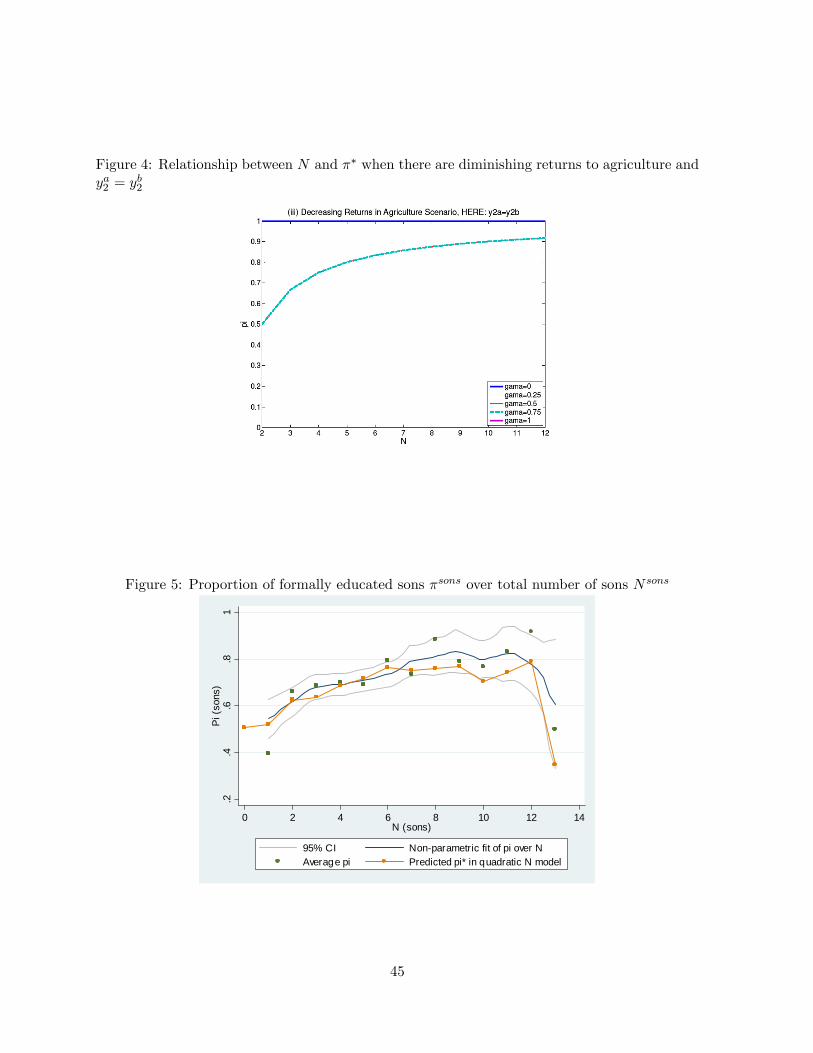
Figure 4: Relationship between N and �� when there are diminishing returns to agriculture andya2 = y
b2
Figure 5: Proportion of formally educated sons �sons over total number of sons N sons
.2.4
.6.8
1Pi
(son
s)
0 2 4 6 8 10 12 14N (sons)
95% CI Nonparametric fit of pi over NAverage pi Predicted pi* in quadratic N model
45
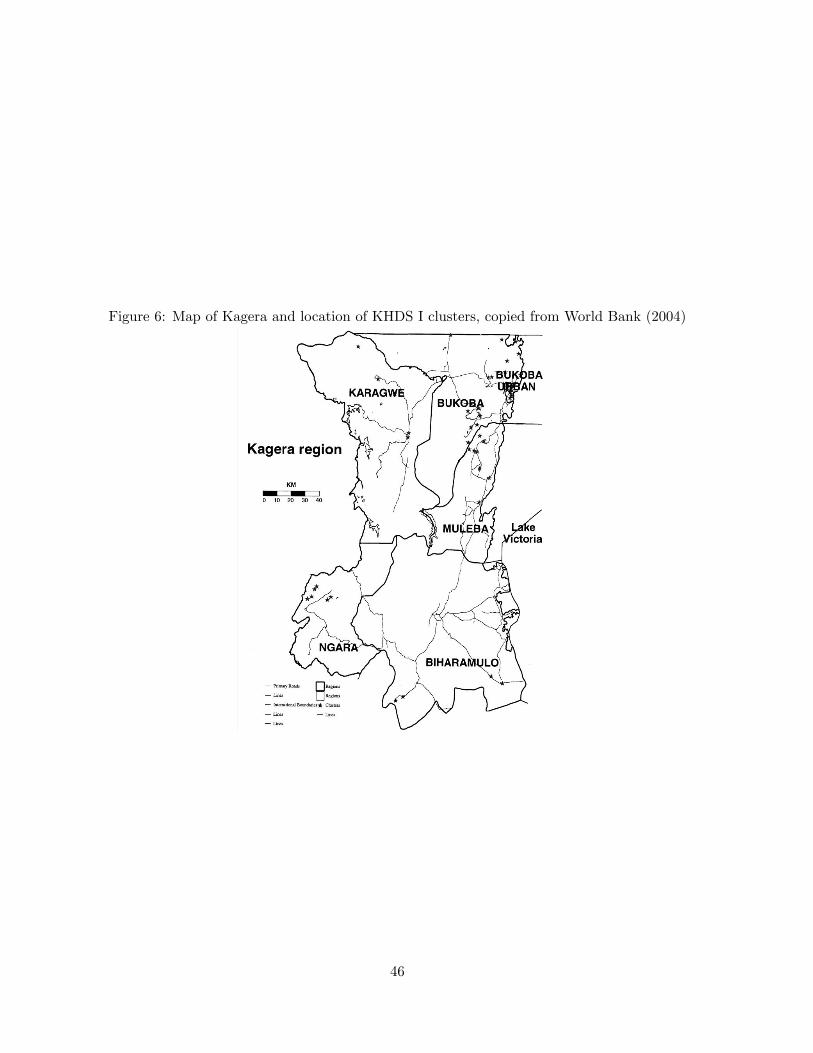
Figure 6: Map of Kagera and location of KHDS I clusters, copied from World Bank (2004)
46
Related Documents