A STUDY ON THE YEAR WISE PERFORMANCE OF DERIVATIVES, SINCE THEIR INCEPTION, IN INDIAN CONTEXT, UNDER NSE TABLE OF CONTENTS Chapter No Contents 1 CHAPTER-1 INTRODUCTION Industrial profile Statement of problems Need for the study Objectives of the study Scope of the study Limitations of the study 2 CHAPTER-2 INDUSTRY PROFILE AND COMPANY PROFILE Derivatives market Clearing and settlement(F&O) Plan of action Period of study Research design Descriptive research Sources of data 3 CHAPTER-4 ANALYSIS AND INTERPRETATION OF DATA 4 CHAPTER-5 SUMMARY OF FINDINGS, SUGGESTIONS, AND CONCLUSIONS BIBLIOGRAPHY 1

Welcome message from author
This document is posted to help you gain knowledge. Please leave a comment to let me know what you think about it! Share it to your friends and learn new things together.
Transcript

A STUDY ON THE YEAR WISE PERFORMANCE OF DERIVATIVES, SINCE THEIR INCEPTION, IN INDIAN
CONTEXT, UNDER NSE
TABLE OF CONTENTS
Chapter No Contents
1 CHAPTER-1 INTRODUCTION
Industrial profile Statement of problems Need for the study Objectives of the study Scope of the study Limitations of the study
2 CHAPTER-2 INDUSTRY PROFILE AND COMPANY
PROFILE
Derivatives market Clearing and settlement(F&O) Plan of action Period of study Research design Descriptive research Sources of data
3 CHAPTER-4 ANALYSIS AND INTERPRETATION OF
DATA
4 CHAPTER-5 SUMMARY OF FINDINGS,
SUGGESTIONS, AND CONCLUSIONS
BIBLIOGRAPHY
ANNEXURE
1

2
INTRODUCTION
The emergence of the market for derivative products, most notably forwards, futures and
options, can be based on the willingness of the risk-averse economic agents to guard against
themselves against uncertainties arising out of fluctuations in asset prices. By nature, the
financial markets are marked by a very high degree of volatility. Derivatives are used to
partially or fully transfer the price risks by locking-in asset price. Derivative products
minimize the impact of fluctuations in asset prices on the profitability and cash flow situation
of risk-averse investors.
A Derivative includes: -
a. A security derived from a debt instrument, share, loan, whether secured or unsecured,
risk instrument or contract for differences or any other form of security.
b. A contract which derives its value from the prices, or index of prices, of underlying
securities.
Derivative products initially emerged as hedging devices against fluctuations in
Commodity prices and commodity-linked derivatives remained the sole form of such
products for almost three hundred years. Financial derivatives came into spotlight in the
post-1970 period due to growing instability in the financial markets. However, since their
emergence, these products have become very popular and by 1990s, they accounted for about
two-thirds of total transactions in derivative products.
In recent years, the market for financial derivatives has grown tremendously in terms of
variety of instruments available, their complexity and also turnover. In the class of equity
derivatives the world over, futures and options on stock indices have gained more popularity
than on individual stocks, especially among institutional investors, who are major users of
index-linked derivatives. Even small investors find these useful due to high correlation of the
popular indexes with various portfolios and ease of use. The lower costs associated with
index derivatives vis-à-vis derivative products based on individual securities is another
reason for their growing use.
3
RESEARCH DESIGNStatement of Problem
Derivatives market was started in India in the year 2000-01. The basic problem
identified was about the Performance Evaluation of Derivatives in the Indian market
pertaining to NSE and to list various companies participating in the Future and option
market. The study includes evaluation of different types of Futures and Options data by
taking separately. It also gives a brief idea about the functioning of the derivatives market, its
procedure and various products available in derivative market.
Though there is a gradual growth in the derivative market from the beginning, there is
a fall in its performance at this point of time due to recession. So this study helps in
evaluating the performance of derivatives.
NEED FOR THE STUDY
The project conducted at Geojit Financial Services Ltd, is basically carried out to
study the functioning of the derivative market. The main intension of the project is to
evaluate the performance of the derivative market in the Indian context and to list all the
participants of future and option market. It helps to know about the functioning of futures
and options in detail.
OBJECTIVES OF THE STUDY To study the growth and analysis on performance of derivative market in India pertaining
to NSE.
To know about the functioning of Futures and options.
To study the functioning of derivative market in India pertaining to NSE.
To list all the product of Futures and Option in the stock market.
Based on the findings, conclusions and suggestions are drawn.
SCOPE OF THE STUDY
4
1. To analyze the growth in the derivative market from the beginning of its trading i.e
from 2000-01 in NSE.
2. The study also covers the functioning of the derivative market in India pertaining to
NSE.
3. And to list all the products of Index Futures, Index Option, Stock Futures and the
Stock Options.
LIMITATIONS OF THE STUDY
The study involves certain limitations and some of those limitations are:
The study is restricted to the, Performance evaluation of derivative market in the
Indian context pertaining to NSE.
The study is limited only for the NSE, as the information is taken from NSE.
The research is carried out only based on the information furnished by the company.
5

6
INDUSTRY PROFILE
DERIVATIVES MARKET Stock Exchanges
Stock exchanges are the physical locations where stocks are bought and sold. They
are the sisters of the Over-The-Counter (OTC) market. The OTC refers to market in which
securities transactions are conducted through a telephone and computer networks connecting
dealers in stocks and bonds, rather than on the floor of an exchange. Together, these two
markets form the secondary market. The primary and secondary markets together form the
stock market.
Trading in derivatives of securities commenced in June 2000 with the enactment of
enabling legislation in early 2000. Derivatives are formally defined to include: (a) a security
derived from a debt instrument, share, loan whether secured or unsecured, risk instrument or
contract for differences or any other form of security, and (b) a contract which derives its
value from the prices, or index of prices, or underlying securities. Derivatives trading in
India are legal and valid only if such contracts are traded on a recognized stock exchange,
thus precluding OTC derivatives.
Derivatives trading commenced in India in June 2000 after SEBI granted the approval
to this effect in May 2000. SEBI permitted the derivative segment of two stock exchanges,
i.e. NSE and BSE, and their clearing house/corporation to commence trading and settlement
in approved derivative contracts.
To begin with, SEBI approved trading in index futures contracts based on S&P CNX
Nifty Index and BSE-30 (Sensex) Index. This was followed by approval for trading in
options based on these two indices and options on individual securities. The derivatives
trading on the NSE commenced with S&P CNX Nifty Index futures on June 12, 2000. The
7

trading in S&P CNX Nifty Index options commenced on June 4, 2001 and trading in options
on individual securities commenced on July 2, 2001. Single stock futures were launched on
November 9, 2001. In June 2003, SEBI-RBI approved the trading on interest rate derivative
instruments.
At NSE, Index futures and options are available on Indices-S&P CNX Nifty, CNX IT
Index, Bank Nifty Index, CNX Nifty Junior, CNX 100, Nifty Midcap 50. Single stock
futures and options are available on more than 200 stocks. India is one of the largest markets
in the world for single stock futures.
The Mini derivative Futures & Options contract on S&P CNX Nifty was introduced
for trading on January 1, 2008 while the long term option contracts on S&P CNX Nifty were
introduced for trading on March 3, 2008.
DERIVATIVES
Derivative is a product whose value is derived from the value of one or more basic
variables, called bases (underlying asset, index, or reference rate), in a contractual manner.
The underlying asset can be equity, forex, commodity or any other asset. For example, wheat
farmers may wish to sell their harvest at a future date to eliminate the risk of a change in
prices by that date. Such a transaction is an example of a derivative. The price of this
derivative is driven by the spot price of wheat which is the "underlying".
The derivatives market performs a number of economic functions. First, prices in an
organized derivatives market reflect the perception of market participants about the future
and lead the prices of underlying to the perceived future level. The prices of derivatives
converge with the prices of the underlying at the expiration of the derivative contract. Thus,
derivatives help in discovery of future as well as current prices. Second, the derivatives
market helps to transfer risks from those who have them but may not like them to those who
have an appetite for them. Third, derivatives, due to their inherent nature, are linked to the
8
underlying cash markets with the introduction of derivatives, the underlying market
witnesses’ higher trading volumes because of participation by more players who would not
otherwise participate for lack of an arrangement to transfer risk. Fourth, speculative trades
shift to a more controlled environment of derivatives market. In the absence of an organized
derivatives market, speculators trade in the underlying cash markets. Margining, monitoring
and surveillance of the activities of various participants become extremely difficult in these
kinds of mixed markets. Fifth, an important incidental benefit that flows from derivatives
trading is that it acts as a catalyst for new entrepreneurial activity.
The derivatives have a history of attracting many bright, creative, well educated
people with an entrepreneurial attitude. They often energies others to create new businesses,
new products and new employment opportunities, the benefit of which are immense. Finally,
derivatives markets help increase savings and investment in the long run. Transfer of risk
enables market participants to expand their volume of activity.
Derivatives Market in India The first step towards introduction of derivatives trading in India was the
promulgation of the Securities Laws (Amendment) Ordinance, 1995, which withdrew the
prohibition on options in securities. The market for derivatives, however did not take off, as
there was no regulatory framework to govern trading of derivatives. SEBI set up a 24-
member committee under the chairmanship of Dr. L.C. Gupta on November 18, 1996 to
develop appropriate regulatory framework for derivatives trading in India. The committee
submitted its report on March 17, 1998 prescribing necessary preconditions for introduction
of derivatives trading in India. The committee recommended that derivatives should be
declared as ‘securities’ so that regulatory framework applicable to trading of ‘securities’
could also govern trading of securities. SEBI also set up a group in June 1998 under the
chairmanship of Prof. J. R. Varma, to recommend measures for risk containment in
derivatives market in India. The report, which was submitted in October 1998, worked out
the operational details of margining system, methodology for charging initial margins, broker
net worth, deposit requirement and real-time monitoring requirements. The SCRA was
9
amended in December 1999 to include derivatives within the ambit of ‘securities’ and the
regulatory framework were developed for governing derivatives trading. The act also made it
clear that derivatives shall be legal and valid only if such contracts are traded on a recognized
stock exchange, thus precluding OTC derivatives. The government also rescinded in March
2000, the three-decade old notification, which prohibited forward trading in securities.
Derivatives trading commenced in India in June 2000 after SEBI granted the final
approval to this effect in May 2000. SEBI permitted the derivatives segments of two stock
exchanges NSE and BSE, and their clearing house corporation to commence trading and
settlement in approved derivatives contracts. To begin with, SEBI approved trading in index
futures contracts based on S&P CNX Nifty and BSE-30 (Sensex) index. This was followed
by approval for trading in options which commenced in June 2001 and the trading in options
on individual securities commenced in July 2001. Futures contracts on individual stocks
were launched in November 2001. Futures and Options contracts on individual securities are
available on more than 200 securities. Trading and settlement in derivative contracts is done
in accordance with the rules, byelaws, and regulations of the respective exchanges and their
clearing house/ corporation duly approved by SEBI and notified in the official gazette.
Factors Driving the Growth of the Derivatives Over the last three decades, the derivatives market has seen a phenomenal growth. A
large variety of derivative contracts have been launched at exchanges across the world. Some
of the factors driving the growth of financial derivatives are:
1. Increased volatility in asset prices in financial markets.
2. Increased integration of national financial markets with the international markets.
3. Marked improvement in communication facilities and sharp decline in their costs.
4. Development of more sophisticated risk management tools, providing economic agents a
wider choice of risk management strategies, and
5. Innovations in the derivatives markets, which optimally combine the risks and returns over
a large number of financial assets leading to higher returns, reduced risk as well as
transactions costs as compared to individual financial assets.
10

Participants in the Derivative Market The following three broad categories of participants - hedgers, speculators, and
arbitrageurs trade in the derivatives market. Hedgers face risk associated with the price of an
asset. They use futures or options markets to reduce or eliminate this risk. Speculators wish
to bet on future movements in the price of an asset. Futures and options contracts can give
them an extra leverage; that is, they can increase both the potential gains and potential losses
in a speculative venture. Arbitrageurs are in business to take advantage of a discrepancy
between prices in two different markets. If, for example, they see the futures price of an asset
getting out of line with the cash price, they will take offsetting positions in the two markets
to lock in a profit.
NSE's Derivatives MarketThe derivatives trading on the NSE commenced with S&P CNX Nifty Index futures
on June 12, 2000. The trading in index options commenced on June 4, 2001 and trading in
options on individual securities commenced on July 2, 2001. Single stock futures were
launched on November 9, 2001. Today, both in terms of volume and turnover, NSE is the
largest derivatives exchange in India. Currently, the derivatives contracts have a maximum
of 3-month expiration cycles. Three contracts are available for trading, with 1 month, 2
months and 3 months expiry. A new contract is introduced on the next trading day following
the expiry of the near month contract.
Participants and functionsNSE admits members on its derivatives segment in accordance with the rules and
regulations of the exchange and the norms specified by SEBI. NSE follows 2-tier
membership structure stipulated by SEBI to enable wider participation. Those interested in
taking membership on F&O segment are required to take membership of CM and F&O
segment or CM, WDM and F&O segment. Trading and clearing members are admitted
11
separately. Essentially, a clearing member (CM) does clearing for all his trading members
(TMs), undertakes risk management and performs actual settlement. There are three types of
CMs:
• Self Clearing Member: A SCM clears and settles trades executed by him only either on his
own account or on account of his clients.
• Trading Member Clearing Member: TM-CM is a CM who is also a TM. TM-CM may
clear and settle his own proprietary trades and client's trades as well as clear and settle for
other TMs.
• Professional Clearing Member PCM is a CM who is not a TM. Typically, banks or
custodians could become a PCM and clear and settle for TMs. The TM-CM and the PCM are
required to bring in additional security deposit in respect of every TM whose rates they
undertake to clear and settle. Besides this, trading members are required to have qualified
users and sales persons, who have passed a certification programme approved by SEBI.
Trading mechanism The futures and options trading system of NSE, called NEAT-F&O trading system,
provides a fully automated screen-based trading for Index futures & options and Stock
futures & options on a nationwide basis and an online monitoring and surveillance
mechanism. It supports an anonymous order driven market which provides complete
transparency of trading operations and operates on strict price-time priority. It is similar to
that of trading of equities in the Cash Market (CM) segment. The NEAT-F&O trading
system is accessed by two types of users. The Trading Members (TM) have access to
functions such as order entry, order matching, and order and trade management. It provides
tremendous flexibility to users in terms of kinds of orders that can be placed on the system.
Various conditions like Immediate or Cancel, Limit/Market price, Stop loss, etc. can be built
into an order. The Clearing Members (CM) uses the trader workstation for the purpose of
monitoring the trading member(s) for whom they clear the trades. Additionally, they can
enter and set limits to positions, which a trading member can take.
12
Derivative Products Derivative is the product whose value is derived from the value of one or more basic
variables called Underlying assets. The underlying asset can be equity, forex, commodity, or
any other asset. Derivative contracts have several variants. The most common variants are:
Forwards: A Forward contract is a customized contract between two entities, where
settlement takes place on a specific date in the future at today’s agreed price.
Futures: A Future contract is an agreement between two parties to buy or sell an asset at a
certain price. Future contract are a standardized contract.
Options: Options are of two types – call and put. Call option gives the buyer a right but not
the obligation to buy a given quantity of the underlying asset, at a given price on or before a
given future date. Put option gives the seller, a right but not an obligation to sell a given
quantity of the underlying asset at a given price on or before a given date.
Warrants: Options generally have lives of upto one year, the majority of options traded on
options exchanges having a maximum maturity of nine months. Longer-dated options are
called warrants and are generally traded over-the counter.
LEAPS: The LEAP means Long-Term Equity Anticipation Securities. These are options
having a maturity of up to three years.
Baskets: Basket options are option on portfolio of underlying assets. The underlying asset is
usually a moving average of a basket of assets. Equity index options are a form of basket
options.
13
Swaps: Swaps are private agreements between two parties to exchange cash flows in the
future according to a prearranged formula. They can be regarded as portfolios of forward
contracts. The two commonly used swaps are:
Interest rate swaps: These entail swapping only the interest related cash flows
between the parties in the same currency.
Currency swaps: These entail swapping both principal and interest between the
parties, with the cash flows in one direction being in a different currency than those in
the opposite direction.
Swaptions: Swaptions are options to buy or sell a swap that will become operative at the
expiry of the options. Thus a swaption is an option on a forward swap. Rather than have calls
and puts, the swaptions market has receiver swaptions and payer swaptions. A receiver
swaption is an option to receive fixed and pay floating. A payer swaption is an option to pay
fixed and receive floating.
Introduction to Futures and Options
Though Derivatives has different variants like, forwards, futures, options, swaps,
swaptions, warrants, LEAPS, etc. the most commonly used derivatives are Futures and
Options. Here is the brief introduction about the futures and options.
FUTURES
A futures contract is an agreement between two parties to buy or sell an asset at a
certain time in the future at a certain price. But unlike forward contracts, the futures contracts
are standardized and exchange traded. To facilitate liquidity in the futures contracts, the
exchange specifies certain standard features of the contract. It is a standardized contract with
standard underlying instrument, a standard quantity and quality of the underlying instrument
that can be delivered and a standard timing of such settlement. A futures contract may be
offset prior to maturity by entering into an equal and opposite transaction. More than 99% of
futures transactions are offset this way.
14
The standardized items in a futures contract are:
o Quantity of the underlying
o Quality of the underlying
o The date and the month of delivery
o The units of price quotation and minimum price change
o Location of settlement
Futures Trading Futures contracts are purchased when the investor expects the price of the underlying
security to rise. This is known as going long. Because he has purchased the obligation to buy
goods at the current price, the holder will profit if the price goes up, allowing him to sell his
futures contract for a profit or take delivery of the goods on the future date at the lower price.
The opposite of going long is going short. In case, the holder acquires the obligation
to sell the underlying commodity at the current price. He will profit if the price declines
before the future date.
Hedgers trade futures for the purpose of keeping price risk in check. Because the
price for a future transaction can be set in the present, the fluctuations in the interim can be
avoided. If the price goes up, the holder will be buying at a discount. If the price goes down,
he will miss out on the new lower price. Hedging with futures can even be used to protect
against unfavorable interest rate adjustment.
While hedgers attempt to avoid risk, speculators seek it out in the hope of turning a
profit when prices fluctuate. Speculators trade purely for the purpose of making a profit and
15
never intend to take delivery on goods. Like options, futures contracts can also be used to
create spread that profit from price fluctuations.
Accounts used to trade futures must be settled with respect to the margin on a daily
basis. Gain and losses are tallied on the day that they occur. Margin accounts that fall below
a certain level must be credited with additional funds.
Settling Futures Contracts Futures contracts are usually not settled with physical delivery. The purchase or
sale of an offsetting position can be used to settle an existing position, allowing the
speculator or hedger to realize profits or losses from the original contract. At this point the
margin balance is returned to the holder along with any additional gains, or the margin
balance plus profit as a credit toward the holder's loss. Cash settlement is used for contracts
like stock index futures that obviously cannot result in delivery.
The purpose of the delivery option is to insure that the futures price and the cash price
of good converge at the expiration date. If this were not true, the good would be available at
two different prices at the same time. Traders could then make a risk-free profit by
purchasing goods in the market with the lower price and selling in the market with the higher
price. That strategy is called arbitrage. It allows some traders to profit from very small
differences in price at the time of expiration.
Pricing FuturesFutures prices are presented in the same format of cash market prices. When these
prices change, they must change by at least a certain minimum amount, called the tick. The
tick is set by the exchange.
Prices are also subject to a maximum daily change. These limits are also determined
by the exchange. Once a limit is reached, no trading is allowed on the other side of that limit
16

for the duration of the session. Both lower and upper limits are in effect. Limits were
instituted to guard against particularly drastic fluctuations in the market.
In addition to these limits, there are also a maximum number of contracts for a given
commodity per person. This limit serves to prevent one investor from gaining such great
influence over the price that he can begin to control it.
Future Terminology
Spot price: The price at which an asset trades in the spot market.
Futures price: The price at which the futures contract trades in the futures market.
Contract cycle: The period over which a contract trades. The index futures contracts on
the NSE have one- month, two-month and three months expiry cycles which expire on the
last Thursday of the month. Thus a January expiration contract expires on the last Thursday
of January and a February expiration contract ceases trading on the last Thursday of
February. On the Friday following the last Thursday, a new contract having a three- month
expiry is introduced for trading.
Expiry date: It is the date specified in the futures contract. This is the last day on which
the contract will be traded, at the end of which it will cease to exist.
Contract size: The amount of asset that has to be delivered less than one contract. Also
called as lot size.
Basis: In the context of financial futures, basis can be defined as the futures price minus
the spot price. There will be a different basis for each delivery month for each contract. In a
normal market, basis will be positive. This reflects that futures prices normally exceed spot
prices.
17
Cost of carry: The relationship between futures prices and spot prices can be
summarized in terms of what is known as the cost of carry. This measures the storage cost
plus the interest that is paid to finance the asset less the income earned on the asset.
Initial margin: The amount that must be deposited in the margin account at the time a
futures contract is first entered into is known as initial margin.
Marking-to-market: In the futures market, at the end of each trading day, the margin
account is adjusted to reflect the investor's gain or loss depending upon the futures closing
price. This is called marking-to-market.
Maintenance margin: This is somewhat lower than the initial margin. This is set to
ensure that the balance in the margin account never becomes negative. If the balance in the
margin account falls below the maintenance margin, the investor receives a margin call and
is expected to top up the margin account to the initial margin level before trading commences
on the next day.
To trade futures, a customer must open a futures trading account with a derivatives
broker. Buying futures involves putting in the margin money. They enable the futures traders
to take a position in the underlying security without having to open an account with a
securities broker. With the purchase of futures on a security, the holder essentially makes a
legally binding promise or obligation to buy the underlying security at maturity date in the
future. Security futures do not represent ownership in a corporation and the holder is
therefore not regarded as a shareholder.
A futures contract represents a promise to transact at some point in the future. In this
light, a promise to sell security is just as easy to make as a promise to buy security. Selling
security futures without previously owning them simply obligates the trader to selling a
certain amount of the underlying security at some point in the future. It can be done just as
easily as buying futures, which obligates the trader to buying a certain amount of the
underlying security the future date.
18
Stock Futures Trading in stock futures commenced on the NSE from November 2001. These
contracts are cash settled on a T+1 basis. The expiration cycle for stock futures is the same as
for index futures, index options and stock options. A new contract is introduced on the
trading day following the expiry of the near month contract.
Index futuresNSE trade S&P CNX Nifty, CNX IT, BANK Nifty, CNX Nifty Junior, CNX 100,
Nifty Midcap 50 and Mini Nifty 50 futures contracts having one-month, two-month and
three- month expiry cycles. All contracts expire on the last Thursday of every month. Thus a
January expiration contract would expire on the last Thursday of January and a February
expiry contract would cease trading on the last Thursday of February. On the Friday
following the last Thursday, a new contract having a three- month expiry would be
introduced for trading.
Futures payoffFutures contracts have linear payoffs. In simple words, it means that the losses as well
as profits for the buyer and the seller of a futures contract are unlimited. These linear payoffs
are fascinating as they can be combined with options and the underlying to generate various
complex payoffs
Payoff for buyer of futures: Long futures
The payoff for a person who buys a futures contract is similar to the payoff for a
person who holds an asset. He has a potentially unlimited upside as well as a potentially
unlimited downside. Take the case of a speculator who buys a two month Nifty index futures
contract when the Nifty stands at 2220.
19

The underlying asset in this case is the Nifty portfolio. When the index moves up, the
long futures position starts making profits, and when the index moves down it starts making
losses.
Payoff for seller of futures: Short futures
The payoff for a person who sells a futures contract is similar to the payoff for a person
who shorts an asset. He has a potentially unlimited upside as well as a potentially unlimited
downside. Take the case of a speculator who sells a two-month Nifty index futures contract
when the Nifty stands at 2220.
The underlying asset in this case is the Nifty portfolio. When the index moves down,
the short futures position starts making profits, and when the index moves up, it starts
making losses.
MARKET PARTICIPANTS IN A FUTURES MARKET:
HEDGERS, SPECULATORS AND ARBITRAGEURS
To be successful, a futures market basically needs to have two types of participants:
hedgers and speculator. The markets simply cannot exist without hedgers and the
speculators cannot then perform any economic function.
Hedging
Hedging is a mechanism to reduce price risk inherent in open positions. Derivatives
are widely used for hedging. A hedge can be help lock in existing profits. Its purpose is to
reduce the volatility of the portfolio, by reducing the risk.
Keep one thing in mind hedging is not mean maximization of the return. It only means
reducing the variation or volatility of the portfolio return. It is quite possible that the return
is higher in the absence of the hedge, but also is the possibility of a much lower return.
20

Hedger is one who is engaged in a business activity where annual acceptable price risk
exists.
Hedging Ratio The hedge ratio is defined as the number of futures contracts required to buy or sell so
as to provide the maximum offset of risk. This depends on
Value of the futures contract.
Value of the portfolio to be hedge.
Sensitivity of the movement of the portfolio price to that of the index (called beta).
The hedge ratio is closely linked to the correlation between the asset (portfolio of
shares) to be hedged and underlying (Index) from which the future is derived.
Strategies for hedging
The basic logic in hedging “If long in cash underlying – short future and if short in
cash underlying – Long futures “Let us understands this by a simple example If you have
bought 100 shares of any company and want to hedge against the market movements, you
should short an appropriate amount of index futures. This will reduce your overall exposure
to events affecting the whole market. In case a war breaks out, the entire market will fall. So
your loss in that company would be offset by the gains in the short position in index futures.
Some important examples of where hedging strategies are useful
Reducing the equity exposure of mutual fund by selling index futures.
Investing funds raised by new schemes in index futures so that market exposure is
immediately taken
Partial liquidity of portfolio by selling the index future instead of the actual shares
where the cost of transaction is higher.
If the period of hedge is longer than available futures in such an event one can roll
forward a hedge. This implies closing one future position and taking the same position on
21

other futures with the same specifications but having a later delivery date. However, this
leaves the basis risk open for uncovered period at the initial stage.
Speculation While the hedgers avoid the price risk, the speculators are the class of participants in
the futures markets who are willing to bear the risk. Speculators may be position traders so
that they maintain futures positions day-after-day (may be for weeks), who close all their
positions before trading closes each day. The day traders do not carry over their transactions
overnight.
Scalpers
Scalpers represent another type of traders who play a crucial role in the economic
functioning of the futures markets. They are the individuals who engage in continuous
buying and selling of contracts on their own behalf. They work on low margins but their
continuous trading enables them to make good profits on their operations.
Arbitrageurs
The arbitrageurs do not take view on prices, like speculators. They come into action
once they find that the prices in the spot market and the futures market or in the futures
market in respect of different maturities are deviating from the normal.
Margin Money for trading in future contracts. The aim of margin money is to minimize the risk of default by either counter party.
The payment of margin ensures that the risk is limited to the previous day’s price movement
on each outstanding position. However, even this exposure is offset by the initial margin
holdings. Money margin is like a security deposit or a insurance against a possible future
loss of value.
22
The basic aim of the initial margin is to cover the largest potential loss in one day.
Both buyer and seller have to deposit margins. The initial margin is deposited before the
opening of day of future transaction. Normally this margin is calculated on the basis of
variation observed in daily price of the underlying (say the index) over a specified historical
period (say immediately preceding 1). The margin is kept in away that it covers price
movements more than 99% of the time. Usually three sigma (standard deviation) is used for
this measurement. This technique is also called Value at Risk (VAR). Based on the
volatility of market indices in India, the initial margin is expected to be around 8 to 10%.
Different Types of Margins
There can be different types of margin but one of the important margins is explained as
below:
Like initial margin, Variation margin Maintenance margin and additional margin.
1. Variation Margin
All daily losses must be met by depositing of further collateral – known as variation
margin, which is required by the close of the business, the following day. Any profit on the
contract is credited to the client’s variation margin account.
2. Maintenance Margin
Some exchanges work on the system of maintenance margin, which is set at a level
slightly less than initial margin, only if the margin level drops below the maintenance margin
limit. For example if the initial margin is fixed at 100 and maintenance margin is at 80 than
the broker is permitted to trade till such time that the balance in this initial margin account is
80 or more. If it drops below 80, say it drops to 70, than a margin of 30 (not 10) is to be paid
to replenish the level of initial margin. This concept is not wisely used in India.
3. Additional Margin
23
In case of sudden higher than the expected volatility, additional margin may be called
for by the exchange. This is generally imposed when the exchange fears that the markets
have become too volatile and may result in some crisis, like payments crisis, etc. This is a
preemptive move by the exchange to prevent breakdown.
4. Cross Margin
This method is calculating margin after taking into account- combined positions in
Futures, options, cash market etc. Hence, the total margin requirement reduces due to cross-
hedges. This is unlikely to be introduced in India immediately.
OPTIONS Options are fundamentally different from forward and futures contracts. An option
gives the holder of the option the right to do something. The holder does not have to exercise
this right. In contrast, in a forward or futures contract, the two parties have committed
themselves to doing something. Whereas it costs nothing (except margin requirements) to
enter into a futures contract, the purchase of an option requires an upfront payment.
An option agreement is a contract in which the writer of the option grants the buyer of
the option the right to purchase from or sell to the writer a designated instrument at a
specified price (or receive a settlement) within a specified period of time. The price at which,
the buyer can exercise the option is called the exercise price, strike price or striking price.
There are two basic types of options, call options and put options.
Call option: A call option gives the holder (buyer/ one who is long call), the right to buy
specified quantity of the underlying asset at the strike price on or before expiration date in
case of American option. The seller (one who is short call) however, has the obligation to
sell the underlying asset if the buyer of the call option decides to exercise his option to buy.
Put option: A put option gives the holder (buyer/ one who is long put), the right to sell
specified quantity of the underlying asset at the strike price on or before expiry date in case
of American option. The seller or the put option (one who is short put) however, has the
24
obligation to buy the underlying asset at the strike price if the buyer decides to exercise his
option to sell.
Call options Put options
Option buyer or option
holder
Buys the right to buy the
underlying asset at the
specified price.
Buys the right to sell
underlying asset at the
specified price.
Option seller or option
writer
Has the obligation to sell
the underlying asset (to the
option holder) at the
specified price.
Has the obligation to buy
the underlying asset (from
the option holder) at the
specified price.
Options terminology Index options: These options have the index as the underlying. Some options are European
while others are American. Like index futures contracts, index options contracts are also cash
settled.
Stock options: Stock options are options on individual stocks. Options currently trade on
over 500 stocks in the United States. A contract gives the holder the right to buy or sell
shares at the specified price.
Buyer of an option: The buyer of an option is the one who by paying the option premium
buys the right but not the obligation to exercise his option on the seller/writer.
Writer of an option: The writer of a call/put option is the one who receives the option
premium and is thereby obliged to sell/buy the asset if the buyer wishes to exercise his
option.
25
Option price: Option price is the price which the option buyer pays to the option seller. It is
also referred to as the option premium.
Expiration date: The date specified in the options contract is known as the expiration date,
the exercise date, the strike date or the maturity.
Strike price: The price specified in the options contract is known as the strike price or the
exercise price.
American options: American options are options that can be exercised at any time up to the
expiration date. Most exchange-traded options are American.
European options: European options are options that can be exercised only on the
expiration date itself. European options are easier to analyze than American options, and
properties of an American option are frequently deduced from those of its European
counterpart.
In-the-money option: An in-the-money (ITM) option is an option that would lead to a
positive cash flow to the holder if it were exercised immediately. A call option on the index
is said to be in-the-money when the current value of index stands at a level higher than the
strike price (i.e. spot price > strike price). If the value of index is much higher than the strike
price, the call is said to be deep ITM. On the other hand, a put option on index is said to be
ITM if the value of index is below the strike price.
At-the-money option: An at-the-money (ATM) option is an option that would lead to zero
cash flow if it were exercised immediately. An option on the index is at-the-money when the
value of current index equals the strike price (i.e. spot price = strike price).
26

Out-of-the-money option: An out-of-the-money (OTM) option is an option that would lead
to a negative cash flow it was exercised immediately. A call option on the index is said to be
out-of-the-money when the value of current index stands at a level which is less than the
strike price (i.e. spot price < strike price). If the index is much lower than the strike price, the
call is said to be deep OTM. On the other hand, a put option on index is OTM if the value of
index is above the strike price.
Intrinsic value of an option: The option premium can be broken down into two
components–intrinsic value and time value. Intrinsic value of an option is the difference
between the market value of the underlying security/index in a traded option and the strike
price. The intrinsic value
of a call is the amount when the option is ITM, if it is ITM. If the call is OTM, its intrinsic
value is zero.
Time value of an option: The time value of an option is the difference between its premium
and its intrinsic value. Both calls and puts have time value. An option that is OTM or ATM
has only time value. Usually, the maximum time value exists when the option is ATM. The
longer the time to expiration, the greater is an option’s time value, all else equal. At
expiration, an option should have no time value. While intrinsic value is easy to calculate,
time value is more difficult to calculate. Historically, this made it difficult to value options
prior to their expiration. Various
Option pricing methodologies were proposed, but the problem wasn't solved until the
emergence of Black-Scholes theory in 1973.
Stock Options
Trading in stock options commenced on the NSE from July 2001. These contracts are
American style and are settled in cash. The expiration cycle for stock options is the same as
for index futures and index options. A new contract is introduced on the trading day
following the expiry of the near month contract. NSE provides a minimum of seven strike
prices for every option type (i.e. call and put) during the trading month. There are at least
three in-the-money contracts, three
27

Out-of-the-money contracts and one at-the-money contract available for trading.
Index Options
Index options are options where the underlying asset is a stock index e.g. options on
‘Sensex’. Index options were first introduced by Chicago Board of Options Exchange
(CBOE) in 1983on its index ‘S& P100’. As opposed to options on individual stocks, index
options give an investor the right to buy or sell the value of an index, which represents group
of stocks.
Uses of index options
Index options enable investors to gain exposure to a broad market, with one trading decision
and frequently with one transaction. To obtain the same level of diversification using
individual stocks or individual equity options, numerous decisions and trades would be
necessary. Since, broad exposure can be gained with one trade; using index options also
reduces transaction cost. As a percentage of the underlying value, premiums of index options
are usually lower than those of equity options are more volatile than the index.
Index options are effective enough to appeal to a broad spectrum of users, from conservative
investors to more aggressive stock market traders. Individual investors might wish to
capitalize on market opinions (bullish, bearish or neutral) by acting on other views of the
broad market or one of its many sectors.
Option premium
The option premium paid by the option holder to the writer is the price of the option. This
option premium consists of two components, intrinsic value and time value.
Intrinsic value
The intrinsic value is equal to the amount by which it is in the money. Therefore an option,
which is out of the money or at the money, has zero intrinsic value. Intrinsic value of any
28
option can never be negative. A call will be in the money or will have intrinsic value only if
its strike price is lower than the current market price of the underlying asset.
Put would have intrinsic value or would be in the money only if its strike is above the
current market price of the underlying asset.
Time value
Time value of the option which is also called extrinsic value of option is the quantification of
the probability of the change in the underlying price that determines that value of the option
during the remaining time until expiration that is the chances of an out of the money or at the
money option going the money or an in the money option going deeper in the money during
currency of the contract. This value depends on time to expiration of the option and the
volatility of the underlying prices. Mathematically speaking in the time value option is equal
to the difference to the option premium and the intrinsic value. So it is clear that incase of the
out of the money option or at the money option, the entire premium paid is the time value of
the options. Time value of the option is also cannot be negative.
Options Payoff’s
The optionality characteristic of options results in a non-linear payoff for options. In
simple words, it means that the losses for the buyer of an option are limited; however the
profits are potentially unlimited. For a writer, the payoff is exactly the opposite. His profits
are limited to the option premium; however his losses are potentially unlimited. These non-
linear payoffs are
fascinating as they lend themselves to be used to generate various payoffs by using
combinations of options and the underlying.
Clearing and Settlement (F&O)
National Securities Clearing Corporation Limited (NSCCL) undertakes clearing and
settlement of all trades executed on the futures and options (F&O) segment of the NSE. It
also acts as legal counterparty to all trades on the F&O segment and guarantees their
29

financial settlement. Clearing and settlement activities in the F&O segment are undertaken
by NSCCL with the help of the following entities:
Clearing members:
Primarily, the Clearing Member (CM) performs the following functions:
1. Clearing: Computing obligations of all his TM's i.e. determining positions to settle.
2. Settlement: Performing actual settlement. Currently, all the Futures and Options contracts
are cash settled.
3. Risk Management: Setting position limits based on upfront deposits/margins for each TM
and monitoring positions on a continuous basis.
In the F&O segment, some members, called self clearing members, clear and settle their
trades executed by them only either on their own account or on account of their clients. Some
others called trading member–cum–clearing member (TM-CM), clear and settle their
own
trades as well as trades of other trading members (TMs). Besides, there is a special category
of members, called professional clearing members (PCM) who clear and settle trades
executed by TMs. The members clearing their own trades and trades of others, and the PCMs
are required to bring in additional security deposits in respect of every TM whose trades they
undertake to clear and settle.
Clearing Member Eligibility Normsa. Net worth of atleast Rs.300 lakh. The net worth requirement for a CM who clears and
settles only deals executed by him is Rs. 100 lakh.
b. Deposit of Rs. 50 lakh to NSCCL which forms the Base Minimum Capital (BMC) of the
CM.
c. Additional incremental deposits of Rs.10 lakh to NSCCL for each additional TM in case
the CM undertakes to clear and settle deals for other TMs.
Clearing banks: Funds settlement takes place through clearing banks. For the purpose of
settlement all clearing members are required to open a separate bank account with NSCCL
30

designated clearing bank for F&O segment. The Clearing and Settlement process comprises
of the following three main activities:
1) Clearing
2) Settlement
3) Risk Management
Plan of action The study is conducted by taking data of Futures and Options trading to evaluate the
performance of the derivatives in the Indian context pertaining to NSE. The available data
are taken in the form of table and the analysis and interpretation is done based on that data by
using Bar chart. The findings and suggestions are done based on the analysis and the
interpretation made and the conclusion is drawn.
Period of Study The study conducted on “A study on year wise performance of derivatives, since
inception in the Indian context, under NSE at Geojit bnp Paribas” derivative market
pertaining to NSE is limited to the time period from 2000-01 to 2010-11.
Research DesignIt is the specification of methods and procedures for acquiring the information
needed. It is overall operational pattern or framework of the project that stipulates what
information is to be collected from which sources and what procedures. This research
includes:
Descriptive Research: Descriptive research is study of existing facts to come to a conclusion. In this
research an attempt has been made to analyze the performance evaluation of the derivative
market in the Indian context.
Source of Data
31
Data is the basis for any research. Analyzing the data and getting the actual inference
is the main part of the research.
In this study the Secondary data is used for the research, it is the information mainly
obtained from the NSE websites. And also information provided by the company.
32

DATA ANALYSIS AND INTERPRETATION
Introduction: The study is related to the Performance Evaluation of the Derivatives in the Indian
Context and it is pertaining to NSE, as the data collected is from the NSE. In this study the
analysis is done on the various types of Futures and options based on its information
available on number of contracts and turnover.
The information available on each type (i.e. index futures, index option, stock futures
and stock options) is taken separately for both No. of contracts and turnover in a table format
and for each table separate Bar chart is drawn. Based on these charts the analysis and
33
interpretation is made. And on these interpretation findings, suggestions and conclusion are
made.
Index FuturesTable 1.1: Showing Index Futures No. of Contracts
Chart 1.1 showing Index Futures No. of Contracts
34
YEAR No. of Contracts
2000-01 90580
2001-02 1025588
2002-03 2126763
2003-04 17191668
2004-05 21635449
2005-06 58537886
2006-07 81487424
2007-08 156598579
2008-09 210428103
2009-10 178306889
2010-11 13751971
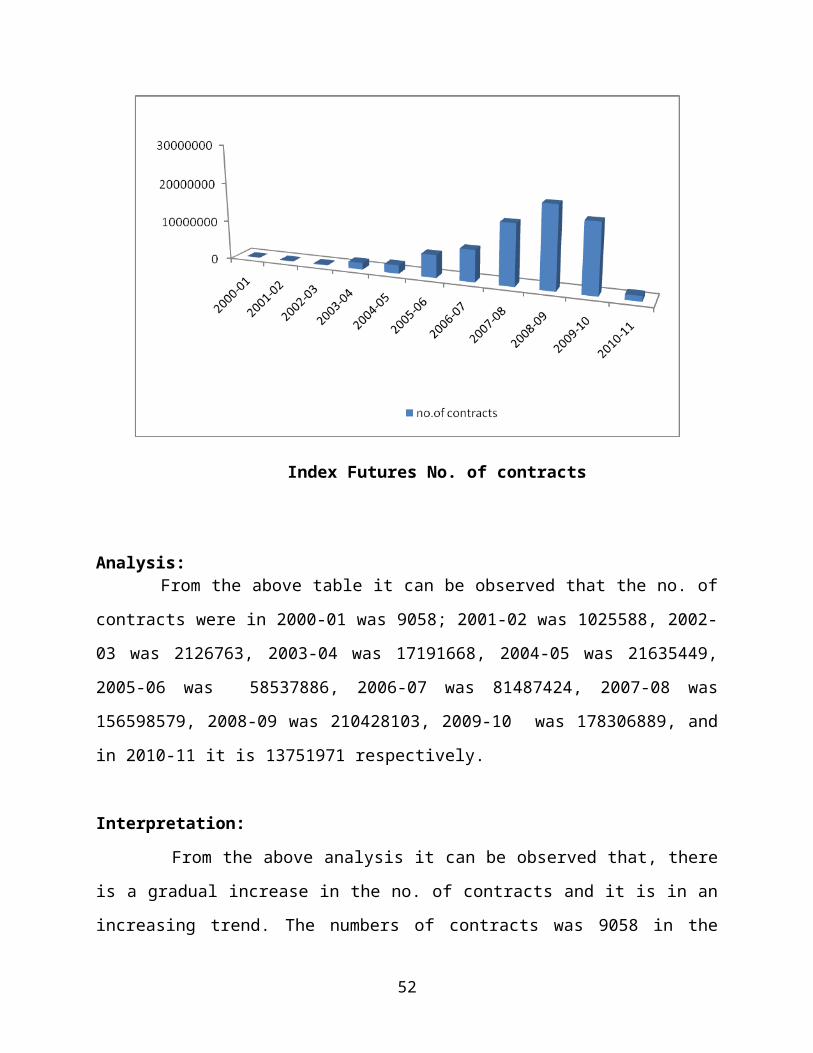
Index Futures No. of contracts
Analysis: From the above table it can be observed that the no. of contracts were in 2000-01 was
9058; 2001-02 was 1025588, 2002-03 was 2126763, 2003-04 was 17191668, 2004-05 was
21635449, 2005-06 was 58537886, 2006-07 was 81487424, 2007-08 was 156598579, 2008-
09 was 210428103, 2009-10 was 178306889, and in 2010-11 it is 13751971 respectively.
Interpretation:
From the above analysis it can be observed that, there is a gradual increase in the no. of
contracts and it is in an increasing trend. The numbers of contracts was 9058 in the year
2000-01 and has reached 210428103 in the year 2008-09. This excellent performance due to
the growth in the derivative market, therefore the no. of contracts was increased year by year.
And this shows the growth of the index future in the Indian market right from the beginning
but now because of recession there is a fall in index future in India.
Table 1.2: Showing Index Futures Turnover
35
Chart 1.2 Showing Index Futures Turnover
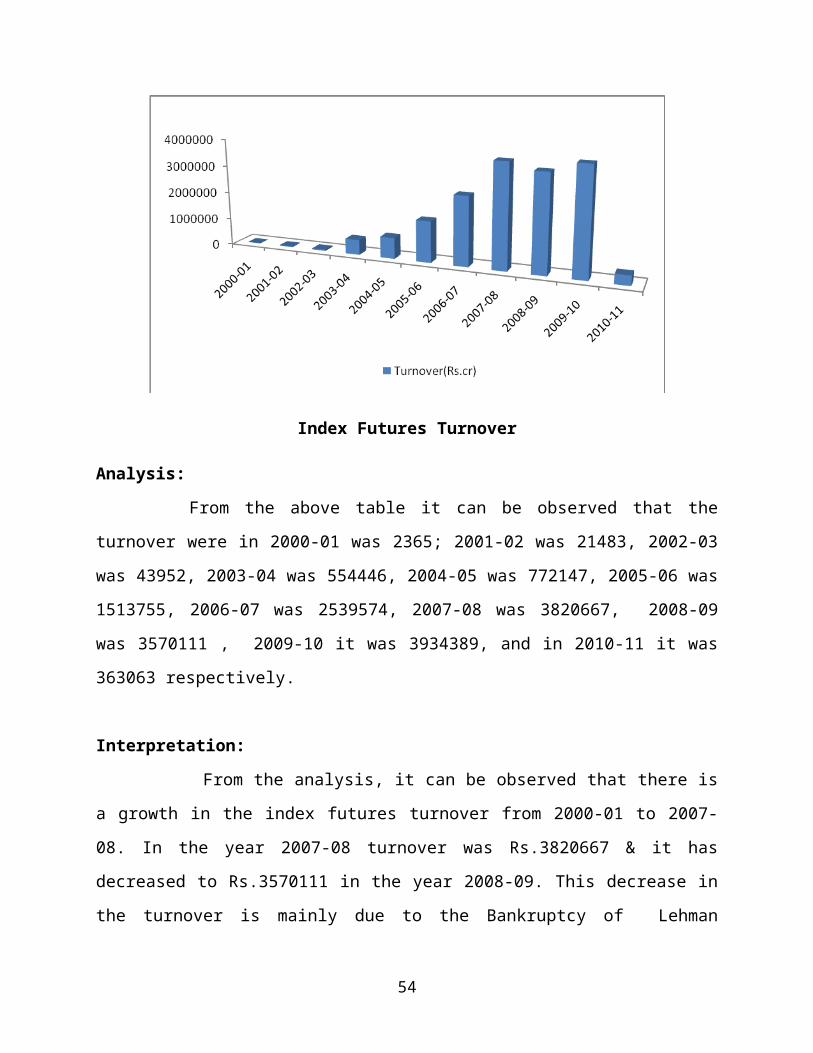
Index Futures Turnover
Analysis:
36
YEAR Turnover(Rs. Cr)
2000-01 2365
2001-02 21483
2002-03 43952
2003-04 554446
2004-05 772147
2005-06 1513755
2006-07 2539574
2007-08 3820667
2008-09 3570111
2009-10 3934389
2010-11 363063

From the above table it can be observed that the turnover were in 2000-01 was 2365;
2001-02 was 21483, 2002-03 was 43952, 2003-04 was 554446, 2004-05 was 772147, 2005-
06 was 1513755, 2006-07 was 2539574, 2007-08 was 3820667, 2008-09 was 3570111 ,
2009-10 it was 3934389, and in 2010-11 it was 363063 respectively.
Interpretation:
From the analysis, it can be observed that there is a growth in the index futures
turnover from 2000-01 to 2007-08. In the year 2007-08 turnover was Rs.3820667 & it has
decreased to Rs.3570111 in the year 2008-09. This decrease in the turnover is mainly due to
the Bankruptcy of Lehman Brothers which affected the global market and again know there
is a growth in the turnover.
Table 1.3: Showing Index Futures No. of contract and Turnover
YEARS No. of Contracts Turnover(Rs. in Crore)
2000-01 90580 2365
2001-02 1025588 21483
2002-03 2126763 43952
2003-04 17191668 554446
2004-05 21635449 772147
2005-06 58537886 1513755
2006-07 81487424 2539574
2007-08 156598579 3820667
2008-09 210428103 3570111
2009-10 178306889 3934389
2010-11 13751971 363063
Chart 1.3 Showing Index Futures No. of contracts and Turnover
37

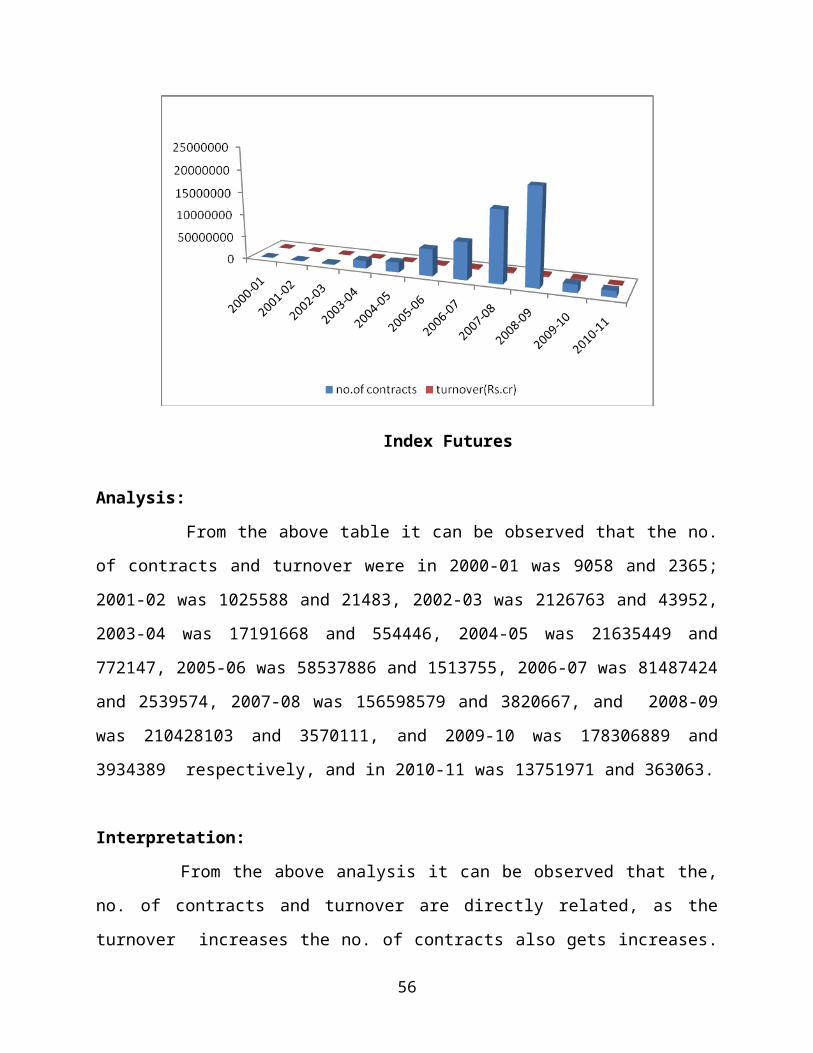
Index Futures
Analysis:
From the above table it can be observed that the no. of contracts and turnover were in
2000-01 was 9058 and 2365; 2001-02 was 1025588 and 21483, 2002-03 was 2126763 and
43952, 2003-04 was 17191668 and 554446, 2004-05 was 21635449 and 772147, 2005-06
was 58537886 and 1513755, 2006-07 was 81487424 and 2539574, 2007-08 was 156598579
and 3820667, and 2008-09 was 210428103 and 3570111, and 2009-10 was 178306889 and
3934389 respectively, and in 2010-11 was 13751971 and 363063.
Interpretation:
From the above analysis it can be observed that the, no. of contracts and turnover are
directly related, as the turnover increases the no. of contracts also gets increases. So from the
above analysis it is clear that, in the year 2009-10 there was a increased in the turnover when
compared to 2008-09 year due to the increase of share prices in the share market. There was
a lot of difference between the no. of contracts and turnover. But now in 2010-11 there is a
fall in no. of contracts and turnover has a slight difference.
Stock Futures
38
Table 2.1: Showing the Stock Futures No. of Contracts
Chart 2.1 Showing the Stock Futures No. of Contracts
Stock Futures No. of contractsAnalysis:
39
YEAR No. of Contracts
2000-01 0
2001-02 1957856
2002-03 1067843
2003-04 32368842
2004-05 47043066
2005-06 80905493
2006-07 104955401
2007-08 203587952
2008-09 221577980
2009-10 145591240
2010-11 15503455
From the above table it can be observed that the no. of contracts were in 2000-01 was 0;
2001-02 was 1957856, 2002-03 was 1067843, 2003-04 was 32368842, 2004-05 was
47043066, 2005-06 was 80905493, 2006-07 was 104955401, 2007-08 was 203587952,
2008-09 was 221577980, 2009-10 was 145591240, and in 2010-11 was 15503455
respectively.
Interpretation:
From the above analysis it can be observed that, there was a gradual increase in the no.
of contracts and it is in an increasing trend. The numbers of contracts was 1957856 in the
year 2001-02 and it has reached 221577980 in the year 2008-09. This excellent performance
due to the growth in the derivative market, therefore the no. of contracts increased year by
year. And this shows that the growth of the stock future in the Indian market, right from the
beginning. But in 2009-10 because of recession there is a fall in no. of contracts compared to
2008-09. But now in 2010-11 there is a decrease comparing to the 2010-11.
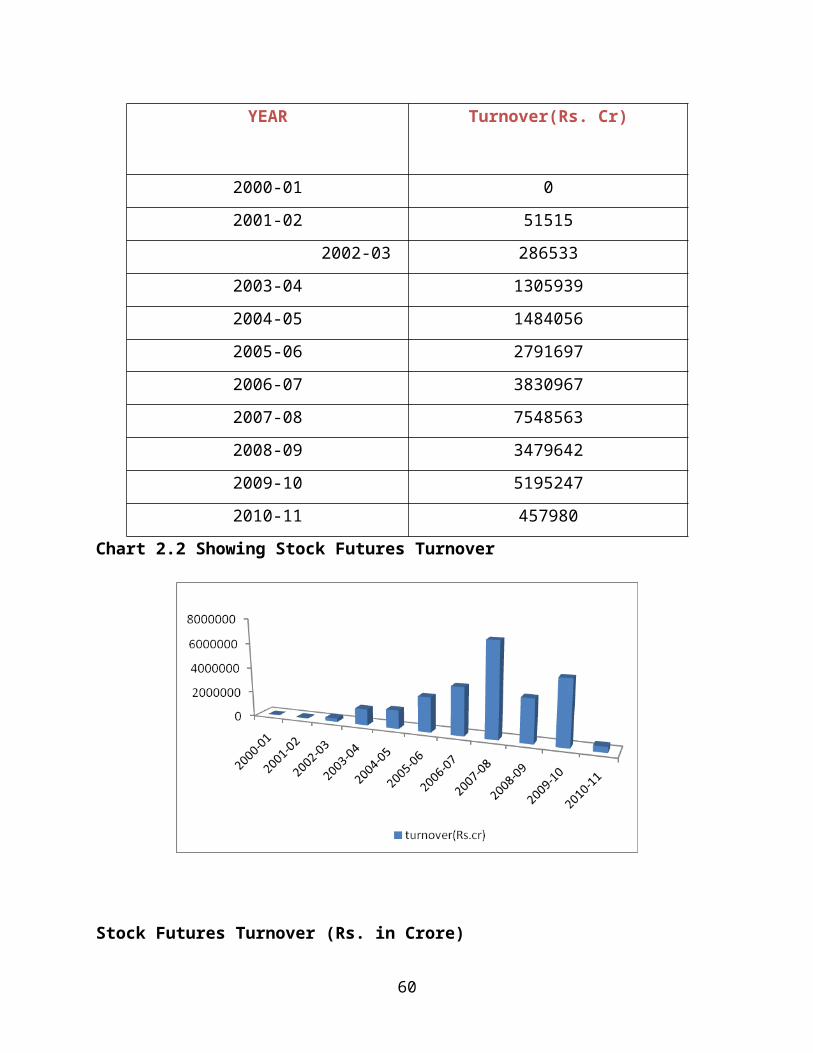
Table 2.2: Showing the Stock Futures Turnover
40
Chart 2.2 Showing Stock Futures Turnover
Stock Futures Turnover (Rs. in Crore)Analysis:
41
YEAR Turnover(Rs. Cr)
2000-01 0
2001-02 51515
2002-03 286533
2003-04 1305939
2004-05 1484056
2005-06 2791697
2006-07 3830967
2007-08 7548563
2008-09 3479642
2009-10 5195247
2010-11 457980

From the above table it can be observed that the turnover were in 2000-01 was 0;
2001-02 was 51515, 2002-03 was 286533, 2003-04 was 1305939, 2004-05 was 1484056,
2005-06 was 2791697, 2006-07 was 3830967, 2007-08 was 7548563, 2008-09 was
3479642, 2009-10 was 5195247, and in 2010-11 was 457980.
Interpretation:
From the analysis, it can be observed that the stock futures trading were started
from the year 2001-02. There was an excellent growth in the turnover from 2001-02 to 2007-
08. Turnover of index futures was RS. 7548563 in the year 2007-08 it has decreased to Rs.
3479642 in the year 2008-09. This decrease in the turnover was mainly due the scam
occurred in Satyam which also affected the global market. But in 2009-10 there is a rise in
turnover compared to 2008-09. But now in 2010-11 there is an decreases in turnover with
comparing to the 2000-10.
Table 2.3: Showing the Stock Futures No. of contracts and Turnover
YEARS No. of Contracts Turnover(Rs. in Crore)
2000-01 0 0
2001-02 1957856 51515
2002-03 1067843 286533
2003-04 32368842 13059393
2004-05 47043066 1484056
2005-06 80905493 2791697
2006-07 104955401 3830967
2007-08 203587952 7548563
2008-09 221577980 3479642
2009-10 145591240 5195247
2010-11 15503455 457980
Chart 2.3 Showing Stock Futures No. of contracts and Turnover
42
Stock Futures
Analysis:
From the above table it can be observed that the no. of contracts and turnover were in
2000-01 was 0 and 0; 2001-02 was 1957856 and 51515, 2002-03 was 1067843 and 286533,
2003-04 was 32368842 and 1305939, 2004-05 was 47043066 and 1484056, 2005-06 was
80905493 and 2791697, 2006-07 was 104955401 and 3830967, 2007-08 was 203587952 and
7548563, 2008-09 was 221577980 and 3479642, 2009-10 was 145591240 and 5195247,
and in 2010-11 was 15503455 and 457980 respectively.
Interpretation:
From the above analysis it can be observed that the, no. of contracts and turnover are
directly related, as the turnover increases the no. of contracts also gets increases still 2007-
08. So from the above analysis it is clear that, in the year 2008-09 there was a decrease in the
turnover when compared to 2007-08 due to the Bankruptcy declared by the American
International Groups which affected the global market. There was a lot of difference between
the no. of contracts and turnover. But now in 2010-11 there is decrease in turnover
compared to 2009-10.
Index OptionsTable 3.1: Showing index Options No. of Contracts
43
Chart 3.1 Showing Index Futures No. of contracts
Index options No. of contractsAnalysis:
From the above table it can be observed that the no. of contracts were in 2000-01 was
0; 2001-02 was 175900, 2002-03 was 442241, 2003-04 was 1732414, 2004-05 was 3293558,
44
YEAR No. of Contracts
2000-01 0
2001-02 175900
2002-03 442241
2003-04 1732414
2004-05 3293558
2005-06 12935116
2006-07 25157438
2007-08 55366038
2008-09 212088444
2009-10 341379523
2010-11 54219880
2005-06 was 12935116, 2006-07 was 25157438, 2007-08 was 55366038, 2008-09 was
212088444, and in 2009-10 is 341379523, 2010-11 is 54219880 respectively.
Interpretation:
From the above analysis it can be observed that, there is a gradual increase in the no.
of contracts and it is in an increasing trend. The numbers of contracts was 175900 in the year
2001-02 and has reached 341379523 in the year 2009-10. This excellent performance due to
the growth in the derivative market. But now in 2010-11 there is a decrease comparing to
the 2009-10.
Table 3.2: Showing Index Options Notional Turnover
Chart 3.2 Showing Index options National Turnover
Index Options Notional Turnover
45
YEAR Notional Turnover(Rs. Cr)
2000-01 0
2001-02 3765
2002-03 9246
2003-04 52816
2004-05 121943
2005-06 338469
2006-07 791906
2007-08 1362111
2008-09 3731502
2009-10 8027964
2010-11 1530447

Analysis:
From the above table it can be observed that the turnover were in 2000-01 was 0; 2001-
02 was 3765, 2002-03 was 9246, 2003-04 was 52816, 2004-05 was 121943, 2005-06 was
338469, 2006-07 was 791906, 2007-08 was 1362111, 2008-09 was 3731502, 2009-10 was
8027964, 2010-11 is 1530447 respectively.
Interpretation:
From the above analysis we can observe that the index options trading were started in
the year 2001-02. There was a gradual growth in the notional turnover from 2004-05 it
started growing in much faster way. Notional turnover of index options was 8027964 in the
year 2009-10. And there is no decrease in the turnover of the index option. But now 1530447
in the year 2010-11 there is a decrease in index option turnover comparing to the 2009-10.
Table 3.3: Showing the Index Options No. of contracts and Notional turnover
YEARS No. of Contracts Notional Turnover(Rs. in Crore)
46

2000-01 0 0
2001-02 175900 3765
2002-03 442241 9246
2003-04 1732414 52816
2004-05 3293558 121943
2005-06 12935116 338469
2006-07 25157438 791906
2007-08 55366038 1362111
2008-09 212088444 3731502
2009-10 341379523 8027964
2010-11 54219880 1530447
Chart 3.3 Showing the Index Options No. of contracts and Notional Turnover
Index Options
Analysis: From the above table it can be observed that the no. of contracts and turnover were in 2000-
01 was 0; 2001-02 was 175900 and 3765, 2002-03 was 442241 and 9246, 2003-04 was
1732414 and 52816, 2004-05 was 3293558 and 121943, 2005-06 was 12935116 and 338469,
47

2006-07 was 25157438 and 791906, 2007-08 was 55366038 and 1362111, 2008-09 was
212088444 and 3731502, 2009-10 was 341379523 and 8027964, and in 2010-11 is
54219880 and 1530447 respectively.
Interpretation:
From the above analysis it can observed that the, no. of contracts and turnover are
directly related, as the turnover increases the no. of contracts also gets increases. So from the
above analysis it is clear that, the index options have an excellent growth in case of both no.
of contracts and notional turnover till 2009-10. But now in 2010-11 there is a decrease of
both no. contracts and national turnover comparing to the 2009-10.
Stock OptionsTable 4.1: Showing Stock options No. of Contracts
48

Chart 4.1Showing Stock Options No. of Contracts
Stock options No. of contract
Analysis:
From the above table it can be observed that the no. of contracts were in 2000-01 was
0; 2001-02 was 1037529, 2002-03 was 3523062, 2003-04 was 5583071, 2004-05 was
49
YEAR No. of Contracts
2000-01 0
2001-02 1037529
2002-03 3523062
2003-04 5583071
2004-05 5045112
2005-06 5240776
2006-07 5283310
2007-08 9460631
2008-09 13295970
2009-10 14016270
2010-11 2709033
5045112, 2005-06 was 5240776, 2006-07 was 5283310, 2007-08 was 9460631, 2008-09
was 13295970, 2009-10 was 14016270, and in 2010-11 is 2709033 respectively.
Interpretation:
From the above analysis it can be observed that the stock options were started trading
from the year 2001-02 and recorded the gradual growth to 2003-04 and the no. of contracts at
that period were 5583071. In the year 2004-05 it came down to 5045112 due to scam on
misappropriation of regulatory in Kethan Parak case and in the year 2005-06 it was
increased to 5240776. There was no much growth in the year 2006-07 also, but after that
there was a fair growth in the stock options. This was quite volatile in nature when compared
to others. And there is an increase in the no. of contracts due to the growth in the derivative
market. But now 2709033 in the year 2010-11 there is a decrease with comparing to the
2009-10.
Table 4.2 Showing Stock Options Notional Turnover
50

Chart 4.2 Showing Stock Options Notional Turnover
Stock Options Notional Turnover
Analysis:
From the above table it can be observed that the turnover were in 2000-01 was 0;
2001-02 was 25163, 2002-03 was 100131, 2003-04 was 217207, 2004-05 was 168836, 2005-
51
YEAR Notional Turnover(Rs. Cr)
2000-01 0
2001-02 25163
2002-03 100131
2003-04 217207
2004-05 168836
2005-06 180253
2006-07 193795
2007-08 359136.6
2008-09 229226.8
2009-10 506065.18
2010-11 85862
06 was 180253, 2006-07 was 193795, 2007-08 was 359136.6, 2008-09 was 229226.8, 2009-
10 was 506065.18, and in 2010-11 is 85862 respectively.
Interpretation:
From the above analysis it can be observed that the stock options was started its trading
in the year 2001-02 and had an good growth till 2003-04, whose value was Rs. 217207.
And were Rs. 168836 on 2004-05, this was due misappropriation of regulatory by Kethan
Parak. Then it was slowly recovered till 2006-07, whose value was Rs. 193795, but in the
year 2007-08 it had recorded a drastic growth by reaching Rs. 359136.6. Again it was
decreased in the year 2008-09 due to the impact of Bankruptcy of Lehman Brothers. But in
2009-10 there is increase in turnover. But now in 2010-11 there is decrease in turnover with
comparing to the 2009-10.
Table 4.3 Showing Stock Options No. of Contracts and Notional Turnover
52

YEARS No. of Contracts Notional Turnover(Rs. in Crore)
2000-01 0 0
2001-02 1037529 25163
2002-03 3523062 100131
2003-04 5583071 217207
2004-05 5045112 168836
2005-06 5240776 180253
2006-07 5283310 193795
2007-08 9460631 359136.6
2008-09 13295970 229226.8
2009-10 14016270 506065.18
2010-11 2709033 85862
Chart 4.3 Showing Stock Options No. of Contracts and Notional Turnover
Stock options
Analysis:
53
From the above table it can be observed that the no. of contracts were in 2000-01 was 0;
2001-02 was 1037529 and 25163, 2002-03 was 3523062 and 100131, 2003-04 was 5583071
and 217207, 2004-05 was 5045112 and 168836, 2005-06 was 5240776 and 180253, 2006-07
was 5283310 and 193795, 2007-08 was 9460631 and 359136.6, 2008-09 was 13295970 and
229226.8, 2009-10 was 14016270 and 506065.18, and in 2010-11 is 2709033 and 85862
respectively.
Interpretation:
From the above analysis it can be observed that the, no. of contracts and turnover are
directly related, as the turnover increases the no. of contracts also gets increases. The stock
options are more volatile in nature when compared to all other types like index futures, stock
futures, and index options. The stock options had a good start and recorded growth in the
initial stage. But later, in the year 2004-05 there was a decrease due to the scam on
misappropriation of regulatory in Kethan Parak case and this affected the growth of the stock
options. Though it started recovering, the growth was slow till 2006-07 and in the year 2007-
08 it had an excellent growth but again in the year 2008-09 there was a decrease in stock
options notional turnover due to the decrease in the share prices in the stock market. But in
2009-10 there is a growth. But now in 2010-11 there is a decrease in turnover.
Total
54
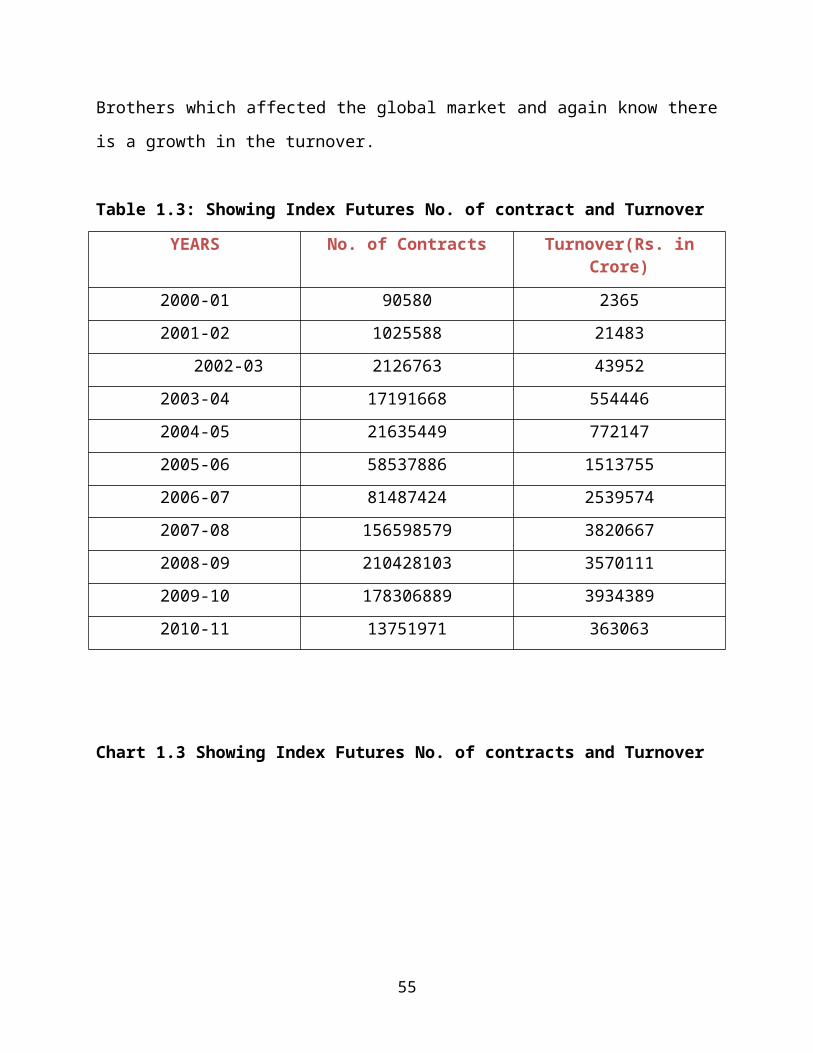
Table 5.1 Showing Total No. of Contracts
Chart 5.1 Showing Total No. of Contracts
Total no. of Contracts
Analysis:
55
YEAR No. of Contracts
2000-01 90580
2001-02 4196873
2002-03 16768909
2003-04 56886776
2004-05 77017185
2005-06 157619271
2006-07 216883573
2007-08 425013200
2008-09 657390497
2009-10 679293922
2010-11 86184339
From the above table it can be observed that the no. of contracts were in 2000-01 was
90580; 2001-02 was 4196873, 2002-03 was 3523062, 2003-04 was 5583071, 2004-05 was
5045112, 2005-06 was 5240776, 2006-07 was 5283310, 2007-08 was 9460631, 2008-09
was 13295970, 2009-10 was 679293922, and in 2010-11 is 86184339 respectively.
Interpretation:
From the above analysis it can be observed that, there is an overall growth in the no. of
contracts. The no. of contracts in the year 2000-01 was the only 90580 as no futures or
options was not traded in the year 2000-01 other than index futures. The total also includes
the no. of contracts of interest rate futures in the year 2003-04 and as it was traded only in
that year, it is not included in any other year. There is an excellent growth in the overall no.
of contracts due to growth in the derivative market up to 2009-10. But now in 2010-11 there
is a decrease in total no. of contracts with comparing to 2009-10.
Note: The total no. of contracts also includes Interest Rate Futures no. of contracts 10781 in
the year 2003-04
Table 5.2 Showing Total Turnover
56

Chart 5.2 Showing Total Turnovers
Total Turnover
Analysis:
From the above table it can be observed that the turnover were in 2000-01 was
2365; 2001-02 was 101926, 2002-03 was 439862, 2003-04 was 2130610, 2004-05 was
57
YEAR Turnover(Rs. Cr)
2000-01 2365
2001-02 101926
2002-03 439862
2003-04 2130610
2004-05 2546982
2005-06 4824174
2006-07 7356242
2007-08 13090478
2008-09 11010482
2009-10 17663664.57
2010-11 2437352

2546982, 2005-06 was 4824174, 2006-07 was 7356242, 2007-08 was 13090478, 2008-09
was 11010482, 2009-10 was 17663664.5, and in 2010-11 is 2437352 respectively.
Interpretation:
From the above analysis it can be observed that, there is a good performance in case of
derivatives in all the year except 2008-09. As there is an impact of the recession on the
derivative market it has recorded decrease in that year, because the growth is only in case of
index options and rest all have decrease in there turnover. The total turnover includes the
interest rate futures turnover Rs. 202 only in the year 2003-04, as it was traded only in that
year. The derivatives have an excellent growth till 2007-08. But the decrease in the year
2008-09 was due to the impact of the Bankruptcy declared by the Lehman brothers. But in
2009-10 there is excellent growth. But now 2437352 in the year of 2010-11 there is a
decrease in turnover comparing to 2009-10.
Note: The total turnover also includes Interest Rate Futures turnover 202 in the year 2003-
04.
Table 5.3 Showing Total No. of Contracts and Turnover
YEARS No. of Contracts Turnover(Rs. in Crore)
58
2000-01 90580 2365
2001-02 4196873 101926
2002-03 16768909 439862
2003-04 56886776 2130610
2004-05 77017185 2546982
2005-06 157619271 4824174
2006-07 216883573 7356242
2007-08 425013200 13090478
2008-09 657390497 11010482
2009-10 679293922 17663664.57
2010-11 86184339 2437352
Chart 5.3 Showing Total No. of Contracts and Turnover
Total
Analysis:
From the above table it can be observed that the no. of contracts and turnover were
in 2000-01 was 90580 and 2365, 2001-02 was 4196873 and 101926, 2002-03 was 3523062
59
and 439862, 2003-04 was 5583071 and 2130610, 2004-05 was 5045112 and 2546982, 2005-
06 was 5240776 and 4824174, 2006-07 was 5283310 and 7356242, 2007-08 was 9460631
and 13090478, 2008-09 was 13295970 and 11010482, 2009-10 was 679293922 and
17663664.5, 2010-11 was 86184339 and 2437352, and in 2010-11 is 86184339 and 2437352
respectively.
Interpretation:
From the above analysis it can be observed that there is an drastic growth in the
overall no.of contracts in the total as at the beginning it was 90580 and reached 657390497.
There an drastic growth in no. of contracts in the year 2008-09 when compared to 2007-08.
But when it comes to turnover, at the initial stage it was only 2365 and at the later stages it
had excellent growth upto 2007-08 and in the year 2008-09 there was an decrease in turnover
from 13090478 to 11010482. In the year 2003-04 it also includes the no. of contracts 10781
and turnover Rs. 202 of interest rate futures. And the major reason for decrease in the year
2008-09 is global recession. The no. of contracts and the turnover in the year 2000-01
includes only index futures, as no other was traded in that year. From this we can say that,
though there is an decrease in the year 2008-09 due to unfavorable market conditions, it has
an better demand and investors would like to invest and it is performing well from the
beginning. But now in 2010-11 there is a decrease in the turnover.
Note: The total also includes the interest rate futures no. of contracts 10781 and the turnover
Rs. 202 in the 2003-04.
Table 6.1 Showing Average Daily Turnover
60

Chart 6.1 Showing Average Daily Turnovers
Average Daily Turnover
Analysis:
61
YEAR Average Daily Turnover(Rs. Cr)
2000-01 11
2001-02 410
2002-03 1752
2003-04 8388
2004-05 10107
2005-06 19220
2006-07 29543
2007-08 52153.3
2008-09 45310.63
2009-10 72392.07
2010-11 115529

From the above table it can be observed that the turnover were in 2000-01 was
11; 2001-02 was 410, 2002-03 was 1752, 2003-04 was 8388, 2004-05 was 10107, 2005-06
was 19220, 2006-07 was 29543, 2007-08 was 52153.3, 2008-09 was 45310.63, 2009-10
was 72392.07, and in 2010-11 is 115529 respectively.
Interpretation:
From the above analysis, it can be observed that there is a growth in the average
daily turnover i.e. from 11 in the year 2000-01 to 45,310.63 in the year 2008-09. But though
there is a drastic growth in the average daily turnover Rs. 52153.3, in the year 2007-08. The
value has been dropped from 52,153.3 in the year 2007-08 to 45,310.63 in the year 2008-09.
So, this was due the overall decrease in the turnover of index futures, stock futures and stock
option. And average daily turnover also includes interest rate futures turnover Rs. 202 only
in the year 2003-04, as it was traded only in that year. The impact of Bankruptcy declared by
Lehman Brothers and decrease in the share prices are the causes for the decrease in average
daily turnover in the year 2008-09. Increase in average daily turnover in the year 2009-10.
But know there is decrease in average daily turnover in 2010-11.
Note: The average daily turnover also includes the interest rate futures turnover Rs. 202 in
the 2003-04.
62
SUMMARY OF FINDINGS
63

This chapter contains the findings made from the interpretation done on the
performance of the derivatives in the Indian context. And based on these findings the
suggestions are made. And conclusion is also done.
The Derivatives performance was excellent to the year 2007-08, as the overall
market was also performing well.
There is decrease in the index future no. of contracts in 2009-10 which is not
ever happened since the inception.
In the year 2008-09 there was fall in the performance of the derivatives due to
bankruptcy of Lehman Brothers and American International Group, which
lead to the recession in the global economy.
There was sudden fall in turnover of stock options in the year 2004-05 due to
the scam on misappropriation of regulatory in the case of Kethan Parak.
The stock options started recovering from the year 2005-06 upto 2007-08 and
again it had a fall in the year 2008-09 because of recession.
There is a rapid growth in stock option notional turnover in 2009-10 compared
to 2008-09.
The Derivatives are mainly used as the Hedging tool in the commodity market
because of high fluctuations of prices in the market.
The most traded and popular Derivatives in the market are Futures and
Options.
Index Options helps the investors to reduce the risk into minimum level and
due to this reason it has an excellent growth compared to others.
National Securities Clearing Corporation Limited (NSCCL) under takes all
the clearing and settlements related to the Futures and Options (F&O) trading.
There are about 109 companies products are traded in the stock futures and the
stock option market and about 7 indices are traded in the index market.
SUGGESTIONS
64
The Government must pass necessary regulations on the trading to control
regulations, as due to this there is a fall in the performance of the derivatives. So it
has to be controlled to increase its performance.
As Metal, Crude oil and Pharmaceuticals sectors are less affected by the recession.
So, it is better to invest in these, so that it increases the confidence in the investors.
Global efforts are necessary to be taken by the developed countries along with the
developing countries to overcome the problem of recession.
Relevant information should be provided to the investors about the derivatives i.e. the
flow of information in the derivative market should be smooth and easily available to
the investors.
Some liberal laws should be passed, so that there is an increasing in the derivative
trading.
Trading in stock options and stock futures helps the companies in increasing their
market capitalization.
To trade in a derivative market, the investors must have knowledge about the various
instruments of trading in order to earn profit.
It is better for an investor to go for options as the risk volume is low in options
compared to futures. And the maximum losses in the options are only the premium
amount.
CONCLUSION
65
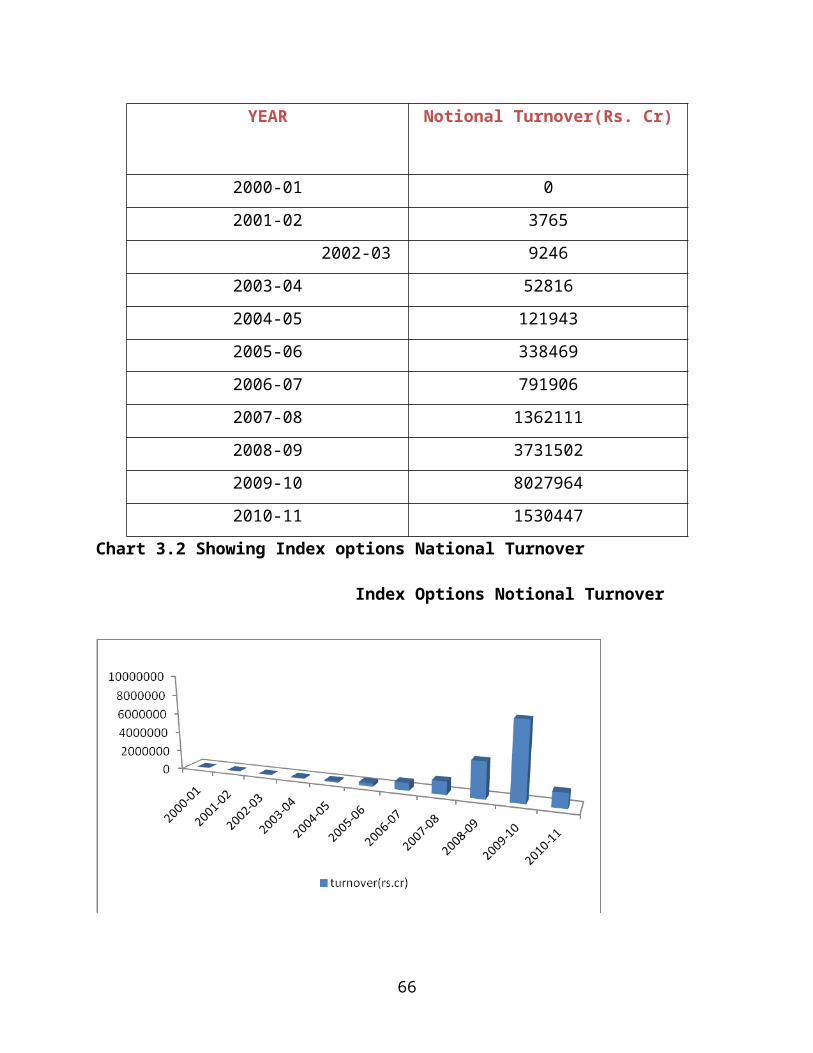
Derivatives are an instrument which takes the value of underlying asset and this
study is conducted to evaluate the performance of derivatives in the Indian context. The
derivative market has an excellent growth as a whole, when the total and average turnover is
considered. The major fall in the performance of the derivatives is mainly due to the impact
of recession.
From this we can conclude that derivatives in the Indian market have an excellent
growth. And this can be achieved only by adopting measures to overcome recession in the
Indian as well as global economy. There are various derivative products available in the
market. And the trading of derivative should be liberalized, so that more number of investors
can invest in the derivatives and this will leads to the increase of no. of contracts and the
turnover of derivatives as a whole.
66

Bibliography
1. Madhu Viji, International Financial Management, Second Edition-2006, Excel Books, NEW DELHI.
2. Prasanna Chandra , Financial Management, Seventh Edition-2008, Tata McGraw Hill publishing Co. ltd, NEW DELHI.
67
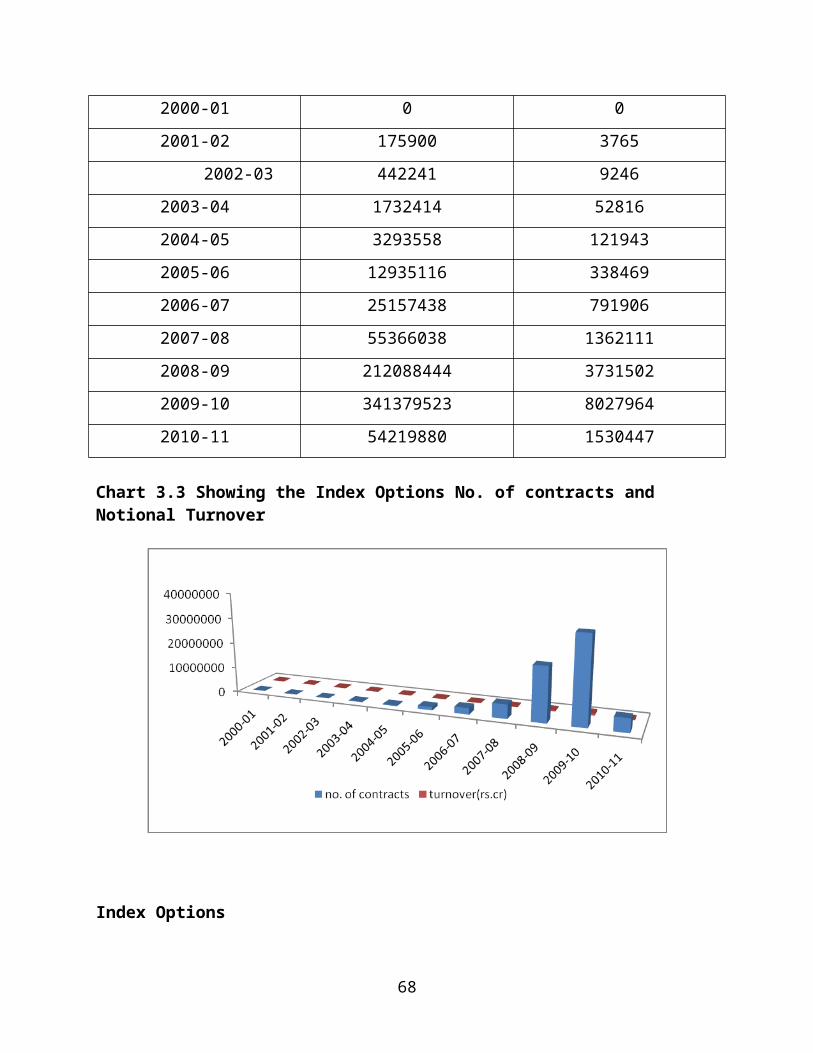
3. National Certificate Financial Markets, National Stock Exchanges.
Websites:
www.nseindia.com
www.bseindia.com
www.geojit.com
www.google.com
68
ANNEXURE1.Index Futures Product
Sl. No. Product Product Code
Contract Multiplier
1 BSE 30 SENSEX FUTURES SENFUT 15
69
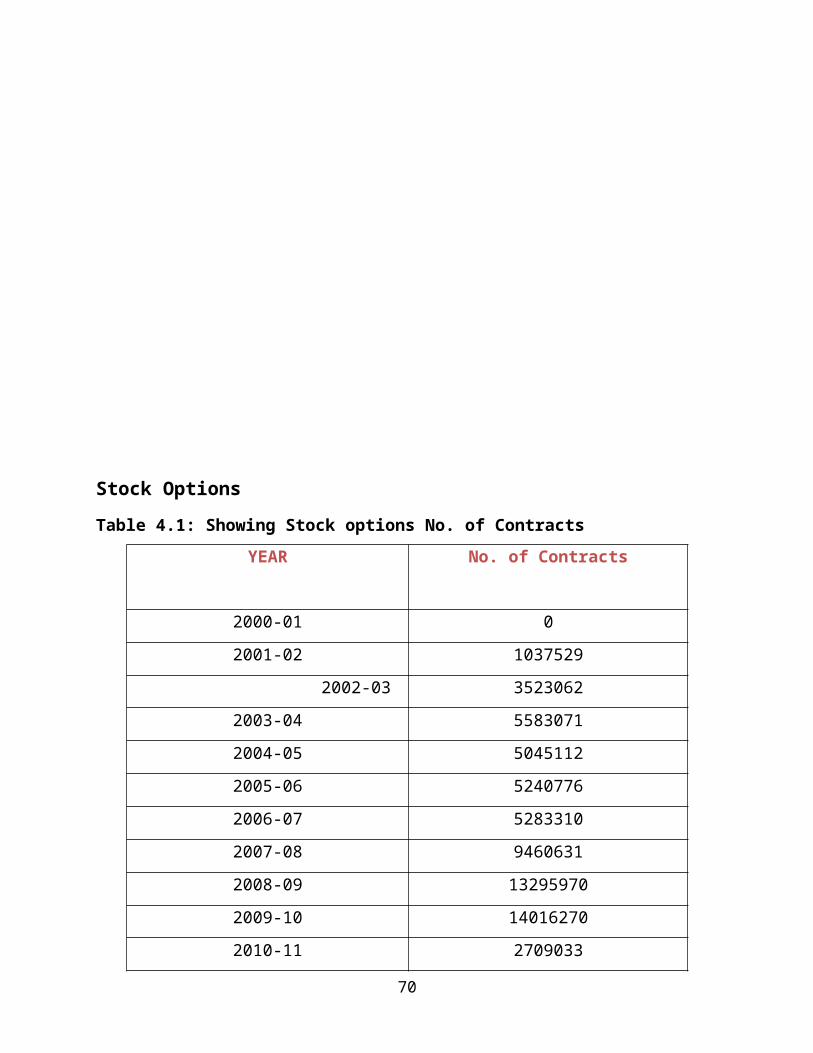
2 BSE SENSEX MINI FUTURES MSXFUT 5
3 BSE TECK FUTURES TECKFUT 124
4 BSE BANKEX FUTURES BNKXFUT 50
5 BSE OIL & GAS FUTURES ONGXFUT 38
6 BSE METAL FUTURES METLFUT 60
7 BSE FMCG FUTURES FMCGFUT 175
2. Stock Futures ProductSr. No. Product Product
CodeContract
Multiplier1 ABB LTD FUTURES ABBFUT 5002 ABAN OFFSHORE LTD FUTURES ABOFUT 4003 ACC FUTURES ACCFUT 7524 ACL FUTURES ACLFUT 41245 ADLABS FILMS LTD FUTURES ADFFUT 18006 ALSTOM PROJ FUTURES APIFUT 12007 APTECH LTD FUTURES APTFUT 39008 ASHOK LEYLAND FUTURES ASHFUT 191009 AREVA T&D FUTURES ATDFUT 1500
10 AXIS BANK FUTURES AXSFUT 90011 BHEL FUTURES BHEFUT 30012 BAJAJ HIND LTD FUTURES BHLFUT 570013 BANK OF BARODA FUTURES BOBFUT 140014 BOI FUTURES BOIFUT 95015 BPCL FUTURES BPCFUT 110016 BHARTI TELE FUTURES BTLFUT 50017 CENTURY TEXTILES FUTURES CENFUT 169618 CIPLA FUTURES CIPFUT 125019 CANARA BANK FUTURES CNBFUT 160020 CAIRN INDIA FUTURES CNLFUT 250021 DIVIS LAB LTD FUTURES DIVFUT 31022 DLF FUTURES DLFFUT 160023 DR. REDDY FUTURES DRRFUT 800
70
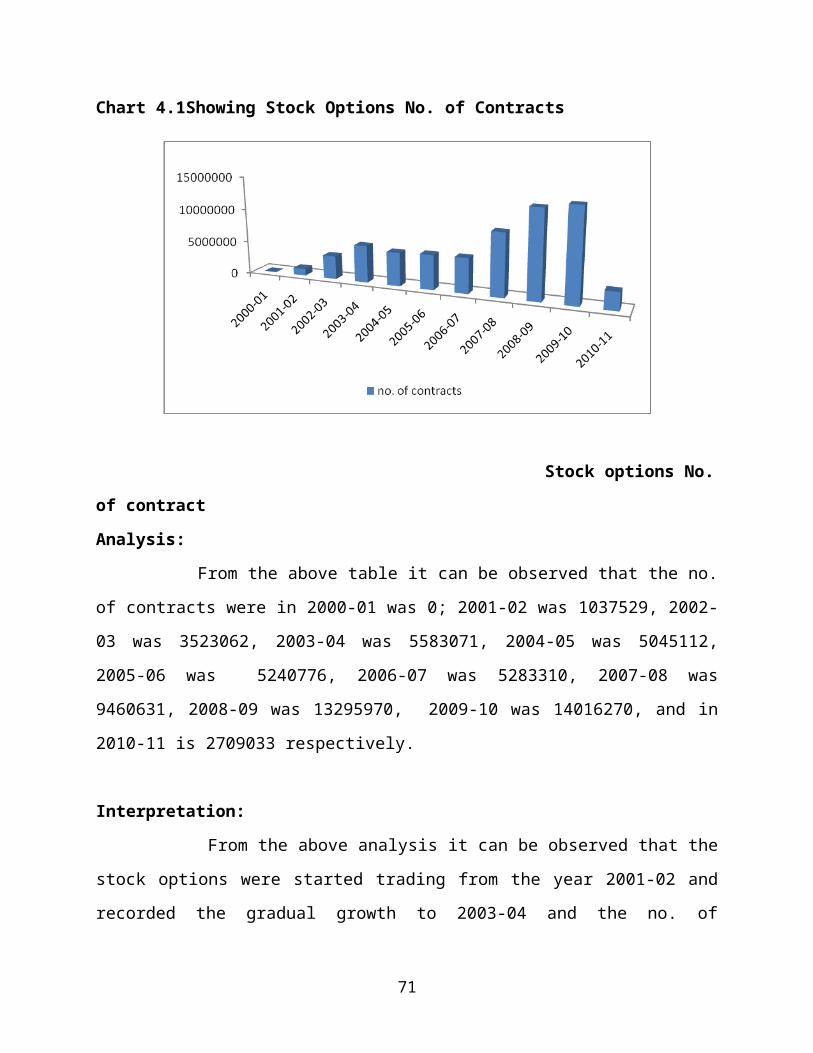
24 EDUCOMP SOLN LTD FUTURES ESLFUT 150
25 FINAN TECH INDIA LTD FUTURES FTLFUT 600
26 GAIL FUTURES GAILFUT 750
27 GREAT EASTERN SHIPPING COMPANY LTD FUTURES GESFUT 2400
28 GMR INFRASTRUCTURE FUTURES GMRFUT 5000
29 GRASIM FUTURES GRSFUT 35230 HCLTECH FUTURES HCLTFUT 260031 HDFC BANK FUTURES HDBKFUT 40032 HDFC FUTURES HDFFUT 15033 HDIL FUTURES HDLFUT 309634 HEROHONDA FUTURES HEROFUT 40035 HINDALCO FUTURES HNDFUT 703636 HPCL FUTURES HPCFUT 130037 HUL FUTURES HULFUT 100038 HINDUSTAN ZINC FUTURES HZNFUT 100039 ICICI BANK FUTURES ICICFUT 70040 IDBI FUTURES IDBIFUT 480041 IDEA CELLULAR FUTURES IDEAFUT 540042 IDFC FUTURES IDFCFUT 590043 IFCI LTD FUTURES IFCFUT 1576044 IFLEX FUTURES IFLXFUT 60045 INDIA INFO LTD FUTURES IILFUT 500046 INDUSIND BANK FUTURES INBKFUT 770047 INDIA CEMENT FUTURES INCMFUT 290048 INDIAN BANK FUTURES INDBFUT 220049 INFOSYS FUTURES INFFUT 20050 IOCL FUTURES IOCLFUT 60051 ISPAT IND LTD FUTURES ISPFUT 2490052 ITC FUTURES ITCFUT 225053 IVRCL LTD FUTURES IVLFUT 2000
54 JAIPRAKASH ASSO LTD FUTURES JAIFUT 4500
55 JET AIRWAYS FUTURES JETFUT 2400
71
56 JSW STEEL LTD FUTURES JSWFUT 1650
57 KOTAK MAHINDRA BANK LTD FUTURES KMBFUT 1100
58 LANCO INFRATECH LTD FUTURES LNCFUT 2550
59 LNT FUTURES LNTFUT 400
60 MAHINDRA & MAHINDRA FUTURES MNMFUT 1248
61 MARUTI SUZUKI INDIA FUTURES MSLFUT 800
62 MTNL FUTURES MTNFUT 3200
63 NAGARJUNA FERTILIZERS & CHEMICALS LTD FUTURES NFCFUT 21000
64 NEYVELI LIGNITE CORPORATION LTD FUTURES NLCFUT 5900
65 NTPC FUTURES NTPCFUT 162566 ONGC FUTURES ONGCFUT 45067 ORCHID CHEMICALS FUTURES ORCHFUT 4200
68 POWER FINANCE CORPORATION FUTURES PFCFUT 2400
69 POWER GRID FUTURES PGCFUT 385070 PNB FUTURES PNBFUT 60071 PUNJ LLYOD FUTURES PNJFUT 150072 POLARIS FUTURES POLAFUT 560073 PRAJ INDUSTRIES LTD FUTURES PRJFUT 440074 PETRONET LNG LTD FUTURES PTRFUT 880075 RANBAXY FUTURES RBXFUT 160076 RELIANCE CAPITAL FUTURES RCAPFUT 552
77 RELIANCE COMMUNICATION Ltd FUTURES RCOMFUT 1400
78 REC FUTURES RECFUT 3900
79 SHREE RENUKA SUGARS LTD FUTURES REUFUT 5000
80 RIL FUTURES RILFUT 300
81 RELIANCE INFRACTURE LTD FUTURES RNFFUT 552
82 RELIANCE NATURAL RESOURCES LTD FUTURES RNLFUT 7152
72
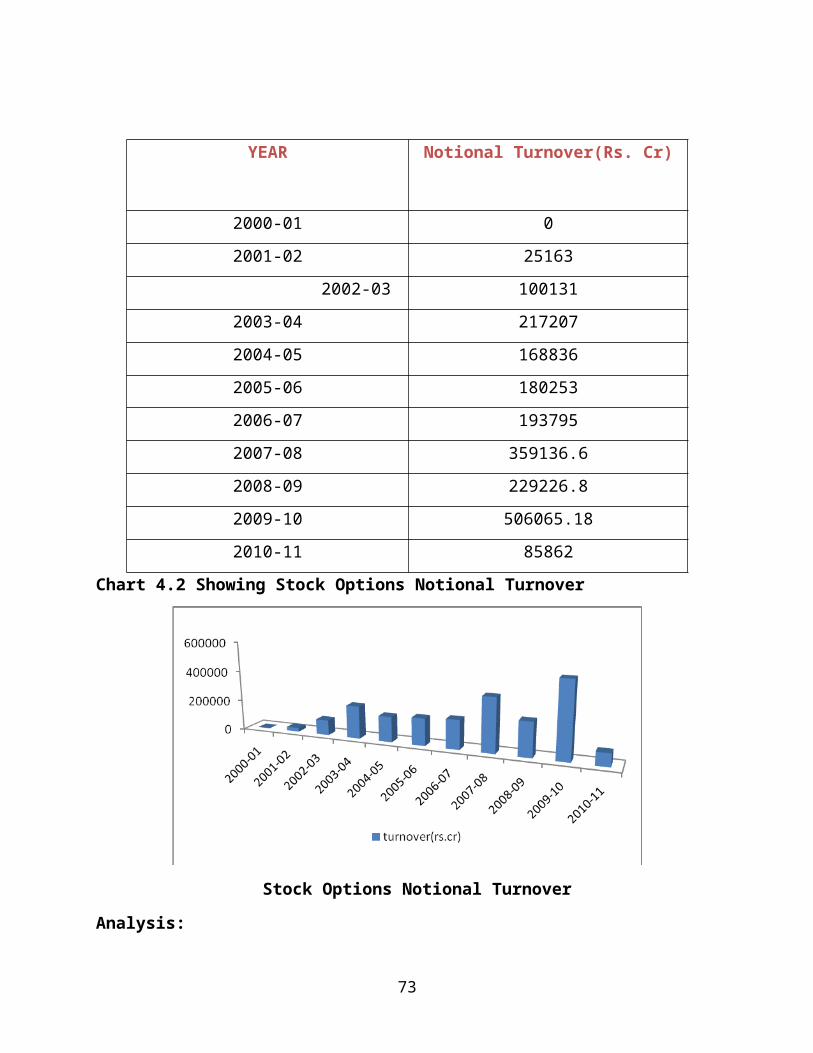
83 ROLTA INDIA LTD FUTURES ROLFUT 180084 RPL FUTURES RPLFUT 3350
85 RELIANCE POWER LTD FUTURES RPWFUT 2000
86 SAIL FUTURES SAILFUT 540087 SBI FUTURES SBIFUT 26488 SESA GOA LTD FUTURES SESFUT 300089 SIEMENS FUTURES SIEMFUT 150490 SPICE COMM. LTD FUTURES SPCNFUT 870091 SPICEJET FUTURES SPJFUT 2400092 STERLITE INDS FUTURES STERFUT 87693 SUZLON FUTURES SUZFUT 600094 TATA CHEMICALS FUTURES TCHMFUT 2700
95 TATA COMMUNICATIONS LTD FUTURES TCLFUT 1050
96 TCS FUTURES TCSFUT 50097 TATA MOTORS FUTURES TELFUT 170098 TECH MAHINDRA LTD FUTURES TEMFUT 1200
99 TITAN INDUSTRIES LTD FUTURES TILFUT 412
100 TISCO FUTURES TISFUT 1528101 TATA POWER FUTURES TPWFUT 400
102 TATA TELESERVICES MAHARASHTRA LTD FUTURES TTLFUT 10450
103 UBI FUTURES UBIFUT 2100104 UNITECH LTD FUTURES UNIFUT 9000105 UNITED SPIRITS LTD FUTURES USLFUT 250106 VOLTAS LTD FUTURES VOLFUT 5400
107 WELSPUN-GUJARAT STAHL ROHREN LTD FUTURES WGSFUT 3200
108 WIPRO FUTURES WIPRFUT 1200109 ZEE FUTURES ZEEFUT 2800
3. Index Options Products
Sr. No. Product Product Code Contract Multiplier
73
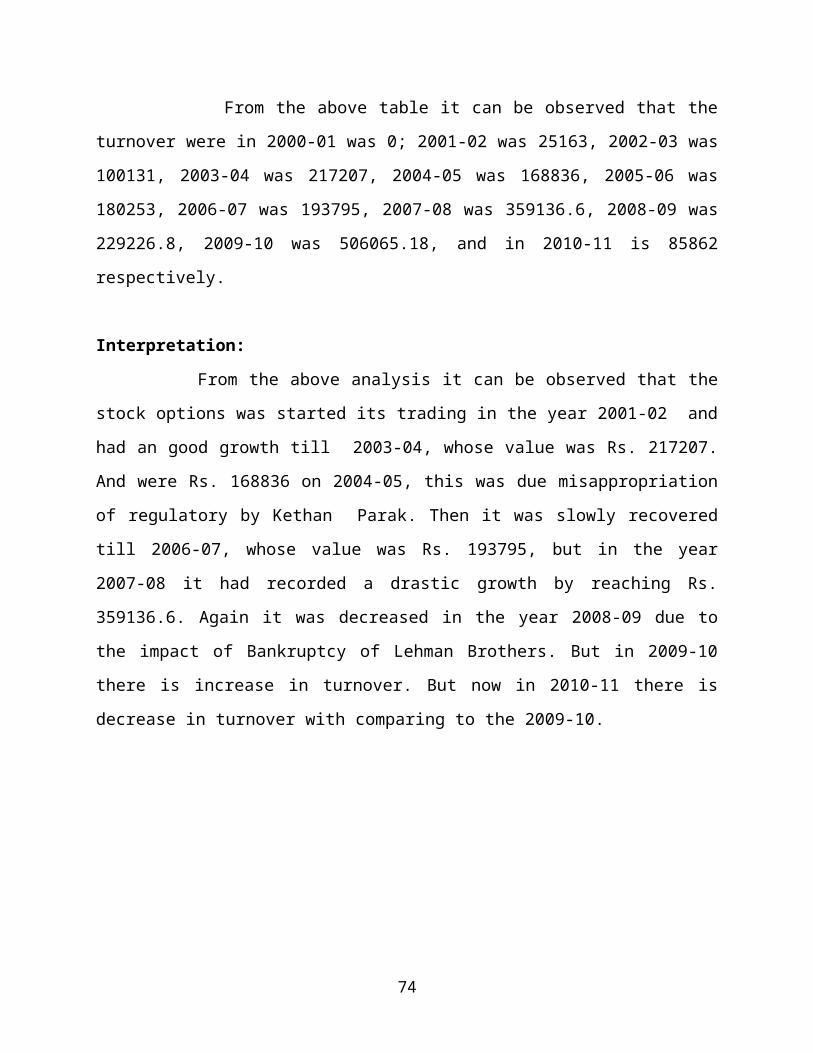
1 BSE 30 SENSEX OPTIONS SENOPT 15
2 BSE SENSEX MINI OPTIONS MSXOPT 5
3 BSE TECK OPTIONS TECKOPT 124
4 BSE BANKEX OPTIONS BNKXOPT 50
5 BSE OIL & GAS OPTIONS ONGXOPT 38
6 BSE METAL OPTIONS METLOPT 60
7 BSE FMCG OPTIONS FMCGOPT 175
4. Stock Options ProductsSr. No. Product Product
CodeContract
Multiplier1 ABB LTD OPTIONS ABBOPT 5002 ABAN OFFSHORE LTD OPTIONS ABOOPT 4003 ACC OPTIONS ACCOPT 7524 ACL OPTIONS ACLOPT 41245 ADLABS FILMS LTD OPTIONS ADFOPT 18006 ALSTOM PROJ OPTIONS APIOPT 12007 APTECH LTD OPTIONS APTOPT 39008 ASHOK LEYLAND OPTIONS ASHOPT 191009 AREVA T&D OPTIONS ATDOPT 150010 AXIS BANK OPTIONS AXSOPT 90011 BHEL OPTIONS BHEOPT 30012 BAJAJ HIND LTD OPTIONS BHLOPT 570013 BANK OF BARODA OPTIONS BOBOPT 140014 BOI OPTIONS BOIOPT 95015 BPCL OPTIONS BPCOPT 110016 BHARTI TELE OPTIONS BTLOPT 50017 CENTURY TEXTILES OPTIONS CENOPT 169618 CIPLA OPTIONS CIPOPT 125019 CANARA BANK OPTIONS CNBOPT 160020 CAIRN INDIA OPTIONS CNLOPT 2500
74

21 DIVIS LAB LTD OPTIONS DIVOPT 31022 DLF OPTIONS DLFOPT 160023 DR. REDDY OPTIONS DRROPT 80024 EDUCOMP SOLN LTD OPTIONS ESLOPT 150
25 FINAN TECH INDIA LTD OPTIONS FTLOPT 600
26 GAIL OPTIONS GAILOPT 750
27 GREAT EASTERN SHIPPING COMPANY LTD OPTIONS GESOPT 2400
28 GMR INFRASTRUCTURE OPTIONS GMROPT 5000
29 GRASIM OPTIONS GRSOPT 35230 HCLTECH OPTIONS HCLTOPT 260031 HDFC BANK OPTIONS HDBKOPT 40032 HDFC OPTIONS HDFOPT 15033 HDIL OPTIONS HDLOPT 309634 HEROHONDA OPTIONS HEROOPT 40035 HINDALCO OPTIONS HNDOPT 703636 HPCL OPTIONS HPCOPT 130037 HUL OPTIONS HULOPT 100038 HINDUSTAN ZINC OPTIONS HZNOPT 100039 ICICI BANK OPTIONS ICICOPT 70040 IDBI OPTIONS IDBIOPT 480041 IDEA CELLULAR OPTIONS IDEAOPT 540042 IDFC OPTIONS IDFCOPT 590043 IFCI LTD OPTIONS IFCOPT 1576044 IFLEX OPTIONS IFLXOPT 60045 INDIA INFO LTD OPTIONS IILOPT 500046 INDUSIND BANK OPTIONS INBKOPT 770047 INDIA CEMENT OPTIONS INCMOPT 290048 INDIAN BANK OPTIONS INDBOPT 220049 INFOSYS OPTIONS INFOPT 20050 IOCL OPTIONS IOCLOPT 60051 ISPAT IND LTD OPTIONS ISPOPT 2490052 ITC OPTIONS ITCOPT 225053 IVRCL LTD OPTIONS IVLOPT 2000
75
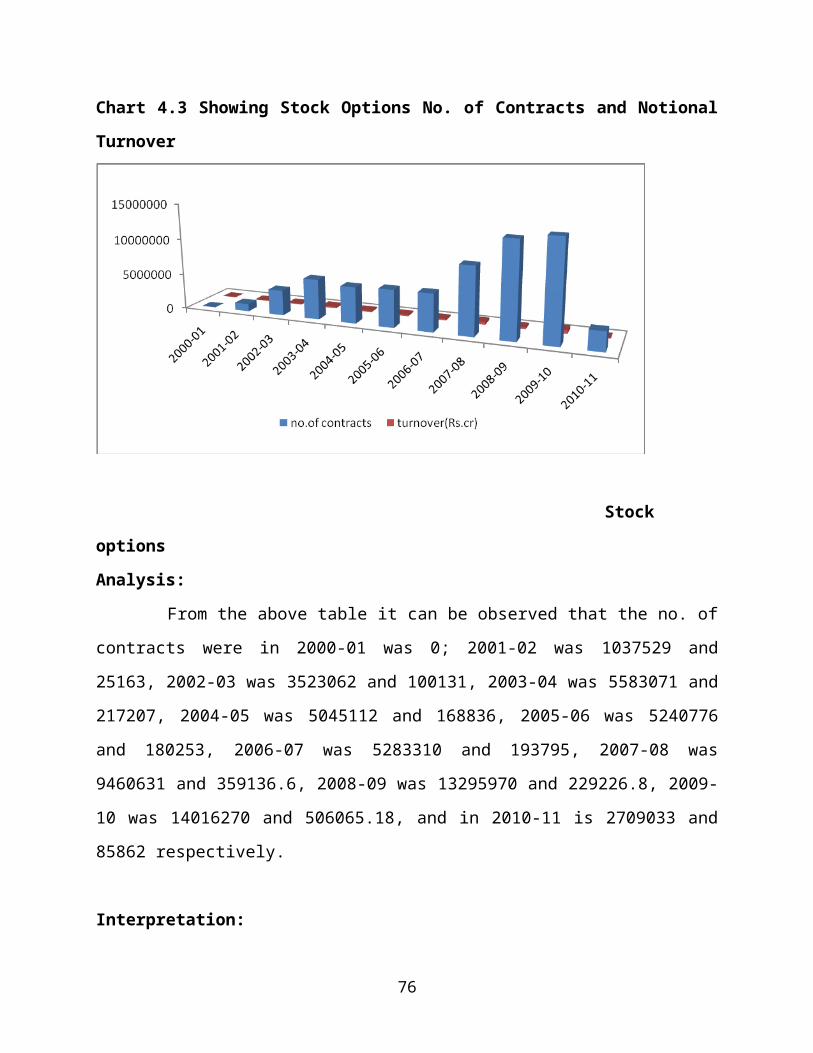
54 JAIPRAKASH ASSO LTD OPTIONS JAIOPT 4500
55 JET AIRWAYS OPTIONS JETOPT 240056 JSW STEEL LTD OPTIONS JSWOPT 1650
57 KOTAK MAHINDRA BANK LTD OPTIONS KMBOPT 1100
58 LANCO INFRATECH LTD OPTIONS LNCOPT 2550
59 LNT OPTIONS LNTOPT 400
60 MAHINDRA & MAHINDRA OPTIONS MNMOPT 1248
61 MARUTI SUZUKI INDIA OPTIONS MSLOPT 80062 MTNL OPTIONS MTNOPT 3200
63 NAGARJUNA FERTILIZERS & CHEMICALS LTD OPTIONS NFCOPT 21000
64 NEYVELI LIGNITE CORPORATION LTD OPTIONS NLCOPT 5900
65 NTPC OPTIONS NTPCOPT 162566 ONGC OPTIONS ONGCOPT 45067 ORCHID CHEMICALS OPTIONS ORCHOPT 4200
68 POWER FINANCE CORPORATION OPTIONS PFCOPT 2400
69 POWER GRID OPTIONS PGCOPT 385070 PNB OPTIONS PNBOPT 60071 PUNJ LLYOD OPTIONS PNJOPT 150072 POLARIS OPTIONS POLAOPT 560073 PRAJ INDUSTRIES LTD OPTIONS PRJOPT 440074 PETRONET LNG LTD OPTIONS PTROPT 880075 RANBAXY OPTIONS RBXOPT 160076 RELIANCE CAPITAL OPTIONS RCAPOPT 552
77 RELIANCE COMMUNICATION Ltd OPTIONS RCOMOPT 1400
78 REC OPTIONS RECOPT 3900
79 SHREE RENUKA SUGARS LTD OPTIONS REUOPT 5000
80 RIL OPTIONS RILOPT 300
81 RELIANCE INFRACTURE LTD OPTIONS RNFOPT 552
76
82 RELIANCE NATURAL RESOURCES LTD OPTIONS RNLOPT 7152
83 ROLTA INDIA LTD OPTIONS ROLOPT 180084 RPL OPTIONS RPLOPT 335085 RELIANCE POWER LTD OPTIONS RPWOPT 200086 SAIL OPTIONS SAILOPT 540087 SBI OPTIONS SBIOPT 26488 SESA GOA LTD OPTIONS SESOPT 300089 SIEMENS OPTIONS SIEMOPT 150490 SPICE COMM. LTD OPTIONS SPCNOPT 870091 SPICEJET OPTIONS SPJOPT 2400092 STERLITE INDS OPTIONS STEROPT 87693 SUZLON OPTIONS SUZOPT 600094 TATA CHEMICALS OPTIONS TCHMOPT 2700
95 TATA COMMUNICATIONS LTD OPTIONS TCLOPT 1050
96 TCS OPTIONS TCSOPT 50097 TATA MOTORS OPTIONS TELOPT 170098 TECH MAHINDRA LTD OPTIONS TEMOPT 1200
99 TITAN INDUSTRIES LTD OPTIONS TILOPT 412
100 TISCO OPTIONS TISOPT 1528101 TATA POWER OPTIONS TPWOPT 400
102 TATA TELESERVICES MAHARASHTRA LTD OPTIONS TTLOPT 10450
103 UBI OPTIONS UBIOPT 2100104 UNITECH LTD OPTIONS UNIOPT 9000105 UNITED SPIRITS LTD OPTIONS USLOPT 250106 VOLTAS LTD OPTIONS VOLOPT 5400
107 WELSPUN-GUJARAT STAHL ROHREN LTD OPTIONS WGSOPT 3200
108 WIPRO OPTIONS WIPROPT 1200109 ZEE OPTIONS ZEEOPT 2800
77

78
Related Documents


![Hypnosis and posthypnotic suggestions[3] · HYPNOSIS AND POSTHYPNOTIC SUGGESTIONS Lars-Erik Unestål. Ph.D. Uppsala University CHAPTER III. POSTHYPNOTIC SUGGESTIONS Posthypnotic Suggestions](https://static.cupdf.com/doc/110x72/5e807de82eb6152f8c71e232/hypnosis-and-posthypnotic-suggestions3-hypnosis-and-posthypnotic-suggestions-lars-erik.jpg)