RESEARCH ARTICLE Open Access A study of glycemic variability in patients with type 2 diabetes mellitus with obstructive sleep apnea syndrome using a continuous glucose monitoring system Suhas S. Khaire 1 , Jugal V. Gada 1* , Ketaki V. Utpat 1,2 , Nikita Shah 1 , Premlata K. Varthakavi 1 and Nikhil M. Bhagwat 1 Abstract Background: Obstructive sleep apnea syndrome (OSAS) in association with Type 2 Diabetes Mellitus (DM) may result in increased glycemic variability affecting the glycemic control and hence increasing the risk of complications associated with diabetes. We decided to assess the Glycemic Variability (GV) in patients with type 2 diabetes with OSAS and in controls. We also correlated the respiratory disturbance indices with glycemic variability indices. Methods: After fulfilling the inclusion and exclusion criteria patients from the Endocrinology and Pulmonology clinics underwent modified Sleep Apnea Clinical Score (SACS) followed by polysomnography (PSG). Patients were then divided into 4 groups: Group A (DM with OSAS, n = 20), Group B (DM without OSAS, n = 20), Group C (Non DM with OSAS, n = 10) and Group D (Non DM without OSAS, n = 10). Patients in these groups were subjected to continuous glucose monitoring using the Medtronic iPro2 and repeat PSG. Parameters of GV: i.e. mean glucose, SD (standard Deviation), CV (Coefficient of Variation), Night SD, Night CV, MAGE and NMAGE were calculated using the Easy GV software. GV parameters and the respiratory indices were correlated statistically. Quantitative data was expressed as mean, standard deviation and median. The comparison of GV indices between different groups was performed by one-way analysis of variance (ANOVA) or Kruskal Wallis (for data that failed normality). Correlation analysis of AHI with GV parameters was done by Pearson correlation. Results: All the four groups were adequately matched for age, sex, Body Mass Index (BMI), waist circumference (WC) and blood pressure (BP). We found that the GV parameters Night CV, MAGE and NMAGE were significantly higher in Group A as compared to Group B (p values < 0.05). Similarly Night CV, MAGE and NMAGE were also significantly higher in Group C as compared to Group D (p value < 0.05). Apnea-hypopnea index (AHI) correlated positively with Glucose SD, MAGE and NMAGE in both diabetes (Group A plus Group B) and non- diabetes groups (Group C plus Group D). (Continued on next page) © The Author(s). 2020 Open Access This article is licensed under a Creative Commons Attribution 4.0 International License, which permits use, sharing, adaptation, distribution and reproduction in any medium or format, as long as you give appropriate credit to the original author(s) and the source, provide a link to the Creative Commons licence, and indicate if changes were made. The images or other third party material in this article are included in the article's Creative Commons licence, unless indicated otherwise in a credit line to the material. If material is not included in the article's Creative Commons licence and your intended use is not permitted by statutory regulation or exceeds the permitted use, you will need to obtain permission directly from the copyright holder. To view a copy of this licence, visit http://creativecommons.org/licenses/by/4.0/. The Creative Commons Public Domain Dedication waiver (http://creativecommons.org/publicdomain/zero/1.0/) applies to the data made available in this article, unless otherwise stated in a credit line to the data. * Correspondence: [email protected] 1 Department of Endocrinology, Room no. 419, 4th floor, College building, Topiwala National Medical College and Bai Yamunabai Laxman (B.Y.L.) Nair Charitable Hospital, A.L. Nair Road, Mumbai Central, Mumbai, Maharashtra 400008, India Full list of author information is available at the end of the article Khaire et al. Clinical Diabetes and Endocrinology (2020) 6:10 https://doi.org/10.1186/s40842-020-00098-0

Welcome message from author
This document is posted to help you gain knowledge. Please leave a comment to let me know what you think about it! Share it to your friends and learn new things together.
Transcript
RESEARCH ARTICLE Open Access
A study of glycemic variability in patientswith type 2 diabetes mellitus withobstructive sleep apnea syndrome using acontinuous glucose monitoring systemSuhas S. Khaire1, Jugal V. Gada1* , Ketaki V. Utpat1,2, Nikita Shah1, Premlata K. Varthakavi1 and Nikhil M. Bhagwat1
Abstract
Background: Obstructive sleep apnea syndrome (OSAS) in association with Type 2 Diabetes Mellitus (DM) mayresult in increased glycemic variability affecting the glycemic control and hence increasing the risk of complicationsassociated with diabetes. We decided to assess the Glycemic Variability (GV) in patients with type 2 diabetes withOSAS and in controls. We also correlated the respiratory disturbance indices with glycemic variability indices.
Methods: After fulfilling the inclusion and exclusion criteria patients from the Endocrinology and Pulmonologyclinics underwent modified Sleep Apnea Clinical Score (SACS) followed by polysomnography (PSG). Patients werethen divided into 4 groups: Group A (DM with OSAS, n = 20), Group B (DM without OSAS, n = 20), Group C (NonDM with OSAS, n = 10) and Group D (Non DM without OSAS, n = 10). Patients in these groups were subjected tocontinuous glucose monitoring using the Medtronic iPro2 and repeat PSG. Parameters of GV: i.e. mean glucose, SD(standard Deviation), CV (Coefficient of Variation), Night SD, Night CV, MAGE and NMAGE were calculated using theEasy GV software. GV parameters and the respiratory indices were correlated statistically. Quantitative data wasexpressed as mean, standard deviation and median. The comparison of GV indices between different groups wasperformed by one-way analysis of variance (ANOVA) or Kruskal Wallis (for data that failed normality). Correlationanalysis of AHI with GV parameters was done by Pearson correlation.
Results: All the four groups were adequately matched for age, sex, Body Mass Index (BMI), waist circumference(WC) and blood pressure (BP). We found that the GV parameters Night CV, MAGE and NMAGE were significantlyhigher in Group A as compared to Group B (p values < 0.05). Similarly Night CV, MAGE and NMAGE were alsosignificantly higher in Group C as compared to Group D (p value < 0.05). Apnea-hypopnea index (AHI) correlatedpositively with Glucose SD, MAGE and NMAGE in both diabetes (Group A plus Group B) and non- diabetes groups(Group C plus Group D).
(Continued on next page)
© The Author(s). 2020 Open Access This article is licensed under a Creative Commons Attribution 4.0 International License,which permits use, sharing, adaptation, distribution and reproduction in any medium or format, as long as you giveappropriate credit to the original author(s) and the source, provide a link to the Creative Commons licence, and indicate ifchanges were made. The images or other third party material in this article are included in the article's Creative Commonslicence, unless indicated otherwise in a credit line to the material. If material is not included in the article's Creative Commonslicence and your intended use is not permitted by statutory regulation or exceeds the permitted use, you will need to obtainpermission directly from the copyright holder. To view a copy of this licence, visit http://creativecommons.org/licenses/by/4.0/.The Creative Commons Public Domain Dedication waiver (http://creativecommons.org/publicdomain/zero/1.0/) applies to thedata made available in this article, unless otherwise stated in a credit line to the data.
* Correspondence: [email protected] of Endocrinology, Room no. 419, 4th floor, College building,Topiwala National Medical College and Bai Yamunabai Laxman (B.Y.L.) NairCharitable Hospital, A.L. Nair Road, Mumbai Central, Mumbai, Maharashtra400008, IndiaFull list of author information is available at the end of the article
Khaire et al. Clinical Diabetes and Endocrinology (2020) 6:10 https://doi.org/10.1186/s40842-020-00098-0

(Continued from previous page)
Conclusions: OSAS has a significant impact on the glycemic variability irrespective of glycemic status. AHI hasmoderate positive correlation with the glycemic variability.
Keywords: Obstructive sleep apnea syndrome, Glycemic variability, Continuous glucose monitoring system,Diabetes mellitus with obstructive sleep apnea
BackgroundObstructive sleep apnea syndrome (OSAS) is character-ized by repetitive episodes of cessation of breathing(apnea) or partial upper airway obstruction (hypopneas)during sleep, frequently associated with reduced bloodoxygen saturation [1]. The prevalence of OSAS in pa-tients with type 2 Diabetes Mellitus (DM) has been re-ported as 18 to 86% in the literature [2–4]. Thisassociation may impact glycemic control and worsendiabetes related complications [4]. OSAS is closely re-lated to cardiovascular complications like coronary heartdisease, heart failure, arrhythmias and sudden death atnight [5–7], and is a risk factor for stroke and death afterstroke [8]. Experimental studies have demonstrated thatOSAS exerts adverse effects on glucose metabolism,such as worsening of insulin resistance, glucose intoler-ance and pancreatic β-cell dysfunction through complexneurohormonal mechanisms [9–13]. This association be-tween OSAS and type 2 DM may be bidirectional ashigher Glycated hemoglobin (HbA1c) levels were foundeven in non-diabetic patients with severe OSAS [14, 15].Besides, OSAS is known to cause rapid fluctuations inblood glucose levels [15]. This Glycemic Variability (GV)is an independent risk factor for diabetes related compli-cations, including cardiovascular diseases [16–18].Therefore, GV may represent an important aspect of gly-cemia which is not reflected by conventional measuresof glucose control, such as HbA1c and fasting plasmaglucose [19]. Thus Continuous Glucose Monitoring Sys-tem (CGMS) becomes a useful tool to assess GV in pa-tients with DM. The data on the effect of OSAS on GVin type 2 DM is scarce. Hence we assessed the GV in pa-tients with type 2 diabetes and OSAS by using a CGMS.
MethodsAimsTo assess the Glycemic Variability in patients with type2 diabetes and OSAS. The primary objective was to cor-relate GV to respiratory disturbance indices in patientsof type2 Diabetes with OSAS. The secondary objectivewas to assess GV in patients with OSAS without DM.
Design and settingThis cross sectional study was conducted by the Endo-crinology and Pulmonology services of a tertiary care
center in Mumbai, Maharashtra, India, after InstitutionalEthics Committee approval (No. ECARP/2018/95). Wescreened 55 patients with type 2 DM treated with life-style measures (LSM) alone or LSM with one or moreoral antidiabetic medications (OAD). Patients aged be-tween 18 to 60 years who had a BMI between 23 to 30kg/m2 were eligible to participate in the study. Themajor exclusion criteria were patients with type 2 dia-betes who were on insulin, type 1 diabetes, upper airwaysurgery in the past, sinusitis, chronic respiratory dis-eases, heart, lung, liver and kidney disease, patients whowere taking sedative-hypnotic medications, pregnant pa-tients, patients with history of alcohol consumption,smoking, steroid intake and untreated hypothyroidism.After applying inclusion and exclusion criteria, 40 pa-tients with type 2 DM underwent further study. We in-cluded 10 patients with OSAS without diabetes fromPulmonology clinic and 10 were normal volunteers with-out diabetes. After a written informed consent partici-pant’s baseline characteristics, anthropometric andclinical data were collected by a single investigator.Patients were screened for OSAS with the help of
Modified Sleep Apnea Clinical Score (SACS) which is apre-test probability score- based on snoring (3 points),witnessed episodes of apnea (3 points), neck circumfer-ence (in cm) and systemic hypertension (4 points). Basedon SACS patients were categorized into low (below 43),medium (43–48) and high risk (above 48) Groups [20,21]. SACS score was used as a screening tool to identifypatients with high probability of OSAS and to avoid un-necessary screening polysomnography (PSG) in a re-source limited setting. Patients in moderate and severegroups were subjected to a screening polysomnography(PSG) for confirmation of the diagnosis. Patients in thelow risk group willing to participate in the study werealso screened with PSG with an intent to classify theminto control groups. PSG was done with RESMED’sApnea link device in the sleep laboratory of the Pulmo-nology department. This was a limited 5 channel level 3PSG involving measurement of cardiovascular variables.It measured snoring, respiratory effort, pulse, oxygensaturation and nasal flow. The subjects were monitoredfor sleep apnea starting at 22:00 h. The sleep monitoringequipment was worn for at least 7 h and was removedby the specialist the next morning after the patient
Khaire et al. Clinical Diabetes and Endocrinology (2020) 6:10 Page 2 of 9

awoke. During the test, the patients did not have accessto sedatives, coffee and tea. The Apnea Hypopnea Index(AHI) was calculated based on the total number of sleepapneas and hypopneas per hour. OSAS was defined asper American association of sleep medicine (AASM) cri-teria [22]. Patients with AHI ≥5 /hour, were classified ashaving obstructive sleep apnea. Four patients with lowSACS score had significant AHI scores and were in-cluded in the obstructive sleep apnea group. The pa-tients were categorized into 4 groups based on AHI:Group A: DM with OSAS (n = 20 patients),Group B: DM without OSAS (n = 20 patients),Group C: Non DM with OSAS (n = 10 patients),Group D: Non DM without OSAS (n = 10 patients).On day 1, a fasting blood sample was drawn after
a 12 h overnight fast between 8 to 9 am for routinebiochemistry and HbA1c. HbA1c was determined byHigh Performance Liquid Chromatography usingBioRad D10 Analyzer (Intra and Inter assay coeffi-cient of variation- < 2%).
Continuous glucose monitoring with the iPro2 CGM(Model REF-MMT 7102W, Medtronic MiniMed, USA)was initiated for 5 days. The sensor was inserted sub-cutaneously over the anterior abdominal wall. The in-strument was calibrated by four capillary glucose valuesobtained on a glucometer (Freestyle Optium Xceed)prior to three major meals and at bedtime. Blood glu-cose meters and the test strips were provided to the pa-tient. Patients were instructed to be consistent with theirmeal timings, pattern and maintain a food diary whichwas analyzed by a registered dietitian. The patients weresubjected to a second PSG on the second night ofCGMS insertion. Fig. 1.CGM data was downloaded with the CareLink Ipro1
software (MMT-7340) (Medtronic, Minneapolis, MN,USA) and this data was used to calculate the variabilityparameters by an automated Software EasyGV version9.0.R2. Glycemic variability was defined as intraday gly-caemic excursions, including episodes of hyperglycemiaand hypoglycemia. Following variables were calculated
Fig. 1 Flowchart of Methodology
Khaire et al. Clinical Diabetes and Endocrinology (2020) 6:10 Page 3 of 9

from CGM readings for each patient: Time In Range(TIR), Time Above Range (TAR) and Time Below Range(TBR), Mean glucose, Standard deviation (SD), NightSD, Coefficient of Variation (CV), Night CV, MeanAmplitude of Glycemic excursion (MAGE) [23] andNight mean amplitude of glycemic excursion (NMAGE).NMAGE was calculated as MAGE for the night periodand was recorded from 10 pm to 6 am.Sample size was calculated based on the study of gly-
caemic variability and OSA by Nakata K, et al [24]; at80% power and 5% alpha error by comparison of themean method, the minimum sample size was found tobe 18 per group in diabetes cohort.Statistical analysis was done using the SPSS v
20.Demographic data was analyzed using descriptive sta-tistics. Statistical significance was set to P < 0.05. Quan-titative Data was expressed as mean, standard deviationand median. The comparison of GV indices between dif-ferent groups was performed by one-way analysis ofvariance (ANOVA) for normally distributed data. Fordata parameters which failed the normality test, KruskalWallis test was applied. Post hoc analysis for multiple in-tergroup comparisons was done using Tukey HSD afterANOVA or Dunn’s method after Kruskal Wallis test.Correlation analysis of AHI with SD/ MAGE/NMAGEwas done by Pearson correlation.
ResultsDemographic dataWe had 20 patients each in group A and group B and10patients in group C and group D. The four study groupswere adequately matched for age, sex, BMI, waist cir-cumference and blood pressure. Table 1 shows the base-line characteristics of the cohort.Patients with Diabetes Mellitus who were on lifestyle
modifications alone, or on Lifestyle modification withmonotherapy or combination therapy with 2 or 3 oral
antidiabetic drugs. Fifty percent patients had diabetes dur-ation of more than 5 years. 47.5% (19 out of 40) had retin-opathy and 60%(24 out of 40) had peripheral neuropathy(Table 2).HbA1c was comparable in Group A and B (8.87 ± 2.54%
vs. 8.18 ± 2.16%) P value > 0.05. SACS was higher in thegroup A (45.10 ± 4.24) and was statistically significant(p < 0.00012) when compared with rest of the three groups.Four patients with low SACS had positive polysomnogra-phy. The BMI of our patients were in the category of over-weight and obese as per the Indian definition of BMI [25].This is well described as thin fat Indian phenotype [25].CGMS parameters:Mean glucose (7.77 ± 2.42 mmol/L), glucose SD
(2.44 ± 1.10 mmol/L), Night CV (31% ± 4.5) MAGE(5.20 ± 2.15 mmol/L) and NMAGE (5.78 ± 2.16) werehighest in Group A as compared to rest of the threegroups which was statistically significant (p values 0.006,0.008, 0.008, 0.01 respectively) (Table 3). Post hoc ana-lysis was then done to compare group A with group Band group C with group D.
Glycemic variability in group a and group B: (Table 4)Mean glucose (7.77 ± 2.42 vs. 6.81 ± 2.31 mmol/L), glu-cose SD (2.44 ± 1.10 vs. 1.91 ± 0.86 mmol/L), MAGE(5.20 ± 2.15 vs. 2.67 ± 1.04 mmol/L) and NMAGE(5.78 ± 2.16 vs. 2.22 ± 1.00 mmol/L) were higher inGroup A than Group B. Post hoc analysis with multiplecomparisons (Dunn’s method) in subgroup analysis,showed MAGE and NMAGE were significantly differentbetween group A and group B (p < 0.05). The measuresof % CV and SD were not significant but the night CVwas significantly different (P < 0.05).
Glycemic variability in group C and group D: (Table 5)Comparing the Non Diabetes groups (group C and D),we found the mean glucose (5.85 ± 2.10 vs. 4.83 ± 1.95
Table 1 Baseline Characteristics of the Study Population
VARIABLE Group A (n = 20) Mean ± SD Group B(n = 20) Mean ± SD Group C (n = 10) Mean ± SD group D (n = 10) Mean ± SD p value
Age (Years) 49.40 ± 7 46.25 ± 11.86 45.90 ± 11.32 44.80 ± 10.98 0.619
Sex(M:F) 15: 5 15: 5 7: 3 7: 3 0.902
BMI (kg/m2) 23.98 ± 2.15 23.63 ± 2.59 23.46 ± 2.19 24.15 ± 3.06 0.898
WC (cm) 91.45 ± 5.25 92.45 ± 5.74 91.40 ± 4.81 91.60 ± 5.48 0.931
SBPa(mm/Hg) 130.40 ± 10.75 125.60 ± 9.12 129.80 ± 9.35 129.20 ± 9.20 0.420
DBP (mm/Hg) 85.90 ± 6.88 82.90 ± 6.10 85.60 ± 5.64 84.20 ± 5.03 0.415
SACS score b 45.10 ± 4.24 37.45 ± 4.39 45 ± 6.25 34.70 ± 7.39 0.0001
Hb1Aca (%) 8.87 ± 2.54 8.18 ± 2.16 5.19 ± 0.43 4.82 ± 0.3 0.08
FPGa(mmol/L) 7.32 ± 1.74 7.57 ± 2.29 5.10 ± 0.47 4.85 ± 0.20 0.07
P value indicates comparison between all four groups. P < 0.05 is considered significant.One way ANOVA applieda Data failed normality hence Kruskal Wallis appliedb Ordinal data hence Kruskal Wallis applied
Khaire et al. Clinical Diabetes and Endocrinology (2020) 6:10 Page 4 of 9
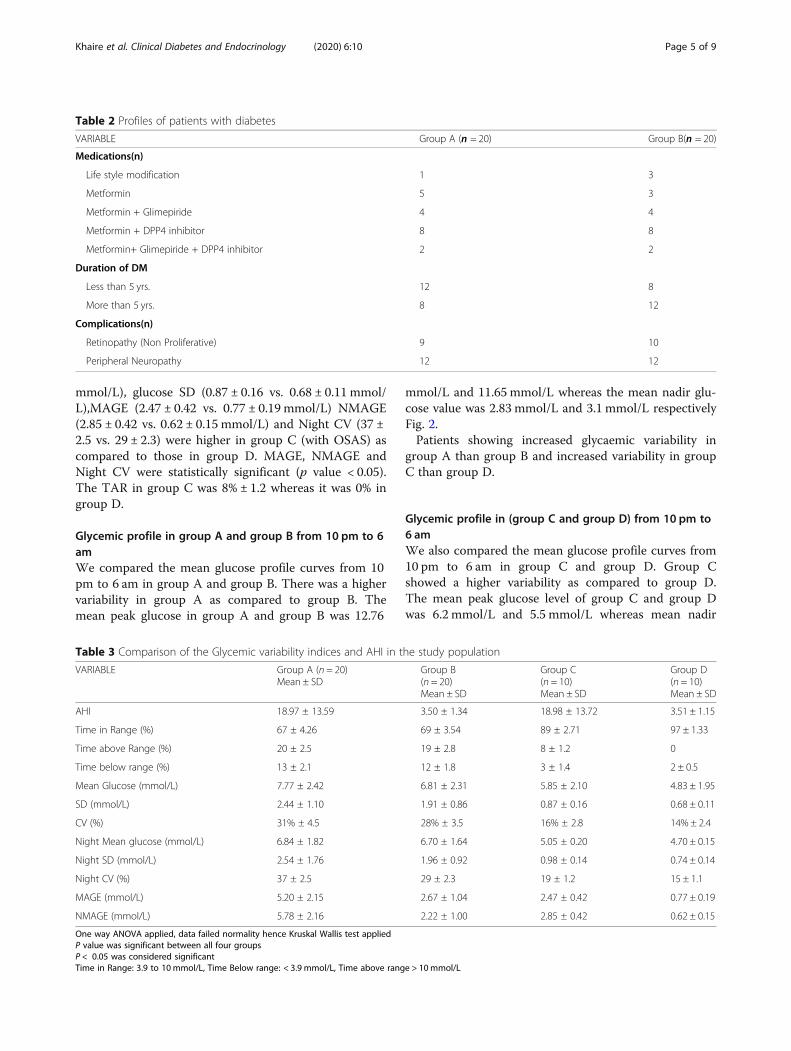
mmol/L), glucose SD (0.87 ± 0.16 vs. 0.68 ± 0.11 mmol/L),MAGE (2.47 ± 0.42 vs. 0.77 ± 0.19 mmol/L) NMAGE(2.85 ± 0.42 vs. 0.62 ± 0.15 mmol/L) and Night CV (37 ±2.5 vs. 29 ± 2.3) were higher in group C (with OSAS) ascompared to those in group D. MAGE, NMAGE andNight CV were statistically significant (p value < 0.05).The TAR in group C was 8% ± 1.2 whereas it was 0% ingroup D.
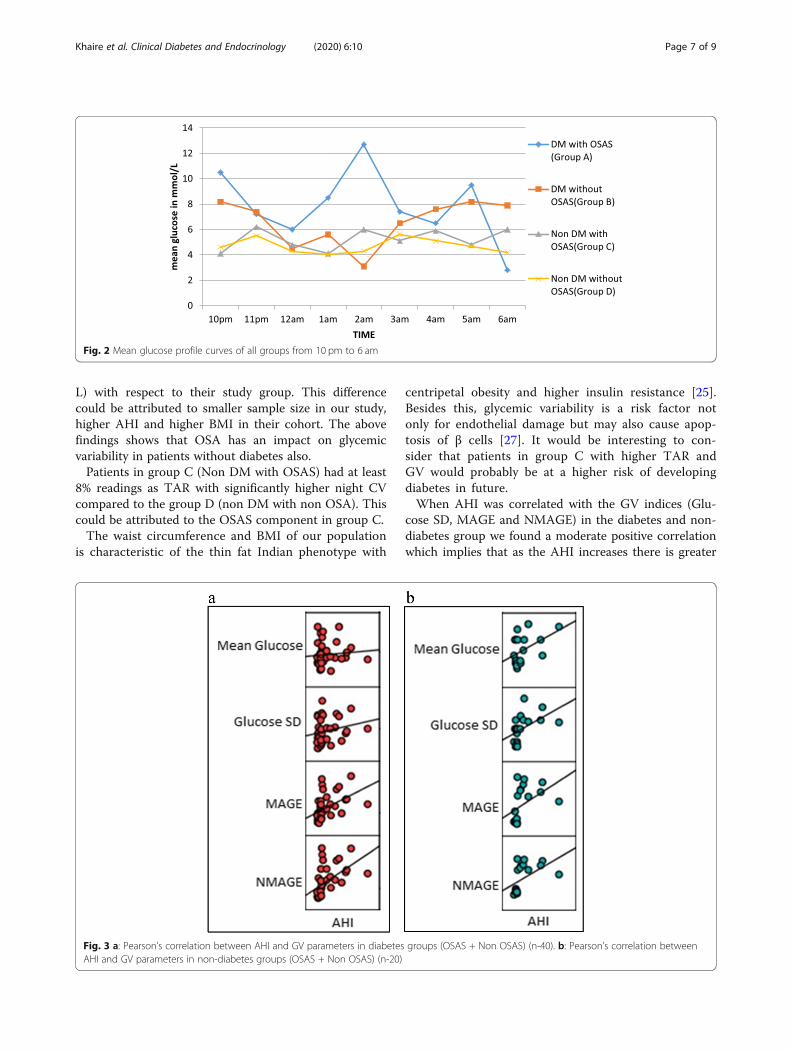
Glycemic profile in group A and group B from 10 pm to 6amWe compared the mean glucose profile curves from 10pm to 6 am in group A and group B. There was a highervariability in group A as compared to group B. Themean peak glucose in group A and group B was 12.76
mmol/L and 11.65 mmol/L whereas the mean nadir glu-cose value was 2.83 mmol/L and 3.1 mmol/L respectivelyFig. 2.Patients showing increased glycaemic variability in
group A than group B and increased variability in groupC than group D.
Glycemic profile in (group C and group D) from 10 pm to6 amWe also compared the mean glucose profile curves from10 pm to 6 am in group C and group D. Group Cshowed a higher variability as compared to group D.The mean peak glucose level of group C and group Dwas 6.2 mmol/L and 5.5 mmol/L whereas mean nadir
Table 2 Profiles of patients with diabetes
VARIABLE Group A (n = 20) Group B(n = 20)
Medications(n)
Life style modification 1 3
Metformin 5 3
Metformin + Glimepiride 4 4
Metformin + DPP4 inhibitor 8 8
Metformin+ Glimepiride + DPP4 inhibitor 2 2
Duration of DM
Less than 5 yrs. 12 8
More than 5 yrs. 8 12
Complications(n)
Retinopathy (Non Proliferative) 9 10
Peripheral Neuropathy 12 12
Table 3 Comparison of the Glycemic variability indices and AHI in the study population
VARIABLE Group A (n = 20)Mean ± SD
Group B(n = 20)Mean ± SD
Group C(n = 10)Mean ± SD
Group D(n = 10)Mean ± SD
AHI 18.97 ± 13.59 3.50 ± 1.34 18.98 ± 13.72 3.51 ± 1.15
Time in Range (%) 67 ± 4.26 69 ± 3.54 89 ± 2.71 97 ± 1.33
Time above Range (%) 20 ± 2.5 19 ± 2.8 8 ± 1.2 0
Time below range (%) 13 ± 2.1 12 ± 1.8 3 ± 1.4 2 ± 0.5
Mean Glucose (mmol/L) 7.77 ± 2.42 6.81 ± 2.31 5.85 ± 2.10 4.83 ± 1.95
SD (mmol/L) 2.44 ± 1.10 1.91 ± 0.86 0.87 ± 0.16 0.68 ± 0.11
CV (%) 31% ± 4.5 28% ± 3.5 16% ± 2.8 14% ± 2.4
Night Mean glucose (mmol/L) 6.84 ± 1.82 6.70 ± 1.64 5.05 ± 0.20 4.70 ± 0.15
Night SD (mmol/L) 2.54 ± 1.76 1.96 ± 0.92 0.98 ± 0.14 0.74 ± 0.14
Night CV (%) 37 ± 2.5 29 ± 2.3 19 ± 1.2 15 ± 1.1
MAGE (mmol/L) 5.20 ± 2.15 2.67 ± 1.04 2.47 ± 0.42 0.77 ± 0.19
NMAGE (mmol/L) 5.78 ± 2.16 2.22 ± 1.00 2.85 ± 0.42 0.62 ± 0.15
One way ANOVA applied, data failed normality hence Kruskal Wallis test appliedP value was significant between all four groupsP < 0.05 was considered significantTime in Range: 3.9 to 10 mmol/L, Time Below range: < 3.9 mmol/L, Time above range > 10mmol/L
Khaire et al. Clinical Diabetes and Endocrinology (2020) 6:10 Page 5 of 9

glucose value was 4.1 mmol/L and 3.99 mmol/Lrespectively.
Correlation of AHI with GV parameters in patients withDiabetes (Group A + Group B) Fig. 3aAHI positively correlated with Glucose SD, MAGE andNMAGE with correlation coefficient of 0.219, 0.464, and0.521 respectively in patients with diabetes (group A andB) with/without OSAS on Pearson’s correlation. Thisfinding denotes moderate correlation of OSAS severitywith glycemic variability indices.
Correlation of AHI with GV parameters in patientswithout diabetes (Group C + Group D) Fig. 3bAHI also correlated positively (moderate correlation) withglycemic variability parameters of Glucose SD, MAGEand NMAGE with correlation coefficient of 0.494, 0.438and 0.495 respectively on Pearson’s correlation.
DiscussionThe association of sleep apnea with diabetes mellitus isbidirectional [14]. Most studies have reported the correl-ation of AHI with plasma glucose levels, HbA1c and in-sulin resistance indices [14, 15], however very fewstudies have looked at the glycemic variability parame-ters. Our study is probably the first to study GV in DMand non DM groups with and without OSAS. All thefour groups studied were adequately matched for all theconfounding factors such as age, sex, BMI, waist circum-ference and blood pressure which could affect OSAS.We found that the MAGE, NMAGE and Night CV
were significantly higher in group A than group B eventhough the TIR, TAR, TBR, CV and SD were not signifi-cantly different. This indicates that patients with similarlevels of glycemia had higher glycemic variability espe-cially at night suggesting a role of OSAS. SimilarlyNakata et al.in his study found significantly higherMAGE and NMAGE in his group of patients who haddiabetes and OSAS as compared to group OSAS withoutdiabetes [24]. When we compared our Group A patientswith their patients who had diabetes with OSAS, our pa-tients had higher NMAGE (5.78 mmol/L vs. 2.75 mmol/L) but lower AHI (18.97 vs. 29) with a comparableMAGE (5.20 mmol/L vs. 5.30 mmol/L). The characteris-tics of study population in Nakata et al. was significantlydifferent than our study population which could explainthe differences in GV parameters. They had patientswith heart failure (54.7%), patients on insulin and CKDwhich were exclusions for our study.The parameters of Night CV, MAGE and NMAGE
were significantly higher in group C compared to groupD. These finding were similar to those with the studydone by Peng et al. [26] who had recruited OSAS (n- 80)and non OSAS (n-40) patients but both without dia-betes. Our patients in Group C (Non-diabetes withOSAS) had lower MAGE (2.47 mmol/L vs. 4.00 mmol/L)and comparable NMAGE (2.85 mmol/L vs. 1.99 mmol/
Table 4 Glycemic variability indices and AHI (Group A & Group B)
VARIABLE Group A (n = 20)Mean ± SD
Group B (n = 20)Mean ± SD
p value
AHI 18.97 ± 13.59 3.50 ± 1.34 < 0.05
Mean Glucose (mmol/L) 7.77 ± 2.42 6.81 ± 2.31 > 0.05
SD (mmol/L) 2.44 ± 1.10 1.91 ± 0.86 > 0.05
CV (%) 31% ± 4.5 28% ± 3.5 > 0.05
Night Mean glucose (mmol/L) 6.84 ± 1.82 6.70 ± 1.64 > 0.05
Night SD (mmol/L) 2.54 ± 1.76 1.96 ± 0.92 > 0.05
Night CV (%) 37 ± 2.5 29 ± 2.3 < 0.05
MAGE (mmol/L) 5.20 ± 2.15 2.67 ± 1.04 < 0.05
NMAGE (mmol/L) 5.78 ± 2.16 2.22 ± 1.00 < 0.05
Post hoc analysis (Dunn’s method) in subgroupsP < 0.05 is significant
Table 5 Glycemic variability indices and AHI in Group C andGroup D
VARIABLE Group C (n = 10)Mean ± SD
Group D (n = 10)Mean ± SD
p value
AHI 18.98 ± 13.72 3.51 ± 1.15 < 0.05
Mean Glucose (mmol/L) 5.85 ± 2.10 4.83 ± 1.95 > 0.05
SD (mmol/L) 0.87 ± 0.16 0.68 ± 0.11 > 0.05
CV (%) 16% ± 2.8 14% ± 2.4 > 0.05
Night Mean glucose 5.05 ± 0.20 4.70 ± 0.15 > 0.05
Night SD 0.98 ± 0.14 0.74 ± 0.14 > 0.05
Night CV (%) 19 ± 1.2 15 ± 1.1 < 0.05
MAGE (mmol/L) 2.47 ± 0.42 0.77 ± 0.19 < 0.05
NMAGE (mmol/L) 2.85 ± 0.42 0.62 ± 0.15 < 0.05
Post hoc analysis between subgroups (Dunn’s method)
Khaire et al. Clinical Diabetes and Endocrinology (2020) 6:10 Page 6 of 9
L) with respect to their study group. This differencecould be attributed to smaller sample size in our study,higher AHI and higher BMI in their cohort. The abovefindings shows that OSA has an impact on glycemicvariability in patients without diabetes also.Patients in group C (Non DM with OSAS) had at least
8% readings as TAR with significantly higher night CVcompared to the group D (non DM with non OSA). Thiscould be attributed to the OSAS component in group C.The waist circumference and BMI of our population
is characteristic of the thin fat Indian phenotype with
centripetal obesity and higher insulin resistance [25].Besides this, glycemic variability is a risk factor notonly for endothelial damage but may also cause apop-tosis of β cells [27]. It would be interesting to con-sider that patients in group C with higher TAR andGV would probably be at a higher risk of developingdiabetes in future.When AHI was correlated with the GV indices (Glu-
cose SD, MAGE and NMAGE) in the diabetes and non-diabetes group we found a moderate positive correlationwhich implies that as the AHI increases there is greater
Fig. 2 Mean glucose profile curves of all groups from 10 pm to 6 am
Fig. 3 a: Pearson’s correlation between AHI and GV parameters in diabetes groups (OSAS + Non OSAS) (n-40). b: Pearson’s correlation betweenAHI and GV parameters in non-diabetes groups (OSAS + Non OSAS) (n-20)
Khaire et al. Clinical Diabetes and Endocrinology (2020) 6:10 Page 7 of 9

increase in GV. However the study by Nakata et al. didnot find any significant correlation in their DM group.The study by Peng et al. in non DM patients did findpositive correlation of AHI with MAGE and NMAGE.With the results of our study it would be tempting tospeculate that the benefit of treating OSAS would alsobe beneficial in reducing GV rather than just improvingglycemic control. It would be worthwhile to see whetherchanges in glycemic variability reverse after applicationof Continuous Positive Airway Pressure therapy (CPAP)in OSAS with diabetes. OSAS is a known, albeit an un-derappreciated comorbidity of type 2 diabetes mellitus.It may be one of the contributors to poor glycemic con-trol and should be actively sought at least in patientswith symptoms suggestive of OSAS.Limitation of the study was low sample size especially
in the Non-diabetes groups, hence studies with largersample size would help to better predict the relation be-tween diabetes/non diabetes and OSAS.
ConclusionOSAS has a significant impact on Glycemic Variabilityin presence or even in absence of diabetes. Respiratorydisturbances index (AHI) has moderate correlation toglycemic variability indices.
AbbreviationsDM: Diabetes Mellitus; OSAS: Obstructive sleep apnea syndrome;GV: Glycemic variability; AHI: Apnea hypopnea index; SACS: Sleep ApneaClinical Score; PSG: Polysomnography; CGMS: Continuous glucosemonitoring system; MAGE: Mean amplitude of glycaemic excursions;NMAGE: Night mean amplitude of glycemic excursions; SD: StandardDeviation; CV: Coefficient of variation; TIR: Time in Range; TBR: Time belowRange; TAR: Time above Range; LSM: Lifestyle Modifications; OAD: OralAntidiabetic Medications; DPP4: Dipeptidyl Peptidase 4; BMI: Body Massindex; WC: Waist Circumference; SBP: Systolic Blood Pressure; DBP: DiastolicBlood Pressure; FPG: Fasting Plasma Glucose
AcknowledgementsNo
Authors’ contributionsAll authors have contributed equally. The author(s) read and approved thefinal manuscript.
Authors’ informationSuhas S. Khaire – MD (Pediatrics), DM (Endocrinology); Assistant Professor.Jugal V. Gada - MD (Internal Medicine), DM (Endocrinology); AssistantProfessor.Ketaki V. Utpat- MD (Pulmonary Medicine), DNB (Respiratory Medicine),EDRM; Assistant Professor.Nikita Shah- MD (Internal Medicine), DM (Endocrinology).Premlata K. Varthakavi – MD (Internal Medicine), Diplomate of National Board- DNB (Endocrinology); Professor.Nikhil M. Bhagwat- MD (Internal Medicine), DM (Endocrinology); AdditionalProfessor and Head of Department.
FundingNone.
Availability of data and materialsNot applicable.
Ethics approval and consent to participateInstitutional Ethics committee approval was taken (No. ECARP/2018/95).
Consent for publicationNot applicable.
Competing interestsThe authors declare that they have no competing interests.No conflict of interest.
Author details1Department of Endocrinology, Room no. 419, 4th floor, College building,Topiwala National Medical College and Bai Yamunabai Laxman (B.Y.L.) NairCharitable Hospital, A.L. Nair Road, Mumbai Central, Mumbai, Maharashtra400008, India. 2Department of Chest Medicine, Topiwala National MedicalCollege and Bai Yamunabai Laxman (B.Y.L.) Nair Charitable Hospital, Mumbai,India.
Received: 23 January 2020 Accepted: 26 May 2020
References1. Thorpy M. Classification of sleep disorders. Neurotherapeutics. 2012;9(4):
687–701.2. Foster G, Sanders M, Millman R, Zammit G, Borradaile K, Newman A, et al.
Obstructive sleep apnea among obese patients with type 2 diabetes.Diabetes Care. 2009;32(6):1017–9.
3. Heffner J, Rozenfeld Y, Kai M, Stephens E, Brown L. Prevalence of diagnosedsleep Apneaamong patients with type 2 diabetes in primary care. Chest.2012;141(6):1414–21.
4. Aronsohn R, Whitmore H, Van Cauter E, Tasali E. Impact of untreatedobstructive sleep apnea on glucose control in type 2 diabetes. Am J RespirCrit Care Med. 2010;181(5):507–13.
5. Mohsenin V. Obstructive Sleep Apnea and Hypertension: a Critical Review.Curr Hypertens Rep. 2014;16(10):482.
6. Ali S, Oni E, Warraich H, Blaha M, Blumenthal R, Karim A, et al. Systematicreview on noninvasive assessment of subclinical cardiovascular disease inobstructive sleep apnea: new kid on the block! Sleep Med Rev. 2014;18(5):379–91.
7. Amit Benjamin J, Lewis K. Sleep-disordered breathing and cardiovasculardisease. Postgrad Med J. 2008;84(987):15–22.
8. Yaggi H, Concato J, Kernan W, Lichtman J, Brass L, Mohsenin V. Obstructivesleep apnea as a risk factor for stroke and death. N Engl J Med. 2005;353(19):2034–41.
9. Bulcun E, Ekici M, Ekici A. Disorders of glucose metabolism and insulinresistance in patients with obstructive sleep apnoea syndrome. Int J ClinPract. 2011;66(1):91–97.9.
10. Kim N. Obstructive sleep apnea and abnormal glucose metabolism.Diabetes Metab J. 2012;36(4):268.
11. Vale J, Manuel P, Oliveira E, Oliveira A, Silva E, Melo V, et al. Obstructivesleep apnea and diabetes mellitus. Revista Portuguesa de Pneumologia(English Edition). 2015;21(2):55–60.
12. Punjabi N. Sleep-disordered breathing, glucose intolerance, and insulinresistance: the sleep heart health study. Am J Epidemiol. 2004;160(6):521–30.
13. Gu C, Li Q, Li M, Zhou J, Du J, Yi H. Liver enzymes and lipid profile in HanChinese subjects with obstructive sleep apnea. Chest. 2016;149(4):A574.
14. Reichmuth K, Austin D, Skatrud J, Young T. Association of Sleep Apnea andType II diabetes. Am J Respir Crit Care Med. 2005;172(12):1590–5.
15. Botros N, Concato J, Mohsenin V, Selim B, Doctor K, Yaggi H. Obstructivesleep apnea as a risk factor for type 2 diabetes. Am J Med. 2009;122(12):1122–7.
16. Nalysnyk L, Hernandez-Medina M, Krishnarajah G. Glycaemic variability andcomplications in patients with diabetes mellitus: evidence from a systematicreview of the literature. Diabetes Obes Metab. 2010;12(4):288–98.
17. Temelkova-Kurktschiev TS, Koehler C, Henkel E, Leonhardt W, Fuecker K,Hanefeld M. Postchallenge plasma glucose and glycemic spikes are morestrongly associated with atherosclerosis than fasting glucose or HbA1c level.Diabetes Care. 2000;23(12):1830–4.
18. Raz I, Wilson PW, Strojek K, Kowalska I, Bozikov V, Gitt AK, et al. Effects ofprandial versus fasting Glycemia on cardiovascular outcomes in type 2diabetes: the HEART2D trial. Diabetes Care. 2009;32(3):381–6.
Khaire et al. Clinical Diabetes and Endocrinology (2020) 6:10 Page 8 of 9
19. Bergenstal RM. Glycemic variability and diabetes complications: does itmatter? Simply put, there are better glycemic markers! Diabetes Care. 2015;38(8):1615–21.
20. Flemons WW, Whitelaw WA, Brant R, Remmers JE. Likelihood ratios for asleep apnea clinical prediction rule. Am J Respir Crit Care Med. 1994;150(5):1279–85.
21. Skodjt NM. Approach to outpatient management of adult sleep apnea. CanFam Physician. 2008;54(10):1408–12.
22. Practice parameters for the indications for polysomnography and relatedprocedures. Polysomnography Task Force, American Sleep DisordersAssociation Standards of Practice Committee. Sleep. 1997;20(6):406–22.https://doi.org/10.1093/sleep/20.6.406.
23. Service FJ, Molnar GD, Rosevear JW, Ackerman E, Gatewood LC, Taylor WF.Mean amplitude of glycemic excursions, a measure of diabetic instability.Diabetes. 1970;19:644–55.
24. Nakata K, Miki T, Tanno M, Ohnishi H, Yano T, Muranaka A, et al. Distinctimpacts of sleep-disordered breathing on glycemic variability in patientswith and without diabetes mellitus. Plos One. 2017;12(12).
25. Wells JCK, Pomeroy E, Walimbe SR, Popkin BM, Yajnik CS. The ElevatedSusceptibility to Diabetes in India: An Evolutionary Perspective. Front PublicHealth. 2016;4:145. https://doi.org/10.3389/fpubh.2016.00145.
26. Peng C-S, Cao Y-A, Tian Y-H, Zhang W-L, Xia J, Yang L. Features ofcontinuous glycemic profile and glycemic variability in patients withobstructive sleep apnea syndrome. Diabetes Res Clin Pract. 2017;134:106–12.
27. Ceriello A, Ihnat MA. ‘Glycaemic variability’: a new therapeutic challenge indiabetes and the critical care setting. Diabet Med. 2010;27(8):862–7.
Publisher’s NoteSpringer Nature remains neutral with regard to jurisdictional claims inpublished maps and institutional affiliations.
Khaire et al. Clinical Diabetes and Endocrinology (2020) 6:10 Page 9 of 9
Related Documents