technologies Article A Stochastic Memory Model for ADL Detection in Human Households † Jana Clement * ID and Klaus Kabitzsch Department of Computer Science, University of Technology Dresden, 01062 Dresden, Germany; [email protected] * Correspondence: [email protected]; Tel.: +49-351-4633-8375 † This paper is an extended version of our paper published in the 10th International Conference on Pervasive Technologies Related to Assistive Environments (PETRA), Island of Rhodes, Greece, 21–23 June 2017. Received: 16 October 2017; Accepted: 24 November 2017; Published: 30 November 2017 Abstract: Many Human Activity Recognition (HAR) systems are able to detect sequential executed Activity of Daily Living (ADL). However, a person is capable of doing two things in parallel or pausing one ADL and finishing it later. Thus, a HAR system must be capable of remembering and deciding which ADL is completed and which might be continued after the current ADL. We address this case by combining a stochastic Markov model and a psychological memory function to detect parallel ADL. For the evaluation, we use an input dataset and a publicly available benchmark. Our approach outperforms the leading HAR systems for the used benchmark by 5%, while using a more cost-effective installation environment. Furthermore, we address an unsupervised learning method to train the HAR system and explain the algorithm of parallel ADL detection in detail. Keywords: Markov model; ADL; human activity detection; cognitive model; Ambient Assisted Living (AAL); human behavior; HAR 1. Introduction This paper is an extended version of the publication done in 2017 for the Pervasive Technologies Related to Assistive Environments (PETRA) Conference in Greece [1]. Additional information and figures have been added and discussed. The detection of activities in private households becomes more important for health-care and assisted accommodations because impaired people want to continue living in their homes [2], which leads to an increase of care. Many accidents happen at home, most of them in the bathroom, living room and the kitchen, where 75% were falls [3]. Especially elderly people are afraid of accidents at home. In Germany, 34.5% of emergency calls have no emergency reason, and 42% of them are executed by people over 70 years [4]. The fear of life-threating situations rises with people’s age and so the emergency costs that could have been prevented. The elderly also tend to forget started activities, such as cooking or an open water tap. This forgetfulness may lead to a severe threat to health. Studies revealed that unattended cooking is the main leading factor responsible for fires in the kitchen [5,6]. Additionally, even if the person does not suffer any health-threatening consequences, there might still be considerable damage to the house’s infrastructure. In [2], a study revealed that, “All men and women expressed wanting to stay at home as long as possible, even if a home care assistant was needed.” The work in [2] also reveals that “Perceiving a situation of being in need of extensive care and living at a nursing home was connected to many different kinds of feelings and fears”. Additionally, already physically impaired people want to be monitored due to the fear of deterioration being left unnoticed [7]. Thus, Human Activity Recognition (HAR) systems can help to prolong the elderly person’s stay at home. It relaxes relatives who are concerned about the health of their family members Technologies 2017, 5, 78; doi:10.3390/technologies5040078 www.mdpi.com/journal/technologies

Welcome message from author
This document is posted to help you gain knowledge. Please leave a comment to let me know what you think about it! Share it to your friends and learn new things together.
Transcript
technologies
Article
A Stochastic Memory Model for ADL Detectionin Human Households †
Jana Clement * ID and Klaus Kabitzsch
Department of Computer Science, University of Technology Dresden, 01062 Dresden, Germany;[email protected]* Correspondence: [email protected]; Tel.: +49-351-4633-8375† This paper is an extended version of our paper published in the 10th International Conference on Pervasive
Technologies Related to Assistive Environments (PETRA), Island of Rhodes, Greece, 21–23 June 2017.
Received: 16 October 2017; Accepted: 24 November 2017; Published: 30 November 2017
Abstract: Many Human Activity Recognition (HAR) systems are able to detect sequential executedActivity of Daily Living (ADL). However, a person is capable of doing two things in parallel orpausing one ADL and finishing it later. Thus, a HAR system must be capable of remembering anddeciding which ADL is completed and which might be continued after the current ADL. We addressthis case by combining a stochastic Markov model and a psychological memory function to detectparallel ADL. For the evaluation, we use an input dataset and a publicly available benchmark.Our approach outperforms the leading HAR systems for the used benchmark by 5%, while usinga more cost-effective installation environment. Furthermore, we address an unsupervised learningmethod to train the HAR system and explain the algorithm of parallel ADL detection in detail.
Keywords: Markov model; ADL; human activity detection; cognitive model; Ambient AssistedLiving (AAL); human behavior; HAR
1. Introduction
This paper is an extended version of the publication done in 2017 for the Pervasive TechnologiesRelated to Assistive Environments (PETRA) Conference in Greece [1]. Additional information andfigures have been added and discussed.
The detection of activities in private households becomes more important for health-care andassisted accommodations because impaired people want to continue living in their homes [2],which leads to an increase of care. Many accidents happen at home, most of them in the bathroom,living room and the kitchen, where 75% were falls [3]. Especially elderly people are afraid of accidentsat home. In Germany, 34.5% of emergency calls have no emergency reason, and 42% of them areexecuted by people over 70 years [4]. The fear of life-threating situations rises with people’s age and sothe emergency costs that could have been prevented. The elderly also tend to forget started activities,such as cooking or an open water tap. This forgetfulness may lead to a severe threat to health. Studiesrevealed that unattended cooking is the main leading factor responsible for fires in the kitchen [5,6].Additionally, even if the person does not suffer any health-threatening consequences, there mightstill be considerable damage to the house’s infrastructure. In [2], a study revealed that, “All menand women expressed wanting to stay at home as long as possible, even if a home care assistant wasneeded.” The work in [2] also reveals that “Perceiving a situation of being in need of extensive care andliving at a nursing home was connected to many different kinds of feelings and fears”. Additionally,already physically impaired people want to be monitored due to the fear of deterioration being leftunnoticed [7]. Thus, Human Activity Recognition (HAR) systems can help to prolong the elderlyperson’s stay at home. It relaxes relatives who are concerned about the health of their family members
Technologies 2017, 5, 78; doi:10.3390/technologies5040078 www.mdpi.com/journal/technologies
Technologies 2017, 5, 78 2 of 17
by having feedback on their relative’s activities. Additionally, HAR systems can also help caregivers tomanage their work more efficiently.
Whereas many sensors currently used for HAR systems try to offer an appeasing design, they stillare visible and may trigger fear of surveillance. In our approach, we make use of already installed,unobtrusive sensors like for example smart meters or smart plugs. An additional benefit of this practiceis the reduced costs for sensors, installation and services. Most of the research models for HAR aretrained with a labeled training set [8–11]. That means the monitored person has to give feedback abouthis/her activities. This is a very time-consuming and error-prone procedure. We already experiencedthis in two projects [11,12] and explain it in detail later. This paper introduces an unsupervised trainingalgorithm based on general assumptions matching all private households where no prior manuallogging of activities is needed. The next section provides an overview of the state of the art in HAR.Section 3 explains how a Markov model is used to learn human activity patterns followed by a sectionexplaining the calculation of significant factors for human patterns. A model for human memorycapacity is introduced in Section 5 to calculate a sensor distribution function in Section 6. That will beused for activity recognition in Section 7. Afterwards, an evaluation is done, and the conclusion willbe drawn.
2. State of the Art
Human Activity Recognition (HAR) is the foundation for a purposeful Ambient Assisted Living(AAL) approach. HAR approaches are typically classified by their usage of sensor types: intrusive orunobtrusive. Intrusive sensors are often more application-oriented than comfort-oriented. This givesresearchers the opportunity to set up controlled experimental scenarios with a high information rateand quality. Every parameter can be adjusted, and all measured data can be deduced. However,these sensors are not ambient. Unobtrusive sensors are more practical for private households.For example a smart meter has the ability to detect active home appliances [13] or smart plugsplaced in a socket to detect home appliances used. Small, mostly wireless sensors [14] or one deviceanalyzing the power consumption [15] are also used to detect human activity. These sensors provideless detailed information than intrusive sensors, but they are accepted by the user.
A HAR system has to be trained before detection can be done. This can be classified intounsupervised and supervised. Supervised training uses a labeled training dataset, which representsnormal activities in a household. For example, [14] deploys a very large number of extremely simplesensors to train naive Bayesian classifiers. These approaches perform well in HAR [16], but relyingon labeled training data in private household scenarios has some drawbacks. For each household,a new training set is needed because every person has different habits. The monitored person has tolog his/her activities to get a labeled training dataset. This procedure can be done with additionalsensors, but this would not fit the assumption of unobtrusive sensors. Thus, it has to be done manually:either handwritten or with technical support like headsets and voice recognition [8] or with the helpof a Personal Digital Assistant (PDA) [14]. This process is time-consuming and error-prone, becausethe person involved gets annoyed logging each and every activity or simply forgets to do so andtries to remember them later or just copies and pastes the activities. We already experienced thoseeffects [11,12] in three different scenarios: (1) the elderly in private households; (2) young academics inprivate households and (3) mixed academics in offices. Logging the activities is also assumed intrusiveand shall not be used in this paper’s approach.
Early unsupervised learning approaches for HAR used an activity or inactivity level. In [17],a daily inactivity diagram is explained where a threshold function is learned to detect deviations.It cannot detect activities. In [18], a single index of daily activity is calculated to detect Activity ofDaily Living (ADL) and long-term changes. It uses a fixed assignment of sensors to ADL. However,this assignment can vary from person to person. Our approach designs a HAR system where such anassignment will be individualized.
Technologies 2017, 5, 78 3 of 17
Nowadays, HAR is based on event stream analysis, where a combination of different sensorsrefers to a specific ADL. This leads to the segmentation problem where the optimal length of a sensorstream has to be estimated to get the best HAR results. In [19], a dynamic windowing approach isused, but still has problems detecting tight occurrences of ADL within one data segment. The authorin [20] solves this problem using a dynamic AES segmentation algorithm to detect also tight ADL.The dynamic segmentation solves the segmentation problem well, but it is based on a supervisedtraining algorithm and is therefore not suitable for our approach.
Unsupervised training methods rely on datasets and/or ontologies, storing information toalleviate the need for manually-labeled training data. For example, a formal description language candescribe human workflows [21]. It also can be used to detect executed activities by data mining.However, each workflow has to be defined manually and differs for each person. The projectUnsupervised Semantic Mining Activity Recognition Technique (USMART) [22] uses ontologies,where spatial information and temporal information are analyzed to detect ADL. There are twoontologies: the sensor-room ontology and the sensor-activity ontology. Data stream segments areclustered into ADL. Unfortunately, no parallel ADL can be detected. The aim of our approach isto provide an unsupervised learning algorithm needing only a few a priori data to detect ADL andparallel ADL. To summarize our requirements, the HAR system must:
• use unobtrusive, inexpensive and few sensors,• work with unsupervised training,• work with individualized assignments of sensors to ADL,• detect parallel HAR,• not rely on complicated a priori information.
3. Structure Detection in the Markov Model
3.1. Initial Setup and Training Data
The HAR-system acts in three stages: initial phase, training phase and application phase. In theinitial phase, a priori knowledge is gathered. In our case, it is a list of sensors used preliminarilyassigned to possibly detectable ADL by each sensor. This assignment is an n:m assignment,which means that one sensor can lead to multiple ADL, like the fridge sensor can be used in theADL prepare food, take a drink or store groceries. On the other hand, one ADL can be detected bymultiple sensors, as well, like the ADL prepare food can include the usage of the fridge, the watertap, the oven and the cupboard with plates. This assignment is general knowledge, leviable with loweffort and not final. It will be changed and adjusted for the monitored person in the training phase bylearning a probability distribution function (pdf) in Section 6. This pdf tells how strong a sensor eventpoints to one certain ADL. For example, Person A: the usage of the fridge points with a probability of0.6 to the ADL “have a snack” and with 0.2 to “prepare food”; whereas Person B does use the fridgemore often for “preparing food” with a probability of 0.5, and “have a snack” only reaches a probabilityof 0.1 (or even zero). This probability distribution is learned without supervision in the training phase.During the training phase, all models of the HAR-system will be trained, and this will be used withinthe application phase. Both phases will be explained in the remaining sections of this publication.
Human activities have to be deduced from sensor data. For our approach, a sensor must deliver astart and end time of the sensor’s activation. Therefore, each sensor and sensor type that can deliversuch information is suitable for our HAR. For example, only one smart meter could be used for awhole apartment. The smart meter must be able to detect which appliance (device ID) was turned onand off with the corresponding time stamps [11]. Another example could be the usage of a motiondetector. In this case, a motion sensor must be installed in each room or zone where an activity shallbe detected. Therefore, our approach is independent from sensor types and only needs the mostbasic sensor information of a timestamp, a sensor ID and the sensor’s state (on/off, active/inactive,open/close). The result is an ordered sensor event stream, which looks like the following:
Technologies 2017, 5, 78 4 of 17
• 2017-02-25 11:33:41 ID 8 sem Fridge State on• 2017-02-25 11:35:33 ID 8 sem Fridge State off• 2017-02-25 11:36:43 ID 8 sem Fridge State on• 2017-02-25 11:37:04 ID 7 sem Cupscupboard State on• 2017-02-25 11:39:00 ID 7 sem Cupscupboard State off• 2017-02-25 11:40:23 ID 8 sem Fridge State off• 2017-02-25 11:41:00 ID 5 sem Hall-Toiletdoor State on• 2017-02-25 11:41:24 ID 14 sem ToiletFlush State on• 2017-02-25 11:42:55 ID 14 sem ToiletFlush State off• 2017-02-25 11:43:14 ID 5 sem Hall-Toiletdoor State off• 2017-02-25 11:44:28 ID 8 sem Fridge State on• 2017-02-25 11:45:01 ID 8 sem Fridge State off• 2017-02-25 11:46:58 ID 8 sem Fridge State on• 2017-02-25 11:47:01 ID 8 sem Fridge State off
For example the event “2016-02-25 11:41:24 ID 14 ToiletFlush State on” tells that the toilet flush withits ID number 14 was turned on at 11:41:24 in 2017 on 25 February. The toilet flush obviously refers tothe ADL toilet usage; whereas instead, it is not possible to assign the sensor event “2017-02-25 11:36:43ID 8 sem Fridge State on” to one ADL only. The fridge can be assigned to many ADL, for example:eating, preparing breakfast/dinner/lunch, drinking, having a snack and storing groceries. The nextsensor event might be helpful “2017-02-25 11:37:04 ID 7 sem Cupscupboard State on”. Cups can beused in the ADL eating, preparing breakfast/dinner/lunch and drinking, but not in have a snack orstoring groceries. Thus, a combination of events is needed to deduce the executed ADL.
3.2. Human Activity Recognition (HAR)-Model
A model representing sensor event (E) combinations is needed. We decided to take a MarkovModel (MM) that is easy to design. Each MM-state Z represents a set of currently “on” sensors (Z ⊆ E).A change of state occurs if a sensor’s state changes. Each MM-state logs the entry and exit times (starttime and end time). If no sensor is “on”, the MM returns to an idle-state. This idle-state always exists.It cannot be learned or eliminated during the training phase. This state also collects all ADL that arenot measureable by sensors. In other words, it represents the inactivity of a person. This idle-state isthe center of the MM and a starting point for all of the following analysis methods.
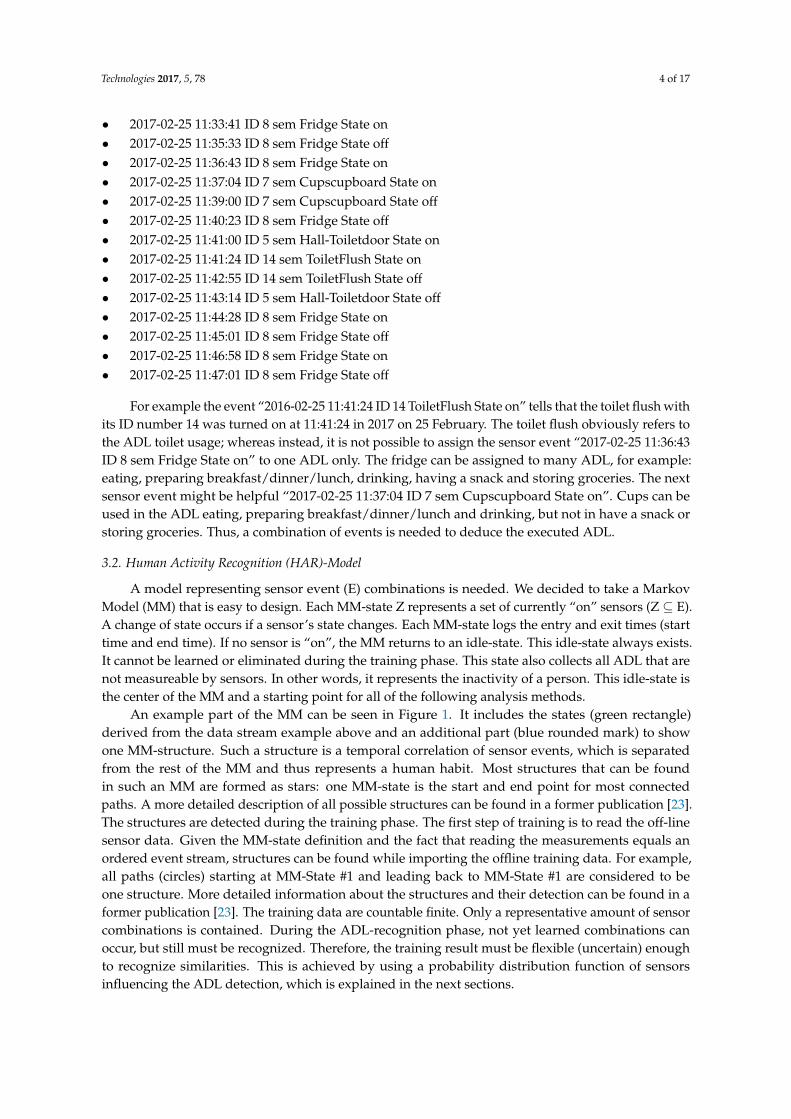
An example part of the MM can be seen in Figure 1. It includes the states (green rectangle)derived from the data stream example above and an additional part (blue rounded mark) to showone MM-structure. Such a structure is a temporal correlation of sensor events, which is separatedfrom the rest of the MM and thus represents a human habit. Most structures that can be foundin such an MM are formed as stars: one MM-state is the start and end point for most connectedpaths. A more detailed description of all possible structures can be found in a former publication [23].The structures are detected during the training phase. The first step of training is to read the off-linesensor data. Given the MM-state definition and the fact that reading the measurements equals anordered event stream, structures can be found while importing the offline training data. For example,all paths (circles) starting at MM-State #1 and leading back to MM-State #1 are considered to beone structure. More detailed information about the structures and their detection can be found in aformer publication [23]. The training data are countable finite. Only a representative amount of sensorcombinations is contained. During the ADL-recognition phase, not yet learned combinations canoccur, but still must be recognized. Therefore, the training result must be flexible (uncertain) enoughto recognize similarities. This is achieved by using a probability distribution function of sensorsinfluencing the ADL detection, which is explained in the next sections.
Technologies 2017, 5, 78 5 of 17
Technologies 2017, 5, 76 5 of 17
Figure 1. The part of the learned Markov Model (MM) showing an example (green rectangle) of two nested Activity of Daily Living (ADL): drinking and use toilet. A typical MM-structure: a star is seen in the blue rounded area.
4. Markov Model (MM)-Structure Significance Estimation
The MM-structures represent individual learned human behavior patterns. To characterize these patterns, they are rated in comparison to the corresponding ADL-MM. An ADL-MM is an MM learned only by the sensor data related to one ADL. As described in Section 3, sensors are assigned to a couple of ADL. Therefore, only the assigned sensors are considered while learning an ADL-MM. The structural characteristics are rated by a significance value 0 1 for each ADL . is computed by: = 0.6 +max , + max( , ) + 0.2 + 0.2 ∑ ∑ . (1)
The equation combines the comparison of structural sub-criteria and statistical sub-criteria as summarized in Table 1. The first sub-criterion of is the similarity of two structures. It is calculated by the ratio of matching states and matching transitions in relation to the sum of the maximum of states and transitions of the ADL-MM or structure. The matching of identical states is simple, as they are distinctly defined by the set of active devices. The transitions are distinctly identified by the tuple of source states and target states. As states and transitions are the base of an MM, this sub-criterion has a major influence and is weighted with 60% within the . The weights used in Equation (1) are retrieved by experience from former experiments. A full sensitivity study still has to be done, but the results are already good. The weights are final. In future work, it may be considered to learn these parameters or make them adjustable suiting the current situation. However, for our purpose, they stay static. We chose the weight according to the relevance of the sub-criterion. Therefore, the structural characteristics have a majority influence and the accessibility and the frequency of occurrence a minor influence. The degree of accessibility rates the variation of transitions to leave or enter a structure. It ranges from 0–1, while a higher value represents additional transitions to enter or leave. The more often this structure is entered from different states, the higher the probability that this human habit can occur. The third sub-criterion is a ratio calculation of the occupancy of the structure and the occurrence of the ADL-MM. The structure significance estimation represents the relevance of the structure and will be used in the following sections of this paper as a weight.
Figure 1. The part of the learned Markov Model (MM) showing an example (green rectangle) of twonested Activity of Daily Living (ADL): drinking and use toilet. A typical MM-structure: a star is seenin the blue rounded area.
4. Markov Model (MM)-Structure Significance Estimation
The MM-structures represent individual learned human behavior patterns. To characterize thesepatterns, they are rated in comparison to the corresponding ADL-MM. An ADL-MM is an MM learnedonly by the sensor data related to one ADL. As described in Section 3, sensors are assigned to acouple of ADL. Therefore, only the assigned sensors are considered while learning an ADL-MM.The structural characteristics are rated by a significance value 0 ≤ GS ≤ 1 for each ADL ai. GS iscomputed by:
GS = 0.6NmT + NmZ
max(
NT1 , NT2
)+ max
(NZ1 , NZ2
) + 0.2NSANTA
+ 0.2∑N
i=0 occi
∑Ni=0 occADLi
. (1)
The equation combines the comparison of structural sub-criteria and statistical sub-criteria assummarized in Table 1. The first sub-criterion of GS is the similarity of two structures. It is calculatedby the ratio of matching states and matching transitions in relation to the sum of the maximum ofstates and transitions of the ADL-MM or structure. The matching of identical states is simple, as theyare distinctly defined by the set of active devices. The transitions are distinctly identified by the tupleof source states and target states. As states and transitions are the base of an MM, this sub-criterionhas a major influence and is weighted with 60% within the GS. The weights used in Equation (1) areretrieved by experience from former experiments. A full sensitivity study still has to be done, but theresults are already good. The weights are final. In future work, it may be considered to learn theseparameters or make them adjustable suiting the current situation. However, for our purpose, they staystatic. We chose the weight according to the relevance of the sub-criterion. Therefore, the structuralcharacteristics have a majority influence and the accessibility and the frequency of occurrence a minorinfluence. The degree of accessibility rates the variation of transitions to leave or enter a structure.It ranges from 0–1, while a higher value represents additional transitions to enter or leave. The moreoften this structure is entered from different states, the higher the probability that this human habit canoccur. The third sub-criterion is a ratio calculation of the occupancy of the structure and the occurrenceof the ADL-MM. The structure significance estimation GS represents the relevance of the structure andwill be used in the following sections of this paper as a weight.
Technologies 2017, 5, 78 6 of 17
Table 1. Sub-criteria of the calculation for structural significance. Each sub-criterion is described by itsequation part, and the parameters are named below.
Sub-Criterion Equation Part
Similarity of the structure with the MMNmT+NmZ
max(NT1 ,NT2 )+max(NZ1 ,NZ2 )
Degree of accessibility NSANTA
Strength of structural components ∑Ni=0 occi
∑Ni=0 occADLi
NmZ number of matching statesNmT number of matching transitionsNSA number of entry and exit transitionsNTA number of transitions without match: NT − NmTNT number of transitionsNZ number of statesocci occurrence of a structure part ioccADLi occurrence of an ADL part iN maximum of states numbers in all parts i
5. Human Forgetting Curve Impulse
5.1. Human Forgetting Curve
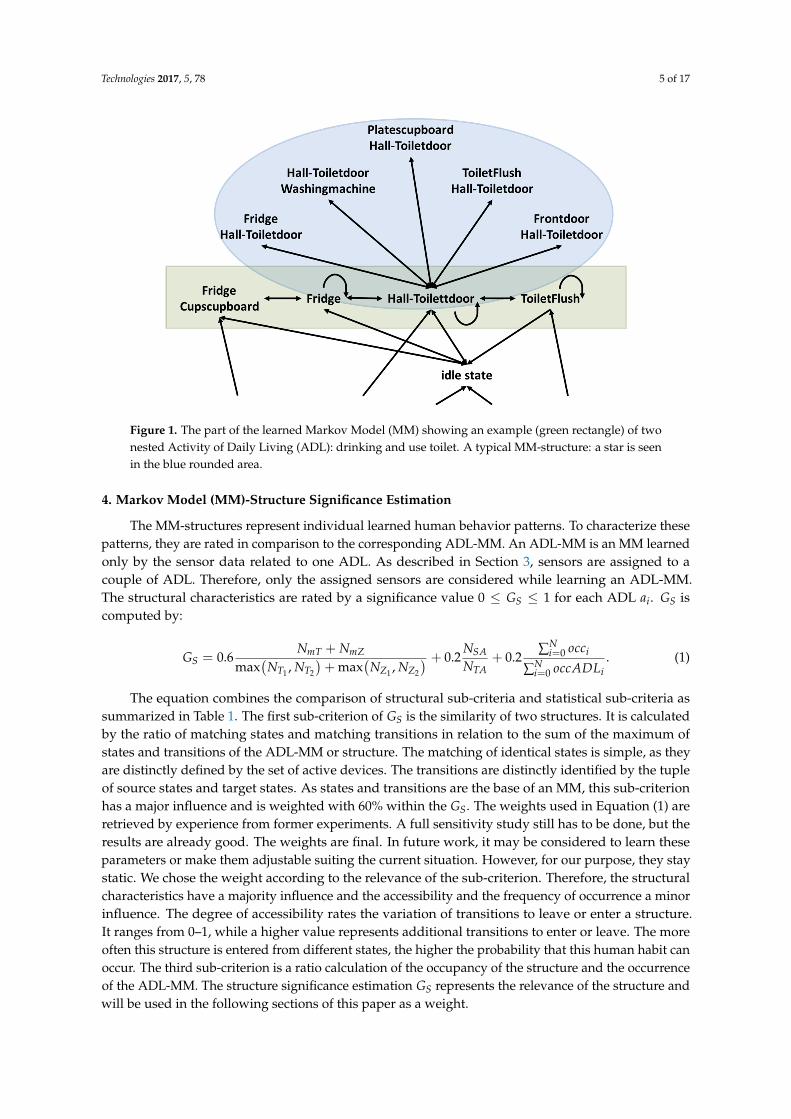
The human habit significance derived from the MM described in Section 4 has two drawbacks.First, a human has a longer memory capacity than the MM, the memory of which only reaches upto one state in the past. Second, a human can execute more than one ADL in parallel. Especially,the ADL media are often executed in the background, or the usage of the toilet is very often in thebackground, as the example in Figure 1 shows. Thus, an additional method needs to be added tothe MM-approach. The human forgetting curve [24] in Figure 2 was developed by psychologists torepresent the memorized percentage over time.
Technologies 2017, 5, 76 6 of 17
Table 1. Sub-criteria of the calculation for structural significance. Each sub-criterion is described by its equation part, and the parameters are named below.
Sub-Criterion Equation Part
Similarity of the structure with the MM +max , + max( , )
Degree of accessibility
Strength of structural components ∑∑
number of matching states number of matching transitions
number of entry and exit transitions number of transitions without match: −
number of transitions number of states
occurrence of a structure part i occurrence of an ADL part i
maximum of states numbers in all parts i
5. Human Forgetting Curve Impulse
5.1. Human Forgetting Curve
The human habit significance derived from the MM described in Section 4 has two drawbacks. First, a human has a longer memory capacity than the MM, the memory of which only reaches up to one state in the past. Second, a human can execute more than one ADL in parallel. Especially, the ADL media are often executed in the background, or the usage of the toilet is very often in the background, as the example in Figure 1 shows. Thus, an additional method needs to be added to the MM-approach. The human forgetting curve [24] in Figure 2 was developed by psychologists to represent the memorized percentage over time.
Figure 2. Human forgetting curve. This shows the human memory capability and that the human awareness decreases over time following an exponential function.
Human memory diminishes over time. Furthermore, even healthy young humans forget. Experiments evaluated that a human forgets newly learned random data: after 20 min, the human forgets 40%, 1 h 55%, 1 day 66%, 6 days 77% and maintains then in memory for ever only 15–20%. These data vary by age, type of learning, the number of repetitions and the type of data that are learned. For example, data that have a certain logical relation remain longer in memory than
Figure 2. Human forgetting curve. This shows the human memory capability and that the humanawareness decreases over time following an exponential function.
Human memory diminishes over time. Furthermore, even healthy young humans forget.Experiments evaluated that a human forgets newly learned random data: after 20 min, the humanforgets 40%, 1 h 55%, 1 day 66%, 6 days 77% and maintains then in memory for ever only 15–20%.These data vary by age, type of learning, the number of repetitions and the type of data that arelearned. For example, data that have a certain logical relation remain longer in memory thanrandomly-generated numbers. The more often the data are repeated, the longer they stay in memory.
Technologies 2017, 5, 78 7 of 17
The forgetting curve decreases as an e-function that has to be parameterized for each situation. This isdone in the next section.
5.2. Impulse Approach
The human forgetting curve impulse (hfci) analyzes the temporal correlation of events. If twoevents occur in quick succession and are assigned to the same ADL, the ADL’s significance is increased;while longer time intervals between events have a reduced impact. This is modeled by an exponentialdecline function for each ADL. If a sensor is activated, the corresponding ADL are stimulatedaccording to their relevance weight Ga. The calculation of this weight is explained later in thissection. The stimulus impulse may not drop below 20% as long as the sensor is active. The stimulusdeclines after the sensor is deactivated. The hfci Iai (t) of each ADL ai is calculated by:
Iai (t) = ∑e∈E
{Ga(e, ai)
(0.2 + 0.8e−d(t−ton)
), active
Ga(e, ai)bon × e−d(t−to f f )), inactive
}(2)
with the time t and the relevance weight Ga(e, ai) of each home appliance e. As described in Section 5.1,the human forgetting curve by Ebbinghaus is designed to keep at least 20% of learned content inmemory. Thus, the hfci for active sensors starts at a value of 0.2, and the exponential decline is decreasedto 80%. This means that without Ga, the maximum outcome is one (100%). The factor Ga is able toincrease or decrease the hfci’s behavior. The factor d describes how fast the curve decreases over time.It can be derived by the descriptions in Section 5.1, as well. For example, after 20 min (t− ton = 1200 s),a human forgets 40%. This means that 60% will be remembered and Ia is 0.6. The factor Ga can beneglected for these adjustments because Ga shall not have any influence on the way of forgetting.It only shall influence the maximum height.
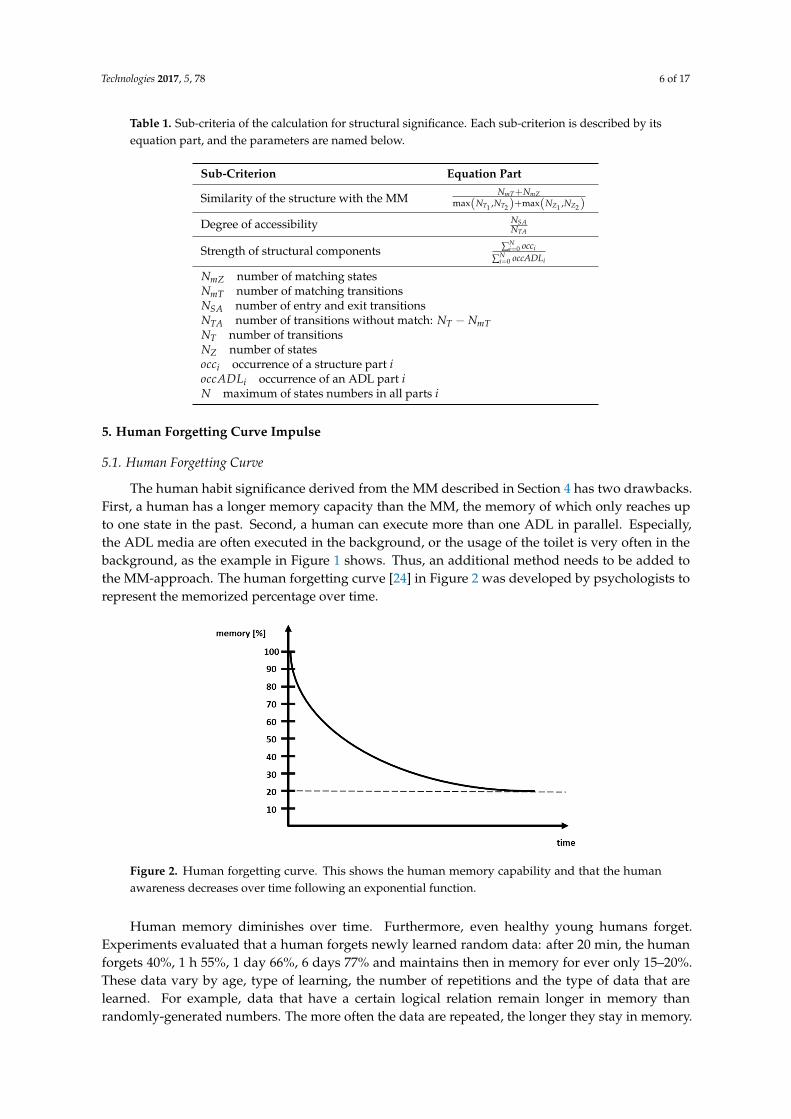
Figure 3 shows an example of the hfci. Each function curve represents one ADL. It is thecorresponding hfci from the MM shown in Figure 1.
Technologies 2017, 5, 76 7 of 17
randomly-generated numbers. The more often the data are repeated, the longer they stay in memory. The forgetting curve decreases as an e-function that has to be parameterized for each situation. This is done in the next section.
5.2. Impulse Approach
The human forgetting curve impulse (hfci) analyzes the temporal correlation of events. If two events occur in quick succession and are assigned to the same ADL, the ADL’s significance is increased; while longer time intervals between events have a reduced impact. This is modeled by an exponential decline function for each ADL. If a sensor is activated, the corresponding ADL are stimulated according to their relevance weight . The calculation of this weight is explained later in this section. The stimulus impulse may not drop below 20% as long as the sensor is active. The stimulus declines after the sensor is deactivated. The hfci ( ) of each ADL ai is calculated by:
( ) = ( , ) 0.2 + 0.8 ( ) , active( , ) ∗ ( )), inactive∈ (2)
with the time and the relevance weight ( , ) of each home appliance . As described in Section 5.1, the human forgetting curve by Ebbinghaus is designed to keep at least 20% of learned content in memory. Thus, the hfci for active sensors starts at a value of 0.2, and the exponential decline is decreased to 80%. This means that without , the maximum outcome is one (100%). The factor is able to increase or decrease the hfci’s behavior. The factor d describes how fast the curve decreases over time. It can be derived by the descriptions in Section 5.1, as well. For example, after 20 min ( − = 1200 s), a human forgets 40%. This means that 60% will be remembered and is 0.6. The factor can be neglected for these adjustments because shall not have any influence on the way of forgetting. It only shall influence the maximum height.
Figure 3 shows an example of the hfci. Each function curve represents one ADL. It is the corresponding hfci from the MM shown in Figure 1.
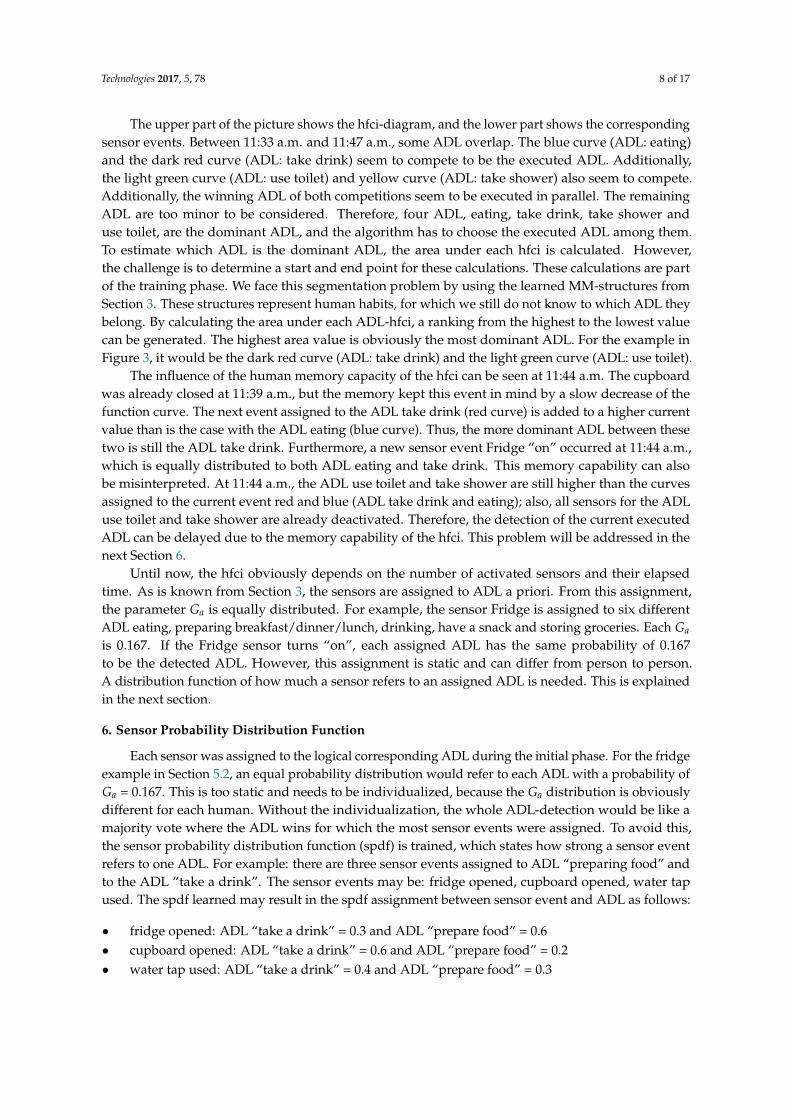
Figure 3. The human forgetting curve impulse (hfci) with the equal distribution of sensor-ADL-assignment (sensor probability distribution function (spdf)). Each colored function curve represents the impulse curve hfci for one ADL. The table underneath the curve diagram shows the corresponding sensor events.
Figure 3. The human forgetting curve impulse (hfci) with the equal distribution of sensor-ADL-assignment (sensor probability distribution function (spdf)). Each colored function curve representsthe impulse curve hfci for one ADL. The table underneath the curve diagram shows the correspondingsensor events.
Technologies 2017, 5, 78 8 of 17
The upper part of the picture shows the hfci-diagram, and the lower part shows the correspondingsensor events. Between 11:33 a.m. and 11:47 a.m., some ADL overlap. The blue curve (ADL: eating)and the dark red curve (ADL: take drink) seem to compete to be the executed ADL. Additionally,the light green curve (ADL: use toilet) and yellow curve (ADL: take shower) also seem to compete.Additionally, the winning ADL of both competitions seem to be executed in parallel. The remainingADL are too minor to be considered. Therefore, four ADL, eating, take drink, take shower anduse toilet, are the dominant ADL, and the algorithm has to choose the executed ADL among them.To estimate which ADL is the dominant ADL, the area under each hfci is calculated. However,the challenge is to determine a start and end point for these calculations. These calculations are partof the training phase. We face this segmentation problem by using the learned MM-structures fromSection 3. These structures represent human habits, for which we still do not know to which ADL theybelong. By calculating the area under each ADL-hfci, a ranking from the highest to the lowest valuecan be generated. The highest area value is obviously the most dominant ADL. For the example inFigure 3, it would be the dark red curve (ADL: take drink) and the light green curve (ADL: use toilet).
The influence of the human memory capacity of the hfci can be seen at 11:44 a.m. The cupboardwas already closed at 11:39 a.m., but the memory kept this event in mind by a slow decrease of thefunction curve. The next event assigned to the ADL take drink (red curve) is added to a higher currentvalue than is the case with the ADL eating (blue curve). Thus, the more dominant ADL between thesetwo is still the ADL take drink. Furthermore, a new sensor event Fridge “on” occurred at 11:44 a.m.,which is equally distributed to both ADL eating and take drink. This memory capability can alsobe misinterpreted. At 11:44 a.m., the ADL use toilet and take shower are still higher than the curvesassigned to the current event red and blue (ADL take drink and eating); also, all sensors for the ADLuse toilet and take shower are already deactivated. Therefore, the detection of the current executedADL can be delayed due to the memory capability of the hfci. This problem will be addressed in thenext Section 6.
Until now, the hfci obviously depends on the number of activated sensors and their elapsedtime. As is known from Section 3, the sensors are assigned to ADL a priori. From this assignment,the parameter Ga is equally distributed. For example, the sensor Fridge is assigned to six differentADL eating, preparing breakfast/dinner/lunch, drinking, have a snack and storing groceries. Each Ga
is 0.167. If the Fridge sensor turns “on”, each assigned ADL has the same probability of 0.167to be the detected ADL. However, this assignment is static and can differ from person to person.A distribution function of how much a sensor refers to an assigned ADL is needed. This is explainedin the next section.
6. Sensor Probability Distribution Function
Each sensor was assigned to the logical corresponding ADL during the initial phase. For the fridgeexample in Section 5.2, an equal probability distribution would refer to each ADL with a probability ofGa = 0.167. This is too static and needs to be individualized, because the Ga distribution is obviouslydifferent for each human. Without the individualization, the whole ADL-detection would be like amajority vote where the ADL wins for which the most sensor events were assigned. To avoid this,the sensor probability distribution function (spdf) is trained, which states how strong a sensor eventrefers to one ADL. For example: there are three sensor events assigned to ADL “preparing food” andto the ADL “take a drink”. The sensor events may be: fridge opened, cupboard opened, water tapused. The spdf learned may result in the spdf assignment between sensor event and ADL as follows:
• fridge opened: ADL “take a drink” = 0.3 and ADL “prepare food” = 0.6• cupboard opened: ADL “take a drink” = 0.6 and ADL “prepare food” = 0.2• water tap used: ADL “take a drink” = 0.4 and ADL “prepare food” = 0.3
Technologies 2017, 5, 78 9 of 17
This assignment would sum up for the ADL “take a drink” (0.3 + 0.6 + 0.4) to a total of 1.3 and forthe ADL “prepare food” (0.6 + 0.2 + 0.3) to a total of 1.1. With such a calculation, it is also possible thatthe minority of sensor events can win. It all depends on the learned spdf.
To calculate the spdf, the information from previous sections is needed:
• structurally important parts of the MM representing strong human habits (Section 3),• structurally significant GS defining the influence of a human habit (Section 4),• sorted list of the area underneath each hfci; representing an ADL ranking (Section 5).
First, the hfci for each structure is calculated. Then, the area underneath is calculated, which leadsto a list of ranked ADL (LdomADL) where the first element is the most dominant, which is the mostprobable executed ADL. This list of ranked ADL also includes parallel executed ADL. The detection ofparallel ADL is explained later in Section 7.
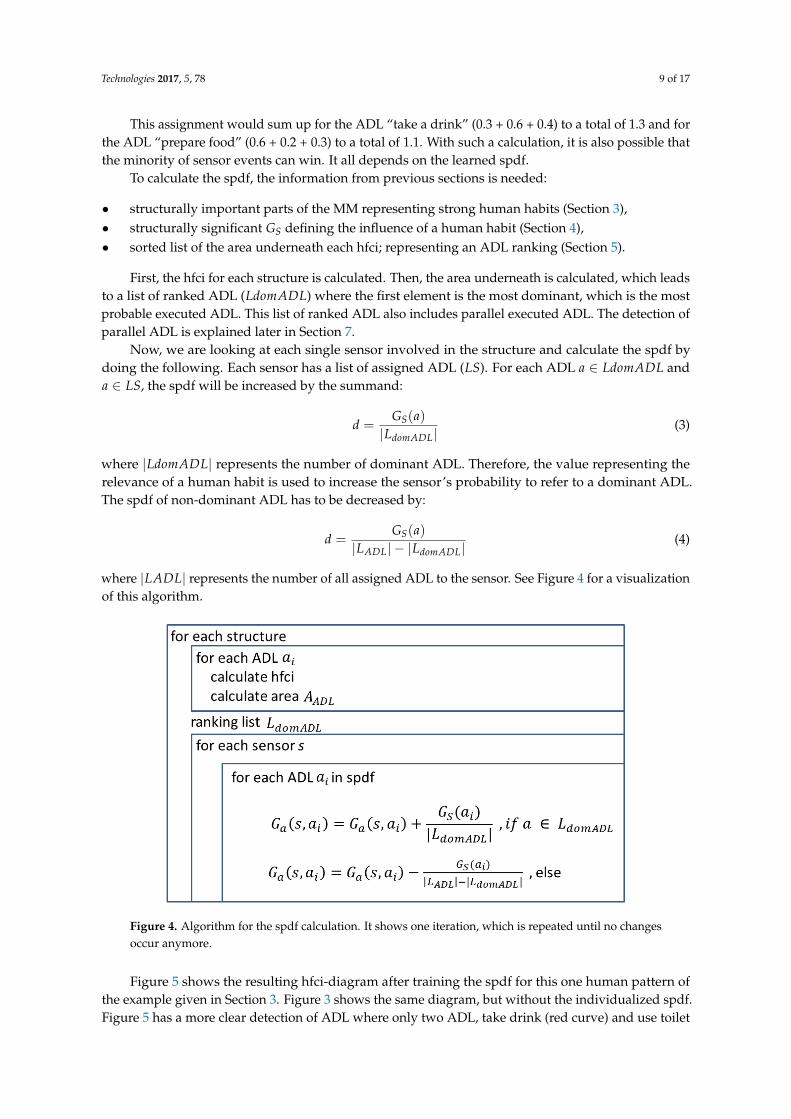
Now, we are looking at each single sensor involved in the structure and calculate the spdf bydoing the following. Each sensor has a list of assigned ADL (LS). For each ADL a ∈ LdomADL anda ∈ LS, the spdf will be increased by the summand:
d =GS(a)|LdomADL|
(3)
where |LdomADL| represents the number of dominant ADL. Therefore, the value representing therelevance of a human habit is used to increase the sensor’s probability to refer to a dominant ADL.The spdf of non-dominant ADL has to be decreased by:
d =GS(a)
|LADL| − |LdomADL|(4)
where |LADL| represents the number of all assigned ADL to the sensor. See Figure 4 for a visualizationof this algorithm.
Technologies 2017, 5, 76 9 of 17
• structurally important parts of the MM representing strong human habits (Section 3), • structurally significant defining the influence of a human habit (Section 4), • sorted list of the area underneath each hfci; representing an ADL ranking (Section 5).
First, the hfci for each structure is calculated. Then, the area underneath is calculated, which leads to a list of ranked ADL ( ) where the first element is the most dominant, which is the most probable executed ADL. This list of ranked ADL also includes parallel executed ADL. The detection of parallel ADL is explained later in Section 7.
Now, we are looking at each single sensor involved in the structure and calculate the spdf by doing the following. Each sensor has a list of assigned ADL ( ). For each ADL ∈ and ∈ , the spdf will be increased by the summand: = ( )| | (3)
where | | represents the number of dominant ADL. Therefore, the value representing the relevance of a human habit is used to increase the sensor’s probability to refer to a dominant ADL. The spdf of non-dominant ADL has to be decreased by: = ( )| | − | | (4)
where | | represents the number of all assigned ADL to the sensor. See Figure 4 for a visualization of this algorithm.
Figure 4. Algorithm for the spdf calculation. It shows one iteration, which is repeated until no changes occur anymore.
Figure 5 shows the resulting hfci-diagram after training the spdf for this one human pattern of the example given in Section 3. Figure 3 shows the same diagram, but without the individualized spdf. Figure 5 has a more clear detection of ADL where only two ADL, take drink (red curve) and use toilet (light green curve), remain to be dominant ADL. It is now possible to deduce the executed ADL more precisely. Training data are much larger than this small example and have a lot more sequences. Each sequence influences the spdf anew until a stable spdf is reached.
With the individualization of the spdf, the training phase is completed. Each sensor installed in the private household is now assigned to a list of ADL with an individualized probability expressing the bonding of a sensor to an ADL. The next section explains how the spdf is used to detect ADL.
Figure 4. Algorithm for the spdf calculation. It shows one iteration, which is repeated until no changesoccur anymore.
Figure 5 shows the resulting hfci-diagram after training the spdf for this one human pattern ofthe example given in Section 3. Figure 3 shows the same diagram, but without the individualized spdf.Figure 5 has a more clear detection of ADL where only two ADL, take drink (red curve) and use toilet
Technologies 2017, 5, 78 10 of 17
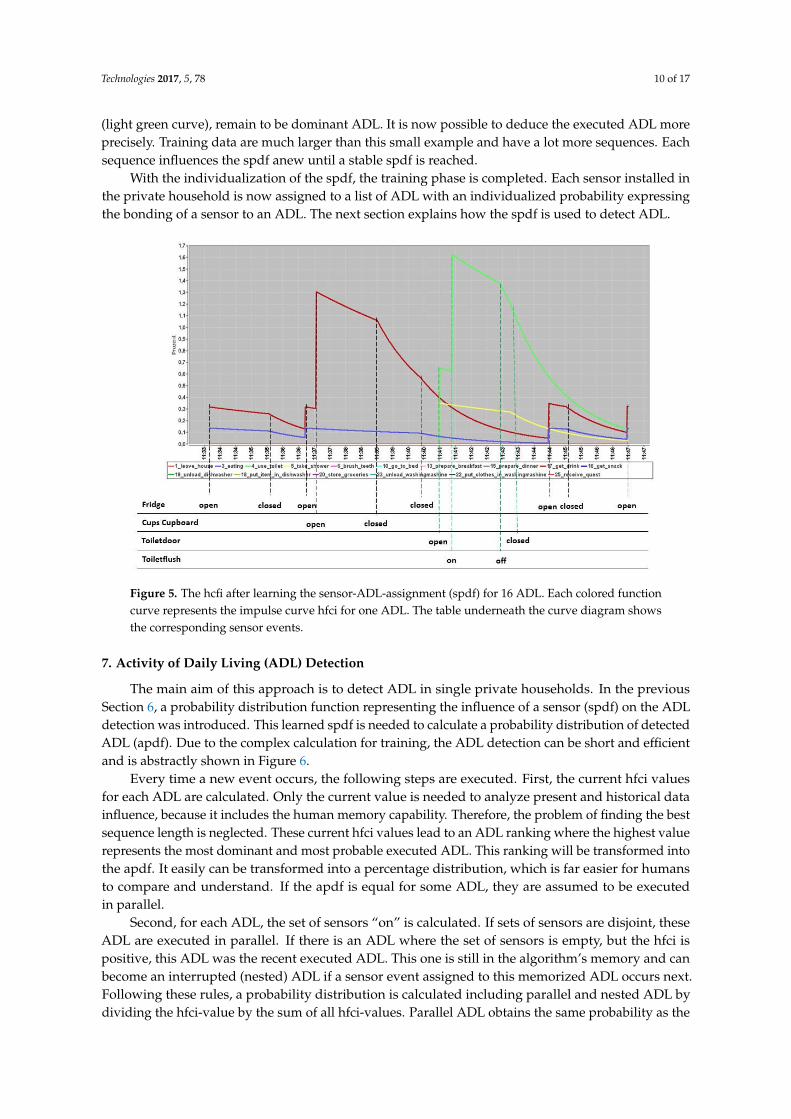
(light green curve), remain to be dominant ADL. It is now possible to deduce the executed ADL moreprecisely. Training data are much larger than this small example and have a lot more sequences. Eachsequence influences the spdf anew until a stable spdf is reached.
With the individualization of the spdf, the training phase is completed. Each sensor installed inthe private household is now assigned to a list of ADL with an individualized probability expressingthe bonding of a sensor to an ADL. The next section explains how the spdf is used to detect ADL.Technologies 2017, 5, 76 10 of 17
Figure 5. The hcfi after learning the sensor-ADL-assignment (spdf) for 16 ADL. Each colored function curve represents the impulse curve hfci for one ADL. The table underneath the curve diagram shows the corresponding sensor events.
7. Activity of Daily Living (ADL) Detection
The main aim of this approach is to detect ADL in single private households. In the previous Section 6, a probability distribution function representing the influence of a sensor (spdf) on the ADL detection was introduced. This learned spdf is needed to calculate a probability distribution of detected ADL (apdf). Due to the complex calculation for training, the ADL detection can be short and efficient and is abstractly shown in Figure 6.
Every time a new event occurs, the following steps are executed. First, the current hfci values for each ADL are calculated. Only the current value is needed to analyze present and historical data influence, because it includes the human memory capability. Therefore, the problem of finding the best sequence length is neglected. These current hfci values lead to an ADL ranking where the highest value represents the most dominant and most probable executed ADL. This ranking will be transformed into the apdf. It easily can be transformed into a percentage distribution, which is far easier for humans to compare and understand. If the apdf is equal for some ADL, they are assumed to be executed in parallel.
Second, for each ADL, the set of sensors “on” is calculated. If sets of sensors are disjoint, these ADL are executed in parallel. If there is an ADL where the set of sensors is empty, but the hfci is positive, this ADL was the recent executed ADL. This one is still in the algorithm’s memory and can become an interrupted (nested) ADL if a sensor event assigned to this memorized ADL occurs next. Following these rules, a probability distribution is calculated including parallel and nested ADL by dividing the hfci-value by the sum of all hfci-values. Parallel ADL obtains the same probability as the ADL where parallelism was detected. If two ADL have a very similar probability, then two cases are possible: first, these ADL could be interpreted as parallel or, second, it is not possible for the algorithm to decide more precisely which of the two ADL is the most dominant, and additional information may be needed.
Figure 5. The hcfi after learning the sensor-ADL-assignment (spdf) for 16 ADL. Each colored functioncurve represents the impulse curve hfci for one ADL. The table underneath the curve diagram showsthe corresponding sensor events.
7. Activity of Daily Living (ADL) Detection
The main aim of this approach is to detect ADL in single private households. In the previousSection 6, a probability distribution function representing the influence of a sensor (spdf) on the ADLdetection was introduced. This learned spdf is needed to calculate a probability distribution of detectedADL (apdf). Due to the complex calculation for training, the ADL detection can be short and efficientand is abstractly shown in Figure 6.
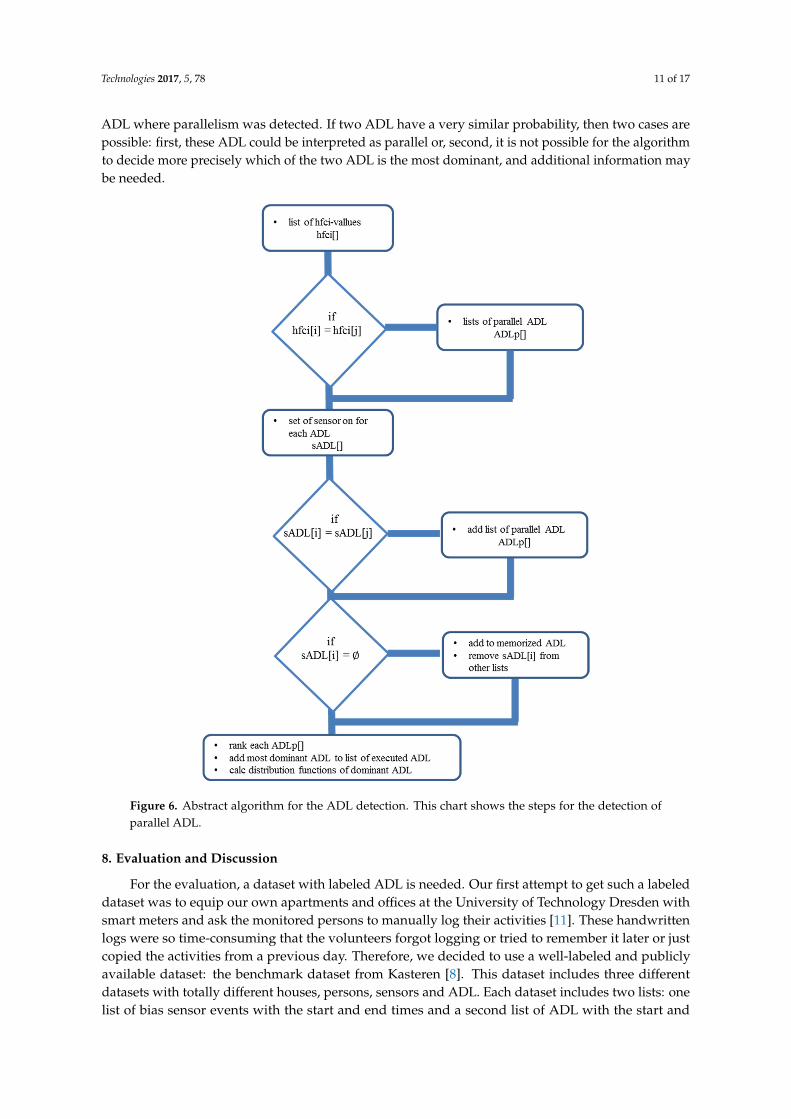
Every time a new event occurs, the following steps are executed. First, the current hfci valuesfor each ADL are calculated. Only the current value is needed to analyze present and historical datainfluence, because it includes the human memory capability. Therefore, the problem of finding the bestsequence length is neglected. These current hfci values lead to an ADL ranking where the highest valuerepresents the most dominant and most probable executed ADL. This ranking will be transformed intothe apdf. It easily can be transformed into a percentage distribution, which is far easier for humansto compare and understand. If the apdf is equal for some ADL, they are assumed to be executedin parallel.
Second, for each ADL, the set of sensors “on” is calculated. If sets of sensors are disjoint, theseADL are executed in parallel. If there is an ADL where the set of sensors is empty, but the hfci ispositive, this ADL was the recent executed ADL. This one is still in the algorithm’s memory and canbecome an interrupted (nested) ADL if a sensor event assigned to this memorized ADL occurs next.Following these rules, a probability distribution is calculated including parallel and nested ADL bydividing the hfci-value by the sum of all hfci-values. Parallel ADL obtains the same probability as the
Technologies 2017, 5, 78 11 of 17
ADL where parallelism was detected. If two ADL have a very similar probability, then two cases arepossible: first, these ADL could be interpreted as parallel or, second, it is not possible for the algorithmto decide more precisely which of the two ADL is the most dominant, and additional information maybe needed.Technologies 2017, 5, 76 11 of 17
Figure 6. Abstract algorithm for the ADL detection. This chart shows the steps for the detection of parallel ADL.
8. Evaluation and Discussion
For the evaluation, a dataset with labeled ADL is needed. Our first attempt to get such a labeled dataset was to equip our own apartments and offices at the University of Technology Dresden with smart meters and ask the monitored persons to manually log their activities [11]. These handwritten logs were so time-consuming that the volunteers forgot logging or tried to remember it later or just copied the activities from a previous day. Therefore, we decided to use a well-labeled and publicly available dataset: the benchmark dataset from Kasteren [8]. This dataset includes three different datasets with totally different houses, persons, sensors and ADL. Each dataset includes two lists: one list of bias sensor events with the start and end times and a second list of ADL with the start and end times. The characteristics of the chosen datasets are shown in Table 2. Houses B and C are more complicated for HAR-detection, as they have over 300,000 events each and more sensors and activities to detect.
Figure 6. Abstract algorithm for the ADL detection. This chart shows the steps for the detection ofparallel ADL.
8. Evaluation and Discussion
For the evaluation, a dataset with labeled ADL is needed. Our first attempt to get such a labeleddataset was to equip our own apartments and offices at the University of Technology Dresden withsmart meters and ask the monitored persons to manually log their activities [11]. These handwrittenlogs were so time-consuming that the volunteers forgot logging or tried to remember it later or justcopied the activities from a previous day. Therefore, we decided to use a well-labeled and publiclyavailable dataset: the benchmark dataset from Kasteren [8]. This dataset includes three differentdatasets with totally different houses, persons, sensors and ADL. Each dataset includes two lists: onelist of bias sensor events with the start and end times and a second list of ADL with the start and
Technologies 2017, 5, 78 12 of 17
end times. The characteristics of the chosen datasets are shown in Table 2. Houses B and C are morecomplicated for HAR-detection, as they have over 300,000 events each and more sensors and activitiesto detect.
Table 2. Characteristics of the publicly available dataset that was used to evaluate the new approach ofADL detection. Three different datasets are used: Houses A, B and C.
Item House A House B House C
Age 26 28 57Gender Male Male MaleSetting Apartment Apartment HouseRooms 3 (+2 Bathrooms, +1 Kitchen) 2 (+1 Bathroom, +1 Kitchen) 6 (+2 Bathrooms, +1 Kitchen)
Duration 25 days 14 days 19 daysSensors 14 23 21
Activities 16 13 16
Kasteren uses various kinds of sensors:
• reed switches to measure whether doors and cupboards are open or closed• pressure mats to measure sitting on a couch or lying in bed• mercury contacts to detect the movement of objects (e.g., drawers)• passive infrared (PIR) to detect motion in specific areas• float sensors to measure the toilet being flushed.
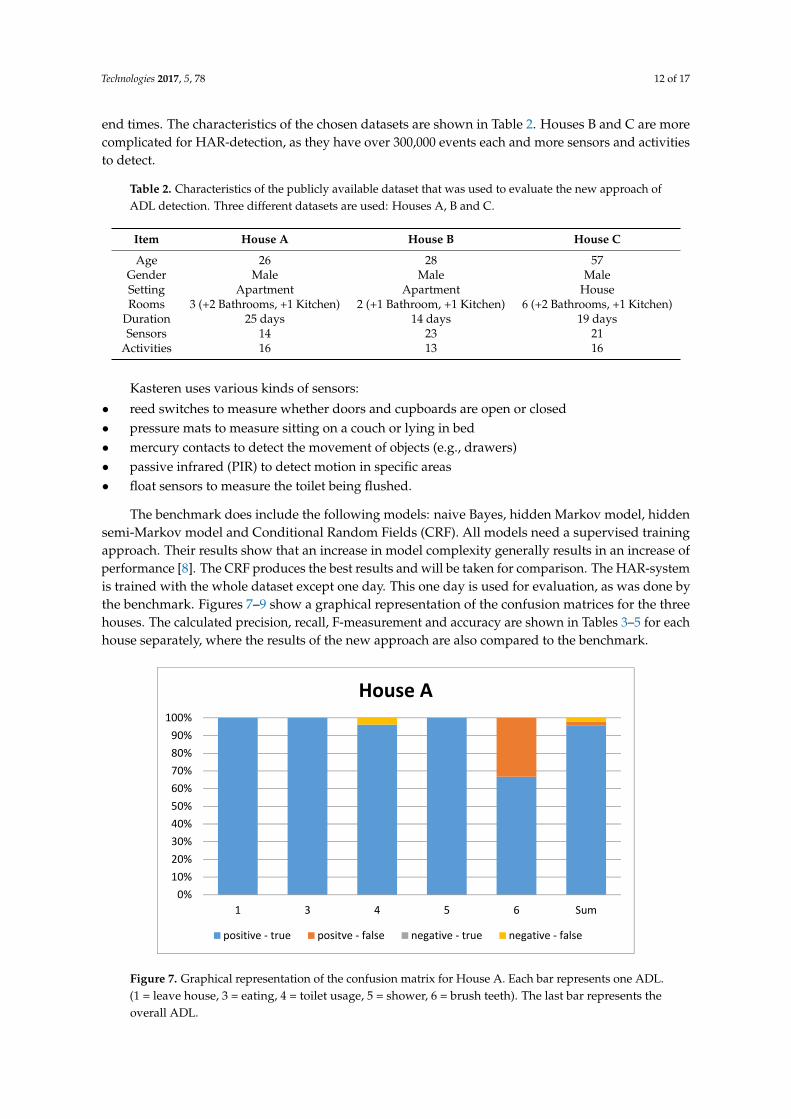
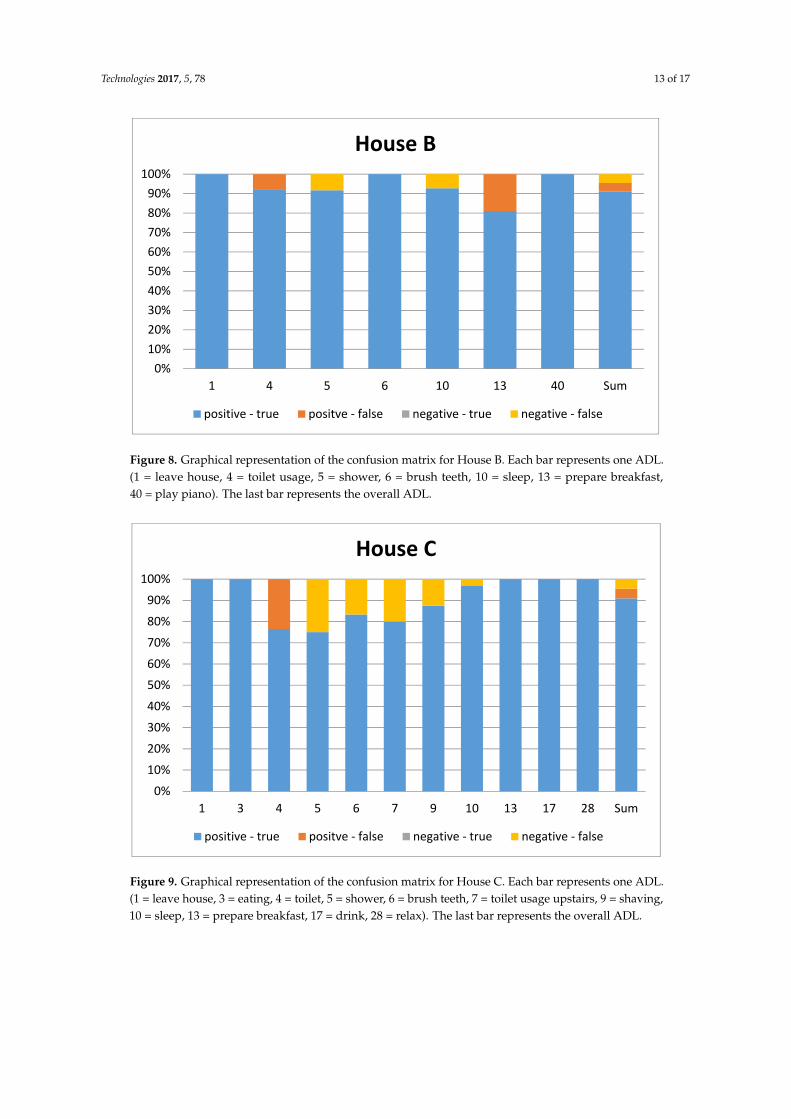
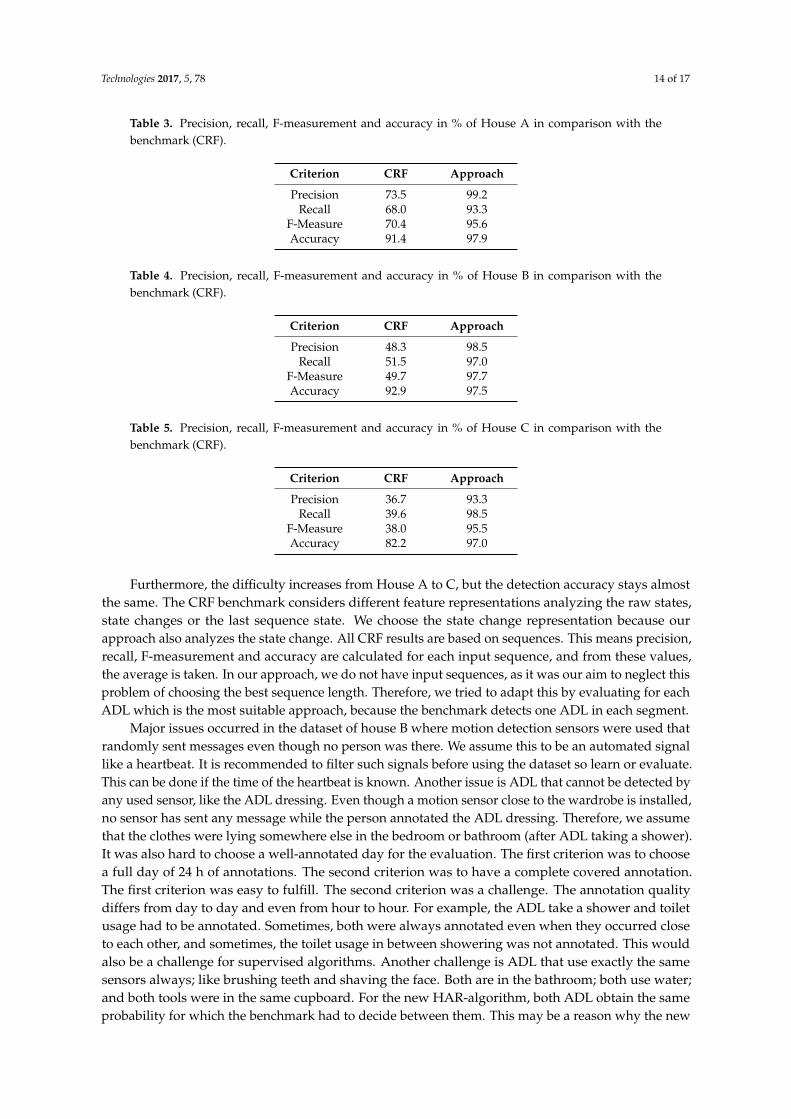
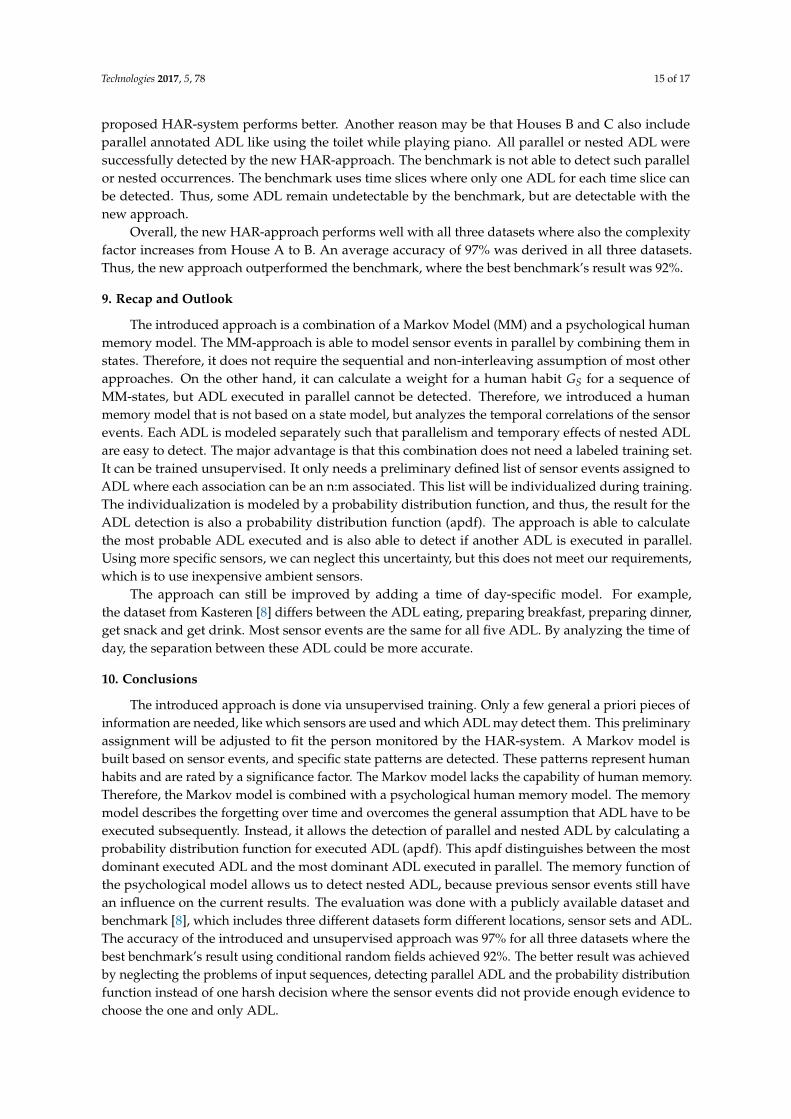
The benchmark does include the following models: naive Bayes, hidden Markov model, hiddensemi-Markov model and Conditional Random Fields (CRF). All models need a supervised trainingapproach. Their results show that an increase in model complexity generally results in an increase ofperformance [8]. The CRF produces the best results and will be taken for comparison. The HAR-systemis trained with the whole dataset except one day. This one day is used for evaluation, as was done bythe benchmark. Figures 7–9 show a graphical representation of the confusion matrices for the threehouses. The calculated precision, recall, F-measurement and accuracy are shown in Tables 3–5 for eachhouse separately, where the results of the new approach are also compared to the benchmark.
Technologies 2017, 5, 76 12 of 17
Table 2. Characteristics of the publicly available dataset that was used to evaluate the new approach of ADL detection. Three different datasets are used: Houses A, B and C.
Item House A House B House C Age 26 28 57
Gender Male Male Male Setting Apartment Apartment House Rooms 3 (+2 Bathrooms, +1 Kitchen) 2 (+1 Bathroom, +1 Kitchen) 6 (+2 Bathrooms, +1 Kitchen)
Duration 25 days 14 days 19 days Sensors 14 23 21
Activities 16 13 16
Kasteren uses various kinds of sensors:
• reed switches to measure whether doors and cupboards are open or closed • pressure mats to measure sitting on a couch or lying in bed • mercury contacts to detect the movement of objects (e.g., drawers) • passive infrared (PIR) to detect motion in specific areas • float sensors to measure the toilet being flushed.
The benchmark does include the following models: naive Bayes, hidden Markov model, hidden semi-Markov model and Conditional Random Fields (CRF). All models need a supervised training approach. Their results show that an increase in model complexity generally results in an increase of performance [8]. The CRF produces the best results and will be taken for comparison. The HAR-system is trained with the whole dataset except one day. This one day is used for evaluation, as was done by the benchmark. Figures 7–9 show a graphical representation of the confusion matrices for the three houses. The calculated precision, recall, F-measurement and accuracy are shown in Tables 3–5 for each house separately, where the results of the new approach are also compared to the benchmark.
Figure 7. Graphical representation of the confusion matrix for House A. Each bar represents one ADL. (1 = leave house, 3 = eating, 4 = toilet usage, 5 = shower, 6 = brush teeth). The last bar represents the overall ADL.
0%10%20%30%40%50%60%70%80%90%
100%
1 3 4 5 6 Sum
House A
positive - true positve - false negative - true negative - false
Figure 7. Graphical representation of the confusion matrix for House A. Each bar represents one ADL.(1 = leave house, 3 = eating, 4 = toilet usage, 5 = shower, 6 = brush teeth). The last bar represents theoverall ADL.
Technologies 2017, 5, 78 13 of 17
Technologies 2017, 5, 76 13 of 17
Figure 8. Graphical representation of the confusion matrix for House B. Each bar represents one ADL. (1 = leave house, 4 = toilet usage, 5 = shower, 6 = brush teeth, 10 = sleep, 13 = prepare breakfast, 40 = play piano). The last bar represents the overall ADL.
Figure 9. Graphical representation of the confusion matrix for House C. Each bar represents one ADL. (1 = leave house, 3 = eating, 4 = toilet, 5 = shower, 6 = brush teeth, 7 = toilet usage upstairs, 9 = shaving, 10 = sleep, 13 = prepare breakfast, 17 = drink, 28 = relax). The last bar represents the overall ADL.
Table 3. Precision, recall, F-measurement and accuracy in % of House A in comparison with the benchmark (CRF).
Criterion CRF Approach Precision 73.5 99.2
Recall 68.0 93.3 F-Measure 70.4 95.6 Accuracy 91.4 97.9
0%10%20%30%40%50%60%70%80%90%
100%
1 4 5 6 10 13 40 Sum
House B
positive - true positve - false negative - true negative - false
0%10%20%30%40%50%60%70%80%90%
100%
1 3 4 5 6 7 9 10 13 17 28 Sum
House C
positive - true positve - false negative - true negative - false
Figure 8. Graphical representation of the confusion matrix for House B. Each bar represents one ADL.(1 = leave house, 4 = toilet usage, 5 = shower, 6 = brush teeth, 10 = sleep, 13 = prepare breakfast,40 = play piano). The last bar represents the overall ADL.
Technologies 2017, 5, 76 13 of 17
Figure 8. Graphical representation of the confusion matrix for House B. Each bar represents one ADL. (1 = leave house, 4 = toilet usage, 5 = shower, 6 = brush teeth, 10 = sleep, 13 = prepare breakfast, 40 = play piano). The last bar represents the overall ADL.
Figure 9. Graphical representation of the confusion matrix for House C. Each bar represents one ADL. (1 = leave house, 3 = eating, 4 = toilet, 5 = shower, 6 = brush teeth, 7 = toilet usage upstairs, 9 = shaving, 10 = sleep, 13 = prepare breakfast, 17 = drink, 28 = relax). The last bar represents the overall ADL.
Table 3. Precision, recall, F-measurement and accuracy in % of House A in comparison with the benchmark (CRF).
Criterion CRF Approach Precision 73.5 99.2
Recall 68.0 93.3 F-Measure 70.4 95.6 Accuracy 91.4 97.9
0%10%20%30%40%50%60%70%80%90%
100%
1 4 5 6 10 13 40 Sum
House B
positive - true positve - false negative - true negative - false
0%10%20%30%40%50%60%70%80%90%
100%
1 3 4 5 6 7 9 10 13 17 28 Sum
House C
positive - true positve - false negative - true negative - false
Figure 9. Graphical representation of the confusion matrix for House C. Each bar represents one ADL.(1 = leave house, 3 = eating, 4 = toilet, 5 = shower, 6 = brush teeth, 7 = toilet usage upstairs, 9 = shaving,10 = sleep, 13 = prepare breakfast, 17 = drink, 28 = relax). The last bar represents the overall ADL.
Technologies 2017, 5, 78 14 of 17
Table 3. Precision, recall, F-measurement and accuracy in % of House A in comparison with thebenchmark (CRF).
Criterion CRF Approach
Precision 73.5 99.2Recall 68.0 93.3
F-Measure 70.4 95.6Accuracy 91.4 97.9
Table 4. Precision, recall, F-measurement and accuracy in % of House B in comparison with thebenchmark (CRF).
Criterion CRF Approach
Precision 48.3 98.5Recall 51.5 97.0
F-Measure 49.7 97.7Accuracy 92.9 97.5
Table 5. Precision, recall, F-measurement and accuracy in % of House C in comparison with thebenchmark (CRF).
Criterion CRF Approach
Precision 36.7 93.3Recall 39.6 98.5
F-Measure 38.0 95.5Accuracy 82.2 97.0
Furthermore, the difficulty increases from House A to C, but the detection accuracy stays almostthe same. The CRF benchmark considers different feature representations analyzing the raw states,state changes or the last sequence state. We choose the state change representation because ourapproach also analyzes the state change. All CRF results are based on sequences. This means precision,recall, F-measurement and accuracy are calculated for each input sequence, and from these values,the average is taken. In our approach, we do not have input sequences, as it was our aim to neglect thisproblem of choosing the best sequence length. Therefore, we tried to adapt this by evaluating for eachADL which is the most suitable approach, because the benchmark detects one ADL in each segment.
Major issues occurred in the dataset of house B where motion detection sensors were used thatrandomly sent messages even though no person was there. We assume this to be an automated signallike a heartbeat. It is recommended to filter such signals before using the dataset so learn or evaluate.This can be done if the time of the heartbeat is known. Another issue is ADL that cannot be detected byany used sensor, like the ADL dressing. Even though a motion sensor close to the wardrobe is installed,no sensor has sent any message while the person annotated the ADL dressing. Therefore, we assumethat the clothes were lying somewhere else in the bedroom or bathroom (after ADL taking a shower).It was also hard to choose a well-annotated day for the evaluation. The first criterion was to choosea full day of 24 h of annotations. The second criterion was to have a complete covered annotation.The first criterion was easy to fulfill. The second criterion was a challenge. The annotation qualitydiffers from day to day and even from hour to hour. For example, the ADL take a shower and toiletusage had to be annotated. Sometimes, both were always annotated even when they occurred closeto each other, and sometimes, the toilet usage in between showering was not annotated. This wouldalso be a challenge for supervised algorithms. Another challenge is ADL that use exactly the samesensors always; like brushing teeth and shaving the face. Both are in the bathroom; both use water;and both tools were in the same cupboard. For the new HAR-algorithm, both ADL obtain the sameprobability for which the benchmark had to decide between them. This may be a reason why the new
Technologies 2017, 5, 78 15 of 17
proposed HAR-system performs better. Another reason may be that Houses B and C also includeparallel annotated ADL like using the toilet while playing piano. All parallel or nested ADL weresuccessfully detected by the new HAR-approach. The benchmark is not able to detect such parallelor nested occurrences. The benchmark uses time slices where only one ADL for each time slice canbe detected. Thus, some ADL remain undetectable by the benchmark, but are detectable with thenew approach.
Overall, the new HAR-approach performs well with all three datasets where also the complexityfactor increases from House A to B. An average accuracy of 97% was derived in all three datasets.Thus, the new approach outperformed the benchmark, where the best benchmark’s result was 92%.
9. Recap and Outlook
The introduced approach is a combination of a Markov Model (MM) and a psychological humanmemory model. The MM-approach is able to model sensor events in parallel by combining them instates. Therefore, it does not require the sequential and non-interleaving assumption of most otherapproaches. On the other hand, it can calculate a weight for a human habit GS for a sequence ofMM-states, but ADL executed in parallel cannot be detected. Therefore, we introduced a humanmemory model that is not based on a state model, but analyzes the temporal correlations of the sensorevents. Each ADL is modeled separately such that parallelism and temporary effects of nested ADLare easy to detect. The major advantage is that this combination does not need a labeled training set.It can be trained unsupervised. It only needs a preliminary defined list of sensor events assigned toADL where each association can be an n:m associated. This list will be individualized during training.The individualization is modeled by a probability distribution function, and thus, the result for theADL detection is also a probability distribution function (apdf). The approach is able to calculatethe most probable ADL executed and is also able to detect if another ADL is executed in parallel.Using more specific sensors, we can neglect this uncertainty, but this does not meet our requirements,which is to use inexpensive ambient sensors.
The approach can still be improved by adding a time of day-specific model. For example,the dataset from Kasteren [8] differs between the ADL eating, preparing breakfast, preparing dinner,get snack and get drink. Most sensor events are the same for all five ADL. By analyzing the time ofday, the separation between these ADL could be more accurate.
10. Conclusions
The introduced approach is done via unsupervised training. Only a few general a priori pieces ofinformation are needed, like which sensors are used and which ADL may detect them. This preliminaryassignment will be adjusted to fit the person monitored by the HAR-system. A Markov model isbuilt based on sensor events, and specific state patterns are detected. These patterns represent humanhabits and are rated by a significance factor. The Markov model lacks the capability of human memory.Therefore, the Markov model is combined with a psychological human memory model. The memorymodel describes the forgetting over time and overcomes the general assumption that ADL have to beexecuted subsequently. Instead, it allows the detection of parallel and nested ADL by calculating aprobability distribution function for executed ADL (apdf). This apdf distinguishes between the mostdominant executed ADL and the most dominant ADL executed in parallel. The memory function ofthe psychological model allows us to detect nested ADL, because previous sensor events still havean influence on the current results. The evaluation was done with a publicly available dataset andbenchmark [8], which includes three different datasets form different locations, sensor sets and ADL.The accuracy of the introduced and unsupervised approach was 97% for all three datasets where thebest benchmark’s result using conditional random fields achieved 92%. The better result was achievedby neglecting the problems of input sequences, detecting parallel ADL and the probability distributionfunction instead of one harsh decision where the sensor events did not provide enough evidence tochoose the one and only ADL.
Technologies 2017, 5, 78 16 of 17
Acknowledgments: This research was part of the context of the European TRIBUTE project (FP7 Contract No.NMP2-LA-2013-608790) and the German Project AUTAGEF: Automatische Assistenz in Gefahrensituationen(Project No. 16SV4012).
Author Contributions: Jana Clement has done the scientific research, conceived of, designed and performed theexperiments, analyzed the data and wrote the paper. Klaus Kabitzsch contributed reagents/materials/analysistools/sensors and provided the laboratories. All authors have read and approved the final manuscript.
Conflicts of Interest: The authors declare no conflict of interest. The founding sponsors had no role in the designof the study; in the collection, analyses or interpretation of data; in the writing of the manuscript; nor in thedecision to publish the results.
References
1. Clement, J.; Kabitzsch, K. A Combined Stochastic Memory Model for ADL Detection. In Proceedings of the10th International Conference on PErvasive Technologies Related to Assistive Environments (PETRA 17),Rhodos, Greece, 21–23 June 2017.
2. Harrefors, C.; Saevenstedt, S.; Axelsson, K. Elderly people’s perceptions of how they want to be cared for:An interview study with healthy elderly couples in Northern Sweden. Scand. J. Caring Sci. 2009, 23, 353–360.[CrossRef] [PubMed]
3. Lee, V.M.S.; Wong, T.W.; Lau, C.C. Home accidents in elderly patients presenting to an emergency department.J. Accid. Emerg. Nurs. 1999, 7, 96–102. [CrossRef]
4. Deutsches Rotes Kreuz. Every Third Mission Is No Emergency. Press Release of a German EmergencyAgency. 2014. Available online: https://www.drk.de/presse/pressemitteilungen/meldung/drk-jeder-dritte-einsatz-ist-kein-notfall/ (accessed on 28 November 2017).
5. Ahrens, M. Home Smoke Alarms: The Data as Context for Decision. J. Fire Technol. 2008, 44, 313–327.[CrossRef]
6. Yared, R.; Abdulrazak, B.; Tessier, T.; Mabilleau, P. Cooking risk analysis to enhance safety of elderly peoplein smart kitchen. In Proceedings of the 8th PErvasive Technologies Related to Assistive Environments(PETRA ’15), Corfu, Greece, 1–3 July 2015. [CrossRef]
7. Vennedey, V.; Danner, M.; Evers, S.; Fauser, S.; Stock, S.; Dirksen, C.; Hiligsmann, M. Using qualitativeresearch to facilitate the interpretation of quantitative results from a discrete choice experiment: Insightsfrom a survey in elderly ophthalmologic patients. Patients Preference Adherence 2016, 10, 993–1002. [CrossRef][PubMed]
8. Van Kasteren, T.; Englebienne, G.; Kroese, B. Human Activity Recognition from Wireless Sensor NetworkData: Benchmark and Software. Activ. Recognit. Pervasive Intell. Environ. 2011, 4, 165–186.
9. Alcala, J.; Urena, J.; Hernandez, A. Activity Supervision Tool using Non-Intrusive Load MonitoringSystems. In Proceedings of the 20th Conference on Emerging Technologies & Factory Automation (ETFA),Luxembourg, UK, 8–11 September 2015. [CrossRef]
10. Alemdar, H.; Ertan, H.; Incel, O.; Ersoy, C. ARAS human activity datasets in multiple homes with multipleresidents. In Proceedings of the 7th Pervasive Healt, Venice, Italy, 5–8 May 2013; pp. 232–235. [CrossRef]
11. Schmidt, F.; Kabitzsch, K.; Clement, J.; Hildebrandt, D.; Richter, K.-P.; Mueller, G.; Hirschfeld, D. AutomatedAssistance in Emergency Situations the AUTAGEF Project and its Business Model. In Proceedings of the 4thGerman AAL-Congress, Berlin, Germany, 25–26 January 2011.
12. European Project TRIBUTE (FP7 Contract Number NMP2-LA-2013-608790). Available online: http://www.tribute-fp7.eu/ (accessed on 28 November 2017).
13. Du, L.; Yang, Y.; He, D.; Harley, R.G.; Habetler, T.G.; Lu, B. Support Vector Machine Based Methods forNon-intrusive Identification of Miscellaneous Electric Loads. In Proceedings of the 38th Annual Conferenceof IEEE Industrial Electronics (IECON 2012), Montreal, QC, Canada, 25–28 October 2012. [CrossRef]
14. Tapia, E.; Intille, S.; Larson, K. Activity Recognition in the Home Using Simple and UbiquitousSensors. In Proceedings of the Second International Conference PERVASIVE 2004, Linz/Vienna, Austria,21–23 April 2004; pp. 158–175.
15. Noury, N.; Quach, K.A.; Berenguer, M.; Teyssier, H.; Bouzid, M.-J.; Goldstein, L.; Giordani, M. Remote FollowUp of Health Through the Monitoring of Electrical Activities on the Residential Power Line PreliminaryResults of an Experimentation. In Proceedings of the 11th International Conference on e-Health Networking,Application & Services (Healthcom 2009), Sydney, Australia, 16–18 December 2009; pp. 9–13. [CrossRef]
Technologies 2017, 5, 78 17 of 17
16. Benmansour, A.; Bouchachia, A.; Feham, M. Human Activity Recognition in Pervasive Single Resident SmartHomes: State of Art. In Proceedings of the 12th International Symposium on Programming and Systems(ISPS 2015), Algiers, Algeria, 28–30 April 2015. [CrossRef]
17. Clement, J.; Ploennigs, J.; Kabitzsch, K. Enhanced Inactivity Diagram to Meet Elderly Needs. In Proceedingsof the Partnerships for social innovation in Europe (AAL-Forum), Italy, Lecce, 26–28 September 2011;pp. 217–225.
18. Noury, N.; Berenguer, M.; Teyssier, M.; Bouzid, M.-J.; Giordani, M. Building an Index of Activity ofInhabitants from Their Activity on the Residential Electrical Power Line. IEEE Trans. Inf. Technol. Biomed.2011, 15, 758–766. [CrossRef] [PubMed]
19. Yala, N.; Fergani, B.; Fleury, A. Feature Extraction for Human Activity Recognition on Streaming Data.In Proceedings of the Inist Presentation at LIBER 2015 (INIST), Madrid, Spain, 2–4 September 2015. [CrossRef]
20. Ye, C.; Xia, Y.; Sun, Y.; Wang, S.; Yan, H.; Mehmood, R. ERAR: An Event-driven Approach for Real-timeActivity Recognition. In Proceedings of the International Conference on Identification, Information &Knowledge in the Internet of Things (IIKI), BeiJing, China, 22–23 October 2015. [CrossRef]
21. Fernandez-Llata, C.; Garcia-Gomez, J.M.; Vicente, J.; Naranjo, J.C.; Robles, M.; Benedi, J.M.; Traver, V.Behavior Patterns Detection for Persuasive Design in Nursing Homes to Help Dementia Patients.In Proceedings of the 33rd Annual International Conference of the IEEE Engineering in Medicine andBiology Society (EMBC 2011), Boston, MA, USA, 30 August–3 September 2011. [CrossRef]
22. Ye, J.; Stevenson, G.; Dobson, S. USMART: An unsupervised semantic mining activity recognition technique.ACM Trans. Int. Intell. Syst. 2015, 4, 16. [CrossRef]
23. Clement, J.; Ploennigs, J.; Kabitzsch, K. Smart Meter: Detect and Individualize ADL. In Proceedings of the5th Deutscher AAL-Kongress 2012, Berlin, Germany, 21–22 January 2012; pp. 107–122.
24. Ebbinghaus, H. Ueber Das Gedaechtnis. Untersuchungen Zur Experimentellen Psychologie; WissenschaftlicheBuchgesellschaft: Darmstadt, Germany, 1992; ISBN 9783534052554.
© 2017 by the authors. Licensee MDPI, Basel, Switzerland. This article is an open accessarticle distributed under the terms and conditions of the Creative Commons Attribution(CC BY) license (http://creativecommons.org/licenses/by/4.0/).
Related Documents