arXiv:astro-ph/0309814v3 10 Oct 2003 Mon. Not. R. Astron. Soc. 000, 000–000 (2003) Printed 2 February 2008 (MN L A T E X style file v2.2) A search for distant radio galaxies from SUMSS and NVSS: I. Sample definition, radio and K -band imaging ⋆ . Carlos De Breuck 1 †, Richard W. Hunstead 2 , Elaine M. Sadler 2 , Brigitte Rocca– Volmerange 1 , Ilana Klamer 2 1 Institut d’Astrophysique de Paris, 98bis Boulevard Arago, 75014 Paris, France. 2 School of Physics, University of Sydney, NSW 2006, Australia. 2 February 2008 ABSTRACT We present the first results from a pilot study to search for distant radio galaxies in the southern hemisphere (δ< -32 ◦ ). Within a 360 deg 2 region of sky, we define a sample of 76 ultra–steep spectrum (USS) radio sources from the 843 MHz Sydney University Molonglo Sky Survey (SUMSS) and 1.4 GHz NRAO VLA Sky Survey (NVSS) radio surveys with α 1400 843 < -1.3 and S 1400 >15 mJy. We observed 71 sources without bright optical or near-infrared counterparts at 1.385 GHz with the ATCA, providing ∼5 ′′ resolution images and sub-arcsec positional accuracy. To identify their host galaxies, we obtained near-IR K-band images with IRIS2 at the AAT and SofI at the NTT. We identify 92% of the USS sources down to K ∼ 20.5. The SUMSS– NVSS USS sources have a surface density more than 4 times higher than USS sources selected at lower frequencies. This is due to the higher effective selection frequency, and the well-matched resolutions of both surveys constructed using the same source fitting algorithm. The scattering of α> -1.3 sources into the USS sample due to spectral index uncertainties can account for only 35% of the observed USS sources. Since our sample appears to contain a similar fraction of very distant (z> 3) galaxies, selecting USS sources from SUMSS–NVSS should allow us to identify large numbers of massive galaxies at high redshift. Key words: surveys – radio continuum: general – radio continuum: galaxies – galax- ies: active 1 INTRODUCTION High redshift radio galaxies (HzRGs) provide an ideal op- portunity to study the early universe and gain insights into the formation and evolution of massive galaxies. The well known Hubble K − z relation (e.g. Lilly et al. 1984; De Breuck et al. 2002) establishes that at z 1, radio galax- ies can be used to trace the most massive star-forming pop- ulations. Thanks to the large sky coverage of present-day radio surveys, we can find the rare sources 2 magni- tudes more luminous than similar redshift sources found in optical/near-IR surveys. Together with the evolutionary path tracing HzRGs to low-redshift (z ≤ 1) elliptical galax- ies (e.g. Franceschini, Vercellone, & Fabian 1998; Sadler ⋆ Based on observations obtained with the Australia Telescope Compact Array, the Anglo-Australian Telescope, and the Euro- pean Southern Observatory, La Silla, Chile (Program 70.A-0514) † Current address: European Southern Observatory, Karl Schwarzschild Straße 2, D-85748 Garching, Germany 2003; Dunlop 2003) and the imperative that radio galaxies harbour central supermassive black holes (SMBHs), HzRGs are excellent laboratories for studying the earliest, most massive stellar systems. HzRGs show diffuse morphologies with strong evidence supporting high star-formation rates (De Breuck et al. 2003; van Breugel et al. 1999b), starkly different to their low- redshift counterparts which are massive elliptical galaxies with little or no star formation. However, with only 26 HzRGs known at z > 3, the statistics are still unreli- able. Addressing this issue is a major concern in our study. The search for HzRGs will also constrain formation mecha- nisms for SMBHs which are still very uncertain (e.g. Loeb 1993; Dunlop et al. 2003). However, a galaxy with a SMBH at z > 5 already implies that if its SMBH is not pri- mordial, then it must form within < 1.3 Gyr (for Ωm = 0.27, ΩΛ =0.73,H0 = 71 km s −1 Mpc −1 ; Spergel et al. 2003; Tonry et al. 2003). Only one HzRG is known at z> 5 (van Breugel et al. 1999a), and it is unclear whether HzRGs c 2003 RAS

Welcome message from author
This document is posted to help you gain knowledge. Please leave a comment to let me know what you think about it! Share it to your friends and learn new things together.
Transcript

arX
iv:a
stro
-ph/
0309
814v
3 1
0 O
ct 2
003
Mon. Not. R. Astron. Soc. 000, 000–000 (2003) Printed 2 February 2008 (MN LATEX style file v2.2)
A search for distant radio galaxies from SUMSS and
NVSS: I. Sample definition, radio and K−band imaging⋆.
Carlos De Breuck1†, Richard W. Hunstead2, Elaine M. Sadler2, Brigitte Rocca–
Volmerange1, Ilana Klamer2
1 Institut d’Astrophysique de Paris, 98bis Boulevard Arago, 75014 Paris, France.2 School of Physics, University of Sydney, NSW 2006, Australia.
2 February 2008
ABSTRACT
We present the first results from a pilot study to search for distant radio galaxiesin the southern hemisphere (δ < −32). Within a 360 deg2 region of sky, we definea sample of 76 ultra–steep spectrum (USS) radio sources from the 843 MHz SydneyUniversity Molonglo Sky Survey (SUMSS) and 1.4 GHz NRAO VLA Sky Survey(NVSS) radio surveys with α1400
843< −1.3 and S1400 >15 mJy. We observed 71 sources
without bright optical or near-infrared counterparts at 1.385 GHz with the ATCA,providing ∼5′′ resolution images and sub-arcsec positional accuracy. To identify theirhost galaxies, we obtained near-IR K−band images with IRIS2 at the AAT and SofIat the NTT. We identify 92% of the USS sources down to K ∼ 20.5. The SUMSS–NVSS USS sources have a surface density more than 4 times higher than USS sourcesselected at lower frequencies. This is due to the higher effective selection frequency,and the well-matched resolutions of both surveys constructed using the same sourcefitting algorithm. The scattering of α > −1.3 sources into the USS sample due tospectral index uncertainties can account for only 35% of the observed USS sources.Since our sample appears to contain a similar fraction of very distant (z > 3) galaxies,selecting USS sources from SUMSS–NVSS should allow us to identify large numbersof massive galaxies at high redshift.
Key words: surveys – radio continuum: general – radio continuum: galaxies – galax-ies: active
1 INTRODUCTION
High redshift radio galaxies (HzRGs) provide an ideal op-portunity to study the early universe and gain insightsinto the formation and evolution of massive galaxies. Thewell known Hubble K − z relation (e.g. Lilly et al. 1984;De Breuck et al. 2002) establishes that at z & 1, radio galax-ies can be used to trace the most massive star-forming pop-ulations. Thanks to the large sky coverage of present-dayradio surveys, we can find the rare sources & 2 magni-tudes more luminous than similar redshift sources foundin optical/near-IR surveys. Together with the evolutionarypath tracing HzRGs to low-redshift (z ≤ 1) elliptical galax-ies (e.g. Franceschini, Vercellone, & Fabian 1998; Sadler
⋆ Based on observations obtained with the Australia TelescopeCompact Array, the Anglo-Australian Telescope, and the Euro-pean Southern Observatory, La Silla, Chile (Program 70.A-0514)† Current address: European Southern Observatory, KarlSchwarzschild Straße 2, D-85748 Garching, Germany
2003; Dunlop 2003) and the imperative that radio galaxiesharbour central supermassive black holes (SMBHs), HzRGsare excellent laboratories for studying the earliest, mostmassive stellar systems.
HzRGs show diffuse morphologies with strong evidencesupporting high star-formation rates (De Breuck et al. 2003;van Breugel et al. 1999b), starkly different to their low-redshift counterparts which are massive elliptical galaxieswith little or no star formation. However, with only 26HzRGs known at z > 3, the statistics are still unreli-able. Addressing this issue is a major concern in our study.The search for HzRGs will also constrain formation mecha-nisms for SMBHs which are still very uncertain (e.g. Loeb1993; Dunlop et al. 2003). However, a galaxy with a SMBHat z > 5 already implies that if its SMBH is not pri-mordial, then it must form within < 1.3 Gyr (for Ωm =0.27, ΩΛ = 0.73, H0 = 71 km s−1 Mpc−1; Spergel et al.2003; Tonry et al. 2003). Only one HzRG is known at z > 5(van Breugel et al. 1999a), and it is unclear whether HzRGs
c© 2003 RAS
2 C. De Breuck et al.
exist at earlier times. Clearly, the discovery of more HzRGswill dramatically increase our knowledge of galaxy formationand SMBH formation timescales.
Although the large optical and infrared telescopes whichprobe the distant universe are increasingly concentrated inthe southern hemisphere, the search for HzRGs has until re-cently been limited to the northern hemisphere because of alack of sensitive radio imaging surveys in the south. This hasbeen rectified with near completion of the Sydney Univer-sity Molonglo Sky Survey (SUMSS; Bock, Large, & Sadler1999) at 843 MHz which will be used, together with its fore-runner the 408 MHz Molonglo Reference Catalogue (MRC;Large et al. 1981), to search for the highest–redshift radiogalaxies in the south. In this paper we present the resultsof a pilot study from SUMSS and the 1.4 GHz NRAO VLASky Survey (NVSS; Condon et al. 1998).
Our search for HzRGs consists of four steps: (i) defini-tion of the sample, (ii) high-resolution radio imaging to ob-tain accurate positions and morphological information, (iii)near-IR identifications of the host galaxies, and (iv) opti-cal and/or near-IR spectroscopy to measure their redshifts.Here we present the results from the first three steps of ourprogram.
2 SAMPLE DEFINITION
We used the 2001 November 23 pre-release version of theSUMSS catalogue (Mauch et al. 2003), and version 39 of theNVSS catalogue (Condon et al. 1998) to construct a sampleof ultra steep spectrum (USS) sources. Note that this is apreliminary version of the SUMSS catalogue which has somedifferences (see below) from the first publicly–released ver-sion, version 1.0 of 2003 February 25. The overlapping areawith NVSS comprises 29 SUMSS mosaics of 4.3 × 4.3 each.Since we only consider sources with δ < −32(see §3.1),the total sky area of our USS sample is 0.11 steradians, or360 deg2. This area lies at b < −31, so Galactic extinctionshould not be a problem in identifying the host galaxies.
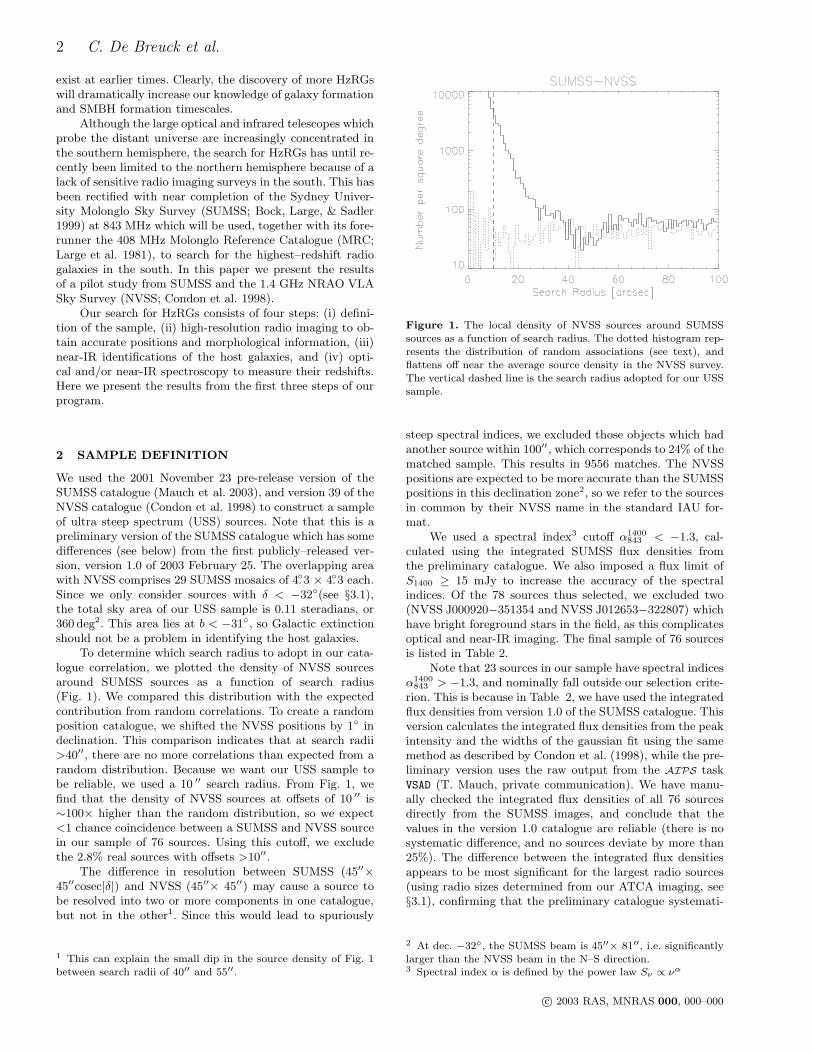
To determine which search radius to adopt in our cata-logue correlation, we plotted the density of NVSS sourcesaround SUMSS sources as a function of search radius(Fig. 1). We compared this distribution with the expectedcontribution from random correlations. To create a randomposition catalogue, we shifted the NVSS positions by 1 indeclination. This comparison indicates that at search radii>40′′, there are no more correlations than expected from arandom distribution. Because we want our USS sample tobe reliable, we used a 10 ′′ search radius. From Fig. 1, wefind that the density of NVSS sources at offsets of 10 ′′ is∼100× higher than the random distribution, so we expect<1 chance coincidence between a SUMSS and NVSS sourcein our sample of 76 sources. Using this cutoff, we excludethe 2.8% real sources with offsets >10′′.
The difference in resolution between SUMSS (45′′×45′′cosec|δ|) and NVSS (45′′× 45′′) may cause a source tobe resolved into two or more components in one catalogue,but not in the other1. Since this would lead to spuriously
1 This can explain the small dip in the source density of Fig. 1between search radii of 40′′ and 55′′.
Figure 1. The local density of NVSS sources around SUMSSsources as a function of search radius. The dotted histogram rep-resents the distribution of random associations (see text), andflattens off near the average source density in the NVSS survey.The vertical dashed line is the search radius adopted for our USSsample.
steep spectral indices, we excluded those objects which hadanother source within 100′′, which corresponds to 24% of thematched sample. This results in 9556 matches. The NVSSpositions are expected to be more accurate than the SUMSSpositions in this declination zone2, so we refer to the sourcesin common by their NVSS name in the standard IAU for-mat.
We used a spectral index3 cutoff α1400843 < −1.3, cal-
culated using the integrated SUMSS flux densities fromthe preliminary catalogue. We also imposed a flux limit ofS1400 ≥ 15 mJy to increase the accuracy of the spectralindices. Of the 78 sources thus selected, we excluded two(NVSS J000920−351354 and NVSS J012653−322807) whichhave bright foreground stars in the field, as this complicatesoptical and near-IR imaging. The final sample of 76 sourcesis listed in Table 2.
Note that 23 sources in our sample have spectral indicesα1400
843 > −1.3, and nominally fall outside our selection crite-rion. This is because in Table 2, we have used the integratedflux densities from version 1.0 of the SUMSS catalogue. Thisversion calculates the integrated flux densities from the peakintensity and the widths of the gaussian fit using the samemethod as described by Condon et al. (1998), while the pre-liminary version uses the raw output from the AIPS taskVSAD (T. Mauch, private communication). We have manu-ally checked the integrated flux densities of all 76 sourcesdirectly from the SUMSS images, and conclude that thevalues in the version 1.0 catalogue are reliable (there is nosystematic difference, and no sources deviate by more than25%). The difference between the integrated flux densitiesappears to be most significant for the largest radio sources(using radio sizes determined from our ATCA imaging, see§3.1), confirming that the preliminary catalogue systemati-
2 At dec. −32, the SUMSS beam is 45′′× 81′′, i.e. significantlylarger than the NVSS beam in the N–S direction.3 Spectral index α is defined by the power law Sν ∝ να
c© 2003 RAS, MNRAS 000, 000–000
Distant radio galaxies from SUMSS and NVSS 3
cally overestimated the integrated flux density. Such errorsshow up easily in USS samples, as we select the sources withthe largest differences between the SUMSS and NVSS fluxdensities. In the following, we shall therefore only use the in-tegrated flux densities from the version 1.0 catalogue. Thisimplies that our sample contains only 53 real USS sourceswith α1400
843 < −1.3. We have decided to retain the other 23sources to provide a baseline in spectral index and radio sizeagainst which to search for correlations with other properties(e.g. K−band magnitude, redshift) in our sample.
When using version 1.0 of the SUMSS catalogue, we finda total of 212 sources with α1400
843 < −1.3. Of these sources,69 are in new fields since added to the SUMSS coverage.The remaining 143 sources are all within the same fields,and qualify as USS sources due to the revised determina-tion of the SUMSS flux density. Most of these sources havejust made it into the USS cutoff: the median spectral indexof the 90 ’new’ sources is α1400
843 = −1.37, while for the 53USS sources in this paper, α1400
843 = −1.56. Because this newversion of the SUMSS catalogue became available only afterour radio and near–IR observations, these ’new’ sources arenot considered here.
2.1 Literature
We searched for obvious optical and K−band identificationsat the NVSS positions using the Digitized Sky Survey (DSS)and the 2 Micron All Sky Survey (2MASS; Skrutskie et al.1997). Of the five sources detected in the DSS, three werealso seen in 2MASS. We did not obtain more accurate ra-dio or K−band identifications for these sources, as they arelikely to be located at low (z ≪ 1) redshifts. As a result,we lack K−band information for two sources, and for these,we quote the 2MASS 10σ sensitivity limit. For the threesources detected in 2MASS, we quote their ’total magni-tudes from fit extrapolation’ and list these in column 10 ofTable 2. Four sources have measured spectroscopic redshifts0.15 < z < 0.26 from the 2dF Galaxy Redshift Survey (2dF-GRS; Colless et al. 2001); these are listed in column 13 ofTable 2.
3 OBSERVATIONS AND DATA REDUCTION
3.1 ATCA
We used the Australia Telescope Compact Array (ATCA)over the period UT 2001 December 12–14 to measure accu-rate radio positions and morphologies of 71 sources in ourUSS sample. The 6A configuration was used, spanning base-lines from 330 m to 6 km. We observed simultaneously at1.344 GHz and 1.432 GHz, and obtained 4–10 cuts of 3 min-utes for each target, spread in hour angle. Primary flux cal-ibration was based on observations of PKS B1934−638 andthe phase calibrators were PKS B1933−400, B2341−351 andB0153−410. To avoid high azimuth tracking speeds, we ex-cluded sources near the local zenith by limiting our sampleto δ < −32.
We used the CAONIS on-line data-reduction tool to de-termine if a source was detected with sufficient signal/noise(S/N). Once a source had been clearly detected, and its mor-phology determined, we skipped to the next source, with the
aim of obtaining a set of radio maps with a uniform S/N leveland uv-coverage. Table 1 gives the total on-source integra-tion times for each source.
The resulting synthesized beam widths are ∼ 9′′ × 5′′,and the positional accuracy is estimated to be < 1′′. Wefollowed standard data reduction procedures in MIRIAD,and combined the 1.344 GHz and 1.432 GHz uv-data toincrease the signal-to-noise and better sample the uv-plane.The final images have a rms noise level of ∼0.4 mJy.
For approximately 30% of our sample, positive K−bandidentifications were confused by several sources located nearthe radio derived positions. We therefore obtained follow-upradio observations to increase the sensitivity of the previousimages. We re-observed 20 USS sources on UT 2003 July29–30 in the 6A configuration. We observed simultaneouslyat 1.384 GHz and 2.368 GHz and obtained 7–8 cuts of 4–6 minutes for each target, spread over 12 hours in hour an-gle. The phase calibrators observed were PKS B1933−400,B2254−367, B0008−421 and B0153−410. All other param-eters and data reduction techniques are as described above.
3.2 AAT
We obtained KSband imaging of 70 sources from our sampleon the nights of UT 2002 October 17 to 20, using the newIRIS2 instrument (Gillingham & Jones 2000) at the 3.9mAnglo-Australian Telescope at Siding Spring Observatory.Conditions were mostly photometric, but the seeing washighly variable on some nights. This led to a loss of sensitiv-ity of up to 2 magnitudes when the KSband seeing was 3.′′0,as compared to good conditions with 1.′′0 seeing. We usedtypical integration times of 64 s, consisting of 8 co-adds of 8 seach in a 14-point random jitter pattern within a 40′′ × 40′′
box. The detector is a 1024×1024 HAWAII HgCdTe array,with a pixel scale of 0.′′446/pixel, resulting in a ∼ 8′×8′ fieldof view.
We used the online data-reduction tool ORAC-DR
(Cavanagh et al. 2003) to sky-subtract, register and sum ourdata. This allowed us to re-observe several of the sourceswhich were not detected after a first 14-point dither pat-tern. This quick data reduction also allowed us to re-observe8 sources where we did not detect the object due to loss ofsensitivity during periods of bad seeing. In our final datareduction, we retained only data obtained with a KSbandseeing <2.0′′, except for 6 sources with K < 18.
3.3 NTT
For the 20 sources not detected in our AAT/IRIS2 images,we obtained deeper KSband images on the nights of UT 2002November 25 to 27 using the Son of Isaac (SofI) instrument(Moorwood, Cuby & Lidman 1998) at the ESO 3.5m NewTechnology Telescope (NTT). Conditions were photometricwith 0.′′7 seeing. We used typical integration times of 60 s,consisting of 6 coadds of 10 s each in a 15 to 40-point randomjitter pattern within 40′′×40′′. The detector is a 1024×1024HAWAII HgCdTe array, with a pixel scale of 0.′′292/pixel,resulting in a ∼ 5′ × 5′ field of view.
We reduced the data using the NOAO IRAF package.After flat-fielding, the data were sky-subtracted, registered,and summed using the DIMSUM near-IR data reduction pack-age. Because most images were observed with good seeing,
c© 2003 RAS, MNRAS 000, 000–000

4 C. De Breuck et al.
Table 1. Integration times for the radio and near-IR observations
Name ATCA AAT NTT Name ATCA AAT NTTs s s s s s
NVSS J001339−322445 ... ... ... NVSS J230035−363410 720 896 2400NVSS J002001−333408 3600 896 ... NVSS J230123−364656 900 896 2400NVSS J002112−321208 900 896 ... NVSS J230203−340932 2376 1792 ...NVSS J002131−342225 900 896 ... NVSS J230404−372450 3924 896 ...NVSS J002219−360728 ... ... ... NVSS J230527−360534 2376 ... 900NVSS J002352−332338 2412 896 ... NVSS J230822−325027 900 896 ...NVSS J002359−325756 900 896 ... NVSS J230846−334810 1260 896 ...NVSS J002402−325253 720 896 ... NVSS J230954−365653 3924 896 1500NVSS J002415−324102 900 896 ... NVSS J231016−363624 900 896 ...NVSS J002427−325135 900 896 ... NVSS J231144−362215 1260 1792 2400NVSS J002627−323653 ... ... ... NVSS J231229−371324 900 896 ...NVSS J002738−323501 3348 896 1680 NVSS J231311−361558 900 896 ...NVSS J011032−335445 1080 896 ... NVSS J231317−352133 900 1792 ...NVSS J011606−331241 1080 896 2400 NVSS J231335−370609 900 896 ...NVSS J011643−323415 3564 896 ... NVSS J231338−362708 1260 896 2400NVSS J012904−324815 ... ... ... NVSS J231341−372504 3564 896 ...NVSS J014413−330457 3240 896 2400 NVSS J231357−372413 1260 896 ...NVSS J014529−325915 720 1792 ... NVSS J231402−372925 900 896 ...NVSS J015223−333833 3240 1792 ... NVSS J231459−362859 900 896 ...NVSS J015232−333952 900 1792 ... NVSS J231519−342710 1620 896 ...NVSS J015324−334117 1080 896 ... NVSS J231726−371443 1260 1792 1260NVSS J015418−330150 1260 896 ... NVSS J231727−352606 2556 896 2400NVSS J015436−333425 1080 896 2400 NVSS J232001−363246 1800 896 1200NVSS J015544−330633 900 896 ... NVSS J232014−375100 1260 896 ...NVSS J021308−322338 1260 1792 ... NVSS J232058−365157 1620 1344 ...NVSS J021359−321115 1260 896 ... NVSS J232100−360223 2376 896 1380NVSS J021545−321047 1260 896 ... NVSS J232219−355816 2376 896 1800NVSS J021716−325121 1260 896 ... NVSS J232322−345250 1440 896 ...NVSS J030639−330432 1440 896 ... NVSS J232408−353547 ... ... ...NVSS J202026−372823 1080 896 ... NVSS J232602−350321 1440 896 ...NVSS J202140−373942 1908 896 ... NVSS J232651−370909 900 896 ...
NVSS J202518−355834 1440 1792 ... NVSS J232956−374534 720 896 ...NVSS J202856−353709 1260 896 ... NVSS J233558−362236 3600 896 1980NVSS J202945−344812 1080 1792 2160 NVSS J233729−355529 720 896 ...NVSS J204147−331731 720 896 ... NVSS J234137−342230 2160 896 1980NVSS J204420−334948 1908 2688 2400 NVSS J234145−350624 3000 896 ...NVSS J213510−333703 2160 2688 ... NVSS J234904−362451 1260 896 ...NVSS J225719−343954 900 576 ... NVSS J235137−362632 2628 896 2400
we block-replicated the pixels by a factor of 2 before sum-ming the individual images.
3.4 Astrometry
The combined images from the ORAC-DR and DIMSUM reduc-tions contain a crude astrometrical solution based on thetelescope pointings. We used the SkycatGAIA tool to iden-tify the non-saturated (12 < R < 18) stars from USNO-A2.0catalogue (Monet et al. 1998), and fine-tuned our astrome-try accordingly. Because of the large field of view, we couldidentify on average ∼90 stars in each IRIS2 image, and ∼40in the SofI images, allowing an accurate astrometrical solu-tion including the rotation and stretch terms. The main un-certainty in the relative near-IR to radio astrometry stemsfrom the uncertainty in the USNO-A2.0 catalogue, whichis 1σ ≈ 0.′′25 (Deutsch 1999). This is more accurate thanour ATCA astrometry, and should therefore be sufficient toidentify the KSband counterparts of our USS sources.
3.5 Photometry
We calibrated the photometry using short observationsof standard stars from the UKIRT faint standard list(Hawarden et al. 2001). This procedure yielded typical ze-ropoints of KS0 = 22.20 ± 0.10 for IRIS2, and KS0 =22.11 ± 0.02 for SofI (for 1 count/second, integrated overthe source). Because our resulting images have a large fieldof view, they generally contain several stars which are alsodetected in the DEep Near Infrared Survey of the SouthernSky (DENIS Epchtein et al. 1997). We extracted all the DE-NIS stars in our images with reliable K−band photometry(confidence coefficient >75) from the catalogue constructedat the Paris Data Analysis Center (Guy Simon, private com-munication). A comparison with our photometry yields asmall systematic offset of −0.06 mag in both the IRIS2 andSofI photometric zeropoints. We applied this correction toour photometry. We estimate the uncertainty in the zero-points by comparing field stars observed by both telescopes,and find ∆(KS0) ≃ 0.05.
c© 2003 RAS, MNRAS 000, 000–000

Distant radio galaxies from SUMSS and NVSS 5
We did not correct for airmass variations, because mostof our objects were observed with airmasses <1.7, and theairmass dependence in KSband is small compared to thefitting errors described below. Similarly, the effect of Galac-tic extinction is expected to be negligible in our fields (lo-cated at b < −31), and no correction has been applied.Note that all our near–IR observations used the KS-bandfilter and not the standard K−band filter. We did not cor-rect our magnitudes to K−band because we do not haveany colour information, and the correction is expected tobe much smaller than the photometric uncertainties. In thefollowing, we shall for refer to the magnitudes as K−bandto facilitate comparison with the literature.
We used the IRAF task phot to measure the magni-tudes of the K−band identifications. To facilitate compari-son with the literature, we use three different apertures, withdiameters of 2.′′0, 4.′′0, and 8.′′0. The uncertainties quoted areour best estimates, which include both the zero-point uncer-tainty and the fitting uncertainty given by the phot routine.
4 RESULTS
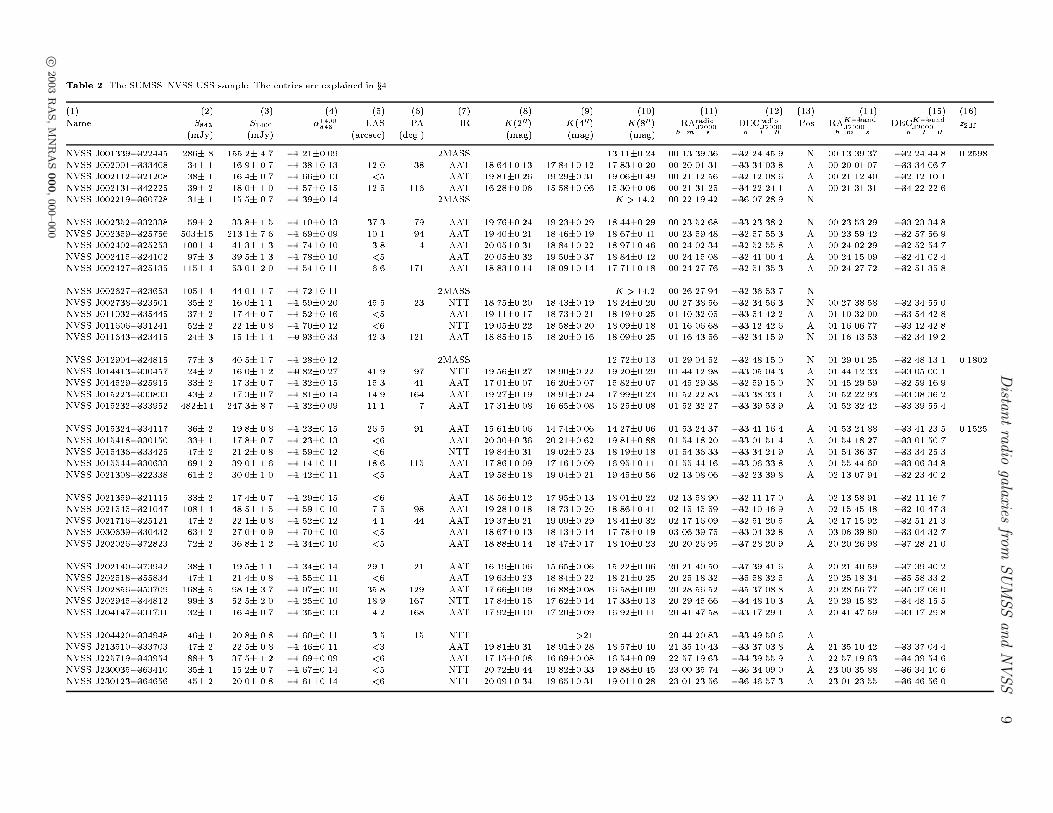
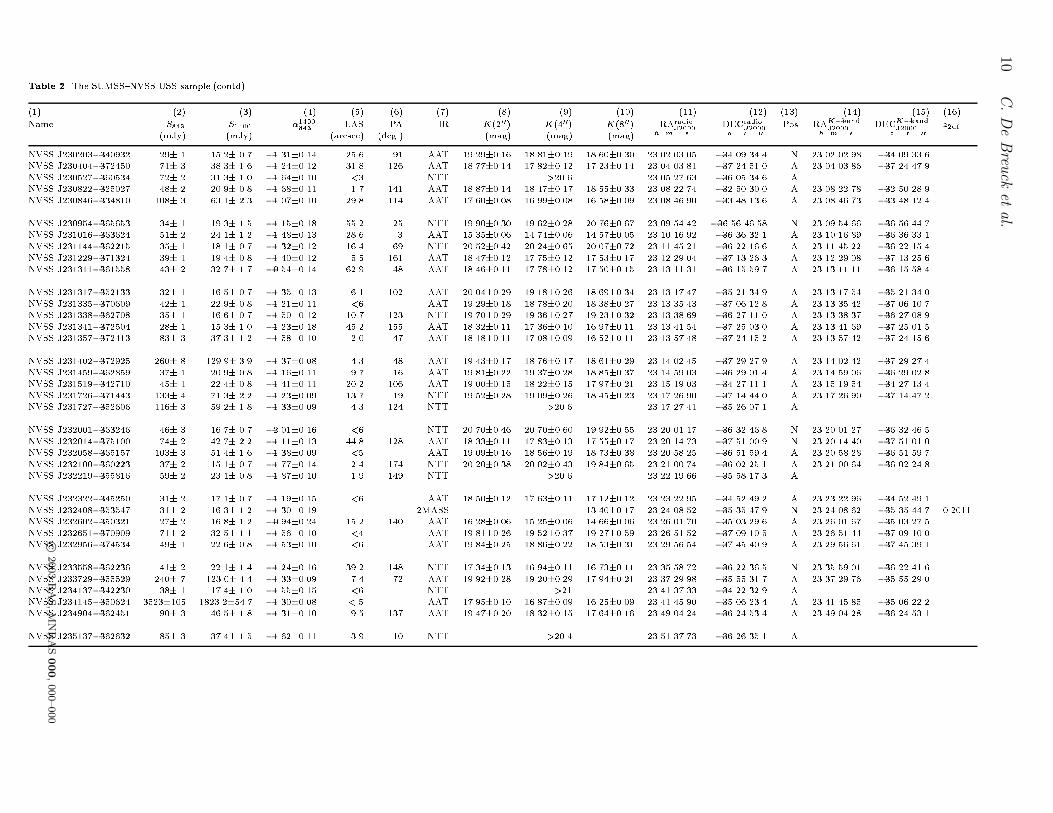
Table 2 lists our sample with the results from our radio andnear-IR imaging. The columns are:
(1) Name of the source in IAU J2000 format.(2) The integrated 843 MHz flux density from the SUMSS
catalogue.(3) The integrated 1.4 GHz flux density from the NVSS
catalogue.(4) The two-point spectral index between SUMSS and
NVSS.(5) Largest angular size, as determined from the ATCA
maps. For single component sources, this is the de-convolvedmajor axis of the elliptical Gaussian, or, for unresolvedsources (preceded by <), an upper limit is given by the res-olution. For multiple component sources, this is the largestpossible separation between their components.(6) De-convolved position angle of the radio structure, as
determined from the ATCA maps, measured North throughEast. For multiple component sources, this is the orientationof the most widely separated components used to calculatethe LAS (col. 5).(7) The telescope used to obtain the K−band imaging.(8)–(10) K−band magnitude determined in apertures with
diameters of 2′′, 4′′, and 8′′. For the 2MASS photometry,these are the total magnitudes from fit extrapolation.(11)–(12) J2000 coordinates of the radio source, either
measured from the ATCA images or from the NVSS cata-logue, as indicated in column 13. The positions in the ATCAmaps have been fitted with a single two-dimensional ellipti-cal Gaussian. For multiple component sources, the geometricmidpoint is given, unless mentioned otherwise in the noteson individual sources.(13) Origin of the radio position given in columns 11 and
12: A=ATCA image, N=NVSS catalogue.(14)–(15) J2000 coordinates of the K−band identification.(16) The spectroscopic redshift from the 2dFGRS.
Notes on individual sources are given in the Appendix.Figure 2 shows overlays of the ATCA 1.4 GHz or 2.4 GHzradio contours onto K−band images.
14 16 18 20K magnitude [4 arcsec aperture]
-0.5
-1.0
-1.5
-2.0
Rad
io s
pect
ral i
ndex
(84
3-14
00 M
Hz)
Figure 3. Relation between K magnitude (in a 4 arcsec aperture)and the radio spectral index between 843 MHz and 1.4GHz. Tri-angles show upper limits. Filled symbols represent sources withα1400
843 < −1.3, and open symbols those with α1400843 > −1.3. The
vertical dotted line indicates the expected K−band magnitude ofa z ∼3 source, and the horizontal dotted line our adopted spectralindex cutoff.
14 16 18 20K magnitude [4 arcsec aperture]
0
10
20
30
40
50
60
70
Rad
io a
ngul
ar s
ize
[arc
sec]
Figure 4. Relation between K magnitude (in a 4 arcsec aperture)of a radio galaxy and the angular size of the radio source. Symbolsare as in Fig. 3. The vertical dotted line indicates the expectedK−band magnitude of a z ∼3 source. Note the paucity of largeradio sources with K > 19.5.
5 DISCUSSION
5.1 Correlations
We now examine the correlations between the differentsource parameters in our sample. Because 30% of our sam-ple contains sources with α1400
843 > −1.3 and large radio sizes,we can study the dependence of K−band magnitude onthese parameters. Fig. 3 shows that the K−band magni-tude and radio spectral index are correlated. The generalizedSpearman rank and generalized Kendall’s tau coefficients(e.g. Isobe, Feigelson, & Nelson 1986) suggest this relationis significant at the 99.95% level. This correlation arises be-cause both radio spectral index and K−band magnitude arecorrelated with redshift, reinforcing our approach of using
c© 2003 RAS, MNRAS 000, 000–000

6 C. De Breuck et al.
K−band magnitude as an additional criterion for selectingthe highest redshift candidates.
Several samples of USS sources (Blundell et al. 1998;Stern et al. 1999) have applied a radio angular-size cutoffto exclude large radio sources, which are thought to be atrelatively low redshift. We can check the efficiency of thisapproach with our sample, as we have radio size informa-tion for 95% of our sources, and K−band information toestimate their redshifts (see §5.3). Note that our samplealso has an implicit angular size cutoff due to the exclu-sion of SUMSS sources with more than one NVSS sourcewithin 100′′(see §2). Considering only the 53 sources withα1400
843 < −1.3 and radio size information, there indeed ap-pears to be a correlation between radio size and K−bandmagnitude (see Fig. 4). The generalized Spearman rank andKendall’s tau coefficients suggest that this correlation is sig-nificant at the 99.7% level. Because our sample contains only29 radio sources larger than 10′′ (only 12 of which haveα1400
843 < −1.3), we consider this suggestive, but not con-clusive evidence that the most distant radio sources in ourradio sample have smaller radio sizes. Nevertheless, it is re-markable that only two sources with K(4′′) > 19.5 have aradio size larger than 6′′. This suggests that a significantfraction of the compact steep spectrum sources in our sam-ple are either at high redshift or are heavily obscured bydust (Reuland et al. 2003).
5.2 Surface density of USS sources
In this paper, we select USS sources on the basis of the radiospectral index between 843 and 1400 MHz. We now evaluatehow well this works in comparison with the techniques usedin earlier USS samples. There are two considerations here:the number of sources which this technique yields, and thefraction of USS sources which lie at high redshift.
Table 3 compares the results from our SUMSS–NVSS pilot study with earlier USS samples observedby De Breuck et al. (2002) and Jarvis et al. (2001). TheSUMSS–NVSS USS selection yields a USS surface densitymore than four times higher than the WENSS–NVSS sam-ple of De Breuck et al. (2002) at the same 1.4 GHz flux level.Note that due to the incompleteness of our USS sample (see§2), these numbers are strictly lower limits. There are severalexplanations for this higher density:
First, the higher observed selection frequency of843 MHz compared to 325 MHz means that we are alsosampling a higher rest-frame spectral index of the radiosources. Because most radio spectra of powerful radio galax-ies and compact steep spectrum sources have a tendencyto steepen towards higher frequencies (e.g. Gopal-Krishna1988; Mangalam & Gopal-Krishna 1995; Athreya & Kapahi1998; Murgia et al. 1999; Blundell, Rawlings, & Willott1999; De Breuck et al. 2000; Sohn, Klein, & Mack 2003), weare effectively probing an intrinsically steeper part of theradio spectrum. Therefore, on average, α1400
843 = −1.3 cor-responds to α1400
325 > −1.3. This slightly more relaxed cutoffleads to a fast increase in the number of USS selected sources(due to the steep tail of the spectral index distribution), butdue to the other two effects described here, we cannot usethis to estimate the α1400
843 cutoff equivalent to α1400325 = −1.3.
Second, the SUMSS and NVSS catalogues have bothbeen constructed with the AIPS task VSAD (Condon et al.
1998; Mauch et al. 2003), while the WENSS survey usesan IDL-based fitting routine (Rengelink et al. 1997). Be-cause both USS samples consider only isolated sources inboth catalogues, the use of the same fitting routine in bothsurveys is more appropriate. For example, De Breuck et al.(2000) considered only ‘single component’ WENSS sources,which may well exclude a substantial fraction of real USSsources. Furthermore, the spatial resolution of SUMSS(45′′× 45′′cosec|δ|) is better matched to NVSS (45′′× 45′′)than that of WENSS (54′′× 54′′cosec|δ|), so fewer sourceswill be removed by our selection criterion to exclude sourcesresolved in only one of the two catalogues (see §2). TheWENSS–NVSS USS sample is therefore less complete thanthe SUMSS–NVSS USS sample.
Third, the shorter frequency baseline between SUMSSand NVSS leads to a median uncertainty in the derived USSspectral indices ∆α1400
843 = 0.12, while for WENSS-NVSS,this is ∆α1400
325 = 0.04 (De Breuck et al. 2000). Because theα < −1.3 cutoff is on the very steep tail of the spectral indexdistribution, we expect more sources with α > −1.3 to scat-ter into into the USS sample than there will be α < −1.3scattering out. To estimate the magnitude of this effect, wehave generated a random sample of sources drawn from theSUMSS–NVSS spectral index distribution, and added ran-dom spectral index uncertainties to this (Rengelink 1999).Here, we use the publicly released version of the SUMSScatalogue, containing 212 USS sources with α < −1.3 to getreliable estimated of this effect. Adopting a mean spectralindex α = −0.82 and a standard deviation of σα = 0.25,we expect that due to uncertainties in the spectral indicesin our sample, ∼40 real α < −1.3 have observed α > −1.3,while ∼115 real α > −1.3 have observed α < −1.3. Hence,this would lead to a surplus of ∼75 sources (35%) in a USSsample (compared to ∼3% in the WENSS–NVSS sample;De Breuck et al. 2000). However, we do not expect that this‘contamination’ of α > −1.3 sources will decrease the frac-tion of z > 3 radio galaxies in our SUMSS–NVSS USS sam-ple because the scatter in the α − z relation is quite large.
Table 3 also shows that the fraction of USS sourceswhich have K−band IDs fainter than K64 kpc >19.5 mag,making them candidates for very distant (z > 3) radiogalaxies, appears similar in the SUMSS–NVSS and WENSS–NVSS USS sample with a S1400 >15 mJy cutoff. However,the K−band photometry of the WENSS–NVSS USS sam-ple is not complete as most of the WENSS–NVSS sourcesobserved in K−band were pre-selected to be undetectedin optical imaging (R ∼
> 24). This preselection will clearlyhave removed a substantial number of ‘intermediate redshift’sources with K < 19.5. If the 20 R−band detected sourcesnot observed at K−band are all assumed to have K < 19.5,then the fraction decreases to 19.6 %, slightly lower than thevalue found for the SUMSS-NVSS sample.
Thus it appears that spectral index selection between843 and 1400 MHz is an efficient way of finding distant galax-ies, and the full SUMSS–NVSS USS sample should be ca-pable of finding large numbers of massive galaxies at z > 3.Spectroscopy is clearly needed to confirm that the K − z
relation holds for these galaxies.
c© 2003 RAS, MNRAS 000, 000–000

Distant radio galaxies from SUMSS and NVSS 7
Table 3. Surface density of USS sources for different selection methods. Note that these are strictly lower limits due to theincompletenesses in the various USS samples (see text).
Sample Flux limit Spectral index Area Sources USS density Fraction of USS Density (sr−1) Ref.(mJy) limit sr (sr−1) with K>19.5 mag USS+K>19.5
WENSS–NVSS S1400 > 10 α1400325 < −1.3 2.27 343 151 12/44 (27%) 41±12 1
TEXAS–NVSS S1400 > 10 α1400365 < −1.3 5.58 268 48 8/24 (33%) 16±6 1
MRC–PMN S408 > 700 α4800408 < −1.3 2.23 58 26 0/19 <1.4 1
6C∗ S151 > 960 α4850151 < −0.981 0.133 24 180 2/24 ( 8%) 15±11 2
SUMSS–NVSS S1400 > 15 α1400843 < −1.3 0.11 53 482 13/53 (25%) 118±33 3
WENSS–NVSS S1400 > 15 α1400325 < −1.3 2.27 233 103 11/36 (31%) 32±10 1
REFERENCES: (1) De Breuck et al. (2000, 2002); (2) Blundell et al. (1998), Jarvis et al. (2001); (3) this paper.
Figure 5. Predicted redshift distribution of the USS sources, es-
timated from the Hubble K − z diagram. The shaded histogramshows the four sources with spectroscopic redshifts from the 2dF-GRS
5.3 Expected redshift distribution
We have spectroscopic redshifts of only four sources fromthe 2dFGRS. To estimate the redshift distribution of theother 71 sources, we use the Hubble K − z diagram. Wehave fitted a linear relation to the 64 kpc radio-galaxymagnitudes in Fig. 7 of De Breuck et al. (2002), yieldingK = 4.633 log10(z) + 17.266. To calculate the 64 kpc met-ric apertures, we used the average correction for z > 1, viz.K64kpc = K(8′′)+0.2. Figure 5 shows the predicted redshiftdistribution of our sample. The median predicted redshift is1.75, which is slightly lower than for the WENSS–NVSS andTexas–NVSS USS samples (De Breuck et al. 2002). How-ever, when the optical preselection in the former (see previ-ous section) is taken into account, the SUMSS–NVSS samplehas at least as high a median expected redshift.
6 CONCLUSIONS
We have constructed a sample of 76 southern USS sourcesfrom the SUMSS and NVSS, including 53 sources withα1400
843 < −1.3. Our ∼5′′ resolution radio maps allow theidentification of 92% of these sources down to K ∼ 20.5. Thesurface density of this SUMSS–NVSS USS sample is morethan four times higher than earlier USS samples, which canbe explained by a spectral index cutoff which is effectivelymore relaxed due to the higher selection frequency, and bythe use of the same source finding algorithm in both cata-logues. The higher uncertainties in the spectral indices dueto the shorter frequency baseline account for a further 35%of α > −1.3 source which get scattered into the USS sample.
The distribution of the K−band magnitudes suggeststhat our sample will be at least as efficient in finding z > 3radio galaxies as earlier USS samples. We intend to obtainfull spectroscopic redshift information for this sample to in-crease the number of potential HzRG targets for follow-upstudies with 8m-class telescopes in the southern hemisphere,and to study the radio power dependence in the Hubble K−z
diagram out to z > 3.By the end of 2003, SUMSS is expected to cover most
of the δ < −30 region. When combined with the re-analysisof the 408 MHz MRC (Crawford, in preparation), this willallow the construction of a sensitive USS sample at δ <
−40, a region which is virtually unexplored in extragalacticradio astronomy.
7 ACKNOWLEDGEMENTS
We thank the referee Philip Best for his valuable com-ments, Tom Mauch for useful discussions and Guy Simonfor providing the K−band data from the DENIS survey.This publication makes use of data products from the TwoMicron All Sky Survey, which is a joint project of the Uni-versity of Massachusetts and the Infrared Processing andAnalysis Center/California Institute of Technology, fundedby the National Aeronautics and Space Administration andthe National Science Foundation. This work was supportedby PICS/CNRS (France) and IREX/ARC (Australia), andby a Marie Curie Fellowship of the European Communityprogramme ‘Improving Human Research Potential and theSocio-Economic Knowledge Base’ under contract numberHPMF-CT-2000-00721.
c© 2003 RAS, MNRAS 000, 000–000

8 C. De Breuck et al.
REFERENCES
Athreya, R., & Kapahi, V. 1998, J. Astrophys. Astr., 19,63
Blundell, K., Rawlings, S., & Willott, C. 1999, AJ, 117, 677Blundell, K., Rawlings, S., Eales, S., Taylor, G., & Bradley,A. 1998, MNRAS, 295, 265
Bock, D., Large, M., & Sadler, E.M. 1999, AJ, 117, 1578Cavanagh, B., et al. 2003, Astronomical Data AnalysisSoftware and Systems XII ASP Conf. Series, 295, p.237
Condon, J., et al. 1998, AJ, 115, 1693Colless, M., et al. 2001, MNRAS, 328, 1039De Breuck, C., van Breugel, W., Rottgering, H., & Miley,G. 2000, A&AS, 143, 303
De Breuck, C., van Breugel, W., Stanford, S. A.,Rottgering, H., Miley, G., & Stern, D. 2002, AJ, 123, 637
De Breuck, C., et al. 2003, A&A, 401, 911Deutsch, E. W. 1999, AJ, 118, 1882Douglas, J. N., Bash, F. N., Bozyan, F. A., Torrence, G.W., & Wolfe, C. 1996, AJ, 111, 1945
Dunlop, J., McLure, R., Kukula, M., Baum, S., O’Dea, C.,& Hughes, D. 2003, MNRAS, 340, 1095
Dunlop, J. 2003, Carnegie Observatories Astrophysics Se-ries, Vol. 1: Coevolution of Black Holes and Galaxies, edL. C. Ho (Cambridge: Cambridge Univ. Press)
Epchtein, N., et al. 1997, The Messenger, 87, 27Franceschini, A., Vercellone, S., & Fabian, A. 1998, MN-
RAS, 297, 817Gillingham, P. & Jones, D. 2000, Proc. SPIE, 4008, 1084Gopal-Krishna 1988, A&A, 192, 37Hawarden, T., Leggett, S., Letawsky, M., Ballantyne, D.,& Casali, M. 2001, MNRAS, 325, 563
Isobe, T., Feigelson, E., & Nelson, P. 1986, ApJ, 306, 490Jarvis, M., et al. 2001, MNRAS, 326, 1585Large, M. I., Mills, B. Y., Little, A. G., Crawford, D. F.,& Sutton, J. M. 1981, MNRAS, 194, 693
Lilly, S & Longair, M. 1984, MNRAS, 211, 833Loeb, A. 1993, ApJ, 403, 542Mangalam, A. & Gopal-Krishna 1995, MNRAS, 275, 976Mauch, T., et al. 2003, MNRAS, in press, astro-ph/0303188Monet, D. et al.1998, USNO-A2.0, (U.S. Naval Observa-tory, Washington DC), VizieR Online Data Catalog, 1252
Moorwood, A., Cuby, J. & Lidman, C., 1998, The Messen-ger, 91, 9
Murgia, M., Fanti, C., Fanti, R., Gregorini, L., Klein, U.,Mack, K.-H., & Vigotti, M. 1999, A&A, 345, 769
Rengelink, R. et al. 1997, A&A, 124, 259Rengelink, R. 1999, Ph.D. thesis, Rijksuniversiteit Leiden.Reuland, M., van Breugel, W., Rottgering, H., de Vries,W., De Breuck, C., & Stern, D. 2003, ApJ, 582, 71
Sadler, E.M. 2003, Carnegie Observatories AstrophysicsSeries, Vol. 1: Coevolution of Black Holes and Galax-ies, ed L. C. Ho (Pasadena: Carnegie Observatories,http://www.ociw.edu/ociw/symposia/series/symposium1/proceedings.html),astro-ph/0304514
Skrutskie, M., et al. 1997, ASSL Vol. 210: The Impact ofLarge Scale Near-IR Sky Surveys, p. 25
Sohn, B., Klein, U. & Mack, K.-H. 2003, A&A, in press,astro-ph/0304155
Spergel, D., et al. 2003, ApJ, submitted, astro-ph/0302209Stern, D. et al. 1999, AJ, 117, 1122Tonry, J. et al. 2003, ApJ, in press, astro-ph/0305008
van Breugel, W., De Breuck, C., Stanford, S. A., Stern, D.,Rottgering, H., & Miley, G. 1999a, ApJ, 518, L61
van Breugel, W., et al. 1999b, Proc. The Most Distant Ra-dio Galaxies, Royal Netherlands Acedemy of Arts and Sci-ences, eds. H. Rottgering, P. Best, and M. Lehnert. 1999,p.49
APPENDIX A: NOTES ON INDIVIDUAL
SOURCES
NVSS J001339−322445: This is the northern memberof a pair of radio sources separated by 2.2 arcmin on thesky and previously catalogued as PKS 0011-327. While thiscould be a wide double, we consider it more likely that thetwo sources are unrelated as there is no plausible optical ornear-IR counterpart located between the two sources. Thenorthern (steep–spectrum) source NVSS J001339−322445 isassociated with a bright galaxy seen on both the DSS and2MASS images, and so was not observed with the ATCAor AAT. The southern source, NVSS J001338−322657, hasno obvious optical counterpart. Its flux density is 106 mJyin NVSS and 141 mJy in SUMSS, giving a spectral index of−0.56.NVSS J002001−333408: The K−band identification islocated at the centre of the extended radio source.NVSS J002112−321208: The diffuse K−band identifica-tion is offset by (∆α, ∆δ)=(2.′′0W, 1.′′5S) from the ATCAposition.NVSS J002131−342225: The source is identified withthe (uncatalogued) bright galaxy located between the radiolobes.NVSS J002219−360728: An optical galaxy is clearly visi-ble on the digitized sky survey images at the NVSS position,so this source was not observed with the ATCA or AAT.NVSS J002352−332338: We identify the host galaxy withthe faint K−band object located along the radio axis, offsetby (∆α, ∆δ)=(7.′′6E, 3.′′4N) from the NVSS position.NVSS J002359−325756: The K−band identification islocated in between the radio lobes. This source is also knownas PMN J0024−3258.NVSS J002402−325253: The diffuse K−band identifica-tion is offset by (∆α, ∆δ)=(0.′′6W, 1.′′1N) from the ATCAposition.NVSS J002415−324102: The diffuse K−band identifica-tion is located at the ATCA position.NVSS J002427−325135: The K−band identification islocated in between the radio lobes.NVSS J002627−323653: An optical galaxy is clearly visi-ble on the digitized sky survey images at the NVSS position,so this source was not observed with the ATCA or AAT.NVSS J002738−323501: The diffuse K−band identifica-tion is located at the midpoint of the radio lobes.NVSS J011032−335445: The K−band identification islocated at the ATCA position.NVSS J011606−331241: The K−band identification islocated at the ATCA position.NVSS J011643−323415: We identify the compactK−band source offset by (∆α, ∆δ)=(0.′′5W, 3.′′6S) from theNVSS position.NVSS J012904−324815: This bright source is clearly de-tected in 2MASS using the NVSS astrometry. We thereforedid not observe it with the ATCA or AAT.NVSS J014413−330457: This radio source has a complex
c© 2003 RAS, MNRAS 000, 000–000
Dista
ntra
dio
gala
xiesfro
mSU
MSS
and
NV
SS
9
Table 2. The SUMSSNVSS USS sample. The entries are explained in x4.(1) (2) (3) (4) (5) (6) (7) (8) (9) (10) (11) (12) (13) (14) (15) (16)Name S843 S1400 1400843 LAS PA IR K(200) K(400) K(800) RAradioJ2000 DECradioJ2000 Pos RAKbandJ2000 DECKbandJ2000 z2df(mJy) (mJy) (arcsec) (deg.) (mag) (mag) (mag) h m s 0 00 h m s 0 00NVSS J001339322445 286 8 155.2 4.7 1.210.09 ... ... 2MASS ... ... 13.110.24 00 13 39.36 32 24 45.9 N 00 13 39.37 32 24 44.8 0.2598NVSS J002001333408 34 1 16.9 0.7 1.380.13 12.0 38 AAT 18.640.13 17.840.12 17.830.20 00 20 01.31 33 34 03.8 A 00 20 01.07 33 34 06.7 ...NVSS J002112321208 38 1 16.4 0.7 1.660.13 <5 ... AAT 19.810.26 19.290.31 19.060.49 00 21 12.56 32 12 08.6 A 00 21 12.40 32 12 10.1 ...NVSS J002131342225 39 2 18.0 1.0 1.570.15 12.5 116 AAT 16.280.06 15.580.06 15.300.06 00 21 31.25 34 22 24.1 A 00 21 31.31 34 22 22.6 ...NVSS J002219360728 31 1 15.5 0.7 1.390.14 ... ... 2MASS ... ... K > 14:2 00 22 19.42 36 07 28.9 N ... ... ...NVSS J002352332338 59 2 33.8 1.5 1.100.13 37.3 79 AAT 19.760.24 19.230.29 18.440.29 00 23 52.68 33 23 38.2 N 00 23 53.29 33 23 34.8 ...NVSS J002359325756 50315 213.1 7.6 1.690.09 10.1 94 AAT 19.400.21 18.460.19 18.670.41 00 23 59.48 32 57 55.3 A 00 23 59.42 32 57 56.9 ...NVSS J002402325253 100 4 41.3 1.3 1.740.10 3.8 4 AAT 20.050.31 18.840.22 18.970.46 00 24 02.34 32 52 55.8 A 00 24 02.29 32 52 54.7 ...NVSS J002415324102 97 3 39.5 1.3 1.780.10 <5 ... AAT 20.050.32 19.500.37 18.840.42 00 24 15.08 32 41 00.4 A 00 24 15.09 32 41 02.4 ...NVSS J002427325135 115 4 53.0 2.0 1.540.11 6.6 171 AAT 18.830.14 18.090.14 17.710.18 00 24 27.76 32 51 35.3 A 00 24 27.72 32 51 35.8 ...NVSS J002627323653 105 4 44.0 1.7 1.720.11 ... ... 2MASS ... ... K > 14:2 00 26 27.94 32 36 53.7 N ... ... ...NVSS J002738323501 35 2 16.0 1.1 1.590.20 45.5 23 NTT 18.750.20 18.430.19 18.240.20 00 27 38.56 32 34 56.3 N 00 27 38.58 32 34 55.0 ...NVSS J011032335445 37 2 17.4 0.7 1.520.16 <5 ... AAT 19.110.17 18.730.21 18.190.25 01 10 32.05 33 54 42.2 A 01 10 32.00 33 54 42.8 ...NVSS J011606331241 52 2 22.1 0.8 1.700.12 <6 ... NTT 19.050.22 18.580.20 18.090.18 01 16 06.68 33 12 42.6 A 01 16 06.77 33 12 42.8 ...NVSS J011643323415 24 3 15.1 1.4 0.930.33 42.3 121 AAT 18.850.15 18.200.16 18.090.25 01 16 43.56 32 34 15.9 N 01 16 43.53 32 34 19.2 ...NVSS J012904324815 77 3 40.5 1.7 1.280.12 ... ... 2MASS ... ... 12.720.13 01 29 04.52 32 48 15.0 N 01 29 04.25 32 48 13.1 0.1802NVSS J014413330457 24 2 16.0 1.2 0.820.27 41.9 97 NTT 19.560.27 18.900.22 19.200.29 01 44 12.98 33 05 04.3 A 01 44 12.33 33 05 00.1 ...NVSS J014529325915 33 2 17.3 0.7 1.320.15 15.3 41 AAT 17.010.07 16.200.07 15.820.07 01 45 29.38 32 59 15.0 N 01 45 29.59 32 59 16.9 ...NVSS J015223333833 43 2 17.3 0.7 1.810.14 14.9 164 AAT 19.270.19 18.910.24 17.990.23 01 52 22.83 33 38 33.1 A 01 52 22.93 33 38 36.2 ...NVSS J015232333952 48214 247.3 8.7 1.320.09 11.1 7 AAT 17.310.08 16.650.08 16.250.08 01 52 32.27 33 39 53.9 A 01 52 32.42 33 39 55.4 ...NVSS J015324334117 36 2 19.8 0.8 1.230.15 26.5 91 AAT 15.610.06 14.740.06 14.270.06 01 53 24.37 33 41 16.4 A 01 53 24.88 33 41 23.5 0.1525NVSS J015418330150 33 1 17.8 0.7 1.230.13 <6 ... AAT 20.300.36 20.210.62 19.810.88 01 54 18.20 33 01 51.4 A 01 54 18.27 33 01 50.7 ...NVSS J015436333425 47 2 21.2 0.8 1.590.12 <6 ... NTT 19.840.31 19.020.23 18.190.18 01 54 36.33 33 34 24.9 A 01 54 36.37 33 34 25.3 ...NVSS J015544330633 69 2 39.0 1.6 1.140.11 18.6 115 AAT 17.860.09 17.160.09 16.950.11 01 55 44.16 33 06 33.8 A 01 55 44.60 33 06 34.8 ...NVSS J021308322338 61 2 30.0 1.0 1.420.11 <5 ... AAT 19.580.18 19.040.21 19.450.56 02 13 08.06 32 23 39.8 A 02 13 07.94 32 23 40.2 ...NVSS J021359321115 33 2 17.4 0.7 1.290.15 <6 ... AAT 18.560.12 17.950.13 18.010.22 02 13 58.90 32 11 17.0 A 02 13 58.91 32 11 16.7 ...NVSS J021545321047 108 4 48.5 1.5 1.590.10 7.5 98 AAT 19.280.18 18.730.20 18.860.41 02 15 45.59 32 10 46.9 A 02 15 45.48 32 10 47.3 ...NVSS J021716325121 47 2 22.1 0.8 1.520.12 4.1 44 AAT 19.370.21 19.090.29 18.410.32 02 17 16.09 32 51 20.5 A 02 17 15.92 32 51 21.3 ...NVSS J030639330432 63 2 27.0 0.9 1.700.10 <5 ... AAT 18.670.13 18.130.14 17.780.19 03 06 39.75 33 04 32.8 A 03 06 39.80 33 04 32.7 ...NVSS J202026372823 72 2 36.8 1.2 1.340.10 <5 ... AAT 18.880.14 18.470.17 18.100.23 20 20 26.95 37 28 20.9 A 20 20 26.98 37 28 21.0 ...NVSS J202140373942 38 1 19.5 1.1 1.340.14 29.1 21 AAT 16.190.06 15.650.06 15.220.06 20 21 40.50 37 39 41.6 A 20 21 40.59 37 39 40.2 ...NVSS J202518355834 47 1 21.4 0.8 1.550.11 <6 ... AAT 19.630.23 18.840.22 18.210.25 20 25 18.32 35 58 32.5 A 20 25 18.34 35 58 33.2 ...NVSS J202856353709 168 5 98.1 3.7 1.070.10 35.8 129 AAT 17.660.09 16.880.08 16.580.09 20 28 56.52 35 37 08.8 A 20 28 56.77 35 37 06.0 ...NVSS J202945344812 99 3 52.5 2.0 1.250.10 18.9 167 NTT 17.840.15 17.620.14 17.330.13 20 29 45.66 34 48 10.3 A 20 29 45.82 34 48 15.5 ...NVSS J204147331731 32 1 16.4 0.7 1.350.13 4.2 168 AAT 17.920.10 17.200.09 16.920.11 20 41 47.58 33 17 29.1 A 20 41 47.59 33 17 29.8 ...NVSS J204420334948 46 1 20.8 0.8 1.600.11 3.5 15 NTT ... >21 ... 20 44 20.83 33 49 50.6 A ... ... ...NVSS J213510333703 47 2 22.5 0.8 1.460.11 <3 ... AAT 19.810.31 18.910.28 18.570.40 21 35 10.43 33 37 03.8 A 21 35 10.42 33 37 04.4 ...NVSS J225719343954 88 3 37.5 1.2 1.690.09 <6 ... AAT 17.150.08 16.690.08 16.540.09 22 57 19.63 34 39 55.9 A 22 57 19.63 34 39 54.6 ...NVSS J230035363410 35 1 15.2 0.7 1.670.14 <5 ... NTT 20.720.44 19.820.33 19.880.45 23 00 35.74 36 34 09.0 A 23 00 35.88 36 34 10.6 ...NVSS J230123364656 45 2 20.0 0.8 1.610.14 <6 ... NTT 20.090.34 19.650.31 19.010.28 23 01 23.56 36 46 57.3 A 23 01 23.55 36 46 56.0 ...
c©2003
RA
S,M
NR
AS
000,000–000
10
C.D
eBreu
cket
al.
Table 2. The SUMSSNVSS USS sample (contd).(1) (2) (3) (4) (5) (6) (7) (8) (9) (10) (11) (12) (13) (14) (15) (16)Name S843 S1400 1400843 LAS PA IR K(200) K(400) K(800) RAradioJ2000 DECradioJ2000 Pos RAKbandJ2000 DECKbandJ2000 z2df(mJy) (mJy) (arcsec) (deg.) (mag) (mag) (mag) h m s 0 00 h m s 0 00NVSS J230203340932 29 1 15.2 0.7 1.310.14 25.6 91 AAT 19.290.16 18.810.19 18.600.30 23 02 03.05 34 09 34.4 N 23 02 02.98 34 09 33.6 ...NVSS J230404372450 71 3 38.3 1.6 1.240.12 31.8 126 AAT 18.770.14 17.820.12 17.230.14 23 04 03.81 37 24 51.0 A 23 04 03.86 37 24 47.9 ...NVSS J230527360534 72 2 31.3 1.0 1.640.10 <3 ... NTT ... >20.6 ... 23 05 27.63 36 05 34.6 A ... ... ...NVSS J230822325027 48 2 20.9 0.8 1.680.11 1.7 141 AAT 18.870.14 18.470.17 18.550.33 23 08 22.74 32 50 30.0 A 23 08 22.78 32 50 28.9 ...NVSS J230846334810 108 3 63.1 2.3 1.070.10 29.8 114 AAT 17.600.08 16.990.08 16.580.09 23 08 46.90 33 48 13.6 A 23 08 46.73 33 48 12.4 ...NVSS J230954365653 34 1 19.3 1.5 1.150.18 55.2 25 NTT 19.900.30 19.620.28 20.760.67 23 09 54.42 36 56 46.58 N 23 09 54.66 36 56 44.7 ...NVSS J231016363624 51 2 24.1 1.2 1.480.13 28.6 3 AAT 15.350.06 14.740.06 14.570.05 23 10 16.92 36 36 32.1 A 23 10 16.89 36 36 33.1 ...NVSS J231144362215 35 1 18.1 0.7 1.320.12 16.4 69 NTT 20.520.42 20.240.65 20.070.72 23 11 45.21 36 22 16.6 A 23 11 45.22 36 22 15.4 ...NVSS J231229371324 39 1 19.4 0.8 1.400.12 5.5 161 AAT 18.470.12 17.750.12 17.530.17 23 12 29.04 37 13 26.3 A 23 12 29.08 37 13 25.6 ...NVSS J231311361558 43 2 32.7 1.7 0.540.14 62.9 48 AAT 18.460.11 17.780.12 17.500.15 23 13 11.31 36 15 59.7 A 23 13 11.11 36 15 58.4 ...NVSS J231317352133 32 1 16.5 0.7 1.350.13 6.1 102 AAT 20.040.29 19.180.26 18.690.34 23 13 17.47 35 21 34.9 A 23 13 17.54 35 21 34.0 ...NVSS J231335370609 42 1 22.9 0.8 1.210.11 <6 ... AAT 19.290.18 18.780.20 18.380.27 23 13 35.43 37 06 12.8 A 23 13 35.42 37 06 10.7 ...NVSS J231338362708 35 1 16.6 0.7 1.500.12 10.7 123 NTT 19.700.29 19.360.27 19.230.32 23 13 38.69 36 27 11.0 A 23 13 38.37 36 27 08.9 ...NVSS J231341372504 28 1 15.3 1.0 1.230.18 45.2 155 AAT 18.320.11 17.360.10 16.970.11 23 13 41.54 37 25 03.0 A 23 13 41.69 37 25 01.5 ...NVSS J231357372413 83 3 37.3 1.2 1.580.10 2.0 47 AAT 18.180.11 17.080.09 16.520.11 23 13 57.48 37 24 15.2 A 23 13 57.42 37 24 15.6 ...NVSS J231402372925 260 8 129.9 3.9 1.370.08 4.3 48 AAT 19.430.17 18.760.17 18.610.29 23 14 02.45 37 29 27.9 A 23 14 02.42 37 29 27.4 ...NVSS J231459362859 37 1 20.9 0.8 1.160.11 9.7 16 AAT 19.810.22 19.370.28 18.850.37 23 14 59.03 36 29 01.4 A 23 14 59.06 36 29 02.8 ...NVSS J231519342710 45 1 22.4 0.8 1.410.11 20.2 106 AAT 19.000.15 18.220.15 17.970.21 23 15 19.03 34 27 11.1 A 23 15 19.54 34 27 13.4 ...NVSS J231726371443 133 4 71.3 2.2 1.230.09 13.7 19 NTT 19.520.28 19.090.26 18.450.23 23 17 26.90 37 14 44.0 A 23 17 26.90 37 14 47.2 ...NVSS J231727352606 116 3 59.2 1.8 1.330.09 4.3 124 NTT ... >20.6 ... 23 17 27.41 35 26 07.1 A ... ... ...NVSS J232001363246 46 3 16.7 0.7 2.010.16 <6 ... NTT 20.700.46 20.700.60 19.920.55 23 20 01.17 36 32 46.8 N 23 20 01.27 36 32 46.5 ...NVSS J232014375100 74 2 42.7 2.2 1.110.13 44.8 128 AAT 18.330.11 17.830.13 17.550.17 23 20 14.73 37 51 00.9 N 23 20 14.40 37 51 01.0 ...NVSS J232058365157 103 3 51.4 1.6 1.380.09 <5 ... AAT 19.090.16 18.560.19 18.730.38 23 20 58.25 36 51 59.4 A 23 20 58.28 36 51 59.7 ...NVSS J232100360223 37 2 15.1 0.7 1.770.14 2.4 174 NTT 20.200.38 20.020.43 19.840.65 23 21 00.74 36 02 25.1 A 23 21 00.64 36 02 24.8 ...NVSS J232219355816 59 2 23.1 0.8 1.870.10 1.9 149 NTT ... >20.6 ... 23 22 19.66 35 58 17.3 A ... ... ...NVSS J232322345250 31 2 17.1 0.7 1.190.15 <6 ... AAT 18.500.12 17.630.11 17.120.12 23 23 22.95 34 52 49.2 A 23 23 22.96 34 52 49.1 ...NVSS J232408353547 31 2 16.3 1.2 1.300.19 ... ... 2MASS ... ... 13.400.17 23 24 08.52 35 35 47.9 N 23 24 08.62 35 35 44.7 0.2011NVSS J232602350321 27 2 16.8 1.2 0.940.24 15.2 140 AAT 16.280.06 15.250.06 14.660.06 23 26 01.70 35 03 29.6 A 23 26 01.67 35 03 27.5 ...NVSS J232651370909 71 2 32.5 1.1 1.560.10 <4 ... AAT 19.810.26 19.520.37 19.270.59 23 26 51.52 37 09 10.5 A 23 26 51.44 37 09 10.0 ...NVSS J232956374534 49 1 22.6 0.8 1.530.10 <6 ... AAT 19.840.25 18.860.22 18.530.31 23 29 56.54 37 45 40.9 A 23 29 56.61 37 45 39.1 ...NVSS J233558362236 41 2 22.1 1.4 1.240.16 39.2 148 NTT 17.340.13 16.940.11 16.730.11 23 35 58.72 36 22 36.5 N 23 35 59.01 36 22 41.6 ...NVSS J233729355529 240 7 123.0 4.4 1.330.09 7.4 72 AAT 19.920.28 19.200.29 17.940.21 23 37 29.98 35 55 31.7 A 23 37 29.76 35 55 29.0 ...NVSS J234137342230 38 1 17.4 1.0 1.550.15 <6 ... NTT ... >21 ... 23 41 37.33 34 22 32.9 A ... ... ...NVSS J234145350624 3523105 1823.254.7 1.300.08 < 5 ... AAT 17.950.10 16.870.09 16.250.09 23 41 45.90 35 06 23.4 A 23 41 45.85 35 06 22.2 ...NVSS J234904362451 90 3 46.5 1.8 1.310.10 9.5 137 AAT 19.470.20 18.320.15 17.640.16 23 49 04.24 36 24 53.4 A 23 49 04.28 36 24 53.1 ...NVSS J235137362632 85 3 37.4 1.5 1.620.11 3.9 10 NTT ... >20.4 ... 23 51 37.73 36 26 35.1 A ... ... ...c©2003
RA
S,M
NR
AS
000,000–000

Distant radio galaxies from SUMSS and NVSS 11
NVSS J002001−333408 σ(13) =0.1 mJy NVSS J002112−321208 σ(20) =0.3 mJy NVSS J002131−342225 σ(20) =0.3 mJyD
EC
LIN
AT
ION
(J2
000)
RIGHT ASCENSION (J2000)00 20 04.0 03.5 03.0 02.5 02.0 01.5 01.0 00.5 00.0
-33 33 45
34 00
15
30
DE
CL
INA
TIO
N (
J200
0)
RIGHT ASCENSION (J2000)00 21 15.0 14.5 14.0 13.5 13.0 12.5 12.0 11.5 11.0 10.5
-32 11 45
12 00
15
30
DE
CL
INA
TIO
N (
J200
0)
RIGHT ASCENSION (J2000)00 21 33.5 33.0 32.5 32.0 31.5 31.0 30.5 30.0 29.5 29.0
-34 22 00
15
30
45
NVSS J002352−332338 σ(13) =0.14 mJy NVSS J002359−325756 σ(20) =0.4 mJy NVSS J002402−325253 σ(20) =0.9 mJy
DE
CL
INA
TIO
N (
J200
0)
RIGHT ASCENSION (J2000)00 23 55.0 54.5 54.0 53.5 53.0 52.5 52.0 51.5 51.0
-33 23 15
30
45
24 00
DE
CL
INA
TIO
N (
J200
0)
RIGHT ASCENSION (J2000)00 24 02.0 01.5 01.0 00.5 00.0 59.0 58.5 58.0 57.5
-32 57 30
45
58 00
15
DE
CL
INA
TIO
N (
J200
0)
RIGHT ASCENSION (J2000)00 24 05.0 04.5 04.0 03.5 03.0 02.5 02.0 01.5 01.0 00.5
-32 52 30
45
53 00
15
NVSS J002415−324102 σ(20) =0.7 mJy NVSS J002427−325135 σ(20) =0.7 mJy NVSS J002738−323501 σ(13) =0.18 mJy
DE
CL
INA
TIO
N (
J200
0)
RIGHT ASCENSION (J2000)00 24 17.5 17.0 16.5 16.0 15.5 15.0 14.5 14.0 13.5
-32 40 45
41 00
15
30
DE
CL
INA
TIO
N (
J200
0)
RIGHT ASCENSION (J2000)00 24 30.0 29.5 29.0 28.5 28.0 27.5 27.0 26.5 26.0
-32 51 15
30
45
52 00
DE
CL
INA
TIO
N (
J200
0)
RIGHT ASCENSION (J2000)00 27 40.5 40.0 39.5 39.0 38.5 38.0 37.5 37.0 36.5 36.0
-32 34 45
35 00
15
30
NVSS J011032−335445 σ(20) =0.5 mJy NVSS J011606−331241 σ(20) =0.7 mJy NVSS J011643−323415 σ(13) =0.19 mJy
DE
CL
INA
TIO
N (
J200
0)
RIGHT ASCENSION (J2000)01 10 34.5 34.0 33.5 33.0 32.5 32.0 31.5 31.0 30.5 30.0
-33 54 30
45
55 00
15
DE
CL
INA
TIO
N (
J200
0)
RIGHT ASCENSION (J2000)01 16 09.0 08.5 08.0 07.5 07.0 06.5 06.0 05.5 05.0 04.5
-33 12 15
30
45
13 00
DE
CL
INA
TIO
N (
J200
0)
RIGHT ASCENSION (J2000)01 16 46.0 45.5 45.0 44.5 44.0 43.5 43.0 42.5 42.0 41.5
-32 33 45
34 00
15
30
Figure 2. Part of the overlays of ATCA 13cm or 20cm maps on AAT/IRIS2 or NTT/SofI K−band images. We have smoothed theSofI images using a circular 0.′′7 Gaussian, corresponding to the average seeing. The contour scheme is a geometric progression in√
2, which implies a factor two change in surface brightness every 2 contours. The first contour level, indicated above each plot, is at3σrms, where σrms is the rms noise measured around the sources. The wavelength of the radio map is given in brackets. The restoringbeams are indicated in the lower left corner of the plots. The open cross indicates the K−band identification, as listed in Table 2. Seehttp://www.eso.org/∼cbreuck/papers.html for a version with all 71 overlays.
c© 2003 RAS, MNRAS 000, 000–000

12 C. De Breuck et al.
morphology. We identify a diffuse K−band source at theposition of the brightest radio component, which is mostlikely the core. In table 2, we list the position of this radiocore.NVSS J014529−325915: The diffuse radio source appearsto lie within a small a cluster of galaxies. We identify thebright K−band source offset by (∆α, ∆δ)=(2.′′6E, 2.′′0S)from the ATCA position.NVSS J015223−333833: The K−band identification islocated along the radio axis, offset by (∆α, ∆δ)=(1.′′6E,2.′′7S) from the midpoint between the radio lobes in theATCA image.NVSS J015232−333952: The bright K−band identifica-tion is located between the main two radio lobes. The ra-dio source, also known as PMN J0152−3340, has a complexmorphology with a fainter lobe to the east of the main tworadio lobes.NVSS J015324−334117: The diffuse radio source appearsto lie within a small a cluster of galaxies. We identify thebright K−band source offset by (∆α, ∆δ)=(6.′′4E, 6.′′7S)from the ATCA position.NVSS J015418−330150: The faint K−band identifica-tion is located at the ATCA position.NVSS J015436−333425: The diffuse K−band identifica-tion is located at the ATCA position.NVSS J015544−330633: The bright K−band identifica-tion is located between the radio lobes.NVSS J021308−322338: The K−band identification islocated at the ATCA position.NVSS J021359−321115: The K−band identification islocated at the ATCA position.NVSS J021545−321047: The K−band identification islocated along the radio axis, offset by (∆α, ∆δ)=(1.′′4W,0.′′2S) from the midpoint between the radio lobes in theATCA image.NVSS J021716−325121: The K−band identification islocated between the radio lobes.NVSS J030639−330432: The K−band identification islocated at the ATCA position. This source is also known asTXS 0304−332.NVSS J202026−372823: The K−band identification islocated at the ATCA position.NVSS J202140−373942: The K−band identification islocated at the central of the 3 radio components.NVSS J202518−355834: The K−band identification islocated at the ATCA position.NVSS J202856−353709: The bright K−band identifica-tion is located between the radio lobes.NVSS J202945−344812: The K−band identification islocated along the radio axis, offset by (∆α, ∆δ)=(1.′′7E,5.′′0S) from the midpoint between the radio lobes in theATCA image.NVSS J204147−331731: The bright K−band identifica-tion is located between the radio lobes.NVSS J204420−334948: No K−band source is seen nearthe radio position in our medium deep SofI image.NVSS J213510−333703: The faint K−band identifica-tion is located at the ATCA position.NVSS J225719−343954: The bright K−band identifica-tion is located at the ATCA position. The bright galaxysouth of the ATCA position has z = 0.0871 from the 2dF-GRS.
NVSS J230035−363410: The very faint K−band identi-fication is offset by (∆α, ∆δ)=(1.′′4E, 1.′′6S) from the ATCAposition.
NVSS J230123−364656: The faint K−band identifica-tion is located at the ATCA position.
NVSS J230203−340932: The K−band identification islocated near the central radio component, which is mostlikely the core. In table 2, we list the position of this radiocore.
NVSS J230404−372450: The K−band identification islocated between the radio lobes.
NVSS J230527−360534: No K−band source is seen nearthe radio position in our SofI image.
NVSS J230822−325027: The K−band identification islocated at the ATCA position.
NVSS J230846−334810: The radio source has a com-plex morphology, consisting of at least 4 components.The K−band identification is surrounded by a number offainter clumps. This source resembles WN J1015+3038 andTN J1049−1258 (De Breuck et al. 2002).
NVSS J230954−365653: There are several faint K−bandsources located in between the radio lobes. A deeper radiomap would be needed to determine with certainty which oneis the host galaxy. We tentatively identify the galaxy closestto the line connecting the radio lobes.
NVSS J231016−363624: The bright K−band identifica-tion is located between the radio lobes. This source is alsodetected in the DENIS survey with K = 14.197 in a 4.′′5aperture.
NVSS J231144−362215: The very faint K−band identi-fication is located between the radio lobes.
NVSS J231229−371324: The K−band identification islocated at the ATCA position.
NVSS J231311−361558: The K−band identification islocated at the midpoint of the radio lobes. This is the largestradio source in our sample.
NVSS J231317−352133: The position quoted in Ta-ble 7 is for the bright eastern component only, because theK−band identification coincides with this lobe.
NVSS J231335−370609: The K−band identification isoffset by (∆α, ∆δ)=(0.′′3E, 1.′′9N) from the ATCA position.
NVSS J231338−362708: The faint K−band identifica-tion is located between the radio lobes.
NVSS J231341−372504: The K−band identification islocated at the midpoint of the radio lobes.
NVSS J231357−372413: The K−band identification islocated at the ATCA position.
NVSS J231402−372925: The K−band identification islocated at the ATCA position.
NVSS J231459−362859: The K−band identification islocated at the ATCA position.
NVSS J231519−342710: The K−band identification islocated along the radio axis, offset by (∆α, ∆δ)=(5.′′9E,2.′′1S) from the midpoint between the radio lobes in theATCA image.
NVSS J231726−371443: There are two K−band objectslocated along the radio axis, which may both be componentsof the host galaxy. We conservatively assume that only thenorthernmost component, offset by (∆α, ∆δ)=(0.′′2E, 2.′′2S)from the northern radio lobe in the ATCA image, is thehost galaxy. The position quoted in Table 2 is for the bright
c© 2003 RAS, MNRAS 000, 000–000

Distant radio galaxies from SUMSS and NVSS 13
northern component only, because it is near the NVSS po-sition.NVSS J231727−352606: No K−band source is seen nearthe radio position in our medium deep SofI image.NVSS J232001−363246: The faint K−band identifica-tion is located at the ATCA position.NVSS J232014−375100: The K−band identification islocated between the radio lobes of this large radio source,offset by (∆α, ∆δ)=(4.′′1W, 0.′′1S) from the NVSS position.NVSS J232058−365157: The K−band identification islocated at the ATCA position.NVSS J232100−360223: The very faint K−band identifi-cation is offset by (∆α, ∆δ)=(1.′′2W, 1.′′1N) from the ATCAposition.NVSS J232219−355816: No K−band source is seen nearthe radio position in our SofI image.NVSS J232322−345250: The K−band identification islocated at the ATCA position.NVSS J232408−353547: An optical galaxy is seen in boththe DSS and 2MASS at the NVSS position, so we did notobserve this source with the ATCA or AAT.NVSS J232602−350321: The bright K−band identifica-tion is coincident with an extended radio source.NVSS J232651−370909: The faint K−band identifica-tion is located at the ATCA position.NVSS J232956−374534: The faint K−band identifica-tion is offset by (∆α, ∆δ)=(0.′′7E, 1.′′5N) from the ATCAposition.NVSS J233558−362236: We identify the host galaxy asthe bright K−band source, located along the radio axis,nearer to the brightest radio lobe.NVSS J233729−355529: The radio source has a complexmorphology, consisting of three non-aligned components. Weidentify the host galaxy with a diffuse K−band source, co-incident with the brightest radio component.NVSS J234137−342230: No K−band source is seen nearthe radio position in our SofI image.NVSS J234145−350624: The bright K−band identifica-tion is located at the ATCA position. This source is alsoknown as PKS J2341−3506.NVSS J234904−362451: The K−band identification islocated between the radio lobes.NVSS J235137−362632: No K−band source is seen nearthe radio position in our medium deep SofI image.
c© 2003 RAS, MNRAS 000, 000–000
Related Documents
![Chandra arXiv:1504.01397v2 [astro-ph.CO] 29 Dec 2015 · 15 erg s 1 cm 2. The south-ern one is a bright radio source listed in both the NVSS (Condon et al. 1998) and FIRST (Becker](https://static.cupdf.com/doc/110x72/6050137c97fe7e777a630cb6/chandra-arxiv150401397v2-astro-phco-29-dec-2015-15-erg-s-1-cm-2-the-south-ern.jpg)


