arXiv:1003.4047v2 [astro-ph.CO] 6 Apr 2010 A Radio Spectral Line Study of the 2-Jy IRAS-NVSS Sample: Part I Maria Ximena Fernandez Department of Astronomy, Columbia University, 550 West 120th Street, New York, NY 10027 [email protected] Emmanuel Momjian National Radio Astronomy Observatory, P. O. Box O, Socorro, NM, 87801 [email protected] Christopher J. Salter NAIC, Arecibo Observatory, HC 3, Box 53995, Arecibo, PR 00612 [email protected] Tapasi Ghosh NAIC, Arecibo Observatory, HC 3, Box 53995, Arecibo, PR 00612 [email protected] ABSTRACT We present results from an on-going survey for the H I 21 cm line and the OH 18 cm lines in IR galaxies with the Arecibo 305 m Radio Telescope. The observations of 85 galaxies extracted from the 2 Jy IRAS-NVSS sample in the R.A. (B1950) range 20 h –00 h are reported in this paper. We detected the H I 21 cm line in 82 of these galaxies, with 18 being new detections, and the OH 18 cm lines in 7 galaxies, with 4 being new detections. In some cases, the H I spectra show the classic double-horned or single-peaked emission profiles. However, the majority exhibit distorted H I spectral features indicating that the galaxies are in interacting and/or merging systems. From these H I and OH observations, various properties of the sample are derived and reported. Subject headings: galaxies: general — galaxies: interactions — masers — radio emission lines — techniques: spectroscopic

Welcome message from author
This document is posted to help you gain knowledge. Please leave a comment to let me know what you think about it! Share it to your friends and learn new things together.
Transcript
arX
iv:1
003.
4047
v2 [
astr
o-ph
.CO
] 6
Apr
201
0
A Radio Spectral Line Study of the 2-Jy IRAS-NVSS Sample:
Part I
Maria Ximena Fernandez
Department of Astronomy, Columbia University, 550 West 120th Street, New York, NY
10027
Emmanuel Momjian
National Radio Astronomy Observatory, P. O. Box O, Socorro, NM, 87801
Christopher J. Salter
NAIC, Arecibo Observatory, HC 3, Box 53995, Arecibo, PR 00612
Tapasi Ghosh
NAIC, Arecibo Observatory, HC 3, Box 53995, Arecibo, PR 00612
ABSTRACT
We present results from an on-going survey for the H I 21 cm line and the
OH 18 cm lines in IR galaxies with the Arecibo 305 m Radio Telescope. The
observations of 85 galaxies extracted from the 2 Jy IRAS-NVSS sample in the
R.A. (B1950) range 20h–00h are reported in this paper. We detected the H I
21 cm line in 82 of these galaxies, with 18 being new detections, and the OH 18 cm
lines in 7 galaxies, with 4 being new detections. In some cases, the H I spectra
show the classic double-horned or single-peaked emission profiles. However, the
majority exhibit distorted H I spectral features indicating that the galaxies are
in interacting and/or merging systems. From these H I and OH observations,
various properties of the sample are derived and reported.
Subject headings: galaxies: general — galaxies: interactions — masers — radio
emission lines — techniques: spectroscopic

– 2 –
1. Introduction
At bolometric luminosities above 1011L⊙, infrared (IR) galaxies become the dominant
population of extragalactic objects in the local universe (z ≤ 0.3). These galaxies are
subdivided into three categories: luminous (LIRGs, LIR > 1011L⊙), ultraluminous (ULIRGs,
LIR > 1012L⊙), and hyperluminous (HyLIRGs, LIR > 1013L⊙; Sanders & Mirabel 1996).
Even though these IR galaxies are relatively rare, comprising less than 6% of the total
IR energy density in the local Universe (Soifer & Neugebauer 1991), some studies suggest
that the majority of galaxies with LB > 1011L⊙ go through a stage of intense IR emission
(Soifer et al. 1987).
Most IR galaxies with LIR < 1011L⊙ are single, gas-rich spirals, and their IR emission
can be accounted for by star formation. In the luminosity range 1011 < LIR < 1012L⊙,
most of the galaxies are interacting/merging systems with enormous quantities of molecular
gas (∼ 1010 M⊙). At the lower end of this range, the bulk of the IR luminosity is due to
warm dust grains heated by a nuclear starburst, while active galactic nuclei (AGN) become
increasingly important at higher luminosities. Galaxies with LIR > 1012L⊙ are believed to
be advanced mergers powered by a combination of starburst and AGN (Sanders & Mirabel
1996).
Previous H I observations of IR galaxies have revealed very broad absorption lines in
ULIRGs, indicating rotation plus large amounts of turbulent gas (Mirabel 1982). High
angular resolution Very Large Array (VLA) and Very Long Baseline Interferometry (VLBI)
observations show that these galaxies have the absorbing H I situated in the inner few
hundred parsecs along the line of sight to the nuclear continuum sources (Baan et al. 1987;
Momjian et al. 2003).
Several OH 18 cm absorption and megamaser (hereafter OHM) emission surveys of
ULIRGs have also been published (Baan 1989; Darling & Giovanelli 2000, 2001, 2002). Baan
(1989) concluded that the OHM emission usually occurs in galaxies with higher far-IR (FIR)
luminosities and flatter 100–25 µm spectra rather than in those with OH 18 cm absorption
features.
Here, we report results from an on-going spectroscopic survey with the Arecibo Radio
Telescope1 targeting the H I 21 cm and the main and satellite OH 18 cm lines of 85 IR
galaxies from the 2-Jy IRAS-NVSS sample (Yun, Reddy & Condon 2001). In this paper, we
adopt H0 = 71 km s−1 Mpc−1, ΩM = 0.27, and ΩΛ = 0.73.
1The Arecibo Observatory is part of the National Astronomy and Ionosphere Center, which is operated
by Cornell University under a cooperative agreement with the National Science Foundation.
– 3 –
2. The Sample
The 85 galaxies reported in this paper are a first set of objects extracted from the 2-
Jy IRAS-NVSS sample (Yun, Reddy & Condon 2001), which consists of 1809 IRAS sources
that have S60 µm ≥ 2 Jy with 1.4 GHz radio counterparts from the NRAO-VLA Sky Survey
(NVSS; Condon et al. 1998). The selection criteria for our full sample are: (1) they lie within
the area of sky accessible to the Arecibo telescope (i.e. −1 < declination < 38), (2) have
LFIR ≥ 7 × 10⁹ L⊙, and (3) have heliocentric velocities between 0 and 50,000 km s−1. The
number of galaxies that meet these criteria is 582. The present study includes 85 of these
galaxies within the R.A. (B1950) range 20h–00h.
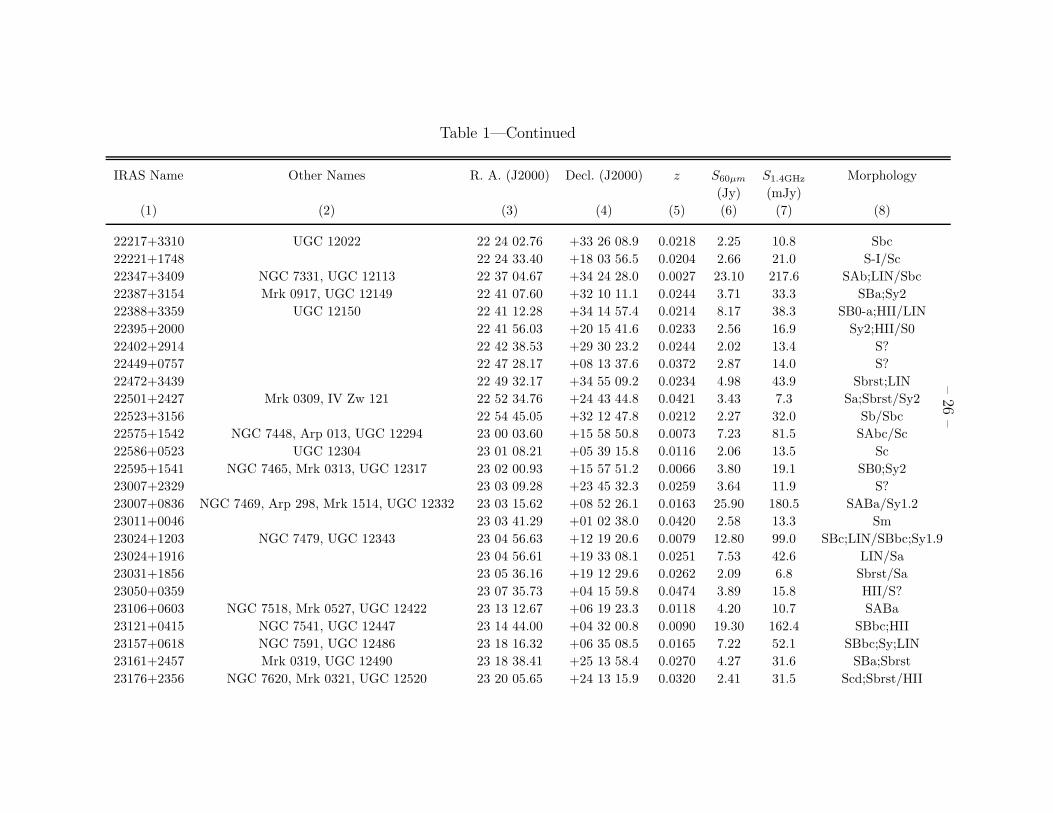
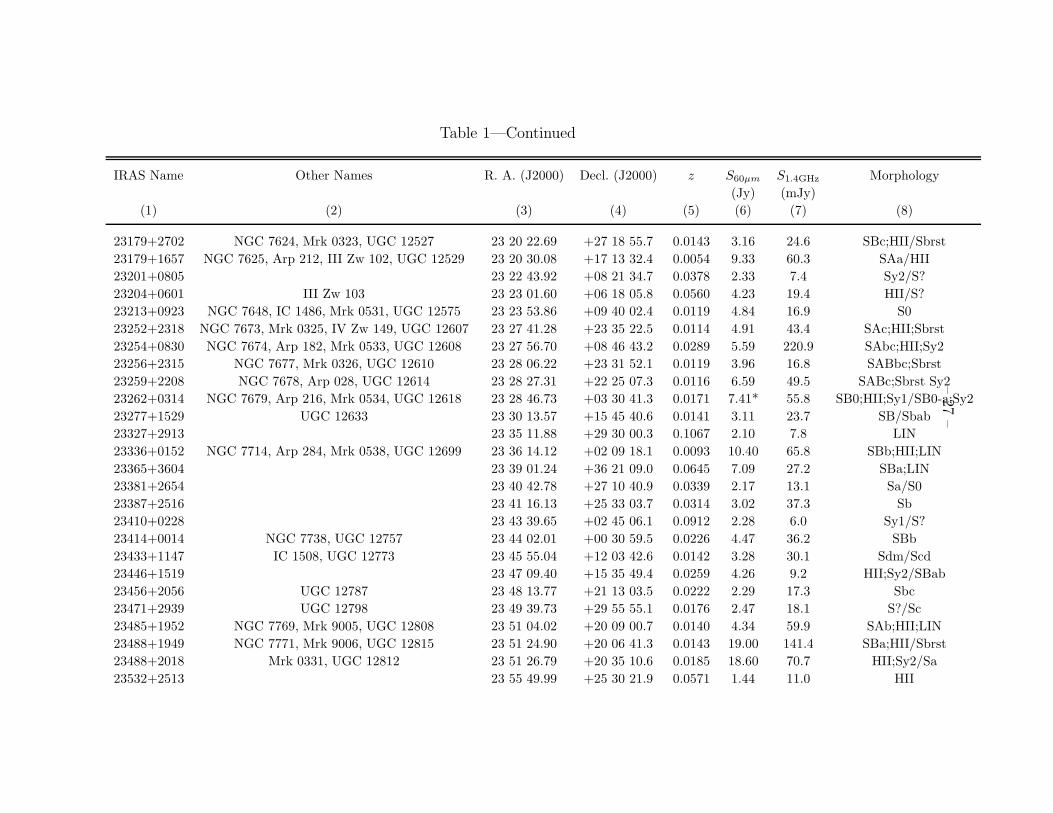
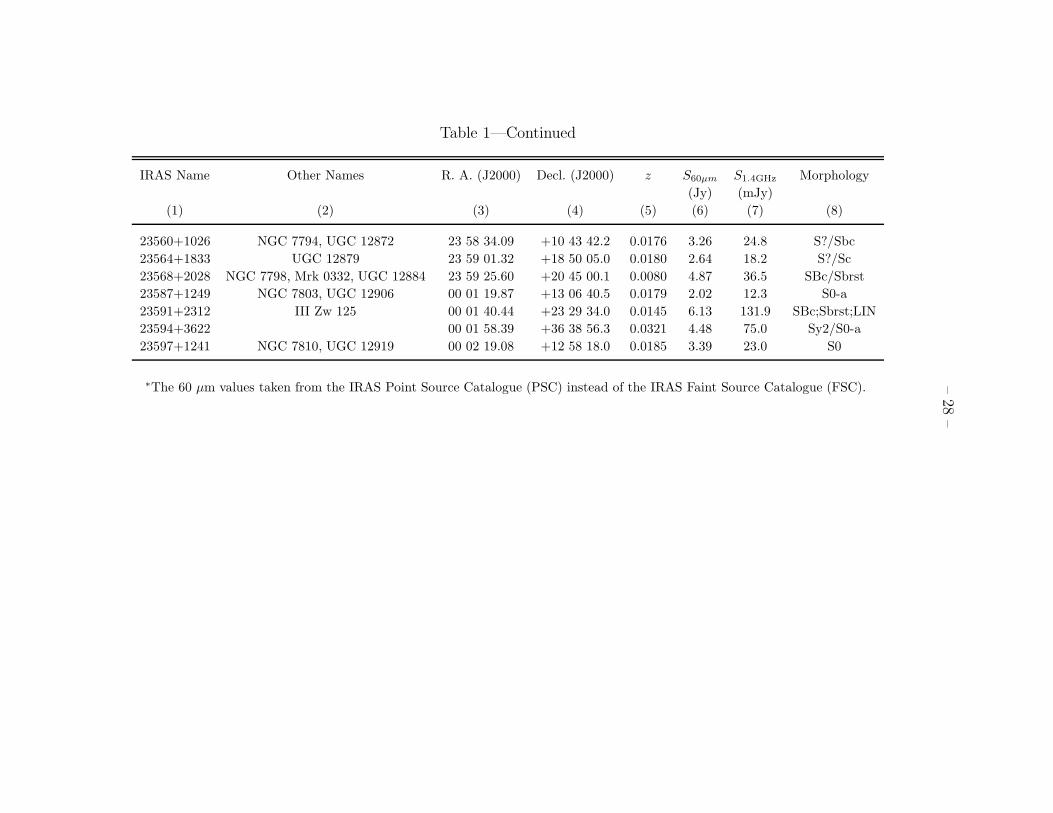
Table 1 presents the 85 galaxies reported in the paper. Column (1) gives the IRAS
names of the galaxies, and column (2) lists other common designations, where applicable.
Column (3) and (4) are the Right Ascensions and Declinations actually observed in J2000
coordinates. Column (5) lists the optical redshifts retrieved from the NASA/IPAC Extra-
galactic Database (NED). Column (6) is the 60 µm flux densities from the IRAS Faint Source
Catalog (FSC), where available. Galaxies marked with an asterisk do not have 60 µm flux
density measurements in the FSC, and for these the IRAS Point Source Catalog (PSC) values
are given instead. Column (7) is the 1.4 GHz flux densities from the NVSS survey. Column
(8) provides the morphologies listed in NED and in the Hyperleda database (Paturel et al.
2003).
3. Observations and Data Reduction
The 85 galaxies were observed with the 305 m Arecibo radio telescope between July and
November 2004 using the L-band wide receiver. The low frequency cut-off of the receiver is
1100 MHz, well below the heliocentric velocity limit of 50,000 km s−1 for our sample. The
four independent boards of the Arecibo Interim Correlator were utilized to simultaneously
observe the following redshifted transitions: the H I 21 cm line (1420.40575 MHz), both of
the OH 18 cm main lines (1665.4018 and 1667.359 MHz), and the two OH 18 cm satellite
lines at 1612.231 and 1720.530 MHz. A bandwidth of 12.5 MHz (dual polarization) was used
for each correlator board with 1024 spectral channels per polarization. The three boards
that targeted the H I and the OH satellite lines were centered at the frequencies of the
respective redshifted transitions, while the central frequency of the board targeting the two
OH 18 cm main lines was set to the redshifted value of the 1667.359 MHz transition. We used
the total-power, position-switching (ON-OFF), observational mode for all the objects in our
sample. However, the spectra of some sources showed significant baseline ripples. For these
sources, the Double Position Switching (DPS; Ghosh & Salter 2002) observing technique,
– 4 –
which requires observing a nearby bandpass calibrator, was utilized in order to minimize the
baseline ripples in their spectra.
The data were reduced using the standard Arecibo Observatory (AO) IDL routines and
special-purpose codes developed by AO staff. The spectra of the sources observed with the
ON-OFF mode were converted to units of flux density using the noise-diode calibration and
the standard gain curves. For sources observed in DPS mode, the flux densities of the band-
pass calibrators were used to convert the ratio spectra to Janskys. Hanning smoothing was
applied to the raw spectra, and after averaging the two polarizations, a 9-channel boxcar
smoothing was applied to further improve the signal-to-noise ratio. The resulting spectral
resolution was 112 kHz. Polynomial baselines were fitted to the resulting spectra and sub-
tracted from them to produce the final spectra used to derive the velocity, velocity widths,
the integrated intensities of the lines, and the rms noises on the spectra for each object.
4. Results
4.1. H I 21 cm Line Spectra
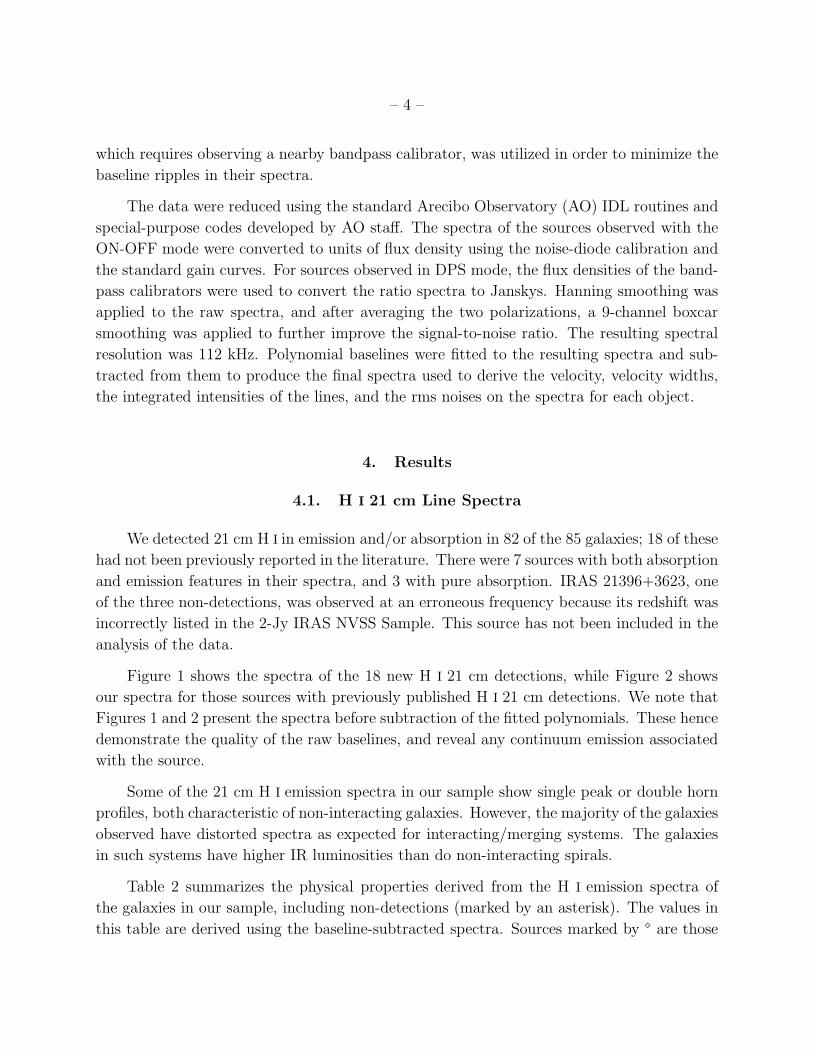
We detected 21 cm H I in emission and/or absorption in 82 of the 85 galaxies; 18 of these
had not been previously reported in the literature. There were 7 sources with both absorption
and emission features in their spectra, and 3 with pure absorption. IRAS 21396+3623, one
of the three non-detections, was observed at an erroneous frequency because its redshift was
incorrectly listed in the 2-Jy IRAS NVSS Sample. This source has not been included in the
analysis of the data.
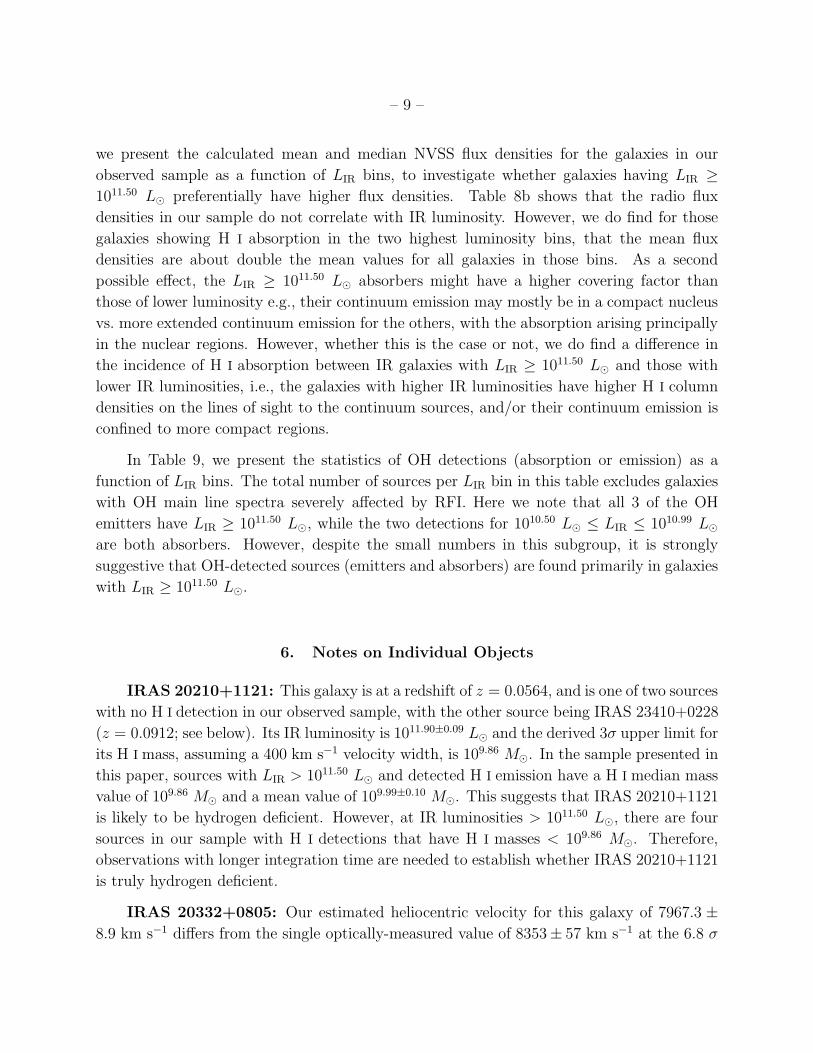
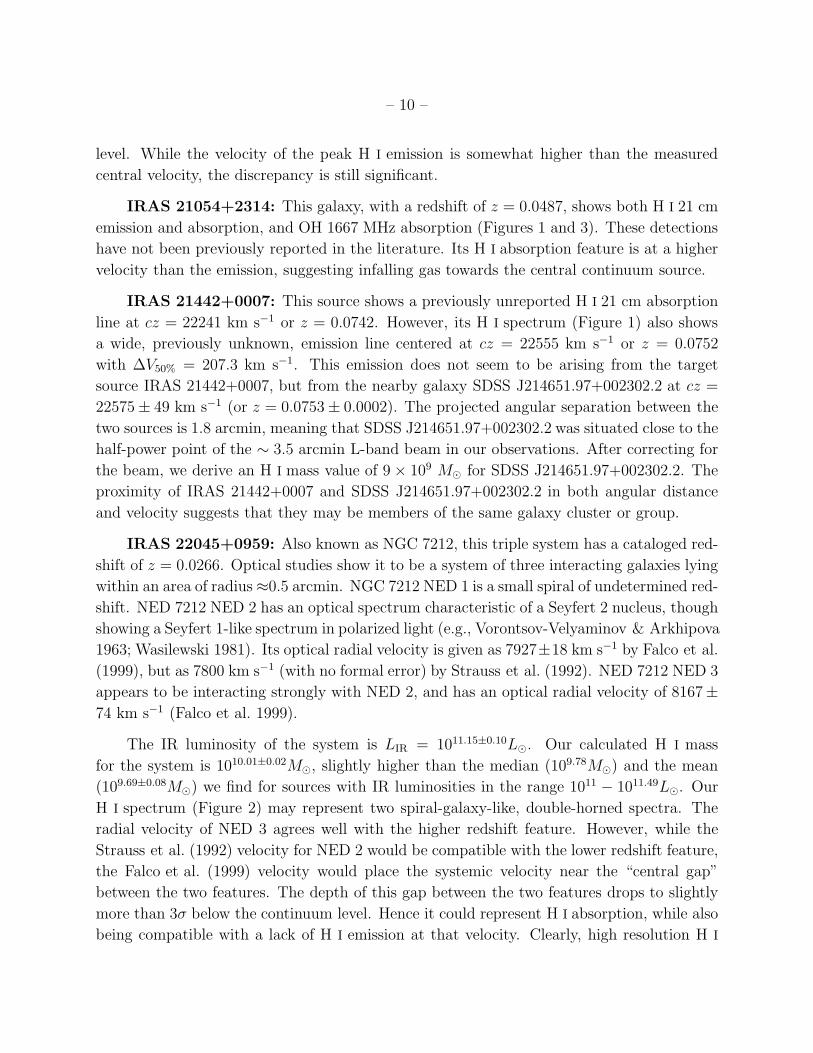
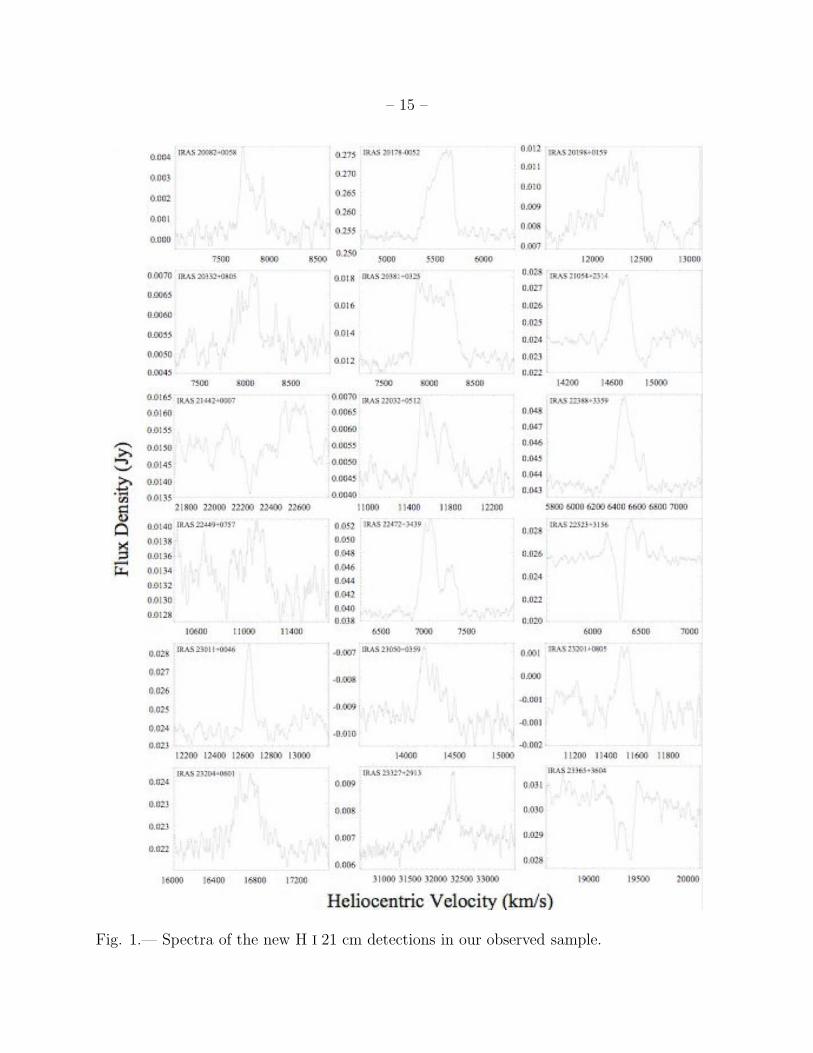
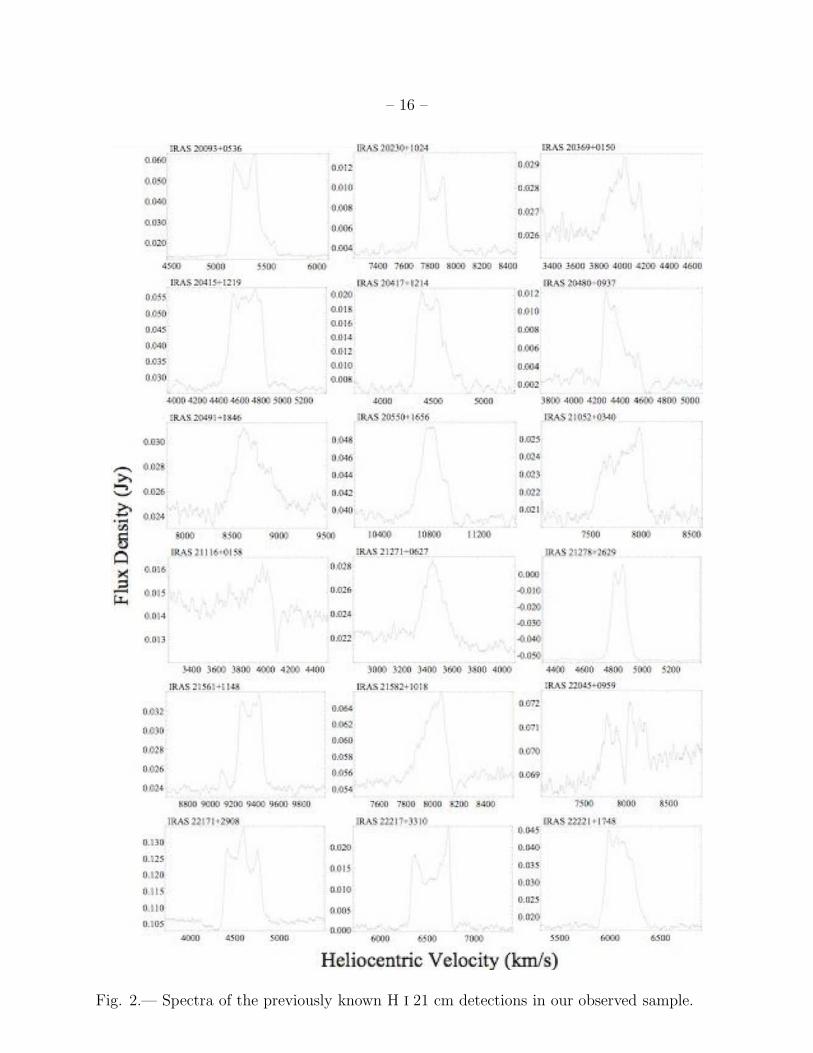
Figure 1 shows the spectra of the 18 new H I 21 cm detections, while Figure 2 shows
our spectra for those sources with previously published H I 21 cm detections. We note that
Figures 1 and 2 present the spectra before subtraction of the fitted polynomials. These hence
demonstrate the quality of the raw baselines, and reveal any continuum emission associated
with the source.
Some of the 21 cm H I emission spectra in our sample show single peak or double horn
profiles, both characteristic of non-interacting galaxies. However, the majority of the galaxies
observed have distorted spectra as expected for interacting/merging systems. The galaxies
in such systems have higher IR luminosities than do non-interacting spirals.
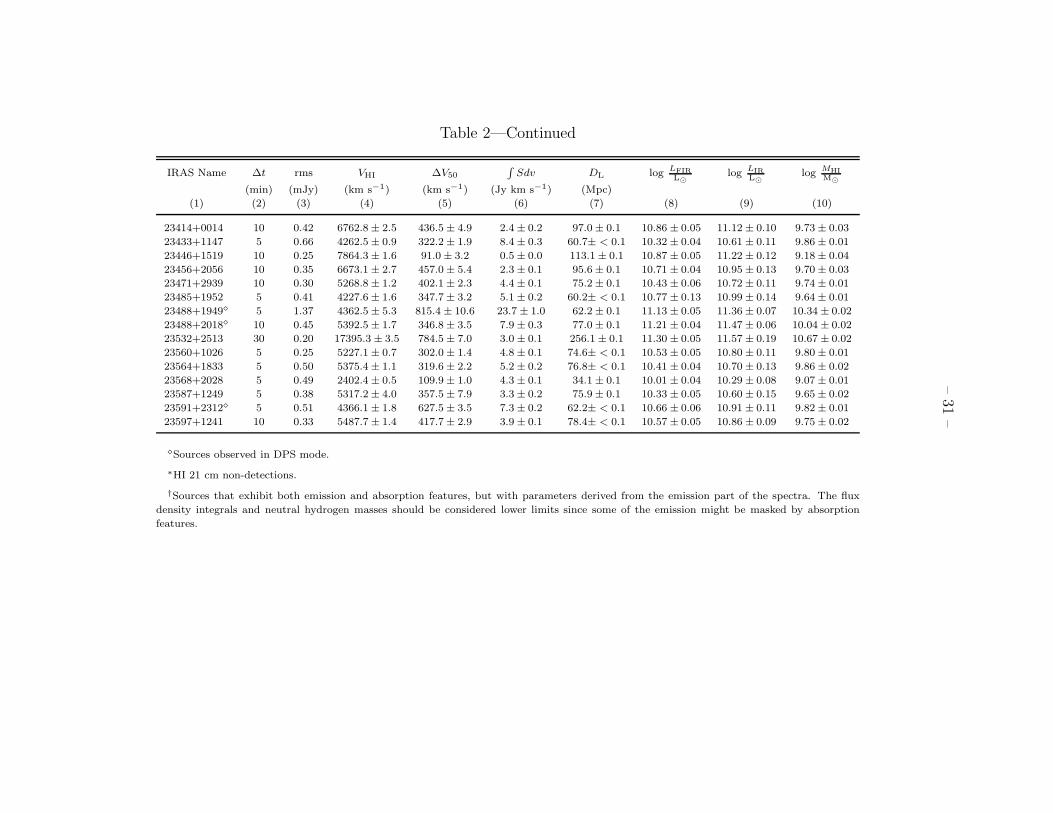
Table 2 summarizes the physical properties derived from the H I emission spectra of
the galaxies in our sample, including non-detections (marked by an asterisk). The values in
this table are derived using the baseline-subtracted spectra. Sources marked by ⋄ are those

– 5 –
observed in DPS mode. Seven sources (indicated by † in Table 2) exhibit both emission
and absorption features in their spectra. For these, the table contains information from
the emission part of the spectra, and the derived flux density integrals and neutral hydrogen
masses should be considered to be lower limits because some of the emission might be masked
by the absorption features. The absorption components are presented separately later in this
section. Column (1) in Table 2 lists the IRAS names of the galaxies. Column (2) gives the
total on-source integration times. Column (3) lists the rms noise levels. Column (4) lists
the heliocentric velocities at which the H I emission lines are centered. For non-detections,
the values correspond to the optical velocities retrieved from NED. Column (5) is the full
velocity widths at half maximum (FWHM) for the observed emission lines. Column (6) is
the flux density integrals (∫Sdv) of the H I lines. For non-detections, the values are 3σ upper
limits derived assuming ∆V50 = 400 km s−1. Column (7) lists the luminosity distances (DL)
of the galaxies derived using their respective velocities (column 4). Column (8) gives the
logarithms of the FIR luminosities calculated using the equation (e.g. Sanders & Mirabel
1996):
LFIR(L⊙) = 3.96× 10⁵ D2L (2.58f60 + f100) (1)
where DL is in Mpc, and f60 and f100 are respectively the 60 and 100 µm flux densities in
Jy. Column (9) is the logarithms of the total IR luminosities derived using the equation (e.g.
Sanders & Mirabel 1996):
LIR(L⊙) = 5.67× 10⁵ D2L (13.48f12 + 5.16f25 + 2.58f60 + f100). (2)
Column (10) lists the logarithms of the total neutral hydrogen mass values derived using the
expression (Roberts 1975) :
MHI(M⊙) = 2.36× 10⁵ D2L
∫Sdv (3)
where the∫Sdv is the flux density integral in Jy km s−1.
Table 3 lists the parameters of the H I absorbers. The properties of the H I absorption
lines are derived from spectra where the flux densities were scaled into optical depths (τ)
and plotted against heliocentric velocity. The values in this table are also obtained using
the baseline-subtracted spectra. Column (1) lists the IRAS names of the galaxies. Column
(2) lists their luminosity distances. These distances are derived using the velocity of the
H I emission line for sources that exhibit both H I emission and absorption (from Table 2),
and the optical redshift values (from Table 1) for sources that exhibit H I absorption only.
Columns (3) and (4) give the logarithms of the FIR and the total IR luminosities calculated
using equations 1 and 2, respectively. Column (5) is the total on-source integration times.
Columns (6) lists the rms noise levels. Column (7) lists the heliocentric velocities at the peak

– 6 –
of the absorption feature in each source. Column (8) is the FWHM velocity values of the
overall observed absorption profile. Column (9) lists the peak optical depths. Column (10)
gives the H I column densities divided by the spin temperature which are derived assuming
a covering factor of unity and using the equation (e.g. Rohlfs 1986):
N(HI)/Ts (cm−2 K−1) = 1.823× 10¹⁸
∫τdv. (4)
4.2. OH 18 cm Line Spectra
We detected OH 18 cm main lines in 7 galaxies; 3 in emission (OHMs) and 4 in absorp-
tion. Of these, 1 OHM and 3 OH absorbers are new detections (Figure 3). For these spectra,
the 1667.359 MHz line was used for deriving the velocity scale. There were no detections
of the OH 18 cm satellite lines at 1612 and 1720 MHz in any of the galaxies of our sample.
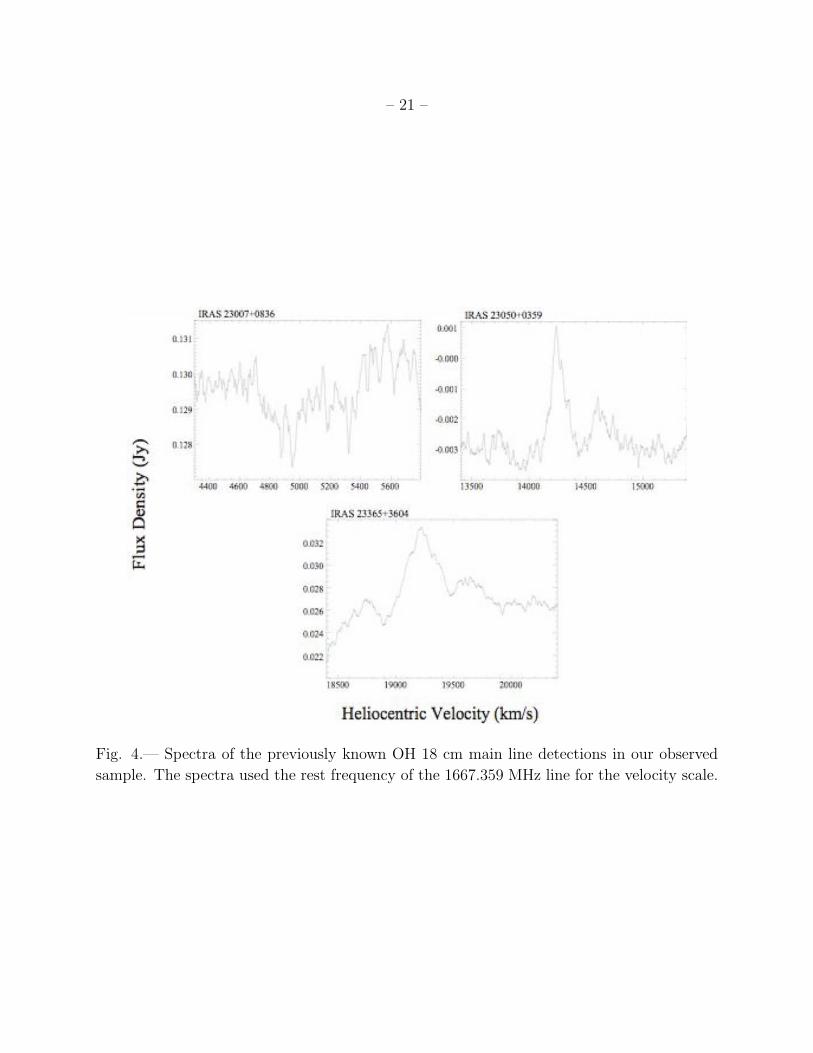
Figure 4 shows the spectra of the 3 sources with previously known OH 18 cm main lines.
As for the H I 21 cm spectra in Figures 1 & 2, Figures 3 & 4 present the final spectra, but
without the subtraction of fitted polynomials.
Table 4 summarizes the parameters derived from the OHM detections. The values in
this table are derived using the baseline-subtracted spectra. Column (1) lists the IRAS
names of the galaxies. Column (2) is the total on-source integration times. Column (3)
gives the rms noise levels, and column (4) lists the heliocentric velocities at the center of the
1667.359 MHz line emission. Columns (5) and (8) are the peak flux densities of the 1667
and 1665 MHz lines respectively, columns (6) and (9) are their full velocity widths at half
maximum, and columns (7) and (10) list their integrated flux densities. Column (11) lists
the hyperfine ratios obtained by dividing the integrated flux density of the 1667 MHz line
by that at 1665 MHz for each source. In thermodynamic equilibrium conditions, this ratio
would be RH = 1.8, and it increases as the saturation of a masing region increases. Column
(12) lists the logarithms of the predicted OH luminosities (in units of L⊙) which have been
calculated using the following equation from Kandalian (1996):
logLpredOH = 1.38 logLFIR − 14.02, (5)
while column (13) gives the logarithms of the measured isotropic OH line luminosities, which
represents the combined integrated flux densities of the two OH 18 cm main lines. Columns
(14) and (15) are the rms noise values for the 1612 and 1720 MHz transitions. Blank fields
in these two columns indicate that the rms noise values could not be estimated because of
severe radio frequency interference (RFI).
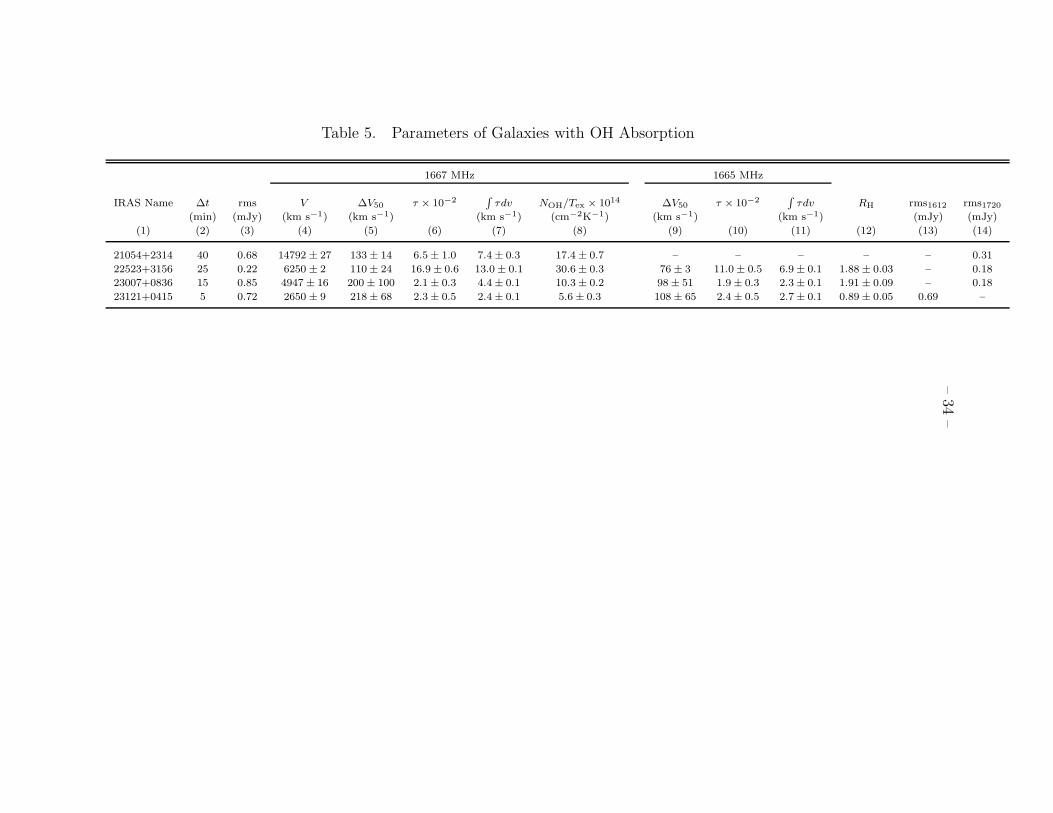
Table 5 lists the parameters derived from the OH absorption lines. The values in this
– 7 –
table are derived using the baseline-subtracted spectra. Column (1) is the IRAS names of
the galaxies. Column (2) is the total on-source integration times. Column (3) gives the rms
noise levels, and column (4) lists the heliocentric velocities at the center of the 1667.359 MHz
absorption lines. Columns (5) and (9) are the full velocity widths at half maximum of the
1667 and 1665 MHz lines respectively, columns (6) and (10) are their peak optical depths,
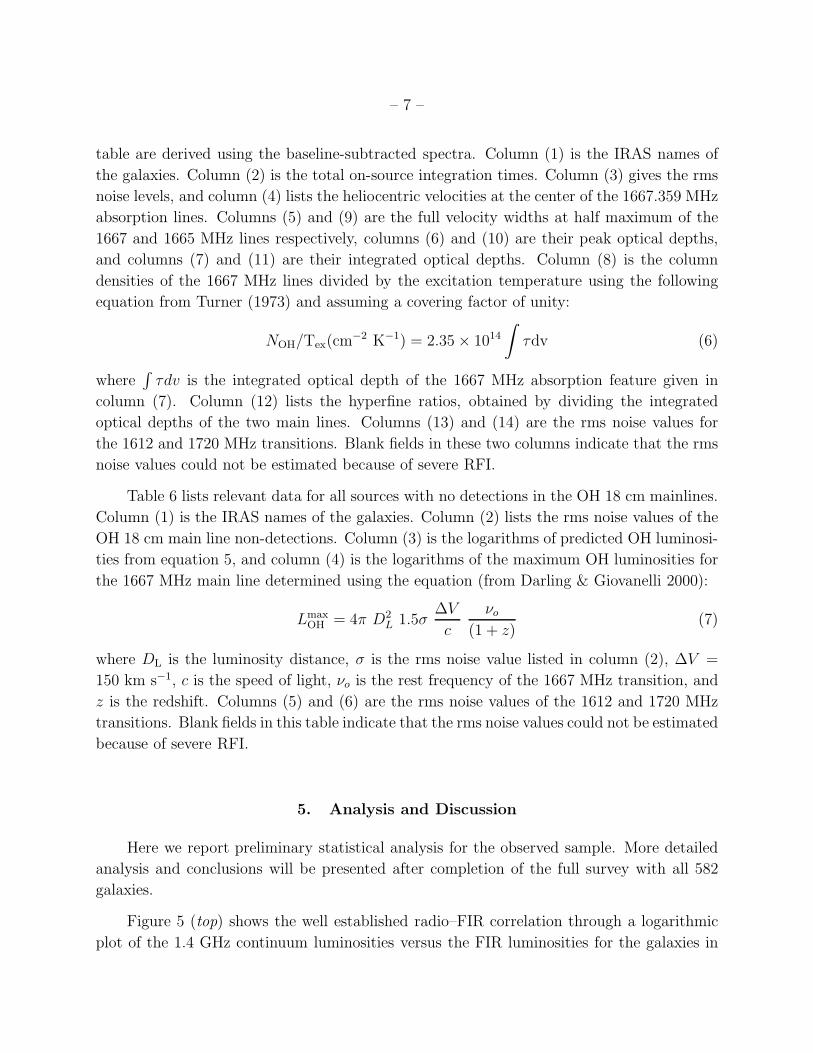
and columns (7) and (11) are their integrated optical depths. Column (8) is the column
densities of the 1667 MHz lines divided by the excitation temperature using the following
equation from Turner (1973) and assuming a covering factor of unity:
NOH/Tex(cm−2 K−1) = 2.35× 10¹⁴
∫τdv (6)
where∫τdv is the integrated optical depth of the 1667 MHz absorption feature given in
column (7). Column (12) lists the hyperfine ratios, obtained by dividing the integrated
optical depths of the two main lines. Columns (13) and (14) are the rms noise values for
the 1612 and 1720 MHz transitions. Blank fields in these two columns indicate that the rms
noise values could not be estimated because of severe RFI.
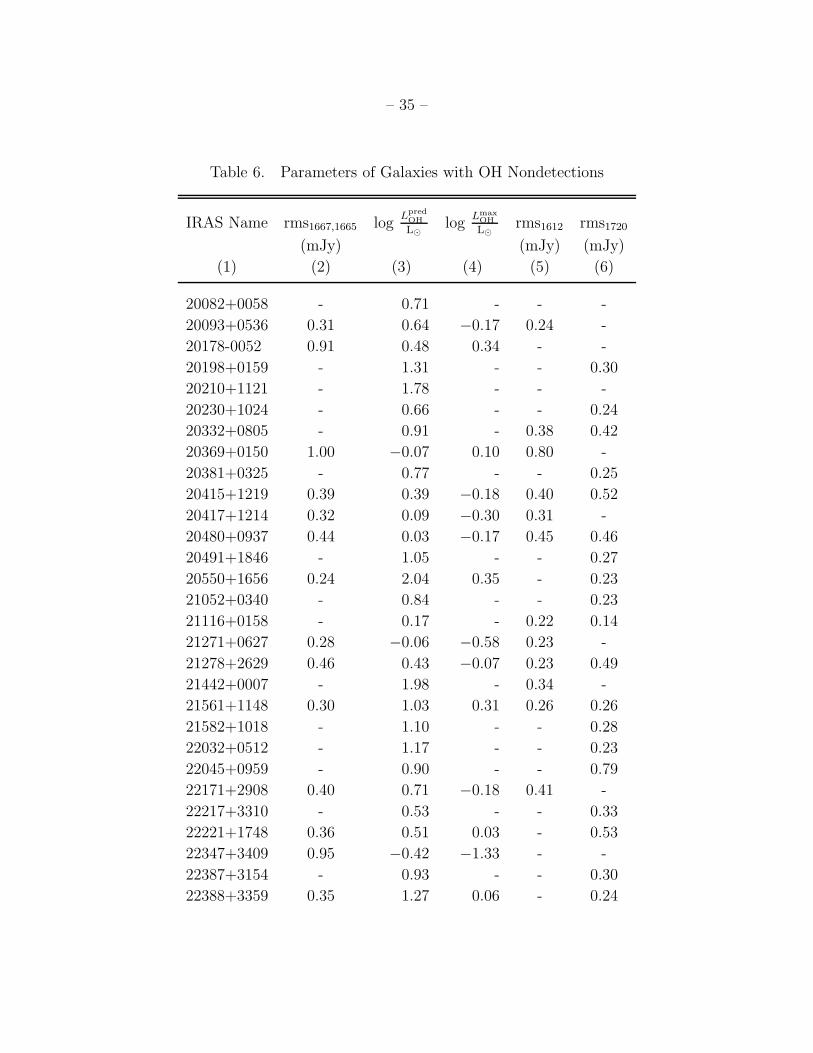
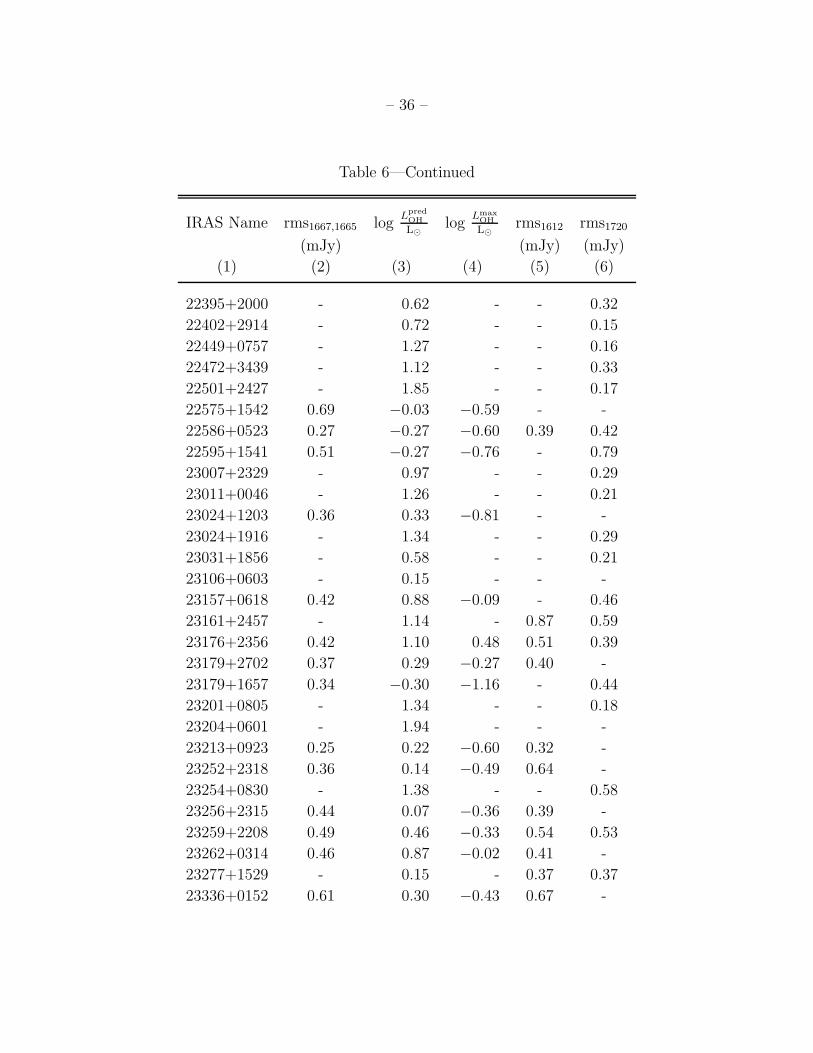
Table 6 lists relevant data for all sources with no detections in the OH 18 cm mainlines.
Column (1) is the IRAS names of the galaxies. Column (2) lists the rms noise values of the
OH 18 cm main line non-detections. Column (3) is the logarithms of predicted OH luminosi-
ties from equation 5, and column (4) is the logarithms of the maximum OH luminosities for
the 1667 MHz main line determined using the equation (from Darling & Giovanelli 2000):
LmaxOH = 4π D2
L 1.5σ∆V
c
νo(1 + z)
(7)
where DL is the luminosity distance, σ is the rms noise value listed in column (2), ∆V =
150 km s−1, c is the speed of light, νo is the rest frequency of the 1667 MHz transition, and
z is the redshift. Columns (5) and (6) are the rms noise values of the 1612 and 1720 MHz
transitions. Blank fields in this table indicate that the rms noise values could not be estimated
because of severe RFI.
5. Analysis and Discussion
Here we report preliminary statistical analysis for the observed sample. More detailed
analysis and conclusions will be presented after completion of the full survey with all 582
galaxies.
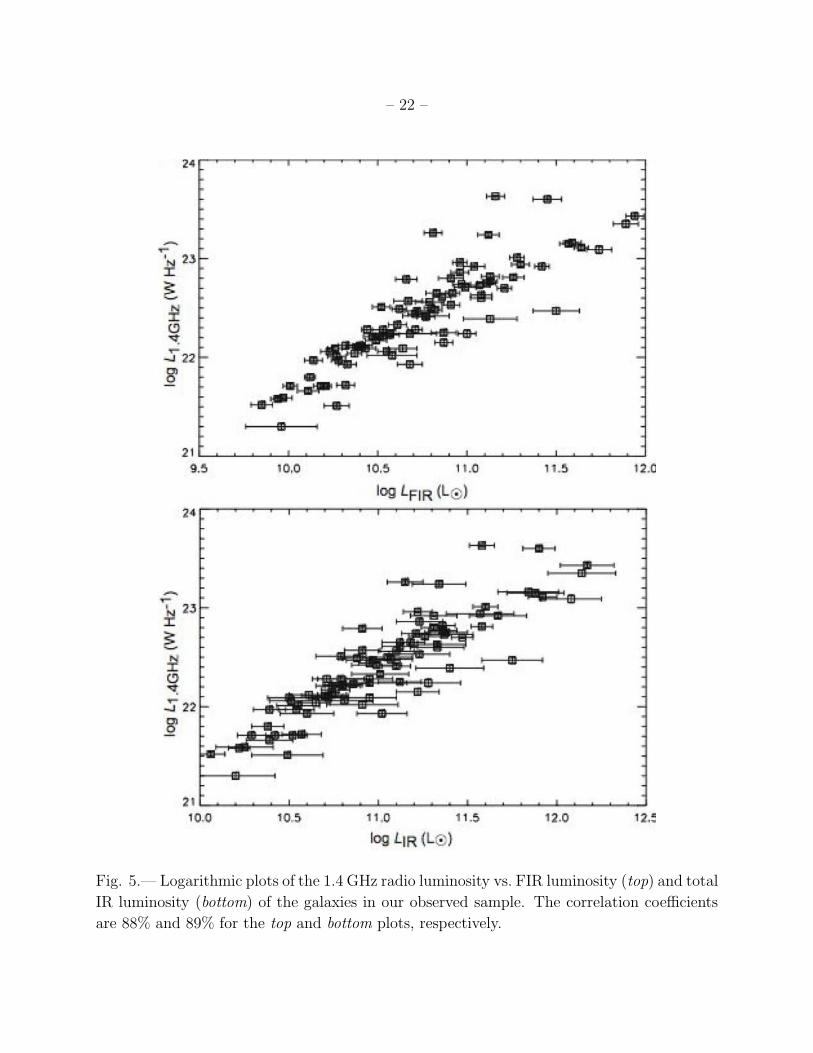
Figure 5 (top) shows the well established radio–FIR correlation through a logarithmic
plot of the 1.4 GHz continuum luminosities versus the FIR luminosities for the galaxies in

– 8 –
our sample. The derived correlation coefficient is 88%. Figure 5 (bottom) shows a logarithmic
plot of the 1.4 GHz continuum luminosities versus the total IR luminosities. The correlation
coefficient here is 89%.
This remarkably tight linear correlation between the total radio continuum emission
and the IR (or FIR) luminosities is well known for “normal” galaxies where the main energy
source is not due to a supermassive black hole (Condon 1992). The most obvious inter-
pretation of this correlation is the presence of massive stars that provide both relativistic
particles via subsequent supernova events, and heat the interstellar dust which radiates at
IR (or FIR) wavelengths (Helou, Soifer & Rowan-Robinson 1985; Wunderlich & Klein 1988;
Condon 1992).
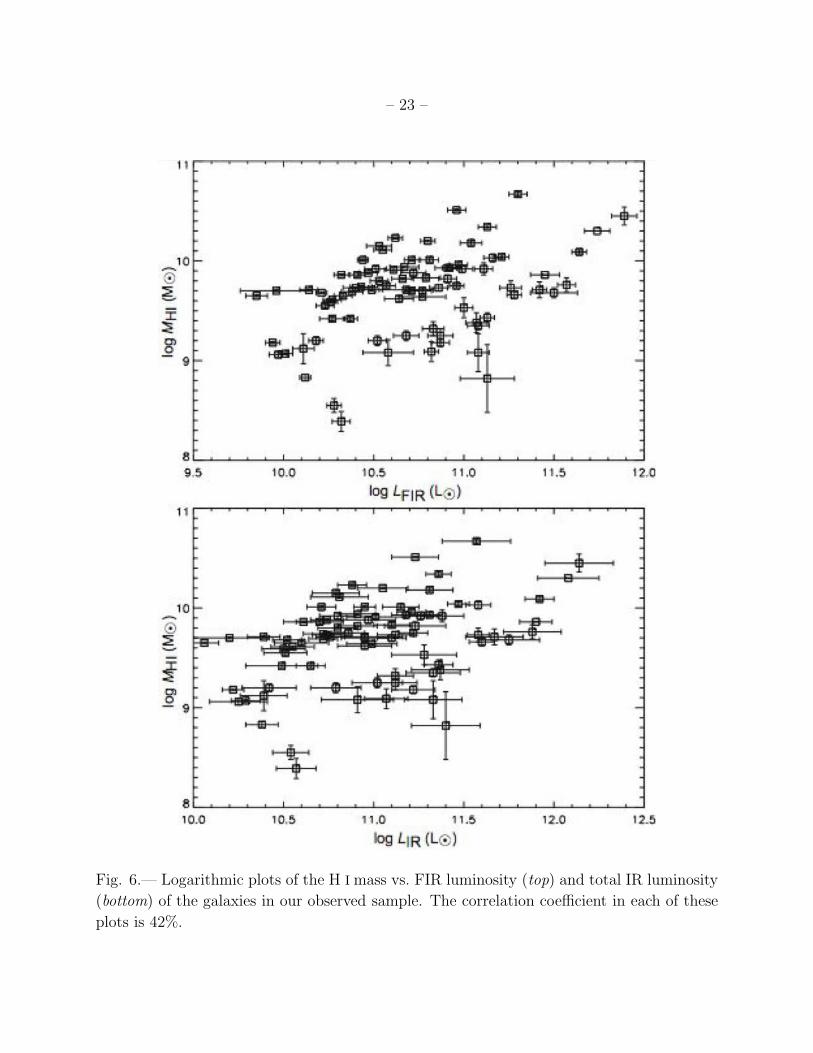
Figure 6 shows logarithmic plots of the H I mass versus the FIR (top) and IR (bottom)
luminosities for the observed sample. Both plots show extremely weak correlations with
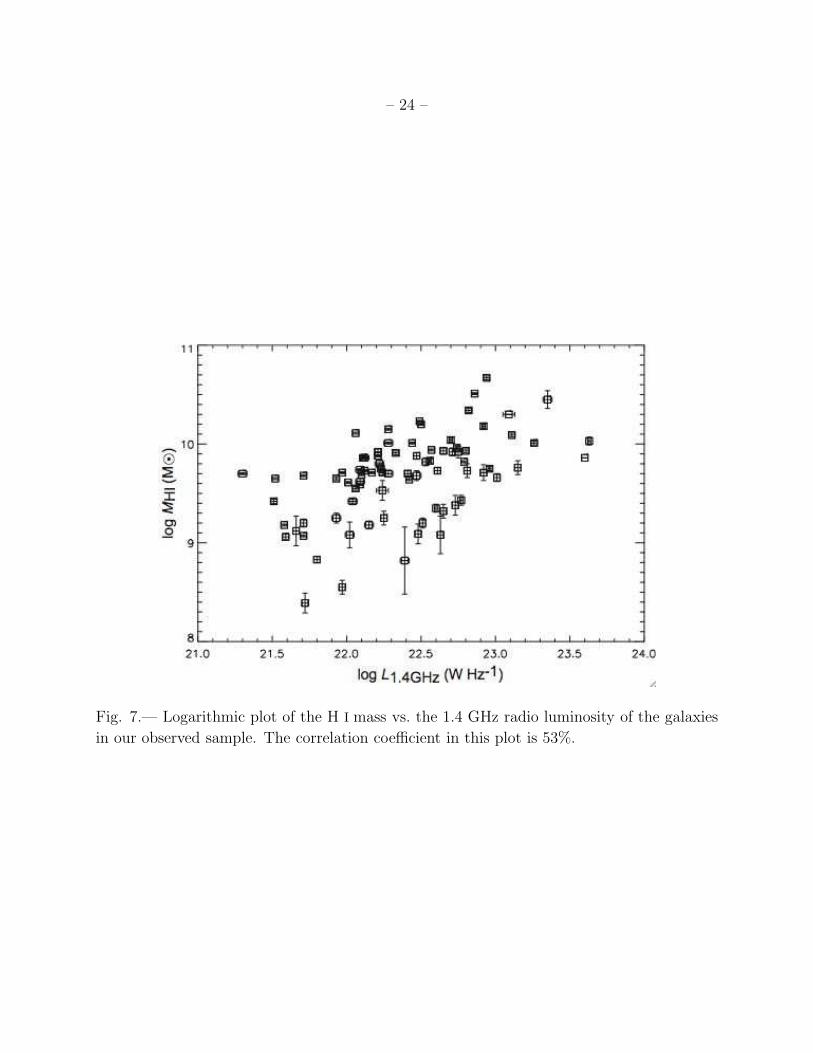
coefficients of 42% in each. Figure 7 shows a logarithmic plot of the H I mass versus the
1.4 GHz radio luminosity. The correlation coefficient here is 53%. These plots suggest that
the total neutral gas content and star formation activity traced through the radio luminosities
or the IR luminosities are only weakly correlated for this sample. This is consistent with the
scenario that atomic gas has first to be converted into molecular gas to form stars, and that
the molecular gas content itself correlates well with star formation (Wong & Blitz 2002).
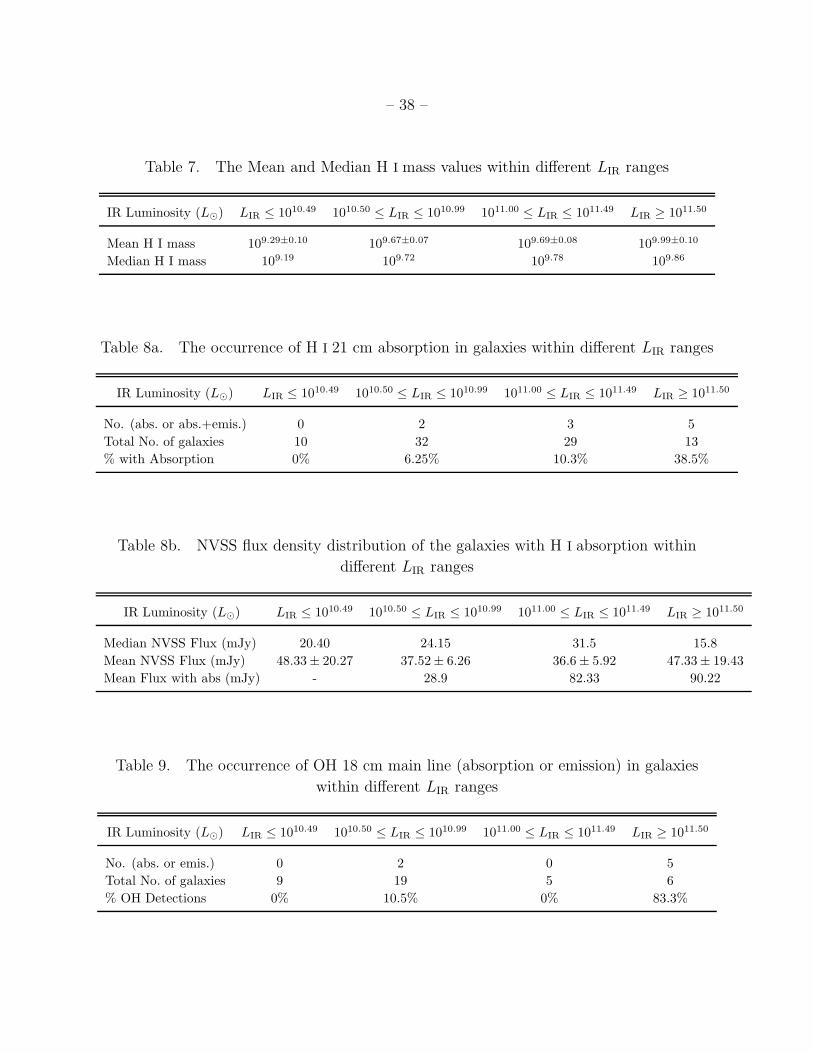
In Table 7, we present the mean and median H I mass values of galaxies with H I 21 cm
emission as a function of total-IR luminosity bins. The numbers reflect a general trend of
higher H I mass values at higher IR luminosities, consistent with the weak correlation seen
in Figure 6-bottom. We utilize the values presented in this table in our notes on individual
objects in §6.
In our observed sample, several galaxies show either H I absorption or both H I emission
and absorption. Binning the sample in LIR (Table 8a) reveals that sources with higher IR
luminosities have the greater likelihood of showing H I absorption. For instance, 38.5% of
the sources with LIR ≥ 1011.50 L⊙ show H I absorption, while only 10.3% of sources with
1011.00 L⊙ ≤ LIR ≤ 1011.49 L⊙, and 6.3% of sources with 1010.50 L⊙ ≤ LIR ≤ 1010.99 L⊙ show
H I absorption. No H I absorption is seen in sources with LIR ≤ 1010.49 L⊙ (see Table 8a).
Thus, while we cannot say anything about traditionally defined ULIRGs (LIR ≥ 1012 L⊙)
because of their rarity in our observed sample, it appears that galaxies with LIR ≥ 1011.50 L⊙
have a greater likelihood of showing H I absorption. We now explore whether this trend could
arise due to a selection effect.
While the flux density of H I emission is proportional to LHI/D2, where D is the distance
to the galaxy, the flux density dip of an absorption corresponding to a given optical depth is
proportional to the background continuum flux density that is being absorbed. In Table 8b
– 9 –
we present the calculated mean and median NVSS flux densities for the galaxies in our
observed sample as a function of LIR bins, to investigate whether galaxies having LIR ≥
1011.50 L⊙ preferentially have higher flux densities. Table 8b shows that the radio flux
densities in our sample do not correlate with IR luminosity. However, we do find for those
galaxies showing H I absorption in the two highest luminosity bins, that the mean flux
densities are about double the mean values for all galaxies in those bins. As a second
possible effect, the LIR ≥ 1011.50 L⊙ absorbers might have a higher covering factor than
those of lower luminosity e.g., their continuum emission may mostly be in a compact nucleus
vs. more extended continuum emission for the others, with the absorption arising principally
in the nuclear regions. However, whether this is the case or not, we do find a difference in
the incidence of H I absorption between IR galaxies with LIR ≥ 1011.50 L⊙ and those with
lower IR luminosities, i.e., the galaxies with higher IR luminosities have higher H I column
densities on the lines of sight to the continuum sources, and/or their continuum emission is
confined to more compact regions.
In Table 9, we present the statistics of OH detections (absorption or emission) as a
function of LIR bins. The total number of sources per LIR bin in this table excludes galaxies
with OH main line spectra severely affected by RFI. Here we note that all 3 of the OH
emitters have LIR ≥ 1011.50 L⊙, while the two detections for 1010.50 L⊙ ≤ LIR ≤ 1010.99 L⊙
are both absorbers. However, despite the small numbers in this subgroup, it is strongly
suggestive that OH-detected sources (emitters and absorbers) are found primarily in galaxies
with LIR ≥ 1011.50 L⊙.
6. Notes on Individual Objects
IRAS 20210+1121: This galaxy is at a redshift of z = 0.0564, and is one of two sources
with no H I detection in our observed sample, with the other source being IRAS 23410+0228
(z = 0.0912; see below). Its IR luminosity is 1011.90±0.09 L⊙ and the derived 3σ upper limit for
its H I mass, assuming a 400 km s−1 velocity width, is 109.86 M⊙. In the sample presented in
this paper, sources with LIR > 1011.50 L⊙ and detected H I emission have a H I median mass
value of 109.86 M⊙ and a mean value of 109.99±0.10 M⊙. This suggests that IRAS 20210+1121
is likely to be hydrogen deficient. However, at IR luminosities > 1011.50 L⊙, there are four
sources in our sample with H I detections that have H I masses < 109.86 M⊙. Therefore,
observations with longer integration time are needed to establish whether IRAS 20210+1121
is truly hydrogen deficient.
IRAS 20332+0805: Our estimated heliocentric velocity for this galaxy of 7967.3 ±
8.9 km s−1 differs from the single optically-measured value of 8353± 57 km s−1 at the 6.8 σ
– 10 –
level. While the velocity of the peak H I emission is somewhat higher than the measured
central velocity, the discrepancy is still significant.
IRAS 21054+2314: This galaxy, with a redshift of z = 0.0487, shows both H I 21 cm
emission and absorption, and OH 1667 MHz absorption (Figures 1 and 3). These detections
have not been previously reported in the literature. Its H I absorption feature is at a higher
velocity than the emission, suggesting infalling gas towards the central continuum source.
IRAS 21442+0007: This source shows a previously unreported H I 21 cm absorption
line at cz = 22241 km s−1 or z = 0.0742. However, its H I spectrum (Figure 1) also shows
a wide, previously unknown, emission line centered at cz = 22555 km s−1 or z = 0.0752
with ∆V50% = 207.3 km s−1. This emission does not seem to be arising from the target
source IRAS 21442+0007, but from the nearby galaxy SDSS J214651.97+002302.2 at cz =
22575± 49 km s−1 (or z = 0.0753± 0.0002). The projected angular separation between the
two sources is 1.8 arcmin, meaning that SDSS J214651.97+002302.2 was situated close to the
half-power point of the ∼ 3.5 arcmin L-band beam in our observations. After correcting for
the beam, we derive an H I mass value of 9 × 10⁹ M⊙ for SDSS J214651.97+002302.2. The
proximity of IRAS 21442+0007 and SDSS J214651.97+002302.2 in both angular distance
and velocity suggests that they may be members of the same galaxy cluster or group.
IRAS 22045+0959: Also known as NGC 7212, this triple system has a cataloged red-
shift of z = 0.0266. Optical studies show it to be a system of three interacting galaxies lying
within an area of radius≈0.5 arcmin. NGC 7212 NED 1 is a small spiral of undetermined red-
shift. NED 7212 NED 2 has an optical spectrum characteristic of a Seyfert 2 nucleus, though
showing a Seyfert 1-like spectrum in polarized light (e.g., Vorontsov-Velyaminov & Arkhipova
1963; Wasilewski 1981). Its optical radial velocity is given as 7927±18 km s−1 by Falco et al.
(1999), but as 7800 km s−1 (with no formal error) by Strauss et al. (1992). NED 7212 NED 3
appears to be interacting strongly with NED 2, and has an optical radial velocity of 8167±
74 km s−1 (Falco et al. 1999).
The IR luminosity of the system is LIR = 1011.15±0.10L⊙. Our calculated H I mass
for the system is 1010.01±0.02M⊙, slightly higher than the median (109.78M⊙) and the mean
(109.69±0.08M⊙) we find for sources with IR luminosities in the range 1011 − 1011.49L⊙. Our
H I spectrum (Figure 2) may represent two spiral-galaxy-like, double-horned spectra. The
radial velocity of NED 3 agrees well with the higher redshift feature. However, while the
Strauss et al. (1992) velocity for NED 2 would be compatible with the lower redshift feature,
the Falco et al. (1999) velocity would place the systemic velocity near the “central gap”
between the two features. The depth of this gap between the two features drops to slightly
more than 3σ below the continuum level. Hence it could represent H I absorption, while also
being compatible with a lack of H I emission at that velocity. Clearly, high resolution H I

– 11 –
synthesis mapping is needed to resolve the actual situation in this system. Here, we have
taken the H I classification of IRAS 22045+0959 to be a mixture of emission and absorption
(see Table 3), though we caution that this may need revision following future observations.
IRAS 22523+3156: This object also displays previously unreported H I and OH lines
(Figures 1 and 3). IRAS 22523+3156 has a relatively low IR luminosity, and is at a redshift
of z = 0.0212. Its H I spectral shape is peculiar, with a deep absorption feature in the middle
of the emission line. Its OH spectrum displays two nicely defined absorption features of the
redshifted 1667 and 1665 MHz main lines. The H I and OH absorption lines arise at the
same velocity (see Tables 3 & 5), indicating that they originate from the same region.
The ratio of∫τdv for the 1667 and 1665 MHz absorption lines is 1.88±0.03, comparable
with the expected ratio in thermal equilibrium of 1.8. In thermal equilibrium, the satellite
lines should be found with a hyperfine ratio relative to the 1667 MHz line of 0.111. The
measured rms level for the 1720 MHz satellite line (Table 5) gives a 3σ upper limit for this
ratio of 0.131, indicating that our non-detection is not inconsistent with thermal equilibrium.
This is especially the case as very low level RFI appears to be present near this satellite line
in some of the data. No rms value was estimated for the 1612 MHz satellite line, because
the spectrum was severely affected by RFI.
IRAS 22595+1541: Our H I spectrum for this target provides an estimated heliocen-
tric velocity of 2089.6 ± 0.5 km s−1, differing at the 7σ level from the weighted optically-
measured value for the galaxy NGC 7465 (type SB0) of 1977 ± 16 km s−1. This galaxy
is a member of the galaxy group RSCG 83 for which NED provides a H I velocity of
2091 ± 5 km s−1 from the HIPASS H I survey. Within our 3.5 arcmin HPBW we could
potentially be seeing emission from three galaxies, (a) NGC 7465; the prime target, (b)
NGC 7464, an E1 pec galaxy with an optical radial velocity of 1787 ± 17 km s−1, and (c)
NGC 7463, an SABb pec galaxy with an optical radial velocity of 2439±24 km s−1. The very
broad H I spectrum seen in Figure 2 suggests that in all probability we are seeing emission
from all three, with that of NGC 7465 dominating.
IRAS 23050+0359: This galaxy, at z = 0.0474, is a new H I emission detection, but
has a previously known OH megamaser which we also detect (Figures 1 and 4). It has a
total IR luminosity of LIR = 1011.67±0.16L⊙, making it one of the more IR luminous objects
in our sample. The calculated H I mass from its distorted spectrum is 109.71±0.08M⊙; a value
that is slightly lower than the median (109.86M⊙) and the mean (109.99±0.10M⊙) for objects
with IR luminosities greater than 1011.50L⊙ (Table 7).
IRAS 23204+0601: Also known as III Zw 103, this galaxy is at a redshift of z =
0.0560, and is also a new H I emission detection (Figure 1). With a total IR luminosity of

– 12 –
LIR = 1011.88±0.16L⊙, it is also one of the more IR luminous sources in our sample. We were
unable to determine if there is OH emission/absorption in this source, because the spectra
of all its main and satellite lines were severely affected by RFI. Its H I mass (109.76±0.07M⊙)
is lower than the median and mean of galaxies with comparable IR luminosities (Table 7).
IRAS 23327+2913: Both the H I and OHM emission lines (Figures 1 and 3) of this
ULIRG (z = 0.1067) are new detections. A study by Dinh-V-Trung et al. (2001) showed
that this object is a system of two interacting galaxies separated by 20 kpc. Its northern
component is disturbed, while the southern component is a normal spiral with a very thick
bar structure. High resolution radio interferometric observations are needed to establish
from which galaxy in this system the H I and OHM emission lines originate.
IRAS 23410+0228: This galaxy is at a redshift of z = 0.0912, which is the second
highest redshift in our observed sample. It is one of two sources with no H I detection,
with the other source being IRAS 20210+1121 (z = 0.0564; see above). Its IR luminosity is
1012.08±0.17 L⊙ and the derived 3σ upper limit for its H Imass, assuming a 400 km s−1 velocity
width, is 1010.30 M⊙. This H I mass limit is greater than the median and the mean H I mass
values for sources with LIR > 1011.50 L⊙, which are 109.86 M⊙ and 109.99±0.10 M⊙, respectively.
Therefore, the non-detection of H I emission from this source does not necessarily imply
hydrogen deficiency.
IRAS 23532+2513: This target consists of three galaxies lying within our HPBW at
similar redshifts. These are, (a) a starburst galaxy (type spiral:HII) lying 14 arcsec from our
pointing position with an optical radial velocity of 17584 ± 69 km s−1, (b) a peculiar Sy1
galaxy also 14 arcsec from our pointing with an optical radial velocity of 17121± 18 km s−1,
and (c) a spiral:HII galaxy about 1 arcmin from our pointing with an optical radial velocity
of 17273± 68 km s−1. Our broad H I spectrum (Figure 2) shows emission over the full range
of velocities covered by the 3 component galaxies.
7. Acknowledgements
We thank the anonymous referee for valuable comments and suggestions. This research
has made use of the NASA/IPAC Extragalactic Database (NED) which is operated by the Jet
Propulsion Laboratory, California Institute of Technology, under contract with the National
Aeronautics and Space Administration. We also acknowledge the usage of the HyperLeda
database (http://leda.univ-lyon1.fr). M.X.F. is grateful for support from NAIC-Arecibo
Observatory during a summer research assistantship.

– 13 –
REFERENCES
Baan, W. A., van Gorkom, J. H., Schmelz, J. T, Mirabel, I. F. 1987, ApJ, 313, 102
Baan, W. A. 1989, ApJ, 338, 804
Condon, J. J. 1992, ARA&A, 30, 575
Condon, J. J., Cotton, W. D., Greisen, E. W., Yin, Q. F., Perley, R. A., Taylor, G. B.,
Broderick, J. J. 1998, AJ, 115, 1693
Darling, J., & Giovanelli, R. 2000, AJ, 119, 3003
Darling, J., & Giovanelli, R. 2001, AJ, 121, 1278
Darling, J., & Giovanelli, R. 2002, AJ, 124, 100
Dinh-V-Trung, Lo, K. Y., Kim, D.-C., Gao, Yu, Gruendl, R. A. 2001, ApJ, 556, 141
Falco, E. E., Kurtz, M. J., Geller, M. J., et al. 1999, PASP, 111, 438
Ghosh, T., & Salter, C.J. 2002, in ASP Conf. Ser. 278, Single-Dish Radio Astronomy: Tech-
niques and Applications, ed. S. Stanimirovic, D. Altschuler, P. Goldsmith, & C. Salter,
(San Francisco: ASP), 521
Helou, G., Soifer, B. T., & Rowan-Robinson, M. 1985, ApJ, 298, L7
Kandalian, R. A. 1996, Astrophysics, 39, 237
Mirabel, I. F. 1982, ApJ, 260, 75
Momjian, E., Romney, J. D., Carilli, C. L., Troland, T. H., 2003, ApJ, 597, 809
Paturel, G., Petit, C., Prugniel, Ph., Theureau, G., Rousseau, J., Brouty, M., Dubois, P.,
Cambresy, L. 2003, A&A, 412, 45
Roberts, M. S. 1975, in Galaxies and the Universe, ed. A. Sandage, M. Sandage, & J. Kristian
(Chicago : Univ. Chicago Press), 309
Rohlfs, K., 1986, Tools of Radio Astronomy, (Springer-Verlag)
Sanders, D. B., & Mirabel, I. F. 1996, ARA&A, 34, 749
Soifer, B. T., & Neugebauer, G. 1991, AJ, 101, 354

– 14 –
Soifer, B. T., Sanders, D. B., Madore, B. F., Neugebauer, G., Danielson, G. E., Elias, J. H.,
Lonsdale, Carol J., Rice, W. L. 1987, ApJ, 320, 238
Strauss, M. A., Huchra, J. P., Davis, M., Yahil, A., Fisher, K. B., Tonry, J. L. 1992, ApJS,
83, 29
Turner, B. E. 1973, ApJ, 186, 357
Vorontsov-Velyaminov, B. A., & Arkhipova, V. P. 1963, Morphological Catalogue of Galax-
ies, Part III (Trudy Astr. Inst. Sternberg 33), 68
Wasilewski, A. J. 1981, PASP, 93, 560
Wong, T., & Blitz, L. 2002, ApJ, 569, 157
Wunderlich, E., & Klein, U. 1988, A&A, 206, 47
Yun, M. S., Reddy, N. A., & Condon, J. J. 2001, ApJ, 554, 803
This preprint was prepared with the AAS LATEX macros v5.2.
– 15 –
Fig. 1.— Spectra of the new H I 21 cm detections in our observed sample.
– 16 –
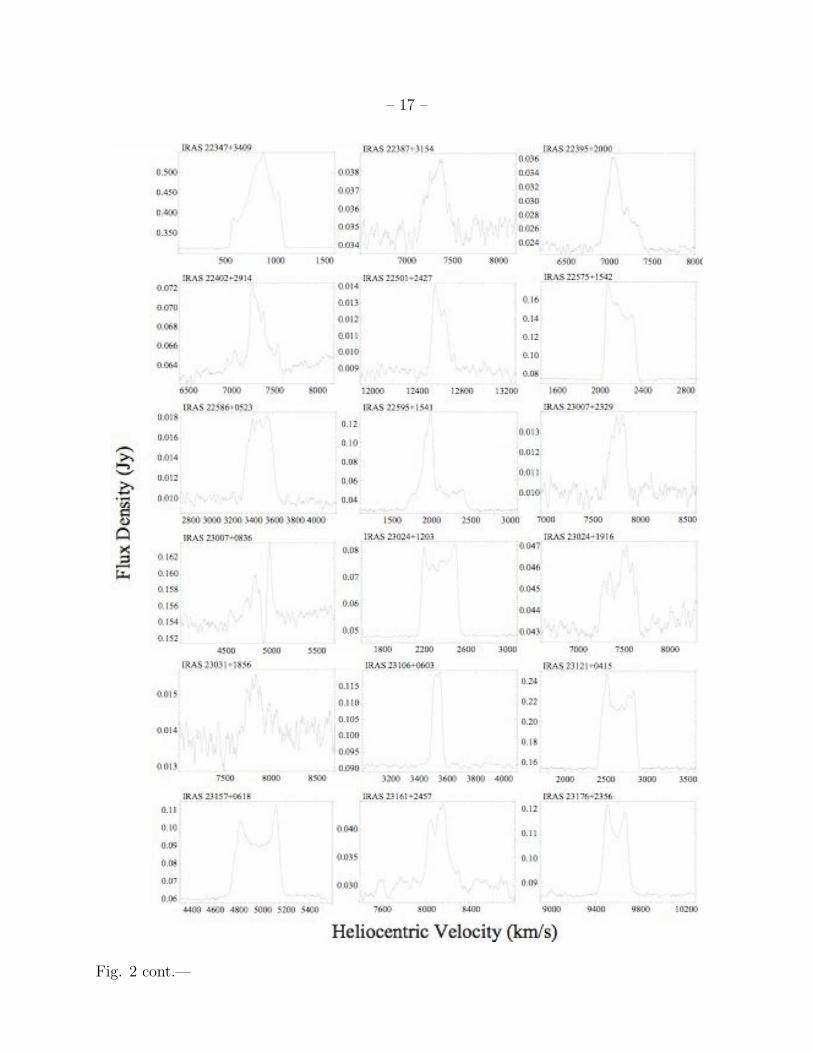
Fig. 2.— Spectra of the previously known H I 21 cm detections in our observed sample.
– 17 –
Fig. 2 cont.—

– 18 –
Fig. 2 cont.—

– 19 –
Fig. 2 cont.—

– 20 –
Fig. 3.— Spectra of the new OH 18 cm main line detections; three are in absorption, one in
emission. The spectral features at 6880 km s−1 in the spectrum of IRAS 22523+3156 and
at 2685 km s−1 in the spectrum of IRAS 23121+0415 are due to RFI. The spectra used the
rest frequency of the 1667.359 MHz line for the velocity scale.
– 21 –
Fig. 4.— Spectra of the previously known OH 18 cm main line detections in our observed
sample. The spectra used the rest frequency of the 1667.359 MHz line for the velocity scale.
– 22 –
Fig. 5.— Logarithmic plots of the 1.4 GHz radio luminosity vs. FIR luminosity (top) and total
IR luminosity (bottom) of the galaxies in our observed sample. The correlation coefficients
are 88% and 89% for the top and bottom plots, respectively.
– 23 –
Fig. 6.— Logarithmic plots of the H I mass vs. FIR luminosity (top) and total IR luminosity
(bottom) of the galaxies in our observed sample. The correlation coefficient in each of these
plots is 42%.
– 24 –
Fig. 7.— Logarithmic plot of the H I mass vs. the 1.4 GHz radio luminosity of the galaxies
in our observed sample. The correlation coefficient in this plot is 53%.

–25
–
Table 1. Sample Properties
IRAS Name Other Names R. A. (J2000) Decl. (J2000) z S60µm S1.4GHz Morphology
(Jy) (mJy)
(1) (2) (3) (4) (5) (6) (7) (8)
20082+0058 20 10 46.29 +01 07 13.6 0.0258 2.69 5.6 S?
20093+0536 UGC 11522 20 11 49.36 +05 45 47.0 0.0175 3.96 44.9 Sbc
20178−0052 20 20 28.00 −00 42 36.5 0.0185 3.08 21.9 HII
20198+0159 20 22 23.07 +02 09 19.1 0.0414 2.40 14.6 S?
20210+1121 20 23 25.54 +11 31 37.2 0.0564 3.38 53.7 Sy2/Sc
20230+1024 20 25 30.64 +10 34 21.5 0.0260 2.01 8.1 Sbc
20332+0805 20 35 39.16 +08 16 15.8 0.0279 3.11 19.2 HII/S?
20369+0150 20 39 26.45 +02 01 04.1 0.0129 2.41 11.5 Sb/S0-a
20381+0325 20 40 39.34 +03 35 47.7 0.0259 2.07 18.5
20415+1219 NGC 6956, UGC 11619 20 43 53.46 +12 30 35.4 0.0156 3.18 35.9 SBb
20417+1214 UGC 11620 20 44 09.74 +12 25 05.0 0.0149 2.55 23.4 Sb/S0-a
20480+0937 20 50 29.09 +09 49 05.5 0.0147 2.34 10.9 SABa
20491+1846 UGC 11643 20 51 25.90 +18 58 04.8 0.0291 2.79 23.4 SBb
20550+1656 II Zw 096 20 57 24.14 +17 07 41.2 0.0361 13.30 43.2 HII/S0-a
21052+0340 UGC 11680 21 07 45.88 +03 52 40.5 0.0259 2.80 16.9 Scd/HII Sy2/E-S0
21054+2314 21 07 43.36 +23 27 06.4 0.0487 2.23* 11.6 S?
21116+0158 IC 1368, UGC 11703 21 14 12.57 +02 10 41.2 0.0130 4.03 25.8 Sa;Sy2
21271+0627 NGC 7074, II Zw 133 21 29 38.93 +06 40 57.3 0.0116 3.11 21.7 S?
21278+2629 NGC 7080, UGC 11756 21 30 01.81 +26 43 05.3 0.0161 3.16 28.4 SBb
21396+3623 21 41 41.65 +36 36 47.4 0.1493 2.16* 13.8
21442+0007 21 46 51.28 +00 21 13.5 0.0740 2.11 10.9 HII
21561+1148 Mrk 0518, UGC 11865 21 58 36.09 +12 02 19.4 0.0311 2.73* 29.1 I?/S?
21582+1018 Mrk 0520, UGC 11871 22 00 41.40 +10 33 07.5 0.0266 4.15 57.9 Sb;Sy1.9
22032+0512 22 05 47.08 +05 27 16.3 0.0383 2.43 5.1 S?
22045+0959 NGC 7212 22 07 02.05 +10 14 02.7 0.0266 2.88 114.1 Sab;Sy2
22171+2908 NGC 7253A, Arp 278, UGC 11984 22 19 27.94 +29 23 41.6 0.0152 5.86 72.1 SABc
–26
–
Table 1—Continued
IRAS Name Other Names R. A. (J2000) Decl. (J2000) z S60µm S1.4GHz Morphology
(Jy) (mJy)
(1) (2) (3) (4) (5) (6) (7) (8)
22217+3310 UGC 12022 22 24 02.76 +33 26 08.9 0.0218 2.25 10.8 Sbc
22221+1748 22 24 33.40 +18 03 56.5 0.0204 2.66 21.0 S-I/Sc
22347+3409 NGC 7331, UGC 12113 22 37 04.67 +34 24 28.0 0.0027 23.10 217.6 SAb;LIN/Sbc
22387+3154 Mrk 0917, UGC 12149 22 41 07.60 +32 10 11.1 0.0244 3.71 33.3 SBa;Sy2
22388+3359 UGC 12150 22 41 12.28 +34 14 57.4 0.0214 8.17 38.3 SB0-a;HII/LIN
22395+2000 22 41 56.03 +20 15 41.6 0.0233 2.56 16.9 Sy2;HII/S0
22402+2914 22 42 38.53 +29 30 23.2 0.0244 2.02 13.4 S?
22449+0757 22 47 28.17 +08 13 37.6 0.0372 2.87 14.0 S?
22472+3439 22 49 32.17 +34 55 09.2 0.0234 4.98 43.9 Sbrst;LIN
22501+2427 Mrk 0309, IV Zw 121 22 52 34.76 +24 43 44.8 0.0421 3.43 7.3 Sa;Sbrst/Sy2
22523+3156 22 54 45.05 +32 12 47.8 0.0212 2.27 32.0 Sb/Sbc
22575+1542 NGC 7448, Arp 013, UGC 12294 23 00 03.60 +15 58 50.8 0.0073 7.23 81.5 SAbc/Sc
22586+0523 UGC 12304 23 01 08.21 +05 39 15.8 0.0116 2.06 13.5 Sc
22595+1541 NGC 7465, Mrk 0313, UGC 12317 23 02 00.93 +15 57 51.2 0.0066 3.80 19.1 SB0;Sy2
23007+2329 23 03 09.28 +23 45 32.3 0.0259 3.64 11.9 S?
23007+0836 NGC 7469, Arp 298, Mrk 1514, UGC 12332 23 03 15.62 +08 52 26.1 0.0163 25.90 180.5 SABa/Sy1.2
23011+0046 23 03 41.29 +01 02 38.0 0.0420 2.58 13.3 Sm
23024+1203 NGC 7479, UGC 12343 23 04 56.63 +12 19 20.6 0.0079 12.80 99.0 SBc;LIN/SBbc;Sy1.9
23024+1916 23 04 56.61 +19 33 08.1 0.0251 7.53 42.6 LIN/Sa
23031+1856 23 05 36.16 +19 12 29.6 0.0262 2.09 6.8 Sbrst/Sa
23050+0359 23 07 35.73 +04 15 59.8 0.0474 3.89 15.8 HII/S?
23106+0603 NGC 7518, Mrk 0527, UGC 12422 23 13 12.67 +06 19 23.3 0.0118 4.20 10.7 SABa
23121+0415 NGC 7541, UGC 12447 23 14 44.00 +04 32 00.8 0.0090 19.30 162.4 SBbc;HII
23157+0618 NGC 7591, UGC 12486 23 18 16.32 +06 35 08.5 0.0165 7.22 52.1 SBbc;Sy;LIN
23161+2457 Mrk 0319, UGC 12490 23 18 38.41 +25 13 58.4 0.0270 4.27 31.6 SBa;Sbrst
23176+2356 NGC 7620, Mrk 0321, UGC 12520 23 20 05.65 +24 13 15.9 0.0320 2.41 31.5 Scd;Sbrst/HII
–27
–
Table 1—Continued
IRAS Name Other Names R. A. (J2000) Decl. (J2000) z S60µm S1.4GHz Morphology
(Jy) (mJy)
(1) (2) (3) (4) (5) (6) (7) (8)
23179+2702 NGC 7624, Mrk 0323, UGC 12527 23 20 22.69 +27 18 55.7 0.0143 3.16 24.6 SBc;HII/Sbrst
23179+1657 NGC 7625, Arp 212, III Zw 102, UGC 12529 23 20 30.08 +17 13 32.4 0.0054 9.33 60.3 SAa/HII
23201+0805 23 22 43.92 +08 21 34.7 0.0378 2.33 7.4 Sy2/S?
23204+0601 III Zw 103 23 23 01.60 +06 18 05.8 0.0560 4.23 19.4 HII/S?
23213+0923 NGC 7648, IC 1486, Mrk 0531, UGC 12575 23 23 53.86 +09 40 02.4 0.0119 4.84 16.9 S0
23252+2318 NGC 7673, Mrk 0325, IV Zw 149, UGC 12607 23 27 41.28 +23 35 22.5 0.0114 4.91 43.4 SAc;HII;Sbrst
23254+0830 NGC 7674, Arp 182, Mrk 0533, UGC 12608 23 27 56.70 +08 46 43.2 0.0289 5.59 220.9 SAbc;HII;Sy2
23256+2315 NGC 7677, Mrk 0326, UGC 12610 23 28 06.22 +23 31 52.1 0.0119 3.96 16.8 SABbc;Sbrst
23259+2208 NGC 7678, Arp 028, UGC 12614 23 28 27.31 +22 25 07.3 0.0116 6.59 49.5 SABc;Sbrst Sy2
23262+0314 NGC 7679, Arp 216, Mrk 0534, UGC 12618 23 28 46.73 +03 30 41.3 0.0171 7.41* 55.8 SB0;HII;Sy1/SB0-a;Sy2
23277+1529 UGC 12633 23 30 13.57 +15 45 40.6 0.0141 3.11 23.7 SB/Sbab
23327+2913 23 35 11.88 +29 30 00.3 0.1067 2.10 7.8 LIN
23336+0152 NGC 7714, Arp 284, Mrk 0538, UGC 12699 23 36 14.12 +02 09 18.1 0.0093 10.40 65.8 SBb;HII;LIN
23365+3604 23 39 01.24 +36 21 09.0 0.0645 7.09 27.2 SBa;LIN
23381+2654 23 40 42.78 +27 10 40.9 0.0339 2.17 13.1 Sa/S0
23387+2516 23 41 16.13 +25 33 03.7 0.0314 3.02 37.3 Sb
23410+0228 23 43 39.65 +02 45 06.1 0.0912 2.28 6.0 Sy1/S?
23414+0014 NGC 7738, UGC 12757 23 44 02.01 +00 30 59.5 0.0226 4.47 36.2 SBb
23433+1147 IC 1508, UGC 12773 23 45 55.04 +12 03 42.6 0.0142 3.28 30.1 Sdm/Scd
23446+1519 23 47 09.40 +15 35 49.4 0.0259 4.26 9.2 HII;Sy2/SBab
23456+2056 UGC 12787 23 48 13.77 +21 13 03.5 0.0222 2.29 17.3 Sbc
23471+2939 UGC 12798 23 49 39.73 +29 55 55.1 0.0176 2.47 18.1 S?/Sc
23485+1952 NGC 7769, Mrk 9005, UGC 12808 23 51 04.02 +20 09 00.7 0.0140 4.34 59.9 SAb;HII;LIN
23488+1949 NGC 7771, Mrk 9006, UGC 12815 23 51 24.90 +20 06 41.3 0.0143 19.00 141.4 SBa;HII/Sbrst
23488+2018 Mrk 0331, UGC 12812 23 51 26.79 +20 35 10.6 0.0185 18.60 70.7 HII;Sy2/Sa
23532+2513 23 55 49.99 +25 30 21.9 0.0571 1.44 11.0 HII
–28
–
Table 1—Continued
IRAS Name Other Names R. A. (J2000) Decl. (J2000) z S60µm S1.4GHz Morphology
(Jy) (mJy)
(1) (2) (3) (4) (5) (6) (7) (8)
23560+1026 NGC 7794, UGC 12872 23 58 34.09 +10 43 42.2 0.0176 3.26 24.8 S?/Sbc
23564+1833 UGC 12879 23 59 01.32 +18 50 05.0 0.0180 2.64 18.2 S?/Sc
23568+2028 NGC 7798, Mrk 0332, UGC 12884 23 59 25.60 +20 45 00.1 0.0080 4.87 36.5 SBc/Sbrst
23587+1249 NGC 7803, UGC 12906 00 01 19.87 +13 06 40.5 0.0179 2.02 12.3 S0-a
23591+2312 III Zw 125 00 01 40.44 +23 29 34.0 0.0145 6.13 131.9 SBc;Sbrst;LIN
23594+3622 00 01 58.39 +36 38 56.3 0.0321 4.48 75.0 Sy2/S0-a
23597+1241 NGC 7810, UGC 12919 00 02 19.08 +12 58 18.0 0.0185 3.39 23.0 S0
∗The 60 µm values taken from the IRAS Point Source Catalogue (PSC) instead of the IRAS Faint Source Catalogue (FSC).

–29
–
Table 2. Parameters of Galaxies with H I Emission
IRAS Name ∆t rms VHI ∆V50
∫Sdv DL log LFIR
L⊙log LIR
L⊙log MHI
M⊙
(min) (mJy) (km s−1) (km s−1) (Jy km s−1) (Mpc)
(1) (2) (3) (4) (5) (6) (7) (8) (9) (10)
20082+0058 15 0.30 7784.6 ± 3.5 275.1 ± 7.0 0.6± 0.1 111.9± 0.1 10.68± 0.07 11.02± 0.14 9.25± 0.05
20093+0536 15 0.33 5286.5 ± 0.8 323.5 ± 1.6 12.6± 0.1 75.5± < 0.1 10.62± 0.04 10.88± 0.08 10.23± < 0.01
20178−0052⋄ 5 0.90 5520.0 ± 3.2 317.6 ± 6.4 5.6± 0.4 78.9 ± 0.1 10.51± 0.06 10.80± 0.10 9.92± 0.03
20198+0159 20 0.37 12301.0 ± 3.6 394.8 ± 7.3 1.1± 0.1 178.8± 0.1 11.11± 0.05 11.38± 0.12 9.92± 0.06
20210+1121* 10 0.41 16905.0 ± 25.0 400.0 0.5 248.7± 0.4 11.45± 0.08 11.90± 0.09 < 9.86
20230+1024 15 0.27 7811.3 ± 2.4 222.1 ± 4.7 1.4± 0.1 112.3± < 0.1 10.64± 0.08 10.95± 0.15 9.62± 0.03
20332+0805 20 0.26 7967.3 ± 8.9 326.1± 17.9 0.4± 0.1 114.6± 0.2 10.82± 0.04 11.07± 0.12 9.09± 0.1
20369+0150 10 0.96 4027.5 ± 13.0 430.7± 26.0 1.7± 0.5 57.3 ± 0.2 10.11± 0.06 10.39± 0.13 9.12± 0.15
20381+0325 10 0.37 8037.5 ± 4.1 486.7 ± 8.1 2.4± 0.2 115.6± 0.1 10.72± 0.07 10.97± 0.15 9.88± 0.03
20415+1219 5 0.49 4640.8 ± 1.3 361.3 ± 2.6 9.9± 0.2 66.2 ± 0.1 10.44± 0.03 10.71± 0.08 10.01 ± 0.01
20417+1214 10 0.42 4483.7 ± 3.4 364.5 ± 6.9 3.7± 0.2 63.9± < 0.1 10.23± 0.05 10.51± 0.12 9.55± 0.02
20480+0937 5 0.46 4391.2 ± 2.1 329.2 ± 4.3 1.7± 0.2 62.6 ± 0.1 10.18± 0.04 10.42± 0.15 9.20± 0.04
20491+1846 10 0.31 8715.1 ± 5.7 504.3± 11.3 2.3± 0.1 125.6± 0.1 10.92± 0.04 11.18± 0.08 9.93± 0.03
20550+1656 10 0.29 10824.7 ± 1.9 282.0 ± 3.8 2.1± 0.1 156.8± < 0.1 11.64± 0.04 11.92± 0.08 10.09 ± 0.02
21052+0340 15 0.27 7792.3 ± 3.6 518.2 ± 7.2 1.7± 0.1 112.0± 0.1 10.77± 0.05 11.10± 0.08 9.70± 0.03
21054+2314† 15 0.28 14667.6 ± 3.5 207.6 ± 7.1 0.5± 0.1 214.5± 0.1 11.26± 0.06 11.58± 0.06 9.73± 0.07
21116+0158† 20 0.21 3847.7 ± 5.3 519.2± 10.7 0.5± 0.1 54.7 ± 0.1 10.28± 0.04 10.54± 0.10 8.55± 0.07
21271+0627 10 0.25 3454.2 ± 3.3 262.3 ± 6.6 1.2± 0.1 49.1 ± 0.1 10.12± 0.03 10.38± 0.09 8.83± 0.03
21278+2629 20 0.63 4837.0 ± 0.6 157.1 ± 1.3 6.8± 0.2 69.0± < 0.1 10.47± 0.05 10.74± 0.09 9.88± 0.01
21561+1148 15 0.20 9343.9 ± 1.3 240.7 ± 2.6 2.0± 0.1 134.8± 0.1 10.91± 0.07 11.31± 0.07 9.93± 0.02
21582+1018† 20 0.22 7972.3 ± 1.4 295.4 ± 2.7 1.8± 0.1 114.6± 0.1 10.96± 0.04 11.22± 0.08 9.75± 0.02
22032+0512 20 0.31 11638.4 ± 9.2 357.1± 18.5 0.5± 0.1 168.9± 0.2 11.00± 0.05 11.28± 0.18 9.53± 0.10
22045+0959†⋄ 20 0.21 7981.3 ± 4.8 563.3 ± 9.7 3.3± 0.2 114.8± 0.3 10.81± 0.05 11.15± 0.10 10.01 ± 0.02
22171+2908 10 0.45 4581.8 ± 0.9 442.8 ± 1.8 8.7± 0.2 65.3± < 0.1 10.67± 0.08 10.91± 0.10 9.94± 0.01
22217+3310 10 0.35 6528.5 ± 0.7 437.4 ± 1.4 6.3± 0.1 93.5± < 0.1 10.55± 0.05 10.81± 0.16 10.11 ± 0.01
22221+1748 10 0.33 6098.5 ± 1.1 358.1 ± 2.2 7.8± 0.1 87.3± < 0.1 10.53± 0.07 10.79± 0.13 10.15 ± 0.01
22347+3409⋄ 10 0.54 800.4 ± 0.1 508.1 ± 0.3 148.1 ± 0.3 11.3± < 0.1 9.85± 0.06 10.06± 0.08 9.65± < 0.01
22387+3154 10 0.36 7326.1 ± 6.5 316.9± 13.1 0.8± 0.1 105.2± 0.1 10.83± 0.06 11.12± 0.10 9.32± 0.07
22388+3359 20 0.27 6480.6 ± 4.6 345.7 ± 9.2 1.1± 0.1 92.8 ± 0.1 11.08± 0.06 11.33± 0.15 9.35± 0.04
22395+2000 10 0.39 7144.6 ± 2.8 426.0 ± 5.6 3.3± 0.2 102.5± 0.1 10.61± 0.05 11.01± 0.16 9.91± 0.02
22402+2914 20 0.26 7258.9 ± 1.4 602.5 ± 2.8 2.0± 0.1 104.2± < 0.1 10.68± 0.15 10.95± 0.21 9.71± 0.02
22449+0757 25 0.23 11040.4 ± 20.2 348.2± 40.4 0.2± 0.1 160.0± 0.3 11.08± 0.06 11.33± 0.16 9.08± 0.19
22472+3439 10 0.36 7107.0 ± 1.5 463.5 ± 3.0 3.7± 0.1 102.0± < 0.1 10.97± 0.05 11.21± 0.08 9.96± 0.02

–30
–
Table 2—Continued
IRAS Name ∆t rms VHI ∆V50
∫Sdv DL log LFIR
L⊙log LIR
L⊙log MHI
M⊙
(min) (mJy) (km s−1) (km s−1) (Jy km s−1) (Mpc)
(1) (2) (3) (4) (5) (6) (7) (8) (9) (10)
22501+2427 20 0.25 12641.0 ± 1.7 220.5± 3.5 0.6± 0.1 183.9± 0.1 11.50 ± 0.13 11.75 ± 0.17 9.68 ± 0.05
22523+3156† 25 0.23 6373.9 ± 11.3 724.8 ± 22.7 0.8± 0.1 91.3± 0.2 10.52 ± 0.05 10.79 ± 0.14 9.20 ± 0.05
22575+1542 5 0.58 2190.6± 0.3 293.3± 0.5 22.8± 0.2 31.0± < 0.1 10.14 ± 0.05 10.39 ± 0.09 9.71± < 0.01
22586+0523 10 0.34 3461.8± 2.3 297.9± 4.6 2.0± 0.1 49.2± < 0.1 9.97± 0.05 10.25 ± 0.16 9.06 ± 0.03
22595+1541 5 0.60 2089.6± 0.5 692.1± 1.0 24.2± 0.2 29.6± < 0.1 9.96± 0.20 10.20 ± 0.22 9.70± < 0.01
23007+2329 10 0.29 7758.9± 5.8 215.2 ± 11.6 0.6± 0.1 111.5± 0.1 10.87 ± 0.07 11.12 ± 0.12 9.25 ± 0.07
23007+0836†⋄ 15 0.47 4808.3± 5.6 550.4 ± 11.2 2.3± 0.2 68.6± 0.3 11.28 ± 0.04 11.60 ± 0.07 9.66 ± 0.04
23011+0046 15 0.35 12666.5 ± 5.8 160.3 ± 11.7 0.3± 0.1 184.3± 0.1 11.07 ± 0.06 11.37 ± 0.16 9.38 ± 0.10
23024+1203⋄ 10 0.37 2352.2± 0.5 366.3± 1.0 20.5± 0.2 33.3± 0.1 10.40 ± 0.07 10.74 ± 0.08 9.73 ± 0.01
23024+1916 15 0.31 7453.8± 3.4 419.3± 6.8 1.0± 0.1 107.0± 0.1 11.13 ± 0.04 11.36 ± 0.08 9.43 ± 0.05
23031+1856 15 0.29 7864.1 ± 10.8 425.2 ± 21.7 0.4± 0.1 113.1± 0.2 10.58 ± 0.14 10.91 ± 0.20 9.08 ± 0.13
23050+0359 20 0.28 14258.4 ± 8.1 321.3 ± 16.3 0.5± 0.1 208.3± 0.1 11.42 ± 0.04 11.67 ± 0.16 9.71 ± 0.08
23106+0603⋄ 10 0.53 3530.3± 0.9 97.0 ± 1.7 4.4± 0.2 50.2± < 0.1 10.27 ± 0.07 10.49 ± 0.20 9.42 ± 0.02
23121+0415⋄ 5 0.61 2655.6± 0.4 455.5± 0.8 30.2± 0.3 37.7± < 0.1 10.71 ± 0.04 10.95 ± 0.06 10.01± < 0.01
23157+0618 5 0.66 4952.6± 0.7 419.2± 1.4 13.5± 0.3 70.7± < 0.1 10.80 ± 0.04 11.05 ± 0.14 10.20± 0.01
23161+2457 5 0.75 8114.3± 4.7 242.0± 9.3 2.6± 0.2 116.7± 0.1 10.99 ± 0.06 11.26 ± 0.09 9.92 ± 0.04
23176+2356 5 0.49 9582.6± 0.8 257.7± 1.6 7.2± 0.2 138.4± < 0.1 10.96 ± 0.05 11.23 ± 0.13 10.51± 0.01
23179+2702 10 0.32 4272.1± 1.4 306.1± 2.8 3.0± 0.1 60.9± 0.1 10.37 ± 0.04 10.65 ± 0.08 9.42 ± 0.02
23179+1657 5 0.45 1628.5± 0.5 210.8± 1.1 12.0± 0.1 23.0± < 0.1 9.94± 0.04 10.22 ± 0.06 9.18 ± 0.01
23201+0805 20 0.28 11502.1 ± 12.7 122.6 ± 25.4 0.1± 0.1 166.9± 0.2 11.13 ± 0.15 11.40 ± 0.19 8.82 ± 0.34
23204+0601 20 0.16 16725.6 ± 4.1 350.9± 8.2 0.4± 0.1 245.9± 0.1 11.57 ± 0.05 11.88 ± 0.16 9.76 ± 0.07
23213+0923 15 0.28 3580.7± 3.8 347.2± 7.5 0.4± 0.1 50.9± 0.1 10.32 ± 0.05 10.57 ± 0.11 8.39 ± 0.10
23252+2318 5 0.59 3404.2± 0.7 181.0± 1.3 7.0± 0.2 48.4± < 0.1 10.26 ± 0.04 10.50 ± 0.12 9.59 ± 0.01
23254+0830†⋄ 5 0.73 8833.1± 2.7 452.1± 5.5 2.8± 0.3 127.3± < 0.1 11.16 ± 0.05 11.58 ± 0.07 10.03± 0.04
23256+2315 5 0.58 3555.3± 0.5 277.7± 1.1 8.0± 0.2 50.5± 0.1 10.21 ± 0.03 10.52 ± 0.08 9.68 ± 0.01
23259+2208 5 0.51 3488.2± 0.6 306.8± 1.2 8.9± 0.2 49.6± < 0.1 10.49 ± 0.06 10.76 ± 0.08 9.71 ± 0.01
23262+0314 5 0.56 5141.8± 1.3 299.1± 2.7 5.3± 0.2 73.4± < 0.1 10.79 ± 0.08 11.10 ± 0.10 9.83 ± 0.02
23277+1529 5 0.41 4219.5± 1.3 322.5± 2.6 4.8± 0.2 60.1± < 0.1 10.27 ± 0.05 10.55 ± 0.12 9.61 ± 0.01
23327+2913 45 0.28 32145.4 ± 3.9 488.6± 7.7 0.5± 0.1 490.1± 0.1 11.89 ± 0.07 12.14 ± 0.19 10.45± 0.09
23336+0152 5 0.73 2795.6± 0.6 214.6± 1.2 13.3± 0.2 39.7± < 0.1 10.38 ± 0.06 10.72 ± 0.08 9.69 ± 0.01
23381+2654 10 0.35 10177.0 ± 4.7 302.1± 9.4 1.3± 0.1 147.2± 0.1 10.91 ± 0.05 11.23 ± 0.17 9.82 ± 0.04
23387+2516 10 0.41 9403.5± 2.1 465.0± 4.2 3.5± 0.2 135.7± 0.1 11.04 ± 0.06 11.31 ± 0.13 10.18± 0.02
23410+0228* 20 0.40 27335.0 ± 96.0 400.0 0.5 412.3± 1.6 11.74 ± 0.07 12.08 ± 0.17 < 10.30
–31
–
Table 2—Continued
IRAS Name ∆t rms VHI ∆V50
∫Sdv DL log LFIR
L⊙log LIR
L⊙log MHI
M⊙
(min) (mJy) (km s−1) (km s−1) (Jy km s−1) (Mpc)
(1) (2) (3) (4) (5) (6) (7) (8) (9) (10)
23414+0014 10 0.42 6762.8± 2.5 436.5± 4.9 2.4± 0.2 97.0± 0.1 10.86 ± 0.05 11.12 ± 0.10 9.73± 0.03
23433+1147 5 0.66 4262.5± 0.9 322.2± 1.9 8.4± 0.3 60.7± < 0.1 10.32 ± 0.04 10.61 ± 0.11 9.86± 0.01
23446+1519 10 0.25 7864.3± 1.6 91.0± 3.2 0.5± 0.0 113.1± 0.1 10.87 ± 0.05 11.22 ± 0.12 9.18± 0.04
23456+2056 10 0.35 6673.1± 2.7 457.0± 5.4 2.3± 0.1 95.6± 0.1 10.71 ± 0.04 10.95 ± 0.13 9.70± 0.03
23471+2939 10 0.30 5268.8± 1.2 402.1± 2.3 4.4± 0.1 75.2± 0.1 10.43 ± 0.06 10.72 ± 0.11 9.74± 0.01
23485+1952 5 0.41 4227.6± 1.6 347.7± 3.2 5.1± 0.2 60.2± < 0.1 10.77 ± 0.13 10.99 ± 0.14 9.64± 0.01
23488+1949⋄ 5 1.37 4362.5± 5.3 815.4 ± 10.6 23.7 ± 1.0 62.2± 0.1 11.13 ± 0.05 11.36 ± 0.07 10.34 ± 0.02
23488+2018⋄ 10 0.45 5392.5± 1.7 346.8± 3.5 7.9± 0.3 77.0± 0.1 11.21 ± 0.04 11.47 ± 0.06 10.04 ± 0.02
23532+2513 30 0.20 17395.3 ± 3.5 784.5± 7.0 3.0± 0.1 256.1± 0.1 11.30 ± 0.05 11.57 ± 0.19 10.67 ± 0.02
23560+1026 5 0.25 5227.1± 0.7 302.0± 1.4 4.8± 0.1 74.6± < 0.1 10.53 ± 0.05 10.80 ± 0.11 9.80± 0.01
23564+1833 5 0.50 5375.4± 1.1 319.6± 2.2 5.2± 0.2 76.8± < 0.1 10.41 ± 0.04 10.70 ± 0.13 9.86± 0.02
23568+2028 5 0.49 2402.4± 0.5 109.9± 1.0 4.3± 0.1 34.1± 0.1 10.01 ± 0.04 10.29 ± 0.08 9.07± 0.01
23587+1249 5 0.38 5317.2± 4.0 357.5± 7.9 3.3± 0.2 75.9± 0.1 10.33 ± 0.05 10.60 ± 0.15 9.65± 0.02
23591+2312⋄ 5 0.51 4366.1± 1.8 627.5± 3.5 7.3± 0.2 62.2± < 0.1 10.66 ± 0.06 10.91 ± 0.11 9.82± 0.01
23597+1241 10 0.33 5487.7± 1.4 417.7± 2.9 3.9± 0.1 78.4± < 0.1 10.57 ± 0.05 10.86 ± 0.09 9.75± 0.02
⋄Sources observed in DPS mode.
∗HI 21 cm non-detections.
†Sources that exhibit both emission and absorption features, but with parameters derived from the emission part of the spectra. The flux
density integrals and neutral hydrogen masses should be considered lower limits since some of the emission might be masked by absorption
features.

–32
–
Table 3. Parameters of Galaxies with H I Absorption
IRAS Name DLa log LFIR
L⊙log LIR
L⊙∆t rms VHI−Peak ∆V50 τmax × 10−2 NHI/Ts × 1018
(Mpc) (min) (mJy) (km s−1) (km s−1) (cm−2 K−1)
(1) (2) (3) (4) (5) (6) (7) (8) (9) (10)
21054+2314† 214.5± 0.1 11.26± 0.06 11.58± 0.06 15 0.28 14893± 9 144± 24 7.1± 0.2 12.6± 0.4
21116+0158† 54.7± 0.1 10.28± 0.04 10.54± 0.10 20 0.21 4079± 11 94± 9 17.9± 1.8 19.5± 0.7
21442+0007 330.9± 0.4 11.59± 0.05 11.84± 0.17 25 0.31 22241± 6 101± 21 11.0± 2.2 15.3± 0.9
21582+1018† 114.6± 0.1 10.96± 0.04 11.22± 0.08 20 0.22 8155± 11 141± 40 4.0± 0.5 4.1± 0.2
22045+0959†⋄ 114.8± 0.3 10.81± 0.05 11.15± 0.10 20 0.21 7982± 3 62± 20 6.1± 0.6 7.9± 0.3
22523+3156† 91.3± 0.2 10.52± 0.05 10.79± 0.14 25 0.23 6260± 8 185± 20 33.8± 1.3 44.0± 0.7
23007+0836†⋄ 68.6± 0.3 11.28± 0.04 11.60± 0.07 15 0.47 4916± 16 75± 5 7.2± 0.4 9.5± 0.2
23254+0830†⋄ 127.3± < 0.1 11.16± 0.05 11.58± 0.07 5 0.73 8571± 8 63± 4 7.6± 0.3 17.9± 0.2
23365+3604 286.1± 0.2 11.94± 0.05 12.17± 0.15 25 0.30 19380± 6 91± 8 9.2± 0.8 23.8± 0.5
23594+3622⋄b 139.0± 0.6 11.11± 0.06 11.34± 0.15 15 0.62 9670± 6 162± 58 6.1± 0.8 16.1± 0.5
⋄Sources observed in DPS mode.
†Sources that exhibit both emission and absorption features, but with H I parameters derived from the absorption part of the spectra.
aDerived using the H I emission velocity (Table 2) for sources that exhibit both H I emission and absorption, and optical redshifts
(Table 1) for sources that exhibit H I absorption only.
bThe H I spectrum for this source (Figure 2) shows another weak absorption-like features at 9350 km s−1. However, it only has a 2.5σ
significance.

–33
–
Table 4. Parameters of Galaxies with OH Megamaser Emission
1667 MHz 1665 MHz
IRAS Name ∆t rms V Fpeak ∆V50
∫Sdv Fpeak ∆V50
∫Sdv RH log
LpredOH
L⊙log LOH
L⊙rms1612 rms1720
(min) (mJy) (km s−1) (mJy) (km s−1) (Jy km s−1) (mJy) (km s−1) (Jy km s−1) (mJy) (mJy)
(1) (2) (3) (4) (5) (6) (7) (8) (9) (10) (11) (12) (13) (14) (15)
23050+0359 20 0.19 14239 ± 9.6 4.0± 0.3 197± 13 0.50 ± 0.01 2.0± 0.3 200 ± 50 0.24± 0.01 2.08 ± 0.10 1.74 1.69 – –
23327+2913 45 0.19 32285 ± 5.4 1.4± 0.2 204± 34 0.30 ± 0.01 – – – – 2.39 2.04 0.23 –
23365+3604 25 0.28 19222 ± 7.4 7.1± 0.3 256± 56 1.90 ± 0.01 2.4± 0.3 172 ± 70 0.50± 0.01 3.80 ± 0.08 2.46 2.46 0.21 –
–34
–
Table 5. Parameters of Galaxies with OH Absorption
1667 MHz 1665 MHz
IRAS Name ∆t rms V ∆V50 τ × 10−2∫τdv NOH/Tex × 1014 ∆V50 τ × 10−2
∫τdv RH rms1612 rms1720
(min) (mJy) (km s−1) (km s−1) (km s−1) (cm−2K−1) (km s−1) (km s−1) (mJy) (mJy)
(1) (2) (3) (4) (5) (6) (7) (8) (9) (10) (11) (12) (13) (14)
21054+2314 40 0.68 14792 ± 27 133± 14 6.5± 1.0 7.4± 0.3 17.4± 0.7 – – – – – 0.31
22523+3156 25 0.22 6250 ± 2 110± 24 16.9± 0.6 13.0± 0.1 30.6± 0.3 76± 3 11.0± 0.5 6.9± 0.1 1.88± 0.03 – 0.18
23007+0836 15 0.85 4947 ± 16 200± 100 2.1± 0.3 4.4± 0.1 10.3± 0.2 98± 51 1.9± 0.3 2.3± 0.1 1.91± 0.09 – 0.18
23121+0415 5 0.72 2650 ± 9 218± 68 2.3± 0.5 2.4± 0.1 5.6± 0.3 108± 65 2.4± 0.5 2.7± 0.1 0.89± 0.05 0.69 –
– 35 –
Table 6. Parameters of Galaxies with OH Nondetections
IRAS Name rms1667,1665 logLpredOH
L⊙log
LmaxOH
L⊙rms1612 rms1720
(mJy) (mJy) (mJy)
(1) (2) (3) (4) (5) (6)
20082+0058 - 0.71 - - -
20093+0536 0.31 0.64 −0.17 0.24 -
20178-0052 0.91 0.48 0.34 - -
20198+0159 - 1.31 - - 0.30
20210+1121 - 1.78 - - -
20230+1024 - 0.66 - - 0.24
20332+0805 - 0.91 - 0.38 0.42
20369+0150 1.00 −0.07 0.10 0.80 -
20381+0325 - 0.77 - - 0.25
20415+1219 0.39 0.39 −0.18 0.40 0.52
20417+1214 0.32 0.09 −0.30 0.31 -
20480+0937 0.44 0.03 −0.17 0.45 0.46
20491+1846 - 1.05 - - 0.27
20550+1656 0.24 2.04 0.35 - 0.23
21052+0340 - 0.84 - - 0.23
21116+0158 - 0.17 - 0.22 0.14
21271+0627 0.28 −0.06 −0.58 0.23 -
21278+2629 0.46 0.43 −0.07 0.23 0.49
21442+0007 - 1.98 - 0.34 -
21561+1148 0.30 1.03 0.31 0.26 0.26
21582+1018 - 1.10 - - 0.28
22032+0512 - 1.17 - - 0.23
22045+0959 - 0.90 - - 0.79
22171+2908 0.40 0.71 −0.18 0.41 -
22217+3310 - 0.53 - - 0.33
22221+1748 0.36 0.51 0.03 - 0.53
22347+3409 0.95 −0.42 −1.33 - -
22387+3154 - 0.93 - - 0.30
22388+3359 0.35 1.27 0.06 - 0.24
– 36 –
Table 6—Continued
IRAS Name rms1667,1665 logLpred
OH
L⊙log
LmaxOH
L⊙rms1612 rms1720
(mJy) (mJy) (mJy)
(1) (2) (3) (4) (5) (6)
22395+2000 - 0.62 - - 0.32
22402+2914 - 0.72 - - 0.15
22449+0757 - 1.27 - - 0.16
22472+3439 - 1.12 - - 0.33
22501+2427 - 1.85 - - 0.17
22575+1542 0.69 −0.03 −0.59 - -
22586+0523 0.27 −0.27 −0.60 0.39 0.42
22595+1541 0.51 −0.27 −0.76 - 0.79
23007+2329 - 0.97 - - 0.29
23011+0046 - 1.26 - - 0.21
23024+1203 0.36 0.33 −0.81 - -
23024+1916 - 1.34 - - 0.29
23031+1856 - 0.58 - - 0.21
23106+0603 - 0.15 - - -
23157+0618 0.42 0.88 −0.09 - 0.46
23161+2457 - 1.14 - 0.87 0.59
23176+2356 0.42 1.10 0.48 0.51 0.39
23179+2702 0.37 0.29 −0.27 0.40 -
23179+1657 0.34 −0.30 −1.16 - 0.44
23201+0805 - 1.34 - - 0.18
23204+0601 - 1.94 - - -
23213+0923 0.25 0.22 −0.60 0.32 -
23252+2318 0.36 0.14 −0.49 0.64 -
23254+0830 - 1.38 - - 0.58
23256+2315 0.44 0.07 −0.36 0.39 -
23259+2208 0.49 0.46 −0.33 0.54 0.53
23262+0314 0.46 0.87 −0.02 0.41 -
23277+1529 - 0.15 - 0.37 0.37
23336+0152 0.61 0.30 −0.43 0.67 -

– 37 –
Table 6—Continued
IRAS Name rms1667,1665 logLpredOH
L⊙log
LmaxOH
L⊙rms1612 rms1720
(mJy) (mJy) (mJy)
(1) (2) (3) (4) (5) (6)
23381+2654 - 1.04 - 0.21 0.18
23387+2516 - 1.22 - - 0.28
23410+0228 - 2.18 - 0.24 -
23414+0014 - 0.96 - - 0.33
23433+1147 0.45 0.22 −0.19 0.50 -
23446+1519 - 0.98 - - 0.34
23456+2056 - 0.76 - - 0.26
23471+2939 0.59 0.33 0.08 0.29 0.39
23485+1952 - 0.84 - 0.38 -
23488+1949 - 1.34 - 1.31 -
23488+2018 - 1.45 - 0.46 0.42
23532+2513 - 1.58 - - -
23560+1026 - 0.51 - 0.26 0.44
23564+1833 - 0.35 - 0.44 0.52
23568+2028 0.45 −0.21 −0.69 - -
23587+1249 - 0.23 - 0.34 0.52
23591+2312 - 0.69 - 0.45 -
23594+3622 - 1.32 - 1.35 1.33
23597+1241 0.32 0.57 −0.12 0.29 0.35
– 38 –
Table 7. The Mean and Median H I mass values within different LIR ranges
IR Luminosity (L⊙) LIR ≤ 1010.49 1010.50 ≤ LIR ≤ 1010.99 1011.00 ≤ LIR ≤ 1011.49 LIR ≥ 1011.50
Mean H I mass 109.29±0.10 109.67±0.07 109.69±0.08 109.99±0.10
Median H I mass 109.19 109.72 109.78 109.86
Table 8a. The occurrence of H I 21 cm absorption in galaxies within different LIR ranges
IR Luminosity (L⊙) LIR ≤ 1010.49 1010.50 ≤ LIR ≤ 1010.99 1011.00 ≤ LIR ≤ 1011.49 LIR ≥ 1011.50
No. (abs. or abs.+emis.) 0 2 3 5
Total No. of galaxies 10 32 29 13
% with Absorption 0% 6.25% 10.3% 38.5%
Table 8b. NVSS flux density distribution of the galaxies with H I absorption within
different LIR ranges
IR Luminosity (L⊙) LIR ≤ 1010.49 1010.50 ≤ LIR ≤ 1010.99 1011.00 ≤ LIR ≤ 1011.49 LIR ≥ 1011.50
Median NVSS Flux (mJy) 20.40 24.15 31.5 15.8
Mean NVSS Flux (mJy) 48.33± 20.27 37.52± 6.26 36.6± 5.92 47.33± 19.43
Mean Flux with abs (mJy) - 28.9 82.33 90.22
Table 9. The occurrence of OH 18 cm main line (absorption or emission) in galaxies
within different LIR ranges
IR Luminosity (L⊙) LIR ≤ 1010.49 1010.50 ≤ LIR ≤ 1010.99 1011.00 ≤ LIR ≤ 1011.49 LIR ≥ 1011.50
No. (abs. or emis.) 0 2 0 5
Total No. of galaxies 9 19 5 6
% OH Detections 0% 10.5% 0% 83.3%
Related Documents